Embed Size (px)
Citation preview

Presentation
North America Wind Energy Advisory
Wind Turbine OEMs Struggle to Remain Competitive
25 May 2011
Matthew Kaplan+1 617 866 [email protected]
© 2011 IHS EMERGING ENERGY RESEARCH, LLC. All rights reserved. Reproduction of this publication in any form without prior written permission is strictly forbidden. The information contained herein is from sources considered reliable but its accuracy and completeness are not warranted, nor are the opinions and analyses which are based upon it.

Page 2North America Wind Energy Advisory – May 2011
The top three North American OEMs faced market share erosion between 2005 and 2009, but this trend reversed course in 2010
Wind Turbine OEMs Struggle to Remain CompetitiveTurbine Deliveries Slow
North America Market Share Evolution: 2001–2010
Source: Manufacturers, IHS Emerging Energy Research
Top Three vs. Other (MW)Annual Deliveries: 2001–2010 (MW)

Page 3North America Wind Energy Advisory – May 2011
Wind Turbine OEMs Struggle to Remain CompetitiveLower Power Price Environment: Wind Must Become More Competitive
Note: Represents projects online between 2007 and 2010 with contracts executed between January 2007 and June 2010; projects online during the same period but with earlier contract execution dates are omitted. Prices represent realized price for full year 2010, where available, excluding test energy or other pre-COD arrangements. Wholesale power price taken as monthly median of representative sample of US hubsSource: FERC, IHS Emerging Energy Research
20
30
40
50
60
70
80
90
100
110
120
130
Jan.07 Jan.08 Jan.09 Jan.10 Jan.11
PP
A/ W
ho
lesa
le P
ow
er P
rice
(U
S$
/ M
Wh
)
Contract Execution Date
Wind PPA PricesPPA TrendMedian US Wholesale Power Price
Lower natural gas prices and increased competition is pushing wind power PPA prices down
2010 Realized Renewable PPA Prices

Page 4North America Wind Energy Advisory – May 2011
PA
IL
MO
Wind Turbine OEMs Struggle to Remain CompetitiveWind OEM Competition Segmentation
Competition Within the US Wind Market
Diversified GlobalHeavy IndustryConglomerates
Europe- or US-Based Wind/Renewables
Companies
Market Leaders
New/Potential Entrants
US
Win
d M
arke
t S
har
eM
ost
Leas
t
Significant Utility-Scale USInstallations
Asia-Based WindCompetitors
As competition heats up, there is an ever-increasing gap emerging between leading heavy industrials and new market entrants

Page 5North America Wind Energy Advisory – May 2011
Wind Turbine OEMs Struggle to Remain CompetitiveTechnology Key Industry Focus
0
0.5
1
1.5
2
2.5
3
3.5
4
4.5
5
70 72 74 76 78 80 82 84 86 88 90 92 94 96 98 100 102 104 106 108 110 112 114 116 118 120 122 124 126 128 130
Cap
acit
y R
atin
g (
MW
)
Rotor Size (meters)
GE
Vestas
Siemens
Gamesa
Mitsubishi
Clipper
Suzlon
Acciona
DeWind
REpower
Nordex
Northern Power
Goldwind
Alstom
High level of product competition
Market trajectory
GE, Acciona, Goldwind
GE
Vestas, Gamesa, Dewind Siemens
Acciona
Source: Utilities, Developers, IHS Emerging Energy ResearchNote: OEMs added to exhibits where similar rotor sizes overlap and may not be visible within exhibit
OEMs are rapidly introducing new products aimed at increased efficiency and overall cost reduction
Wind Product Rotor Size vs. Nameplate Capacity

Page 6North America Wind Energy Advisory – May 2011
Wind Turbine OEMs Struggle to Remain CompetitiveUS Wind Manufacturing Map
Major Wind Manufacturing Map (Select Recent Investments)
OEM
Towers
Blades
Gearboxes
Bearings
Towers TowersGenerators
Blades
Tower Bases
Blades
BladesTowers
Castings
Suppliers are forced to respond to customer demand for lower costs

Page 7North America Wind Energy Advisory – May 2011
Wind Turbine OEMs Struggle to Remain CompetitiveNorth America Wind MW Added by Country: 2005–2025
Historical Forecast
Note: *IHS EER preliminary forecasts subject to revisionSource: IHS Emerging Energy Research
United States Wind Capacity Added: 2005–2025*
Between 2011 and 2025, IHS EER forecasts 7.5 GW in average wind installations per year in the United States

Riding the WindDomesticating the Supply Chain – One Part at a Time
Tom WaggonerManagerSupply ChainAcciona Windpower North America

AGENDA
› Market Demands
› The Strategic Approach
› GloCal Sourcing
› Key Partners

Market Demands

WIND ECONOMIC FUNDAMENTALS 2008 VERSUS 2011
MARKET DEMANDS
Market Indicator 2008 2011
Natural Gas $11/MMBtu $4.3/MMBtu
Steel $1200/ton $850/ton
PPA Pricing $65/MWh $35/MWh
Electricity Demand Growing 2%/year At pre-recession levels
RPS ComplianceStatus Short of targets Meeting obligations
WTG Lead Time 2+ years 6-9 months
› Market power has shifted from the OEMs/suppliers to the Utilities given weak demand, low natural gas prices, and weak policies for renewable energy
The market demands attention to mitigate Cost Drivers. Localization of the Supply Chain can play a key role.

MARKET DEMANDS IN NORTH AMERICA
› Cost Highly competitive with pricing dropping 40% since 2008 due to excess
capacity
› Lead Time 6 to 9 months vs. 12 to 18 months requires flexibility
› Quality Rapid innovation and increased Warranty period demands drive higher Quality
Standards and ability to control
› Service Rapid turn-around of Service to maintain Maximum availability
So how do we decide on localization?
MARKET DEMANDS

The Strategic Approach
THE STRATEGIC APPROACH
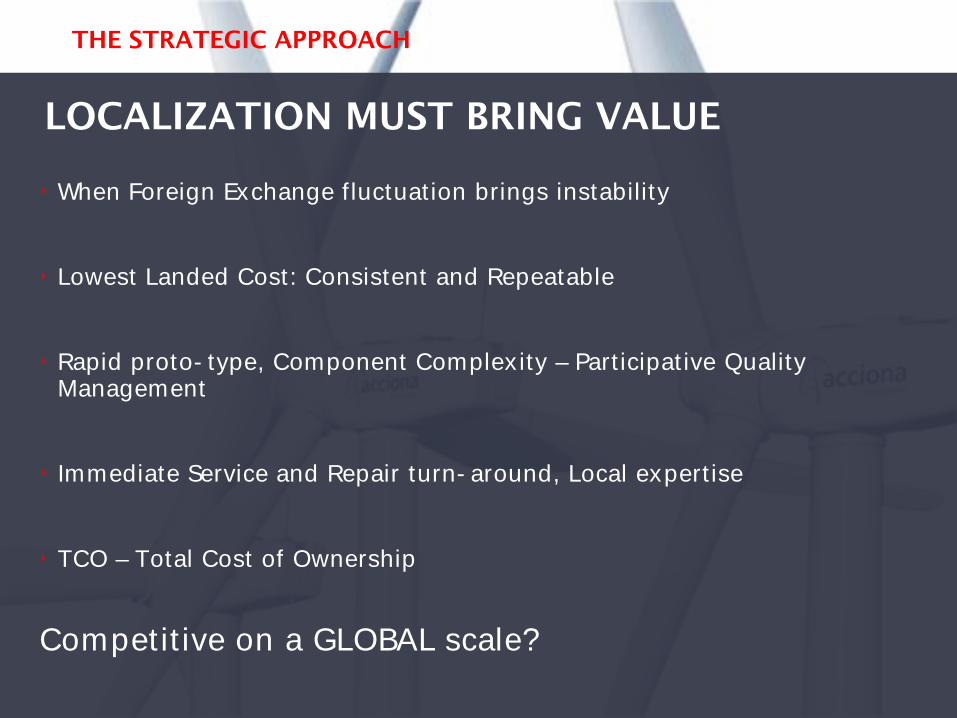
LOCALIZATION MUST BRING VALUE
› When Foreign Exchange fluctuation brings instability
› Lowest Landed Cost: Consistent and Repeatable
› Rapid proto-type, Component Complexity – Participative Quality Management
› Immediate Service and Repair turn-around, Local expertise
› TCO – Total Cost of Ownership
Competitive on a GLOBAL scale?

“GloCal” Sourcing
“GLOCAL” SOURCING

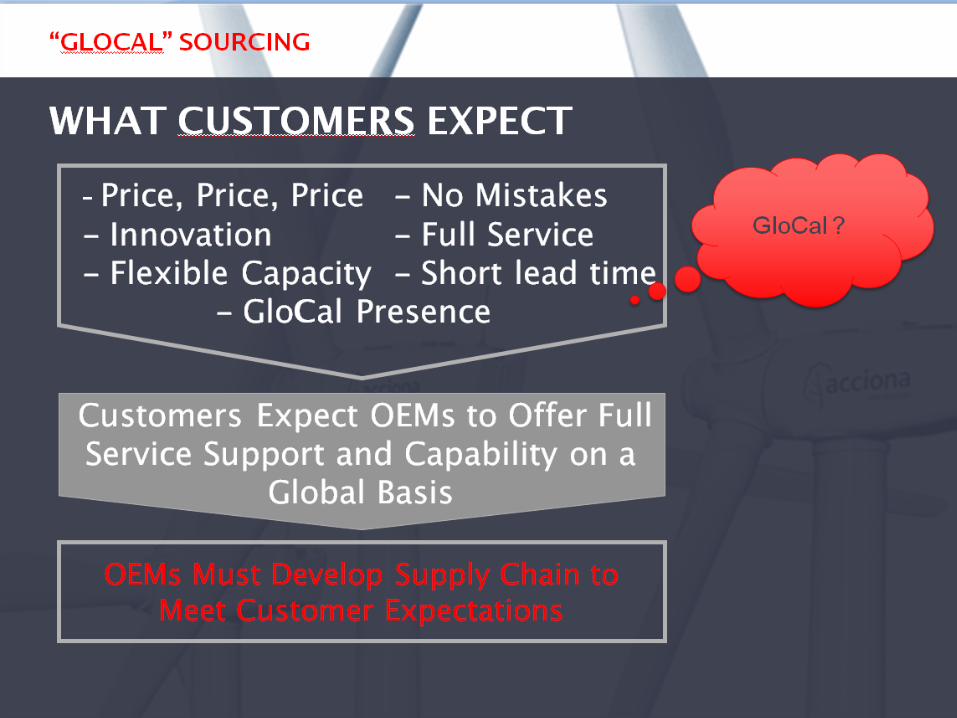
“GLOCAL” SOURCING
THE ABILITY TO RESPOND TO LOCAL DEMANDS ON A GLOBAL BASIS
Global Footprint – Design Partners
Regional 1 – Rapid Proto-type
Regional 2 – Critical Component
Limited – Commercial Components
The Capability to Respond Globally, within a Localized Supply Chain at a Consistently Competitive Price is a Key Decision Point

CURRENT STATUS IN NORTH AMERICA
“GLOCAL” SOURCING
Non-U.S. Source
23%
U.S. Source 77%
Localized Supply AWNA
North American Suppliers / Subsidiaries are proving the ability to bring value on a consistent basis
Long Term Success requires Development of Key Partners

Key Partners for the Future

KEY PARTNERS
BECOMING A KEY PARTNER – PERFORMANCE AND INTEGRATION
Selection
Quality
Key Partner
Cont. Imp.
Integration
Technology
Delivery
Supplier

HOMOLOGATION DECISION MADE ONE PART AT A TIME
LOCALIZING THE SUPPLY CHAIN – ONE PART AT A TIME
Cost
Bring value at globally competitive cost –Lowest Landed and Total Cost of Ownership
Quality
Strict Quality Controls to assure Industry Leading reliability and availability
Delivery
Ability to provide components and service when and where needed
Technology
The capability to grow and improve utilizing a systematic approach to continuous improvement
RobustRepeatable
Relevant

MANY THANKS
Tom WaggonerManager, Supply Chain
Acciona Windpower N.A.

23
AWEA WINDPOWER 2011 Conference Supply Chain Development at Gamesa
May 25, 2011
James BuddelmeyerVice-President, Purchasing

24
3 business units dedicated to wind power
GAMESA BUSINESS UNITS 2010 Statistics
WIND TURBINE MANUFACTURING
OPERATIONSAND MAINTENANCE
WIND FARMS
REVENUE:
GLOBAL HEADQUARTERS
STAFF:
$3.5 B
BILBAO, SPAIN
7,200 EMPLOYEES
GLOBAL RANKING 2010U.S. RANKING 2010
43
MANUFACTURING CENTERS:
SPAIN/USA/CHINA/INDIA/BRAZIL IN DEVELOPMENT
GLOBAL INSTALLED BASE 21,000MW

25
Growth – 30 Countries and growing
Americas2,766 MW
Europe14,586 MW
Asia1,726 MW
INSTALLATIONS
N. Africa756 MW
2010 Total Global Sales : 2,405 MW

26
Global Manufacturing
30 Production Centers
Components
Nacelle AssembliesBlades
GearboxesGenerators
Electrical Control Boxes
CAPACITY
USA > 1,200 MW
EUROPE > 2,000 MW
ASIA > 1,200 MW
Brazil in development
UK in development
ANNUAL > 4,400 MW

27
Significant investments in R&D…focused on new technology and product improvements
7 R&D centers in Spain, US, Singapore & China.
Planned centers:United Kingdom, India (Chennai), & Brazil.
Over $395 Million invested over last 5 years
Investment to exceed $220 Million over the next 3 years
162 registered patents at the end of 2009
Gamesa leads and takes part in advanced R&D Wind Energy programs in Spain, the U.S. and the rest of Europe
28
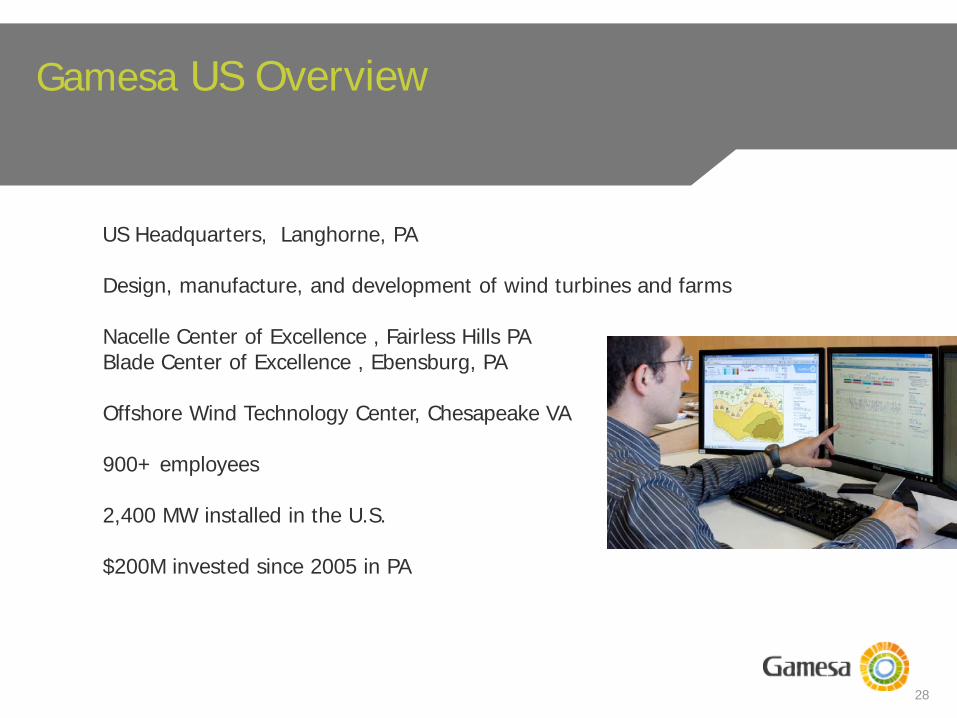
Gamesa US Overview
US Headquarters, Langhorne, PA
Design, manufacture, and development of wind turbines and farms
Nacelle Center of Excellence , Fairless Hills PABlade Center of Excellence , Ebensburg, PA
Offshore Wind Technology Center, Chesapeake VA
900+ employees
2,400 MW installed in the U.S.
$200M invested since 2005 in PA

29
Commitment to the US Market
R&D G80 Wind farm Henry
Hills
G87 Wind Farm at Kumeyaay
Gamesa opens US Headquarters in Philadelphia, PA
GWUS opens office in Austin, TX
GEUSA purchases Navitas Energy
2002 2003 2004 2005 2007
First Wind Farm at Mendota Hills (63xG52)
GTC, Inc shifts headquarters to Oxford
Valley, PA
1.000 MW installed
2.000 MW installed
Fairless Hills & Ebensburg
manufacturing facilities
groundbreaking
Sales and Development
Offices in 7 US Cities
Gamesa/Northrop Grumman
20112008 2009
3.000 MW
installed

30
Commitment to the US MarketNacelle Center of Excellence Fairless Hills, PA
Brownfield site rehabilitation in 2005-6 (Formerly US Steel Fairless Hills Site)
235,000 sq. ft. Factory in three production bays and 75,000 sq. ft. Warehouse.
93 acres of land.
Access to Rail & Deepwater Port
Gross investment > $70 MM
Currently produce nacelles & hubs.
Additional bays available for expansion
US Steel Fairless Works, circa 1960

31
Commitment to the US MarketBlade Center of ExcellenceEbensburg, PA
Greenfield site installed in 2005-6.
Plant produces wind turbine blades
168,000 sq. ft. Factory with offices and warehouse included in plant.
Total of approximately 29 acres of land - ample FG storage
Gross investment > $65 MM including land, building, equipment.
Upgraded from G87 to G90 blades in 2009-10.
Additional $20MM invested in North American Facilities in 2009

32
Over 2,400 MW installed in the US…900+ under construction
BEAR CREEK
CAYUGA RIDGE
FAIRLESS HILLSEBENSBURG
MESQUITE & POST OAK
SANDBLUFF BARTON CHAPEL
MENDOTA HILLS & GSG
KUMEYAAY
LOCUST RIDGEALLEGHENY
RIDGE
P.HEIGHTS
TOP OF IOWA &
BARTONAIRFORCE
FARMER CITY
LEMPSTER
MT. STORM
WINNEBAGOBUFFALO RIDGE II
BIG HORN
HARDSCRABBLE
CHESTNUT FLATS
FIRST MARINE
WINDSTARKINGMAN
SLYINA
DE,MPSEY
24 Wind Farmsin 17 States
VALEY VIEW

33
Gamesa Logistics & Service Support Resources
On-Site Spare parts and tooling warehouses
Major Regional Warehouses
3 Service Centers3 Regional Warehouses25 On-Site Warehouses
Regional Service Centers

34
1
o Regulatory uncertainty in USo Growth in Asia and other emerging markets o Offshore growth will accelerate after 2013o Wind turbine technology changing rapidly
MARKET:
THE SLOWDOWN OF 2009 & 2010 HAS TRANSFORMED THE WIND INDUSTRY
2 CLIENTS: o Increasing demands by operators–utilities and large developers
o Wind power internationalization requires WTM global support
o Competition based on offering the lowest CoE and availability over the wind farm's life
3 SUPPLIERS o Large industrial conglomerates increasing their market share
o Smaller, local players are reducing their presence
Wind industry is transforming rapidly

35
Games is Responding to the Changing Market
Competitive CoE
Superior reliability and service offering
The right products with superior technology
Extensive geographical presence
Flexible response times17
Gamesa Value Proposition:

36
Gamesa US Overview
2010: 100 Meter Tower & Seismic towers Introduction of 90 meter rotor – Class IIIA winds High altitude package designed for 2000 meters (6000 ft) Cold weather package designed for -40C Gamesa NRS (Noise Reduction System) O&M Services - Improvements and expanded coverage
2011: G9X 2.0 MW wind turbine – Designed for Class I, IIA & IIIA winds G10X – 4.5 MW wind turbine
Introduction of New Products:

37
Technology Leadership…G10X 4.5MW
State of the Art Technologies
• Compact power train
• 2 sectioned blade
• 1,300,000 engineering hours been dedicated exclusively to the G10X 4.5MW turbine
• 240,000 hours specifically to testing
• 350+ tests on components and sub-systems
• Designed in collaboration with our suppliers

38
Ambitious product innovation roadmap

39
Gamesa Goes Offshore ..UK & US
Global Offshore Headquarters in London
Sites in Scotland,
Total investment of €50MM
R&D engineering center in Glasgow
U.S Offshore Wind Technology Center…..In Partnership with Northrop Grumman
U.S . Center opened February 2011, Chesapeake, Va
60 engineers jointly working to design the G11X
Design, development, and testing of the G11X prototype
Installation of 2 prototypes by 2012 along the Mid-Atlantic coast
First offshore turbine to be developed in the US
2 New platforms: G11X 5.0MW & G14X 6.0/7.0MW
Gov Bob McDonnell

40
Gamesa Global Purchasing
Global purchasing presenceResources in EU/NA/ASIA/INDIA
Strategic purchasing approachTotal cost of ownership
Focus on local supply chainsReduce cycle time to meet customer needs
Optimized logistics patternsSupplier development program
Performance metrics & feedback
Introduction of lean techniquesImprove process & eliminate waste

41
Gamesa Global Purchasing
Opportunities for NA suppliers exist in several areas: Specific quality inspection providers:
Electrical & electro mechanical Gear box inspection
Firms that can do Operations & Maintenance work up tower in the wind farms Preventative maintenance and/or “punch-list” work Requires extensive certifications
Suppliers of large industrial portable generators
Fabricators of large, machined weldments
Electrical cabling
Metallurgical towers

42
Gamesa US Purchasing
Opportunities for NA suppliers exist in several areas:
Engineered tools, fixtures and inspection devices for maintenance of wind turbines
Transport of major assemblies to the wind farms
Environmental inspection services
Construction contractors to complete the civil work on the wind farms
Support the erection of wind turbines
Needs: suppliers that can bring technological solutions to improve wind turbine availability and reduce COE!

43
Gamesa Supplier Requirements
Successfully pass initial supplier quality assessment
ISO9000 Certification
ISO14001 Certification plan to achieve
World class competitive cost structure
Advance technological capabilities
Advance product quality planning (APQP) system implemented
Production part approval process (PPAP) implemented
Successful Homologation in Gamesa system
Lean culture and techniques utilized
Manufacturing & administration
Healthy Financial Status

44
Certification & Homologation Process:
Homologation Process Steps:
Phase 1: Supplier’s Qualification Assessment
Phase 2: Supplier Feasibility(Capability & Capacity)
Phase 3: Process and Product Design
Phase 4: Process Validation and Serial Mfg. Approval
Phase 5: Initial Samples
Phase 6: PPAP Closing. Start of Mass Production

45
o Quality (SQA):
o Delivery (Planning): o Technology (Eng.):
Material cost reduction as a % of spend
Acceptance of contract terms
Long Term Agreement in place
Productivity reduction plan in place?
Supplier currently in Gamesa SIP program?
Supplier Balanced Score Cardo Cost (Purchasing)
Delivery performance to due on dock dates
Participation in Gamesa pull system?
Following packaging instructions?
Lead time reduction plan in place?
Line disruption deduction
NCR’s # at production
NCR’s cost percentage
NCR’s # at wind farm
Advance quality planning
Lack of notification deduction
Catia/Cad facilities
Bench mark technology
Best practices design
Design capabilities/DFSS
Design failure deduction
46
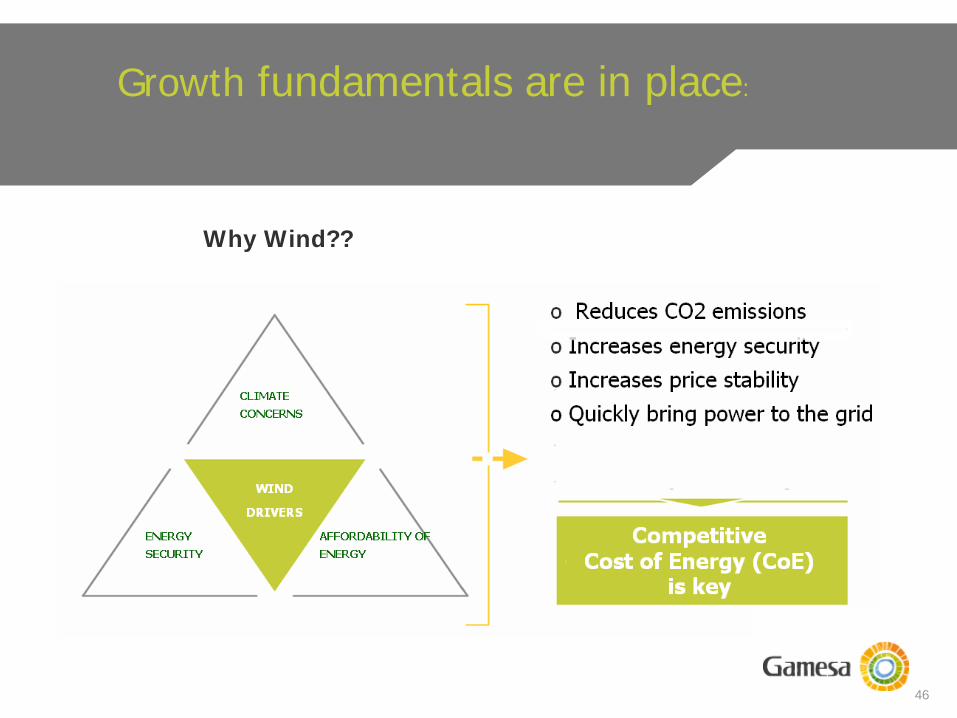
Growth fundamentals are in place:
Why Wind??

47
7
Attractive opportunities mostly in Emerging markets:
7

48
Aligned with the main international ethical corporate principles

49
Corporate perspective…simply “globalization” 1,600MW sold in 2004 Top markets: Spain, Italy, Portugal, & China
U.S. Market receptive to wind (2004)
Dynamic market conditions
Positive signs…Estimates showed the U.S. could top 15,000 MW of total installed capacity by the end of 2009
7 states plus DC legislated RPS’s
500 utilities in 34 states offered green pricing programs
Early 2005 Project announcements of large projects, 4 of the top 5 were 200+MW
PTC
Gamesa: Global Presence, Local Focus

Developing a Supply Chain as aWind Industry Start-up Company
Bill BerghoffDIRECTOR OF MANUFACTURING

Permanent Magnet Generators and Power Converters
Full design and manufacturing• Only PMG manufacturer in USA
Industries• Wind
• Industrial
• Transportation
Company• Partnerships
• Right people doing the right things
• Innovation driven
How a Start-Up Differs From an Established Company
Growth from technology or industry need
Incomplete organizational competencies
Investment funded by active partners
Historical relationships
Reputation

Strategy
Core Competencies
Vertical Integration vs. Assembly Competencies
Vertical Integration
• Machining• Fabrication• Stator Winding
Assembly
• Design• Sourcing• Assembly Processes

Supplier Value Proposition

Danotek Supply Base Strategy

Supply Base Development Strategy Differences
Typical Progression
• Self evaluation• Quote• Review of technical
specifications• Revised quote• Supplier evaluation• Supplier fit
determination
Danotek Progression
• Supplier discussions• On-site visit• Ownership introduction• Alignment discussions• Competency evaluation• Program management
evaluation• Quote

Privately owned
Domestic facility headquarters, often Midwest
Strategy to enter wind industry
Military, medical or industrial product critical mass
Advanced technology or competency expertise
Global outreach
Danotek Typical Supplier

Danotek Supplier Interaction
Assessment during design and quote phaseFull design reviews
• Mating parts and full assembly
• Functional use
Complete open door exchange at facilities• Designers, engineers, floor technicians and quality personnel
Customer• On-site customer review of facilities and capabilities
• Suppliers are partners through to our customer

Expertise: Machining complex rotating assembly parts• Military final drive• Turbo assemblies
Danotek Partnership Example:Loc Performance
Danotek design• Max run-out 0.004”
Loc Performance Solution• Max stack-up run-out surface 0.0002”• 20 Times less run-out with No Added Cost

Expertise: Design, machining, fabrication and assembly• Machine tools• Assembly cells
Danotek Partnership Example:Merrill Technologies
Danotek situation• MFG medium speed generator
Merrill Technologies solution• Prototype assembly process• Re-locatable MFG cell

Danotek Supply-Base Partnership Take-Away
Complementary skill sets
Advanced technology or industry offerings
Understand cost structure prior to quoting
Understand partnerships and start-up companies
Transition from prototype to production
Passion for wind diversification

Three PhasesThroughout Production
•Local/Domestic Expertise•Design & Engineering Driven•Prototype Production•Fast Turnaround•Higher Cost•Selected Partnership•Contingency Support
Start Up Phase
•Global & Local Sourcing•Quality & Cost Driven•Established Organizations•Technical Partnerships•Volume Capability
Production Phase
•Design Improvements•Supplier Re-Alignment•Logistics Optimization
CI / CR Phase
Danotek Supply BasePartnerships Evolving
Competitive through product manufacturing
Competitive through global outreach
Competitive through bundled global buy
Follow and support Danotek in low cost regions
New low cost partners for CI/CR phase
Partners continue involvement with new product development

Danotek Motion Technologies - Confidential
Questions?
www.danotekmotion.com
Bill BerghoffDIRECTOR OF MANUFACTURING
[email protected] ext 401
Maureen DempseyGLOBAL SUPPLY CHAIN MANAGER
[email protected] ext 178

Questions and Answers

Questions and Answers

Questions and Answers