Embed Size (px)
Citation preview
The future of the vehicleExploring the future of mobility and implications for the aftermarket
Neal GanguliAutomotive Supplier Consulting LeaderDeloitte Consulting LLP
Copyright © 2017 Deloitte Development LLC. All rights reserved. 1
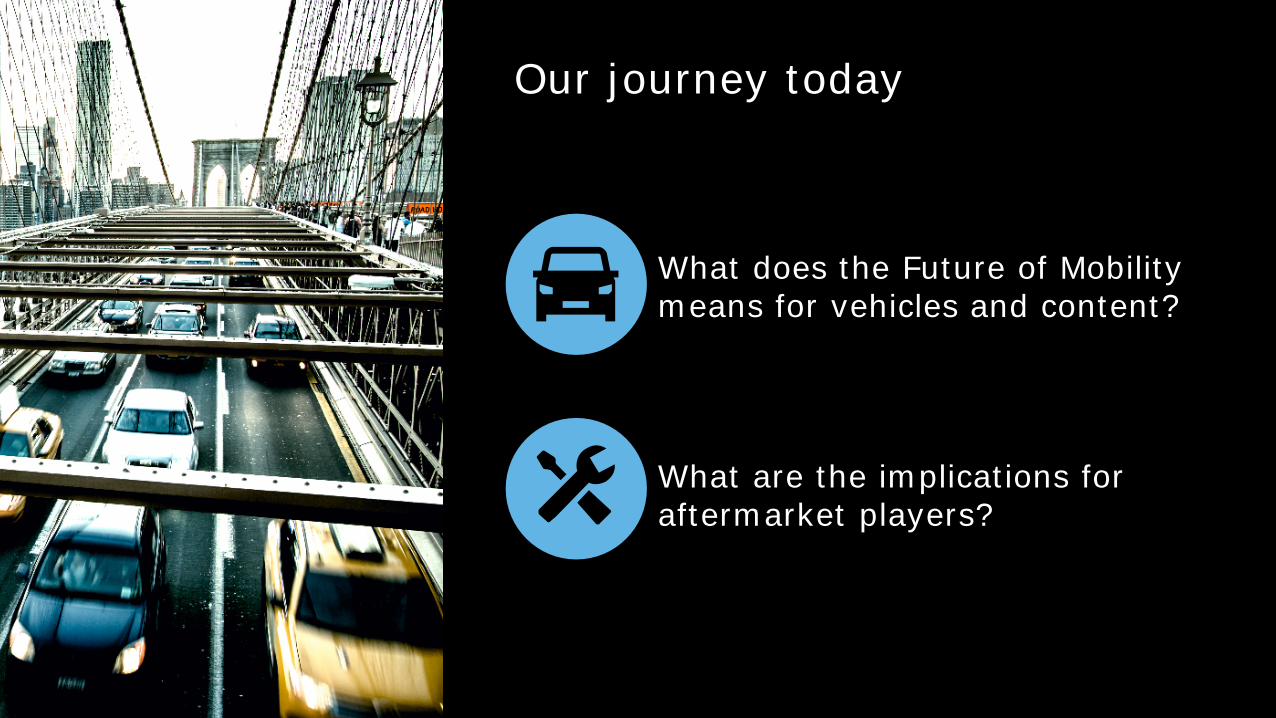
What does the Future of Mobility means for vehicles and content?
What are the implications for aftermarket players?
Our journey today
Copyright © 2017 Deloitte Consulting LLP. All rights reserved. 2
The future of mobilityDeloitte’s view on future automotive archetypes and impact on Automotive Industry players
Copyright © 2017 Deloitte Consulting LLP. All rights reserved. 3
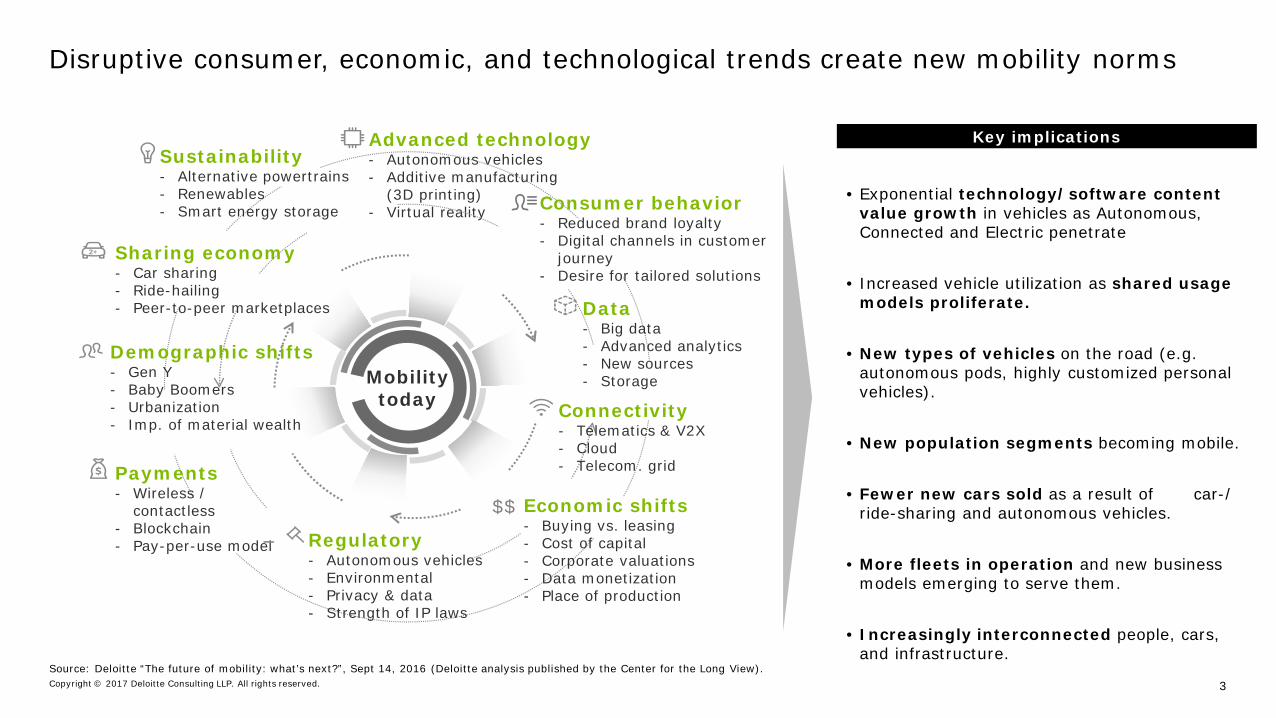
Disruptive consumer, economic, and technological trends create new mobility norms
Source: Deloitte “The future of mobility: what’s next?”, Sept 14, 2016 (Deloitte analysis published by the Center for the Long View).
• Exponential technology/software content value growth in vehicles as Autonomous, Connected and Electric penetrate
• Increased vehicle utilization as shared usage models proliferate.
• New types of vehicles on the road (e.g. autonomous pods, highly customized personal vehicles).
• New population segments becoming mobile.
• Fewer new cars sold as a result of car-/ ride-sharing and autonomous vehicles.
• More fleets in operation and new business models emerging to serve them.
• Increasingly interconnected people, cars, and infrastructure.
Advanced technology- Autonomous vehicles- Additive manufacturing
(3D printing) - Virtual reality
Mobility today
Data- Big data- Advanced analytics- New sources- Storage
Connectivity- Telematics & V2X- Cloud- Telecom. grid
Sustainability- Alternative powertrains- Renewables- Smart energy storage
Payments- Wireless /
contactless- Blockchain- Pay-per-use model
Demographic shifts- Gen Y- Baby Boomers- Urbanization- Imp. of material wealth
Sharing economy- Car sharing- Ride-hailing- Peer-to-peer marketplaces
Regulatory- Autonomous vehicles- Environmental- Privacy & data- Strength of IP laws
Economic shifts- Buying vs. leasing- Cost of capital- Corporate valuations- Data monetization- Place of production
$$
Consumer behavior- Reduced brand loyalty- Digital channels in customer
journey- Desire for tailored solutions
Key implications
Copyright © 2017 Deloitte Consulting LLP. All rights reserved. 4
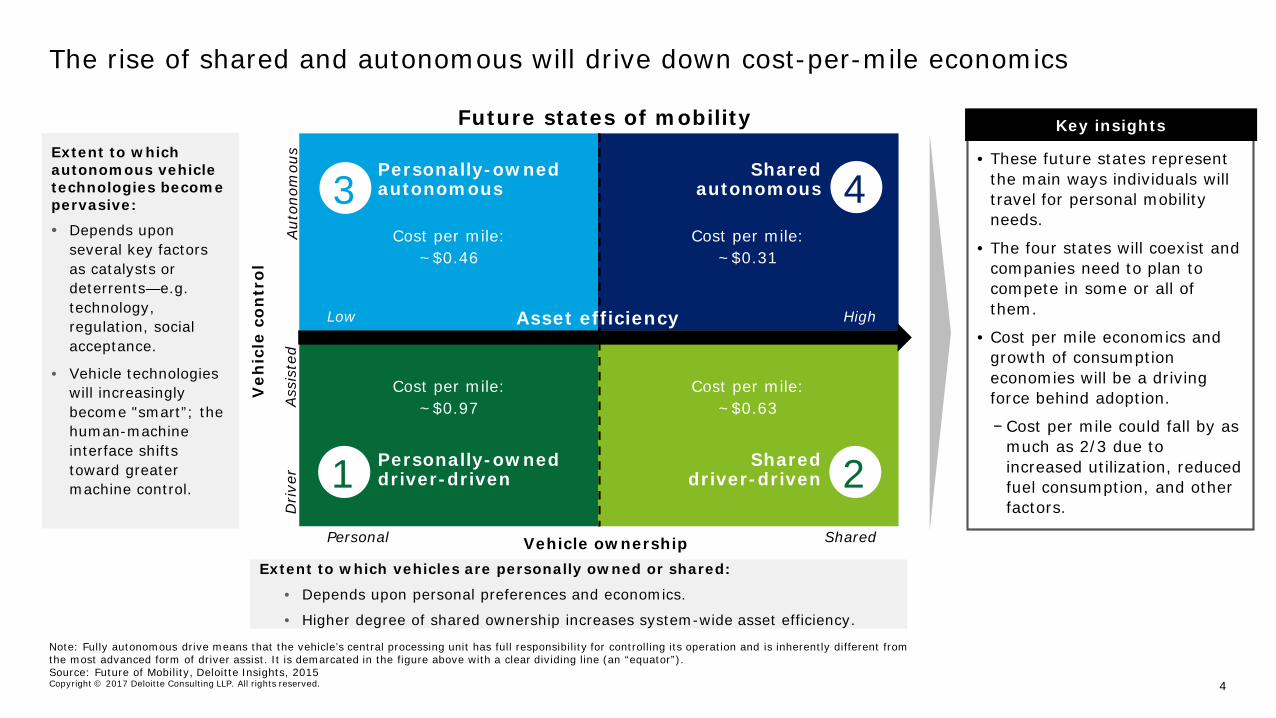
The rise of shared and autonomous will drive down cost-per-mile economics
Extent to which autonomous vehicle technologies become pervasive:
• Depends upon several key factors as catalysts or deterrents—e.g. technology, regulation, social acceptance.
• Vehicle technologies will increasingly become "smart”; the human-machine interface shifts toward greater machine control.
Extent to which vehicles are personally owned or shared:
• Depends upon personal preferences and economics.
• Higher degree of shared ownership increases system-wide asset efficiency.
Personal Shared
Aut
onom
ous
Drive
r
Future states of mobility
Vehicle ownership
Veh
icle
con
trol
Shared autonomous
Shareddriver-driven
Personally-owned autonomous
Personally-owned driver-driven1 2
3 4
Asset efficiencyLow High
Ass
iste
d
Note: Fully autonomous drive means that the vehicle’s central processing unit has full responsibility for controlling its operation and is inherently different from the most advanced form of driver assist. It is demarcated in the figure above with a clear dividing line (an “equator”). Source: Future of Mobility, Deloitte Insights, 2015
• These future states represent the main ways individuals will travel for personal mobility needs.
• The four states will coexist and companies need to plan to compete in some or all of them.
• Cost per mile economics and growth of consumption economies will be a driving force behind adoption.
− Cost per mile could fall by as much as 2/3 due to increased utilization, reduced fuel consumption, and other factors.
Cost per mile:~$0.46
Cost per mile:~$0.31
Cost per mile:~$0.97
Cost per mile:~$0.63
Key insights
Copyright © 2017 Deloitte Consulting LLP. All rights reserved. 5
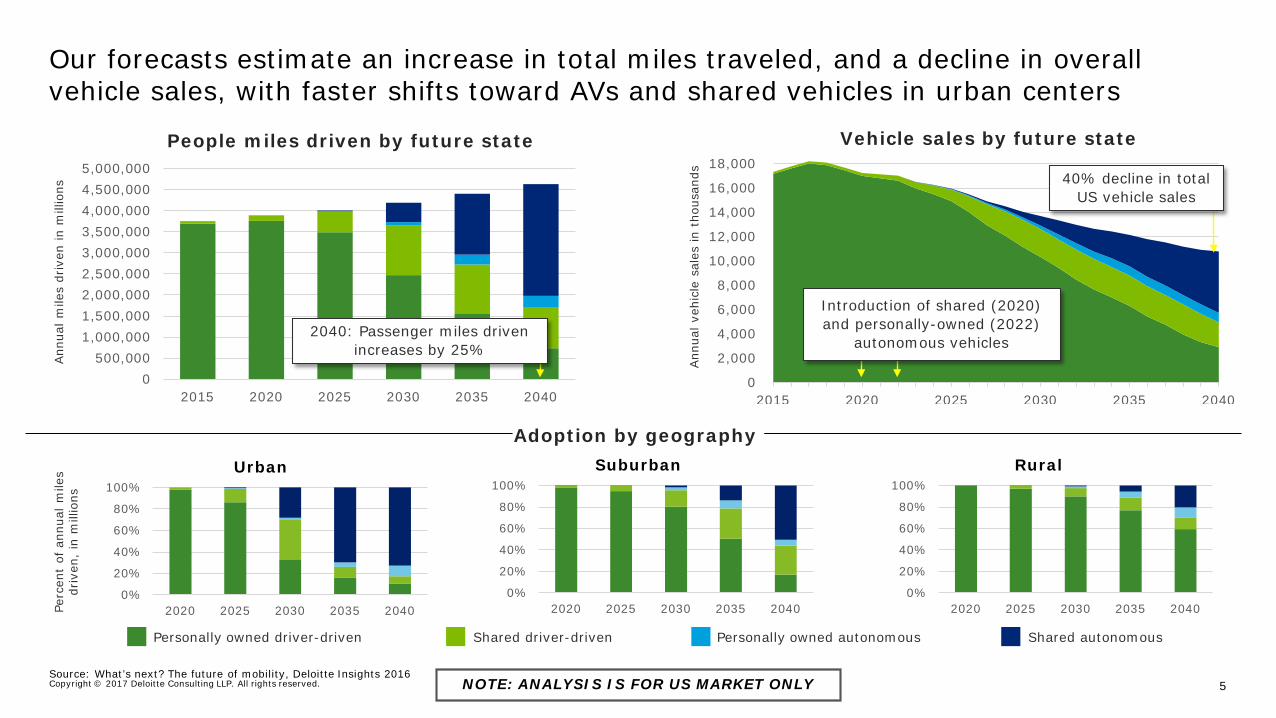
Our forecasts estimate an increase in total miles traveled, and a decline in overall vehicle sales, with faster shifts toward AVs and shared vehicles in urban centers
0
2,000
4,000
6,000
8,000
10,000
12,000
14,000
16,000
18,000
2015 2020 2025 2030 2035 2040
Vehicle sales by future state
0500,000
1,000,0001,500,0002,000,0002,500,0003,000,0003,500,0004,000,0004,500,0005,000,000
2015 2020 2025 2030 2035 2040
People miles driven by future state
Personally owned driver-driven Shared driver-driven Personally owned autonomous Shared autonomous
Introduction of shared (2020) and personally-owned (2022)
autonomous vehicles2040: Passenger miles driven
increases by 25%
Urban Suburban Rural
Perc
ent
of a
nnua
l m
iles
driv
en,
in m
illio
nsAnn
ual m
iles
driv
en in
mill
ions
Ann
ual v
ehic
le s
ales
in t
hous
ands
Adoption by geography
40% decline in total US vehicle sales
0%
20%
40%
60%
80%
100%
2020 2025 2030 2035 20400%
20%
40%
60%
80%
100%
2020 2025 2030 2035 20400%
20%
40%
60%
80%
100%
2020 2025 2030 2035 2040
Source: What’s next? The future of mobility, Deloitte Insights 2016NOTE: ANALYSIS IS FOR US MARKET ONLY
Copyright © 2017 Deloitte Consulting LLP. All rights reserved. 6
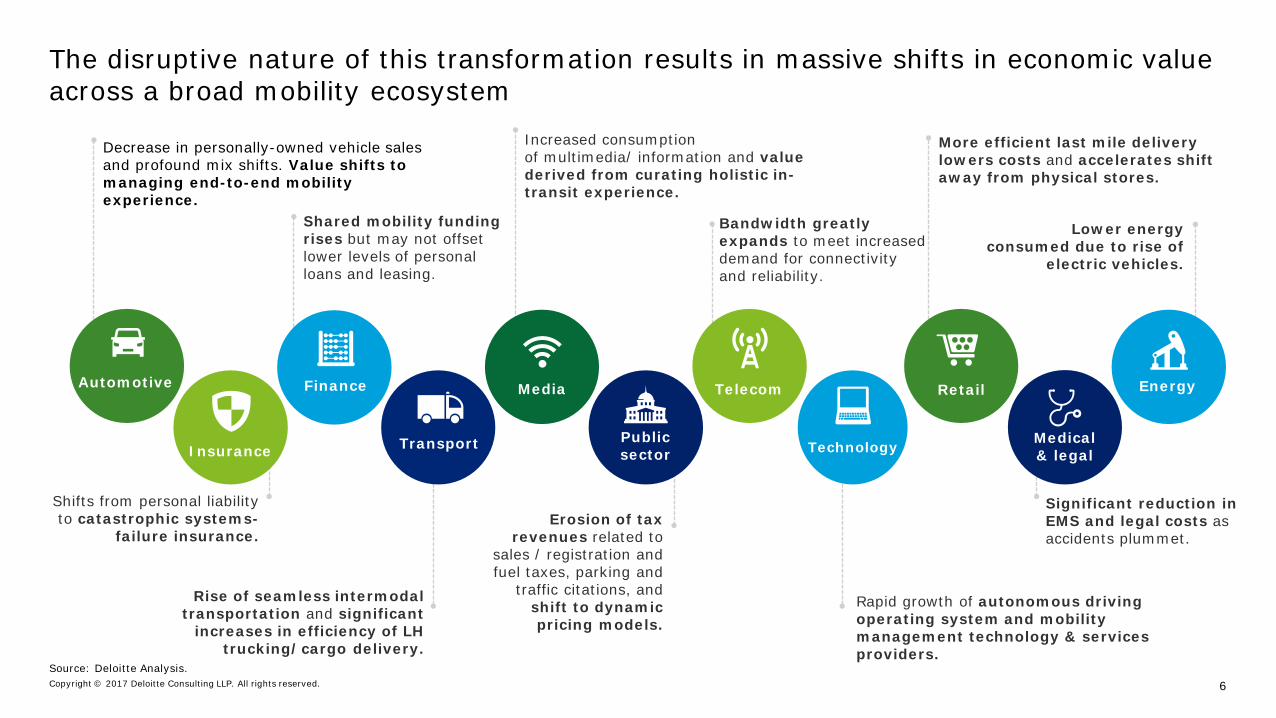
The disruptive nature of this transformation results in massive shifts in economic value across a broad mobility ecosystem
Increased consumption of multimedia/ information and value derived from curating holistic in-transit experience.
Decrease in personally-owned vehicle sales and profound mix shifts. Value shifts to managing end-to-end mobility experience.
Shared mobility funding rises but may not offset lower levels of personal loans and leasing.
Rapid growth of autonomous driving operating system and mobility management technology & servicesproviders.
Shifts from personal liability to catastrophic systems-
failure insurance.
Lower energy consumed due to rise of
electric vehicles.
Erosion of tax revenues related to
sales / registration and fuel taxes, parking and
traffic citations, and shift to dynamic pricing models.
More efficient last mile delivery lowers costs and accelerates shift away from physical stores.
Bandwidth greatly expands to meet increased demand for connectivity and reliability.
Significant reduction in EMS and legal costs as accidents plummet.
Rise of seamless intermodal transportation and significant
increases in efficiency of LH trucking/cargo delivery.
EnergyFinance
TransportInsurance
TelecomAutomotive Retail
Publicsector
Medical& legalTechnology
Media
Source: Deloitte Analysis.
Copyright © 2017 Deloitte Consulting LLP. All rights reserved. 7
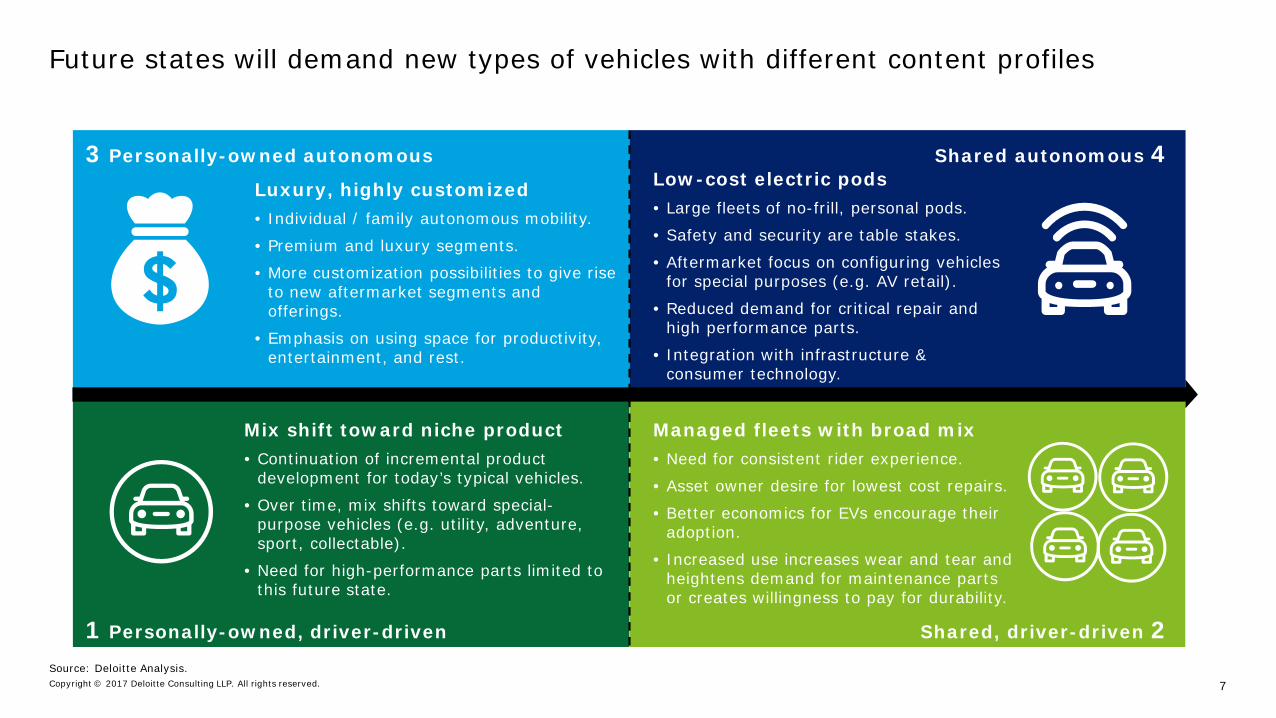
Future states will demand new types of vehicles with different content profiles
Luxury, highly customized• Individual / family autonomous mobility.
• Premium and luxury segments.
• More customization possibilities to give rise to new aftermarket segments and offerings.
• Emphasis on using space for productivity, entertainment, and rest.
Mix shift toward niche product• Continuation of incremental product
development for today’s typical vehicles.
• Over time, mix shifts toward special-purpose vehicles (e.g. utility, adventure, sport, collectable).
• Need for high-performance parts limited to this future state.
Shared autonomous 4
Shared, driver-driven 2
3 Personally-owned autonomous
1 Personally-owned, driver-driven
Low-cost electric pods• Large fleets of no-frill, personal pods.
• Safety and security are table stakes.
• Aftermarket focus on configuring vehicles for special purposes (e.g. AV retail).
• Reduced demand for critical repair and high performance parts.
• Integration with infrastructure & consumer technology.
Managed fleets with broad mix• Need for consistent rider experience.
• Asset owner desire for lowest cost repairs.
• Better economics for EVs encourage their adoption.
• Increased use increases wear and tear and heightens demand for maintenance parts or creates willingness to pay for durability.
Source: Deloitte Analysis.
Copyright © 2017 Deloitte Consulting LLP. All rights reserved. 8
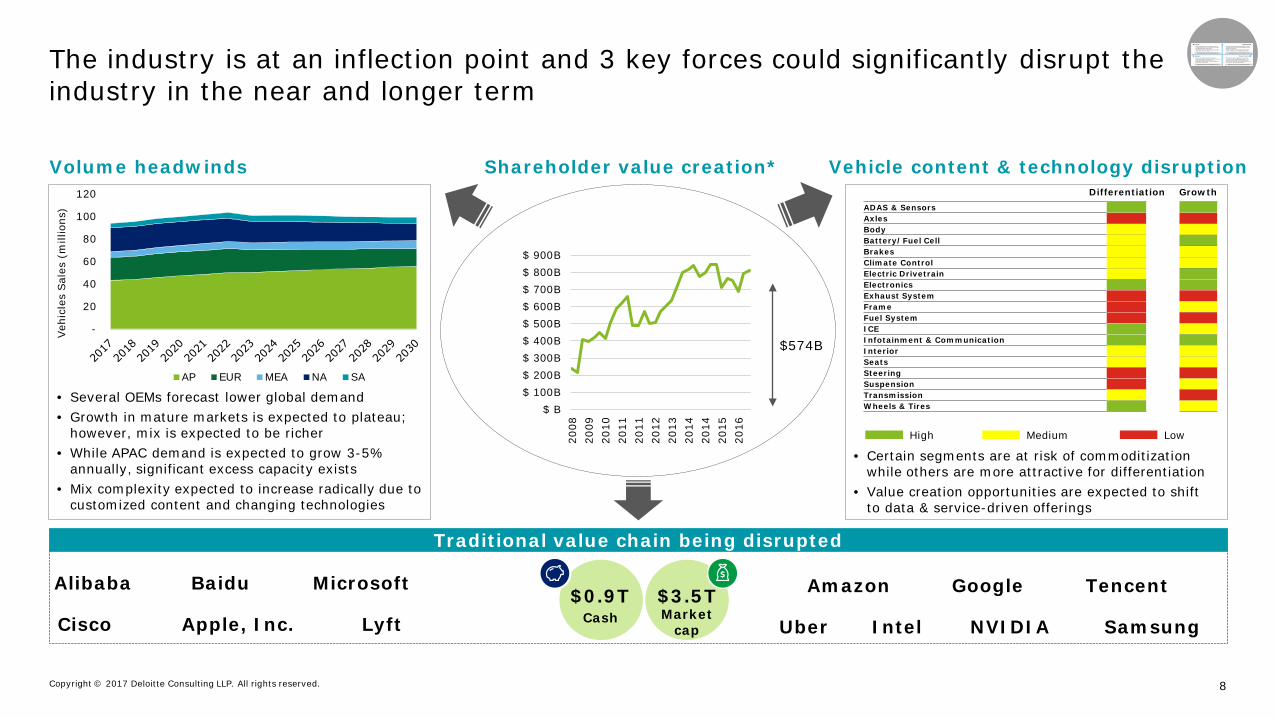
The industry is at an inflection point and 3 key forces could significantly disrupt the industry in the near and longer term
Volume headwinds Shareholder value creation*
• Several OEMs forecast lower global demand• Growth in mature markets is expected to plateau;
however, mix is expected to be richer• While APAC demand is expected to grow 3-5%
annually, significant excess capacity exists• Mix complexity expected to increase radically due to
customized content and changing technologies
GrowthDifferentiation
$ B$ 100B$ 200B$ 300B$ 400B$ 500B$ 600B$ 700B$ 800B$ 900B
2008
2009
2010
2011
2011
2012
2013
2014
2014
2015
2016
Vehicle content & technology disruption
Traditional value chain being disrupted
$0.9TCash
$3.5TMarket
cap
$574B -
20
40
60
80
100
120
Vehi
cles
Sal
es (
mill
ions
)
AP EUR MEA NA SA
• Certain segments are at risk of commoditization while others are more attractive for differentiation
• Value creation opportunities are expected to shift to data & service-driven offerings
ADAS & SensorsAxlesBodyBattery/Fuel CellBrakesClimate ControlElectric DrivetrainElectronicsExhaust SystemFrameFuel SystemICEInfotainment & CommunicationInteriorSeatsSteeringSuspensionTransmissionWheels & Tires
Alibaba
Cisco
Baidu Microsoft
LyftApple, Inc. Uber Intel
GoogleAmazon
NVIDIA Samsung
Tencent
LowMediumHigh
Copyright © 2017 Deloitte Consulting LLP. All rights reserved. 9
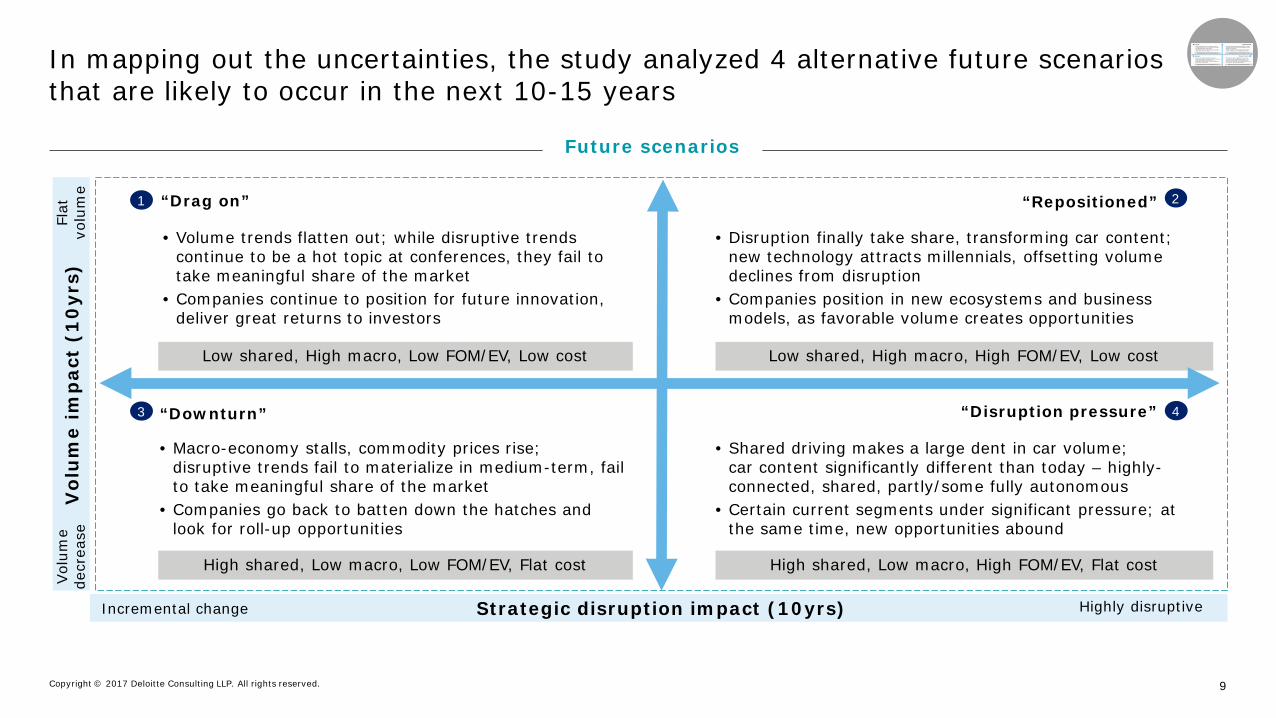
In mapping out the uncertainties, the study analyzed 4 alternative future scenarios that are likely to occur in the next 10-15 years
Vol
um
e im
pac
t (1
0yr
s)
Strategic disruption impact (10yrs)
“Repositioned” 2
Flat
vo
lum
eVol
ume
decr
ease
Highly disruptive
• Volume trends flatten out; while disruptive trends continue to be a hot topic at conferences, they fail to take meaningful share of the market
• Companies continue to position for future innovation, deliver great returns to investors
“Drag on”1
• Disruption finally take share, transforming car content; new technology attracts millennials, offsetting volume declines from disruption
• Companies position in new ecosystems and business models, as favorable volume creates opportunities
• Macro-economy stalls, commodity prices rise; disruptive trends fail to materialize in medium-term, fail to take meaningful share of the market
• Companies go back to batten down the hatches and look for roll-up opportunities
“Downturn”
• Shared driving makes a large dent in car volume; car content significantly different than today – highly-connected, shared, partly/some fully autonomous
• Certain current segments under significant pressure; at the same time, new opportunities abound
3
Low shared, High macro, Low FOM/EV, Low cost Low shared, High macro, High FOM/EV, Low cost
High shared, Low macro, Low FOM/EV, Flat cost
“Disruption pressure” 4
High shared, Low macro, High FOM/EV, Flat cost
Future scenarios
Incremental change
Copyright © 2017 Deloitte Consulting LLP. All rights reserved. 10
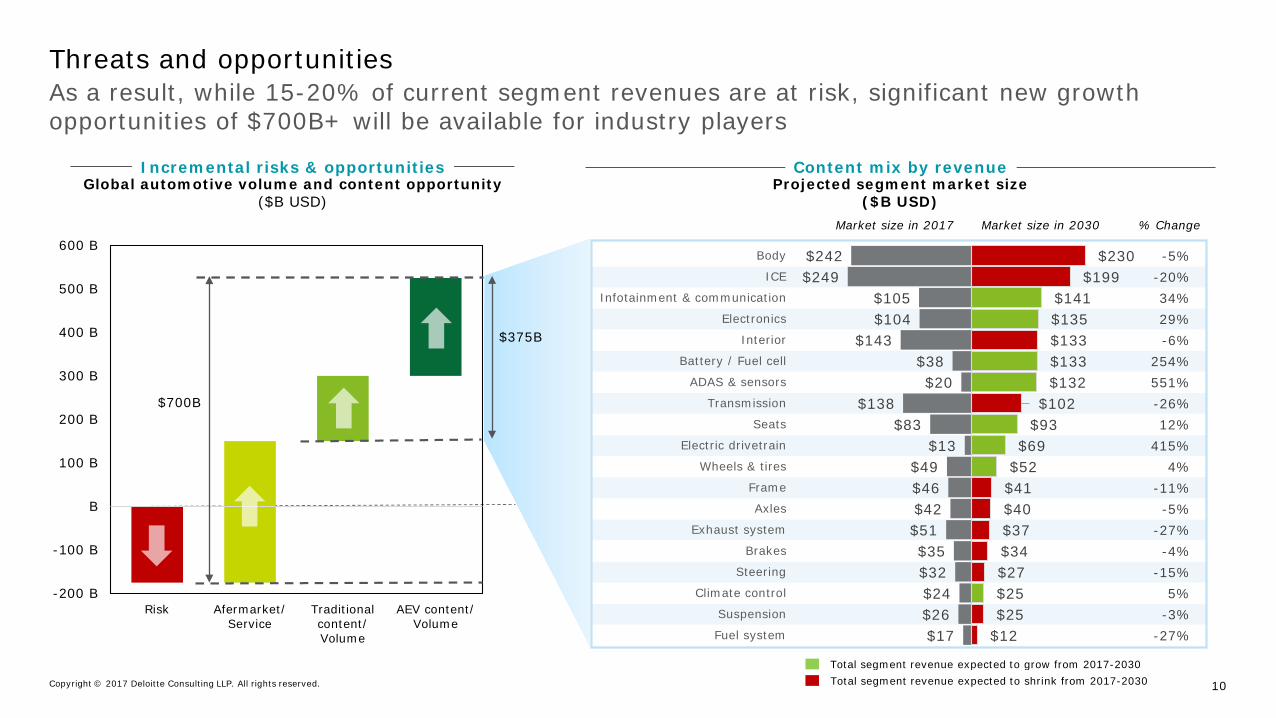
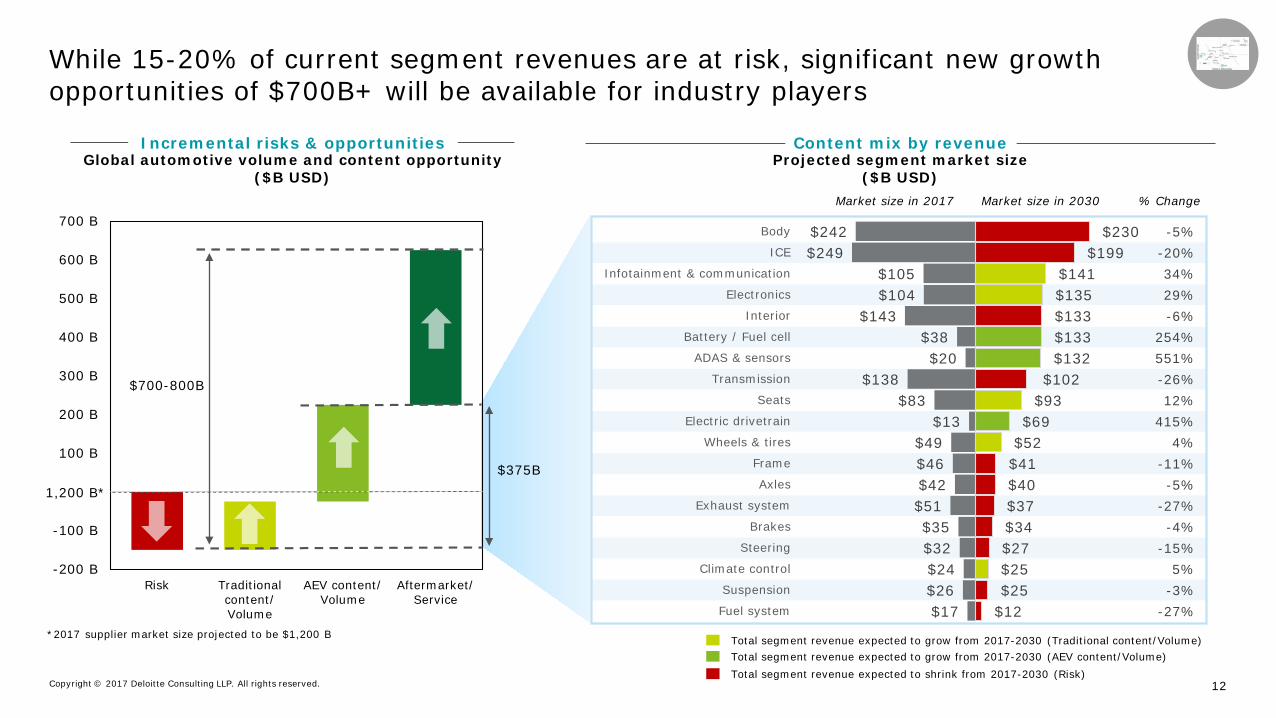
$17 $26 $24 $32 $35
$51 $42 $46 $49
$13 $83
$138 $20
$38 $143
$104 $105
$249 $242
-27%-3%5%
-15%-4%
-27%-5%
-11%4%
415%12%
-26%551%254%
-6%29%34%
-20%-5%
$12 $25 $25 $27 $34 $37 $40 $41 $52 $69
$93 $102
$132 $133 $133 $135 $141
$199 $230
Fuel system
Suspension
Climate control
Steering
Brakes
Exhaust system
Axles
Frame
Wheels & tires
Electric drivetrain
Seats
Transmission
ADAS & sensors
Battery / Fuel cell
Interior
Electronics
Infotainment & communication
ICE
Body
Total segment revenue expected to grow from 2017-2030
-200 B
-100 B
B
100 B
200 B
300 B
400 B
500 B
600 B
Risk Afermarket/Service
Traditionalcontent/Volume
AEV content/Volume
Incremental risks & opportunities Content mix by revenueGlobal automotive volume and content opportunity
($B USD)Projected segment market size
($B USD)
Total segment revenue expected to shrink from 2017-2030
Market size in 2017 Market size in 2030
$375B
$700B
% Change
As a result, while 15-20% of current segment revenues are at risk, significant new growth opportunities of $700B+ will be available for industry players
Threats and opportunities

Copyright © 2017 Deloitte Consulting LLP. All rights reserved. 11
ADAS & sensors
Infotainment & communication
ElectronicsElectric
drivetrain
Battery / Fuel Cell
ICE
Wheels & tires
Seats
Body
Interior
Transmission
Climate control
Brakes
Frame
Steering
Exhaust system
Fuel system
Suspension
Axles
1.6
2.1
2.6
3.1
3.6
4.1
4.6
1.4 1.9 2.4 2.9 3.4 3.9 4.4 4.9
Gro
wth
po
ten
tial
Ability to differentiate
Median differentiation Score
Median growth score
Overall attractiveness varies across product segments, with several facing significant risk of commoditization/decline
Observations
• Suppliers, OEMs as well as non-traditional suppliers and high tech players vying for competitive position in attractive segments
• Attractive segments’ traditional value chain is being challenged, as the technology disruption occurs – e.g., tier leapfrogging may challenge the traditional linear model
• Suppliers with product portfolio in middle-ground segments are shifting focus to more profitable segments and enhanced value propositions
• Players in segments with higher risk and asset intensity may begin to consolidate further and/or become potential acquisition targets
Attractive
Risky
Copyright © 2017 Deloitte Consulting LLP. All rights reserved. 12
$17 $26 $24 $32 $35
$51 $42 $46 $49
$13 $83
$138 $20
$38 $143
$104 $105
$249 $242
-27%-3%5%
-15%-4%
-27%-5%
-11%4%
415%12%
-26%551%254%
-6%29%34%
-20%-5%
$12 $25 $25 $27 $34 $37 $40 $41 $52 $69
$93 $102
$132 $133 $133 $135 $141
$199 $230
Fuel system
Suspension
Climate control
Steering
Brakes
Exhaust system
Axles
Frame
Wheels & tires
Electric drivetrain
Seats
Transmission
ADAS & sensors
Battery / Fuel cell
Interior
Electronics
Infotainment & communication
ICE
Body
Incremental risks & opportunities Content mix by revenue
While 15-20% of current segment revenues are at risk, significant new growth opportunities of $700B+ will be available for industry players
Global automotive volume and content opportunity ($B USD)
Projected segment market size ($B USD)
Total segment revenue expected to grow from 2017-2030 (AEV content/Volume)
Market size in 2017 Market size in 2030 % Change
$375B
Total segment revenue expected to shrink from 2017-2030 (Risk)
Total segment revenue expected to grow from 2017-2030 (Traditional content/Volume)
-200 B
-100 B
B
100 B
200 B
300 B
400 B
500 B
600 B
700 B
Risk Traditionalcontent/Volume
AEV content/Volume
Aftermarket/Service
$700-800B
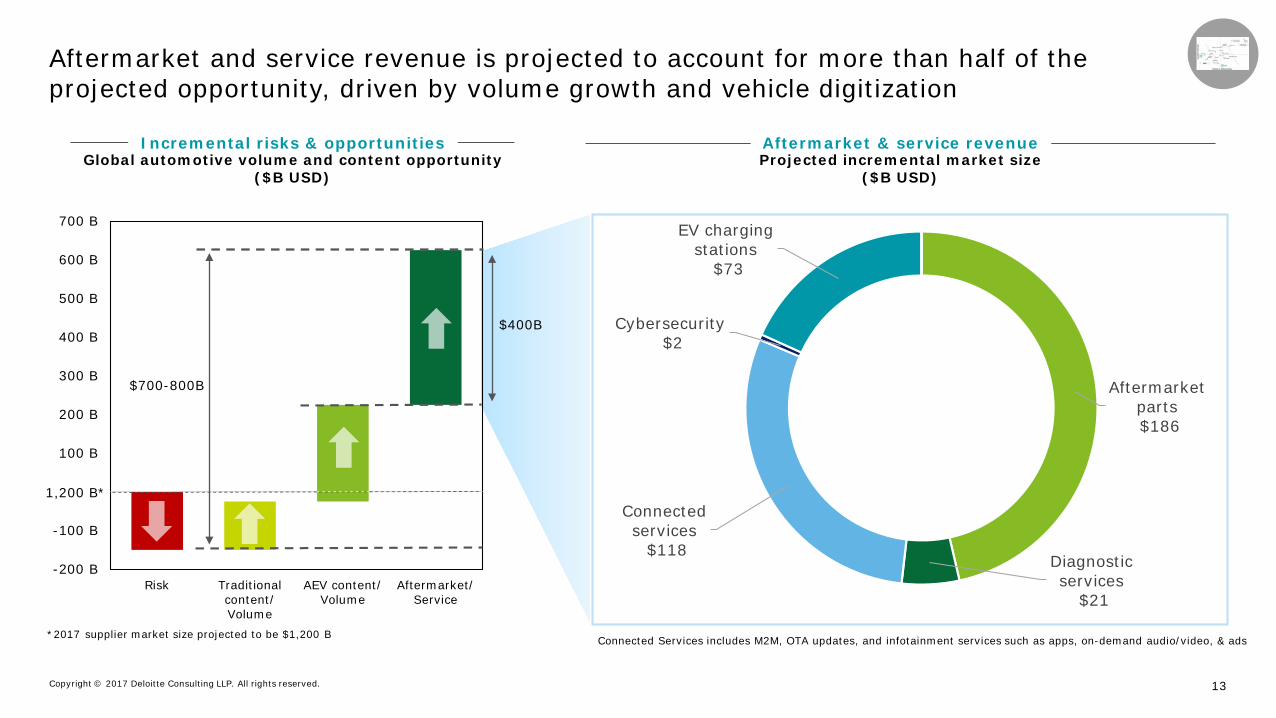
1,200 B*
*2017 supplier market size projected to be $1,200 B
Copyright © 2017 Deloitte Consulting LLP. All rights reserved. 13
-200 B
-100 B
B
100 B
200 B
300 B
400 B
500 B
600 B
700 B
Risk Traditionalcontent/Volume
AEV content/Volume
Aftermarket/Service
Incremental risks & opportunities Aftermarket & service revenue
Aftermarket and service revenue is projected to account for more than half of the projected opportunity, driven by volume growth and vehicle digitization
Global automotive volume and content opportunity ($B USD)
Projected incremental market size ($B USD)
$400B
$700-800B Aftermarket parts$186
Diagnostic services
$21
Connected services
$118
Cybersecurity$2
EV charging stations
$73
Connected Services includes M2M, OTA updates, and infotainment services such as apps, on-demand audio/video, & ads*2017 supplier market size projected to be $1,200 B
1,200 B*
Copyright © 2017 Deloitte Consulting LLP. All rights reserved. 14
Implications for automotive aftermarketTrends shaping the aftermarket industryPotential considerations for aftermarket players
Copyright © 2017 Deloitte Consulting LLP. All rights reserved. 15
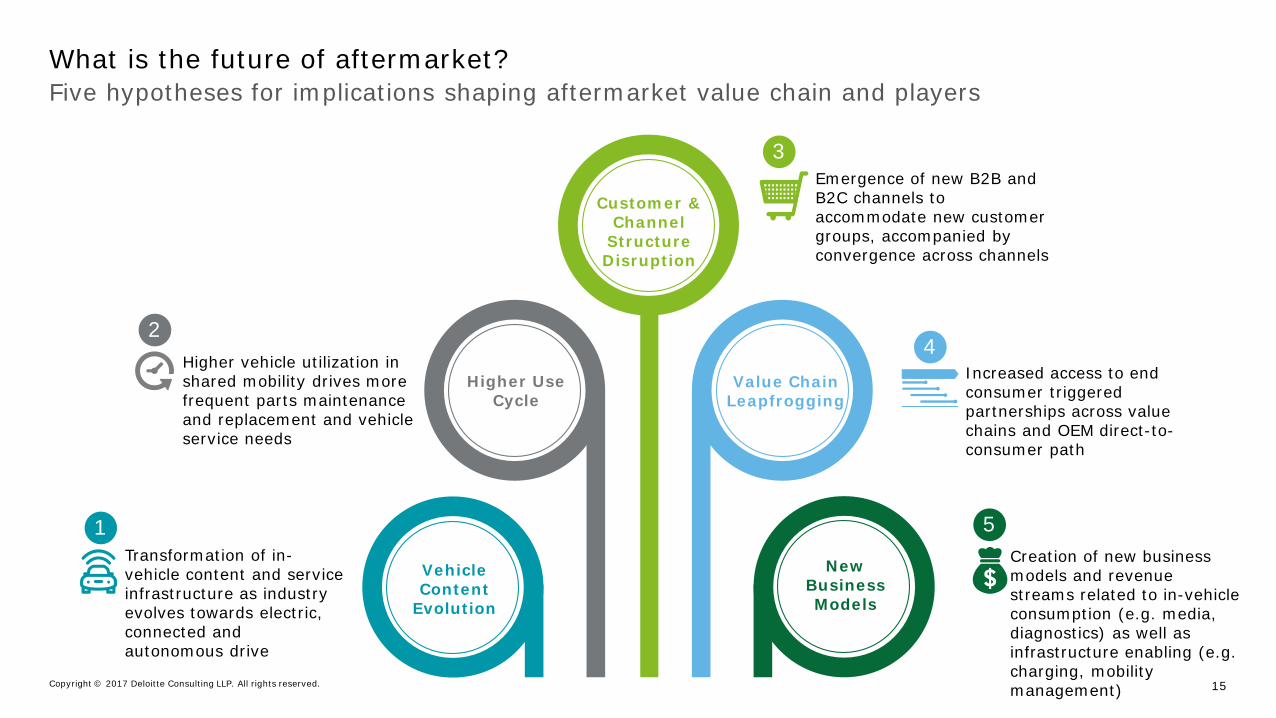
Five hypotheses for implications shaping aftermarket value chain and playersWhat is the future of aftermarket?
Customer & Channel
Structure Disruption
Value Chain Leapfrogging
Higher Use Cycle
Vehicle Content
Evolution
New Business Models
Higher vehicle utilization in shared mobility drives more frequent parts maintenance and replacement and vehicle service needs
Transformation of in-vehicle content and service infrastructure as industry evolves towards electric, connected and autonomous drive
Emergence of new B2B and B2C channels to accommodate new customer groups, accompanied by convergence across channels
Increased access to end consumer triggered partnerships across value chains and OEM direct-to-consumer path
Creation of new business models and revenue streams related to in-vehicle consumption (e.g. media, diagnostics) as well as infrastructure enabling (e.g. charging, mobility management)
3
4
5
2
1
Copyright © 2017 Deloitte Consulting LLP. All rights reserved. 16
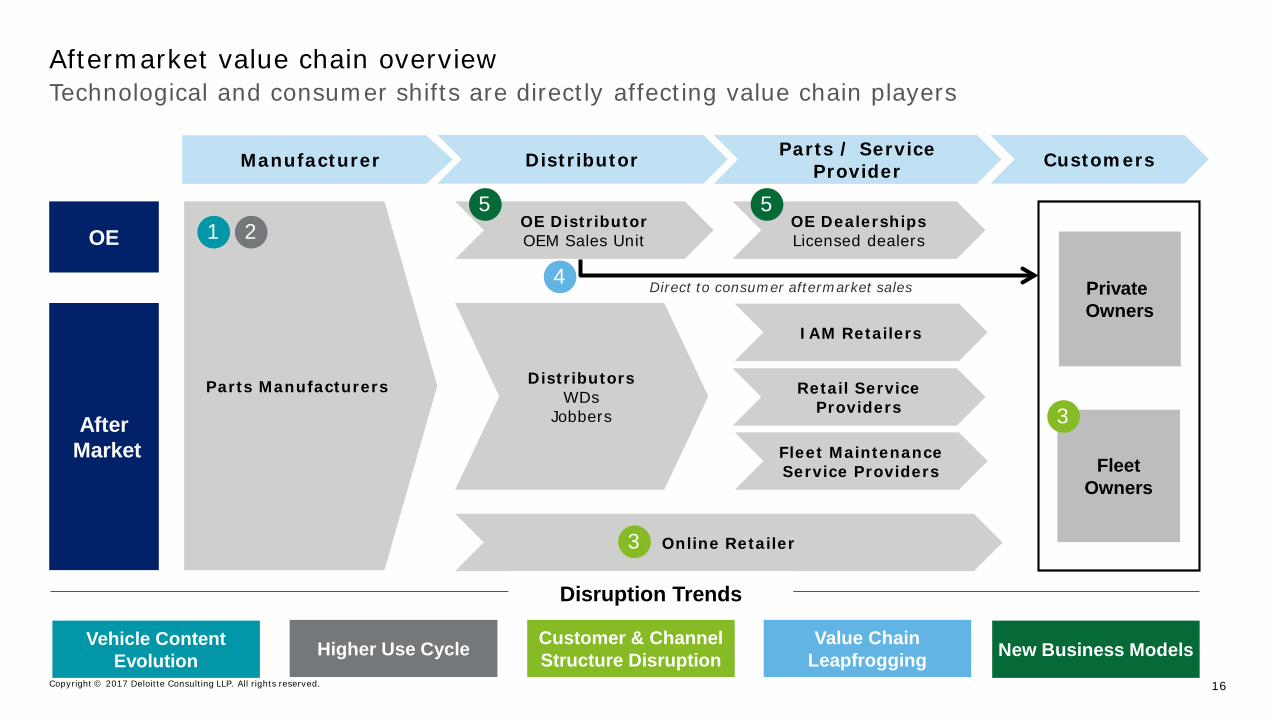
Technological and consumer shifts are directly affecting value chain playersAftermarket value chain overview
Parts Manufacturers
OE DistributorOEM Sales UnitOE
AfterMarket
Direct to consumer aftermarket sales
DistributorsWDs
Jobbers
Online Retailer
OE DealershipsLicensed dealers
IAM Retailers
Retail Service Providers
Fleet Maintenance Service Providers
Private Owners
FleetOwners
3
3
4
1 25 5
DistributorManufacturer Parts / Service Provider Customers
Disruption Trends
Vehicle Content Evolution Higher Use Cycle Customer & Channel
Structure DisruptionValue Chain
Leapfrogging New Business Models
Copyright © 2017 Deloitte Consulting LLP. All rights reserved. 17
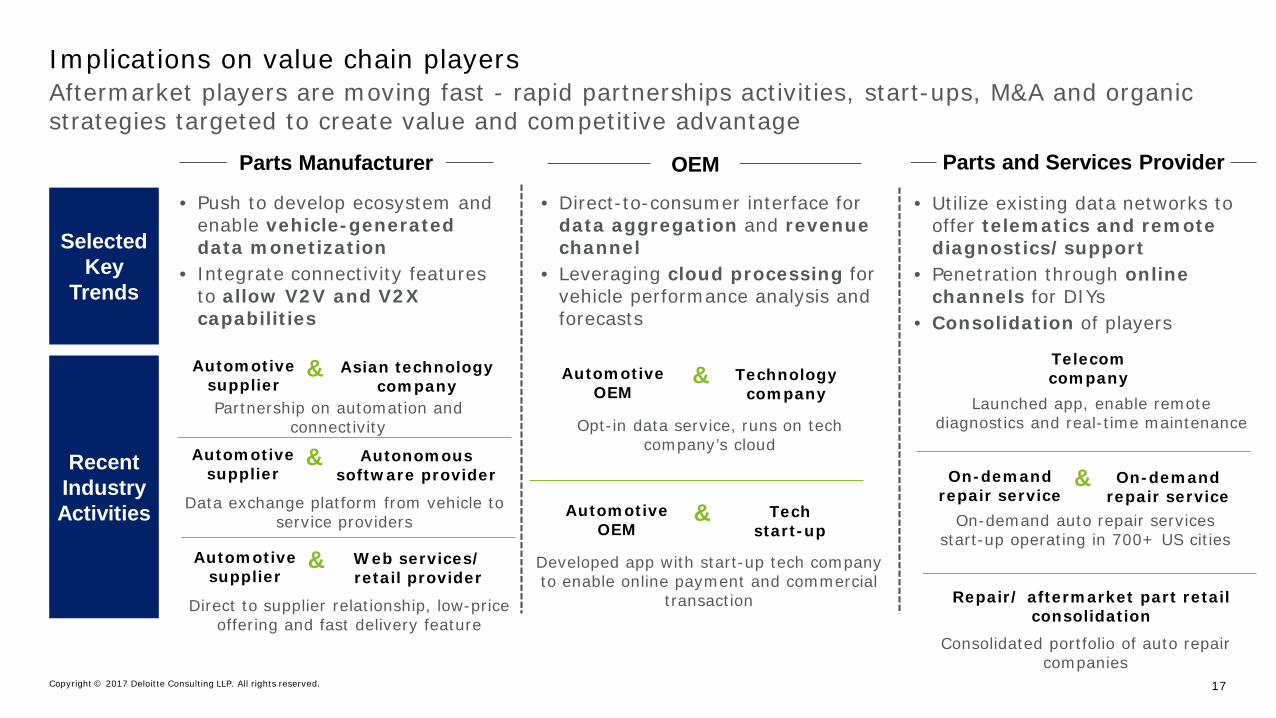
Aftermarket players are moving fast - rapid partnerships activities, start-ups, M&A and organic strategies targeted to create value and competitive advantage
Implications on value chain players
Selected Key
Trends
Recent Industry Activities
OEM
Opt-in data service, runs on tech company’s cloud
Developed app with start-up tech company to enable online payment and commercial
transaction
Data exchange platform from vehicle to service providers
Launched app, enable remote diagnostics and real-time maintenance
Direct to supplier relationship, low-price offering and fast delivery feature
• Push to develop ecosystem and enable vehicle-generated data monetization
• Integrate connectivity features to allow V2V and V2X capabilities
• Direct-to-consumer interface for data aggregation and revenue channel
• Leveraging cloud processing for vehicle performance analysis and forecasts
• Utilize existing data networks to offer telematics and remote diagnostics/support
• Penetration through online channels for DIYs
• Consolidation of players
Parts Manufacturer Parts and Services Provider
On-demand auto repair services start-up operating in 700+ US cities
Consolidated portfolio of auto repair companies
Partnership on automation and connectivity
Automotive supplier
Asian technology company
&
Automotive supplier
Autonomous software provider
&
Automotive supplier
Web services/ retail provider
&
Automotive OEM
Technology company
&
Automotive OEM
Techstart-up
&
Telecomcompany
On-demandrepair service
On-demandrepair service
&
Repair/ aftermarket part retail consolidation

Copyright © 2017 Deloitte Consulting LLP. All rights reserved. 18
Executing the right strategies helps our clients mitigate risks and capture value from new opportunities
Transforming disruption into opportunities
Cost and Asset Efficiency • Core business profitability• Cost & asset efficiency and
profitability transparency• Material cost efficiency• Digital supply chainOrganization, talent, and
operating model• IP- and service-centric business
models• Partnership and contracting
models• Talent requirements• Capability building
Portfolio optimization and technology roadmap• Portfolio strategy and analytics• Scenario planning to optimize portfolio
performance• Product and technology strategy and
roadmap
M&A/Divestiture strategies and transaction execution• Growth and/or consolidation strategies • Capability identification and acquisition• Due diligence and transaction advisory• Integration execution
Service offerings and new business models• Innovation strategy and agenda• Approach and process to new offering
development• Niche creation in new mobility ecosystem
About DeloitteDeloitte refers to one or more of Deloitte Touche Tohmatsu Limited, a UK private company limited by guarantee (“DTTL”), its network of member firms, and their related entities. DTTL and each of its member firms are legally separate and independent entities. DTTL (also referred to as “Deloitte Global”) does not provide services to clients. Please see www.deloitte.com/about for a detailed description of DTTL and its member firms. Please see www.deloitte.com/us/about for a detailed description of the legal structure of Deloitte LLP and its subsidiaries. Certain services may not be available to attest clients under the rules and regulations of public accounting.
Copyright © 2017 Deloitte Development LLC. All rights reserved.36 USC 220506