Embed Size (px)
Citation preview

Florida International UniversityFIU Digital Commons
Discussion Papers in Economics and Banking Department of Economics
6-1982
The Future of the Hispanic Market: The CubanEntrepreneur and the Economic Development ofthe Miami Standard Metropolitan Statistical AreaAntonio JorgeFlorida International University, International Banking Center & Department of Economics, [email protected]
Raul MoncarzFlorida International University, International Banking Center & Department of Economics
Follow this and additional works at: https://digitalcommons.fiu.edu/ecxdpeb
This work is brought to you for free and open access by the Department of Economics at FIU Digital Commons. It has been accepted for inclusion inDiscussion Papers in Economics and Banking by an authorized administrator of FIU Digital Commons. For more information, please [email protected].
Recommended CitationJorge, Antonio and Moncarz, Raul, "The Future of the Hispanic Market: The Cuban Entrepreneur and the Economic Development ofthe Miami Standard Metropolitan Statistical Area" (1982). Discussion Papers in Economics and Banking. 9.https://digitalcommons.fiu.edu/ecxdpeb/9

Discussion Papers in Economics and Banking
The Futum of the Hispanic Market: The Cuban Entrepmneur and the Economic
Development of the Miami Standard Metropolitan Statistical Area
by Antonio Jorge and Raul Moncaxz
Discussion Paper No. 6
June, 1982
International Banking Center & Department of Economics Florida International University Mami, Florida 33199

Discussion Papers in Economics and Banking
FLORIDA INTERNATIONAL UNIVERSTPr: COLLEGE OF ARTS & SCIENCES, DEPARTMENT OF ECONOMICS
JORGE SALAZAR-CARRILLO, Professor and Chairman, Ph.D., University of California (Berkeley), Economic Dwelopment, Economic Integration, International Economics, Labor Economics, Development Planning.
RENE HICONNET, Professor and Director of the International Banking Center at FLU., Ph.D., Harvard University, Money and Banking, International Economics, Economic History.
ANTONIO JORGE, Professor, Ph.D., Villanova University (Cuba), History of Economic Thought, Political Economy, Caribbean Economics, Cuban Economics, Comparative Sys- tems.
RAUL MONCARZ, Professor, Ph.D., Florida State University, Money and Banking, Eco- nomic Development, Human Resources.
MIRA WILKINS, Professor, Ph.D., Cambridge University (England), Economic and Busi- ness History, Multinational Corporations, World Economy.
IRMA G. TlRADO DE ALONSO, Associate Professor, Ph.D., University of York (England), Public Fiance, Economics of Education, Quantitative Methods.
MANUEL J. CARVAJAL, Associate Professor, Ph.D., University of Florida, Economics of Human Capital, Population and Labor Economics, Econometrics.
PANAGIS LIOSSATOS, Associate Professor, Ph.D., University of Pennsylvania, Spatial Economic Theory, Classical-Mamian Capital Theory, Mathematical Economics.
D. BABATUNDE THOMAS, Associate Professor, Ph.D., Indiana University, Technology Transfer, Economic Planning, Economic Development, Applied Macroeconomics.
ROBERT DAVID CRUZ, Assistant Professor, Ph.D. Candidate, University of Pennsyl- vania, International Economics, Development Economics.
GORDON V. KARELS, Assistant Professor, Ph.D., Purdue University, Industrial Organi- zation, Theory, Managerial Economics, Applied Microeconomics, Econometrics, Energy.
KENNETH J. LIPNER, Assistant Professor, Ph.D., Rutgers University, Urban Economics, Labor Economics.
M.E HASSAN, Visiting Professor, Ph.D., University of Wisconsin (Madison), Macroec* nomic Theory, Economic Development, International Economics.

The Future of the Hispanic Market: The Cuban Entrepreneur and the Economic Development of
the Miami Standard Metropolitan Statistical Area
BY Antonio Jorge* and Raul Moncarz**
*Professor of Political Economy, Florida International University **Professor of Economics, Florida International University
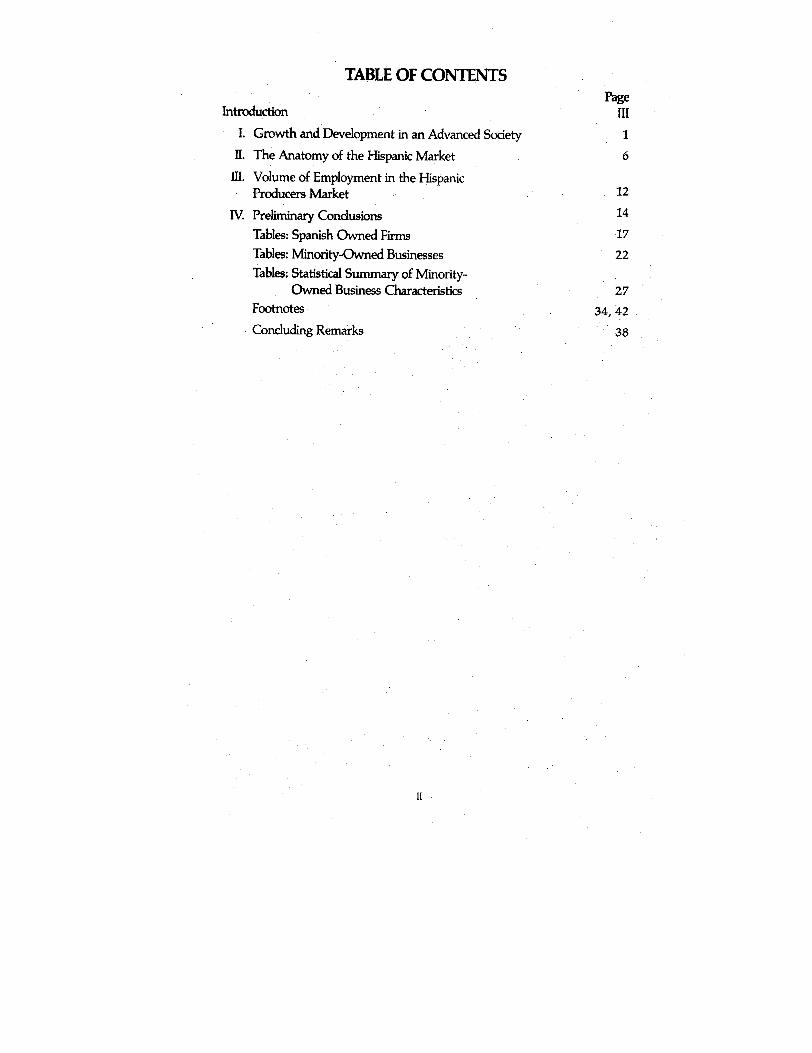
TABLE OF CONTENTS
Introduction
I. Growth and Development in an Advanced Society
11. The Anatomy of the Hispanic Market
III. Voiurne of Employment in the Hispanic Producers Market
n! Preliminary Conclusions
Tables: Spanish Owned Firms Tables: Minority-Owned Businesses Tables: Statistical Summary of Minority-
Owned Business characteristics Footnotes
Concluding Remarks
Page 111
i
6

THE CUBAN ENTREPRENEUR AND THE ECONOMIC DEVELOPMENT OF THE MIAMI S.M.S.A.
Introduction
The present paper has for its main objective to explore the con- tribution of Cuban and Hispanics in an area which so far has been very little researched. Namely, the constitution, nature or anatomy of the Hispanic producers market and its participation in the overall economic development and growth of the S.M.S.A. of Miami.
Other aspects of the Cuban and Hispanic contribution have been dealt with at some length in .other publications by the authors of the present work. These other dimensions are those concerned, first, with the growth and relative importance over time of the Hispanic consumer market and, second, the indirect help given by Latins to the development of the area through the generation of a new socio- economic function. For the sake of not excluding these very fun- damental facets of the Hispanic socio-economic influence, we are in- cluding in the present work relevant quotes in the appropriate sec- tions.
It will be seen that although the Cuban entrepreneur has played in the past, and continues to have at present, a very important role in the area's economy, his future position is far from being assured. Innovation, efficiency, versatility, and the ability to compete in an ever more technologically and educationally refined environment, hold the key to his survival and success. Whether he will be up to the challenge or not, is largely his decision to make. No one can assure him of success beforehand. It is clearly predictable that inac- tion will certainly lead to the opposite result.

I. Growth and Development in an Advanced Society
We are advisedly contrasting devel~pment and growth in an ef- fort to draw attention to the very deep structural changes that have taken place in the society and economy of South Florida over the last two decades. According to established usage, growth consists in the continuing expansion of the economy of a developed society. The implication being that no structural changes are to take place in the process. Society's institutions are already in lace and provide a firm framework for the uninterrupted ascent of the economy. No major changes and adjustments are to be expected. Even in the economic field proper the path to be traveled can be anticipated and rationally extrapolated. Growth is, in a very fundamental sense, more of the same:An excellent example of this view is provided by --- - - -. . - - - - - ---- -. -
the assumptions and general perspective which are contributing to the redefinition of our social milieu as much as physically creating a new habitat for us to live in. A new dynamics has been incorporated into the social body and its elements, and even culture is subject to modification if not to fundamental revision. The economic sub- system itself is totally reshaped and assumes formerly unsuspected forms. There are good reasons to try to conceptualize the recent socio-economic and cultural changes in Dade County as part of a developmental experience. Once we adopt that attitude it becomes much easier to deal with discontinuities and to understand the con- flictive and crisscrossing paths that events have taken in our local society. That is, once we accept the notion of structural change, even if unaccustomed to the exercise in the context of an advanced society, it becomes much easier to try to make sense of apparently disjointed and disfunctional occurrences and behavior.
The key consists in realizing that tomorrow can no longer be expected to be like today. That there are powerful underlying forces which are transforming the scaffolding of society. The economy it- self is breaking new paths, and, in the process, powerfully contri- buting to the redefinition of our social milieu as much as it is phys- ically creating a new habitat for us to live in. A new dynamics has been incorporated into the social body and it will inevitably lead society into areas that not long ago would have been totally unex- plored.
Like all social processes, although in greatly varying degrees de- pending on specific composition and circumstances, this one has ome relatively fixed elements to it and others which admit of great-
er flexibility. There is a logic inherent in change. The alternatives

are not infinite and certain goals cannot be pursued in totally free and unconstrained ways.
In the case of Miami, the new blend of cultural and socio- economic factors which constitute the infrastructure of its economic development set the boundaries and parameters of the transaction matrix itself. The fact that we have a new matrix is what justifies the use of the term development in our context.
Interestingly enough, our paths to economic development share some of the traits and features which classical and neo-classical e- conomists associated with the process. Most specifically, the interna- tional trade aspects of it. J.S. Mill, D.H. Robertson, E Taussig, G. Haberler and J. Viner would'have felt very comfortable with the growth engine metaphor in our particular case. As a matter of fact, from a purely economic standpoint ours can be construed as a text- book case. It is precisely because of the ex-post facto smooth and reg- ular behavior of some of the crucial variables' values and their mu- tual inter-relation that the construction of a preliminary mathemati- cal model could be attempted. Predictably, the most confusing, debat- able and emotion-laden facets of the process lie in the area of socio- cultural change. That was to be fully expected. Man does not live by economic rationality alone. Perhaps, and contrary to established folklore, not even to an important degree. Values are to be taken very seriously. Particularly, instrumental values and their reflection in everyday lifestyles and behavior. Inevitably, all of the strands of the process of structural transformation are intertwined and cannot be separated and rewoven at will. There are only so many degrees of freedom in goal directed paths. Doubtless, it would be of great theoretical significance as well as of practical import to explore this matter in detail. It would allow us the benefit of foresight in help- ing to eliminate obstacles, reduce adverse side effects, minimize so- cial costs and expedite the attainment of objectives and goals.
With the preceding in mind, let us now address the question of factor complementarity between the native society and economy and that of the new immigrants. In our estimation, this relation plays a pivotal role in any attempt at explaining the economic phenomena of the area. It is our thesis that their blending constitutes the gist of the heightened pace of development in the area during the past decade, and offers firm ground as well for the optimistic projections being made about the future of Miami's economy.1 The essence of the factor complementarity phenomenon between the host and im- migrant societies resides in the new production function arising from this mix. It is this innovation that is bringing about a far reaching

transformation of the local society and economy. Its working entails cultural change, as well as a progressive modification of social struc- tures and functions, accompanied by deep structural alterations in the fabric of the economy.
Without the socio-cultural and economic innovation wrought out by the interaction of local resources and the immigrants' traits, Miami would not have been in a position to develop the compara- tive and even absolute advantage that it now enjoys in the interna- tional economic field. The meeting of the two cultures proved to be a very fecund mix in terms of its attractiveness to Latin Americans first, and to western Europeans at a later stage of its evolution.
The cross-cultural product that has emerged from the cosmopoli- tan milieu now characterizing Miami has been highly instrumental in facilitating -- - a - classical - -- - - growth pattern through the opening of new maTkets, especially those to the South.2
-
The Cuban influx, now reinforced by the arrival of other Latin nationalities was, at the very least, a necessary condition for the transformation of Latin America's potential demand for the prod- ucts and services of this area into an effective demand. This pro- cess has been one associated with the familiar trade creation effect, whose greatest relevance lies precisely in the field of economic inte- gration.
In effect, it should come as no surprise to us that, to a large extent, Miami's favored position derives from its geopolitical advan- tages vis a vis the Caribbean and Latin America. Miami and the region to the south constitute a natural trade area for South Flor- ida. Although, of course, there are no formal arrangements in exis- tence regulating economic cooperation, in the manner, say, of a trade or customs union, not to speak of a common market, there are strong economic bonds arising from a rational commonality of interests. In the process of exploiting its advantageous geographical and economic position, Miami has also helped to create a trade div- ersion effect, deflecting potential economic activity that could have been channeled to other international centers like New Orleans and Atlanta, in its own direction.
There is no question that the even larger volume of heightened economic activity would have been greatly diminished had it not been for the net favorable balance for the area of the interdepend. ent action of the trade creation and diversion effects.
The increased economic activity was made possible by the ever larger volume of trade in commodities, business and professional services in general (ranging from the burgeoning medical industry

and educational services to financial and investment consulting); tourism and recreational services; and also banking transactions and operations in the capital as well as in the money and investment markets.3
Reiterating our main proposition, the symbiotic relationship of Cu- ban and Hispanic factor endowment on the one hand, and native factor proportions on the other, had indeed created a new produc- tion function by its innovative activity, both in the restricted area of factor mix, as well as in the larger context of socio-cultural change. The synergetic effect of this union accomplished what nei- ther component could have attained by itself. The evidence pat- ently indicates what best would be described as the appearance of historical increasing returns to all factors (seriatim) in the economy. The high and sustained growth rates of the area for the decade of
- --- -- -- . - .--
the sixties and u p to the 1974-75 recession (far above the corre- ponding percentages for the national economy), in association with a process of structural economic change which has been accomp- lished by large population growth and a corresponding work force expansion (with unemployment rates most of the time below the national level), and also marked by large upward jumps in domestic and foreign capital investment with undiminished factor return, estab- lish a strong presumption in favor of our contention.4 The weight of the data, we believe, amply verifies our position. Given that our statements are definitely falsifiable, the burden of refutation is on those that deny its validity. In turn, these discontinuities in the growth process have brought about dynamic changes in the com- parative advantage scale of the area. As a consequence, the com- parative cost situation has improved relative to foreign, and, particu- larly, Latin countries. This development has made possible the explo- sive market expansion in international activities which, at present, is playing the role of a key, strategic or dynamic sector in the econ- omy. In terms of the developmental literature, Miami has indeed become a true growth pole for a large region spanning north and south of its geographic position.
In sum, the economies of scale and real external economies that have ensued from the breaking down of indivisibilities and bottle- necks, and also from the elimination of rigidities and the closing of gaps in the economic system, are not only in the process of trans- forming the economic landscape, but are also actively helping to shape the socio-cultural milieu of the area.
It is interesting to observe that neither pre-Castro Cuba or Miami at that time could have succeeded in creating then what the latter
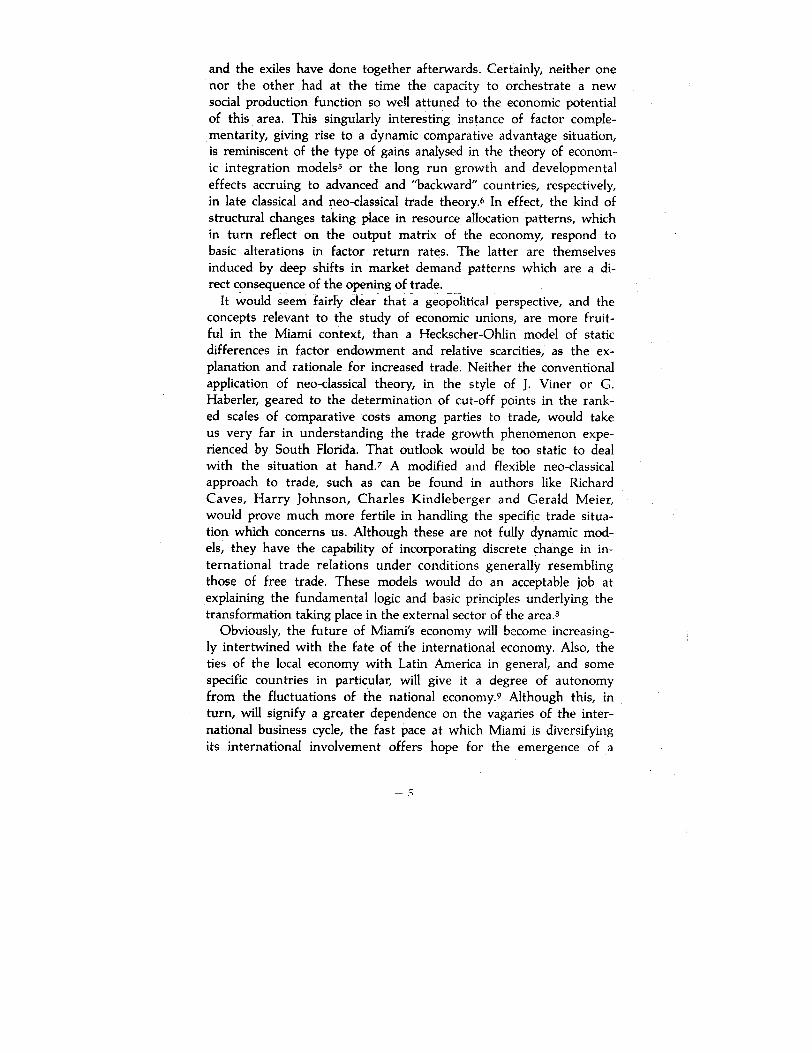
and the exiles have done together afterwards. Certainly, neither one nor the other had at the time the capacity to orchestrate a new social production function so well attuned to the economic potential of this area. This singularly interesting instance of factor comple- mentarity, giving rise to a dynamic comparative advantage situation, is reminiscent of the type of gains analysed in the theory of econom- ic integration models5 or the long run growth and developmental effects accruing to advanced and "backward" countries, respectively, in late classical and neo-classical trade theory.6 In effect, the kind of structural changes taking place in resource allocation patterns, which in turn reflect on the output matrix of the economy, respond to basic alterations in factor return rates. The latter are themselves induced by deep shifts in market demand patterns which are a di- rect consequence of the opening of trade.
It would seem fairk clear that perspective, and the concepts relevant to the study of economic unions, are more fruit- ful in the Miami context, than a Heckscher-Ohlin model of static differences in factor endowment and relative scarcities, as the ex- planation and rationale for increased trade. Neither the conventional application of neo-classical theory, in the style of J. Viner or G. Haberler, geared to the determination of cut-off points in the rank- ed scales of comparative costs among parties to trade, would take us very far in understanding the trade growth phenomenon expe- rienced by South Florida. That outlook would be too static to deal with the situation at hand.' A modified and flexible neo-classical approach to trade, such as can be found in authors like Richard Caves, Harry Johnson, Charles Kindleberger and Gerald Meier, would prove much more fertile in handling the specific trade situa- tion which concerns us. Although these are not fully dynamic mod- els, they have the capability of incorporating discrete change in in- ternational trade relations under conditions generally resembling those of free trade. These models would do an acceptable job at explaining the fundamental logic and basic principles underlying the transformation taking place in the external sector of the area.8
Obviously, the future of Miami's economy will become increasing- ly intertwined with the fate of the international economy. Also, the ties of the local economy with Latin America in general, and some specific countries in particular, will give it a degree of autonomy from the fluctuations of the national economy.9 Although this, in turn, will signify a greater dependence on the vagaries of the inter- national business cycle, the fast pace at which Miami is diversifying its international involvement offers hope for the emergence of a

relatively stable situation. Moreoever, in the case of Latin America and of some of the national economies with closest ties to Miami, the growth record has proven to be quite vigorous.10 The exogenous forces may, afterall, prove to be more stimulating than the domestic independent variables makmg for gr0wth.n - -
What all of the foregoing means in terms of practical entrepreneur- ial conduct for Hispanic firms is the following: to the extent that hard enough pockets of a differentiated market activity exist in Dade County, so that the concept of spealic Latin markets based on their low elasticity of substitution vis a vis competing markets has any reality, the Cuban and Hispanic entrepreneur can go exhibiting be- havior patterns not too dissimilar from those he displayed in his native Cuba and Latin America. Naturally, these conditions will not very often be fulfilled. Furthermore, a diversity of reasons would seem to suggest the increasing likelihood of Hispanic business firms and the Hispanic or Latin business sector as a whole being sub- jected to greater competitive pressure from the non-Hispanic firms and market. That is, elasticity of substitution among firms and mar- kets should increase as a function of time. Non-competing ethnic markets will gradually become more marginal and their existence more precarious.
11. The Anatomy of the Hispanic Market Let us now continue our investigation of the contribution of the
Cuban entrepreneurial activity to the development of the S.M.S.A. of Miami by pursuing it along two complementary paths. One will be the description of actual empirical events to the extent that the relatively scarce data on the subject allows it. The other will consist in an interpretive effort of the present situation of Cuban entre- preneurial activity in the context of the total society and market, and of its near term prospects as an individual component in the growth picture of the area.
Given that the population of Cuban origin in Dade County con- stitutes about 80% of the 'total Hispanic population, and that the number of Cuban businesses can be confidentially stated to repre- sent an even larger percentage of the total of Hispanic firms, we can for the purpose of this paper use the terms Cuban and His- panic interchangeably.
In the following pages we will be copiously citing data descriptive of Hispanic firms and their standing relative to the total of firms in Dade County. Some very limited national data will also be quoted. In order to avoid repeated reference to the same sources, we are

including the relevant data at the end of the paper. Therefore, we will dispense with individual quotations, except in the case of text material or when more than one source is involved.
We will start by noting that the number of Spanish owned firms has increased from 3,447 in 1969 to 4,847 in 1972 and to 8,248 in 1977. That is, about a 40% growth rate for the first period and 70% for the latter one. For a roughly comparable period, March 1975 to March 1979, there was a net increase of nearly 7,000 new businesses in Dade. The total number of businesses with employees went from 35,316 in 1975 to 38,052 in 1977 and to 42,294 in 1979, which signifies a 20% gain for the entire period. It should be noted, by way of background information useful for the interpretation of business expansion in the macroeconomic context, that during the mentioned interval employment increased in Dade by 78,000 or 13%, while the County's population advanced only 8% or by 140,000.12
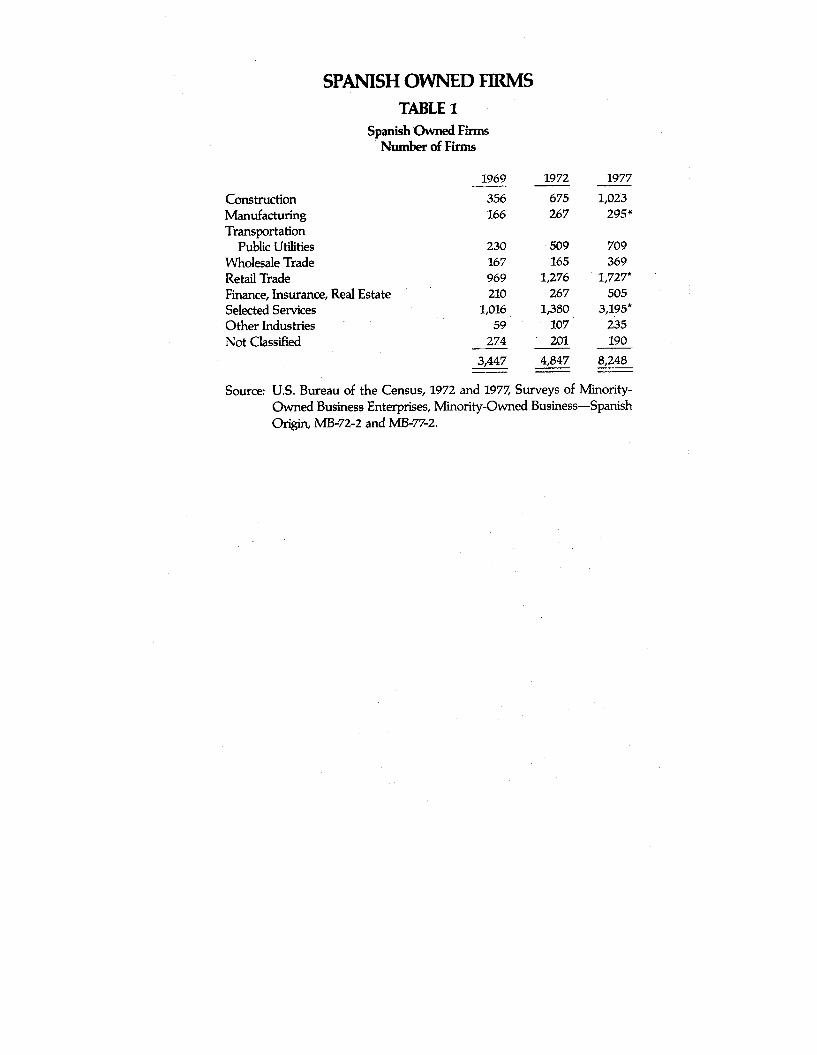
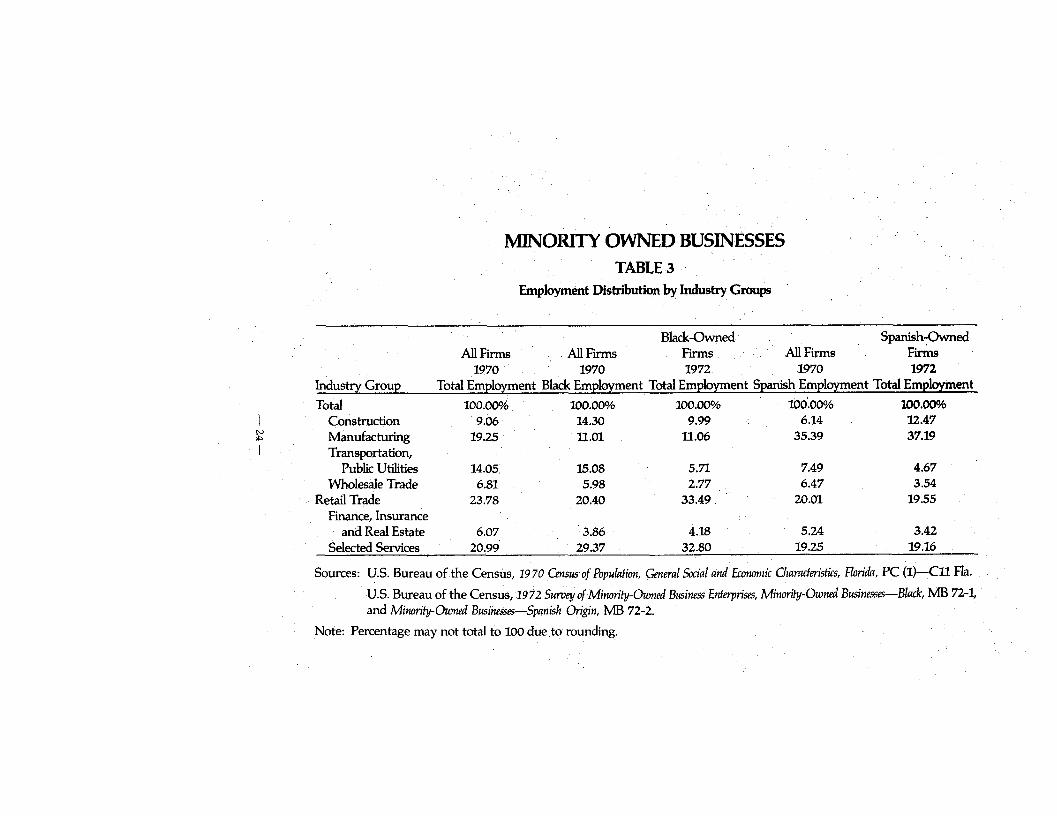
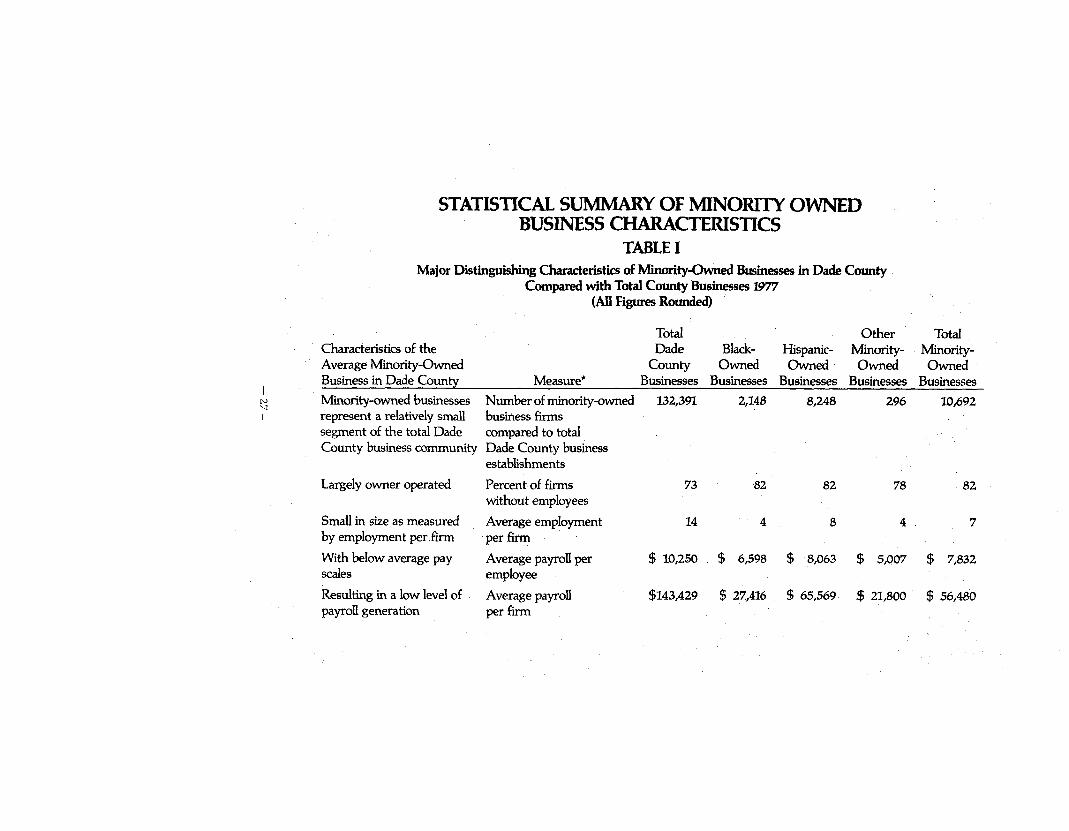
It would also help in drawing a general picture of ethnic business activity in Dade, to indicate that Hispanic-owned firms comprise 77% of Dade's minority-owned business units, accounting for 86% of the employees and 89% of the payrolls of such firms.13 Also, minority-owned firms are generally small in size. They are largely owner operated with no employees. Overall, the minority-owned firms that do hire outside workers have one-half the number of employees of the average non-minority-owned business. Below av- erage pay scales combine with these low employment levels to pro- duce low payroll generation per minority-owned firm.14
One should point to the fact that 73% of Dade County business- es are owner operated and do not have employees. In the case of Hispanic-owned businesses the corresponding percentage is 82. If businesses without employees were to be included in the total count for Dade, the number would have to be put at 132,391 for 1977, instead of the above cited figure of 42,294 for 1979. By the same token, the number of Hispanic firms with employees would be re- duced to 1,463 for 1977.15
It is also worth comparing the relative distribution and ranking of Hispanic firms in Miami and Florida with other areas of the nation. In 1972, Spanish-owned firms in the Miami metropolitan area (roughly equivalent to Dade County) ranked first in the nation in terms of gross receipts. Gross receipts per firm in the Miami area, the highest in the nation, were $74,939, far surpassing the second ranked metropolitan area, namely, El Paso, Texas, with an average of $59,773 per firm.
The Miami S.M.S.A. also had more Spanish-owned firms than
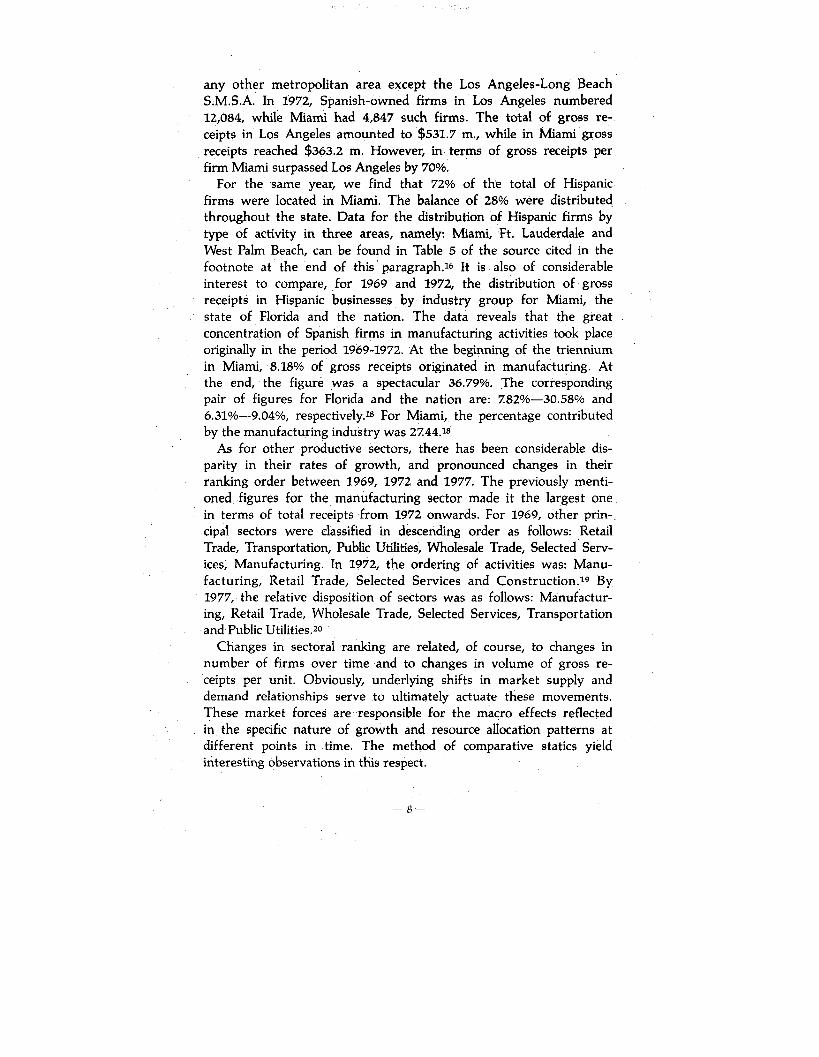
any other metropolitan area except the Los Angeles-Long Beach S.M.S.A. In 1972, Spanish-owned firms in Los Angeles numbered 12,084, while Miami had 4,847 such firms. The total of gross re- ceipts in Los Angeles amounted to $531.7 m., while in Miami gross receipts reached $363.2 m. However, in terms of gross receipts per firm Miami surpassed Los Angeles by 70%.
For the same year, we find that 72% of the total of Hispanic firms were located in Miami. The balance of 28% were distributed throughout the state. Data for the distribution of Hispanic firms by type of activity in three areas, namely: Miami, Ft. Lauderdale and West Palm Beach, can be found in Table 5 of the source cited in the footnote at the end of this'paragraph.16 It is also of considerable interest to compare, for 1969 and 1972, the distribution of gross receipts in Hispanic businesses by industry group for Miami, the state of Florida and the nation. The data reveals that the great concentration of Spanish firms in manufacturing activities took place originally in the period 1969-1972. At the beginning of the triennium in Miami, 8.18% of gross receipts originated in manufacturing. At the end, the figure was a spectacular 36.79%. The corresponding pair of figures for Florida and the nation are: 282%-30.58% and 6.31%-9.04%, respectively.18 For Miami, the percentage contributed by the manufacturing industry was 2244.18
As for other productive sectors, there has been considerable dis- parity in their rates of growth, and pronounced changes in their ranking order between 1969, 1972 and 1977. The previously menti- oned figures for the manufacturing sector made it the largest one in terms of total receipts from 1972 onwards. For 1969, other prin- cipal sectors were classified in descending order as follows: Retail Trade, Transportation, Public Utilities, Wholesale Trade, Selected Serv- ices, Manufacturing. In 1972, the ordering of activities was: Manu- facturing, Retail Trade, Selected Services and Construction.lg By 1977, the relative disposition of sectors was as follows: Manufactur- ing, Retail Trade, Wholesale Trade, Selected Services, Transportation and Public Utilities.20
Changes in sectoral ranking are related, of course, to changes in number of firms over time and to changes in volume of gross re- ceipts per unit. Obviously, underlying shifts in market supply and demand relationships serve to ultimately actuate these movements. These market forces are responsible for the macro effects reflected in the specific nature of growth and resource allocation patterns at different points in time. The method of comparative statics yield interesting observations in this respect.

At the micro level, that of the internal composition of the indi- vidual business firm in our case, it should be noted in passing that: a) Although relative (to other factors) labor intensity (amount of labor per unit of output) will naturally vary among different indus- tries and technologies in use and, b) Average efficiency of firms will also probably differ from one sector to the other, thus making for sectoral differences in the amount of receipts or sales per em- ployee, nonetheless, most probably there subsists a marked associa- tion between gross volume of receipts and size of individual firm for each particular sector and, to some extent, even among sectors, once one discounts the effect of the former condition. This associa- tion can also be made extensive to the intensity of employment in various individual sectors once these two conditions are taken into consideration. Again, and in order to avoid falling into circular ar- gumentation and tautological conclusions, what is being stated is that there exists an empirically verifiable loose relationship among size, gross volume of receipts and employment, for each individual sector, and to a degree, even across sectoral lines, despite differ- ences in relative factor intensities in their respective productive functions; the use of alternative technologies, and degree of efficien- cy of firms in different sectors.
With the preceding in mind, we will now endeavor to provide some additional data that will serve to complement our efforts at describing the Hispanic producers market.
Out of the total 8,248 Hispanic owned firms in 1977, of which only 1,463 have employees, the largest number and the fastest rate of growth was in selected services. There were in that sector 1,380 firms in 1972 in comparison to 3,195 in 1977. Nonetheless, the in- dustry's gross receipts were in the fourth place in a descending or- der of ranking for the various sectors. This was due to the fact that the firms involved exhibited the third lowest gross receipts per unit among all of the classified activities.
Wholesale trade, with a much smaller number of firms, 165 in 1972 and 369 in 1977, displayed a rate of growth very nearly the same as that of selected services. Although gross receipts per unit did increase very little for this time interval (from $327,642 to $332,124), the firms ranked second among sectors for this index. As far as the percentage of total receipts by industry is concerned, wholesale trade was in third place.
Retail trade showed respectable growth in the number of busi- ness establishments (from 1,276 in 1972 to 1,727 in 1977), although the figures are not as impressive, especially in relative terms, as those

for the two prior cases. Receipts &r unit ran a poor third, after the much higher levels for wholesale trade and manufacturing. They came only to approximately $86,000 in 1972 Despite the fact that growth in this last measure was not inconsiderable, gross receipts per unit were about $70,700 in 1972, the industry lost ground as far as percentage of total receipts by sector goes. It experienced a decrease from 24.8% in 1972 to 21.5% in 1977. Nonetheless, it re- tained the second place in the ordinal classification of sectors, fob lowing manufacturing, as had been the case in 1972. It should be noticed in passing, as we will briefly twice reiterate below, that the implications for the nature and structure of the Hispanic producers market of these two sectors retaining their same ranking, while the magnitude of the total receipts by industry represented by them in percentage terms decreased, should be made the object of careful future research. In effect, after the explosive percentage growth of
-- - --- - -- .-
manufacturing from a mere 8.18% of the market to a 36.79% be- tween 1969 and 1972, it contracted to 2744%. In the case of retail trade, there has been a steady downward trend in operation, which took the sector from a 41.93% participation rate in 1969, to a 24.84% share in 1972 and, finally, to a 21.59% portion in 1977.
Manufacturing is, in several respects, the most interesting sector in Hispanic business. We have already made some reference above to the phenomenal growth in gross receipts it exhibited about a decade ago. In regards to the number of firms, there was a notice- able increase from 166 in 1969 to 267 in 1972, which was followed by a much more modest growth to a total of 295 in 1977. Gross receipts per unit of $59,633, which ranked third among other sec- tors, jumped to $500,520 and first place in 1972, and still at the top of the scale, reached $639,817 in 1977. The gross receipts of the industry were, relative to the rest of the market, extremely high. They went from a scant $9.89 m. in 1969 to $133.63 m. in 1972 and, from there, to $188.74 m. in 1972
The Finance, Insurance and Real Estate sector, experienced a per- centage decrease in its market participation from 4.53% in 1969 to a 2.45% in 1972. By 1977 it had recouped its losses and was back to a 4.91% share of the Hispanic producers market. It is worth not- ing that in order for this to happen, the gross receipts of the in- dustry had to jump from a figure of $8.90 m. in 1972 to $34 m. in 1977. This expansion took place through both, a rapid growth in the number of firms, which went from 267 in 1972 to 505 in 1977, and a near doubling of gross receipts per firm, which expanded from $33,348 at the beginning of the period to $63,338 at the end

of same. In the case of transportation and public utilities we observe a
very large relative decrease in the sector as measured in terms of percentage of total receipts by industry. In effect, participation in the market drops from 16.38% in 1969 to 3.43% in 1972, and par- tially recovers to 8.60% in 1977, about half its strength in the ini- tial year. It should be noticed that the relative weakening of these activities were accompanied by a proliferation in the number of firms. These multiplied from 230 in 1969 to 509 in 1972 and to 709 in 1977. This meant, of course, a drastic reduction in gross receipts per unit between the first two dates. The corresponding figures were $86,147 and $24,493. Even at the close of the period receipts per firm were slightly below their initial figure in 1969. They a- mounted in 1977 to $83,434, close to $3,000 less than the original level.
Finally, construction activities do not show any large variations in market percentage of total receipts by industry. They were '%43%, 8.07% and 6.31% in 1969, 1972 and 1977, respectively. Total num- ber of firms evidences large increases for the same dates. From 356 at the initial point, it went to 675 and then to 1,023. The absolute increase in receipts was such that despite the small percentage in- crease in market participation, and the large growth in total num- ber of firms between 1969 and 1972, still gross receipts per unit expanded from $25,256 to $43,443. At the close of the period, the increase in gross receipts by the industry was not sufficient to com- pensate for the growth in the number of firms and gross receipts per unit suffered a slight decline to $42,222.
Obviously, the growth in final sales by Hispanic owned enter- prises between 1969 and 1977 has made possible the overall large increase in number of firms. It has also allowed for the rapid growth both in gross receipts per unit and by industry for most sectors, accompanied by simultaneous changes in the relative ranking of the various activities. Large absolute advances in sales per firm, and also for industries as a whole, did not ensure, however, the preservation of the relative position of the sectors involved. Ultimately, the rela- tive disposition of sectors depended on the initial volume of the industries' gross receipts at a given selected date and their subse- quent rate of growth. The examination of the data reveals stunning changes over time in gross receipts by most industries. Patterns gov- erning the behavior of industries as far as growth over time in number of firms and their gross receipts are, also, quite variable.
The role of differing factor intensities, production functions and

technologies, among industries and firms, along with varying de- grees of efficiency arising from these factors, general market condi- tions and international organizational and administrative considera- tions, await a detailed and in-depth study of the Hispanic producers market.
In any case, as we shall emphasize towards the end of the paper, an examination of those variables is imperative in order to assess the future of Hispanic owned firms. There is no question that both the external and internal conditions affecting the competitive condi- tions of firms must be subjected to close examination. The former are related to market conditions, their past trends and probable course of future development. Macro forces, both domestic and in- ternational, will largely determine the outcome in this case. As for the internal aspect of the firms' competitiveness, the variables men- tioned in &e previous paragraph (relative factor intensities; produc- - -- -- .- - - . . - - - - tion functions; technologies, and organizational and administrative factors) must be critically analyzed and comparatively tested in non- Hispanic firms, in order to ascertain the relative position of His- panic establishments and any discernible trends that may be present.
111. Volume of Employment in the Hispanic Producers Market
Regarding the direct employment capability of the Spanish owned firms, it will be presently seen that it is quite limited. In fact, the authors had suspected as much and had strongly suggested, on a number of occasions, the likelihood of the situation about to be described. In a very recent publication of ours the case was argued in considerable detail.21
Volume of employment in the Spanish producers market, a defi- nition of the market that we have coined for the purpose of high- lighting its differences with the Spanish consumers market, is great- ly restricted because of the small size of firms compared to the average size for the entire market; their relatively small number and, also, the already noted fact that the overwhelming majority of firms have no employees.
Let us proceed to examine the available estimates. If we were to take the figure of 8.1, which is the simple arithmetic average of the number of employees in the various activities listed in the stan- dard classification of sectors, as representative of the employment intensity of Hispanic firms for 1977, we would end up with a total level of employment of about 67,000 (8.1 employees X 8,248 firms).22 it should be noticed that this amounts to about 12% of the total of 532,481 Dade County employees reported in the 1977 CBI?23

Another way of calculating employment in the Spanish producing market would start by recognizing that "Fully 45.85% of all Hispanic- owned firm employment was in manufacturing during 1977. Manu- facturing accounted for only 16.99% of Dade's total employment-in firms with employees-during that year. The average number of workers in all Dade County manufacturing establishments was 30 while the average Hispanic-owned manufacturer employed 33. Nev- ertheless these Hispanic-owned firms accounted for only 16% (sic) of Dade County manufacturing employment in 197Z1'24 Given that there were in Dade 295 Hispanic manufacturing firms in 1977, mul- tiplying the arithmetic average for employment in the sector by them would yield a total of 9,735. The grand total for employment by Hispanic producers would then come to slightly more than 21,100. - - - - - --- -
Finally, the estimate of the ~ e s e a r c h Division of Metropolitan Dade County Planning Department is the lowest of all. It yields an employment figure of 13,759 (sic) workers for Hispanic firms. This results from the small number of firms with employees in the His- panic producers market, only 1,463, and the low average number of employees per firm, except in manufacturing activities. Also, it is to be noticed that the Hispanic-owned Arms percentage of total em- ployment is, as was to be expected, very low for all sectors. Again, with the exception of manufacturing, not any minority sector par- ticipated with more than 2.5% of the tota1.25
We will now add some brief comments on the evolution of em- ployment in some of the productive sectors of the Hispanic market. In the case of manufacturing, it should be noticed that the number of employees per firm increased rapidly for the period 1969 to 1972 but remained practically static for the subsequent interval, 1972 to 1977. Given the previously mentioned small expansion in the num- ber of firms for the latter period, total gain in employment was only slight. In passing, let us observe that despite a changeless situa- tion in employment per firm, the figure for gross receipts per estab- lishment expanded considerably. Also, the gross receipts of the in- dustry grew much more rapidly in relative terms than the number of firms in it. That is, output and sales per firm grew without a corresponding increase in the average number of employees per firm. As a result, there was a gain in labor productivity, which could have been due, presumably, to an advance in capitalization, i.e., in the capitalllabor ratio, or else, to technical progress. Regbrdless of whether this development hailed from a more intensive capitaliza- tion process or else, from technical progress in production or organ-

ization, or from the utilization of idle capacity under more favorable market conditions, it is worthy of attention and of future investiga- tion to identify its origin.
As already remarked, in the construction sector there has been a large and sustained increase in the number of firms. On the other hand, employees per firm, which showed a sizable advance between 1969 and 1972, diminished considerably for the subsequent period. As a result, there has been a net decrease in total employment for the interval 1972 to 1977.
In the wholesale and retail trade sectors, as remarked in the fore- going, there has been a very noticeable increase in the number of firms. For the former sector, the expansion took place between 1972 and 1977, there having been practically no change registered in the preceeding 1969 to 1972 interval. For the latter, the growth was a steady one, maintaining a good pace from 1969 to 1977 Also, aver- age monetary productivity per worker in the wholesale sector, mea- sured as average sales per employee, are high when compared to its equivalent in manufacturing. One cannot dismiss the possibility, which should be made the object of further research, that despite modest gains in that respect in manufacturing from 1972 to 1977, the sector may not be capital intensive enough orland as technically and organizationally efficient as is the norm for non-Hispanic firms in the market.
Finally, notice that as mentioned before, in no sector do the His- panic owned businesses make a sizable or even modest contribution to the total of employment generated by all firms in the market. With the noticed exception of manufacturing, only one sector con- tributes more than 2% but less than 396, namely, construction with 2.5% in 1977. As for the average employment for all sectors as a percentage of total employment provided by Hispanic owned firms, it reaches a meager 2.23% in the same year. These figures are high- ly revealing by themselves.2"
Preliminary Conclusions
In closing, let us add some brief comments which will serve to indicate the present relative position of the Hispanic market and the nature of prospective developments that should be the object of our observation and future investigation.
It seems to us that the preceding information and reasoning has served to confirm a conclusion of the authors' which they had al- ready stated in a recent publication.
Although available data for certain years show that the number of Hispanic owned firms in the Miami S.M.S.A.

has increased faster than the number of non-hispanic firms, the participation of Latin enterprises in the mar- ket, measured as a percentage of the value of total out- put (or value of final sales) and employment, certainly is not proportiona1 to the percentage participation of Hispan- ics in the total population, labor force or personal income of residents. It can also be said that the percentage of gross receipts of sales generated by these firms out of the total for the area, is below the percentage of His- panic firms as a fraction of the total.27
In effect, even the most generous calculations would confirm that the value of the gross volume of final sales or total output con- tributed by Hispanic firms in 1977, would not represent 10% of the total for these concepts participation rates measured on a market wide basis.28 Hispanic producers markets can be gathered from a
perusal of Tables X and XI1 of Statistical Summary of Minority-Owned Business Characteristics. Again, with the exception of construction and manufacturing, which accounted in 1977 for 5.08% and 5.48% re- spectively of the total of firms in their sectors, all others were below a 5% participation figure. In some sectors, ownership of total firms by Hispanics ranged as low as 1.14% and 1.82%. In regards to the share of Hispanic owned firms of the total payroll in the various sectors, manufacturing registered the highest value with a 4.74% in 197% Six sectors were under 2% and two below 1%.
There is no question that to the extent that the Hispanic market produces and sells differentiated products for which there is not a perfect elasticity of substitution in the general market, it is going to enjoy a degree of autonomy or power best defined by the charac- teristics of the market structure known as monopolistic or imper- fect competition. However, as the authors have often remarked, this kind of advantage tends to decrease over time. Partial acculturation and economic integration very strongly work towards the unifica- tion of the market, particularly as regards consumers goods in gen- eral. In the case of the Cuban population in particular, and the Hispanic in general, the marked influence of American patterns of consumption preceded their immigration into the United States.
It should be emphasized anew that Cubans and Hispanics, al- though greatly contributing to the creation of the new socio-eco- nomic production function which increasingly characterizes South Florida, must continuously endeavor to promote their participation in the socio-economic system in accordance with society's established and sanctioned norms and its accepted success criteria. Were they

not to do it, their indirect contribution to the welfare of the society would go largely unrewarded. The real external economies gener- ated by their presence, somewhat in the nature of a social produc- ers surplus are, of course, allocated according to the existing pat- terns of stratification. To the extent that Cubans and Hispanics do not succeed in accelerating their upward mobility in society, they will share into the increased welfare at a rate inferior to the aver- age for white natives. That is, rewards for direct participation (through functional distribution) and indirect contributions, go hand in hand. They are linked into the same productivity function for each factor.
Closely linked to the above and also fundamental in its own right, is the question of human capital development. Given the downward occupational mobility of a large sector of Cuban exiles and its over- - - - -
all imp%cations for the potential of the group, as well as for the area as a whole, this matter has become of paramount importance to the future welfare of Cubans and non-Cubans alike in Miami.
Entrepreneurial and managerial abilities and skills constitute an impor- tant sub-category within the wider classification of human capital. No doubt, more than audacity and agressiveness are going to be needed to be successful in the long pull. Education and training will be decisive factors in facilitating the entry and retention of Cubans in the middle and upper managerial and entrepreneurial ranks. As Cubans seek to compete in an increasingly sophisticated environ- ment, they will need all of the technical expertise they can acquire.
Our studies have shown that the Cubans in Dade County make an exceptional group in many respects. There are both strengths and weaknesses in the picture. We have seen how Cuban income and formal education levels are well above the average for Hispanic groups and blacks. On the other hand, an age level considerably above the median for those other ethnic groups, represents a seri- ous handicap in the long run.
We can speak of opportunities and dangers; of unexploited fron- tiers and of latest disadvantages. Unless Cubans come to firmly real- ize and vigorously grasp the truth that formal educational attain- ments and vocational training are highly correlated to income levels, they will gradually slip in relative terms from their present position. Likewise, unless Cubans succeed in gaining access to capital finan- cing on a scale and terms competitive with the white native popula- tion, their hold on productive wealth will weaken rather than be- come more solid.29
SPANISH OWNED FIRMS TABLE 1
Spanish Owned Firms Number of Firms
Construction Manufacturing Transportation
Public Utilities Wholesale Trade Retail Trade Finance, Insurance, Real Estate Selected Services Other Industries Not Classified
Source: U.S. Bureau of the Census, 1972 and 1977, Surveys of Minority- Owned Business Enterprises, Minority-Owned Business-Spanish Origin, MB-72-2 and MB-77-2.

SPANISH OWNED FIRMS TABLE 2
Spanish Owned Firms Gross Receipts Per Unit
Construction Manufacturing Transportation
Public Utilities Wholesale Trade Retail Trade Finance, Insurance, Real Estate Selected Services Other Industries Not Classified
Source: U.S. Bureau of the Census, 1972 and 1977, Surveys of Minority- Owned Business Enterprises, Minority-Owned Business-Spanish Origin, MB-72-2 and MB-77-2.

SPANISH OWNED FIRMS
Spanish Owned Firms Gross Receipts by Industry
($~poo)
Construction Manufacturing Transportation
Public Utilities Wholesale Trade Retail Trade Finance, Insurance, Real Estate Selected Services Other Industries Not Classified
Source: U.S. Bureau of the Census, 1972 and 1977, Surveys of Minority- Owned Business Enterprises, Minority-Owned Business-Spanish Origin, MB-72-2 and MB-77-2.

Construction Manufacturing
Transportation Public Utilities
Wholesale Trade
SPANISH OWNED FIRMS TABLE 4
Spanish Owned Firms % of Total Receipts by Industry
Retail Trade 41.93 24.84
Finance, Insurance, Real Estate ' 4.53 2.45 Selected Services 8.89 8.51 Other Industries .68 .45 Not Classified 2.68 ' .57
100.00 100.00 -. Note: Percentages may not total to 100 due to rounding.
Source: U.S. Bureau of the Census, 1972 and 1977, Surveys of Minority- Owned Business Enterprises, Minority-Owned Business-Spanish Origin, MB-72-2 and MB-77-2.

SPANISH OWNED FIRMS TABLE 5
Spanish Owned Finns Average Employees Per Firm
For Those Firms With Paid Employees
Construction Manufacturing Transportation
Public Utilities Wholesale Trade Retail Trade Finance, Insurance, Real Estate Selected Services Other Industries Not Classified
AU Finns
Source: U.S. Bureau of the Census, 1972 and 1977, Surveys of Minority- Owned Business Enterprises, Minority-Owned Business-Spanish Origin, MB-72-2 and MB-77-2.

MINORITY OWNED BUSINESSES TABLE 2
Minority Businesses by Industry Miami, SMSA 1972 and 1969
1972 Black-Owned Firms Spanish-Owned F i s
Number Gross Receipts % Of Total Number Gross Receipts % Of Total Industry Group Of Firms ($1,000) Receipts Of Firms ' ($1,000) Receipts
I N
Construction 108 $5,152 6.86% 675 $29,324 8.07% N Manufacturing 20 5,9n 7.96 267 133,639 36.79 I Transportation,
Public Utilities 123 2,286 3.05 509 12,467 3.43 Wholesale Trade 27 5,235 6.98 165 54,061 14.88 Retail Trade 474 41,810 55.n 1,276 90,217 24.84 Finance, Insurance,
Real Estate 43 2,385 3.18 267 8,904 2.45 Selected Services 556 9,921 13.22 1,380 30,912 8.51 Other Industries 128 1,488 1.98 107 1,647 .45
Not Classified 51 800 1.07 201 2,057 .57
Total 1,530 75,048 100.00 4,847 363,228 100.00

I 1969 Black-Owned Firms Spanish-Owned Firms
Number Gross Receipts % Of Total Number Gross Receipts % Of Total Industry Group Of Firms ($1,000) - Receipts Of Firms ($1,000) ̂ Receipts
Construction Manufacturing Transportation,
Public Utilities Wholesale Trade
1- Retail Trade *
Fiance, Insurance, Real Estate
Selected Services Other Industries Not Classified
Total 1,166. 28,696 100.00 3,447 120,965 100.00
Note: Percentages may not total to 100 due to rounding.
Source: U.S. Bureau of the Census, 1972 Suroey of Minority-Owned Business Enfwprises, M i n o r i t y - O m d Businesses-Black, MB 72-2 and Minority-Owned Businesses-Spanish Origin, MB 72-2.
MINORITY OWNED BUSINESSES TABLE 3
Employment Distribution by Industry Groups
Black-Owned Spanish-Owned All Firms All F i s Firms All Firms F i 1970 1970 1972 1970 1972
Industry Group Total Employment Black Employment Total Employment Spanish Employment Total Employment Total 100.00% ~OO.OO?? 100.000h 100.00% 100.000h
I Construction 9.06 14.30 9.99 6.14 12.47 N n Manufacturing 19.25 11.01 11.06 35.39 37.19 I Transportation,
Public Utilities 14.05 15.08 5 . n 7.49 4.67 Wholesale Trade 6.81 5.98 2.77 6.47 3.54
Retail Trade 23.78 20.40 33.49 20.01 19.55 F i c e , Insurance
and Real Estate 6.07 3.86 4.18 5.24 3.42 Selected Services 20.99 29.37 32.80 19.25 19.16
Sources: U.S. Bureau of the Census, 19 70 Census of Populafion, General Social and Economic Charactwistics, Florida, PC (I)-C11 ma. U.S. Bureau of the Census, 1972 Suruey of Minority-Owned Business Enterprises, Minority-Owned Businessps-Bhk, MB 72-1, and Minority-Owned Businesses-Spanish Origin, ME3 72-2.
Note: Percentage may not total to 100 due ,to rounding.

MINORITY OWNED BUSINESSES TABLE 6
Distribution of Gross Receipts in Minority Business by Industry Group: Miami, Florida, The Nation
Miami Florida Nation
Black Total
Construction Manufacturing Transportation,
Public Utilities Wholesale Trade Retail Trade F i c e , Insurance &
Real Estate Selected Services Other Industries Not Classified

Spanish Total 100.00% 100.00% 100.00% 100.00% 100.00% 100.00% Construction 7.43 8.07 7.49 8.43 8.92 12.72 Manuf actunng 8.18 36.79 7.82 30.58 6.31 9.04 Transportahon, Public utilihes 16.38 3.43 12.12 3.49 3.41 3.25 Wholesale Trade 9.29 14.88 10.06 15.25 8.17 9.86 Retail Trade 41.93 24.84 43.47 28.59 50.27 45.61 Finance, Insurance &
Real Estate 4.53 2.45 4.47 2.58 3.27 3.39 Selected Services 8.89 8.51 10.37 9.64 15.10 12.39 Other Industries 0.68 0.45 1.14 0.68 1.68 1.80 Not Classified -- 2.68 0.57 3.07 0.75 2.88 1.93
Source: U.S Bureau of the Census, 1972 Sumq of Minority-Owned Business Enterprises, Minority-Owned Businesses-Black, MB 72-1, and Mlnorify-Owned Bwinesss-Spanish Origin, MB 72-2.
Note: Percentages may not total to 100 due to rounding.
STATISTICAL SUMMARY OF MINORITY OWNED BUSINESS CHARACTERISTICS
TABLE I Major Distinguishing Characteristics of Minority-Owned Businesses in Dade County
Compared with Total County Businesses 1977 (All Figures Rounded)
Total Other Characteristics of the Dade Black- Hispanic- Minority- Average Minority-Owned County Owned Owned Owned
I Business in Dade County Measure* Businesses Businesses Businesses Businesses
N '4
Minority-owned businesses Number of minority-owned 132,391 2,148 8,248 296 I represent a relatively small business firms
segment of the total Dade compared to total County business community Dade County business
establishments
Largely owner operated Percent of firms 73 82 82 78 without employees
Small in size as measured Average employment 14 4 8 4 by employment per firm per firm
With below average pay Average payroll per $ 10,250 $ 6,598 $ 8,063 $ 5,007 scales employee
Resulting in a low level of Average payroll $143,429 $ 27,416 $ 65,569 $ 21,800 payroll generation per firm
TotaI Minority- Owned
Businesses
10,692

Highly concentrated in Percent of firms in 56 72 63 77 65 Retailing and Services Retailing and Services
With below average receipts Average receipts per $422,374 $186,420 $175,462 $172,320 $177,753 per firm f rm in Retailing
and Services
But with relatively htgher Average receipts per $ 37,845 $ 52,550 $ 45,721 $ 32,149 $ 46,902 receipts per employee.. . employee in Retailing
Services
And per dollar of payroll Dollar of receipts $5.48 $8.63 $7.03 $6.43 $7.32 per dollar of payroll in Retading and Services.
*All measures for firms with employees except total number of firms or establishments (countywide census data is on an N m establishment basis) I Source: U.S. Department of Commerce, Bureau of the Census, 1977 Suwey qf Minority-Owned Business Enferprisps: M B 77-1
Minority-Owned Businws-Blacks, (Washington D.C.: U.S. Government Printing Office, December, 1979); MB 77-2 Minorify-Oumed Businesses--Spanish On'gin, (Washington D.C. : U.S. Government Printing Office, August 1980): MB 77-3 Minority-Owned Businesses-Asian Amwican, American Indian, and Other (Washington D.C.: U.S. Government Printing Office, November 1980).
-. County Business Patterns 19 77, Employment and Payrolls, Number and Employment Size of Establishments by Detailed Industry, Florida. CBP-77-11 (Washington D.C.: U.S. Government Printing Office, July 1979).
. 1977 Census of Mail Trade, Geographic Area Series, Flmima, RC77-A-10 (Washington D.C.: U.S. Government Printing Office, September 1979).
. 1977 Census of Swvice Indusfries, Geographic Area Series, Florida, SC-77-A-10 (Washington D.C.: U.S. Government Printing Office, January 1980).
Computations by Metropolitan Dade County Planning Department.

STATISTICAL SUMMARY OF MINORITY-OWNED BUSINESS CHARACTERISTICS TABLE n
Comparison of County Business Patterns Data For AU Businesses With Minority-Owned Business Survey Data For All Minority-Owned Firms
Number of Establishments and Firms With Employees, Dade County, Florida 1977
Percentage Distribution
Total Minority- Total Minority- Minority- Dade County Owned Dade County Owned Owned Firms
INDUSTRY Establishments Firms Establishmenis Firms As a % of Total Construction 2,675 163 7.03 8.54 6.09 Manufacturing 2,994 181 7.87 9.49 6.04 Transportation & 1,314 69 3.45 3.62 5.25
Public Utilities Wholesale Trade 4,137 130 10.87 6.81 3.14 Retail Trade 9,308 583 24.46 30.56 6.26 Finance, Insurance & 4,472 67 11.75 3.51 1.50
Real Estate Selected Services 11,890 659 31.25 34.54 5.54 Other Industries 1,262 56 3.32 2.93 4.44 Totals 38,052 1,908 100.00 100.00 5.01
Source: U.S. Department of Commerce, Bureau of the Census, 1977 Suvuey of Minwity-Owned Business Enterprises: M B 77-1 Minority-Owned Businesses-Black, (Washington D.C.: U.S. Government Printing Office, December 1979); M B 77-2 Minority-Owned Bwinesses-Spanish Origin, (Washington, D.C.: U.S. Government Printing Office, August 1980); M B 77-3 Minority-Owned Businesses-Asian American, American Indian, and Other (Washington D.C.: U.S. Government Printing Office, November 1980).
-. County Businesses Patterns 1988, Employment and Payrolls, Number and Employment Sizeof Establishments By Detailedlndustry, Flonda, CBP-77-11 (Washington D.C.: U.S. Government Printing Office, July 1979).
Computations by Metropolitan Dade County Planning Department.

STATISTICAL S U W Y OF MINORITY-OWNED1 BUSINESS CHARACTERISTICS TABLE X
Comparison of County Business Patterns Data For All Businesses With Minority-Owned Business S w e y Data For All Hispanic-Owned Firms
Number of Establishments and F i i With Employees, Dade C o w Florida 1977
Percentage nstribution
Total Hispanic- Total Hispanic- Hispanic- Dade County Owned Dade County Owned Owned Firms
INDUSTRY Establishments F i s Establishments Firms As a % of Total Construction 2,675 136 7.03 9.30 5.08 Manufacturing 2,994 164 7.87 11.21 5.48 Transportation & 1,314 55 3.45 3.76 4.19
I t,
Public Utilities o Wholesale Trade 4,137 116 10.87 7.93 2.80
1 Retail Trade 9,308 410 24.46 28.02 4.40 Finance, Insurance & 4,472 51 11.75 3.49 1.14
Real Estate Selected Services 11,890 508 31.25 34.72 4.27 Other Industries 1,262 23 3.32 1.57 1.82 Totals 38,052 1,463 100.00 100.00 3.84
Source: U.S. Department of Commerce, Bureau of the Census, 1977 Survey of Minority-Owned Business Enterpri'ses: M B 77-1 Minority-Owned Businesses-Black, (Washington D.C.: U.S. Government Printing Office, December 1979); M B 77-2 Minori ty-Owd Bus~neues-Spanlsh Origin, (Washington, D.C.: U.S. Government Printing Office, August 1980); M B 77-3 Minority-Owned Businesses-Asian American, A-can Indian, and Other (Washington D.C.: U.S. Government Printing Office, November 1980). . County Businesses Patterns 1988, Employment arrd Payrolls, Number and Employment Size of Establishments By Detailed Industry, Florida, CBP-77-17 (Washington D.C.: U.S. Government Printing Office, July 1979).
Computations by Metropolitan Dade County Planning Department.

STATISTICAL SUMMARY OF MINORITY-OWNED BUSINESS CHARACTERISTICS TABLE XI
Comparison of County Business Patterns Data For All Businesses With Minority-Owned Business Survey Data For Hispanic-Owned Firms
Number of Employees in Establishments and Fims With ~ m ~ l o y e b , Dade County 1977
INDUSTRY
Percentage Distribution of Employees In Employees In Hispanic-
Total Employees In Total Dade Hispanic- Owned Firms Dade County Hispanic- County Owned % of Total
Establishments Owned Firms Establishments Firms Emvlovrnent Construction 26,614 685 5.00 5.76 2.57 Manufacturing 90,448 5,455 16.99 45.85 6.03 Transportation & 56,690 902 10.65 7.58 1.59
Public Utilities Wholesale Trade 43,466 738 8.16 6.20 1.70 Retail Trade n 0 , m 1,670 20.69 14.04 1.52 Finance, Insurance & 50,174 573 9.42 4.82 1.14
Real Estate Selected Services 150,849 1,853 28.33 15.58 1.23 Other Industries 4,069 21 .76 0.18 0.52 Totals 532,481 11,897 100.00 100.00 2.23
Source: U.S. Department of Commerce, Bureau of the Census, 1977 Survey of Minority-Owned Business Enterprises: M B 77-1 Minority-Owned Businesses-Black, (Washington D.C.: U.S. Government Printing Office, December 1979); M B 77-2 M~nority-Owned Businesses-Spanish Origin, (Washington, D.C.: U.S. Government Printing Office, August 1980); M B 77-3 Minority-Owned Businesses-Asian American, American Indian, and Othw (Washington D.C.: U.S. Government Printing Office, November 1980). . County Businesses Patterns 1988, Employment and Payrolls, Number and Employment Sizr of Establishments By Detailed Industry, Florida, CBP-77-11 (Washington D.C.: U.S. Government Printing Office, July 1979).
Computations by Metropolitan Dade County Planning Department.

STATISTICAL SUMMARY OF MINORITY-OWNED BUSINESS CKARACTERISnCS TABLE MI
Comparison of County Business Patterns Data For All Businesses With Minority-Owned Business Survey Data For Hispanic-Owned F i s
Value of Payrolls in Establishments and Firms With Employees, Dade County 1977
Value Of Percentage Distribution Payrolls In Value of of Payrolls In
Total Pavrolls In Hispanic- Dade County Hispanic- Total Dade Hispanic- owned Firms
Establishments Owned Firms County Owned Asa %of INDUSTRY - (ooo'ss) (ooo'ss) Establishments Firms Total Construction $ 330,021 $ 6,156 6.05 6.42 1.87 Manufacturing 861,328 40,787 15.78 42.52 4.74 Transportation & 956,513 11,059 17.53 11.53 1.16
Public Utilities Wholesale Trade 558,594 9,218 10.23 9.61 1.65 Retail Trade 795,156 10,257 14.57 10.69 1.29 Finance, Insurance & 541,539 5,577 9.92 5.81 1.03
Real Estate Selected Services 1,373,781 12,657 25.17 13.19 0.92 Other Industries 40,840 217 .75 0.23 0.53 Totals $5,457,772 $95,928 100.00 100.00 1.76
Source: U.S. Department of Commerce, Bureau of the Census, 1977 Survey of Minority-Owned Business Enterprises: M B 77-1 M~norify-Owned Businesses-Bbrk, (Washington I3.C.: U.S. Government Printing Office, December 1979); M B 77-2 M~nority-Owned Businesses-Spanish O n g n , (Washington, D.C.: U.S. Government Printing Office, August 1980); M B 77-3 Minority-Owned Businesses-Asian Ammcan, American Indian, and Other (Washington D.C.: U.S. Government Printing Office, November 1980). . County Businesses Patterns 1988, Employment and Payrolls, Number and Employment Sizr ofEs/abllshments By Detalled Industy, Ronda, CBP-77-11 (Washington D.C.: U.S. Government Printing Office, July 1979).
Computations by Metropolitan Dade County Planning Department.

STATISTICAL SUMMARY OF MINORITY-OWNED BUSINESS CHARACTERISTICS TABLE XIII
Dade County Retail and Selected Swvices Data Comparing Hispanic-Owned Firms With All Dade County Retail and Services Establishments
1977
Total Dade County Estabhshments Hispanic-Owned Dade County F~rms Hrspana-Owned Percentage of Totals Selected Selected Selected
Items Re ta~lrng Serv~ces Totals Retarlrng Servrces Totals Retarlrng Semces Totals Number of Frrms 13,729 16,210 29,939 1,727 3,195 4 922 1258 1 9 n 16.44 or Establrshments
Frrms or Establrsh- 4,140 8,466 12,606 1,317 2,687 4,004 31 81 31 74 31.76 ments wrthout Employees
Frrms or Establrsh- 9,589 7,744 17,333 410 508 918 4 28 6 56 5 30 ments wlth employees
Percentage of Frrms 30.16 52 23 42 11 76 26 84 10 81 35 25285 16102 193.18 or Establrshments Wrthout Employees
Percentage of Frrms 69 84 47.77 5789 23 74 15 90 18 65 33 99 3328 32 22 or Establrshmerits Wrth Employees
Number of Employees 110,620 82,827 193,447 1,670 1,853 3,523 1 51 2 24 1 82
Average Employment 12 11 11 4 4 4 33 33 3636 3636 of Frrms or Estab- l~shments W ~ t h Employees
Annual Payroll' 680,077 655,833 1,335,910 10.257 12,657 22,914 151 1 9 3 1 72
Average Payroll Per 70,923 84,689 77,073 25,017 24,915 24,961 35 27 2942 32 39 Frrm or Establish- ment $
Average Payroll Per 6,148 7,918 6,906 6,142 6,831 6,504 99 90 8627 94.18 Employee $
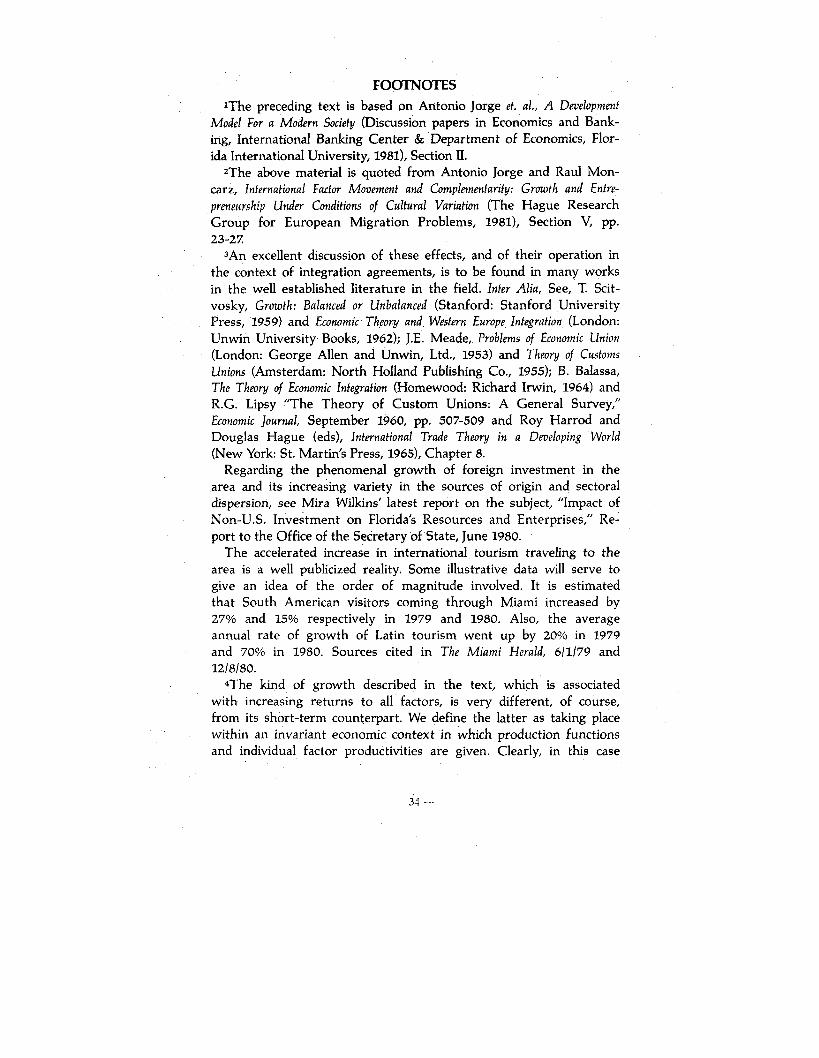
FOOTNOTES 'The preceding text is based on Antonio Jorge et. al., A Development
Model For a Modern Society (Discussion papers in Economics and Bank- ing, International Banking Center & Department of Economics, Flor- ida International University, 1981), Section 11.
the above material is quoted from Antonio Jorge and Raul Mon- carz, International Factor Movement and Complemenfarify: Growth and Enfre- preneurship Under Conditions of Cultural Variation (The Hague Research Group for European Migration Problems, 1981), Section V, pp. 23-27.
3An excellent discussion of these effects, and of their operation in the context of integration agreements, is to be found in many works in the well established literature in the field. Infer Alia, See, T Scit- vosky, Growth: Balanced or Unbalanced (Stanford: Stanford University Press, 1959) and Economic Theory and Western Europe Integration (London: Unwin University Books, 1962); J.E. Meade, Problems of Economic Union (London: George Allen and Unwin, Ltd., 1953) and Theory of Customs Unions (Amsterdam: North Holland Publishing Co., 1955); B. Balassa, The Theory of Economic Integration (Homewood: Richard Irwin, 1964) and R.G. Lipsy "The Theory of Custom Unions: A General Survey," Economic ]ournal, September 1960, pp. 507-509 and Roy Harrod and Douglas Hague (eds), Infwnafional Trade Theory in a Dmeloping World (New York: St. Martin's Press, 1965), Chapter 8.
Regarding the phenomenal growth of foreign investment in the area and its increasing variety in the sources of origin and sectoral dispersion, see Mira Wilkins' latest report on the subject, "Impact of Non-U.S. Investment on Florida's Resources and Enterprises," Re- port to the Office of the Secretary of State, June 1980.
The accelerated increase in international tourism traveling to the area is a well publicized reality. Some illustrative data will serve to give an idea of the order of magnitude involved. It is estimated that South American visitors coming through Miami increased by 27% and 15% respectively in 1979 and 1980. Also, the average annual rate of growth of Latin tourism went up by 20% in 1979 and 70% in 1980. Sources cited in The Miami Herald, 6/1/79 and 12/8/80.
T h e kind of growth described in the text, which is associated with increasing returns to all factors, is very different, of course, from its short-term counterpart. We define the latter as taking place within an invariant economic context in which production functions and individual factor productivities are given. Clearly, in this case
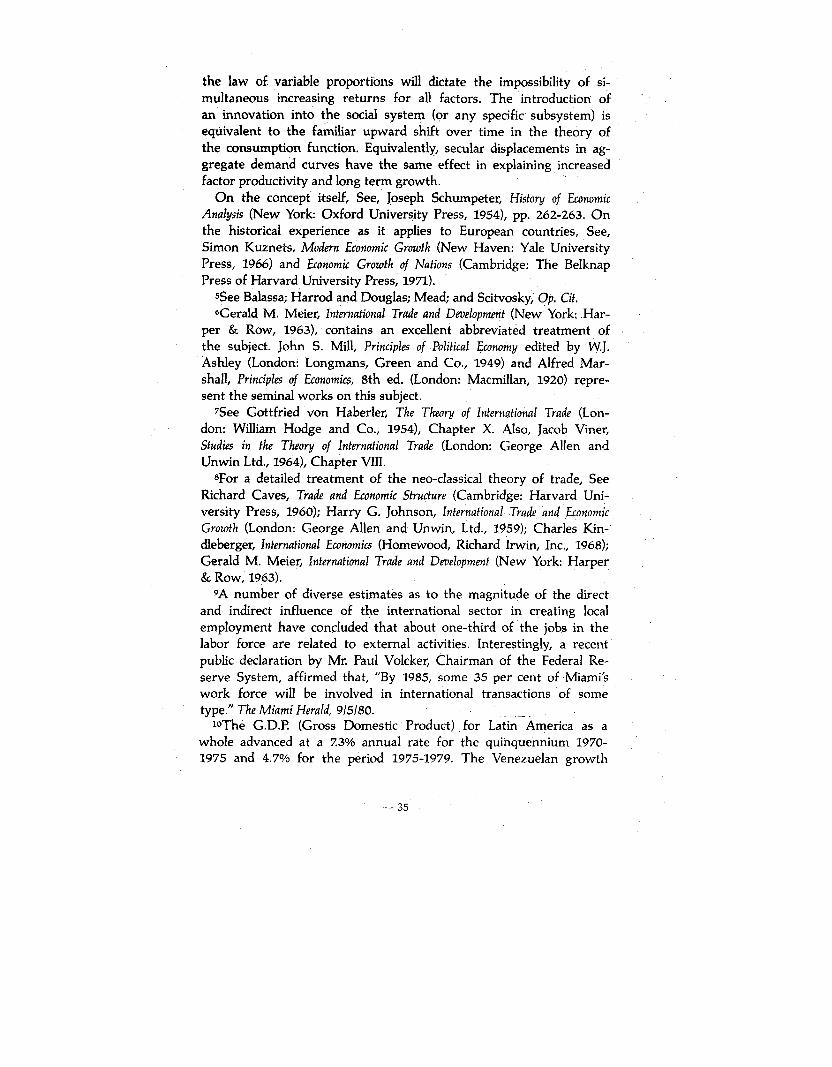
the law of variable proportions will dictate the impossibility of si- multaneous increasing returns for all factors. The introduction of an innovation into the social system (or any specific subsystem) is equivalent to the familiar upward shift over time in the theory of the consumption function. Equivalently, secular displacements in ag- gregate demand curves have the same effect in explaining increased factor productivity and long term growth.
On the concept itself, See, Joseph Schumpeter, History of Economic Analysis (New York: Oxford University Press, 1954, pp. 262-263. On the historical experience as it applies to European countries, See, Simon Kuznets, Modem Economic Growfh (New Haven: Yale University Press, 1966) and Economic Growth of Nations (Cambridge: The Belknap Press of Harvard University Press, 1971).
S e e Balassa; Harrod and Douglas; Mead; and Scitvosky, Op. Cit. 6Gerald M. Meier, lnternafional Trade and Developmenf (New York: Har-
per & Row, 1963), contains an excellent abbreviated treatment of the subject. John S. Mill, Principles of Political Economy edited by W.J. Ashley (London: Longmans, Green and Co., 1949) and Alfred Mar- shall, Principles of Economics, 8th ed. (London: Macmillan, 1920) repre- sent the seminal works on this subject.
'See Gottfried von Haberler, The Theory of International Trade (Lon- don: William Hodge and Co., 1954), Chapter X. Also, Jacob Viner, Studies in fhe Theory of lnfernafional Trade (London: George Allen and Unwin Ltd., 1964), Chapter VIII.
8For a detailed treatment of the neo-classical theory of trade, See Richard Caves, Trade and Economic Structure (Cambridge: Harvard Uni- versity Press, 1960); Harry G. Johnson, International Trade and Economic Growth (London: George Allen and Unwin, Ltd., 1959); Charles Kin- dleberger, International Economics (Homewood, Richard Irwin, Inc., 1968); Gerald M. Meier, International Trade and Dmelopment (New York: Harper & Row, 1963).
9A number of diverse estimates as to the magnitude of the direct and indirect influence of the international sector in creating local employment have concluded that about one-third of the jobs in the labor force are related to external activities. Interestingly, a recent public declaration by Mr. Paul Volcker, Chairman of the Federal Re- serve System, affirmed that, "By 1985, some 35 per cent of Miami's work force will be involved in international transactions of some type." The Miami Herald, 9/5/80. -
loThe G.D.P. (Gross Domestic Product) for Latin America as a whole advanced at a Z3% annual rate for the quinquennium 1970- 1975 and 4.7% for the period 1975-1979. The Venezuelan growth

rate, the largest Latin importer through Customs District 52 (which includes Miami), although decreasing of late has been quite substan- tial for the decade of the seventies. See, Banco Interamericano de Desarrollo, Progreso Econornico y Social en America ht ina (1979), Washing- ton D.C., Ch. 1.
1lWe will not attempt to give the reader any references on this protean theme which has elicited for many years a flow of well known historical, cultural, political, psychological and socio-econahic contributions and interpretations. Our single exception, because of the nature and contrast offered by the two participants, will be to mention a panel debate at the 1963 meeting of the International Development Association,'Columbia University, New York, on April 5 of that year, between Felipe Pazos and Kalman Silvert, regarding the question of whether Hispanic feudal culture was deadly, or simply irrelevant, to economic development in Latin America. Cited in Charles Kindleberger, Economic Dmelopmenf (New York: McGraw- Hill Book Co., 1965), p. 18
l2Dade County Broadens Economic Base, 1975-1979. Report of the Re- search Division, Metropolitan Dade County Planning Department, 1980, p. 1.
13Stafisfical Summary of Minority-Owned Business Characteristics. Report of the Research Division, Metropolitan Dade County Planning Depart- ment, 1981, p. 2.
14lbid., p. 1. 15lbid, Tables 1 and X. 16Minority-Owned Businesses. Report of the Research Division, Met-
ropolitan Dade County Planning Department, 1975, pp. 1-3. l7lbid, Table 6. , lsSpanish Owned Firms. Report of the Research Division, Metropoli-
tan Dade County Planning Department, 1980, Table 4. Iglbid., Table 4 and Minority-Owned Businesses, Table 6. 20Spanish Owned Firms, Tables 3 and 4. 21Antonio Jorge and Raul Moncarz, international Factor Movement and
Complementarity: Growth and Entrepreneurship Under Conditions of Cultural Var- iation, Section VII, pp. 35-40.
22Spanish Owned Firms, Tables 1 and 5. 23Sfafistical Summary of Minority-Owned Business Characteristics, p. %
241bid., p. 2. Also, compare the 16% figure quoted above with the corresponding one cited in the same publication, Table XI. In Minor- ity Owned Businesses, Table 3, a 3219% estimate is given as the share of manufacturing in the total employment generated by Hispanic firms in 1972.

zslbid., p. 7 and Table XI. Observe divergence in employment fig- ures cited in pp. 2 and 7 and Table XI.
ZbIbid., Table XI. 27Antonio Jorge and Kaul Moncarz, International Factor Movement and
Complementarity: Growth and Entrepreneurship Under Conditions of Cultural Var- iations, n. 46.
z8Our calculations are based on absolute income data for 1977 from the 1980 Florida Sfafisfical Abstract; data on gross receipts by in- dustry of Hispanic firms, appearing on Table 3 of Spanish Owned Firms and, finally, on indirect estimates of the G.D.P. of residents in the S.M.S.A. of Miami, extracted from Dade County Facts. Report of the Research Division, Metropolitan Dade County Planning Department, 1979, p. 4. It should be noticed that our figures are in nominal rather than real money terms and that, therefore, for some pur- poses the corresponding adjustments would have to be made. Among them, to evaluate the real rates of growth of gross volumes of sales by industries with the parallel increase in number of firms in them for Latin markets.
29Antonio Jorge and Raul Moncarz, Cubans in South Florida: A Social Science Approach (New York: Metas, 1980), pp. 86-87.

CONCLUDING REMARKS The title of this discussion paper has been slightly altered from the original used in its presentation at the University of Texas at El Paso, in order incorporate some brief observations of an impression- istic nature on the future of the Hispanic market.
The evidence and reasoning reflected in the body of the paper, and, most especially the section on Preliminary Conclusions, would seem to suggest that several paths are open for the Hispanic mar- ket to take. Which one will actually materialize is something that can only be speculated about, albeit one would naturally reject those assumptions and akernatives considered as less probable.
In keeping with the distinction between a consumers and a pro- ducers Hispanic market, our perspective on their development would be subject to the evolution of the causal elements determining these markets' behavior. The growth of the former is, obviously, mainly a function of earned income accruing to the Hispanic sector of the population and of its demographic weight in the area. In turn, the value of earned income will fundamentally depend on the behavior of wage and salary rates for the various component elements of the population in question. To the extent that for the group as a whole, in contrast to particular individuals, level of formal education up to certain levels is a significant variable in explaining earned income, it is clear that access to quality educational institutions is an important factor in shaping the future of the Hispanic consu- mers market. - -. - - - - -
Natural increases in population, immigration to the area, number of household or family members participating in the labor force, and economic discrimination*, are also variables to be taken into consideration in any attempt at explaining the present extent of the consumer's market or at projecting its growth.
Hispanics as a segment of the local population will keep on in- creasing mainly as a result of the arrival of new immigrants. Natu- ral population growth most likely will not contribute to any further expansion of the Hispanic's share given the present and foreseeable size of the family unit among Cubans compared to non-Latins. An educated guess would venture to affirm that as the social stratifica- tion of Cuban arrivals has changed, and as new economically orient- ed Latin immigrants into the area decrease the Cuban population preponderance, the greater participation of Cubans and other Latins in the labor force relative to white natives will continue to develop.
Various indications that would point in the direction of an ascen- ding "drop-out" rate among Hispanic students would, if confirmed,

reinforce the above suggested conclusion.** An unwillingness to de- fer economic satisfaction, that is, a strong positive time preference fueled by sociological factors like the so-called "demonstration effect" and "keeping up with the Joneses", will produce as a result a great- er participation rate in the labor force. Possibly, it will also contrib- ute to a higher unemployment rate among Hispanics, especially whenever there is a slack in economic activity. This follows from the fact that unskilled teenagers engross the ranks of the unem- ployed in a larger proportion than their numbers in the total labor force.
Discrimination, as noted above in the text and as explained in the source of the first footnote and bibliography therein, is clearly a factor to be considered in the analysis of the earned income of Hispanics. To the extent that society is willing to pay for social dis- tance, or that there exists a propensity to confine Hispanics to less productive and remunerative sectors, enterprises and positions on non-economic grounds; or that a specific tendency is at operation which facilitates the undervaluation of the human resources of Cubans in general, and particularly of their human capital acquired outside the United States, the growth of the Hispanic consumers market will be considerably slower than would otherwise be the case.
It is practically impossible on scientific grounds to produce a high probability estimate of how all of these factors are going to quan- titatively affect the extent of the Hispanic market in terms of its income level and consumption capabilities. Even if one were to pos- tulate, which is reasonable in view of the slippage of the per capita income of Cubans relative to that of white native Americans, that the total aggregate earned income of Hispanics will not keep pace with their population share in the area, no immediate major changes are to be expected. A gap between a 45% to 50% population weight and a 40% to 45% aggregate income level, although considerable and worrisome, would not prove catastrophic over the medium term. However, it certainly would provide an ominous sign, portending the gradual decline and downward mobility over the long-run of the Hispanic stratum in the socio-economic pyramid.
As for the Hispanic producers market, it has been noted on nu- merous occasions that its future will depend on a host of factors which could perhaps, somewhat tautologically, be reduced to the phrase: Competitive Capacity. In effect, such specifics as, 1) building of optimal plant size, 2) adoption of an efficient production technol- ogy, 3) availability of capital, 4) familiarity with suitable managerial

practices and, 5) internalization of economically rational values and implementation of market efficient practices, are means or expedi- ents to the objective of establishing an acceptable competitive level in the general economic market.
There are no inherent reasons that would impede, or practical obstacles that would frustrate, a serious and determined attempt on the part of Hispanic entrepreneurs and businessmen to compete ef- fectively in most sectors and activities of the local econ0my.t None- etheless, the importance of the obstacles on the path of success should not be underestimated either. Operating in large, impersonal markets, is quite a different phenomenon from the experience of ethnic markets. It is only in the former that the full impact of the cultural differences between mainstream Anglo-Saxon culture and the Hispanic culture is felt. The shock of functioning under the values contained in the Parsonian Variables is even greater for the small and medium sized businessmen with no previous business ex- perience in Cuba. If, as is widely assumed to be the case, this group represents the great majority of present day Hispanic entrepreneurs in the area, their transformation to the ways of large business con- cerns is going to be more difficult. Even for many of the old and experienced Cuban entrepreneurs adaptation proved to be proble- matic. Many an entrepreneur with considerable sophistication and in contact with foreign markets has found it oftentimes much eas- ier to operate from a base in his native country than abroad. Fac- tors l i e age, language barrier, lack of capital and the role of the public sector, have further put the latter group of Cuban entrepre- neurs at a disadvantage in their adoptive country.tf In terms of the cultural context, it will be highly interesting to watch for the emergence of a native group of Cuban-American entrepreneurs and to observe their behavior in comparison with that of both groups of native Cuban businessmen.
It is a common observation of the manner financial institutions operate outside the industrialized countries that they tend to observe a more personal style in their business dealings with clients than their counterparts in the first world. Incidentally, this practice need not be interpreted In a negatively critical way on grounds of non- rationality or irrationality, inasmuch as it is perfectly possible to con- struct alternative models that would satisfy the condition of eco- nomic rationality under various socio-cultural milieus. Ths observa- tion, valid for developed countries as well, given that the procedures and general modus operandi of commercial banking is different, say, in Germany, England and the United States even in our own days, is,

a fortiori, more relevant for the increasingly Latin-oriented business world of Miami. Nonetheless, the fact of the matter is that during a transitional period in the transformation of the economic contex- ture of the area such as the present time happens to be, conflicting business styles may seriously affect the developmental capabilities of the Hispanic market. The black minority in the United States is, in a way much different from that of the Latins, a prime illustration of this question.
It seems fair to raise the possibility that as the integration and partial acculturation of Hispanics gradually proceed along its path, the more catholic tastes and behavior of the Hispanic consumer may be accompanied by a greater degree of universality in the prac- tices either of established immigrant entrepreneurs or of their busi- ness oriented descendants. There is no reason for barring a priori the feasibility of a learning process on the part of the foreign born entrepreneurs, leading to greater flexibility and responsiveness to the requirements of the general market. After all, those people evinced in the past considerable creativity and innovative capacity under very trying and risky circumstances. With added force, there is no good argument to support the assumption that the native born entrepre- neurs from the Hispanic ethnic group could not develop the moti- vations and expertise necessary to successfully compete in the over- all market.
How all of these factors, and others that have not been referred to, will blend together and what will be the final resultant of the forces at play, cannot be unambiguously discerned at this moment. One would like to conclude by sounding a note of cautious optim- ism. Namely, that a minority which has recently arrived to the country and that has proved its mettle by achieving beyond all orig- inai expectations, has the potential for continued growth and ex- pansion. Whether its success is to be substantially limited by the boundaries of an ethnic market or will surmount these constraints over-spilling into the general market and society is, indeed, a fasci- nating question to which time will give its answer. In concluding, it should be noted that in agreement with the basic philosophical per- ception of the nature of social change informing this work, one would ultimately conceive of historical evolution and social change as an open ended process. Most particularly this could be the case in a highly developed and pluralistic society with its manifold oppor- tunities for personal initiative and imaginative effort.

FOOTNOTES *The need for further research in this area is discussed in Anto-
nio Jorge, et al., A Development Model for Modern Society: New Cross Cultural Patterns and Socio-Economic Change (The Cuban Experi- ence in South Florida), Discussion Paper Series of the International Banking Center and the Department of Economics (Miami: Florida International University, 1981), Section IV.
**On this point see, Antonio Jorge and Raul Moncarz, "Cubans in South Florida: The Political Economy of Exile and Immigration" in John Bodnar (ed.), Immigrant Communities in America (Champaign, University of Illinois Press, forthcoming), p. 35 and n. 40.
tSee A. Jorge and R. Moncarz, "Cubans in South Florida: A So- cial Science Approach", METAS, Fall 1980, Vol. l , No. 3, pp. 65-75. Idem, International Factor Movement and Complementarity: Growth and Entre- preneurship Under Conditions of Cultural Variation, R.E.M.P. Bulletin, Sup- plement 14 (The Hague: Research Group for European Migration Problems, 1981), Sec. VIII.
??These and similar observations regarding the apparent lack of success in the United States of many powerful Cuban entrepre- neurs were made by Dr. Justo Carrillo at his very interesting pres- entation on the subject on the occasion of the Celebration of Reen- cuentro Cubano, a Cuban arts festival recently held at the University of Miami, in Miami, Florida.