Embed Size (px)
Citation preview

1540-7977/10/$26.00©2010 IEEE34 IEEE power & energy magazine march/april 2010
The Future of Power
TransmissionTechnological Advances for Improved Performance
By Stanley H. Horowitz, Arun G. Phadke, and Bruce A. Renz Digital Object Identifi er 10.1109/MPE.2009.935554
TTHE ELECTRIC POWER SYSTEM IS ON THE VERGE
of signifi cant transformation. For the past fi ve years or so,
work has been under way to conceptualize the shape of a
21st-century grid that exploits the huge progress that has
been made in digital technology and advanced materials.
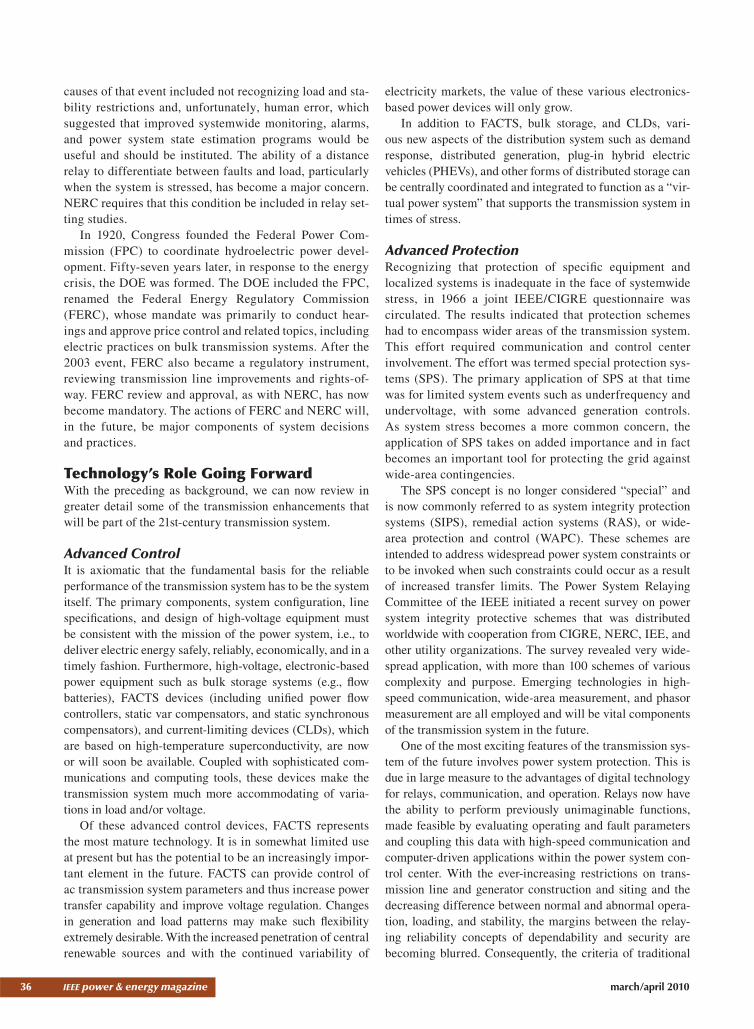
The National Energy Technology Laboratory (NETL) has
identifi ed fi ve foundational key technology areas (KTAs), as
shown in Figure 1.
Foremost among these KTAs will be integrated communi-
cations. The communications requirements for transmission
enhancement are clear. Broadband, secure, low-latency chan-
nels connecting transmission stations to each other and to con-
trol centers will enable advances in each of the other KTAs.
Sensing and measurements will include phasor mea-✔
surement data streaming over high-speed channels.
Advanced components, such as all forms of fl exible ✔
ac transmission system (FACTS) devices, HVDC, and
new storage technologies will respond to control sig-
nals sent to address perturbations occurring in mil-
liseconds.
©BRAND X PICTURES
34 IEEE power & energy magazine march/april 20101540-7977/10/$26.00©2010 IEEE

march/april 2010 IEEE power & energy magazine 35
Advanced control (and protection) methods will in- ✔
clude differential line relaying, adaptive settings, and
various system integrity protection schemes that rely
on low-latency communications.
Improved interfaces and decision support will uti- ✔
lize instantaneous measurements from phasor mea-
surement units (PMUs) and other sources to drive
fast simulations and advanced visualization tools
that can help system operators assess dynamic chal-
lenges to system stability.
Each of these elements will be applied to the moderniza-
tion of the grid, at both the distribution level and the transmis-
sion level. Because it is clearly less advanced, distribution is
receiving most of the initial focus. This is dramatically illus-
trated by the American Recovery and Reinvestment Act’s
Smart Grid Investment Grants (SGIGs), announced in Octo-
ber. Of the $3.4 billion awarded to 100 proposers (of the more
than 400 that applied), only $148 million went to transmission
applications; most of the rest was for distribution projects.
While the changes to distribution will be revolutionary,
transmission will change in an evolutionary manner. Dis-
tributed generation and storage, demand response, advanced
metering infrastructure (SGIGs will fund the deployment of
18 million smart meters), distribution automation, two-way
power fl ow, and differentiated power quality together rep-
resent a sea change in distribution design that will require
enormous fi nancial and intellectual capital.
The role of transmission will not be diminished, how-
ever, by this new distribution paradigm. Large central power
plants will continue to serve as our bulk power source, and
many new ones will be fueled by renewable resources that
would today be out of reach of the transmission grid. New
lines will be built to connect these new plants, and new
methods will be employed to accommodate their very dif-
ferent performance characteristics. Addressing the result-
ing greater variability of supply will be the job of the fi ve
KTAs listed above. As KTA technology speeds increase,
control of transmission will advance from quasi-steady-
state to dynamic.
The traditional communications technologies capable of
supporting these strict requirements are fi ber optics (e.g.,
optical ground wire) and microwave. Recently a third can-
didate has appeared on the scene. Research funded by the
U.S. Department of Energy (DOE) and American Electrical
Power in conjunction with a small Massachusetts smart-grid
communications company, Amperion, has demonstrated the
viability of broadband over power line (BPL) for application
on transmission lines. Currently, a fi ve-mile, 69-kV line is
operating at megabit-per-second data rates with latency of
less than 10 ms. The next step will be to extend this high-
voltage BPL technology to 138 kV.
How We Got Here In 551 B.C., Confucius wrote, “Study the past if you would
know the future.” The future of the electrical power trans-
mission system must be based on a study of the past con-
sidering its successes and failures, on knowledge of the
existing system and all of its component disciplines, and
on a thorough understanding of the latest technologies and
their possible applications. The electrical power system,
and in particular its transmission and distribution network,
is a vital and integral part of today’s society. Because it
is essential to all our endeavors, we must be prepared to
integrate new, exciting, and highly innovative concepts to
guarantee that it performs reliably, safely, economically,
and cleanly.
Although not unique in world events involving power
systems, two widely known outages in the United States and
Canada serve as examples of the history, analysis, and reme-
dies for blackouts and can provide a basis for future actions.
Widely publicized, the blackouts of 9 November 1965 in
the northeastern United States and 23 August 2003 in the
northeastern United States and Canada are typical events
that can help shape our planning and operating efforts for
the future.
In 1965 we learned that cooperation and interaction
between utilities were essential. In response to the blackout,
utilities established the National Electric Reliability Cor-
poration (NERC) in 1968, which began distributing recom-
mendations and information. These communications formed
the basis for more reliable and secure planning, operating,
and protective activities. The decisions of the newly formed
NERC were, however, only recommendations. Defi ciencies
due to limitations in transmission planning, operations, and
protection were recognized, and steps were taken to correct
them. Transmission systems were strengthened considerably
by the construction of 345-kV, 500-kV, and 765-kV lines.
System planning studies were made cooperatively; operat-
ing parameters and system problems were studied jointly.
Underfrequency load shedding became universal, with spe-
cifi c settings arrived at by agreement between utilities, and
loss-of-fi eld relaying was recognized as a system phenom-
enon and studied accordingly.
In 2003 another blackout of similar proportions affected
the northeastern United States and parts of Canada. The
figure 1. NETL’s five key technology areas.
Advanced
Components
Sensing and
Measurements
Advanced
Control
Methods
Decision SupportIntegrated
Communications
36 IEEE power & energy magazine march/april 2010
causes of that event included not recognizing load and sta-
bility restrictions and, unfortunately, human error, which
suggested that improved systemwide monitoring, alarms,
and power system state estimation programs would be
useful and should be instituted. The ability of a distance
relay to differentiate between faults and load, particularly
when the system is stressed, has become a major concern.
NERC requires that this condition be included in relay set-
ting studies.
In 1920, Congress founded the Federal Power Com-
mission (FPC) to coordinate hydroelectric power devel-
opment. Fifty-seven years later, in response to the energy
crisis, the DOE was formed. The DOE included the FPC,
renamed the Federal Energy Regulatory Commission
(FERC), whose mandate was primarily to conduct hear-
ings and approve price control and related topics, including
electric practices on bulk transmission systems. After the
2003 event, FERC also became a regulatory instrument,
reviewing transmission line improvements and rights-of-
way. FERC review and approval, as with NERC, has now
become mandatory. The actions of FERC and NERC will,
in the future, be major components of system decisions
and practices.
Technology’s Role Going ForwardWith the preceding as background, we can now review in
greater detail some of the transmission enhancements that
will be part of the 21st-century transmission system.
Advanced ControlIt is axiomatic that the fundamental basis for the reliable
performance of the transmission system has to be the system
itself. The primary components, system confi guration, line
specifi cations, and design of high-voltage equipment must
be consistent with the mission of the power system, i.e., to
deliver electric energy safely, reliably, economically, and in a
timely fashion. Furthermore, high-voltage, electronic-based
power equipment such as bulk storage systems (e.g., fl ow
batteries), FACTS devices (including unifi ed power fl ow
controllers, static var compensators, and static synchronous
compensators), and current-limiting devices (CLDs), which
are based on high-temperature superconductivity, are now
or will soon be available. Coupled with sophisticated com-
munications and computing tools, these devices make the
transmission system much more accommodating of varia-
tions in load and/or voltage.
Of these advanced control devices, FACTS represents
the most mature technology. It is in somewhat limited use
at present but has the potential to be an increasingly impor-
tant element in the future. FACTS can provide control of
ac transmission system parameters and thus increase power
transfer capability and improve voltage regulation. Changes
in generation and load patterns may make such fl exibility
extremely desirable. With the increased penetration of central
renewable sources and with the continued variability of
electricity markets, the value of these various electronics-
based power devices will only grow.
In addition to FACTS, bulk storage, and CLDs, vari-
ous new aspects of the distribution system such as demand
response, distributed generation, plug-in hybrid electric
vehicles (PHEVs), and other forms of distributed storage can
be centrally coordinated and integrated to function as a “vir-
tual power system” that supports the transmission system in
times of stress.
Advanced ProtectionRecognizing that protection of specifi c equipment and
localized systems is inadequate in the face of systemwide
stress, in 1966 a joint IEEE/CIGRE questionnaire was
circulated. The results indicated that protection schemes
had to encompass wider areas of the transmission system.
This effort required communication and control center
involvement. The effort was termed special protection sys-
tems (SPS). The primary application of SPS at that time
was for limited system events such as underfrequency and
undervoltage, with some advanced generation controls.
As system stress becomes a more common concern, the
application of SPS takes on added importance and in fact
becomes an important tool for protecting the grid against
wide-area contingencies.
The SPS concept is no longer considered “special” and
is now commonly referred to as system integrity protection
systems (SIPS), remedial action systems (RAS), or wide-
area protection and control (WAPC). These schemes are
intended to address widespread power system constraints or
to be invoked when such constraints could occur as a result
of increased transfer limits. The Power System Relaying
Committee of the IEEE initiated a recent survey on power
system integrity protective schemes that was distributed
worldwide with cooperation from CIGRE, NERC, IEE, and
other utility organizations. The survey revealed very wide-
spread application, with more than 100 schemes of various
complexity and purpose. Emerging technologies in high-
speed communication, wide-area measurement, and phasor
measurement are all employed and will be vital components
of the transmission system in the future.
One of the most exciting features of the transmission sys-
tem of the future involves power system protection. This is
due in large measure to the advantages of digital technology
for relays, communication, and operation. Relays now have
the ability to perform previously unimaginable functions,
made feasible by evaluating operating and fault parameters
and coupling this data with high-speed communication and
computer-driven applications within the power system con-
trol center. With the ever-increasing restrictions on trans-
mission line and generator construction and siting and the
decreasing difference between normal and abnormal opera-
tion, loading, and stability, the margins between the relay-
ing reliability concepts of dependability and security are
becoming blurred. Consequently, the criteria of traditional

march/april 2010 IEEE power & energy magazine 37
protection and control are being challenged. The hallmark
of relays is the tradeoff between dependability (the ability to
always trip when required) and security (the characteristic
of never tripping when not required).
Traditionally, relays and relay schemes have been designed
to be dependable. Losing a transmission line element must
be tolerated, whether the loss is for an actual fault or for an
inadvertent or incorrect trip. When the system is stressed,
however, an incorrect trip is not allowable. With the system
stressed, losing another element could be the fi nal step in
bringing down the entire network. With digital logic and
operations, it is possible to reorder protection priorities and
require additional inputs before allowing a trip. This can be
done with appropriate communication from a central center
advising the relays.
Probably one of the most diffi cult decisions for a relay is
to distinguish between heavy loads and faults. Heretofore,
relays simply relied on the impedance measurement, with
settings determined by off-line load studies using conditions
based on experience. As in the two blackouts mentioned
above, this criterion was not adequate for unusual system
conditions that were not previously considered probable.
Digital relays can now establish such parameters as power
factor or voltage and remove the measured impedance from
the tripping logic.
The bête noir of protection has traditionally been the
multiterminal line. The current to the fault and the voltage
at the fault defi nes the fault location. A relay designed to
protect the system for this fault, however, sees only the cur-
rent and voltage at that relay’s specifi c location. The advent
of high-speed communication and digital logic remedies this
condition and allows all involved relays to receive the appro-
priate fault currents and voltages.
The increasing popularity of transmission line differen-
tial relaying also provides both dependability and security
for faults in a multiterminal confi guration. Although primar-
ily a current-measuring relay, the digital construction allows
far more protection, monitoring, and recording functions.
Future applications will be available to accomplish the fea-
tures mentioned above and in ways not yet implemented or
even thought of.
One of the earliest advantages of the computer relay
is its ability to monitor itself and either repair, replace, or
report the problem. This feature is sure to be a major fea-
ture in future transmission line protection. In addition, the
information stored in each relay during both normal and
abnormal conditions and the ability to analyze and trans-
fer this information to analyzers have made previously used
oscillography and sequence-of-events recorders obsolete.
Replacing these devices will result in very signifi cant sav-
ings in both hardware and installation costs. AEP, in con-
junction with Schweitzer Engineering and Tarigma Corp.,
has embarked on a revolutionary program that lets selected
centers receive data from critical substations that will com-
bine, display, and analyze fault data to a degree and in a
time frame heretofore not possible. Combining the current,
voltage, communication signals, and breaker performance
from several stations on one record that can be analyzed at
several control and engineering centers permits operations
to be verifi ed and personnel to be alerted to potential prob-
lems. A vital by-product of this advanced monitoring is the
fact that it allows NERC requirements for monitoring and
analysis to be met.
Perhaps even more exciting is the possibility of predicting
the instability of a power swing. Modern protection theory
knows how to detect the swing using zones of stability and
instability. The problem is how to set the zones. With accu-
rate synchronized phasor measurements from several buses,
the goal of real-time instability protection seems achievable.
Out-of-step relays could then establish blocking or tripping
functions at the appropriate stations.
The role of underfrequency load shedding has already
been discussed. Future schemes, however, could use real-
time measurements at system interconnection boundaries,
compute a dynamic area control error, and limit any poten-
tial widespread underfrequency by splitting the system.
Computer relays, if not already in universal use, will be
in the near future. This will let utilities protect, monitor, and
analyze system and equipment performance in ways and to a
degree not possible before.
Synchronized Phasor MeasurementsIt has been recognized in recent years that synchronized
phasor measurements are exceedingly versatile tools of
modern power system protection, monitoring, and control.
Future power systems are going to depend on making use
of these measurements to an ever-increasing extent. The
principal function of these systems is to measure positive
sequence voltages and currents with a precise time stamp
(to within a microsecond) of the instant when the measure-
ment was made. The time stamps are directly traceable to
the Coordinated Universal Time (UTC) standard and are
achieved by using Global Positioning System (GPS) trans-
missions for synchronization. Many PMUs also provide
While the changes to distribution will be revolutionary, transmission will change in an evolutionary manner.
38 IEEE power & energy magazine march/april 2010
other measurements, such as individual phase voltages and
currents, harmonics, local frequency, and rate of change of
frequency. These measurements can be obtained as often
as once per power frequency cycle, although for a number
of applications a slower measurement rate may be prefer-
able. In well-designed systems, measurement latency (i.e.,
the delay between when the measurement is made and when
it becomes available for use) can be limited to fewer than
50 ms. The performance requirements of the PMUs are
embodied in the IEEE synchrophasor standard (C37.118). A
measurement system that incorporates PMUs deployed over
large portions of the power system has come to be known as
a wide-area measurement system (WAMS), and a power sys-
tem protection, monitoring, and control application that uti-
lizes these measurements is often referred to as a wide-area
measurement protection and control system (WAMPACS).
Automatic Calibration of Instrument Transformers It is well known that current and voltage transformers
used on high-voltage networks have ratio and phase-angle
errors that affect the accuracy of the measurements made
on the secondary of these transformers. Capacitive volt-
age transformers are known to have errors that change with
ambient conditions as well as with the age of the capacitor
elements. Inductive instrument transformers have errors that
change when their secondary loading (burden) is manually
changed. The PMU offers a unique opportunity for cali-
bration of the instrument transformers in real time and as
often as necessary. In simple terms, the technique is based
on having some buses where a precise voltage transformer
(with known calibration) is available and where a PMU is
placed. Potential transformers used for revenue metering are
an example of such a voltage source. Using measurements by
the PMU at this location, the calibration at the remote end
of a feeder connected to this bus can be found. This calibra-
tion is not affected by current transformer (CT) errors when
the system loading is light. It is thus possible to calibrate
all voltage transformers using current measurements at light
system load. Using the voltage transformer calibration thus
obtained and additional measurements during heavy system
load, the current transformers can be calibrated. In practice,
it has been found (in simulated case studies) that by combin-
ing several light and heavy load measurement sets a very
accurate estimate of all the current and voltage transformers
can be obtained. Although a single accurate voltage source
is suffi cient in principle, having a number of them scattered
throughout the network provides a more secure calibration.
Precise State Measurements and EstimatesState estimation of power systems using real-time measure-
ments of active and reactive power fl ows in the network
(supplemented with a few other measurements) was intro-
duced in the late 1960s to improve the awareness among
power system operators of the prevailing state of the power
grid and its ability to handle contingency conditions that
may occur in the immediate future. This was a big step for-
ward in intelligent operation of the power grid. The limita-
tions of this technology (such as nonsimultaneity of system
measurements across the network) were rooted in the tech-
nology of that day. The fact that the data from a dynamically
changing power system was not obtained simultaneously
over a signifi cant time span meant that the estimated state
was an approximation of the actual system state. Conse-
quently, the system state and its response to contingencies
could only be reasonably accurate when the power system
was in a quasi-steady state. Indeed, when the power system
was undergoing signifi cant changes due to evolving events,
the state estimator could not always be counted on to con-
verge to a usable solution.
The advent of wide-area measurements using GPS-
synchronized PMUs led to a paradigm shift in the state
estimation process. With this technology, the capability of
directly measuring the state of the power system has become
a reality. PMUs measure positive sequence voltages at net-
work buses and positive sequence currents in transmission
lines and transformers. Since the state of the power system
is defi ned as a collection of positive sequence voltages at
all network buses, it is clear that with suffi cient numbers of
PMU installations in the system one can measure the sys-
tem state directly: no estimation is necessary. In fact, the
transmission line currents provide a direct estimate of volt-
age at a remote bus in terms of the voltage at one end. It is
therefore not necessary to install PMUs at all system buses.
It has been found that by installing PMUs at about one-third
of system buses with voltage and current measurements, it
is possible to determine the complete system state vector.
Feeding this information into the appropriate computers
provides the information necessary for the adaptive protec-
tive function described above. Of course, a larger number
of PMUs provides redundancy of measurements, which is
always a desirable feature of estimation processes.
Complete and Incomplete ObservabilityIn order to achieve a state estimate in the traditional way,
i.e., by using unsynchronized supervisory control and data
acquisition (SCADA) measurements, a complete network
tree must be measured. With PMUs, however, it is suffi cient
to measure isolated parts of the network, which provides
islands of observable networks. This is possible since all
phasors are synchronized to the same instant in time. The
process has been described as PMU placement for incom-plete observability. The remaining network buses can be
estimated from the observed islands using approximation
techniques. This is, of course, not as accurate as providing a
suffi cient number of PMUs in the fi rst place. But it has been
shown that combining incomplete observations with such an
approximation technique to estimate the unobserved parts
provides surprisingly useful results. Incomplete observabil-
ity estimators are a natural step in the progression towards
march/april 2010 IEEE power & energy magazine 39
complete observability and will be a feature in future trans-
mission systems.
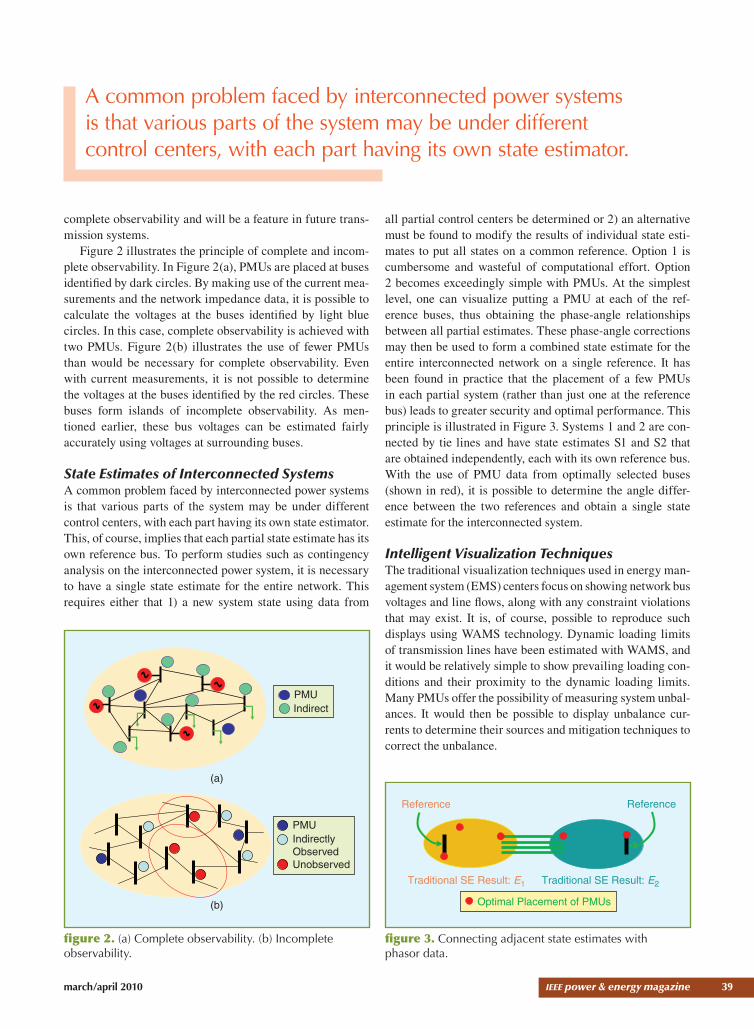
Figure 2 illustrates the principle of complete and incom-
plete observability. In Figure 2(a), PMUs are placed at buses
identifi ed by dark circles. By making use of the current mea-
surements and the network impedance data, it is possible to
calculate the voltages at the buses identifi ed by light blue
circles. In this case, complete observability is achieved with
two PMUs. Figure 2(b) illustrates the use of fewer PMUs
than would be necessary for complete observability. Even
with current measurements, it is not possible to determine
the voltages at the buses identifi ed by the red circles. These
buses form islands of incomplete observability. As men-
tioned earlier, these bus voltages can be estimated fairly
accurately using voltages at surrounding buses.
State Estimates of Interconnected SystemsA common problem faced by interconnected power systems
is that various parts of the system may be under different
control centers, with each part having its own state estimator.
This, of course, implies that each partial state estimate has its
own reference bus. To perform studies such as contingency
analysis on the interconnected power system, it is necessary
to have a single state estimate for the entire network. This
requires either that 1) a new system state using data from
all partial control centers be determined or 2) an alternative
must be found to modify the results of individual state esti-
mates to put all states on a common reference. Option 1 is
cumbersome and wasteful of computational effort. Option
2 becomes exceedingly simple with PMUs. At the simplest
level, one can visualize putting a PMU at each of the ref-
erence buses, thus obtaining the phase-angle relationships
between all partial estimates. These phase-angle corrections
may then be used to form a combined state estimate for the
entire interconnected network on a single reference. It has
been found in practice that the placement of a few PMUs
in each partial system (rather than just one at the reference
bus) leads to greater security and optimal performance. This
principle is illustrated in Figure 3. Systems 1 and 2 are con-
nected by tie lines and have state estimates S1 and S2 that
are obtained independently, each with its own reference bus.
With the use of PMU data from optimally selected buses
(shown in red), it is possible to determine the angle differ-
ence between the two references and obtain a single state
estimate for the interconnected system.
Intelligent Visualization Techniques The traditional visualization techniques used in energy man-
agement system (EMS) centers focus on showing network bus
voltages and line fl ows, along with any constraint violations
that may exist. It is, of course, possible to reproduce such
displays using WAMS technology. Dynamic loading limits
of transmission lines have been estimated with WAMS, and
it would be relatively simple to show prevailing loading con-
ditions and their proximity to the dynamic loading limits.
Many PMUs offer the possibility of measuring system unbal-
ances. It would then be possible to display unbalance cur-
rents to determine their sources and mitigation techniques to
correct the unbalance.
figure 3. Connecting adjacent state estimates with phasor data.
Traditional SE Result: E1 Traditional SE Result: E2
Reference Reference
Optimal Placement of PMUs
A common problem faced by interconnected power systems is that various parts of the system may be under different control centers, with each part having its own state estimator.
figure 2. (a) Complete observability. (b) Incomplete observability.
Indirect
PMU
PMU
Indirectly
Observed
Unobserved
(a)
(b)

40 IEEE power & energy magazine march/april 2010
With direct measurement of synchronized phasors,
many more display options become possible. For example, a
geographical display with phase angles at all network buses
shown at the physical location of buses—and perhaps fi tted
with a surface in order to provide a hilly contour—would
immediately show the distribution of positive sequence volt-
age phase angles.
Figure 4 shows such a visualization of a hypothetical net-
work state for the entire United States. The map colors iden-
tify the magnitude and sign of the positive sequence voltage
phase angle with respect to a center of angle reference. The
lower plot is a footprint of equiangle loci from the map. Since
the positive sequence voltage phase-angle profi le of a net-
work conveys a great deal of information regarding its power
fl ow and loading conditions, such visualizations can instantly
show the quality of the prevailing system state and its dis-
tance from a normal state. High-speed dynamic phenomena
can be represented by animations of such visualizations.
Such a display would instantly show the general dispo-
sition of generation surplus and load surplus areas. Such a
picture can be updated at scan rates of a few cycles, leading
to visualization of dynamic conditions on the network. If
thresholds for phase-angle differences between key buses
have been established for secure operation of the network,
then violation of those thresholds could lead to important
alarms for the operator. Similarly, when islands are formed
following a catastrophic event, the boundaries of those
islands could be displayed for the operator. Several protec-
tion and control principles are being developed to make
use of wide-area measurements provided by PMUs. Adap-
tive relaying decisions made in this manner could also be
displayed for the use of protection and control engineers.
The technology of visualization using WAMS schemes is
in its infancy. As we gain greater experience with these
systems, more interesting display ideas will undoubtedly
be forthcoming.
ConclusionModernizing the U.S. power grid has become a national pri-
ority. Unprecedented levels of governmental funding have
been committed in order to achieve this goal. The initial
focus has been on the fundamental transformation of the
distribution system. This is in itself a huge technical chal-
lenge that will be measured not in years but in decades. The
end result is expected to be higher effi ciency, reduced envi-
ronmental impact, improved reliability, and lower exposure
to terrorism.
The revolution in distribution must be accompanied by
the continued evolution of the transmission system. Events
like the 2003 blackout—more the result of human shortcom-
ings than technological breakdowns—can be eliminated
by exploiting the huge progress made in recent years in the
digital and material sciences. Other industries have already
harvested these opportunities; now it is our turn.
Technological development is an engineering challenge.
This nation has time and again demonstrated its ability
to meet such challenges whenever they have been clearly
focused. But there is another challenge that may actually
be more diffi cult. It is to fi nd the political alignment that is
needed to accept the vision and move forward aggressively.
For transmission, that means recognizing that new lines, not
just better lines, will be needed. It is simply not acceptable
to wait ten or more years for a new line to move from con-
cept to reality. Unlike many other parts of the world, the
United States has allowed fragmented responsibility for
transmission additions to slow the process to an unaccept-
able extent.
With the intense focus now on energy in general and
electricity in particular, it should be possible to overcome
both the technical and the political obstacles and to reestab-
lish U.S. leadership in this vital arena. Doing so is a matter
of huge national signifi cance that will affect the lifestyle of
all Americans in this new century.
For Further ReadingV. Madani and D. Novosel, “Getting a grip on the grid,”
IEEE Spectr., pp. 42–47, Dec. 2005.
P. Anderson and B. K. LeReverend, “Industry experience
with special protection schemes,” IEEE Trans. Power Syst., vol. 2, no.3 , pp. 1166–1179, Aug. 1996.
“Global Industry Experiences with System Integrity Pro-
tection Schemes,” Survey of Industry Practices, IEEE Power
System Relaying Committee, submitted for publication.
Biographies Stanley H. Horowitz is a former consulting electrical engi-
neer at AEP and former editor-in-chief of IEEE Computer Applications in Power magazine.
Arun G. Phadke is the University Distinguished Profes-
sor Emeritus at Virginia Tech.
Bruce A. Renz is president of Renz Consulting, LLC. p&e
figure 4. U.S. Phasor contour map.