Embed Size (px)
Citation preview

EUR
OP
EA
N F
OOD BANKS FEDE
RA
TIO
N
F E B A
Impactful data for social good4-5 FEBRUARY 2019 / BRUSSELS, BELGIUM
THE FUTURE OF FOOD BANKS IN EUROPE

This publication has received financial support from the European Union through the Grant Agreement SANTE/2018/E1/FEBA/SI2.790560. The information contained in this publication reflects only the authors’ view and the European Commission is not responsible for any use that may be made of the information it contains.
Published March 2019, Brussels.
© FEBA. All rights reserved. Any reproduction in full or in part must mention the title and credit FEBA as the copyright owner.

ContentsIntroduction
Skill-sharing session Summary / 4th February
Programme
Skill-sharing session Summary / 5th February
1
3
1014

Introduction
Report I Impactful data for social good1
The skill-sharing session “Impactful data for social good” was focused on data collection and took place in Brussels during two days in February 2019. Food Bank representatives from 19 European countries shared best practice and knowledge about existing models of delegated data collection and talked about the possibility to improve the current shared model.
This skill-sharing session aimed at fostering an efficient way to strengthen the capability of FEBA and its membership to collect data in a reliable and - most of all - comparable format across different countries, and to address the need for more clarity in terms of impact measurement.
The main objective is therefore to share a standardized and consistent methodology for data collection across Food Banks and define how to make sense of the information of impact management and measurement.
Efficient
Significant & Reliable
Consistant & Comparable

The skill-sharing session is part of the project “The Future of Food Banks in Europe. Preparing the ‘20s”, awarded with a grant by DG Health and Food Safety, European Commission.
The objective of the project is sharing best practice and knowledge amongst FEBA members to support recovery
Report I Impactful data for social good2
and redistribution of surplus food to feed people in need. This contributes to the achievement of the UN SDGs, in particular SDG 12.3 by preventing food waste through the redistribution for human consumption. In this document you will find a summary of the information and best practice shared during the two days of the skill-sharing session.
Skill-sharing session Summary / 4th February
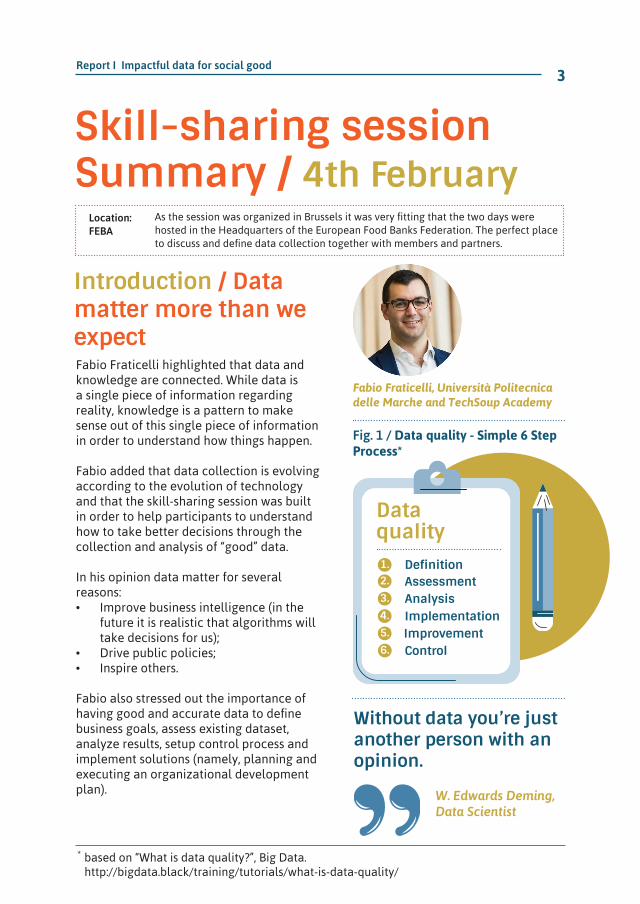
Introduction / Data matter more than we expectFabio Fraticelli highlighted that data and knowledge are connected. While data is a single piece of information regarding reality, knowledge is a pattern to make sense out of this single piece of information in order to understand how things happen.
Fabio added that data collection is evolving according to the evolution of technology and that the skill-sharing session was built in order to help participants to understand how to take better decisions through the collection and analysis of “good” data.
In his opinion data matter for several reasons:• Improve business intelligence (in the
future it is realistic that algorithms will take decisions for us);
• Drive public policies;• Inspire others.
Fabio also stressed out the importance of having good and accurate data to define business goals, assess existing dataset, analyze results, setup control process and implement solutions (namely, planning and executing an organizational development plan).
Fabio Fraticelli, Università Politecnica delle Marche and TechSoup Academy
Without data you’re just another person with an opinion.
W. Edwards Deming,Data Scientist
Control
Dataquality
Assessment
ImprovementImplementation
Definition
Analysis
Fig. 1 / Data quality - Simple 6 Step Process*
1.2.
3.
4.5.6.
based on “What is data quality?”, Big Data. http://bigdata.black/training/tutorials/what-is-data-quality/
*
Report I Impactful data for social good3
As the session was organized in Brussels it was very fitting that the two days were hosted in the Headquarters of the European Food Banks Federation. The perfect place to discuss and define data collection together with members and partners.
Location: FEBA
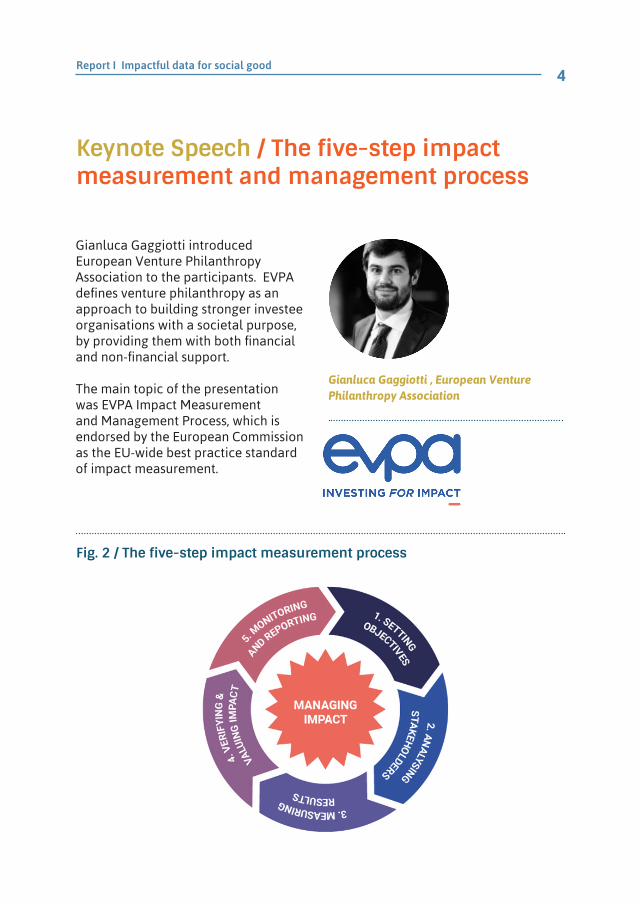
Keynote Speech / The five-step impact measurement and management process
Gianluca Gaggiotti introduced European Venture Philanthropy Association to the participants. EVPA defines venture philanthropy as an approach to building stronger investee organisations with a societal purpose, by providing them with both financial and non-financial support.
The main topic of the presentation was EVPA Impact Measurement and Management Process, which is endorsed by the European Commission as the EU-wide best practice standard of impact measurement.
Gianluca Gaggiotti , European Venture Philanthropy Association
Fig. 2 / The five-step impact measurement process
Report I Impactful data for social good4

Workshop / Why do we collect data? Understanding the FEBA model
FEBA currently collects data - number of Food Banks, charities and end beneficiaries, tons of food collected and distributed (including sources and food categories), financials, human resources, premises, vehicles, and handling equipment - from its membership once a year.
These data are then analysed and used for different purposes: Governance (e.g. voting rights at FEBA General Assembly), Communication (e.g. FEBA Annual Report, leaflet, website, social media), Relationship with European institutions and stakeholders and Fundraising.
EUR
OP
EA
N F
OOD BANKS FEDE
RA
TIO
N
F E B A
Governance
Communication
Relationship with European institutions and stakeholders
Fundraising
Fig. 3 / FEBA model
Report I Impactful data for social good5
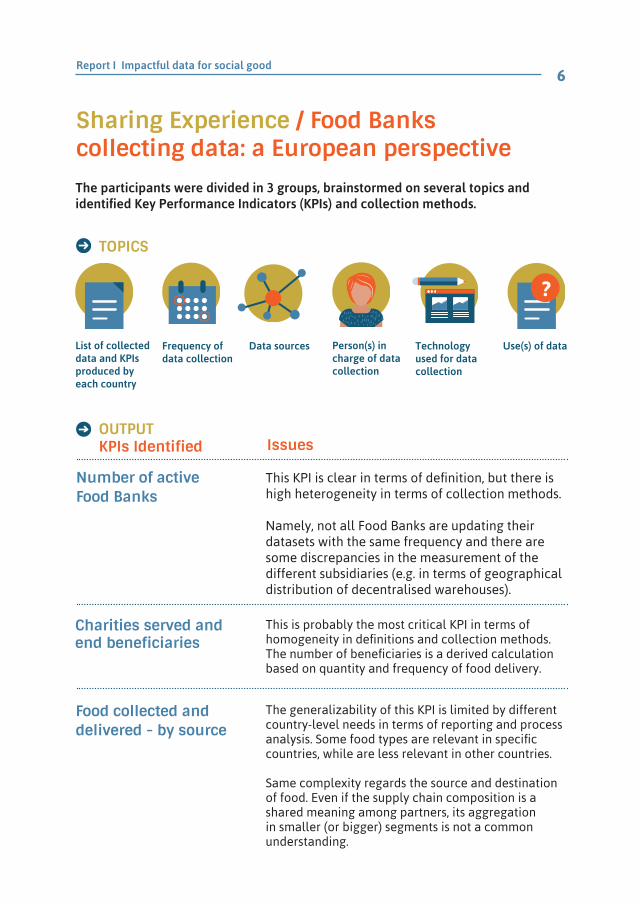
Sharing Experience / Food Banks collecting data: a European perspectiveThe participants were divided in 3 groups, brainstormed on several topics and identified Key Performance Indicators (KPIs) and collection methods.
OUTPUTKPIs Identified
Number of active Food Banks
This KPI is clear in terms of definition, but there is high heterogeneity in terms of collection methods.
Namely, not all Food Banks are updating their datasets with the same frequency and there are some discrepancies in the measurement of the different subsidiaries (e.g. in terms of geographical distribution of decentralised warehouses).
Charities served and end beneficiaries
This is probably the most critical KPI in terms of homogeneity in definitions and collection methods. The number of beneficiaries is a derived calculation based on quantity and frequency of food delivery.
Food collected and delivered - by source
The generalizability of this KPI is limited by different country-level needs in terms of reporting and process analysis. Some food types are relevant in specific countries, while are less relevant in other countries.
Same complexity regards the source and destination of food. Even if the supply chain composition is a shared meaning among partners, its aggregation in smaller (or bigger) segments is not a common understanding.
Issues
TOPICS
List of collected data and KPIs produced by each country
Frequency of data collection
Data sources Person(s) in charge of data collection
Technology used for data collection
Use(s) of data
Report I Impactful data for social good6
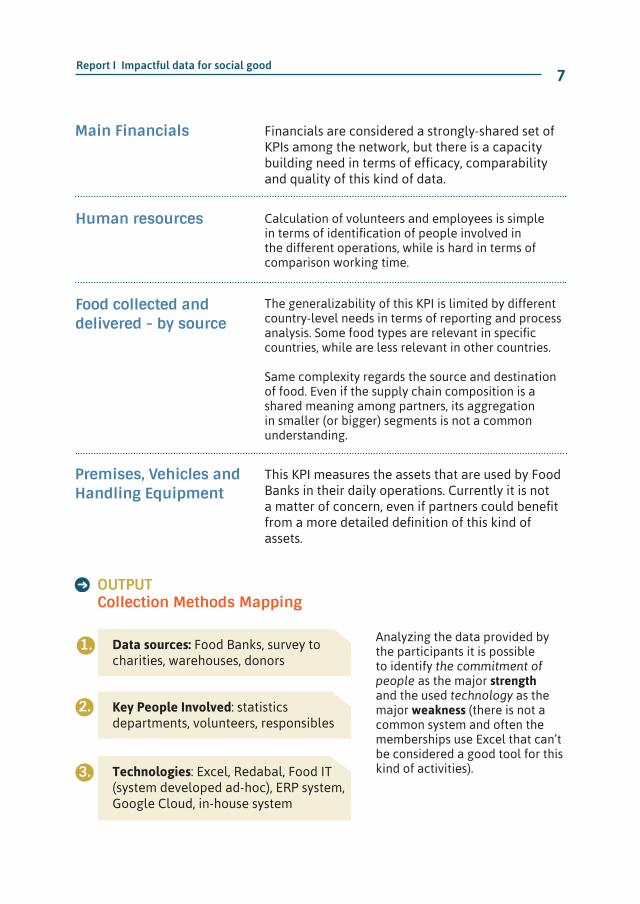
Main Financials Financials are considered a strongly-shared set of KPIs among the network, but there is a capacity building need in terms of efficacy, comparability and quality of this kind of data.
Human resources Calculation of volunteers and employees is simple in terms of identification of people involved in the different operations, while is hard in terms of comparison working time.
Food collected and delivered - by source
The generalizability of this KPI is limited by different country-level needs in terms of reporting and process analysis. Some food types are relevant in specific countries, while are less relevant in other countries.
Same complexity regards the source and destination of food. Even if the supply chain composition is a shared meaning among partners, its aggregation in smaller (or bigger) segments is not a common understanding.
Premises, Vehicles and Handling Equipment
This KPI measures the assets that are used by Food Banks in their daily operations. Currently it is not a matter of concern, even if partners could benefit from a more detailed definition of this kind of assets.
Analyzing the data provided by the participants it is possible to identify the commitment of people as the major strength and the used technology as the major weakness (there is not a common system and often the memberships use Excel that can’t be considered a good tool for this kind of activities).
OUTPUTCollection Methods Mapping
Data sources: Food Banks, survey to charities, warehouses, donors
Key People Involved: statistics departments, volunteers, responsibles
Technologies: Excel, Redabal, Food IT (system developed ad-hoc), ERP system, Google Cloud, in-house system
1.
2.
3.
Report I Impactful data for social good7

Workshop Session / Challenging the current model - Important KPIs we all measureThe aim of this session was to reach a common floor base of the KPIs that the entire network is capable to measure in a robust and comparable way because while the label is clear there are a lot of criticalities/open question that must be addressed by the network in order to reach a robust and shared data collection. To this, the facilitator handled a plenary session.
Tons of Food (gross or net)
Number of beneficiaries
The KPI is measured on demand with paper documents in/out warehouse management system or on the base of the food weight.
However, the Matrix is difficult to be managed and there is the need to find a simplest version of it.
The KPI is measured by a direct contact to Food Banks. It is difficult to find an equal definition.
Does 1 person correspond to one beneficiary? Are meals a better KPI? Should we combine meals and beneficiaries? If yes, how? Should we categorize beneficiaries? If yes, how? Which type of “soft categories” should we use? Someone with income lower than EU level of poverty threshold? Do we want to count the entire family? Can we count on charities? Should we refer the KPI to a number of weeks? Should we talk about the impacted people instead of beneficiaries or meals? Maybe one parameter is not enough?
Number of meals
KPI measured on demand and the conversion factor is based on tons of food.
Report I Impactful data for social good8
Report I Impactful data for social good9
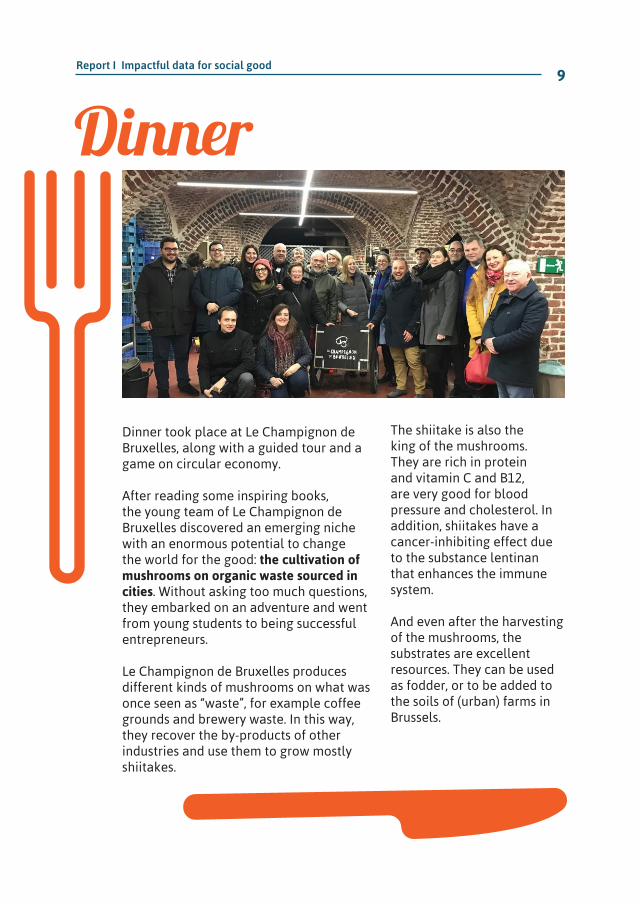
Dinner took place at Le Champignon de Bruxelles, along with a guided tour and a game on circular economy.
After reading some inspiring books, the young team of Le Champignon de Bruxelles discovered an emerging niche with an enormous potential to change the world for the good: the cultivation of mushrooms on organic waste sourced in cities. Without asking too much questions, they embarked on an adventure and went from young students to being successful entrepreneurs.
Le Champignon de Bruxelles produces different kinds of mushrooms on what was once seen as “waste”, for example coffee grounds and brewery waste. In this way, they recover the by-products of other industries and use them to grow mostly shiitakes.
The shiitake is also the king of the mushrooms. They are rich in protein and vitamin C and B12, are very good for blood pressure and cholesterol. In addition, shiitakes have a cancer-inhibiting effect due to the substance lentinan that enhances the immune system.
And even after the harvesting of the mushrooms, the substrates are excellent resources. They can be used as fodder, or to be added to the soils of (urban) farms in Brussels.
Dinner

Skill-sharing session Summary / 5th February
Keynote Speech / Welcome to Eurostat
Cristina Calizzani introduced Eurostat, the statistical office of the European Union, to the participants. Its mission is to provide high quality statistics for Europe. Providing the European Union with statistics at European level that enables comparisons between countries and regions is a key task.
The Eurostat statistics have a geographical coverage and have a wide range of topics. In this framework data play a key role at Eurostat. To find them is it possible to:
• Explore the data navigation tree• Use the data left menu of statistics
by theme web pages• Use the search function with
keywords• Start with publications and
metadata documents which usually contain links/names to the source datasets.
Geographical coverage
aggregates for the EU and the euro area
28 Member States
If possible, EFTA and candidate countries
many indicators available at regional level, some at city level
Wide range of topics
9 statistical themes
4600+tables
1.2 billion+figures
Report I Impactful data for social good10

Workshop Session / Challenging the current model - Important KPIs we all measure
The participants were divided in 3 groups and brainstormed on options about how to define a KPI.
The participants’ task was to define and present a KPI that described the food recovered by Food Banks. They identified these sources:
• European and national fruit & vegetables withdrawal scheme
• FEAD• Industry (Agri Farm Products)• Industry (Manufacturing)• Distribution (Wholesale, retails, etc.)• HORECA
GROUP 1
• Food collections• Other Food banks
For each source, the group identified a further categorization regarding the status of delivered food, among the following two items:
RESCUED = food originally intended for human consumption that would otherwise not be consumed by humans without the Food Bank intervention (i.e. food that otherwise would go the the next (lower) levels of the hierarchy of waste).
NOT RESCUED = food that is managed by the Food Bank but not because it is rescued (i.e. donated, purchased, etc.).
Report I Impactful data for social good11
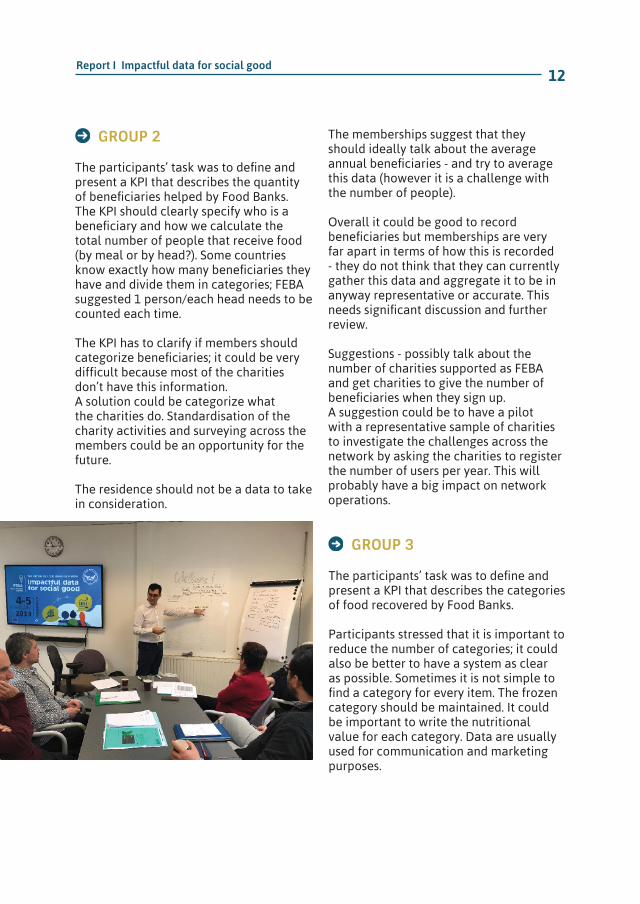
The participants’ task was to define and present a KPI that describes the categories of food recovered by Food Banks.
Participants stressed that it is important to reduce the number of categories; it could also be better to have a system as clear as possible. Sometimes it is not simple to find a category for every item. The frozen category should be maintained. It could be important to write the nutritional value for each category. Data are usually used for communication and marketing purposes.
The participants’ task was to define and present a KPI that describes the quantity of beneficiaries helped by Food Banks.The KPI should clearly specify who is a beneficiary and how we calculate the total number of people that receive food (by meal or by head?). Some countries know exactly how many beneficiaries they have and divide them in categories; FEBA suggested 1 person/each head needs to be counted each time.
The KPI has to clarify if members should categorize beneficiaries; it could be very difficult because most of the charities don’t have this information.A solution could be categorize what the charities do. Standardisation of the charity activities and surveying across the members could be an opportunity for the future.
The residence should not be a data to take in consideration.
GROUP 2 The memberships suggest that they should ideally talk about the average annual beneficiaries - and try to average this data (however it is a challenge with the number of people).
Overall it could be good to record beneficiaries but memberships are very far apart in terms of how this is recorded - they do not think that they can currently gather this data and aggregate it to be in anyway representative or accurate. This needs significant discussion and further review.
Suggestions - possibly talk about the number of charities supported as FEBA and get charities to give the number of beneficiaries when they sign up. A suggestion could be to have a pilot with a representative sample of charities to investigate the challenges across the network by asking the charities to register the number of users per year. This will probably have a big impact on network operations.
GROUP 3
Report I Impactful data for social good12
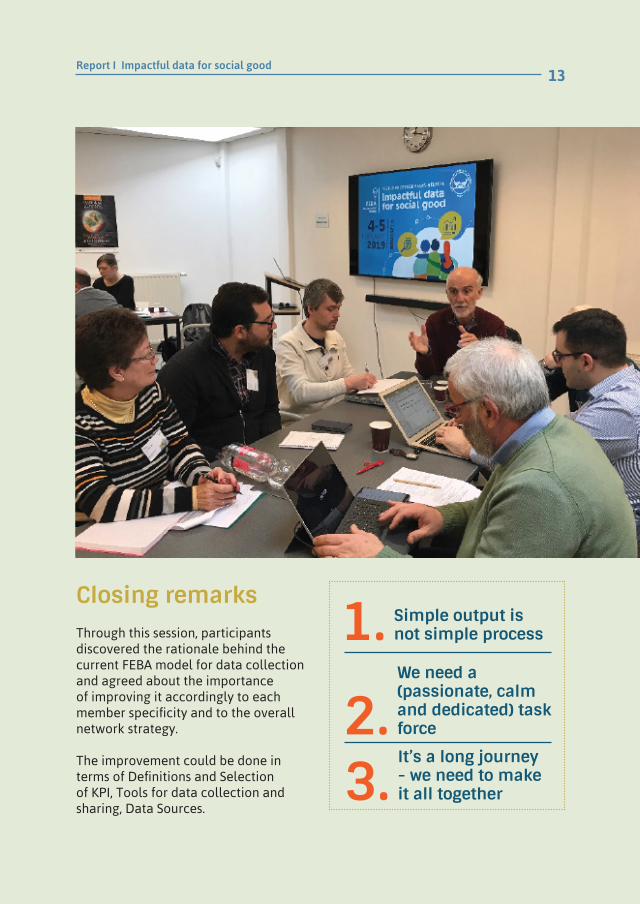
Closing remarksThrough this session, participants discovered the rationale behind the current FEBA model for data collection and agreed about the importance of improving it accordingly to each member specificity and to the overall network strategy.
The improvement could be done in terms of Definitions and Selection of KPI, Tools for data collection and sharing, Data Sources.
1. Simple output is not simple process
2.We need a (passionate, calm and dedicated) task force
3.It’s a long journey - we need to make it all together
Report I Impactful data for social good13

Programme8h30 - 9h00
February 4thRegistration and coffee
9h00 - 9h15 Welcome / Agenda of the workshop and expectations
Angela Frigo (FEBA)
9h15 - 9h45 Introduction / Data matter more than we expect
Fabio Fraticelli (UniversitàPolitecnica delle Marche and TechSoup Academy)
9h45 - 10h15 Keynote Speech / A world where philanthropy and investment combine to drive social impact
Gianluca Gaggiotti (European Venture Philanthropy Association)
10h15 - 11h15 Workshop/ Why do we collect data? Understanding the FEBA model
Plenary session
11h15 - 11h45 Coffee Break11h45 - 13h00 Sharing Experience /
Food Banks collecting data: a European perspective
Working in groups
13h00 - 14h00 Lunch14h00 - 15h45 Workshop Session /
Challenging the current modelWorking in groups
15h45 - 16h15 Coffee Break
16h15 - 17h15 Brainstorming / Building a prototype of the new model
Plenary session
17h15 - 17h30 Closing remarks
February 5th8h45 - 9h00 Arrival of participants9h00 - 9h30 Welcome / Recap of DAY 1
and expectations for DAY 2Angela Frigo (FEBA) and Fabio Fraticelli (UniversitàPolitecnica delle Marche andTechSoup Academy)
9h30 - 10h00 Keynote Speech / Welcome to Eurostat
Cristina Calizzani (European Commission, Eurostat)
10h00 - 11h00 Workshop / Using the prototype of the new model
Working in groups
11h00 - 11h15 Coffee Break
11h15 - 12h15 Role play / The challenge is on
Plenary session
12h15 - 12h30 Closing remarks Angela Frigo (FEBA)
12h30 - 13h30 Lunch
Report I Impactful data for social good14

The European Food Banks Federation takes this opportunity to gratefully acknowledge DG Health and Food Safety, European Commission for concretely supporting the reinforcement of the credibility and efficacy of FEBA and its membership.
A grateful acknowledgement to Gianluca Gaggiotti from EVPA for driving us to the discovery of the impact measurement and management process.
A deep appreciation to Cristina Calizzani from Eurostat for a comprehensive presentation of the complexity of European statistics.
Deserving of special mention is Fabio Fraticelli for giving an added value to the skill-sharing session thanks to his competence and expertise.
A huge thank you to Quentin Declerck and Thibault Fastenakels for the guided visit to Le Champignon de Bruxelles and the dinner prepared with tasty mushrooms in such an inspiring environment.
Last but not least, many thanks to all the participants who actively contributed to the success of the skill-sharing session.
Acknowledgement
Report I Impactful data for social good15


EUR
OP
EA
N F
OOD BANKS FEDE
RA
TIO
N
F E B A
European Food Banks Federation asbl - FEBA
Chaussée de Louvain 775Brussels 1140, Belgium
+32 2 538 94 [email protected]
@EuroFoodBanks
European Food Banks Federation
www.eurofoodbank.org
linkedin.com/company/eurofoodbanks
facebook.com/EuroFoodBanks
www.
instagram.com/eurofoodbanks