Embed Size (px)
Citation preview

1
The Future of Bottled Water9-18-09
Kim Jeffery - CEO, Nestlé Waters North America

2
DisclaimerDisclaimer
This presentation contains forward looking statements which reflect Management’s current views and estimates. The forward looking statements involve certain risks and uncertainties that could cause actual results to differ materially from those contained in the forward looking statements. Potential risks and uncertainties include such factors as general economic conditions, foreign exchange fluctuations, competitive product and pricing pressures and regulatory developments.
3
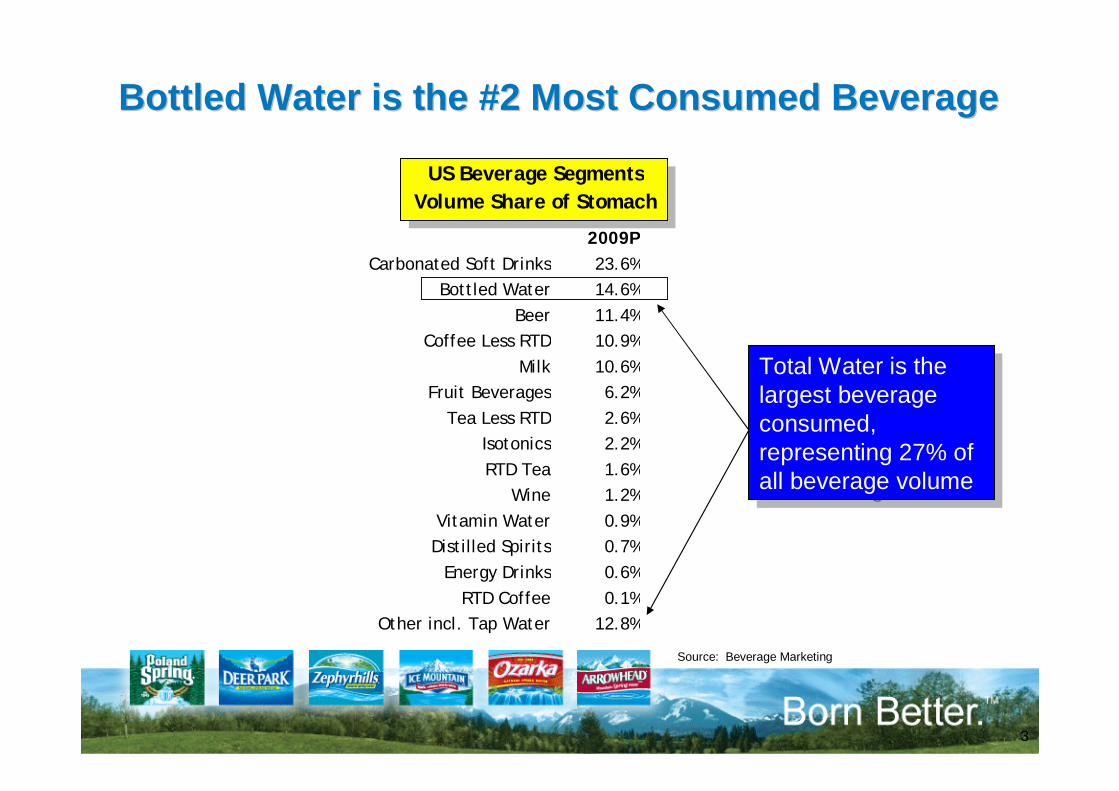
Bottled Water is the #2 Most Consumed BeverageBottled Water is the #2 Most Consumed Beverage
2009PCarbonated Soft Drinks 23.6%
Bottled Water 14.6%Beer 11.4%
Coffee Less RTD 10.9%Milk 10.6%
Fruit Beverages 6.2%Tea Less RTD 2.6%
Isotonics 2.2%RTD Tea 1.6%
Wine 1.2%Vitamin Water 0.9%Distilled Spirits 0.7%
Energy Drinks 0.6%RTD Coffee 0.1%
Other incl. Tap Water 12.8%
US Beverage SegmentsVolume Share of Stomach
Total Water is the largest beverage consumed, representing 27% of all beverage volume
Total Water is the largest beverage consumed, representing 27% of all beverage volume
Source: Beverage Marketing

4
Bottled Water and RTD Teas Are The Only Bottled Water and RTD Teas Are The Only Beverages With Growth This Year Beverages With Growth This Year
Beverage Volume Trends1st Half 2009
CSD's -3.7%
Juice Drinks -10.4%
Sports Drinks -12.8%
- Gatorade -17.7%
Enhanced Water -11.8%
- Glaceau Vitamin Water -15.0%
RTD Teas 0.7%
Bottled Water 0.5%
All LRB's -3.4%
Source: Beverage Digest and Nielsen

5
NWNA37.7%
Coke12.8%
Others4.5%
Cr. Geyser3.8%
Private Label29.0%
Pepsi12.2%
NWNA Continues To Drive ShareNWNA Continues To Drive ShareMeasured ChannelsMeasured Channels
Source: PET volume share for Nielsen, Food, Pharmacy, Mass (x Wal-Mart) and C-Store channels
(+2.0 pts)
(-1.4 pts)(-3.3 pts)*
* Includes Dasani, Dannon/Aquarius, Evian
(-0.3 pts)
(+3.1 pts)
(-0.1 pts)
PET Volume Share YTD 8/8/09Food, Pharmacy, Mass excl. Wal-Mart, C-Store Channels
PET Volume Share YTD 8/8/09Food, Pharmacy, Mass excl. Wal-Mart, C-Store Channels

6
2008 All Channel PET Volume Share
NWNA41.1%
Aquafina10.3%
Dasani10.3%
Crystal Geyser9.6%
Danone2.1%
All Others26.5%
NWNA With Strong All Outlet Share Growth NWNA With Strong All Outlet Share Growth
Source: Beverage Marketing Corp. April 2009
Share Pt. Change2007 2008
NWNA +2.6 +2.1Aquafina -0.5 -1.4Dasani -0.1 -0.5Crystal Geyser +1.1 +0.2Danone -2.7 -0.3All Others -0.4 -0.1
2008 PET Results - All Channel Volume Share2008 PET Results - All Channel Volume Share

7
The Environmental Debate
• Originated by Corporate Accountability International (NGO) with their campaign
• Failed to identify a specific goal
• 5 years ago, Bottled Water was the antidote for obesity
• Today bottled water is portrayed as the villain
- The environmental facts do not support this
- The health & wellness facts do not support this
Will Environmental Issues Be A LongWill Environmental Issues Be A Long--Term Term Roadblock to Bottled Water Growth?Roadblock to Bottled Water Growth?
* NWNA carbon footprint is 1.7 million metric tons of Co2 annually
The Facts
• Bottled water consumption/capita is 0.2% of a person’s carbon footprint (in EU, will be even smaller in US)
• NWNA’s carbon footprint is equivalent to the annual Co2 emissions of 35,000 homes vs. 110 million total households in the U.S.*
• NWNA is one of 70,000 beverages made with glass, plastic or aluminum. 70% of Americans prefer packaged beverages.

8
Sugared Beverage Consumption Is Over Sugared Beverage Consumption Is Over 3 Times The Size of Bottled Water3 Times The Size of Bottled Water
50
55
60
65
70
75
1990
1991
1992
1993
1994
1995
1996
1997
1998
1999
2000
2001
2002
2003
2004
2005
2006
0
10
20
30
40
50
60
70
CSDs, Fruit Juices, Energy Drinks Retail Bottled Water
CSD’s, Fruit JuicesEnergy Drinks
CSD’s, Fruit JuicesEnergy Drinks
Retail Bottled WaterRetail Bottled WaterU.S. Gallons Per CapitaU.S. Gallons Per Capita
Source: Beverage Marketing

9Source: Financial forecast Center, LLC and Nielsen FDMXC
• Slowdown in PET Category correlates with GDP trends• According to Nielsen, the PET category is sensitive to the economy but
rebounds with economic recovery• Based on total LRB trends, bottled water is performing better• People expect LRBs to recover, so Bottled Water should outperform as well
What Is the Sensitivity of the Industry to Current Economic What Is the Sensitivity of the Industry to Current Economic Conditions And Will It Recover?Conditions And Will It Recover?

10
NWNA Has A Broad Portfolio That Is WellNWNA Has A Broad Portfolio That Is Well--Positioned In This Economic EnvironmentPositioned In This Economic Environment
Regional Brands
Regional Brands
National BrandNestlé Pure Life
National BrandNestlé Pure Life
PremiumBrands
PremiumBrands
PremiumPremium--PricedPriced
ValueValue
#1 volume brand across all channels
Source: Beverage Marketing

11
1. Bottled water is perfect as it is – limited opportunities to innovate• Beauty of bottled water is absence of negatives
2. Water “Plus” products are vanishing • Lack the benefits of water people want
3. NWNA has significant technological capabilities in packaging that have substantial environmental impact
• Industry leader with Eco-shape™ bottle in 2007
• By year-end 2009, we will have saved more than 195 million pounds of resin
– Equivalent of taking 78,000 cars off the roads for a year
• Others have followed with light-weight packaging
Does Bottled Water Have the Innovation and Does Bottled Water Have the Innovation and Profitability to Ensure LongProfitability to Ensure Long--Term Survival?Term Survival?
12
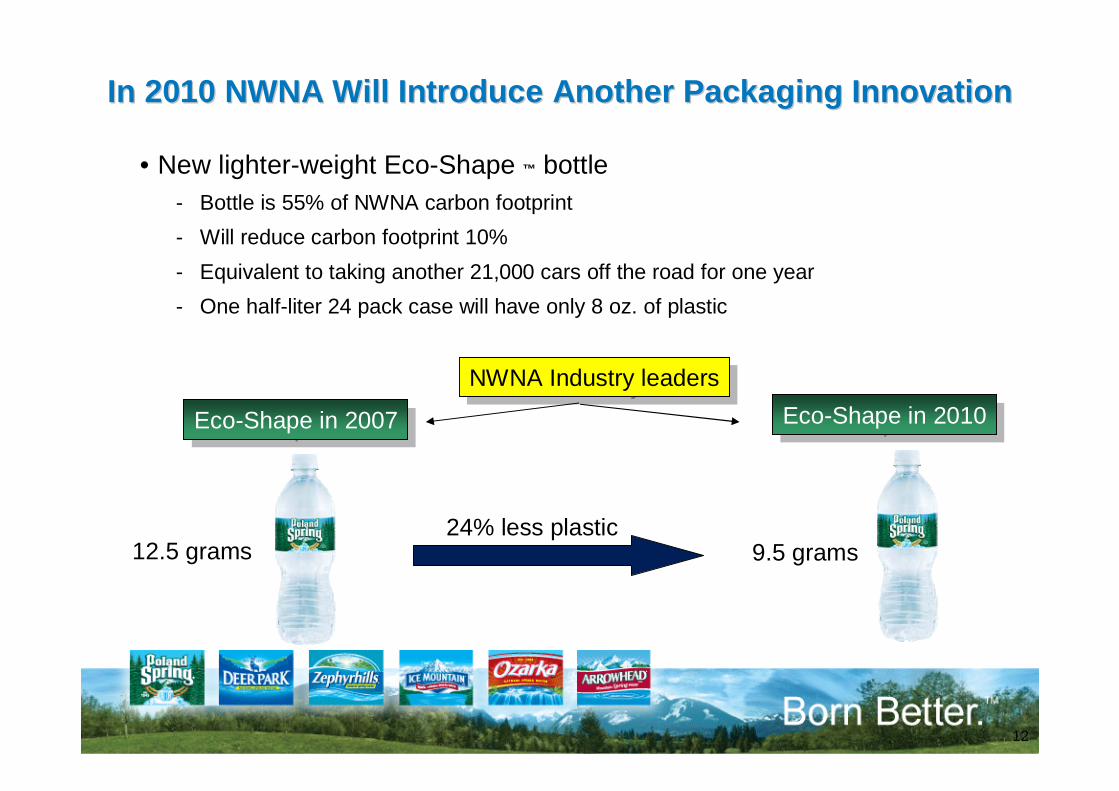
In 2010 NWNA Will Introduce Another Packaging InnovationIn 2010 NWNA Will Introduce Another Packaging Innovation
• New lighter-weight Eco-Shape ™ bottle- Bottle is 55% of NWNA carbon footprint- Will reduce carbon footprint 10% - Equivalent to taking another 21,000 cars off the road for one year- One half-liter 24 pack case will have only 8 oz. of plastic
Eco-Shape in 2007Eco-Shape in 2007
24% less plastic
NWNA Industry leadersNWNA Industry leaders
12.5 grams
Eco-Shape in 2010Eco-Shape in 2010
9.5 grams
13
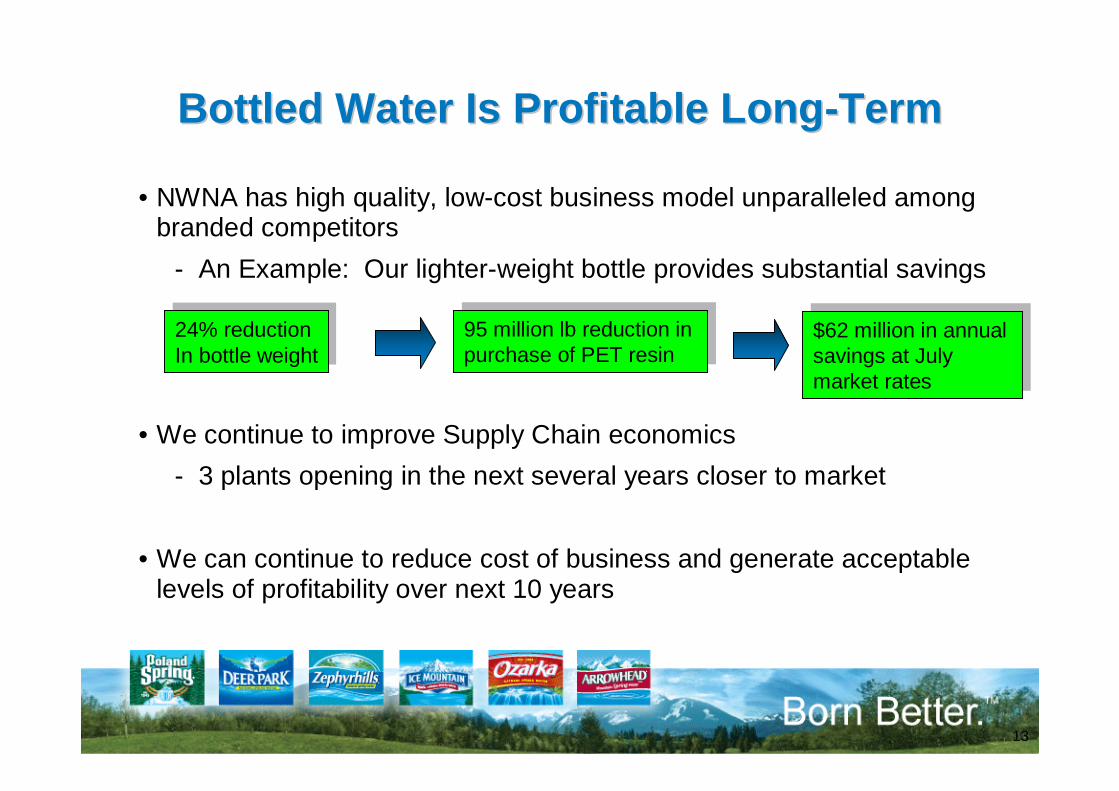
Bottled Water Is Profitable LongBottled Water Is Profitable Long--TermTerm
• NWNA has high quality, low-cost business model unparalleled among branded competitors
- An Example: Our lighter-weight bottle provides substantial savings
• We continue to improve Supply Chain economics- 3 plants opening in the next several years closer to market
• We can continue to reduce cost of business and generate acceptable levels of profitability over next 10 years
24% reduction In bottle weight
24% reduction In bottle weight
95 million lb reduction in purchase of PET resin
95 million lb reduction in purchase of PET resin
$62 million in annual savings at July market rates
$62 million in annual savings at July market rates
14
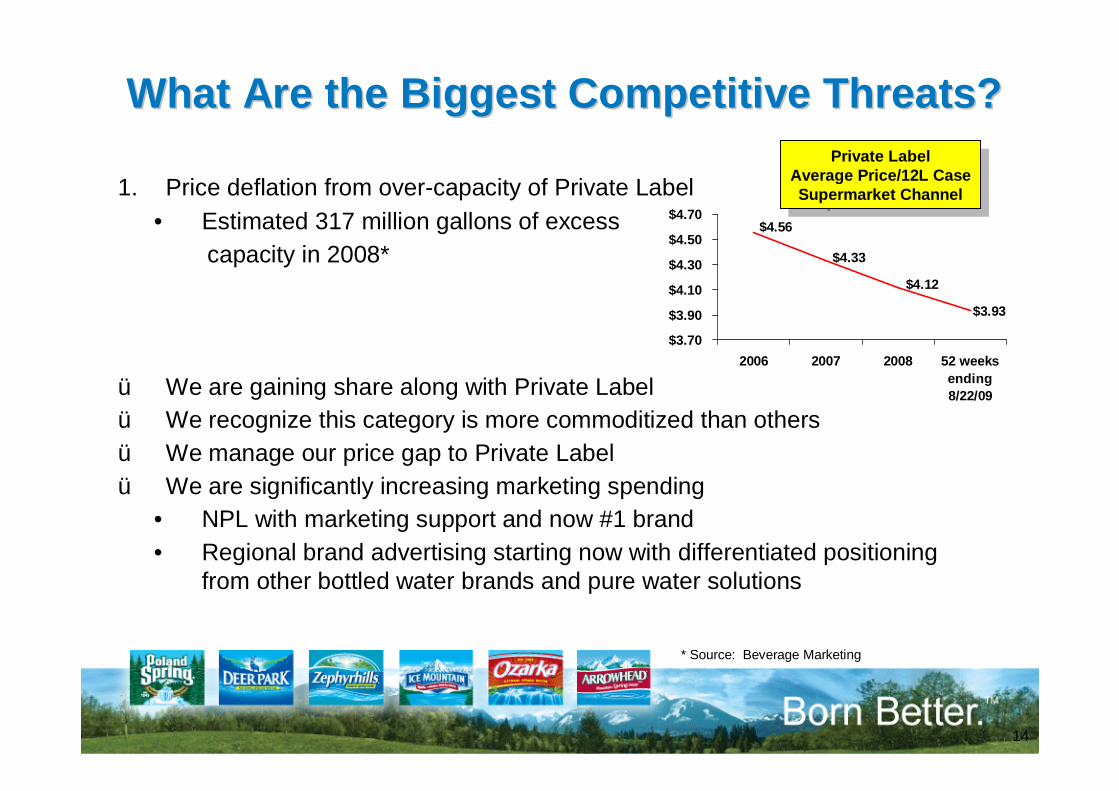
What Are the Biggest Competitive Threats?What Are the Biggest Competitive Threats?
1. Price deflation from over-capacity of Private Label • Estimated 317 million gallons of excess
capacity in 2008*
ü We are gaining share along with Private Labelü We recognize this category is more commoditized than othersü We manage our price gap to Private Labelü We are significantly increasing marketing spending
• NPL with marketing support and now #1 brand• Regional brand advertising starting now with differentiated positioning
from other bottled water brands and pure water solutions
* Source: Beverage Marketing
$3.93
$4.56
$4.33
$4.12
$3.70
$3.90
$4.10
$4.30
$4.50
$4.70
2006 2007 2008 52 weeksending8/22/09
Private LabelAverage Price/12L CaseSupermarket Channel
Private LabelAverage Price/12L CaseSupermarket Channel
15
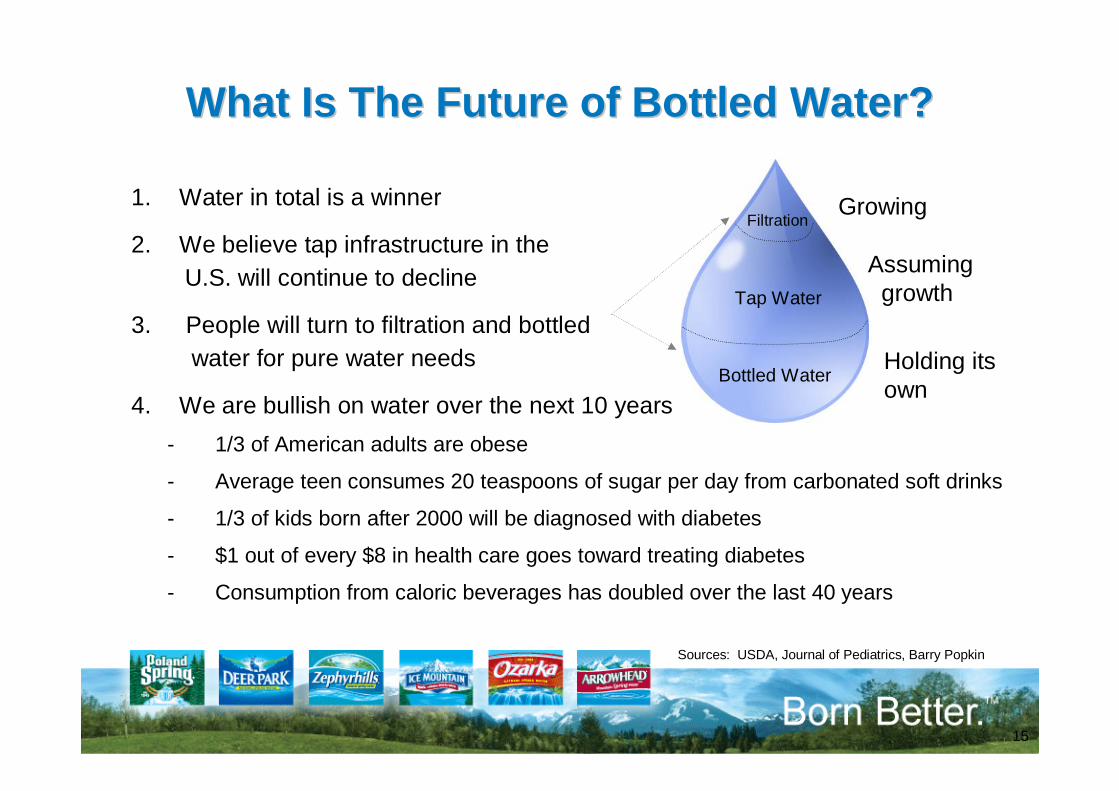
What Is The Future of Bottled Water?What Is The Future of Bottled Water?
1. Water in total is a winner
2. We believe tap infrastructure in the U.S. will continue to decline
3. People will turn to filtration and bottled water for pure water needs
4. We are bullish on water over the next 10 years- 1/3 of American adults are obese
- Average teen consumes 20 teaspoons of sugar per day from carbonated soft drinks
- 1/3 of kids born after 2000 will be diagnosed with diabetes
- $1 out of every $8 in health care goes toward treating diabetes
- Consumption from caloric beverages has doubled over the last 40 years
Filtration
Tap Water
Bottled Water
Growing
Assuming growth
Holding its own
Sources: USDA, Journal of Pediatrics, Barry Popkin

16
QuestionsQuestions