Embed Size (px)
Citation preview

THE FUNCTIONAL ASSESSMENT OF FLUORECENTLY TAGGED ADENOSINE A2A AND
DOPAMINE D2 RECEPTORS AND QUALITATIVE ANALYSIS OF DIMERIZATION OF
ADENOSINE A2A AND DOPAMINE D2 RECEPTOR BY USING FRET
A THESIS SUBMITTED TO
THE GRADUATE SCHOOL OF NATURAL AND APPLIED SCIENCES
OF
MIDDLE EAST TECHNICAL UNIVERSITY
BY
SELİN AKKUZU
IN PARTIAL FULFILLMENT OF THE REQUIREMENTS
FOR
THE DEGREE OF MASTER OF SCIENCE
IN
BIOLOGY
JANUARY 2013
Approval of the Thesis
THE FUNCTIONAL ASSESSMENT OF FLUORECENTLY TAGGED ADENOSINE A2A AND
DOPAMINE D2 RECEPTORS AND QUANTITATIVE ANALYSIS OF DIMERIZATION OF
ADENOSINE A2A AND DOPAMINE D2 RECEPTOR BY USING FRET
Submitted by SELİN AKKUZU in partial fulfillment of the requirement for the degree of Master of
Science in Biology Department, Middle East Technical University by,
Prof. Dr. Canan Özgen ______________
Dean, Graduate School of Natural and Applied Sciences
Prof. Dr. Gülay Özcengiz ______________
Head of the Department, Biology
Assoc. Prof. Dr. Çağdaş D. Son ______________
Supervisor, Biology Dept., METU
Examining Committee Members
Prof. Dr. Mahinur Akkaya _______________
Chemistry Dept., METU
Assoc. Prof. Dr. Çağdaş D. Son _______________
Biological Sciences Dept., METU
Assist. Prof. Dr. Hakan Kayır _______________
Medical Pharmacology Dept., GATA
Asssoc. Prof. Dr. Mayda Gürsel _______________ Biological Sciences Dept., METU
Assist. Prof. Dr. Tülin Yanık _______________
Biological Sciences Dept., METU
Date: 28/ 01/2013

iii
I hereby declare that all information in this document has been obtained and presented in
accordance with academic rules and ethical conduct. I also declare that, as required by these rules
and conduct, I have fully cited and referenced all material and results that are not original to this
work.
Name, Last Name : Selin AKKUZU
Signature :
iv
ABSTRACT
THE FUNCTIONAL ASSESSMENT OF FLUORECENTLY TAGGED ADENOSINE A2A AND DOPAMINE D2 RECEPTORS AND QUALITATIVE ANALYSIS OF DIMERIZATION OF
ADENOSINE A2A AND DOPAMINE D2 RECEPTOR DIMERIZATION BY USING FRET
Akkuzu, Selin
M.Sc., Department of Biology
Supervisor: Assoc. Prof. Dr. Çağdaş D. Son
February 2013, 69 pages
Recently, several studies have demonstrated that G protein coupled receptors exist as homo/heterodimers
or oligomers. Adenosine A2A receptors and dopamine D2 receptors are present as both homo- and
heterodimer. In the GABAergic striatopallidal neurons A2AR are co- localized with D2 receptors (D2R),
and establish functional A2AR-D2R heteromers, which modulates dopaminergic activity. Due to be
involved in physiological processes, these receptors bear critical roles. Dopamine receptors play critical
role in dopaminergic pathways in regulation of memory, food intake and psychomotor activity, etc. On the
other hand, adenosine A2A receptors are involved in the regulations of neurotransmission, immune response and cardiovascular systems. Dopamine D2R andadenosine A2AR have been shown to interact in
striatum and modulate dopaminergic activity
The purpose of this study is to assess the functionality of EGFP (enhanced green fluorescent protein) and
mCherry (a red fluorescent protein) tagged adenosine A2A and dopamine D2 receptors and to detect
homo/ hetero-dimerization of these receptors in live cells via Fluorescence Resonance Energy Transfer
(FRET). Understanding the mechanisms of the interaction between adenosine and dopamine signaling will
help us to figure out some molecular mechanism of neurophysiological disorders. Furthermore, the
fluorescence based live cell model could be used to observe the effects of potential anti-psychotic drugs on
the interaction of these two receptors.
Keywords: Dopamine D2R, Adenosine A2AR, GPCR Heterodimerization, GPCR Homodimerization,
FRET
v
ÖZ
FLORESAN MOLEKÜLLER İLE İŞARETLENMİŞ ADENOZİN A2A VE DOPAMİN D2 RESEPTÖRLERİNİ İŞLEVSEL TESPİTİ VE RESEPTÖRLERİN EŞLEŞMESİNİN FRET ANALİZİ
İLE KANTİTATİF DEĞERLENDİRİLMESİ
Akkuzu, Selin
Yüksek Lisans, Biyoloji Bölümü
Tez Yöneticisi : Doç. Dr. Çağdaş D. Son
Ocak 2013, 69 Sayfa
Son zamanlarda yapılan çalışmalar, birçok G proteine kenetli reseptörün (GPKR) homodimer ve
heterodimer olarak bulunduklarını ileri sürmektedir. Adenozin A2A ve dopamin D2 receptörleri hem
homodimer hem de heterodimer olarak bulunmaktadırlar. A2A receptörleri GABAergic striatopallidal
nöronlarında D2 reseptörü ile fonskiyonel A2AR-D2R heteromerini olustururlar. Bu heteromerlerinj
dopaminerjik aktiviteyi düzenlenledikleri tespit edilmiştir. Her iki reseptör de fizyolojik olaylarda kritik
roller oynamaktadır. Dopamine reseptörleri, hafızanın düzenlenmesini, besin alımını, ve psikomotor kontrol eden dopaminerjik sistemin anahtar noktasıdır. Öte yandan, Adenozin A2A reseptörünün, sinirsel
iletim, kardiyovasküler sistem ve vücudun bağışıklık sisteminde örevleri vardır. Dopamine D2 ve
adenozin A2A reseptörlerinin striatumda eşleştikleri ve dopaminerjik aktiviteyi düzenledikleri
österilmiştir.
Bu çalışmanın amacı; EGFP ( eliştirilmiş yeşil floresan protein) ve mCherry (kırmızı floresan protein
türevi) floresan proteinleriyle işretlenmiş A2A ve D2 reseptörlerinin işlevsel tespitinin yapılması ve
Floresan Rezonans Enerji Transferi (FRET) yöntemine dayanarak aralarında oluşan etkileşimi tespit
etmektir. Dopamin-adenozin sinyal yolaklarının etkileşimlerinin mekanizmalarını anlamak için yeni yollar
açacaktır. Böylelikle, bazı nörofizyolojik olayların ve bozuklukların da moleküler mekanizmalarının
anlaşılmasına katkıda bulunulacaktır. Ayrıca tasarlanan floresan tabanlı canlı hücre modeli, potansiyel anti-psikotik ilaçların bu iki reseptörün eşleşmesi üzerine etkilerinin tespiti için kullanılabilecektir.
Anahtar Kelimeler: Dopamin D2R, Adenozin A2AR, GPKR Heterodimerizasyonu, ve
homodimerizasyonu , FRET

vi
To my family

vii
ACKNOWLEDGEMENTS
I would firstly like to present my deepest ratitude to my supervisor Assoc. Prof. Dr. Çağdaş D. SON,
without whom this thesis study would be neither started nor completed. I owe him a lot for his endless moral support, guidance, encouragement, tolerance, patience and understanding. I cannot feel luckier to
work with such a great mentor. I will always be grateful to him in my entire academic life.
I also want to thank the members of thesis examining committee; Prof. Dr. Mahinur Akkaya, Assist. Prof.
Dr. Mayda Gürsel, Assist. Prof. Dr. Tülin Yanık, Assist. Prof. Dr. Hakan Kayır for evaluatin this thesis;
and their invaluable suggestions and comments to make the final version of this thesis better.
I should also acknowled e the members of SON’s Lab., all of who supported, trusted and believed me to
complete this Master’s thesis. I appreciate their efforts to make SON’s Lab. a better place and workin
environment not only scientifically, but also socially.
I would like to thank UNAM for Confocal Microscopy Facilities, which allowed taking confocal microscopy images presented in this study. I should here mention the contributions of Assoc. Prof. Dr. A.
Elif ERSON BENSAN who kindly allowed me takin luminescence measurements in her laboratory. I
would also like to thank Assist. Prof. Dr. Tülin YANIK for providin N2a cell line and Assist. Prof. Dr.
Hakan KAYIR for providing the agonist of dopamine receptor and the drug, namely agmatine, used in this
project.
I couldn’t have completed this thesis without thankin my dearest friends; Bil i Gün ör, Cansaran
Say ılı, Mümine Küçükdemir, Ilknur Telkes, Sevim Osmano lu and Murat Özyeşer without whom I
could not progress this far to the end of this thesis study. They are not only friends but also advisors to me.
They always supported, helped and cheered me up in hard times. They also aided a lot in scientific
discussions about my project and gave advises to make some procedures better and easier. I can say by heart that these two years of master study would not be so good without their friendship. I deeply thank
them for always being there for me and helping me at all times.
Finally, but not the least; I would like to express my thanks to my parents, Meral Akkuzu and Zeki
Akkuzu my sister Pelin Engez, my aunt Melahat Döner, my sister’s husband Kerem En ez , my nephew
İrem En ez and my randmother Mesude Peynircioğlu for believin and encoura in me throu hout all
my education years and being my first teachers and advisors. They are who prepared me for science and
taught very basics of my knowledge in the first place.
This work is supported by Marie Curie Actions, International Reintegration Grant (IRG) and METU
internal research funds with the project number BAP- 08-11-2010-R17.
viii
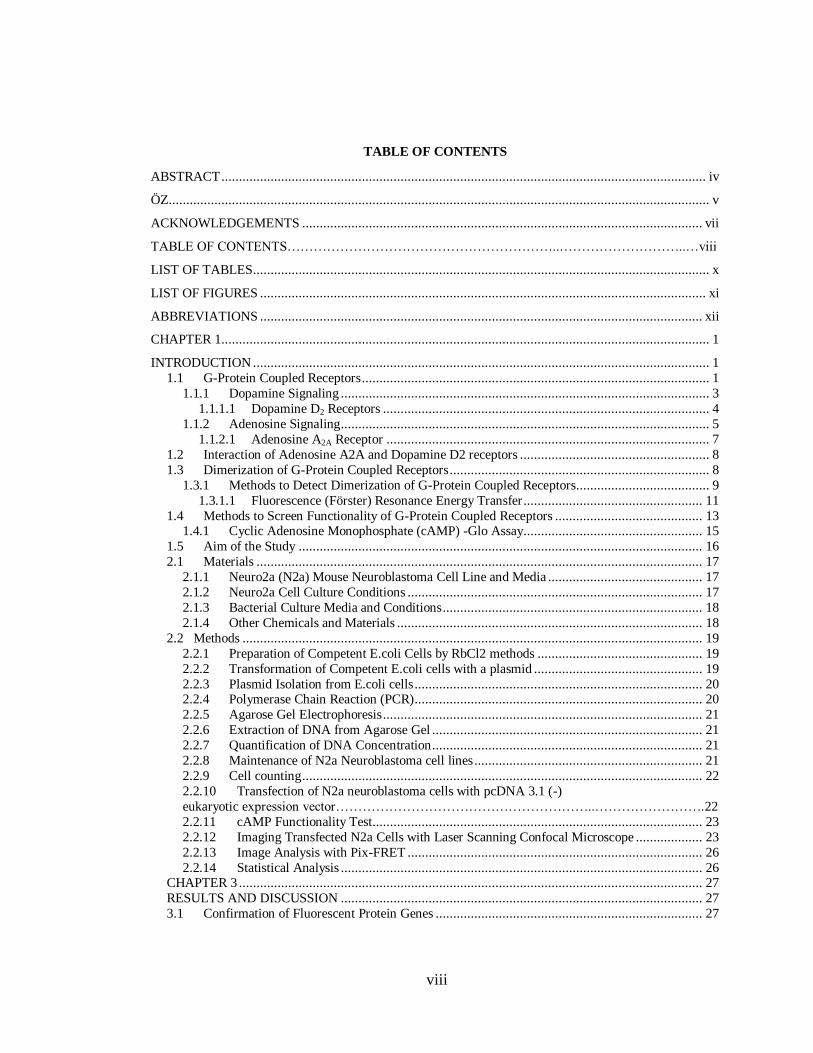
TABLE OF CONTENTS
ABSTRACT .......................................................................................................................................... iv
ÖZ.......................................................................................................................................................... v
ACKNOWLEDGEMENTS .................................................................................................................. vii
TABLE OF CONTENTS……………………………………………………..………………………..…viii
LIST OF TABLES .................................................................................................................................. x
LIST OF FIGURES ............................................................................................................................... xi
ABBREVIATIONS .............................................................................................................................. xii
CHAPTER 1........................................................................................................................................... 1
INTRODUCTION .................................................................................................................................. 1
1.1 G-Protein Coupled Receptors ................................................................................................... 1
1.1.1 Dopamine Signaling ......................................................................................................... 3
1.1.1.1 Dopamine D2 Receptors ............................................................................................. 4
1.1.2 Adenosine Signaling ......................................................................................................... 5
1.1.2.1 Adenosine A2A Receptor ............................................................................................ 7
1.2 Interaction of Adenosine A2A and Dopamine D2 receptors ...................................................... 8
1.3 Dimerization of G-Protein Coupled Receptors .......................................................................... 8
1.3.1 Methods to Detect Dimerization of G-Protein Coupled Receptors ...................................... 9
1.3.1.1 Fluorescence (Förster) Resonance Energy Transfer ................................................... 11
1.4 Methods to Screen Functionality of G-Protein Coupled Receptors .......................................... 13 1.4.1 Cyclic Adenosine Monophosphate (cAMP) -Glo Assay................................................... 15
1.5 Aim of the Study ................................................................................................................... 16
2.1 Materials ............................................................................................................................... 17
2.1.1 Neuro2a (N2a) Mouse Neuroblastoma Cell Line and Media ............................................ 17
2.1.2 Neuro2a Cell Culture Conditions .................................................................................... 17
2.1.3 Bacterial Culture Media and Conditions .......................................................................... 18
2.1.4 Other Chemicals and Materials ....................................................................................... 18
2.2 Methods ................................................................................................................................... 19
2.2.1 Preparation of Competent E.coli Cells by RbCl2 methods ............................................... 19
2.2.2 Transformation of Competent E.coli cells with a plasmid ................................................ 19
2.2.3 Plasmid Isolation from E.coli cells .................................................................................. 20 2.2.4 Polymerase Chain Reaction (PCR) .................................................................................. 20
2.2.5 Agarose Gel Electrophoresis ........................................................................................... 21
2.2.6 Extraction of DNA from Agarose Gel ............................................................................. 21
2.2.7 Quantification of DNA Concentration ............................................................................. 21
2.2.8 Maintenance of N2a Neuroblastoma cell lines ................................................................. 21
2.2.9 Cell counting .................................................................................................................. 22
2.2.10 Transfection of N2a neuroblastoma cells with pcDNA 3.1 (-)
eukaryotic expression vector…………………………………………………..…………………….22
2.2.11 cAMP Functionality Test.............................................................................................. 23
2.2.12 Imaging Transfected N2a Cells with Laser Scanning Confocal Microscope ................... 23
2.2.13 Image Analysis with Pix-FRET .................................................................................... 26
2.2.14 Statistical Analysis ....................................................................................................... 26 CHAPTER 3 .................................................................................................................................... 27
RESULTS AND DISCUSSION ....................................................................................................... 27
3.1 Confirmation of Fluorescent Protein Genes ............................................................................ 27
ix
3.2 Functional Assessment of Fluorescent Protein Tagged Receptors ............................................ 28
3.3 Qualitative Assessment of Dimerization of Fluorescently Tagged Receptors via FRET ........... 32
3.3.1 Homodimerization of Adenosine A2A receptors ............................................................. 32
3.3.2 Homodimerization of Dopamine D2 Receptors ............................................................... 36
3.3.3. Heterodimerization of Adenosine A2A and Dopamine D2 receptors ............................... 41
CHAPTER 4 .................................................................................................................................... 45 CONCLUSION ................................................................................................................................ 45
REFERENCES ..................................................................................................................................... 46
APPENDICIES .................................................................................................................................... 55
A. METABOLIC REACTIONS ............................................................................................................ 55
B. NEURO2A CELL CULTURE MEDIUM ......................................................................................... 60
C. BACTERIAL CULTURE MEDIA PREPARATION ........................................................................ 62
D. BUFFERS AND SOLUTIONS ........................................................................................................ 63
E. PLASMID MAPS............................................................................................................................. 64
F. PRIMERS ........................................................................................................................................ 69
x
LIST OF TABLES
TABLES
Table 1.1 Pharmacolo ical properties of dopamine receptors……………………………………..4
Table 1.2 Biolo ical characteristics of Adenosine Receptor subtypes…………………………….7 Table 2.1 Optimized PCR conditions for amplifyin fluorescent protein enes…………………20
Table B.1 Composition of D-MEM with Hi h Glucose…………………………………………..60
xi
LIST OF FIGURES
FIGURES
Figure 1.1 The representative image of GPCR – seven transmembrane structures………………...1 Figure 1.2 GPCR si nalin ………………………………………………………………………...2
Figure 1.3 Dopamine structure…………………………………………………………………..….3
Figure 1.4 Adenosine structure……………………………………………………………………...6
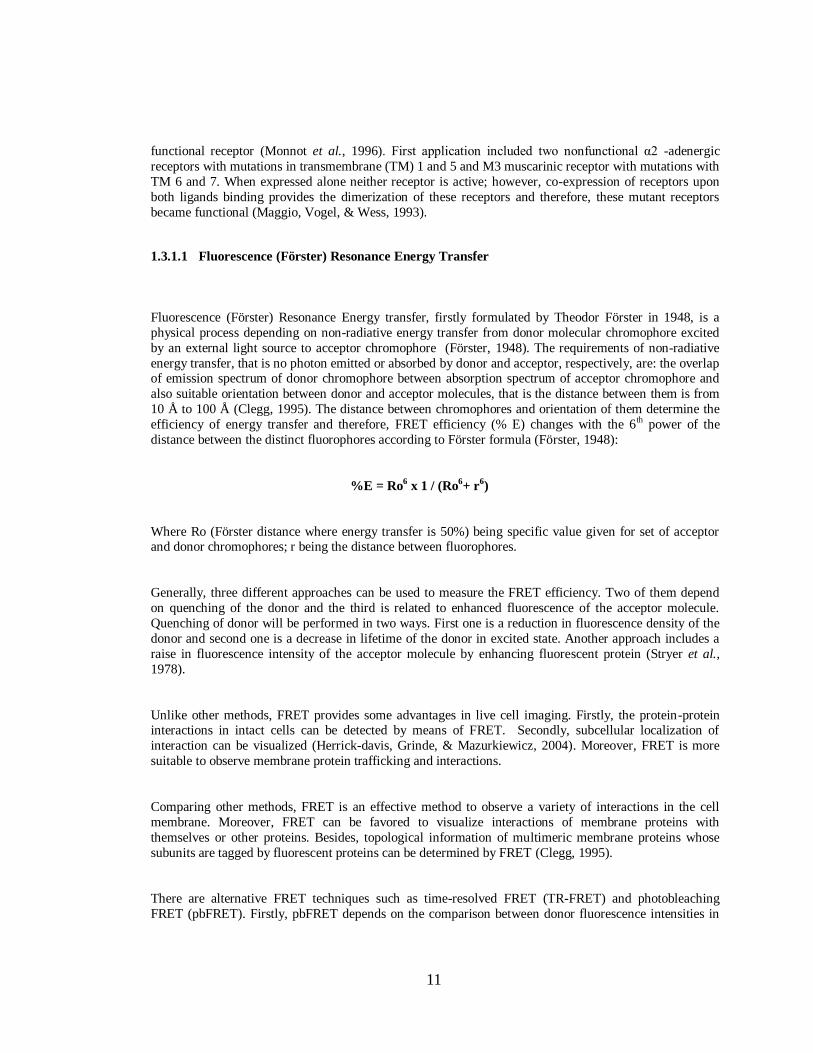
Figure 1.5 Structure of Green Fluorescent Protein (GFP)…………………………………………12
Figure 1.6 Spectroscopic characteristics of EGFP and mCherry…………………………………..13
Figure 1.7 Schematic diagrams of the cAMP-Glo™ Assay…………………………………...…..15
Figure 2.1 Zeiss 510 LSM model……………………………………………………………….....19
Figure 2.2 Track 1 confi urations in laser scannin confocal microscope……………………......24
Figure 2.3 Track 2 confi uration in laser scannin confocal microscope………………………....25
Figure 3.1.1 A arose el photo of PCR product of mCherry and EGFP…………………………....28
Figure 3.2.1 N2a cells transfected with A2AR-EGFP, D2R-EGFP, A2AR-mCherry
and D2R-mCherry in pcDNA 3.1(-)…………………………………………………...29 Figure 3.2.2 Functionality test of Adenosine A2A receptor fused to EGFP and mCherry…………...30
Figure 3.2.3 Functionality tests of Dopamine D2 receptors fused to EGFP and mCherry………….31
Figure 3.3.1 N2a cells transfected with A2AR –EGFP in pcDNA 3.1 (-)…………………………..33
Figure 3.3.2 N2a cells transfected with A2AR –mCherry in pcDNA 3.1 (-)………………………34
Figure 3.3.3 N2a cells transfected with A2AR –EGFP and A2AR –mCherry ……………………..35
Figure 3.3.4 N2a cells transfected with D2R –EGFP in pcDNA 3.1 (-)…………………………….38
Figure 3.3.5 N2a cells transfected with D2R- mCherry in pcDNA 3.1 (-)………………………….39
Figure 3.3.6 N2a cells transfected withD2R –EGFP and D2R-mCherry …………………………...40
Figure 3.3.7 N2a cells transfected with A2AR –EGFP and D2R-mCherry ………………………...42
Figure 3.3.8 N2a cells transfected with A2AR –mCherry and D2R-EGFP ………………………...43
Figure A.1 Metabolic reactions of dopamine……………………………………………………....55 Figure A.2 Intracellular metabolism of adenosine………………………………………………....56
Figure A.3 Extracellular metabolism of adenosine………………………………………………...57
Figure A.4 Conversion of ATP to cAMP by the action of adenylyl cyclase………………………58
Figure A.5 Chemical structure of CGS21680, a selective antagonist of A2A receptor……………..58
Figure A.6 Chemical structure of Quinpirole, a selective a onist of D2 receptor…………………59
Figure E.1 Map of pcDNA 3.1……………………………………………………………………..65
Figure E.2 Coding sequence of A2AR+mCherry fusion…………………………………………..66
Figure E.3 Coding sequence of D2R+mCherry fusion ene………………………………………67
Figure E.4 Coding sequence of A2AR+EGFP fusion ene………………………………………..68
Figure E.5 Coding sequence of D2R+EGFP fusion ene………………………………………….69
xii
ABBREVIATIONS
A2AR Adenosine A2A Receptor
AC Adenylyl Cyclase
ADHD Attention Deficit Hyperactive Disorder ADP Adenosine Diphosphate
AMP Adenosine Monophosphate
ATP Adenosine Triphosphate
bp base pair
BiFC Bimolecular Fluorescence Complementation
BRET Bioluminescence Resonance Energy Transfer
BSA Bovine Serum Albumin
cAMP cyclic AMP
CFP Cyan Fluorescent Protein
CCR5 C-C Chemokine Type 5 Receptor
cDNA Complementary Deoxyribonucleic Acid
CNS Central Nervous System CoIP Co-Immunoprecipitation
D-MEM Dulbecco’s Modified Ea le Medium
D-PBS Dulbecco’s Phosphate Buffered Saline
DNA Deoxyribonucleic Acid
EDTA Ethylenediamine tetraacetic acid
EGFP Enhanced Green Fluorescent Protein
ER Endoplasmic Reticulum
FRET Fluorescence/Förster Resonance Energy Transfer
Gi Inhibitory Gα subunit
Golf Olfactory Gα subunit
Gs Stimulatory Gα subunit GABA γ-amino Butyric Acid
GDP Guanosine Diphosphate
GFP Green Fluorescent Protein
GIRK G-protein gated inward rectifying potassium channels
GnRH Gonadotropin Releasing Hormone
GPCR G-Protein Coupled Receptor
GTP Guanosine Triphosphate
IL Interleukin
kb Kilobase pair
LB Luria Bertani
MAP Mitogen Activated Protein
mCherry monomericCherry mGluR Metabotropic Glutamate Receptor
mRNA Messenger Ribonucleic Acid
N2a Neuro2a
PBS Phosphate Buffered Saline
PCR Polymerase Chain Reaction
PLC Phospholipase C
PLD Phospholipase D
RE Restriction Enzyme
rpm Revolution per Minute
Taq Thermus aquaticus

xiii
TBE Tris Borate EDTA
UV Ultraviolet
YFP Yellow Fluorescent Protein
1
CHAPTER 1
INTRODUCTION
1.1 G-Protein Coupled Receptors
G-Protein Coupled Receptors (GPCRs) belong to the largest integral membrane protein family. It has been
reported that about 1000 genes in human genome encode GPCRs (Kobilka, 2007; Takeda, Kadowaki,
Haga, & Takaesu, 2002). At structural level, GPCRs demonstrate conserved structural features such as
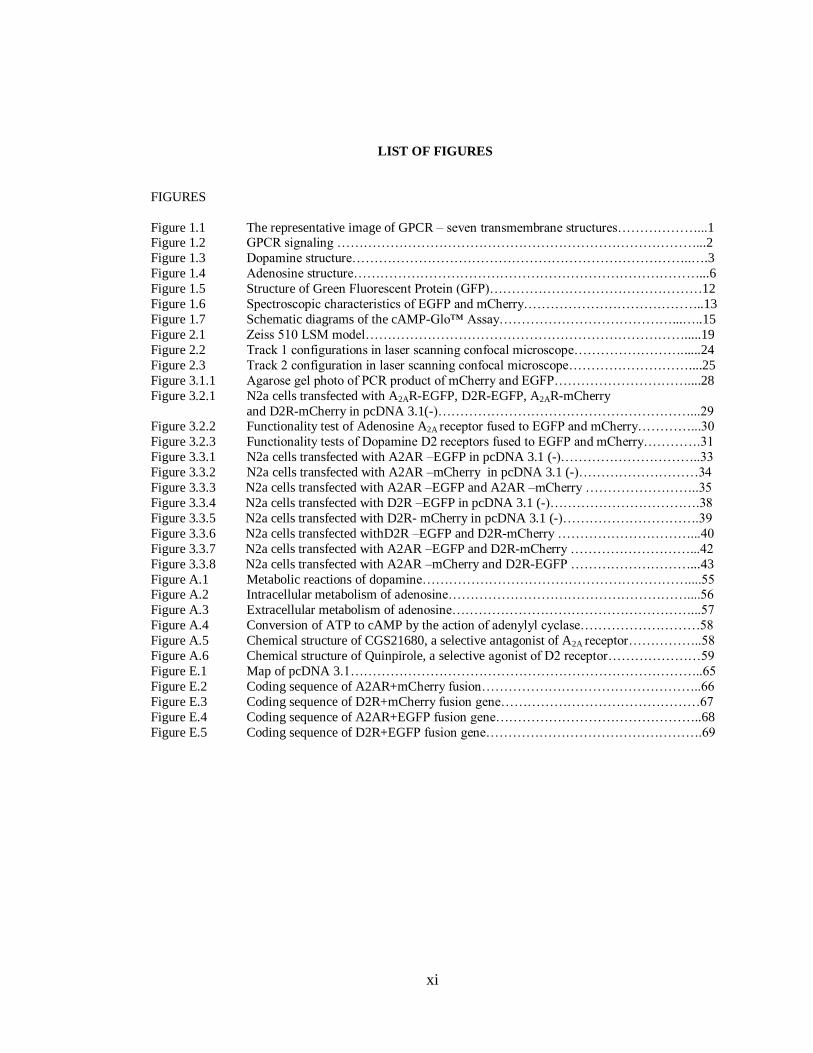
seven trans-membrane alpha helices which are attached by three extracellular and three intracellular loops
with extracellular amino (N)-terminus and intracellular carboxy (C)-terminus (Figure 1.1) (Kobilka, 2007). The conserved motifs and ligand-binding site of receptors are often used to define the subfamilies
of GPCRs and there have been five main subfamilies, namely: adhesion, frizzled/taste 2, glutamate,
rhodopsin and secretin (Fredriksson, Lagerström, Lundin, & Schiöth, 2003; Parrill & Bautista, 2010).
GPCRs have been involved in different signaling processes in response to hormones and neurotransmitter.
Besides, they have been involved in sensory stimulation processes, especially induced by light and
odorants (Rohrer & Kobilka, 1998). Additionally, cellular processes including inflammation, immune
response, cellular differentiation and cell growth are mediated by GPCRs (Bouvier, 2001).
Figure 1.1 The representative image of GPCR – seven transmembrane structures divides the protein into
three domains, the cytoplasmic, the transmembrane and the extracellular domains. (Taken from (© 2002
Judith Klein-Seetharaman, University of Pittsburgh)
As a result of ligand binding to GPCRs, receptors change conformation and the active form of receptor
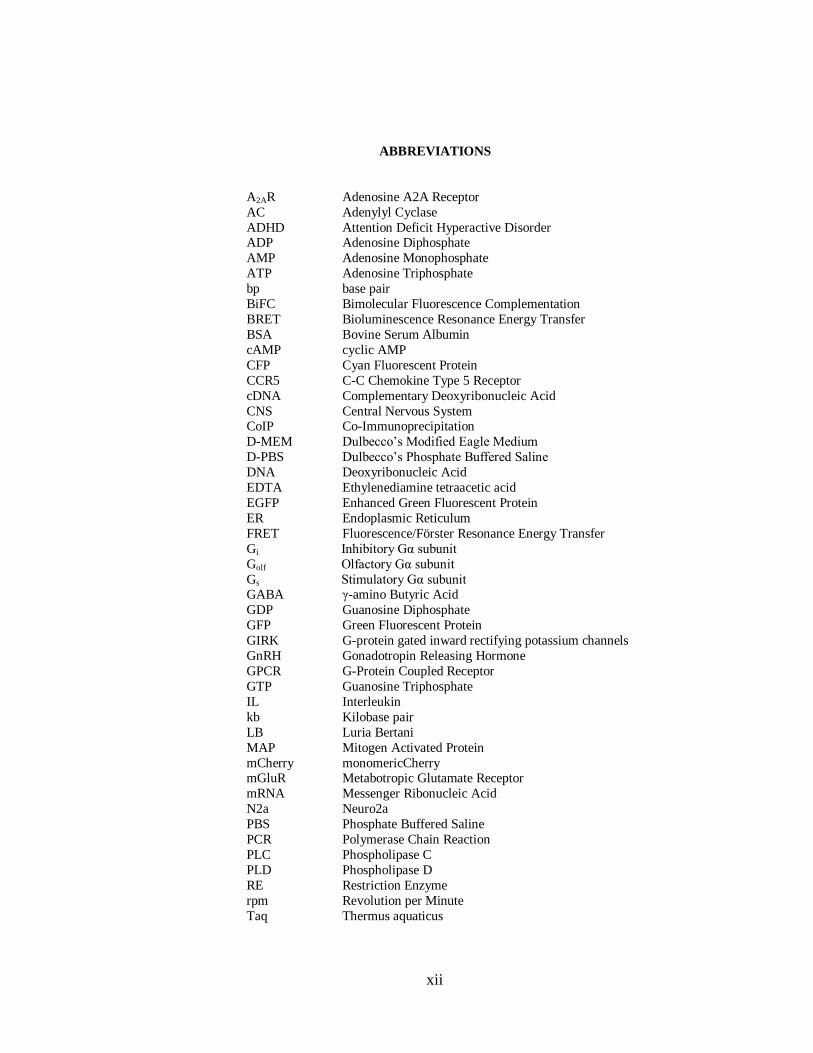
will be stabilized so that the GDP bound to the α subunit will be replaced by GTP, thus heteromeric G
protein (GTP –binding proteins), which is composed of 3 subunits, namely α, β and γ, will be separated
2
from the GPCR and dissociates from each other. When ligand molecules bind to GPCRs, inactive state of
Gα protein, which is bound to GDP, becomes active by replacement of the GDP with GTP; thereby
conformational chan e in G protein occurs and Gα bounded to GTP dissociates from receptor and Gβγ,
Gβγ dissociate from the receptor but stay as a hetero dimer (Lambright et al., 1996). Dissociated
heterotrimeric subunits of G proteins can initiate different signaling cascades. Different subtypes of Gα
exert their effects on different effectors such as ion channels, adenylyl cyclase, and phospholipase C (Neer, 1995) (Fig.1.2). The receptor-mediated activation either inhibits or stimulates these effectors to
change concentrations of molecules such as calcium and cAMP as secondary messengers (Strader, Fong,
Tota, Underwood & Dixon, 1994). Similarly, Gβγ dimer effectors includin PLC2 and 3,
phosphoinositide 3-kinase (PI3 kinase), potassium and calcium channels and importantly, components of
the MAP kinase cascade are regulated by receptor mediated G protein activation (Cabrera-Vera, 2003)
(Fig 1.2).
Figure 1.2 GPCR signaling upon a diverse range of ligand binding and the downstream of several GPCR
pathways (taken from (Dorsam & Gutkind, 2007))
Having critical functions in human physiology makes GPCRs the drug targets of about 25% of total
marketed pharmaceuticals (Haack & McCarty, 2011) . These drugs have been designed considering the
modulations of GPCRs such as G-protein interactions and blocking or activating receptor induced
signaling pathways (Eglen & Reisine, 2011). In the market, mimetic of agonist and antagonist of Drugs
targeting GPCRs have been used against several disorders such as hypertension, allergies, asthma,
psychotic disorders and migraine (Bouvier, 2001). Many next generation drugs like allosteric regulators
have been produced with novel pharmacology also target these receptors (Eglen & Reisine, 2011).
3
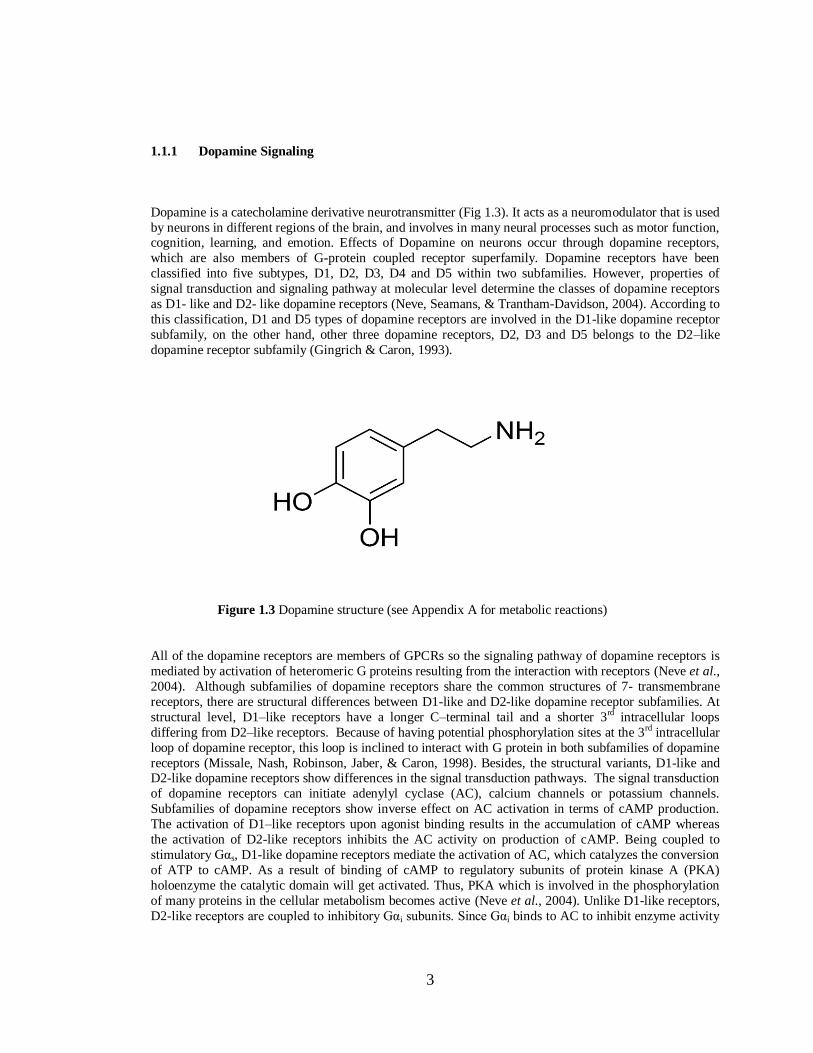
1.1.1 Dopamine Signaling
Dopamine is a catecholamine derivative neurotransmitter (Fig 1.3). It acts as a neuromodulator that is used
by neurons in different regions of the brain, and involves in many neural processes such as motor function, cognition, learning, and emotion. Effects of Dopamine on neurons occur through dopamine receptors,
which are also members of G-protein coupled receptor superfamily. Dopamine receptors have been
classified into five subtypes, D1, D2, D3, D4 and D5 within two subfamilies. However, properties of
signal transduction and signaling pathway at molecular level determine the classes of dopamine receptors
as D1- like and D2- like dopamine receptors (Neve, Seamans, & Trantham-Davidson, 2004). According to
this classification, D1 and D5 types of dopamine receptors are involved in the D1-like dopamine receptor
subfamily, on the other hand, other three dopamine receptors, D2, D3 and D5 belongs to the D2–like
dopamine receptor subfamily (Gingrich & Caron, 1993).
Figure 1.3 Dopamine structure (see Appendix A for metabolic reactions)
All of the dopamine receptors are members of GPCRs so the signaling pathway of dopamine receptors is
mediated by activation of heteromeric G proteins resulting from the interaction with receptors (Neve et al.,
2004). Although subfamilies of dopamine receptors share the common structures of 7- transmembrane
receptors, there are structural differences between D1-like and D2-like dopamine receptor subfamilies. At
structural level, D1–like receptors have a longer C–terminal tail and a shorter 3rd intracellular loops
differing from D2–like receptors. Because of having potential phosphorylation sites at the 3rd intracellular
loop of dopamine receptor, this loop is inclined to interact with G protein in both subfamilies of dopamine
receptors (Missale, Nash, Robinson, Jaber, & Caron, 1998). Besides, the structural variants, D1-like and D2-like dopamine receptors show differences in the signal transduction pathways. The signal transduction
of dopamine receptors can initiate adenylyl cyclase (AC), calcium channels or potassium channels.
Subfamilies of dopamine receptors show inverse effect on AC activation in terms of cAMP production.
The activation of D1–like receptors upon agonist binding results in the accumulation of cAMP whereas
the activation of D2-like receptors inhibits the AC activity on production of cAMP. Being coupled to
stimulatory Gαs, D1-like dopamine receptors mediate the activation of AC, which catalyzes the conversion
of ATP to cAMP. As a result of binding of cAMP to regulatory subunits of protein kinase A (PKA)
holoenzyme the catalytic domain will get activated. Thus, PKA which is involved in the phosphorylation
of many proteins in the cellular metabolism becomes active (Neve et al., 2004). Unlike D1-like receptors,
D2-like receptors are coupled to inhibitory Gαi subunits. Since Gαi binds to AC to inhibit enzyme activity
4
resulting in the decreased cAMP level, D2-like receptors reduce PKA -stimulated phosphorylation (Neve
et al., 2004).
As a neuromodulator, dopamine affects fundamental processes in mammals. Mainly, neural processes
such as reward, learning, motor control, emotion are mediated by dopamine–induced signaling pathways (Gingrich & Caron, 1993). Because of the importance of dopamine in neural processes, the dsyregulation
of the dopamine–induced signaling can be correlated with many pathological disorders such as
Parkinson’s disease, schizophrenia, Tourette’s syndrome, and hyperprolactinemia. The pharmacolo ical
profile of dopamine receptors, in terms of agonists and antagonists are used as a model for drug targeting
against these diseases. To illustrate, as a reducin a ent of hypokineasia in Parkinson’s diseases, and as a
blocking agent of symptoms of schizophrenia such as hallucinations and delusions, agonists and
antagonists of dopamine receptors have been designed, respectively (Missale et al., 1998). Therefore, in
order to manage these conditions, drugs targeting dopaminergic mechanisms have been developed
considering the pharmacological profiles of dopamine receptors including agonists and antagonists (Yao
Wei-Dong, Spealman Roger D, 2008). The pharmacological profiles of dopamine receptors are
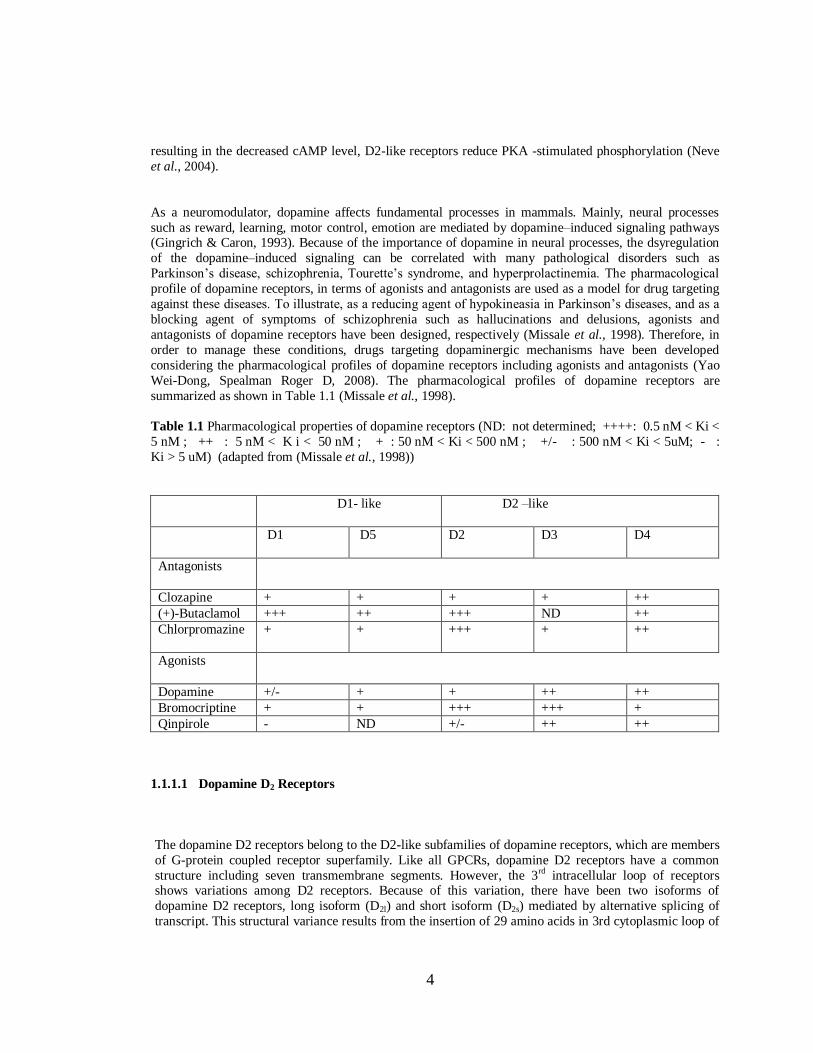
summarized as shown in Table 1.1 (Missale et al., 1998).
Table 1.1 Pharmacological properties of dopamine receptors (ND: not determined; ++++: 0.5 nM < Ki <
5 nM ; ++ : 5 nM < K i < 50 nM ; + : 50 nM < Ki < 500 nM ; +/- : 500 nM < Ki < 5uM; - :
Ki > 5 uM) (adapted from (Missale et al., 1998))
D1- like
D2 –like
D1 D5 D2 D3 D4
Antagonists
Clozapine + + + + ++
(+)-Butaclamol +++ ++ +++ ND ++
Chlorpromazine + + +++ + ++
Agonists
Dopamine +/- + + ++ ++
Bromocriptine + + +++ +++ +
Qinpirole - ND +/- ++ ++
1.1.1.1 Dopamine D2 Receptors
The dopamine D2 receptors belong to the D2-like subfamilies of dopamine receptors, which are members
of G-protein coupled receptor superfamily. Like all GPCRs, dopamine D2 receptors have a common
structure including seven transmembrane segments. However, the 3rd intracellular loop of receptors shows variations among D2 receptors. Because of this variation, there have been two isoforms of
dopamine D2 receptors, long isoform (D2l) and short isoform (D2s) mediated by alternative splicing of
transcript. This structural variance results from the insertion of 29 amino acids in 3rd cytoplasmic loop of
5
long isoform of D2 receptors (D2l) (Dal Toso et al., 1989). This loop seems to be involved in the coupling
of receptor with heteromeric G-proteins (Prou et al., 2001). Despite the insertion on this critical location,
which is involved in the interaction with Gαi functional difference between two isoforms has not been
detected (Missale et al., 1998). Both isoforms of dopamine D2 receptors are coupled to Gαi/olf proteins,
which mediates the D2 dopamine receptor inhibition of adenylate cyclase (Prou et al., 2001). Therefore,
the stimulation of dopamine D2 receptors reduces the PKA–stimulated phosphorylation of proteins (Neve et al., 2004). Both isoforms exert the same effect on signaling pathway when they are expressed in the
cell line; however, in terms of the binding affinity of isoforms to G protein, D2s isoforms have higher
affinity than D2l(Dal Toso et al., 1989). Besides the difference of binding affinity, the amount of D2
dopamine isoforms shows variation among different brain locations (Giros et al., 1989).
In order to understand molecular processes, which mediate dopaminergic effect, the mechanisms
involving the coupling of receptor with Gαi/olf proteins are the most studied modulations. However, there
are other modulations, which are associated with D2R gene (drd2). The studies about alcoholism, co-
morbid depression, anxiety and social dysfunction in untreated veterans with post-traumatic stress disorder
show that drd2 gene is involved in the signaling cascades of these diseases (Lawford, Young, Noble,
Kann, & Ritchie, 2006; Thanos et al., 2005). As a result of dopaminergic regulation, the activation of Akt signaling/glycogen synthase kinase 3 (GSK-3) is induced by dopamine D2 receptors (Beaulieu &
Gainetdinov, 2011). The activation of D2 receptors is involved not only in Akt signaling but also in Wnt
signaling pathway (Min et al., 2011). The inhibition of Wnt pathway via interaction with β-catenin
induced by D2 receptor activation affect the cytosolic level of β-catenin as a transcriptional co-activator
for transcription factor LEF/TCF (lymphoid enhancing factor/T-cell factor) in the nucleus (Cadigan & Liu,
2006). In addition to Akt and Wnt signaling cascades, the activation of the D1-D2 heteromer is linked to
signaling cascade associated with intracellular calcium release (Geor e & O’Dowd, 2007).
Besides the brain areas, dopamine D2 receptors are also expressed, in cardiac tissue. The activation of this
receptor upon agonist binding in cardiac tissue causes the decrease in heart rate and arterial blood pressure (Végh, Papp, Semeraro, Fatehi-Hasanabad, & Parratt, 1998). Agonists of dopamine D2 receptors can be
new therapeutic agents for myocardial ischemia/reperfusion injury inducing cardiomyocyte apoptosis (Li
et al., 2011).
1.1.2 Adenosine Signaling
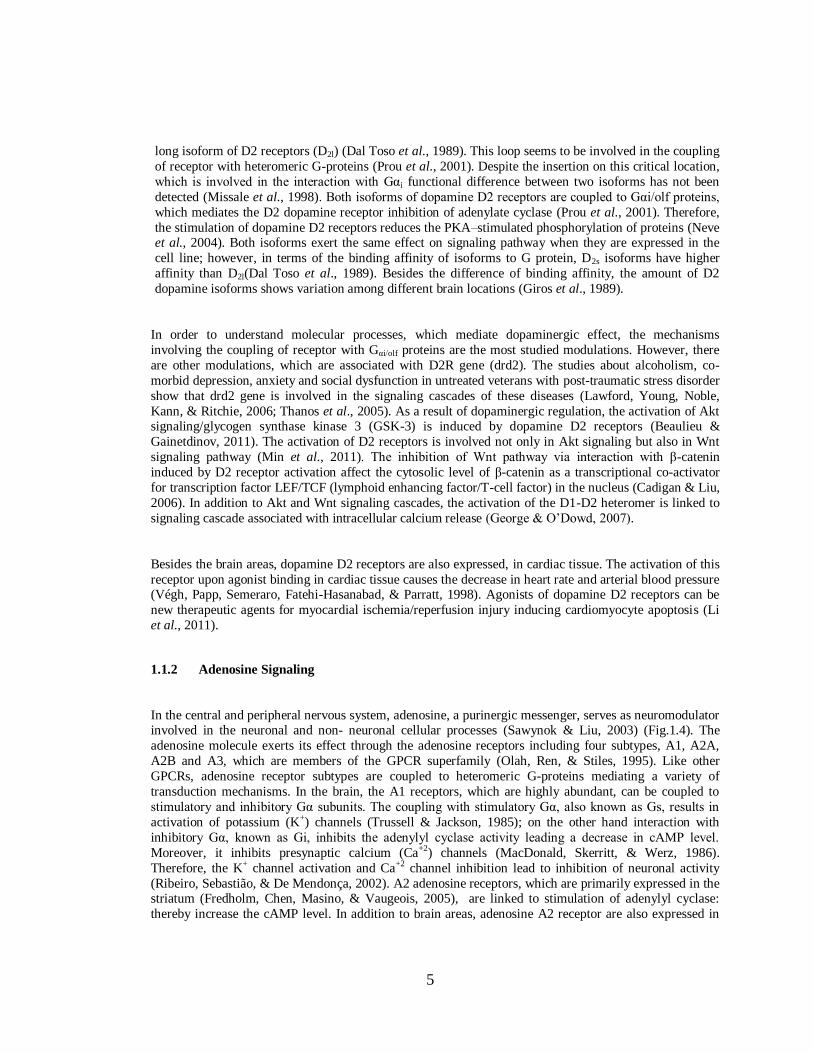
In the central and peripheral nervous system, adenosine, a purinergic messenger, serves as neuromodulator involved in the neuronal and non- neuronal cellular processes (Sawynok & Liu, 2003) (Fig.1.4). The
adenosine molecule exerts its effect through the adenosine receptors including four subtypes, A1, A2A,
A2B and A3, which are members of the GPCR superfamily (Olah, Ren, & Stiles, 1995). Like other
GPCRs, adenosine receptor subtypes are coupled to heteromeric G-proteins mediating a variety of
transduction mechanisms. In the brain, the A1 receptors, which are highly abundant, can be coupled to
stimulatory and inhibitory Gα subunits. The couplin with stimulatory Gα, also known as Gs, results in
activation of potassium (K+) channels (Trussell & Jackson, 1985); on the other hand interaction with
inhibitory Gα, known as Gi, inhibits the adenylyl cyclase activity leadin a decrease in cAMP level.
Moreover, it inhibits presynaptic calcium (Ca+2) channels (MacDonald, Skerritt, & Werz, 1986).
Therefore, the K+ channel activation and Ca+2 channel inhibition lead to inhibition of neuronal activity
(Ribeiro, Sebastião, & De Mendonça, 2002). A2 adenosine receptors, which are primarily expressed in the striatum (Fredholm, Chen, Masino, & Vaugeois, 2005), are linked to stimulation of adenylyl cyclase:
thereby increase the cAMP level. In addition to brain areas, adenosine A2 receptor are also expressed in
6
blood vessels so they exert their effects as a vasodilator effect in the brain (Shi et al., 2007). Unlike A2
receptor, A2B receptors are expressed at different regions of brain excluding striatum, where they are
expressed at medium or low abundance, and also A2B receptors are coupled to Gs; therefore, adenylyl
cyclase and phospholipase C (PLC) are activated. PLC is also activated by A3 adenosine receptor.
Additionally, A3 receptor is involved in regulation of intracellular Ca+2 level by increasing Ca+2 amount
(Dunwiddie & Masino, 2001). As a result of activation of all subtypes of adenosine receptors, adenosine signaling is involved in several metabolic processes including modulation of excitability in the central
nervous systems (CNS), induction of sleep, perception of pain etc. (Benarroch, 2008). Because of the
involvement in serious processes in living organisms, agonists and antagonists of adenosine receptors are
thought to be models for drug targeting in several diseases such as cerebral ischemia, pain, seizures and
Parkinson’s diseases (During, Ryder, & Spencer, 1995; Ribeiro et al., 2002; Sawynok & Liu, 2003;
Schapira et al., 2006).
Figure 1.4 Adenosine structure (see Appendix A for metabolic reactions)
Another regulator affecting adenosine signaling is adenosine concentration. Adenosine transporters,
intracellular and extracellular enzymes are contributed into adenosine signaling under some conditions. To
illustrate, stress conditions trigger the formation of adenosine monophosphate (AMP), as a result of
dephosphorylation of adenosine triphosphate (ATP), and then, AMP is converted to adenosine by the
enzyme, 5` nucleotidase. Intracellular and extracellular adenosine molecules are transported by nucleoside
transporters such as equilibrative nucleoside transporters (ENT) for membrane translocation (King,
Ackley, Cass, Young, & Baldwin, 2006). Intracellular and extracellular adenosine concentration can be
fluctuated under abnormal conditions such as hypoxia, trauma, seizures etc. (Ribeiro et al., 2002). The
biological properties of types of adenosine receptors are summarized in Table 1.2.
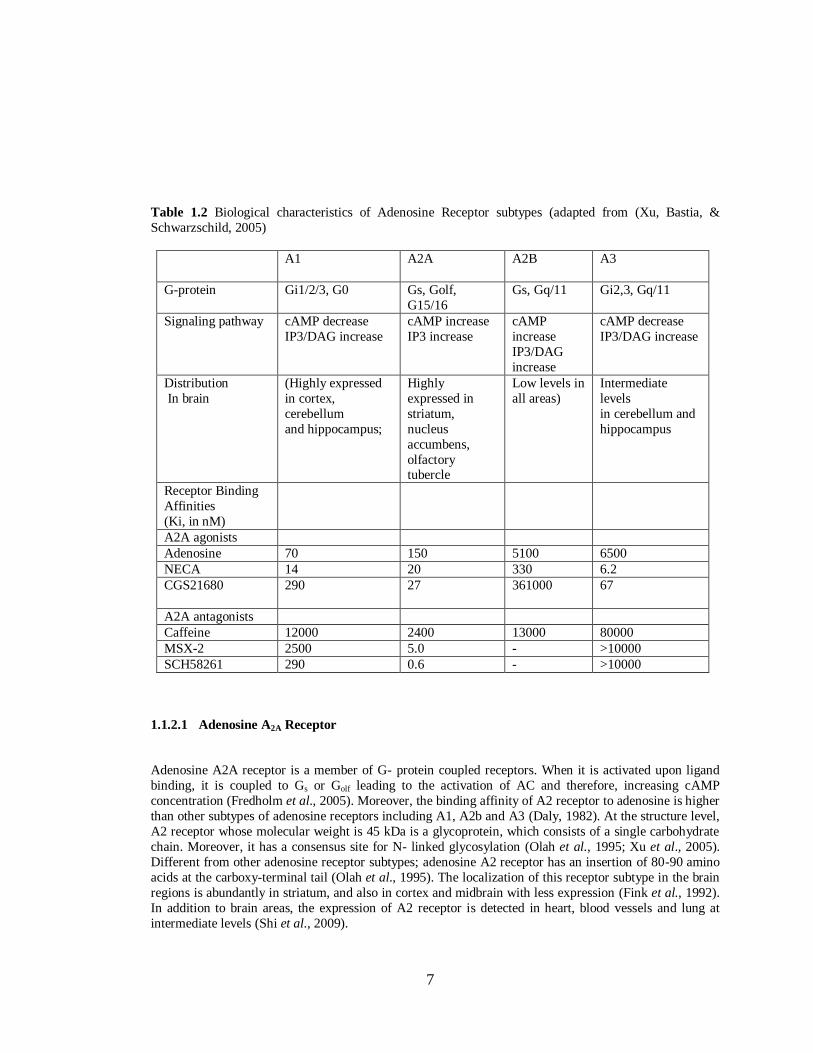
7
Table 1.2 Biological characteristics of Adenosine Receptor subtypes (adapted from (Xu, Bastia, &
Schwarzschild, 2005)
A1 A2A A2B A3
G-protein Gi1/2/3, G0 Gs, Golf,
G15/16
Gs, Gq/11 Gi2,3, Gq/11
Signaling pathway cAMP decrease
IP3/DAG increase
cAMP increase
IP3 increase
cAMP
increase
IP3/DAG
increase
cAMP decrease
IP3/DAG increase
Distribution
In brain
(Highly expressed
in cortex,
cerebellum
and hippocampus;
Highly
expressed in
striatum,
nucleus
accumbens,
olfactory tubercle
Low levels in
all areas)
Intermediate
levels
in cerebellum and
hippocampus
Receptor Binding
Affinities
(Ki, in nM)
A2A agonists
Adenosine 70 150 5100 6500
NECA 14 20 330 6.2
CGS21680 290 27 361000 67
A2A antagonists
Caffeine 12000 2400 13000 80000
MSX-2 2500 5.0 - >10000
SCH58261 290 0.6 - >10000
1.1.2.1 Adenosine A2A Receptor
Adenosine A2A receptor is a member of G- protein coupled receptors. When it is activated upon ligand
binding, it is coupled to Gs or Golf leading to the activation of AC and therefore, increasing cAMP
concentration (Fredholm et al., 2005). Moreover, the binding affinity of A2 receptor to adenosine is higher
than other subtypes of adenosine receptors including A1, A2b and A3 (Daly, 1982). At the structure level,
A2 receptor whose molecular weight is 45 kDa is a glycoprotein, which consists of a single carbohydrate
chain. Moreover, it has a consensus site for N- linked glycosylation (Olah et al., 1995; Xu et al., 2005).
Different from other adenosine receptor subtypes; adenosine A2 receptor has an insertion of 80-90 amino
acids at the carboxy-terminal tail (Olah et al., 1995). The localization of this receptor subtype in the brain
regions is abundantly in striatum, and also in cortex and midbrain with less expression (Fink et al., 1992).
In addition to brain areas, the expression of A2 receptor is detected in heart, blood vessels and lung at
intermediate levels (Shi et al., 2009).
8
Recent studies indicate that A2 adenosine receptors are also expressed on glial cells (Popoli et al., 2007).
As a result of receptor activity in this area, it leads to myelination in some cells such as Schwann cells
(Stevens et al., 2002). The study shows that A2 receptor upon antagonist interaction can be critical for
transition astrocytic response when exposed to some situations such as injury and inflammation.
According to Brambilla et al., selective antagonist of A2 receptor, SCH58261, is optional preventing agent for growth factor induced elongation in cellular mechanisms such as astrogliosis (Brambilla, Cottini,
Fumagalli, Ceruti, & Abbracchio, 2003). It is shown that activation of receptors has neuroprotective effect
on meningitis (Sullivan, Linden, Buster, & Scheld, 1999); on the other hand, its activation induces
ischemic brain injury when they are expressed on bone marrow-derived cells (Yu et al., 2004).
1.2 Interaction of Adenosine A2A and Dopamine D2 receptors
Adenosine A2 and dopamine D2 receptors, which are abundantly expressed in striatopallidal GABA (γ-
aminobutyric acid) containing neurons, exert the antagonistic interaction, in terms of signal transmission
(Ferré et al., 2004; Soriano et al., 2009). Being functionally involved in pathophysiology of disorders
located in basal an lia makes these neurons key point in Parkinson’s disease, dru abuse, as well as
neuroleptics (Canals, Marcellino, et al., 2003). Therefore, this antagonistic interaction is thought to be a
base in order to develop therapeutic approaches against neuropsychiatric diseases such as schizophrenia
and Parkinson’s disease (Ferré et al., 2004).
The interaction between adenosine A2A and dopamine D2 receptors have been demonstrated at
biochemical, behavioral and functional levels. At the biochemical level, this antagonistic interaction can be observed in two outcomes. First one is the stimulation of adenosine A2 receptor upon ligand binding
has antagonistic effect on dopamine D2 receptor so binding affinity of agonist to dopamine D2 receptor
decreases upon stimulation of A2A receptor. (Björklund et al., 1997). Second is that the interaction of
adenosine A2 and dopamine D2 receptor in the intramembrane exerts its effect through Gs/olf - and Gi -
coupling on adenylyl cyclase activity (Ferré et al., 2004). As mentioned before, Adenosine A2 receptor is
coupled to Gs/olf to stimulate the AC activation, which is inhibited by dopamine D2 receptor activation, as
a result of Gi- coupling. Therefore, the cAMP level is affected by this antagonistic interaction, which leads
to contradicting changes in cellular processes such as protein phosphorylation and gene expression
(Hillion et al., 2002).
1.3 Dimerization of G-Protein Coupled Receptors
A novel concept of GPCR dimerization or oligomerization contradicts the classical idea about the
existence and functioning of GPCR as monomeric species (Milligan, 2004). It is shown that, functionally
GPCR can exist as dimers, not only with themselves to form homo-dimers but also with closely or
distantly related other GPCR members to form hetero -dimers (Rios, Jordan, Gomes, & Devi, 2001). The studies about GPCR dimerization have indicated that dimers form early, after biosynthesis, and
dimerization is thought to be involved in receptor maturation. Additionally, dimerization of receptors have
influenced some processes including G-protein coupling, regulatory processes, and downstream/upstream
signaling (Terrillon & Bouvier, 2004). As the initial proof for dimerization, Liang et al showed that the
rhodopsin exist as homo -dimer, as a result of atomic force microscopy (AFM) studies. Moreover, assays
9
deriving from AFM applications demonstrated the oligomeric organization of rhodopsin (Liang et al.,
2003). Similarly, co-immunoprecipitation, bioluminescence resonance energy transfer (BRET) and
fluorescence resonance energy transfer (FRET) studies have been used to visualize or detect the
dimerization of GPCRs. GABAB receptors are evidence that GPCR-GPCR interaction begins during
biosynthesis and can be important for the function of GPCRs (Milligan, 2004). Marshall and her
colleagues demonstrated that GABAB receptors form heterodimer (Marshall, Jones, & Kaupmann, 1999); in order to properly traffic to plasma membrane, GABAB2 subtypes of receptor need GABAB1 subtypes
(Villemure et al., 2005).
Baneres and his colleagues showed that leukotriene B4 (BLT1 receptor) dimers are engaged with only one
heteromeric G-protein after an agonist treatment. By solution phase neutron-scattering experiment, they
proved that GPCRs could exist as a dimer, supporting 2:1 stoichiometry of GPCR: heteromeric bounded
G-protein. Another study about metabotropic glutamate (mGLU) receptors supports the dimerization of
GPCRs, in terms of the operative unit. According to this study, the stimulation with an agonist induces not
only the partial activation of dimers, but also optimal coupling of dimer with G- proteins, as a result of the
activation of double promoter (Kniazeff et al., 2004). Therefore, it can be concluded that GPCRs are
functionally inclined to be dimer. Moreover, GPCRs become dimer in the process of biosynthesis, trafficking and maturation. Many studies including GABAB receptors indicate that the beginning of the
dimerization is early in the biosynthesis, which occurs in the ER. Dimerization in the ER is constitutive;
differ from agonist-induced dimerization (Bulenger, Marullo, & Bouvier, 2005). Like GABAB receptors,
α1D- and α1B–adreno-receptors need to be heterodimerize in ER to be properly expressed at the cell
surface (Hague, Uberti, Chen, Hall, & Minneman, 2004). Furthermore, β2–adrenergic and related
olfactory receptors form hetero-dimers, which is enough to moderate the trafficking of the dimer to cell
membrane (Hague, Uberti, Chen, Bush, et al., 2004). Lastly, hetero-dimerization of taste receptors such as
T1R2 and T1R3 is necessary for the biogenesis of taste receptors (Nelson et al., 2002).
Internalization of GPCR might also be influenced by hetero-dimerization, in terms of agonist–induced GPCR endocytosis(Terrillon & Bouvier, 2004). Several studies demonstrate that induction of only one of
the promoters was enough to lead co-internalization of both receptors in the dimer. δ-opioid /β2 adrener ic
(B. a Jordan, Trapaidze, Gomes, Nivarthi, & Devi, 2001) , SSTR1/SSTR5 somatostatin (Rocheville et al.,
2000) , A2A adenosine/D2 dopamine (Hillion et al., 2002), α2A/β1 adrenergic (Xu et al., 2005),
SSTR2A somatostatin/ μ opioid (Pfeiffer et al., 2002) and α1A/α1b adrener ic (Novi et al., 2005)
receptors are all capable to be co-internalized. Furthermore, cross desensitization in the signaling pathway
promote co-internalization of receptors. Some studies have shown the opposite mechanism, that is hetero-
dimerization of some GPCRs demonstrate negative effect on agonist induced endocytosis (Terrillon &
Bouvier, 2004). To illustrate, the β1AR prevent the a onist-mediated internalization of the β2AR (Lavoie
et al., 2002): similarly, the κ-opioid receptor has inhibitory effect on the endocytosis of both β2AR (B. a
Jordan et al., 2001) and δ-opioid receptors (B. A. Jordan & Devi, 1999).
1.3.1 Methods to Detect Dimerization of G-Protein Coupled Receptors
The experimental approaches including biophysical, biochemical and functional complementation assays
provide the direct or indirect evidence for existence of G-protein coupled receptor dimerization. Additionally, these techniques have been used to investigate both pharmacological and functional
properties of GPCRs (Milligan & Bouvier, 2005). Firstly, as biochemical approach, co-
10
immunoprecipitation (CoIP) has been used to confirm the oligomerization of GPCRs. This method is
based on the ability of an antibody to stably and specifically binding complexes containing a bait protein
that interacts with other proteins as homo/hetero-dimer form. As a type of co–immunopreicipation,
differentially epitope tagged CoIP have been preferred to be used for detection of dimerization of GPCRs,
especially calcium sensing receptors (Ward, Brown, & Harris, 1998) and histamine H2 receptors
(Fukushima et al., 1997). First application of CoIP by Hebert and colleagues was performed to detect receptor dimerization of β2–adrenergic receptors, which were tagged with hemagglutinin (HA) – and c-
myc tags and were co-expressed in insect Sf9 cells. Immunoprecipitation with the anti-HA and anti c-myc
antibody including dimer of receptors were obtained. In order to detect specific interaction, muscarinic
Ach receptor M2 was tagged with c-myc tags, instead of c- myc ta ed β2–adrenergic receptor and it was
expected not to see co-immunoprecipitation between two receptors (Hebert et al., 1996). Beside homo-
dimerization, hetero-dimerization of many GPCRs including dopamine D1 (Ginés et al., 2000), adenosine
A1, bradykinin B2 and angiotensin I receptors (AbdAlla, Lother, & Quitterer, 2000) have been
demonstrated. Although co-immunoprecipitation is mainly preferred to show the GPCR dimerization,
there are some problems with this technique. Major problem or concern in the application of CoIP is false
positives due to aggregation since GPCRs have hydrophobic nature (Rios et al., 2001). In the
solubilization and immunoprecipitation steps, some reagents such as reducing agents are used to reduce
artifactual aggregation of GPCRs; however, using reducing agents sometimes cause a decrease in level of dimer formation (B. A. Jordan & Devi, 1999). In addition to reducing agent, a capping agent affecting
cysteine residues can be used to decrease artifactual aggregation, as a result of formation of disulfide bond
in a receptor (K. Kroeger, Pfleger, & Eidne, 2005). Secondly, biolimunescence resonance energy transfer
(BRET) and fluorescence resonance energy transfer (FRET) methods, as biophysical approaches, have
been used to visualize dimerization of GPCRs in living cells. In BRET method, the energy transfer from
emission of light resulting from degradation of coelenterazine in luciferase to fluorescent protein such as
green fluorescent protein (GFP) is being used to detect the interaction (Milligan, 2004). Angers and his
colleagues carried out first BRET study with β2-adrenergic receptors (Angers, Salahpour, & Bouvier,
2002). In this study, β2-adrenergic receptors were genetically linked with Renilla luciferase (Rluc) and
GFP proteins and then energy transfer between these fluorescent tagged receptors, which were transfected
into same cells, was detected, as a result of constitutive homo-dimerization of β2 -adrenergic receptors (Angers et al., 2002). However, there were some limitations in this study. One of these limitations is that
low sensitivity of this method is not favorable for subcellular localization, in terms of dimerization of
GPCRs. To overcome the problem, low sensitivity, more sensitive cameras and/ or luminescence donors
which can give higher light output can be used (Milligan & Bouvier, 2005). BRET method was used to
visualize dimerization of other GPCRs such as δ opioid receptors (McVey et al., 2001) and thyrotropin-
releasing hormone receptors (K. M. Kroeger, Hanyaloglu, Seeber, Miles, & Eidne, 2001). In addition to
homo-dimerization, hetero-dimerization can be detected by BRET method. Similar to BRET, fluorescence
resonance energy transfer (FRET) technique has been carried out by using donor molecules and acceptor
molecules. Different from BRET, external light source is used to excite donor molecule, which is a variant
of fluorescent protein in most cases. If the distance between two fluorescent protein tagged proteins is less
than 100 Å, the energy from excited donor molecule can be transferred to acceptor molecule and the
acceptor molecule can be excited (Clegg, 1995). Therefore, FRET methods allow direct access to obtain the information of the interactions of two proteins in living cells in nanometer scale. For instance, Overton
and his collo ues visualized the oli omer structure of the GPCR that is α-factor receptor, the product of
the STE2 gene in the yeast Saccharomyces cerevisiae (Overton & Blumer, 2000). In addition to
oligomerization of Ste2p, the dimerization of gonadotropin releasing hormone (GnRH) receptor, which is
mediated upon agonist binding, was detected using FRET method with GFP and red fluorescent protein
(RFP) (Cornea, Janovick, Maya-Núñez, & Conn, 2001). Moreover, luteinizing hormone (LH) receptor
dimerization was shown by FRET via labeling hormone with two different flourophores (Roess & Smith,
2003). In addition to biophysical and biochemical assays, functional complementation assay is another
technique to detect dimerization of GPCRs. This method based on direct protein-protein interaction has
two receptors, which are nonfunctional GPCR mutants that are capable to reconstitute agonist -mediated
11
functional receptor (Monnot et al., 1996). First application included two nonfunctional α2 -adenergic
receptors with mutations in transmembrane (TM) 1 and 5 and M3 muscarinic receptor with mutations with
TM 6 and 7. When expressed alone neither receptor is active; however, co-expression of receptors upon
both ligands binding provides the dimerization of these receptors and therefore, these mutant receptors
became functional (Maggio, Vogel, & Wess, 1993).
1.3.1.1 Fluorescence (Förster) Resonance Energy Transfer
Fluorescence (Förster) Resonance Energy transfer, firstly formulated by Theodor Förster in 1948, is a
physical process depending on non-radiative energy transfer from donor molecular chromophore excited
by an external light source to acceptor chromophore (Förster, 1948). The requirements of non-radiative
energy transfer, that is no photon emitted or absorbed by donor and acceptor, respectively, are: the overlap of emission spectrum of donor chromophore between absorption spectrum of acceptor chromophore and
also suitable orientation between donor and acceptor molecules, that is the distance between them is from
10 Å to 100 Å (Clegg, 1995). The distance between chromophores and orientation of them determine the
efficiency of energy transfer and therefore, FRET efficiency (% E) changes with the 6th power of the
distance between the distinct fluorophores according to Förster formula (Förster, 1948):
%E = Ro6 x 1 / (Ro
6+ r
6)
Where Ro (Förster distance where energy transfer is 50%) being specific value given for set of acceptor and donor chromophores; r being the distance between fluorophores.
Generally, three different approaches can be used to measure the FRET efficiency. Two of them depend
on quenching of the donor and the third is related to enhanced fluorescence of the acceptor molecule.
Quenching of donor will be performed in two ways. First one is a reduction in fluorescence density of the
donor and second one is a decrease in lifetime of the donor in excited state. Another approach includes a
raise in fluorescence intensity of the acceptor molecule by enhancing fluorescent protein (Stryer et al.,
1978).
Unlike other methods, FRET provides some advantages in live cell imaging. Firstly, the protein-protein interactions in intact cells can be detected by means of FRET. Secondly, subcellular localization of
interaction can be visualized (Herrick-davis, Grinde, & Mazurkiewicz, 2004). Moreover, FRET is more
suitable to observe membrane protein trafficking and interactions.
Comparing other methods, FRET is an effective method to observe a variety of interactions in the cell
membrane. Moreover, FRET can be favored to visualize interactions of membrane proteins with
themselves or other proteins. Besides, topological information of multimeric membrane proteins whose
subunits are tagged by fluorescent proteins can be determined by FRET (Clegg, 1995).
There are alternative FRET techniques such as time-resolved FRET (TR-FRET) and photobleaching
FRET (pbFRET). Firstly, pbFRET depends on the comparison between donor fluorescence intensities in
12
the cell before and after disrupting the acceptor fluorescence molecule via photobleaching. FRET is
detected according to an increase of donor fluorescence on photobleached acceptor. The main problems in
pbFRET are the background fluorescence, which arises from cellular autofluorescence, and a decrease in
the signal to noise ratio. However, use of TR-FRET can be a solution for these concerns since TR-FRET
involves the measurement of effect of an acceptor molecule on decay profile of a donor molecule that is
excited with a short laser pulse (Klostermeier & Millar, 2002). As a result of short laser pulse, cellular autofluorescence will be decreased when compared with that after long-term laser exposures and also
there is an increase in the signal to noise ratio. The advantage of this derivative FRET is being
independent of concentration of donor and acceptor molecules; on the other hand, continuous excitation
damages the fluorophore so that same sample cannot be analyzed for a long time (K. M. Kroeger et al.,
2001).
The most commonly used fluorescent protein in literature is green fluorescent protein (GFP) from Victoria
aequrea, jellyfish discovered by Shimomura and his colleagues (Shimomura, Johnson, & Saiga, 1962).
GFP and its colored variants, which have a wide range of spectral properties, are used as FRET pairs in
many studies. At structural level, a choromophore within a molecule, which is responsible for color of a
molecule of GFP, is p-hydroxybenzylideneimidazolinone in native protein (Cody, Prasher, Westler, Prendergast, & Ward, 1993) (Fig. 1.5).
Figure 1.5 Structure of Green Fluorescent Protein (GFP)
In many studies involving GPCR dimerization, the variants of GFP, mainly cyan fluorescent protein
(CFP) and yellow fluorescent protein (YFP), have been used as donor and acceptor chromophores,
respectively. (K. M. Kroeger et al., 2001). For example, the dimerization of yeast α-factor receptor (Overton & Blumer, 2000), dopamine D2 receptor (Wurch, Matsumoto, & Pauwels, 2001) complement
C5A receptors (Floyd et al., 2003) and neuropeptide Y receptor dimers (Dinger, Bader, Kóbor,
Kretzschmar, & Beck-Sickinger, 2003) have been detected via FRET method using CFP and YFP.
Besides CFP and YFP, red fluorescent protein (RFP) and green fluorescent protein (GFP) have been used
extensively in FRET studies (Latif, Graves, & Davies, 2002).
Recently, other FRET pairs such as enhanced GFP (EGFP), and mCherry, a derivative of a red fluorescent
protein find use in many studies (Shaner et al., 2008). EGFP has large Strokes shift and good brightness
13
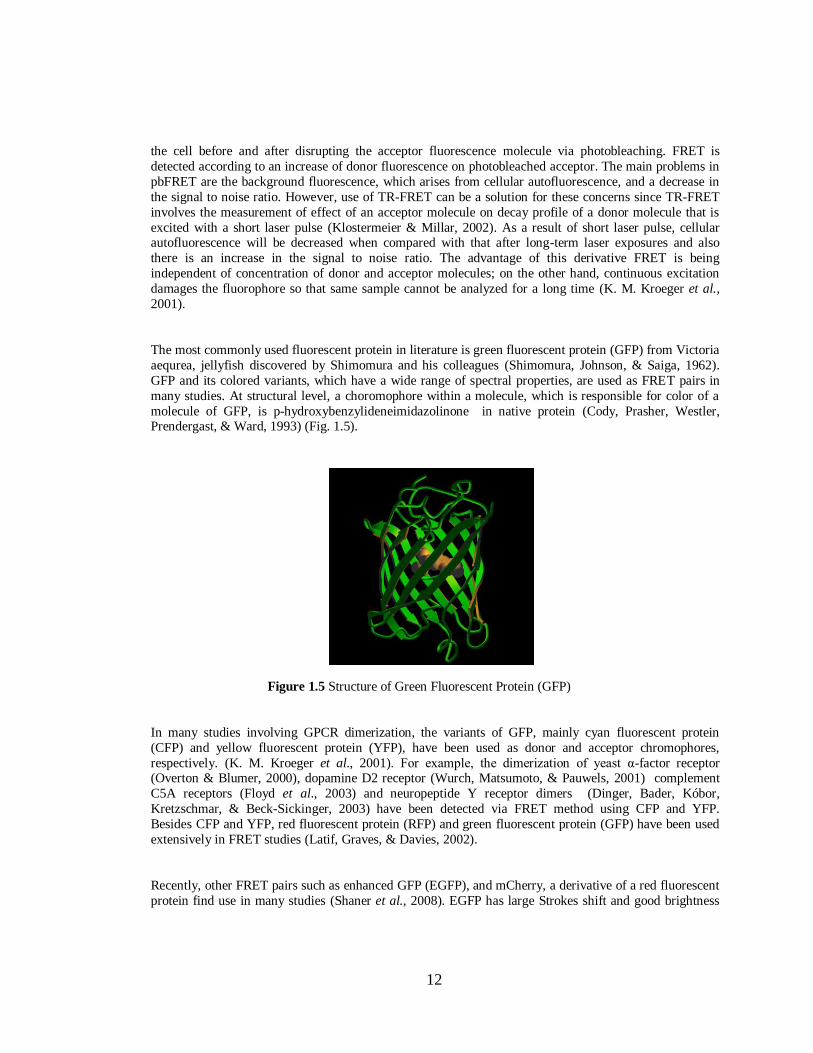
whereas mCherry has high photostability and large absorption cross-section; therefore these properties
make them a good FRET pair (Albertazzi, Arosio, Marchetti, Ricci, & Beltram, 2009).
Figure 1.6 Spectroscopic characteristics of EGFP (cyan-green) and mCherry (yellow-orange) (drawn with
FRET for Fluorescent Proteins JAVA Tutorial provided by MicroscopyU of Nikon®)
One of the requirements of being good FRET pair is narrow emission overlap region (Fig.1.6).
Spectroscopic properties of EGFP and mCherry show that blue shaded part indicate the overlap of
emission of mCherry and EGFP molecules which is narrow enough for minimal bleed-through. The laser we choose to excite EGFP is at 458 nm (shown as a blue line on Figure 1.6), which excite mCherry at less
than 1% according to absorption spectrum of mCherry, thus minimize the direct excitation of acceptor
molecule. Lastly, the overlap between absorption spectrum of donor and excitation spectrum of acceptor
molecule between EGFP and mCherry is suitable for high FRET efficiency. Considering these properties,
EGFP and mCherry forms a good FRET pair.
1.4 Methods to Screen Functionality of G-Protein Coupled Receptors
G-Protein Coupled Receptors (GPCRs) have an important role in biological pathways thus they are
targeted by many drugs in the market. GPCRs are capable to recognize several endogenous stimuli such as
ions, lipids, proteins and peptides (Fredriksson et al., 2003). Predominantly, GPCRs utilize the
mechanism to transduce extracellular stimuli to intracellular environment via heteromeric G proteins,
which are coupled, to GPCRs (Bourne, 1997; Cabrera-Vera, 2003). In different subcellular localization
and cell types, as a result of coupling to G protein, GPCRs generate distinct cellular responses (Thomsen,
Frazer, & Unett, 2005). The screening techniques for GPCRs, especially second messenger assays, have
been essential to facilitate drug screening (Thomsen et al., 2005).
EGFP excitation
mCherry excitation
mCherry emission EGFP
emission
14
The assay involving the measurement of cAMP level is a common method to screen functionality of
GPCRs. As secondary messenger, cAMP is included in the transduction of signal from extracellular
environment. As a result of couplin of GPCR with Gαi/o and Gαs, the production of cAMP is either
inhibited or stimulated, respectively. AC stimulates cAMP production from ATP molecule, thereby
increasing cAMP level which leads the PKA activation thus phosphorylation of many substrate proteins in
the cell (Babcock, Farzan, & Sodroski, 2003) assays have been designed to measure the cAMP level in the cell generated by GPCRs. Depending on re ulation of AC by Gαi/o and Gαs subunits, there are several
ways to determine cAMP level in the cell. Some of them include the competition between cellular cAMP
and radioactively labelled cAMP for binding site of cAMP antibody. These assays use an antibody to a
fluorescein-labeled cAMP tracer and cAMP. Competition between cellular cAMP and a tracer cause a
reduction of polarization value with an increase in cAMP level (Von Euler, Sexton, Christopoulos, &
Hick, n.d.).
Similarly, IP accumulation assays have been used to screen for Gq-coupled GPCRs. The activation of Gq
of G protein stimulates PLC activation, thereby leading the hydrolysis of phosphatidyl-inositol-4, 5-
bisphosphate (PIP2) that is a phospholipid in the plasma membrane. As a result of hydrolysis of PIP2, IP3
and diacylglycerol (DAG) are produced. Whereas IP3 affect intracellular Ca+2 mobilization, DAG induces
PKC activation. So, the IP3 accumulation has been measured for GPCR function. Generally, biotinylated IP3 have been used to compete with cellular IP3 produced in the cell upon ligand binding (Von Euler et
al., n.d.).
Another commonly used assay is intracellular calcium assays. Beside GPCR activated regulation, muscle
contraction, and neurotransmitter release from synapses and apoptosis change calcium ion concentration
in the cell. The binding of IP3 to IP3 receptors located on the ER membrane stimulates the release of Ca+2
from endoplasmic reticulum (ER). It is known that IP3 is produced as a result of hydolysis of PIP2 into
two molecules IP3 and DAG, upon coupling of Gq subunits (Kirk, Maccallum, Michell, & Barker, 1990).
Calcium indicators including Fura-2 and visible-light -excitable indicators show the calcium concentration
when binding the Ca+2 in the cell (Hougland, Kravchuk, Herschlag, & Piccirilli, 2005).
MAPK cascades associated assays can also be used as an alternative to screen GPCR function. The
activation of MAPK kinase (MEK) and extracellular signal-regulated kinases 1&2 (ERK1/2) are mainly
regulated by Gq-coupled receptors, as a result of an increase in the level of intracellular DAG and Ca+2
throu h PKC. Phosphorylation of ERK1/2 is re ulated by βγ subunits of Gi/o -coupled receptors (Kolch et
al., 1993). Moreover, Gs subunit has effect on the phosphorylation of ERK1/2 through cAMP/PKA/B-Raf-
dependent mechanism (Schmitt & Stork, 2002a, 2002b). As a result of involvement in multiple pathways,
very specific antibodies used to detect phosphorylated ERK1/2 by Western Blotting and also enzyme -
linked immunosorbent assay (ELISA) – based assay (Von Euler et al., n.d.).
When carrying out the functional screen assays, there are some critical aspects. The most important one is
the condition of the cells used in the assay. GPCR of interest should be expressed in the cell lines at a
reasonable level. GPCR can be transfected by two ways including stable and transient transfection
method. High expression level can be obtained from transient transfection so, it is preferred in functional
assay protocols. Cell lines used for assays are also important for G–protein and GPCR coupling process.
Moreover, nonphysciological pathways can affect the overexpression of GPCRs in the cells. Cell density
and controls, positive and negative, are important for all assays. Cell density can change strength of signal
and background noise level whereas controls determine basal level of the measurement. Finally, non-
specific binding of agonist to overexpressed GPCR can cause signal amplification, thereby leading a
decrease in signal to noise ratio (Von Euler et al., n.d.).
15
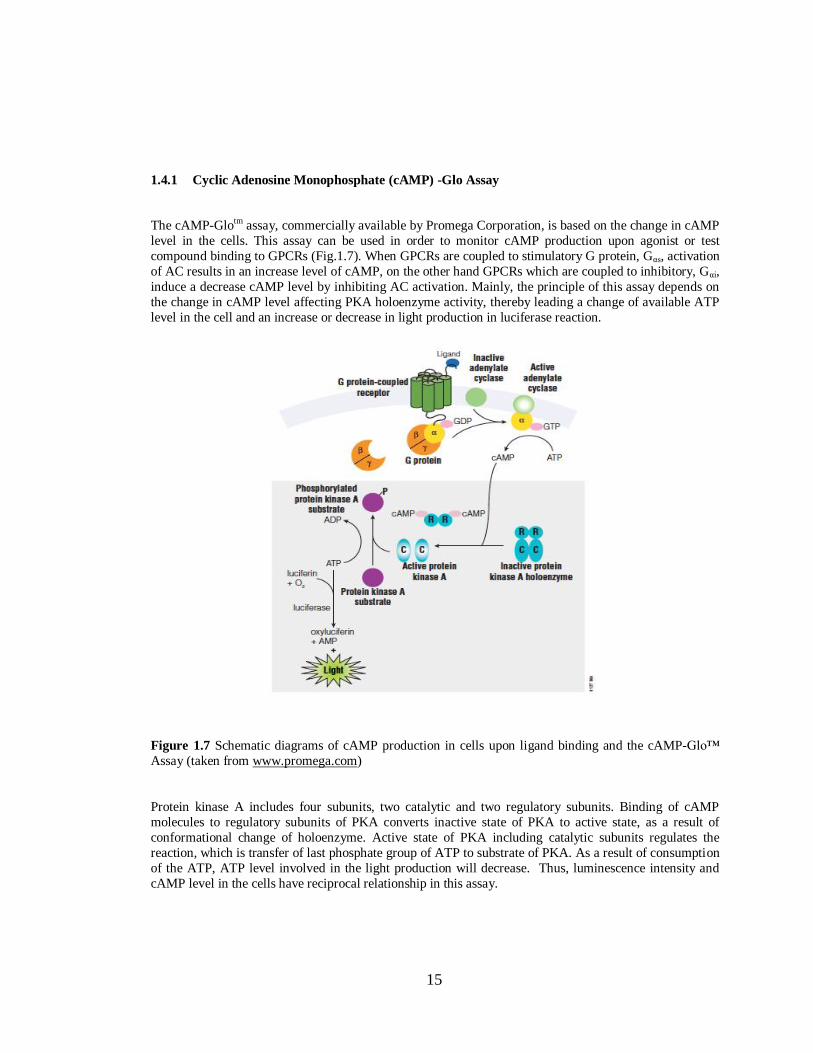
1.4.1 Cyclic Adenosine Monophosphate (cAMP) -Glo Assay
The cAMP-Glotm assay, commercially available by Promega Corporation, is based on the change in cAMP
level in the cells. This assay can be used in order to monitor cAMP production upon agonist or test
compound binding to GPCRs (Fig.1.7). When GPCRs are coupled to stimulatory G protein, Gαs, activation
of AC results in an increase level of cAMP, on the other hand GPCRs which are coupled to inhibitory, Gαi,
induce a decrease cAMP level by inhibiting AC activation. Mainly, the principle of this assay depends on
the change in cAMP level affecting PKA holoenzyme activity, thereby leading a change of available ATP
level in the cell and an increase or decrease in light production in luciferase reaction.
Figure 1.7 Schematic diagrams of cAMP production in cells upon ligand binding and the cAMP-Glo™
Assay (taken from www.promega.com)
Protein kinase A includes four subunits, two catalytic and two regulatory subunits. Binding of cAMP
molecules to regulatory subunits of PKA converts inactive state of PKA to active state, as a result of
conformational change of holoenzyme. Active state of PKA including catalytic subunits regulates the
reaction, which is transfer of last phosphate group of ATP to substrate of PKA. As a result of consumption
of the ATP, ATP level involved in the light production will decrease. Thus, luminescence intensity and
cAMP level in the cells have reciprocal relationship in this assay.
16
1.5 Aim of the Study
Adenosine A2A and dopamine D2 receptors both affect neurophysiological events and are targeted by
neuropsychiatric drugs. Thus, their physical interaction and mechanism of this interaction may reveal new
approaches to explain both physiology and pharmacology of these receptors in more detail as well as to pharmacologically target them more efficiently.
The purpose of this study is to assess the functionality of EGFP (enhanced green fluorescent protein) and
mCherry (a red fluorescent protein) tagged adenosine A2A and dopamine D2 receptors and to
qualitatively assess the dimerization of these receptors in live cells via Fluorescence Resonance Energy
Transfer (FRET) method. Understanding the mechanisms of the interaction between adenosine and
dopamine signaling will help us to figure out some molecular mechanism of neurophysiological disorders.
Furthermore, the fluorescence based live cell model could be used to observe the effects of potential drugs
on the interaction of these two receptors.
17
CHAPTER 2
MATERIALS AND METHODS
2.1 Materials
2.1.1 Neuro2a (N2a) Mouse Neuroblastoma Cell Line and Media
Neuro2a (N2a) mouse cell line was transiently transfected in order to express and visualize the receptors
tagged with fluorescent proteins. This cell line was provided by ATCC and kindly granted by Assist. Prof.
Dr. Tülin Yanık from METU Biolo ical Sciences, Ankara, Turkey.
Growth medium used to sustain N2a cells was Dulbecco’s Modified Ea le Medium (D-MEM) (50%)
supplemented with L-glutamine (Invitrogen, Cat#41966029) and OptiMEM®I Reduced Serum Medium
with L-glutamine (Invitrogen, Cat#31985047) (50%) , Fetal Bovine Serum (Invitrogen, Cat#26140-079)
(10%) and Penicillin/Streptomycin solution (Invitrogen, Cat#15140-122) (1%). Millipore Stericup® Filter
Units was used for sterilization step to filter the final solution.
10X Phosphate Buffered Saline (PBS) was prepared and was diluted to 1X with distilled H2O in order to
wash cells to get rid of the dead cells and rest of the waste medium. The content of PBS was given in
Appendix D.
TrypLETM Express Stable Trypsin-Like Enzyme with Phenol Red (Invitrogen, Cat#12605-028) was used
for detachment of cells from culture flasks surface during their passage.
Freezing medium was prepared to freeze the cells to make stock cells. This medium was composed of
35% D-MEM, 35% OptiMEM®I, 20% glycerol (as cryoprotectant) and 10% FBS. Around 107 N2a cells
were frozen following a confluency of 80-90 % was observed.
Cell culture equipment including all reagents and chemicals were cell culture grade.
2.1.2 Neuro2a Cell Culture Conditions
The cells were grown at 37°C in a 5% CO2 atmosphere provided by Heraeus® Hera Cell 150 Tri- Gas
Cell Culture incubator. Cell culture experiments were performed under sterile conditions using a laminar flow cabinet with a hepa filter.
18
2.1.3 Bacterial Culture Media and Conditions
Luria Bertani (LB) medium was used to reproduce the Escherichia coli TOP10. The content of LB was
indicated in Appendix C. Medium compositions were mixed in distilled water (dH20) and pH of mixture was adjusted to 7.0 by addition of 1 N KOH. After preparing the medium mixture, it was autoclaved at
121°C for 20 minutes for sterilization. LB agar containing extra 1.5 % agar was supplemented with either
100 mg/ml ampicillin or 50 mg/ml kanamycin prepared for bacterial selection part of experiments. Cooled
medium was mixed with antibiotic solution. Solid LB a ar plates were incubated at 37 C in a Nüve
brand incubator. Selected colonies were grown in liquid LB at 37°C in a Zheiheng shaker incubator.
Bacterial stocks were prepared by mixing liquid culture and 50 % glycerol ata ratio of 50:50 to make final
concentration of glycerol 25%. Stocks were kept at -80°C in the freezer.
2.1.4 Other Chemicals and Materials
The chemicals were supplemented from Sigma Chemical Company (NY, USA), Applichem (Darmstadt,
Germany) and Si ma Aldrich (Taufkirchen / Germany). Molecular biolo y kits were from Fermentas
(Ontario, Canada), IAGEN (Düsseldorf, Germany) or Invitrogen (CA, USA). DNA polymerases used in
polymerase chain reactions (PCR) were from Fermentas (Ontario, Canada), from New England Biolabs
(Hertfordshire, UK) and from Finnzymes (Vantaa, Finland). Cell culture media and reagents were all from
GIBCO®, Invitrogen (CA, USA). Functional assay kits were purchased from Promega (WI, USA).
Agonist of Dopamine D2 receptor, namely uinpirole, was a kind ift by Assist. Prof. Dr. Hakan Kayır from GATA, Department of Medical Pharmaceuticals, Ankara.
T-75 cell culture flasks and 35 mm cell culture dishes from Greiner (Frankfurt, Germany) were used for
cell culture experiments and functional assay protocol. Sterile serological pipettes were purchased from
LP Italiana (Milano, Italy). Glass bottom dishes ordered from In Vitro Scientific (CA, USA) were used for
transfection and live cell imaging experiments. For functional assay, 96 well plates were purchased from
BD (Becton, Dickinson & Company, NJ, USA).
Live cell-imaging experiments were performed using a Zeiss LSM 510 confocal laser scanning
microscope (Fig 2.1). Expression control experiments were performed using a Leica fluorescence
microscope.
19
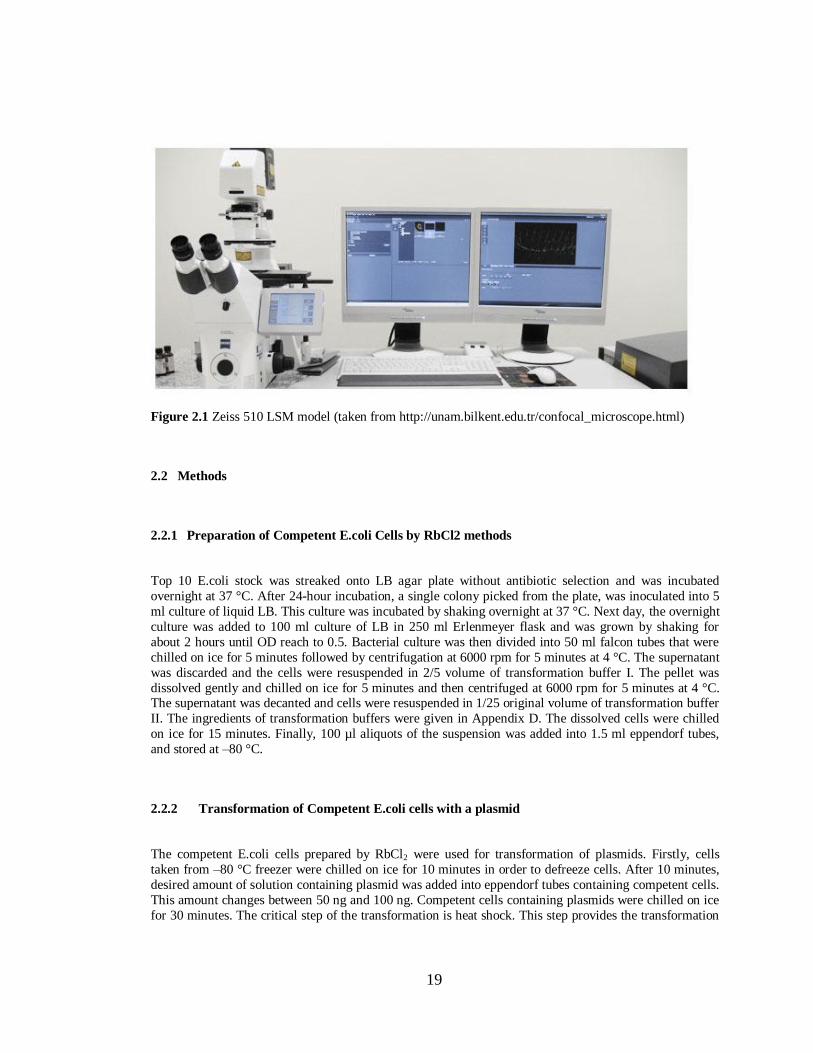
Figure 2.1 Zeiss 510 LSM model (taken from http://unam.bilkent.edu.tr/confocal_microscope.html)
2.2 Methods
2.2.1 Preparation of Competent E.coli Cells by RbCl2 methods
Top 10 E.coli stock was streaked onto LB agar plate without antibiotic selection and was incubated
overnight at 37 °C. After 24-hour incubation, a single colony picked from the plate, was inoculated into 5
ml culture of liquid LB. This culture was incubated by shaking overnight at 37 °C. Next day, the overnight
culture was added to 100 ml culture of LB in 250 ml Erlenmeyer flask and was grown by shaking for
about 2 hours until OD reach to 0.5. Bacterial culture was then divided into 50 ml falcon tubes that were
chilled on ice for 5 minutes followed by centrifugation at 6000 rpm for 5 minutes at 4 °C. The supernatant
was discarded and the cells were resuspended in 2/5 volume of transformation buffer I. The pellet was
dissolved gently and chilled on ice for 5 minutes and then centrifuged at 6000 rpm for 5 minutes at 4 °C. The supernatant was decanted and cells were resuspended in 1/25 original volume of transformation buffer
II. The ingredients of transformation buffers were given in Appendix D. The dissolved cells were chilled
on ice for 15 minutes. Finally, 100 µl aliquots of the suspension was added into 1.5 ml eppendorf tubes,
and stored at –80 °C.
2.2.2 Transformation of Competent E.coli cells with a plasmid
The competent E.coli cells prepared by RbCl2 were used for transformation of plasmids. Firstly, cells
taken from –80 °C freezer were chilled on ice for 10 minutes in order to defreeze cells. After 10 minutes,
desired amount of solution containing plasmid was added into eppendorf tubes containing competent cells.
This amount changes between 50 ng and 100 ng. Competent cells containing plasmids were chilled on ice
for 30 minutes. The critical step of the transformation is heat shock. This step provides the transformation
20
of plasmids into competent cells by widening the pore of cell membrane of cells, thereby making it easier
for the plasmids to be taken in. The competent cells incubated for 30 minutes were placed on heat block,
and the temperature was adjusted to 42 °C, for 90 seconds. Immediately, cells were taken and incubated
on ice for 5 minutes. In order to grow the cells, preheated 900 ul sterile LB was put on cells. 1.5 ml
eppendorf tubes containing competent cells and LB were incubated at 37 °C in shaker incubator. After
cells were incubated for 1 hour, they were spun at 6000 rpm for 3 minutes in the centrifuge. 800 ul supernatant was discarded without destroying the pellet containing cells. By resuspending pellet
containin with remained 200 μl supernatant, the pellet was inoculated onto LB a ar plate with selected
antibiotic. In order to spread the cell mixture, sterile glass beads were used. Inoculated LB agar plates
were incubated overnight at 37 °C in incubator. The whole procedure was carried out under sterile
conditions.
2.2.3 Plasmid Isolation from E.coli cells
Transformed E.coli cells, which were grown on the selected LB agar plate, were inoculated to 5 ml liquid
LB broth mixed with 5 µl of selected antibiotic solution by picking single cells. They were incubated
overnight at 37 °C in shaker incubator. After overnight incubation, plasmids were isolated from 5 ml of
bacterial inoculum by using Fermentas® GeneJETTM Plasmid Miniprep Kit and following the protocol
mentioned in instructor`s manual.
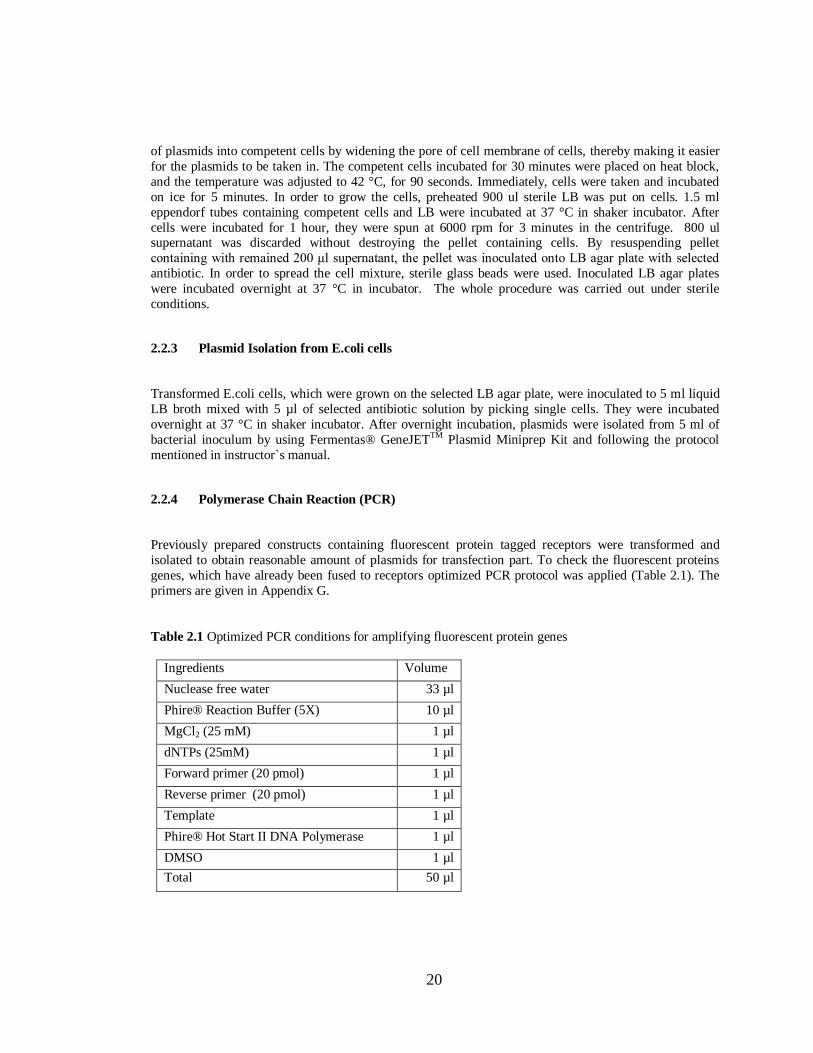
2.2.4 Polymerase Chain Reaction (PCR)
Previously prepared constructs containing fluorescent protein tagged receptors were transformed and
isolated to obtain reasonable amount of plasmids for transfection part. To check the fluorescent proteins
genes, which have already been fused to receptors optimized PCR protocol was applied (Table 2.1). The
primers are given in Appendix G.
Table 2.1 Optimized PCR conditions for amplifying fluorescent protein genes
Ingredients Volume
Nuclease free water 33 µl
Phire® Reaction Buffer (5X) 10 µl
MgCl2 (25 mM) 1 µl
dNTPs (25mM) 1 µl
Forward primer (20 pmol) 1 µl
Reverse primer (20 pmol) 1 µl
Template 1 µl
Phire® Hot Start II DNA Polymerase 1 µl
DMSO 1 µl
Total 50 µl
21
Cycle parameters
98°C for 30 sec
35 cycles of;
98°C for 30 sec
55°C for 5 sec 72°C for 15 sec
72°C for 1 min
4 °C forever
2.2.5 Agarose Gel Electrophoresis
Agarose gel electrophoresis was performed to control the size of fluorescent protein genes, amplified by
PCR method. 1 % w/v agarose gel was used to run the PCR products. Gel was prepared by using 1X TBE
buffer, given in Appendix D. After cooling the gel down, required volume of 10 mg/ml EtBr stock
solution was added into gel solution to staining DNA. EtBr is used as a DNA interchelator. To check size
of genes, appropriate quick load DNA size ladders were loaded and at loading step, PCR products were
mixed with 6X DNA loading dye (Fermentas®, Cat#R0611, given in Appendix D) to obtain DNA: dye
ratio as 5:1 and then loaded to gel. The horizontal electrophoresis tank containing 1X TBE was used to run
the gel at 120 V for 20-25 minutes. The gel was visualized on UV transilluminator modified with camera
systems.
2.2.6 Extraction of DNA from Agarose Gel
At the end of the digestion and PCR, the products were run on agarose gel. These products were extracted
by using QIAGEN® Gel Extraction Kit (Cat# 28704). The excised bands were eluted by following the
protocol mentioned in instructor`s manual.
2.2.7 Quantification of DNA Concentration
After plasmid isolation and gel extraction protocol, the concentration of DNA was quantified by using
NanoDrop 2000 spectrophotometer from Thermo Scientific® brand. After loading of 1µl of solution
containing eluted DNA onto the micro-volume pedestal, the measurement was taken accordin to user’s
manual instructions.
2.2.8 Maintenance of N2a Neuroblastoma cell lines
N2a cells were sub-cultured after reaching to 80-90 % confluence taking approximately 3 days. At every
three-day, medium in the flask was aspirated and cells were washed with 1X PBS once. At the end of
22
washing step, 1 ml of trypsin solution were added and incubated for 5 minutes at 37 °C to detach the cells.
After 5 – minute incubation, detached cells were diluted with 9 ml of growth medium. Cells were diluted
10 fold. 1 ml of cell suspension was transferred into T-75 culture flask containing 14 ml growth medium.
The cells reaching to 90 % confluence were counted and about 107 cells were centrifuged at 1000 rpm for 5 minutes. After centrifugation, the cells, which precipitated, were resuspended with 1 ml freezing
medium and transferred into cryovial tubes. These tubes were kept in –80 °C freezer for 24 hours and then
were stored at about –150 °C in a liquid nitrogen tank. To culture from the frozen stock cells, frozen cells
were thaw at room temperature and transferred in 4 ml growing medium. This mixture was centrifuged at
1200 g for 10 minutes. The precipitation containing cells were resuspended with 5 ml growing medium
and transferred to cell culture flask containing growth medium.
2.2.9 Cell counting
At the end of sub-culture, cells were counted for freezing and seedin on dishes. 10 μl of cell suspension
applied onto a heamocytometer. Cells in 4 corners (composed of 16 small squares) with 1 mm2 area were
counted under a light microscope and the cell number was calculated by the formula:
(Total cell number in 4 big squares x 104) /4 = number of cells per ml
Working cell concentration was adjusted to 100.000 cells/ dish for FRET sets and functional assay.
2.2.10 Transfection of N2a neuroblastoma cells with pcDNA 3.1 (-) eukaryotic expression vector
LipofectamineTM LTX with PlusTM reagents from Invitrogen® was utilized to transfect plasmid to
eukaryotic cells and to increase the transfection efficiency. The day before transfection experiment, N2a
cells were counted. The cells were counted with haemocytometer and a volume of medium containing
100.000 N2a cells was dropped on 35 mm culture dish, where coverslips were inserted, and on a glass
bottom dish. To adjust the final volume to 2 ml, needed volume of growing medium was added to dish. The cells were incubated at 37 °C, 5 % CO2 for 24 hours. After 24-hour incubation, transfection protocol
was carried out. Firstly, the mixture containing 200 ng of plasmid to be transfected, 100 ml of OptiMEM®
I and 6 μl of PlusTM reagent was prepared in 1.5 ml eppendorf tube. In the case of double transfection, 200
ng of each plasmid was diluted in 100 ml of OptiMEM® I. This mixture was incubated for 15 minutes at
room temperature. During the 15-minute incubation, in another tube, 100 ml OptiMEM and 4 μl of
Lipofectamine LTXTM were mixed. At the end of 15-minute incubation, this mixture was added to
previously prepared mixture containing plasmid DNA, PlusTM in OptiMEM® I. This final mixture was
incubated for 15 minutes at room temperature. In the meantime, the medium in a dish was removed and
the cells were washed with 1 ml of sterile 1X PBS. After discarded PBS, 1 ml of OptiMEM® I was put on
the cells in the dish. At the end of last 15-minute incubation of transfection mixture, the mixture was
dripped on the cells. After complete the transfection protocol, the incubation step was applied during next 3 hours in the 5% CO2 incubator at 37 °C. After 3-hour incubation, in order to grow transfected cells, 2.5
ml of normal growth medium containing serum was put on the dish. The cells were incubated for 48 hours
for the expression of the constructs in N2a cells in the 5% CO2 incubator at 37 °C.
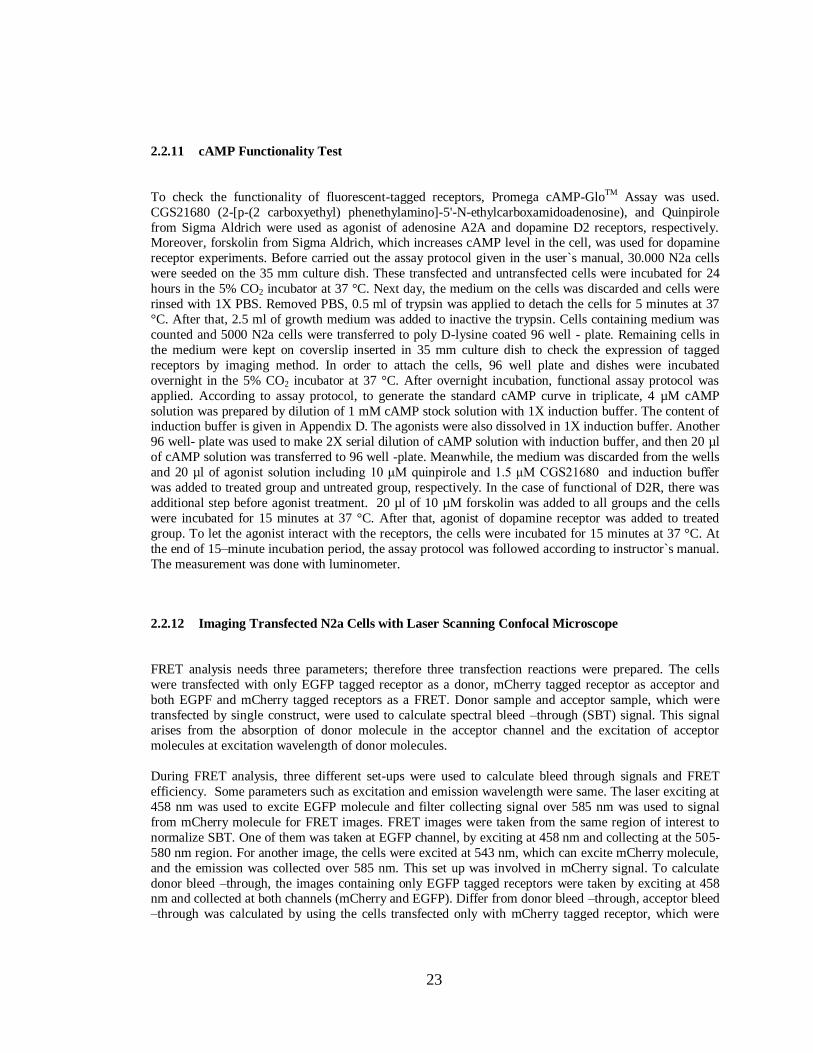
23
2.2.11 cAMP Functionality Test
To check the functionality of fluorescent-tagged receptors, Promega cAMP-GloTM Assay was used.
CGS21680 (2-[p-(2 carboxyethyl) phenethylamino]-5'-N-ethylcarboxamidoadenosine), and Quinpirole
from Sigma Aldrich were used as agonist of adenosine A2A and dopamine D2 receptors, respectively. Moreover, forskolin from Sigma Aldrich, which increases cAMP level in the cell, was used for dopamine
receptor experiments. Before carried out the assay protocol given in the user`s manual, 30.000 N2a cells
were seeded on the 35 mm culture dish. These transfected and untransfected cells were incubated for 24
hours in the 5% CO2 incubator at 37 °C. Next day, the medium on the cells was discarded and cells were
rinsed with 1X PBS. Removed PBS, 0.5 ml of trypsin was applied to detach the cells for 5 minutes at 37
°C. After that, 2.5 ml of growth medium was added to inactive the trypsin. Cells containing medium was
counted and 5000 N2a cells were transferred to poly D-lysine coated 96 well - plate. Remaining cells in
the medium were kept on coverslip inserted in 35 mm culture dish to check the expression of tagged
receptors by imaging method. In order to attach the cells, 96 well plate and dishes were incubated
overnight in the 5% CO2 incubator at 37 °C. After overnight incubation, functional assay protocol was
applied. According to assay protocol, to generate the standard cAMP curve in triplicate, 4 µM cAMP
solution was prepared by dilution of 1 mM cAMP stock solution with 1X induction buffer. The content of induction buffer is given in Appendix D. The agonists were also dissolved in 1X induction buffer. Another
96 well- plate was used to make 2X serial dilution of cAMP solution with induction buffer, and then 20 µl
of cAMP solution was transferred to 96 well -plate. Meanwhile, the medium was discarded from the wells
and 20 µl of agonist solution includin 10 μM quinpirole and 1.5 μM CGS21680 and induction buffer
was added to treated group and untreated group, respectively. In the case of functional of D2R, there was
additional step before agonist treatment. 20 µl of 10 µM forskolin was added to all groups and the cells
were incubated for 15 minutes at 37 °C. After that, agonist of dopamine receptor was added to treated
group. To let the agonist interact with the receptors, the cells were incubated for 15 minutes at 37 °C. At
the end of 15–minute incubation period, the assay protocol was followed according to instructor`s manual.
The measurement was done with luminometer.
2.2.12 Imaging Transfected N2a Cells with Laser Scanning Confocal Microscope
FRET analysis needs three parameters; therefore three transfection reactions were prepared. The cells
were transfected with only EGFP tagged receptor as a donor, mCherry tagged receptor as acceptor and
both EGPF and mCherry tagged receptors as a FRET. Donor sample and acceptor sample, which were
transfected by single construct, were used to calculate spectral bleed –through (SBT) signal. This signal arises from the absorption of donor molecule in the acceptor channel and the excitation of acceptor
molecules at excitation wavelength of donor molecules.
During FRET analysis, three different set-ups were used to calculate bleed through signals and FRET
efficiency. Some parameters such as excitation and emission wavelength were same. The laser exciting at
458 nm was used to excite EGFP molecule and filter collecting signal over 585 nm was used to signal
from mCherry molecule for FRET images. FRET images were taken from the same region of interest to
normalize SBT. One of them was taken at EGFP channel, by exciting at 458 nm and collecting at the 505-
580 nm region. For another image, the cells were excited at 543 nm, which can excite mCherry molecule,
and the emission was collected over 585 nm. This set up was involved in mCherry signal. To calculate
donor bleed –through, the images containing only EGFP tagged receptors were taken by exciting at 458 nm and collected at both channels (mCherry and EGFP). Differ from donor bleed –through, acceptor bleed
–through was calculated by using the cells transfected only with mCherry tagged receptor, which were
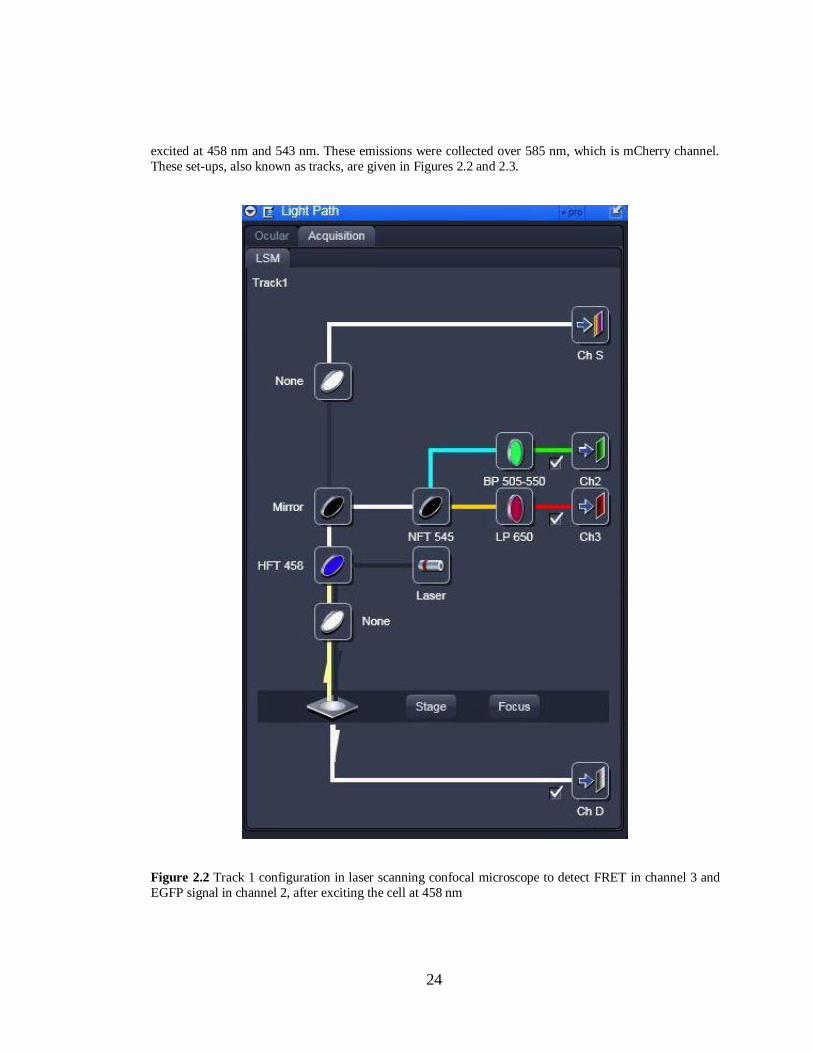
24
excited at 458 nm and 543 nm. These emissions were collected over 585 nm, which is mCherry channel.
These set-ups, also known as tracks, are given in Figures 2.2 and 2.3.
Figure 2.2 Track 1 configuration in laser scanning confocal microscope to detect FRET in channel 3 and
EGFP signal in channel 2, after exciting the cell at 458 nm
25
Figure 2.3 Track 2 configuration in laser scanning confocal microscope to detect mCherry signal in
channel 2 after exciting the cell at 543 nm
FRET was calculated by using PixFRET plug-in of ImageJ software (Feige, Sage, Wahli, Desvergne, &
Gelman, 2005).
26
2.2.13 Image Analysis with Pix-FRET
The normalization of spectral bleed –through (SBT) is the main problem in FRET analysis. As mentioned,
SBT signal, that is a false positive FRET signal, can result from either the absorption of donor molecule in
the acceptor channel or the excitation of acceptor molecules at excitation wavelength of donor molecules. In order to handle this problem, Pix-FRET plug-in in Image J that allows creating the images of sensitized
–emission FRET can be used; therefore, it can be possible to determine wherever FRET occurs by
counting up pixel-by-pixel the images visualized in three channel settings.
Firstly, images were taken from the cells transfected with only donor, EGFP tagged receptor, to calculate
donor bleed-through by following setups:
- excitation of the donor and emission of the acceptor
- excitation of the donor and emission of the donor
Secondly, for acceptor bleed-through, only acceptor, mCherry tagged receptor, was transfected to cells and images taken with the following setups were used;
- excitation of the donor and emission of the acceptor
- excitation of the acceptor and emission of the acceptor
Lastly, two fluorophores must be present at the same time and three images were taken with the following
setups;
- excitation of the donor and emission of the acceptor
- excitation of the donor and emission of the donor
- excitation of the acceptor and emission of the acceptor
Using bleed-through images, Pix-FRET outputs three line equations; constant, linear and exponential; that
fit and comprise most of the pixel intensity values.
The best equation from these three was chosen to normalize the bleed-through. Afterwards, FRET image
is analyzed according to this normalization.
2.2.14 Statistical Analysis
Student`s t-test was conducted between control (or untreated) versus treatment groups (two-tailed unpaired
comparison). p values that were <0.05 were considered as statistically significant throughout these
studies.
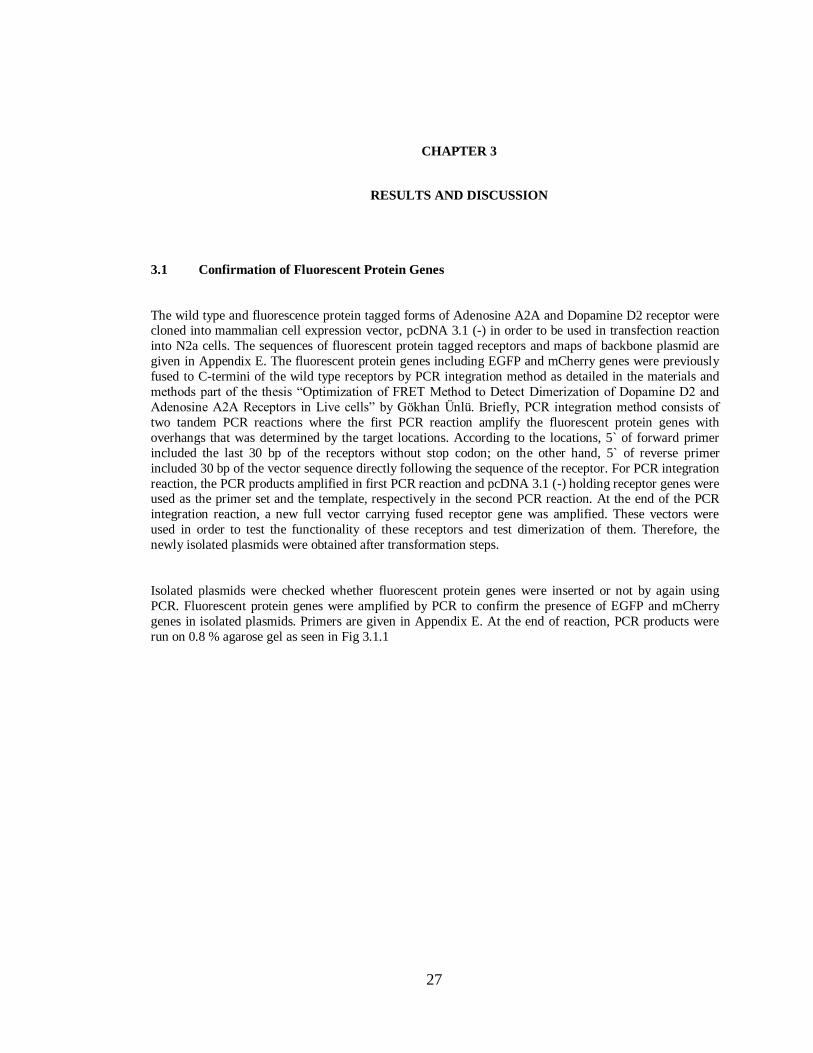
27
CHAPTER 3
RESULTS AND DISCUSSION
3.1 Confirmation of Fluorescent Protein Genes
The wild type and fluorescence protein tagged forms of Adenosine A2A and Dopamine D2 receptor were cloned into mammalian cell expression vector, pcDNA 3.1 (-) in order to be used in transfection reaction
into N2a cells. The sequences of fluorescent protein tagged receptors and maps of backbone plasmid are
given in Appendix E. The fluorescent protein genes including EGFP and mCherry genes were previously
fused to C-termini of the wild type receptors by PCR integration method as detailed in the materials and
methods part of the thesis “Optimization of FRET Method to Detect Dimerization of Dopamine D2 and
Adenosine A2A Receptors in Live cells” by Gökhan Ünlü. Briefly, PCR inte ration method consists of
two tandem PCR reactions where the first PCR reaction amplify the fluorescent protein genes with
overhangs that was determined by the target locations. According to the locations, 5` of forward primer
included the last 30 bp of the receptors without stop codon; on the other hand, 5` of reverse primer
included 30 bp of the vector sequence directly following the sequence of the receptor. For PCR integration
reaction, the PCR products amplified in first PCR reaction and pcDNA 3.1 (-) holding receptor genes were used as the primer set and the template, respectively in the second PCR reaction. At the end of the PCR
integration reaction, a new full vector carrying fused receptor gene was amplified. These vectors were
used in order to test the functionality of these receptors and test dimerization of them. Therefore, the
newly isolated plasmids were obtained after transformation steps.
Isolated plasmids were checked whether fluorescent protein genes were inserted or not by again using
PCR. Fluorescent protein genes were amplified by PCR to confirm the presence of EGFP and mCherry
genes in isolated plasmids. Primers are given in Appendix E. At the end of reaction, PCR products were
run on 0.8 % agarose gel as seen in Fig 3.1.1
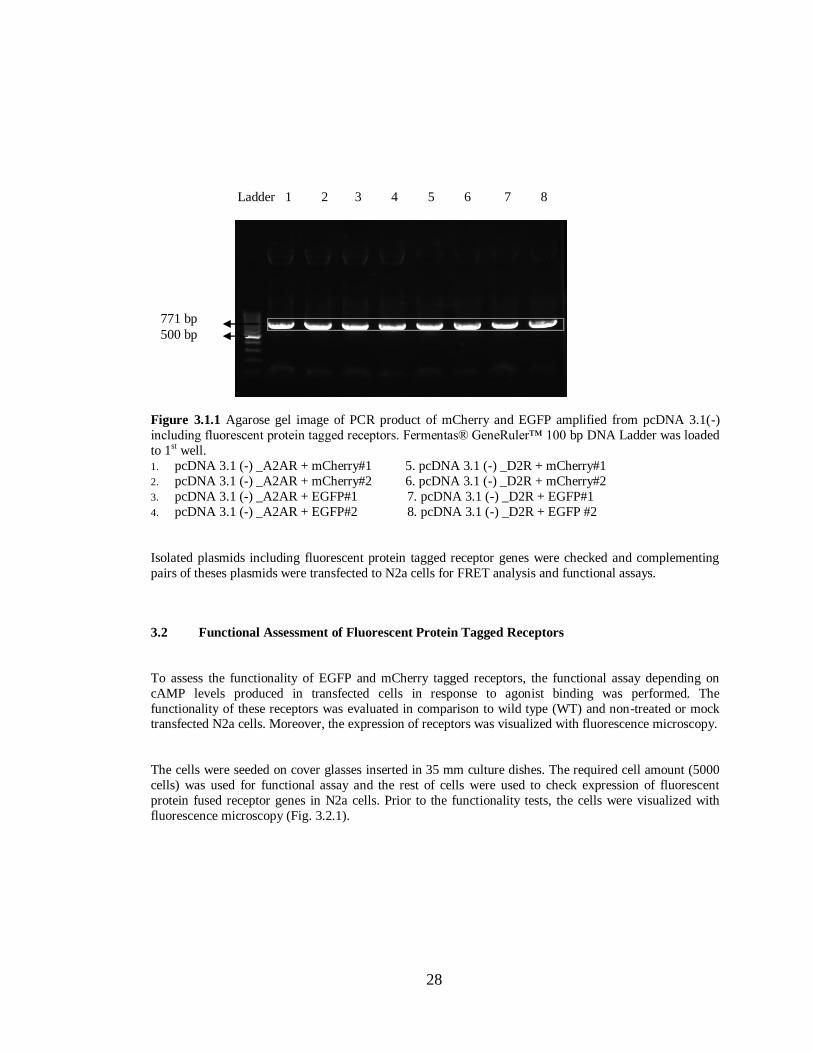
28
Ladder 1 2 3 4 5 6 7 8
Figure 3.1.1 Agarose gel image of PCR product of mCherry and EGFP amplified from pcDNA 3.1(-)
includin fluorescent protein ta ed receptors. Fermentas GeneRuler™ 100 bp DNA Ladder was loaded
to 1st well.
1. pcDNA 3.1 (-) _A2AR + mCherry#1 5. pcDNA 3.1 (-) _D2R + mCherry#1
2. pcDNA 3.1 (-) _A2AR + mCherry#2 6. pcDNA 3.1 (-) _D2R + mCherry#2
3. pcDNA 3.1 (-) _A2AR + EGFP#1 7. pcDNA 3.1 (-) _D2R + EGFP#1
4. pcDNA 3.1 (-) _A2AR + EGFP#2 8. pcDNA 3.1 (-) _D2R + EGFP #2
Isolated plasmids including fluorescent protein tagged receptor genes were checked and complementing
pairs of theses plasmids were transfected to N2a cells for FRET analysis and functional assays.
3.2 Functional Assessment of Fluorescent Protein Tagged Receptors
To assess the functionality of EGFP and mCherry tagged receptors, the functional assay depending on
cAMP levels produced in transfected cells in response to agonist binding was performed. The
functionality of these receptors was evaluated in comparison to wild type (WT) and non-treated or mock transfected N2a cells. Moreover, the expression of receptors was visualized with fluorescence microscopy.
The cells were seeded on cover glasses inserted in 35 mm culture dishes. The required cell amount (5000
cells) was used for functional assay and the rest of cells were used to check expression of fluorescent
protein fused receptor genes in N2a cells. Prior to the functionality tests, the cells were visualized with
fluorescence microscopy (Fig. 3.2.1).
771 bp
500 bp
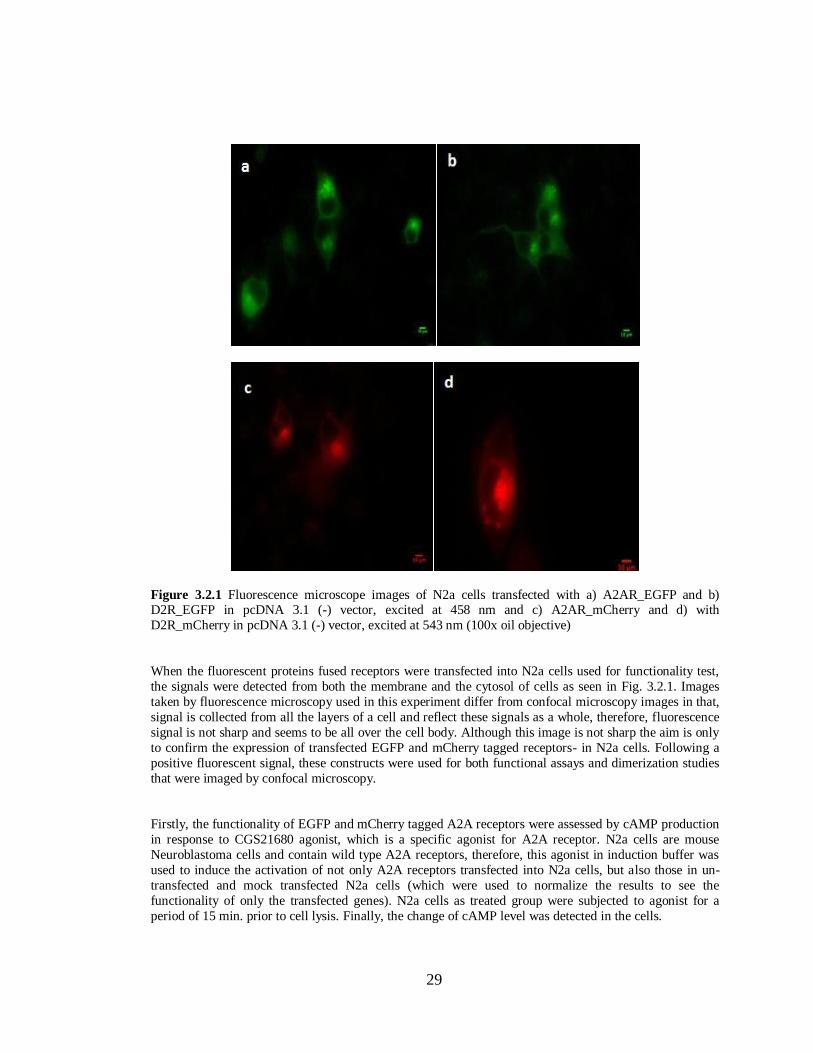
29
Figure 3.2.1 Fluorescence microscope images of N2a cells transfected with a) A2AR_EGFP and b) D2R_EGFP in pcDNA 3.1 (-) vector, excited at 458 nm and c) A2AR_mCherry and d) with
D2R_mCherry in pcDNA 3.1 (-) vector, excited at 543 nm (100x oil objective)
When the fluorescent proteins fused receptors were transfected into N2a cells used for functionality test,
the signals were detected from both the membrane and the cytosol of cells as seen in Fig. 3.2.1. Images
taken by fluorescence microscopy used in this experiment differ from confocal microscopy images in that,
signal is collected from all the layers of a cell and reflect these signals as a whole, therefore, fluorescence
signal is not sharp and seems to be all over the cell body. Although this image is not sharp the aim is only
to confirm the expression of transfected EGFP and mCherry tagged receptors- in N2a cells. Following a
positive fluorescent signal, these constructs were used for both functional assays and dimerization studies
that were imaged by confocal microscopy.
Firstly, the functionality of EGFP and mCherry tagged A2A receptors were assessed by cAMP production
in response to CGS21680 agonist, which is a specific agonist for A2A receptor. N2a cells are mouse
Neuroblastoma cells and contain wild type A2A receptors, therefore, this agonist in induction buffer was
used to induce the activation of not only A2A receptors transfected into N2a cells, but also those in un-
transfected and mock transfected N2a cells (which were used to normalize the results to see the
functionality of only the transfected genes). N2a cells as treated group were subjected to agonist for a
period of 15 min. prior to cell lysis. Finally, the change of cAMP level was detected in the cells.
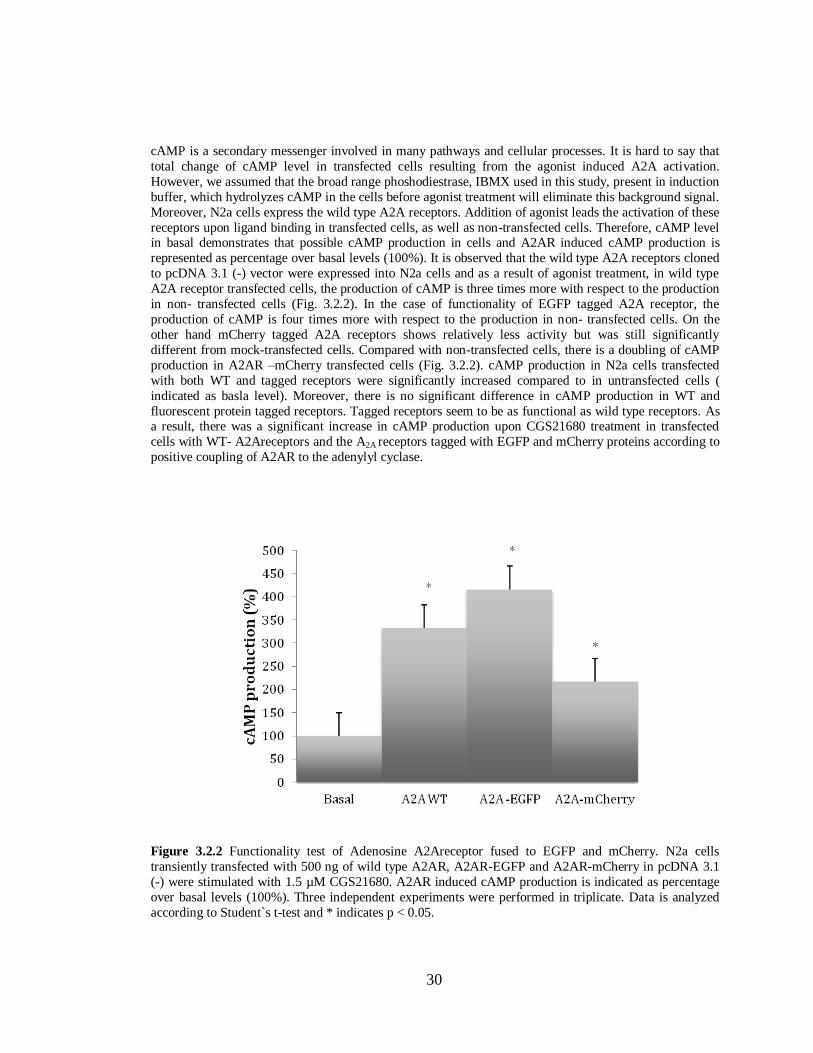
30
cAMP is a secondary messenger involved in many pathways and cellular processes. It is hard to say that
total change of cAMP level in transfected cells resulting from the agonist induced A2A activation.
However, we assumed that the broad range phoshodiestrase, IBMX used in this study, present in induction
buffer, which hydrolyzes cAMP in the cells before agonist treatment will eliminate this background signal.
Moreover, N2a cells express the wild type A2A receptors. Addition of agonist leads the activation of these
receptors upon ligand binding in transfected cells, as well as non-transfected cells. Therefore, cAMP level in basal demonstrates that possible cAMP production in cells and A2AR induced cAMP production is
represented as percentage over basal levels (100%). It is observed that the wild type A2A receptors cloned
to pcDNA 3.1 (-) vector were expressed into N2a cells and as a result of agonist treatment, in wild type
A2A receptor transfected cells, the production of cAMP is three times more with respect to the production
in non- transfected cells (Fig. 3.2.2). In the case of functionality of EGFP tagged A2A receptor, the
production of cAMP is four times more with respect to the production in non- transfected cells. On the
other hand mCherry tagged A2A receptors shows relatively less activity but was still significantly
different from mock-transfected cells. Compared with non-transfected cells, there is a doubling of cAMP
production in A2AR –mCherry transfected cells (Fig. 3.2.2). cAMP production in N2a cells transfected
with both WT and tagged receptors were significantly increased compared to in untransfected cells (
indicated as basla level). Moreover, there is no significant difference in cAMP production in WT and
fluorescent protein tagged receptors. Tagged receptors seem to be as functional as wild type receptors. As a result, there was a significant increase in cAMP production upon CGS21680 treatment in transfected
cells with WT- A2Areceptors and the A2A receptors tagged with EGFP and mCherry proteins according to
positive coupling of A2AR to the adenylyl cyclase.
Figure 3.2.2 Functionality test of Adenosine A2Areceptor fused to EGFP and mCherry. N2a cells
transiently transfected with 500 ng of wild type A2AR, A2AR-EGFP and A2AR-mCherry in pcDNA 3.1
(-) were stimulated with 1.5 µM CGS21680. A2AR induced cAMP production is indicated as percentage
over basal levels (100%). Three independent experiments were performed in triplicate. Data is analyzed
according to Student`s t-test and * indicates p < 0.05.
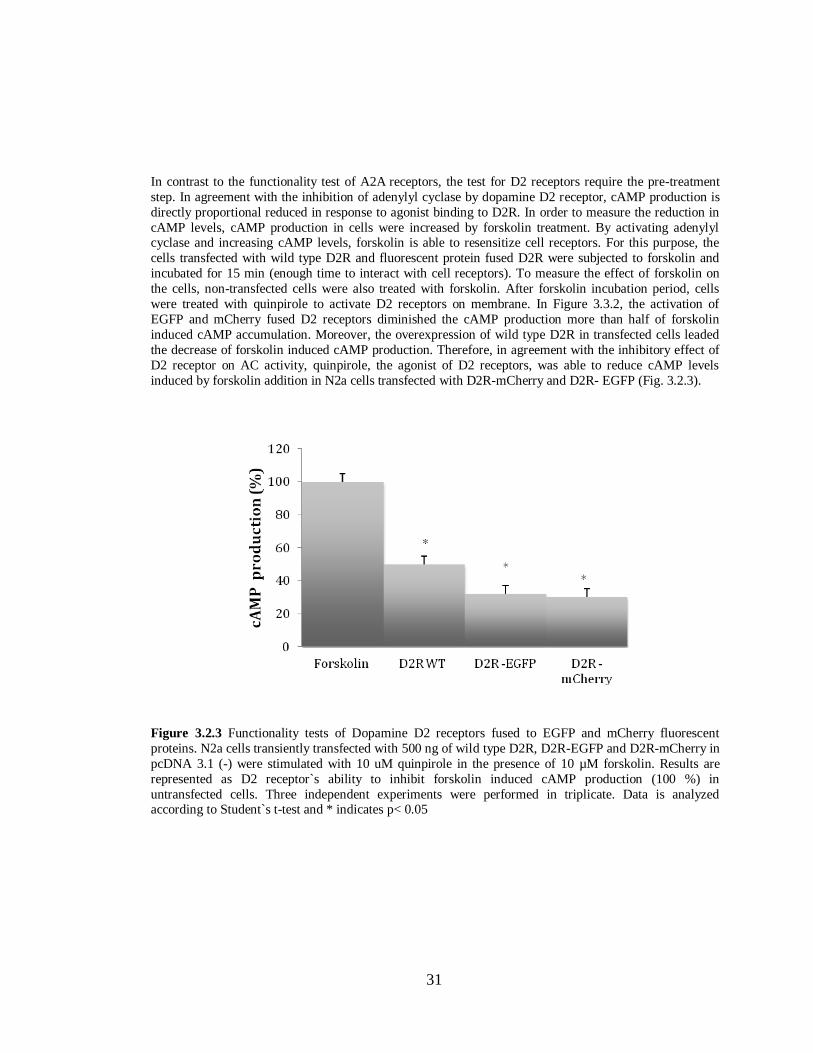
31
In contrast to the functionality test of A2A receptors, the test for D2 receptors require the pre-treatment
step. In agreement with the inhibition of adenylyl cyclase by dopamine D2 receptor, cAMP production is
directly proportional reduced in response to agonist binding to D2R. In order to measure the reduction in
cAMP levels, cAMP production in cells were increased by forskolin treatment. By activating adenylyl cyclase and increasing cAMP levels, forskolin is able to resensitize cell receptors. For this purpose, the
cells transfected with wild type D2R and fluorescent protein fused D2R were subjected to forskolin and
incubated for 15 min (enough time to interact with cell receptors). To measure the effect of forskolin on
the cells, non-transfected cells were also treated with forskolin. After forskolin incubation period, cells
were treated with quinpirole to activate D2 receptors on membrane. In Figure 3.3.2, the activation of
EGFP and mCherry fused D2 receptors diminished the cAMP production more than half of forskolin
induced cAMP accumulation. Moreover, the overexpression of wild type D2R in transfected cells leaded
the decrease of forskolin induced cAMP production. Therefore, in agreement with the inhibitory effect of
D2 receptor on AC activity, quinpirole, the agonist of D2 receptors, was able to reduce cAMP levels
induced by forskolin addition in N2a cells transfected with D2R-mCherry and D2R- EGFP (Fig. 3.2.3).
Figure 3.2.3 Functionality tests of Dopamine D2 receptors fused to EGFP and mCherry fluorescent
proteins. N2a cells transiently transfected with 500 ng of wild type D2R, D2R-EGFP and D2R-mCherry in
pcDNA 3.1 (-) were stimulated with 10 uM quinpirole in the presence of 10 µM forskolin. Results are
represented as D2 receptor`s ability to inhibit forskolin induced cAMP production (100 %) in
untransfected cells. Three independent experiments were performed in triplicate. Data is analyzed according to Student`s t-test and * indicates p< 0.05
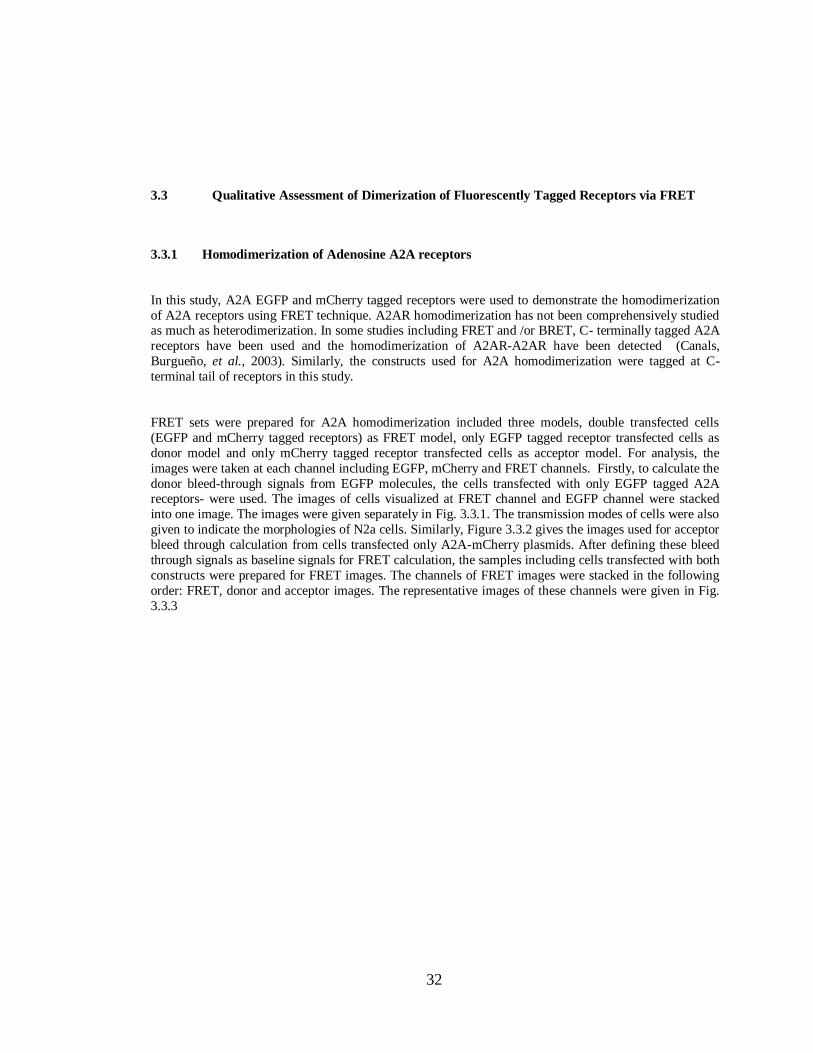
32
3.3 Qualitative Assessment of Dimerization of Fluorescently Tagged Receptors via FRET
3.3.1 Homodimerization of Adenosine A2A receptors
In this study, A2A EGFP and mCherry tagged receptors were used to demonstrate the homodimerization
of A2A receptors using FRET technique. A2AR homodimerization has not been comprehensively studied as much as heterodimerization. In some studies including FRET and /or BRET, C- terminally tagged A2A
receptors have been used and the homodimerization of A2AR-A2AR have been detected (Canals,
Burgueño, et al., 2003). Similarly, the constructs used for A2A homodimerization were tagged at C-
terminal tail of receptors in this study.
FRET sets were prepared for A2A homodimerization included three models, double transfected cells
(EGFP and mCherry tagged receptors) as FRET model, only EGFP tagged receptor transfected cells as
donor model and only mCherry tagged receptor transfected cells as acceptor model. For analysis, the
images were taken at each channel including EGFP, mCherry and FRET channels. Firstly, to calculate the
donor bleed-through signals from EGFP molecules, the cells transfected with only EGFP tagged A2A receptors- were used. The images of cells visualized at FRET channel and EGFP channel were stacked
into one image. The images were given separately in Fig. 3.3.1. The transmission modes of cells were also
given to indicate the morphologies of N2a cells. Similarly, Figure 3.3.2 gives the images used for acceptor
bleed through calculation from cells transfected only A2A-mCherry plasmids. After defining these bleed
through signals as baseline signals for FRET calculation, the samples including cells transfected with both
constructs were prepared for FRET images. The channels of FRET images were stacked in the following
order: FRET, donor and acceptor images. The representative images of these channels were given in Fig.
3.3.3
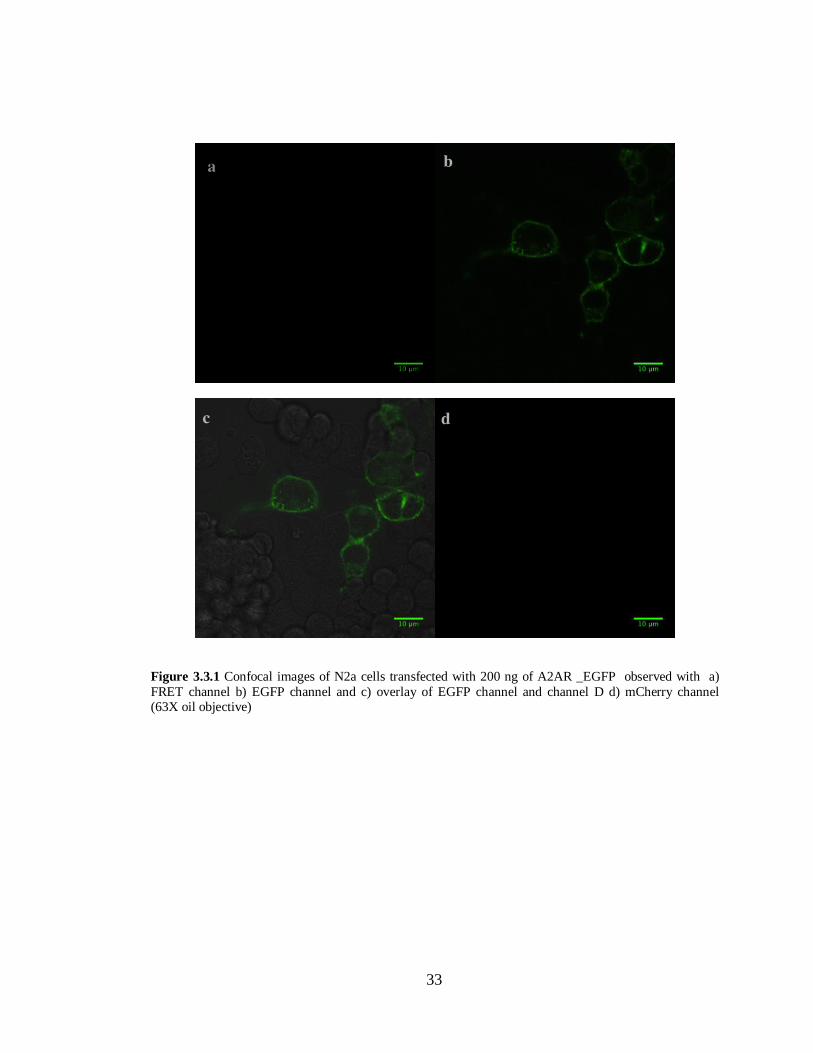
33
Figure 3.3.1 Confocal images of N2a cells transfected with 200 ng of A2AR _EGFP observed with a)
FRET channel b) EGFP channel and c) overlay of EGFP channel and channel D d) mCherry channel (63X oil objective)
34
Figure 3.3.2 Confocal images of N2a cells transfected with 200 ng of A2AR _mCherry observed with a)
FRET channel b) mCherry channel and c) overlay of mCherry channel and channel D d) EGFP channel
(63X oil objective)
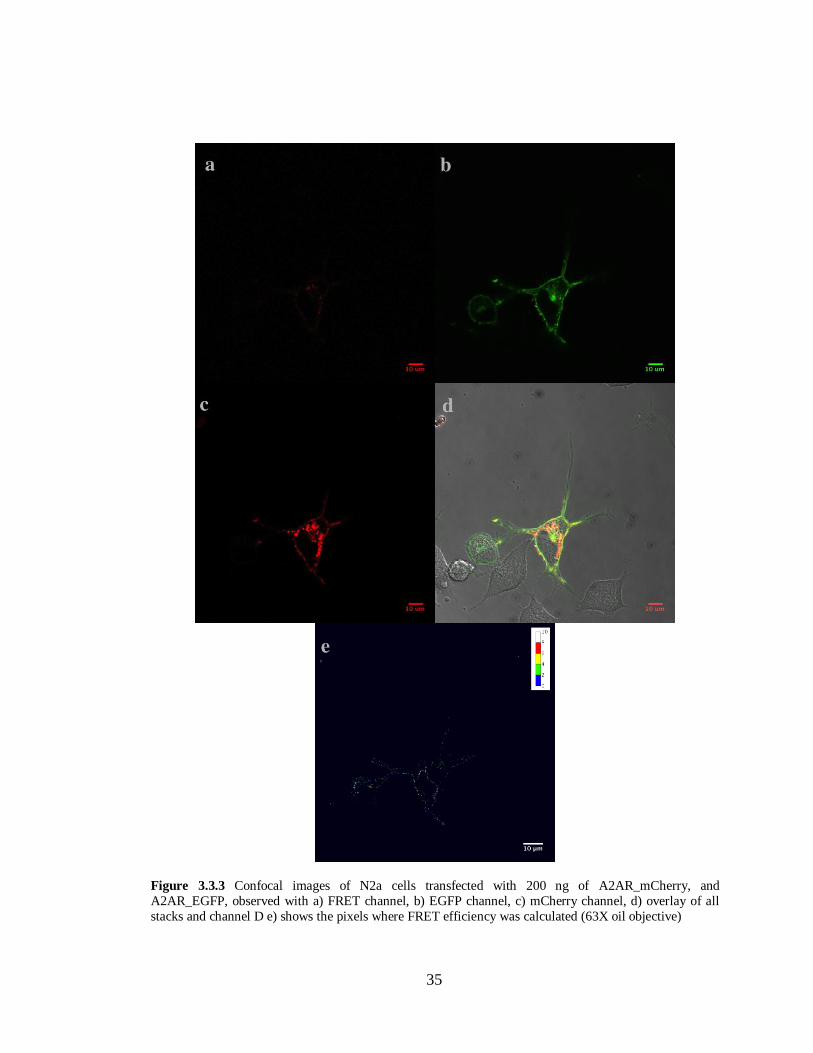
35
Figure 3.3.3 Confocal images of N2a cells transfected with 200 ng of A2AR_mCherry, and
A2AR_EGFP, observed with a) FRET channel, b) EGFP channel, c) mCherry channel, d) overlay of all
stacks and channel D e) shows the pixels where FRET efficiency was calculated (63X oil objective)
36
Consequently, plasma membrane appeared dominantly decorated by both tagged receptors, A2AR-EGFP
and A2AR-mcherry transfected in cells (Fig. 3.3.3) and also confocal images indicated the co-localization
of A2A receptors occurs mainly on the membrane (Fig. 3.3.3d). In contrast to the co-localization of
A2AR-EGFP and A2AR-mcherry in the plasma membrane, FRET signals at either membrane or
intracellular parts of cells were detectable (however calculated FRET efficiency was less than 5 %, thus
was not suitable for quantitative analysis). There may be several reasons why low FRET efficiency was obtained. Firstly, co-localization of two proteins does not always mean the two proteins are interacting. On
the contrary even though two proteins are interacting with each other, we may not observe FRET between
them since distance between the proteins are not suitable for the FRET to occur. Secondly, FRET can be
affected by the stoichiometry or orientation of acceptors to donors, which can vary with even transfection
efficiencies of plasmids. In this thesis, the position of fluorescent protein added to receptors is C-terminal
tail and obviously, the orientation of EGFP and mCherry at this position may not allow detectable FRET
to occur between these proteins. The important point in FRET studies is to catch the exact time for the
location of receptors and the interaction between them. It was quite hard to catch the optimum time for
imaging for us since the transportation of samples was required for the live cell imaging of our samples.
3.3.2 Homodimerization of Dopamine D2 Receptors
Similar to Adenosine A2A receptors, the homodimer formation between dopamine D2 receptors has been
observed (Ng et al., 1996). Particularly, C-terminally tagged dopamine D2 receptors with split Renilla
luciferase 8 have co-expressed in efficient complementation of luminescence (Loening, Fenn, Wu, &
Gambhir, 2006). Additionally, heterodimerization studies, especially FRET or BRET studies, have
included C-terminally tagged dopamine D2 receptors (Canals, Marcellino, et al., 2003). Depending on these studies, C-terminally EGFP and mCherry tagged D2 receptors –have been prepared.
FRET sets were prepared for D2R homodimerization in the same manner as the A2A receptors explained
previously. Briefly these sets included three conditions, double transfected cells (EGFP and mCherry
tagged receptors) as FRET model, only EGFP tagged receptor transfected cells as donor model and only
mCherry tagged receptor transfected cells as acceptor model. In Fig. 3.3.4 and 3.3.5, the images used for
donor and acceptor bleed through signals, respectively, were given in different channels. Additionally,
Fig. 3.3.6 indicates the representative images for FRET in D2R dimerization studies.
As indicated in images, C- terminally tagged dopamine D2 receptors seemed to be predominantly resided
at intracellular compartments. Especially, in FRET images, it has been realized that the co-localization of these receptors is strongly in the intracellular compartments. Due to intercellular retention, FRET
efficiencies at plasma membrane are very weak (Fig. 3.3.6e). Although, Guo and his colleagues have
shown that C- terminally tagged receptors have expressed in the membrane of live cells (Guo et al., 2008),
some studies including double labeling experiments indicate that dopamine D2 receptors are mostly found
in intracellular compartments. Particularly, long isoform of the dopamine D2 receptors (which we used in
this study) are mostly retained in the early secretory membranes and their distribution is essentially
restrained in the endoplasmic reticulum (Prou et al., 2001). In this study dopamine D2 receptors showed
similar distribution in cells as reported for the long isoform of dopamine D2 receptors reported by Prou et
al.. On the other hand, according to the confocal images, D2 receptors were distributed not only in
intracellular compartments but also plasma membrane that is plasma membrane has been relatively
decorated less than inside of the cell.
There are some observations that can provide the retention of Dopamine D2 receptors in intracellular
37
compartments. First of all, this is not cell – specific and not changing with time that is not delayed
transportation (Prou et al., 2001). Secondly, the failures in the folding process of proteins cause some
defect in some posttranslational modifications such as glycosylation. Theoretically, it could lead the
retrieval of the protein from Golgi complex (Gahmberg & Tolvanen, 1996). In the case of the dopamine
D2 receptors, an alternative cause can be that a defect in transport out of ER could lead a mistake in the
maturation process of receptors in polysaccharide moieties as mentioned in previous studies (Fishburn, Elazar, & Fuchs, 1995). Finally, the lack of a component in transfected cells that would be involved in the
maintenance of the receptors at the plasma membrane and also a lack of a scaffolding proteins such as
PDZ-domain proteins, but a consensus for PDZ binding is not defined for the D2 receptor which could
have help the explanation of the poor localization of dopamine D2 receptors at the plasma membrane.
From a different perspective, although EGFP and mCherry tagged dopamine D2 receptors –were
predominantly co-localized in the intracellular comportments, FRET efficiencies in these compartments
are very low (Fig 3.3.6e). The reasons can be same as detailed in section 3.3.1, Homodimerization of
Adenosine A2A receptors. Besides to in vivo complications, technical obstacles such as laser sources,
incubation of live cells and imaging processes affect the interpretation of FRET signals. In particular, the
incubation and transportation of transfected N2a cells used in this study could lead some morphological trouble in the cells. During the imaging process with confocal microscopy, mainly, the vesicular
compartments in a cell were observed. These vesicular structures may cause the accumulation of receptors
in intracellular compartments, since many signals intensified inside cells. As a conclusion, the health of
N2a cells was not good in this thesis.
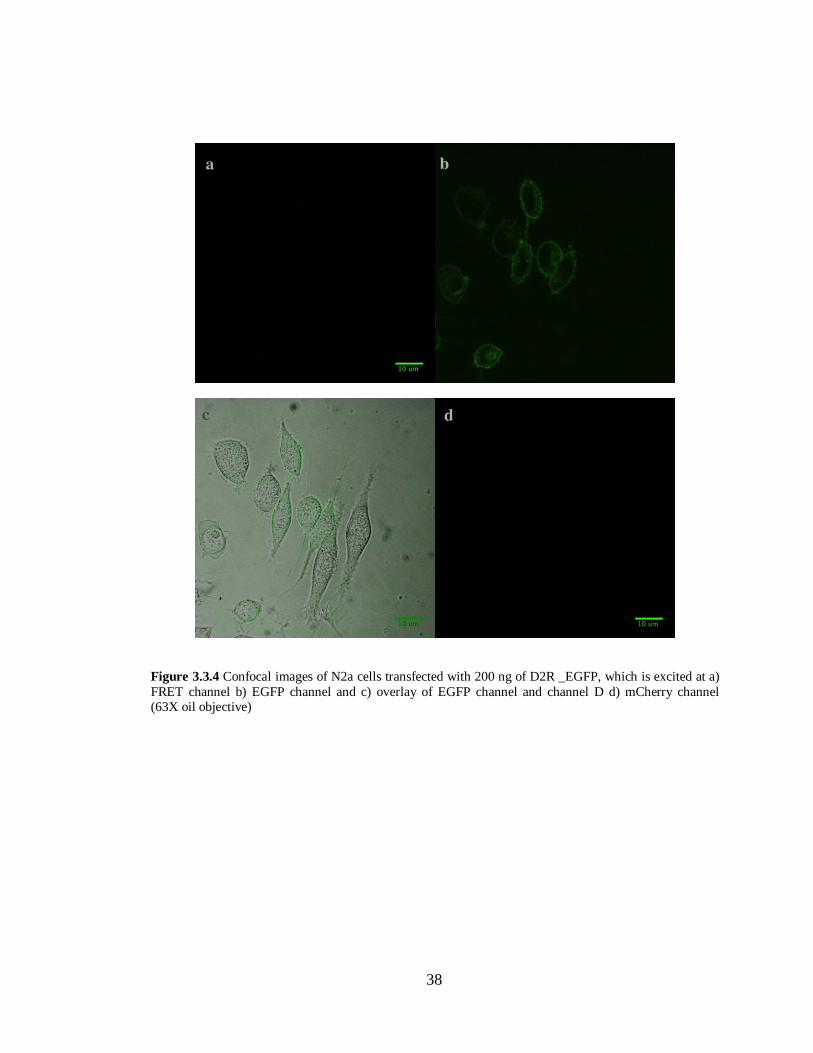
38
Figure 3.3.4 Confocal images of N2a cells transfected with 200 ng of D2R _EGFP, which is excited at a)
FRET channel b) EGFP channel and c) overlay of EGFP channel and channel D d) mCherry channel (63X oil objective)
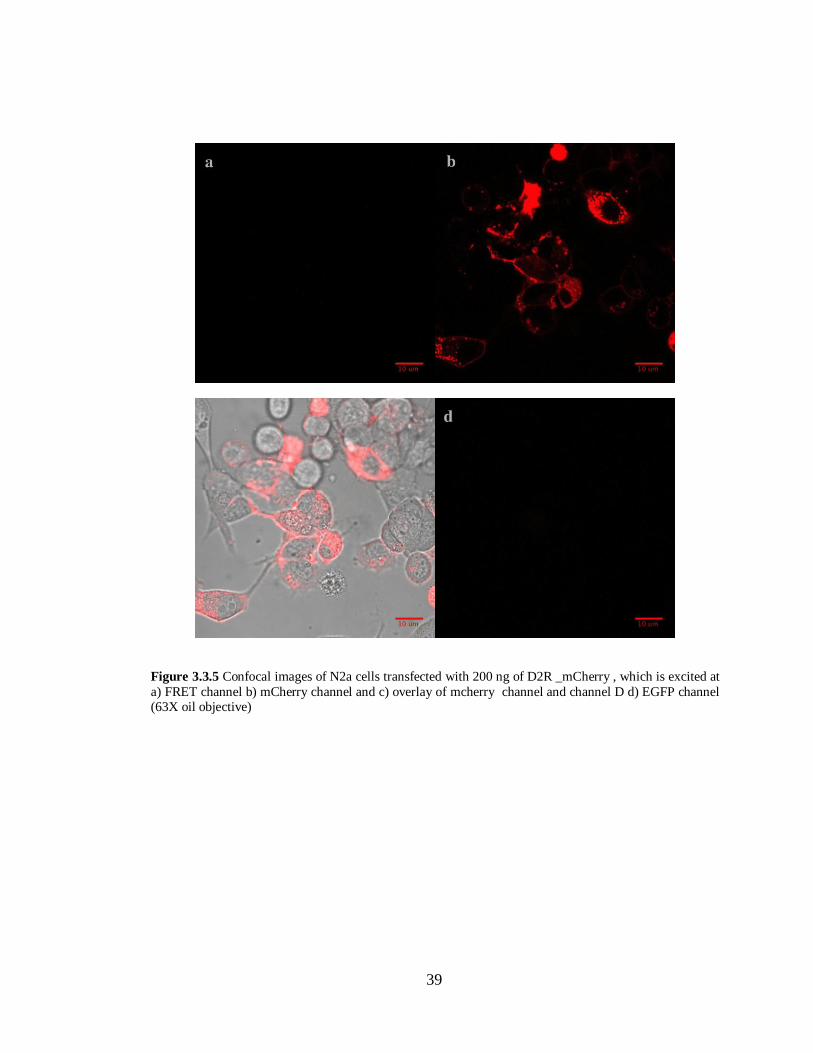
39
Figure 3.3.5 Confocal images of N2a cells transfected with 200 ng of D2R _mCherry , which is excited at
a) FRET channel b) mCherry channel and c) overlay of mcherry channel and channel D d) EGFP channel (63X oil objective)
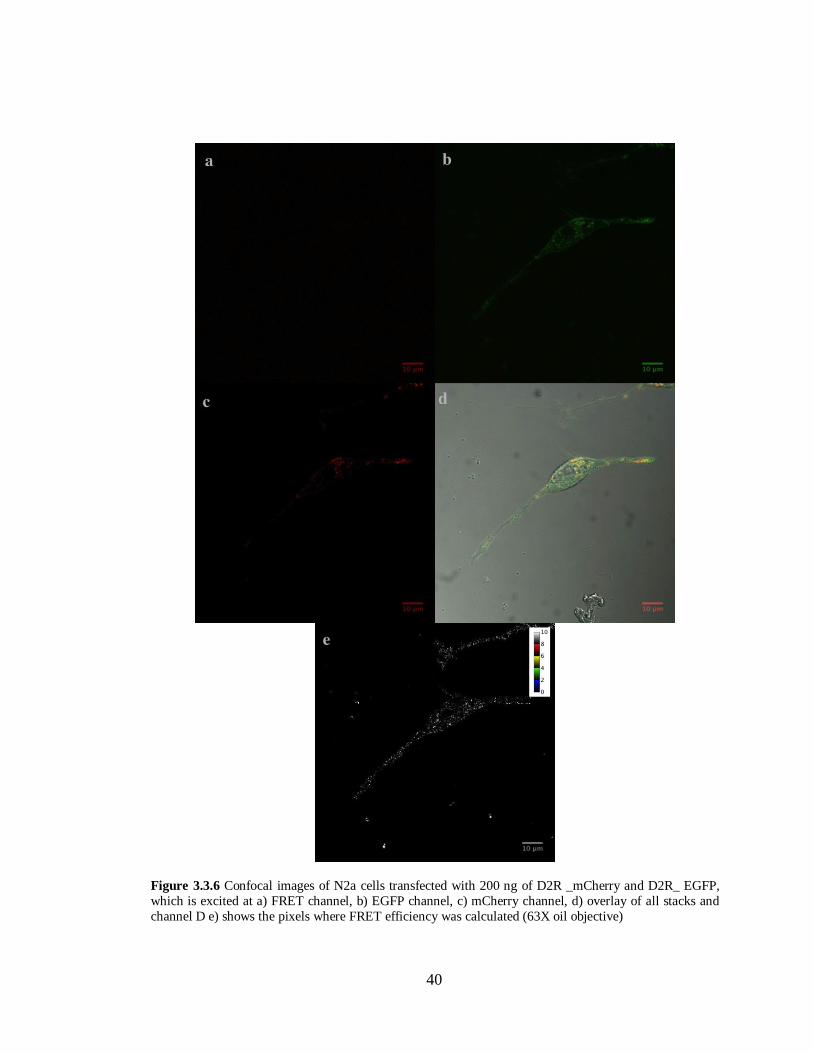
40
Figure 3.3.6 Confocal images of N2a cells transfected with 200 ng of D2R _mCherry and D2R_ EGFP,
which is excited at a) FRET channel, b) EGFP channel, c) mCherry channel, d) overlay of all stacks and
channel D e) shows the pixels where FRET efficiency was calculated (63X oil objective)
41
3.3.3. Heterodimerization of Adenosine A2A and Dopamine D2 receptors
To detect the heterodimerization between A2AR and D2R via FRET, C-terminally tagged receptors –
EGFP and mCherry were transfected into N2a cell lines. Some studies such as Canals and his colleagues
have shown that functional C-terminally tagged receptors interact with each other on the plasma membrane of HEK293T cell lines (Canals, Marcellino, et al., 2003). In this study, reciprocal FRET
samples were prepared to observe FRET between these proteins.
Similar to adenosine A2A and D2 receptors, FRET sets were prepared for heterodimerization included
three models, double transfected cells (EGFP and mCherry tagged receptors) as FRET model, only EGFP
tagged receptor transfected cells as donor model and only mCherry tagged receptor transfected cells as
acceptor model and also the samples were prepared for reciprocal pairs. Similar to homodimerization
studies, same images were used for donor and acceptor bleed through signals. Additionally, Fig. 3.3.7 and
3.3.8 indicate the representative images for FRET in heterodimerization studies.
As indicated in figures of this section, both FRET efficiencies in plasma membrane and those in the compartments in the cells are lower or weaker than that in homodimerization of these receptors. Both
constructs, A2AR / D2R –EGFP and mCherry, used in this thesis were tagged at C-terminal of receptors.
On the other hand, some studies have indicated that that the C-terminal tail of A2AR can be involved in
heterodimerization of A2A and D2 receptors (Canals, Burgueño, et al., 2003). Although the receptors
were co-localizatized, the orientation of acceptor and donor or these proteins could not be suitable for
energy transfer. Moreover, some studies indicate that homodimers of adenosine A2A receptors are more
favored than heterodimers formed by A2AR and D2R. If the dopamine D2 receptor molecules were not
enough to interact with A2A receptors, A2AR transfected into cells may have been inclined to become
homodimers. As mentioned before, cellular localization of receptors and technical complications could
directly affect FRET studies in this thesis.
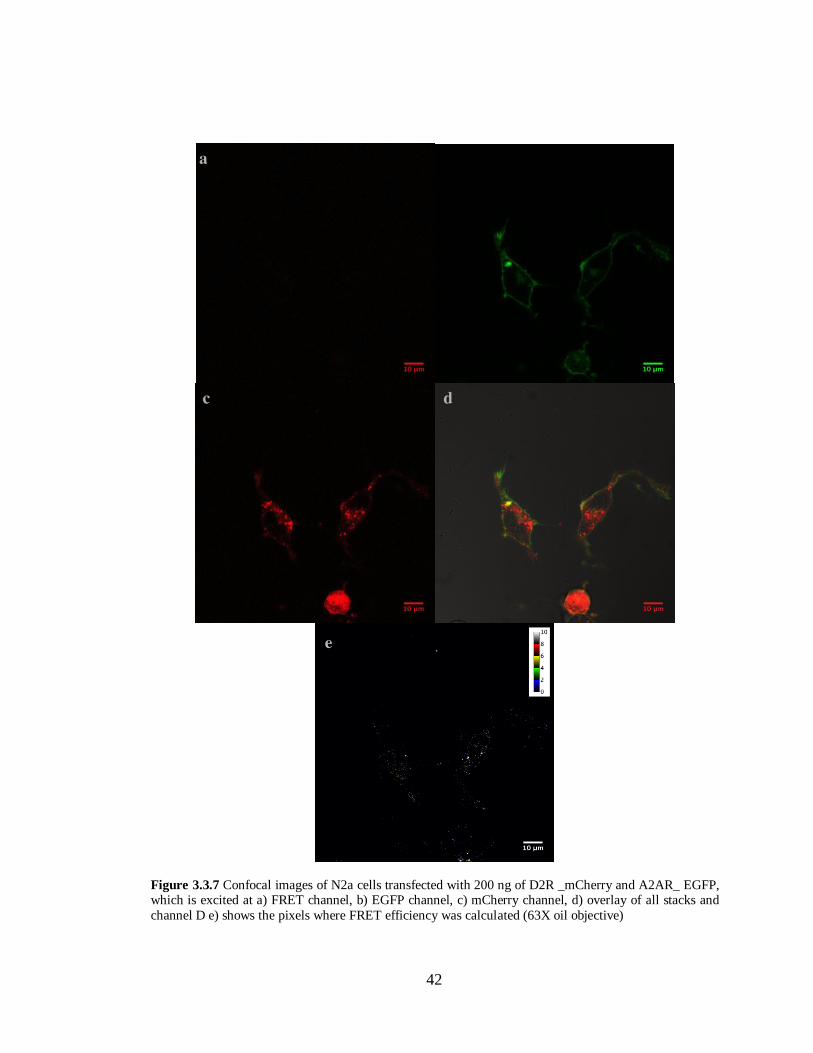
42
Figure 3.3.7 Confocal images of N2a cells transfected with 200 ng of D2R _mCherry and A2AR_ EGFP, which is excited at a) FRET channel, b) EGFP channel, c) mCherry channel, d) overlay of all stacks and
channel D e) shows the pixels where FRET efficiency was calculated (63X oil objective)
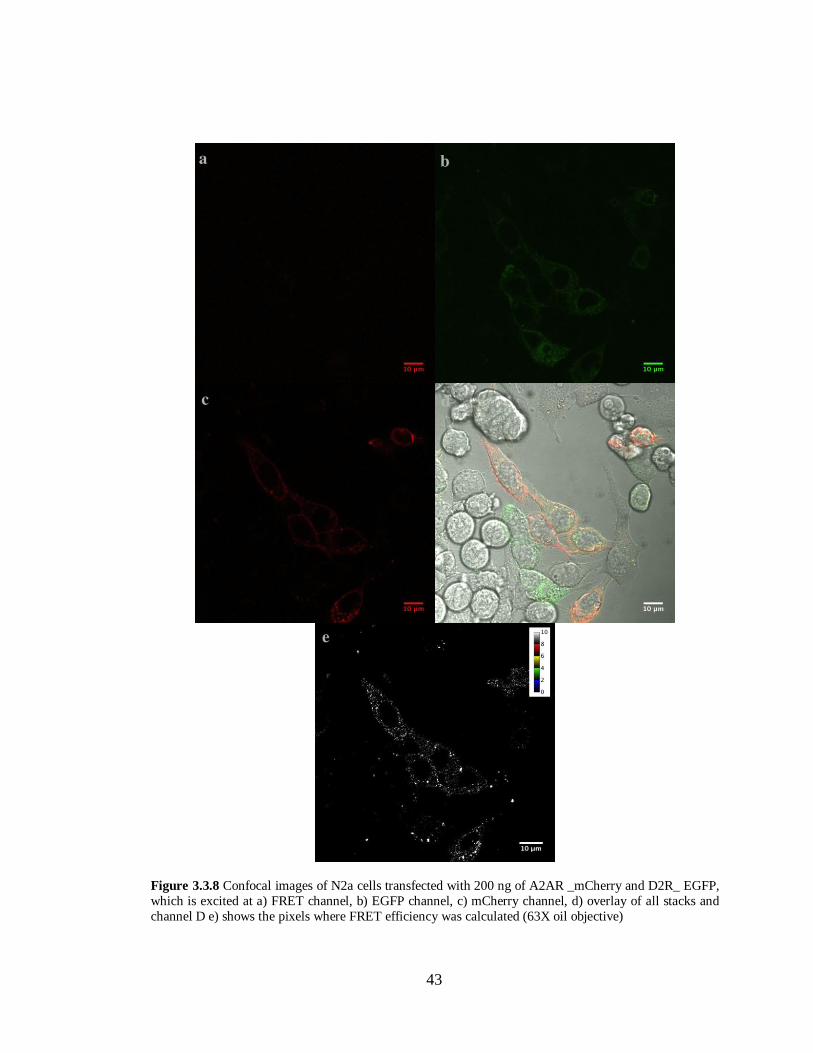
43
Figure 3.3.8 Confocal images of N2a cells transfected with 200 ng of A2AR _mCherry and D2R_ EGFP,
which is excited at a) FRET channel, b) EGFP channel, c) mCherry channel, d) overlay of all stacks and
channel D e) shows the pixels where FRET efficiency was calculated (63X oil objective)
44
As a consequence, functional C-terminally tagged A2AR and D2R constructs were used to detect
heterodimerization of these receptors, as well homodimerization of them. The colocalization of the
receptors indicates that the expressions of both receptors were found at both cellular membrane and
intracellular compartments. However, as mentioned before, intracellular retention of dopamine D2
receptors and tagging position of receptors could lead the inconvenient environment to occur FRET at membrane. Therefore, in agreement with colocalization of receptors, these receptors coexpressed at
plasma membrane for interaction; however, FRET signals are not enough to calculate the distance
between these receptors.
45
CHAPTER 4
CONCLUSION
The aims of the study were to assess the functionality of fluorescently tagged adenosine A2A and
dopamine D2 receptors expressed in N2a mouse neuroblastoma cell line and to quantitatively assess the
interaction of these two receptors as homodimerization and heterodimerization in live cells.
At the end of the study, the functionality of C- terminally tagged receptors was assessed. According to
their ability to increase or reduce cAMP production in cells, the functionality of the fusion receptors was
confirmed. Homodimerization of adenosine A2A and dopamine D2 receptors were presented, as well
heterodimerization of A2AR-D2R by using the configurations of FRET in confocal laser scanning
microscope. However, to obtain quantitative FRET signals, the position of fluorescent molecule could be
changed, to optimize fluorophore interaction.
Using FRET method, possible drugs targeted to neurophysiological disorders, dopamine and adenosine agonists/antagonists were tested. Unfortunately, no significant change in FRET was observed. The
concentration and incubation time should be optimized for future studies.
With this thesis study, a powerful, fluorescence based cell culture model to detect the homo- and hetero-
dimerization of adenosine A2A and dopamine D2 receptors has been successfully developed. This model
system is readily usable for drug screening research. Drugs that affect dopamine or adenosine signaling
can be introduced to this system and their effect on homo- and hetero-dimerization of these receptors can
be investigated very easily. Thus, this system is also useful to study/screen molecular mechanisms of some
chemicals as potential drugs.
46
REFERENCES
AbdAlla, S., Lother, H., & Quitterer, U. (2000). AT1-receptor heterodimers show enhanced G-protein
activation and altered receptor sequestration. Nature, 407(6800), 94–98.
Albertazzi, L., Arosio, D., Marchetti, L., Ricci, F., & Beltram, F. (2009). Quantitative FRET analysis with
the EGFP-mCherry fluorescent protein pair. Photochemistry and photobiology, 85(1), 287–97.
Angers, S., Salahpour, A., & Bouvier, M. (2002). Dimerization: an emerging concept for G protein-coupled receptor ontogeny and function. Annual review of pharmacology and toxicology, 42(1),
409–35.
Babcock, G. J., Farzan, M., & Sodroski, J. (2003). Ligand-independent dimerization of CXCR4, a
principal HIV-1 coreceptor. The Journal of biological chemistry, 278(5), 3378–85.
Beaulieu, J., & Gainetdinov, R. R. (2011). The Physiology , Signaling , and Pharmacology of Dopamine
Receptors, 63(1), 182–217.
Benarroch, E. E. (2008). Adenosine and its receptors . Neurology , 70 (3 ), 231–236.
Björklund, C. N. S., Ns, P. H. S., Ferré, S., Fredholm, B. B., Morelli, M., Popoli, P., & Fuxe, K. (1997).
Selected references Adenosine – dopamine receptor – receptor interactions as an integrative
mechanism in, 2236(1985), 0–5.
Bourne, H. R. (1997). How receptors talk to trimeric G proteins. Current Opinion in Cell Biology, 9(2),
134–142.
Bouvier, M. (2001). Oligomerization of G-protein-coupled transmitter receptors. Nature reviews.
Neuroscience, 2(4), 274–86.
Brambilla, R., Cottini, L., Fumagalli, M., Ceruti, S., & Abbracchio, M. P. (2003). Blockade of A2A adenosine receptors prevents basic fibroblast growth factor-induced reactive astrogliosis in rat
striatal primary astrocytes. Glia, 43(2), 190–194.
Bulenger, S., Marullo, S., & Bouvier, M. (2005). Emerging role of homo- and heterodimerization in G-
protein-coupled receptor biosynthesis and maturation. Trends in pharmacological sciences, 26(3),
131–7.
Cabrera-Vera, T. M. (2003). Insights into G Protein Structure, Function, and Regulation. Endocrine
Reviews, 24(6), 765–781.
Cadigan, K. M., & Liu, Y. I. (2006). Wnt signaling: complexity at the surface . Journal of Cell Science ,
119 (3 ), 395–402.
Canals, M., Burgueño, J., Marcellino, D., Cabello, N., Canela, E. I., Mallol, J., Agnati, L., et al. (2003).
Homodimerization of adenosine A2A receptors: qualitative and quantitative assessment by
fluorescence and bioluminescence energy transfer. Journal of Neurochemistry, 88(3), 726–734.
47
Canals, M., Marcellino, D., Fanelli, F., Ciruela, F., De Benedetti, P., Goldberg, S. R., Neve, K., et al.
(2003). Adenosine A2A-dopamine D2 receptor-receptor heteromerization: qualitative and
quantitative assessment by fluorescence and bioluminescence energy transfer. The Journal of
biological chemistry, 278(47), 46741–9.
Clegg, R. M. (1995). Fluorescence resonance energy transfer. Current opinion in biotechnology, 6(1),
103–10.
Cody, C. W., Prasher, D. C., Westler, W. M., Prendergast, F. G., & Ward, W. W. (1993). Chemical
structure of the hexapeptide chromophore of the Aequorea green-fluorescent protein. Biochemistry,
32(5), 1212–1218.
Cornea, a, Janovick, J. a, Maya-Núñez, G., & Conn, P. M. (2001). Gonadotropin-releasing hormone
receptor microaggregation. Rate monitored by fluorescence resonance energy transfer. The Journal
of biological chemistry, 276(3), 2153–8.
Dal Toso, R., Sommer, B., Ewert, M., Herb, a, Pritchett, D. B., Bach, a, Shivers, B. D., et al. (1989). The
dopamine D2 receptor: two molecular forms generated by alternative splicing. The EMBO journal,
8(13), 4025–34.
Daly, J. W. (1982). Medicinal Chemistry 0, 25(3).
Dinger, M. C., Bader, J. E., Kóbor, A. D., Kretzschmar, A. K., & Beck-Sickinger, A. G. (2003).
Homodimerization of Neuropeptide Y Receptors Investigated by Fluorescence Resonance Energy
Transfer in Living Cells . Journal of Biological Chemistry , 278 (12 ), 10562–10571.
Dorsam, R. T., & Gutkind, J. S. (2007). G-protein-coupled receptors and cancer. Nature reviews. Cancer,
7(2), 79–94.
Dunwiddie, T. V, & Masino, S. A. (2001). T HE R OLE AND R EGULATION OF A DENOSINE IN
THE C ENTRAL N ERVOUS SYSTEM, 31–55.
During, M. J., Ryder, K. M., & Spencer, D. D. (1995). Hippocampal GABA transporter function in
temporal-lobe epilepsy. Nature, 376(6536), 174–177.
Eglen, R. M., & Reisine, T. (2011). GPCRs Revisited: New Insights Lead to Novel Drugs.
Pharmaceuticals, 4(2), 244–272.
Feige, J. N., Sage, D., Wahli, W., Desvergne, B., & Gelman, L. (2005). PixFRET, an ImageJ plug-in for
FRET calculation that can accommodate variations in spectral bleed-throughs. Microscopy research
and technique, 68(1), 51–8.
Ferré, S., Ciruela, F., Canals, M., Marcellino, D., Burgueno, J., Casadó, V., Hillion, J., et al. (2004).
Adenosine A2A-dopamine D2 receptor-receptor heteromers. Targets for neuro-psychiatric
disorders. Parkinsonism & related disorders, 10(5), 265–71.
48
Fink, J. S., Weaver, D. R., Rivkees, S. A., Peterfreund, R. A., Pollack, A. E., Adler, E. M., & Reppert, S.
M. (1992). Molecular cloning of the rat A2 adenosine receptor: selective co-expression with D2
dopamine receptors in rat striatum. Molecular Brain Research, 14(3), 186–195.
Fishburn, C. S., Elazar, Z., & Fuchs, S. (1995). Differential glycosylation and intracellular trafficking for
the long and short isoforms of the D2 dopamine receptor. The Journal of biological chemistry,
270(50), 29819–24.
Floyd, D. H., Geva, A., Bruinsma, S. P., Overton, M. C., Blumer, K. J., & Baranski, T. J. (2003). C5a
Receptor Oligomerization . Journal of Biological Chemistry , 278 (37 ), 35354–35361.
Fredholm, B. B., Chen, J.-F., Masino, S. a, & Vaugeois, J.-M. (2005). Actions of adenosine at its receptors
in the CNS: insights from knockouts and drugs. Annual review of pharmacology and toxicology,
45(30), 385–412.
Fredriksson, R., Lagerström, M. C., Lundin, L.-G., & Schiöth, H. B. (2003). The G-protein-coupled
receptors in the human genome form five main families. Phylogenetic analysis, paralogon groups,
and fingerprints. Molecular pharmacology, 63(6), 1256–72.
Fukushima, Y., Asano, T., Takata, K., Funaki, M., Ogihara, T., Anai, M., Tsukuda, K., et al. (1997). Role
of the C Terminus in Histamine H2 Receptor Signaling, Desensitization, and Agonist-induced
Internalization . Journal of Biological Chemistry , 272 (31 ), 19464–19470.
Gahmberg, C. G., & Tolvanen, M. (1996). Why mammalian cell surface proteins are glycoproteins.
Trends in Biochemical Sciences, 21(8), 308–311.
Geor e, S. R., & O’Dowd, B. F. (2007). A novel dopamine receptor si nalin unit in brain:
heterooligomers of D1 and D2 dopamine receptors. TheScientificWorldJournal, 7, 58–63.
Gingrich, J. A., & Caron, M. G. (1993). RECENT ADVANCES IN THE, 299–321.
Ginés, S., Hillion, J., Torvinen, M., Le Crom, S., Casadó, V., Canela, E. I., Rondin, S., et al. (2000).
Dopamine D1 and adenosine A1 receptors form functionally interacting heteromeric complexes .
Proceedings of the National Academy of Sciences , 97 (15 ), 8606–8611.
Giros, B., Sokoloff, P., Martres, M.-P., Riou, J.-F., Emorine, L. J., & Schwartz, J.-C. (1989). Alternative
splicing directs the expression of two D2 dopamine receptor isoforms. Nature, 342(6252), 923–926.
Guo, W., Urizar, E., Kralikova, M., Mobarec, J. C., Shi, L., Filizola, M., & Javitch, J. a. (2008). Dopamine
D2 receptors form higher order oligomers at physiological expression levels. The EMBO journal,
27(17), 2293–304.
Haack, K. K. V., & McCarty, N. a. (2011). Functional Consequences of GPCR Heterodimerization:
GPCRs as Allosteric Modulators. Pharmaceuticals, 4(3), 509–523.
Hague, C., Uberti, M. a, Chen, Z., Bush, C. F., Jones, S. V, Ressler, K. J., Hall, R. a, et al. (2004). Olfactory receptor surface expression is driven by association with the beta2-adrenergic receptor.
49
Proceedings of the National Academy of Sciences of the United States of America, 101(37), 13672–
6.
Hague, C., Uberti, M. a, Chen, Z., Hall, R. a, & Minneman, K. P. (2004). Cell surface expression of
alpha1D-adrenergic receptors is controlled by heterodimerization with alpha1B-adrenergic
receptors. The Journal of biological chemistry, 279(15), 15541–9.
Hebert, T. E., Moffett, S., Morello, J. P., Loisel, T. P., Bichet, D. G., Barret, C., & Bouvier, M. (1996). A
peptide derived from a beta2-adrenergic receptor transmembrane domain inhibits both receptor
dimerization and activation. The Journal of biological chemistry, 271(27), 16384–92.
Herrick-davis, K., Grinde, E., & Mazurkiewicz, J. E. (2004). Biochemical and Biophysical
Characterization of Serotonin 5-HT 2C Receptor Homodimers on the Plasma Membrane of Living
Cells †, 13963–13971.
Hillion, J., Canals, M., Torvinen, M., Casado, V., Scott, R., Terasmaa, A., Hansson, A., et al. (2002).
Coaggregation, cointernalization, and codesensitization of adenosine A2A receptors and dopamine
D2 receptors. The Journal of biological chemistry, 277(20), 18091–7.
Hougland, J. L., Kravchuk, A. V, Herschlag, D., & Piccirilli, J. A. (2005). Functional Identification of
Catalytic Metal Ion Binding Sites within RNA. PLoS Biol, 3(9), e277.
Jordan, B. a, Trapaidze, N., Gomes, I., Nivarthi, R., & Devi, L. a. (2001). Oligomerization of opioid
receptors with beta 2-adrenergic receptors: a role in trafficking and mitogen-activated protein kinase activation. Proceedings of the National Academy of Sciences of the United States of America, 98(1),
343–8.
Jordan, B. A., & Devi, L. A. (1999). G-protein-coupled receptor heterodimerization modulates receptor
function . Nature, 399(6737), 697–700. Retrieved from http://dx.doi.org/10.1038/21441
King, A. E., Ackley, M. a, Cass, C. E., Young, J. D., & Baldwin, S. a. (2006). Nucleoside transporters:
from scavengers to novel therapeutic targets. Trends in pharmacological sciences, 27(8), 416–25.
Kirk, C. J., Maccallum, S. H., Michell, R. H., & Barker, C. J. (1990). Inositol phosphates in receptor-
mediated cell signaling: metabolic origins and interrelationships. Biotechnology and Applied
Biochemistry, 12(5), 489–495.
Klostermeier, D., & Millar, D. P. (2002). Time-resolved fluorescence resonance energy transfer: A
versatile tool for the analysis of nucleic acids. Biopolymers, 61(3), 159–179.
Kniazeff, J., Bessis, A.-S., Maurel, D., Ansanay, H., Prezeau, L., & Pin, J.-P. (2004). Closed state of both
binding domains of homodimeric mGlu receptors is required for full activity. Nat Struct Mol Biol,
11(8), 706–713.
Kobilka, B. K. (2007). NIH Public Access, 1768(4), 794–807.
50
Kolch, W., Heidecker, G., Kochs, G., Hummel, R., Vahidi, H., Mischak, H., Finkenzeller, G., et al.
(1993). Protein kinase C[alpha] activates RAF-1 by direct phosphorylation. Nature, 364(6434), 249–
252.
Kroeger, K. M., Hanyaloglu, a C., Seeber, R. M., Miles, L. E., & Eidne, K. a. (2001). Constitutive and
agonist-dependent homo-oligomerization of the thyrotropin-releasing hormone receptor. Detection
in living cells using bioluminescence resonance energy transfer. The Journal of biological
chemistry, 276(16), 12736–43.
Kroeger, K., Pfleger, K. G., & Eidne, K. (2005). Biophysical and Biochemical Methods to Study GPCR
Oligomerization. In L. Devi (Ed.), The G Protein-Coupled Receptors Handbook SE - 10 (pp. 217–
241 LA – English). Humana Press.
Lambright, D. G., Sondek, J., Bohm, A., Skiba, N. P., Hamm, H. E., & Sigler, P. B. (1996). The 2.0 A
crystal structure of a heterotrimeric G protein. Nature, 379(6563), 311–319.
Latif, R., Graves, P., & Davies, T. F. (2002). Ligand-dependent Inhibition of Oligomerization at the
Human Thyrotropin Receptor . Journal of Biological Chemistry , 277 (47 ), 45059–45067.
Lavoie, C., Mercier, J.-F., Salahpour, A., Umapathy, D., Breit, A., Villeneuve, L.-R., Zhu, W.-Z., et al.
(2002). β1/β2-Adrenergic Receptor Heterodimerization Regulates β2-Adrenergic Receptor
Internalization and ERK Signaling Efficacy . Journal of Biological Chemistry , 277 (38 ), 35402–
35410.
Lawford, B. R., Young, R., Noble, E. P., Kann, B., & Ritchie, T. (2006). The D2 dopamine receptor
(DRD2) gene is associated with co-morbid depression, anxiety and social dysfunction in untreated
veterans with post-traumatic stress disorder. European psychiatry : the journal of the Association of
European Psychiatrists, 21(3), 180–5.
Li, H., Guo, J., Gao, J., Han, L., Jiang, C., Li, H., Bai, S., et al. (2011). Role of dopamine D2 receptors in
ischemia/reperfusion induced apoptosis of cultured neonatal rat cardiomyocytes. Journal of
biomedical science, 18(1), 18.
Liang, Y., Fotiadis, D., Filipek, S., Saperstein, D. A., Palczewski, K., & Engel, A. (2003). Organization of
the G Protein-coupled Receptors Rhodopsin and Opsin in Native Membranes . Journal of Biological
Chemistry , 278 (24 ), 21655–21662.
Loening, A. M., Fenn, T. D., Wu, A. M., & Gambhir, S. S. (2006). Consensus guided mutagenesis of Renilla luciferase yields enhanced stability and light output. Protein engineering, design &
selection : PEDS, 19(9), 391–400.
MacDonald, R. L., Skerritt, J. H., & Werz, M. A. (1986). Adenosine agonists reduce voltage-dependent
calcium conductance of mouse sensory neurones in cell culture. . The Journal of Physiology , 370 (1
), 75–90.
Maggio, R., Vogel, Z., & Wess, J. (1993). Coexpression studies with mutant muscarinic/adrenergic
receptors provide evidence for intermolecular “cross-talk” between G-protein-linked receptors .
Proceedings of the National Academy of Sciences , 90 (7 ), 3103–3107.
51
Marshall, F. H., Jones, K. A., & Kaupmann, K. (1999). GABA B receptors – the first 7TM heterodimers,
20(October).
McVey, M., Ramsay, D., Kellett, E., Rees, S., Wilson, S., Pope, A. J., & Milligan, G. (2001). Monitoring
Receptor Oligomerization Using Time-resolved Fluorescence Resonance Energy Transfer and
Bioluminescence Resonance Energy Transfer . Journal of Biological Chemistry , 276 (17 ), 14092–
14099.
Milligan, G. (2004). Applications of bioluminescence- and fluorescence resonance energy transfer to drug
discovery at G protein-coupled receptors. European journal of pharmaceutical sciences : official
journal of the European Federation for Pharmaceutical Sciences, 21(4), 397–405.
Milligan, G., & Bouvier, M. (2005). Methods to monitor the quaternary structure of G protein-coupled
receptors. The FEBS journal, 272(12), 2914–25.
Min, C., Cho, D.-I., Kwon, K.-J., Kim, K.-S., Shin, C. Y., & Kim, K.-M. (2011). Novel Regulatory
Mechanism of Canonical Wnt Signaling by Dopamine D2 Receptor through Direct Interaction with
β-Catenin . Molecular Pharmacology , 80 (1 ), 68–78.
Missale, C., Nash, S. R., Robinson, S. W., Jaber, M., & Caron, M. G. (1998). Dopamine receptors: from
structure to function. Physiological reviews, 78(1), 189–225.
Monnot, C., Bihoreau, C., Conchon, S., Curnow, K. M., Corvol, P., & Clauser, E. (1996). Polar Residues
in the Transmembrane Domains of the Type 1 Angiotensin II Receptor Are Required for Binding
and Coupling . Journal of Biological Chemistry , 271 (3 ), 1507–1513.
Neer, E. J. (1995). Heterotrimeric G proteins: organizers of transmembrane signals. Cell, 80(2), 249–57.
Nelson, G., Chandrashekar, J., Hoon, M. A., Feng, L., Zhao, G., Ryba, N. J. P., & Zuker, C. S. (2002). An
amino-acid taste receptor. Nature, 416(6877), 199–202.
Neve, K. a., Seamans, J. K., & Trantham-Davidson, H. (2004). Dopamine Receptor Signaling. Journal of
Receptor and Signal Transduction Research, 24(3), 165–205.
N , G. Y. K., O’Dowd, B. F., Lee, S. P., Chun , H. T., Brann, M. R., Seeman, P., & Geor e, S. R. (1996).
Dopamine D2 Receptor Dimers and Receptor-Blocking Peptides. Biochemical and Biophysical
Research Communications, 227(1), 200–204.
Novi, F., Stanasila, L., Giorgi, F., Corsini, G. U., Cotecchia, S., & Maggio, R. (2005). Paired Activation of
Two Components within Muscarinic M3 Receptor Dimers Is Required for Recruitment of β-
Arrestin-1 to the Plasma Membrane . Journal of Biological Chemistry , 280 (20 ), 19768–19776.
Olah, M. E., Ren, H., & Stiles, G. L. (1995). Adenosine receptors: protein and gene structure. Archives
internationales de pharmacodynamie et de therapie, 329(1), 135–150.
Overton, M. C., & Blumer, K. J. (2000). G-protein-coupled receptors function as oligomers in vivo.
Current biolo y : CB, 10(6), 341–4.
52
Parrill, A. L., & Bautista, D. L. (2010). GPCR Conformations: Implications for Rational Drug Design.
Pharmaceuticals, 4(1), 7–43.
Pfeiffer, M., Koch, T., Schröder, H., Laugsch, M., Höllt, V., & Schulz, S. (2002). Heterodimerization of
Somatostatin and Opioid Receptors Cross-modulates Phosphorylation, Internalization, and
Desensitization . Journal of Biological Chemistry , 277 (22 ), 19762–19772.
Popoli, P., Blum, D., Martire, A., Ledent, C., Ceruti, S., & Abbracchio, M. P. (2007). Functions,
dysfunctions and possible therapeutic relevance of adenosine A2A receptors in Huntin ton’s
disease. Progress in neurobiology, 81(5-6), 331–48.
Prou, D., Gu, W. J., Le Crom, S., Vincent, J. D., Salamero, J., & Vernier, P. (2001). Intracellular retention
of the two isoforms of the D(2) dopamine receptor promotes endoplasmic reticulum disruption.
Journal of cell science, 114(Pt 19), 3517–27.
Ribeiro, J. a., Sebastião, a. M., & De Mendonça, a. (2002). Adenosine receptors in the nervous system:
pathophysiological implications. Progress in Neurobiology, 68(6), 377–392.
Rios, C. D., Jordan, B. a, Gomes, I., & Devi, L. a. (2001). G-protein-coupled receptor dimerization:
modulation of receptor function. Pharmacology & therapeutics, 92(2-3), 71–87.
Rocheville, M., Lange, D. C., Kumar, U., Sasi, R., Patel, R. C., & Patel, Y. C. (2000). Subtypes of the
Somatostatin Receptor Assemble as Functional Homo- and Heterodimers . Journal of Biological
Chemistry , 275 (11 ), 7862–7869.
Roess, D. A., & Smith, S. M. L. (2003). Self-Association and Raft Localization of Functional Luteinizing
Hormone Receptors . Biology of Reproduction , 69 (6 ), 1765–1770.
Rohrer, D. K., & Kobilka, B. K. (1998). G protein-coupled receptors: functional and mechanistic insights
through altered gene expression. Physiological reviews, 78(1), 35–52.
Sawynok, J., & Liu, X. J. (2003). Adenosine in the spinal cord and periphery: release and regulation of
pain. Progress in Neurobiology, 69(5), 313–340.
Schapira, A. H. V, Bezard, E., Brotchie, J., Calon, F., Collingridge, G. L., Ferger, B., Hengerer, B., et al.
(2006). Novel pharmacolo ical tar ets for the treatment of Parkinson’s disease. Nat Rev Dru
Discov, 5(10), 845–854.
Schmitt, J. M., & Stork, P. J. S. (2002a). Gα and Gβγ Require Distinct Src-dependent Pathways to
Activate Rap1 and Ras . Journal of Biological Chemistry , 277 (45 ), 43024–43032.
Schmitt, J. M., & Stork, P. J. S. (2002b, January 1). PKA Phosphorylation of Src Mediates cAMP’s
Inhibition of Cell Growth via Rap1. Molecular cell. Cell Press.
Shaner, N. C., Lin, M. Z., Mckeown, M. R., Steinbach, P. A., Hazelwood, K. L., Davidson, M. W., &
Tsien, R. Y. (2008). Improving the photostability of bright monomeric orange and red fluorescent
proteins, 5(6).
53
Shi, Y., Liu, X., Gebremedhin, D., Falck, J. R., David, R., & Koehler, R. C. (2009). NIH Public Access,
28(1), 111–125.
Shi, Y., Liu, X., Gebremedhin, D., Falck, J. R., Harder, D. R., & Koehler, R. C. (2007). Interaction of
mechanisms involving epoxyeicosatrienoic acids, adenosine receptors, and metabotropic glutamate
receptors in neurovascular coupling in rat whisker barrel cortex. J Cereb Blood Flow Metab, 28(1),
111–125.
Shimomura, O., Johnson, F. H., & Saiga, Y. (1962). Extraction, Purification and Properties of Aequorin, a
Bioluminescent Protein from the Luminous Hydromedusan, Aequorea. Journal of Cellular and
Comparative Physiology, 59(3), 223–239.
Soriano, A., Ventura, R., Molero, A., Hoen, R., Casadó, V., Cortés, A., Fanelli, F., et al. (2009).
Adenosine A2A receptor-antagonist/dopamine D2 receptor-agonist bivalent ligands as
pharmacological tools to detect A2A-D2 receptor heteromers. Journal of medicinal chemistry,
52(18), 5590–602.
Sullivan, G. W., Linden, J., Buster, B. L., & Scheld, W. M. (1999). Neutrophil A2A Adenosine Receptor
Inhibits Inflammation in a Rat Model of Meningitis: Synergy with the Type IV Phosphodiesterase
Inhibitor, Rolipram . Journal of Infectious Diseases , 180 (5 ), 1550–1560.
Takeda, S., Kadowaki, S., Haga, T.,& Takaesu, H. (2002). Identification of G protein-coupled receptor
genes from the human genome sequence, 520.
Terrillon, S., & Bouvier, M. (2004). Roles of G-protein-coupled receptor dimerization. EMBO reports,
5(1), 30–4.
Thanos, P. K., Rivera, S. N., Weaver, K., Grandy, D. K., Rubinstein, M., Umegaki, H., Wang, G. J., et al. (2005). Dopamine D2R DNA transfer in dopamine D2 receptor-deficient mice: effects on ethanol
drinking. Life sciences, 77(2), 130–9.
Thomsen, W., Frazer, J., & Unett, D. (2005). Functional assays for screening GPCR targets. Current
opinion in biotechnology, 16(6), 655–65.
Trussell, L. O., & Jackson, M. B. (1985). Adenosine-activated potassium conductance in cultured striatal
neurons . Proceedings of the National Academy of Sciences , 82 (14 ), 4857–4861.
Villemure, J.-F., Adam, L., Bevan, N. J., Gearing, K., Chénier, S., & Bouvier, M. (2005). Subcellular
distribution of GABA(B) receptor homo- and hetero-dimers. The Biochemical journal, 388(Pt 1),
47–55. doi:10.1042/BJ20041435
Von Euler, G., Sexton, P. M., Christopoulos, A., & Hick, C. A. (n.d.). Second Messenger Assays for G
Protein-coupled Receptors :
Végh, a, Papp, J. G., Semeraro, C., Fatehi-Hasanabad, Z., & Parratt, J. R. (1998). The dopamine receptor
agonist Z1046 reduces ischaemia severity in a canine model of coronary artery occlusion. European
journal of pharmacology, 344(2-3), 203–13.
54
Ward, D. T., Brown, E. M., & Harris, H. W. (1998). Disulfide Bonds in the Extracellular Calcium-
Polyvalent Cation-sensing Receptor Correlate with Dimer Formation and Its Response to Divalent
Cations in Vitro . Journal of Biological Chemistry , 273 (23 ), 14476–14483.
Wurch, T., Matsumoto, A., & Pauwels, P. J. (2001). Agonist-independent and -dependent oligomerization
of dopamine D2 receptors by fusion to fluorescent proteins. FEBS Letters, 507(1), 109–113.
Xu, K., Bastia, E., & Schwarzschild, M. (2005). Therapeutic potential of adenosine A2A receptor
anta onists in Parkinson’s disease. Pharmacolo y & Therapeutics, 105(3), 267–310.
Yao Wei-Dong, Spealman Roger D, Z. J. (2008). NIH Public Access, 75(11), 2055–2069.
Yu, L., Huang, Z., Mariani, J., Wang, Y., Moskowitz, M., & Chen, J.-F. (2004). Selective inactivation or
reconstitution of adenosine A2A receptors in bone marrow cells reveals their significant
contribution to the development of ischemic brain injury. Nat Med, 10(10), 1081–1087.
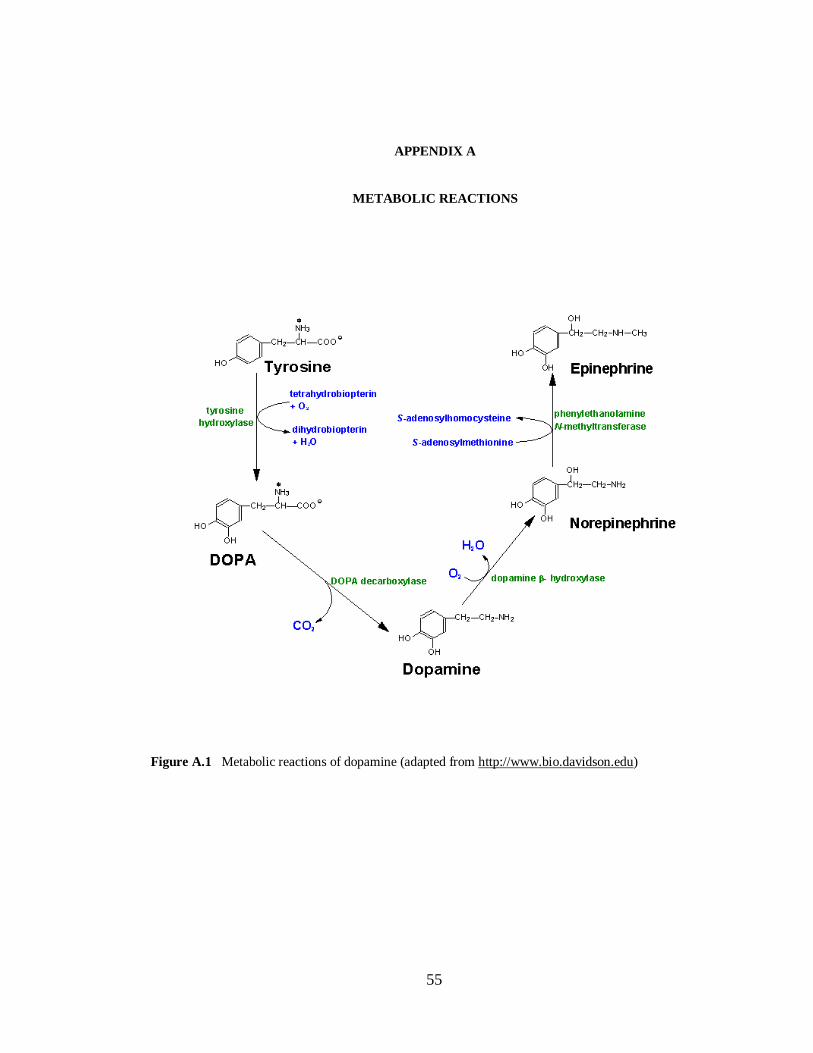
55
APPENDIX A
METABOLIC REACTIONS
Figure A.1 Metabolic reactions of dopamine (adapted from http://www.bio.davidson.edu)
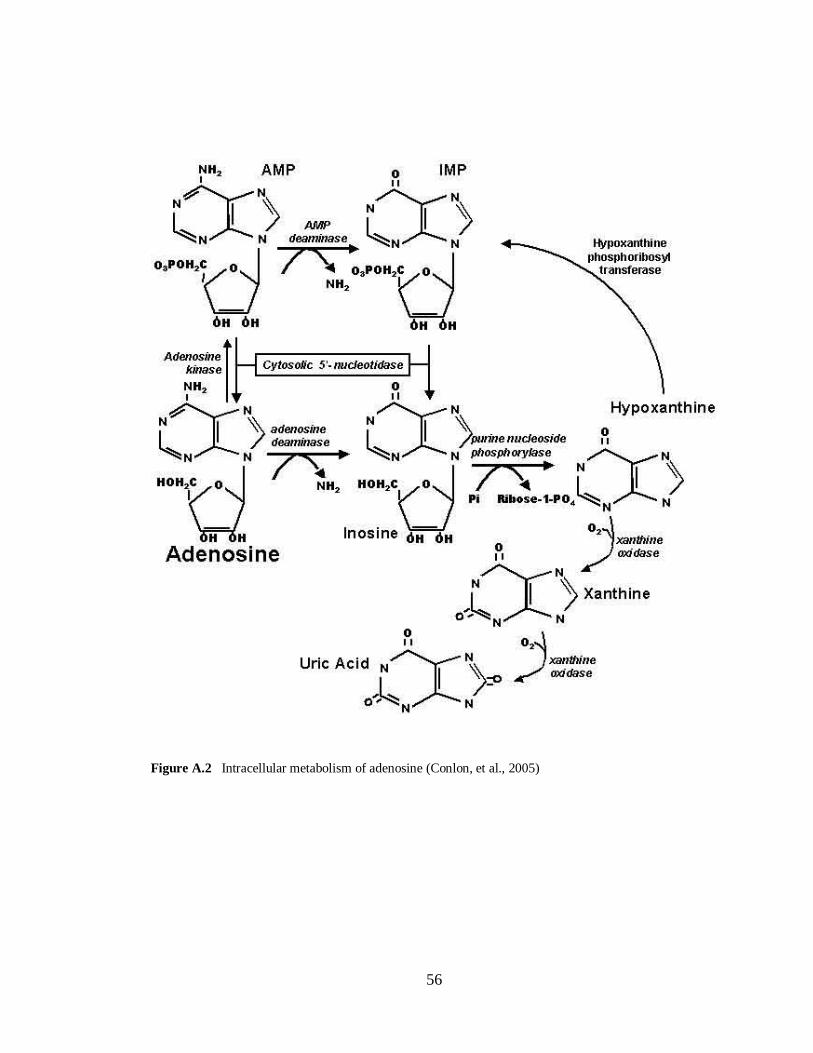
56
Figure A.2 Intracellular metabolism of adenosine (Conlon, et al., 2005)
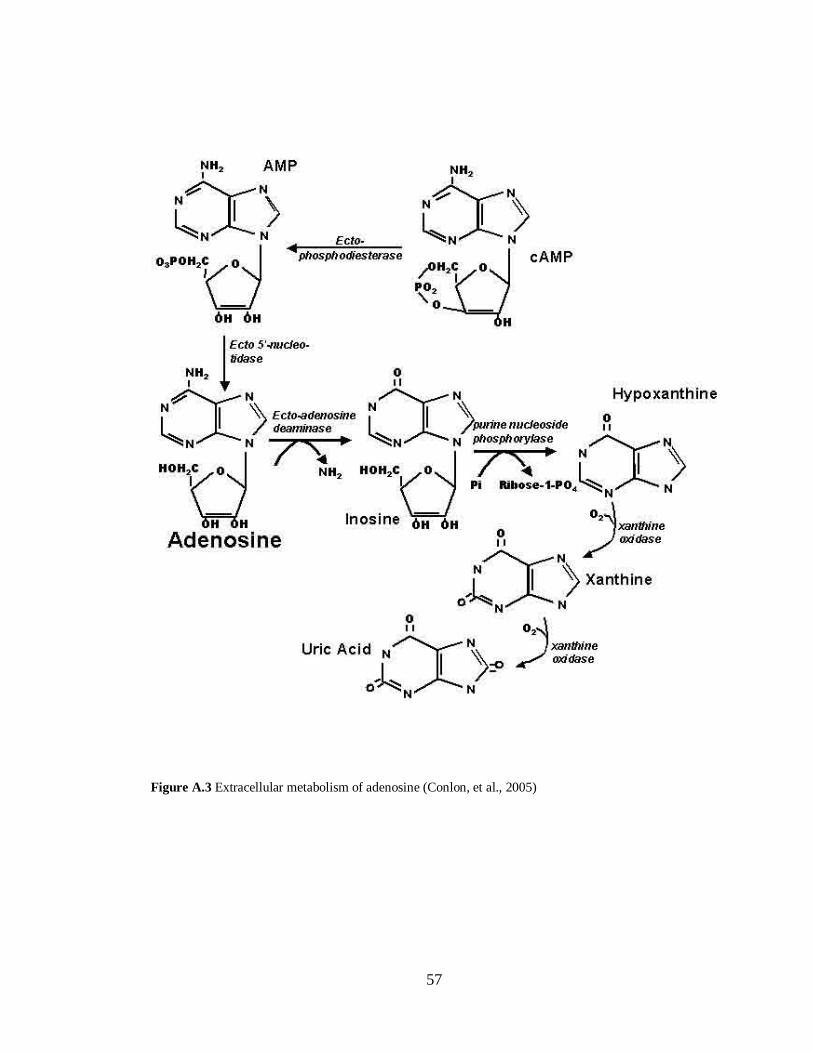
57
Figure A.3 Extracellular metabolism of adenosine (Conlon, et al., 2005)
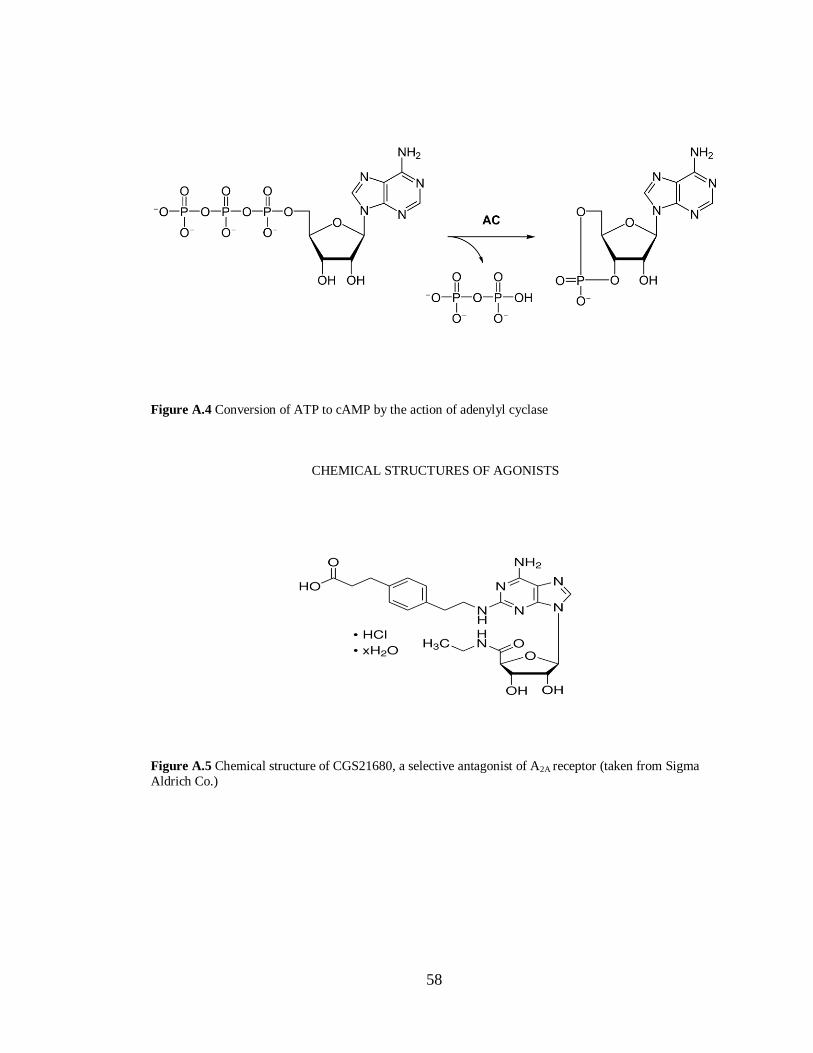
58
Figure A.4 Conversion of ATP to cAMP by the action of adenylyl cyclase
CHEMICAL STRUCTURES OF AGONISTS
Figure A.5 Chemical structure of CGS21680, a selective antagonist of A2A receptor (taken from Sigma
Aldrich Co.)
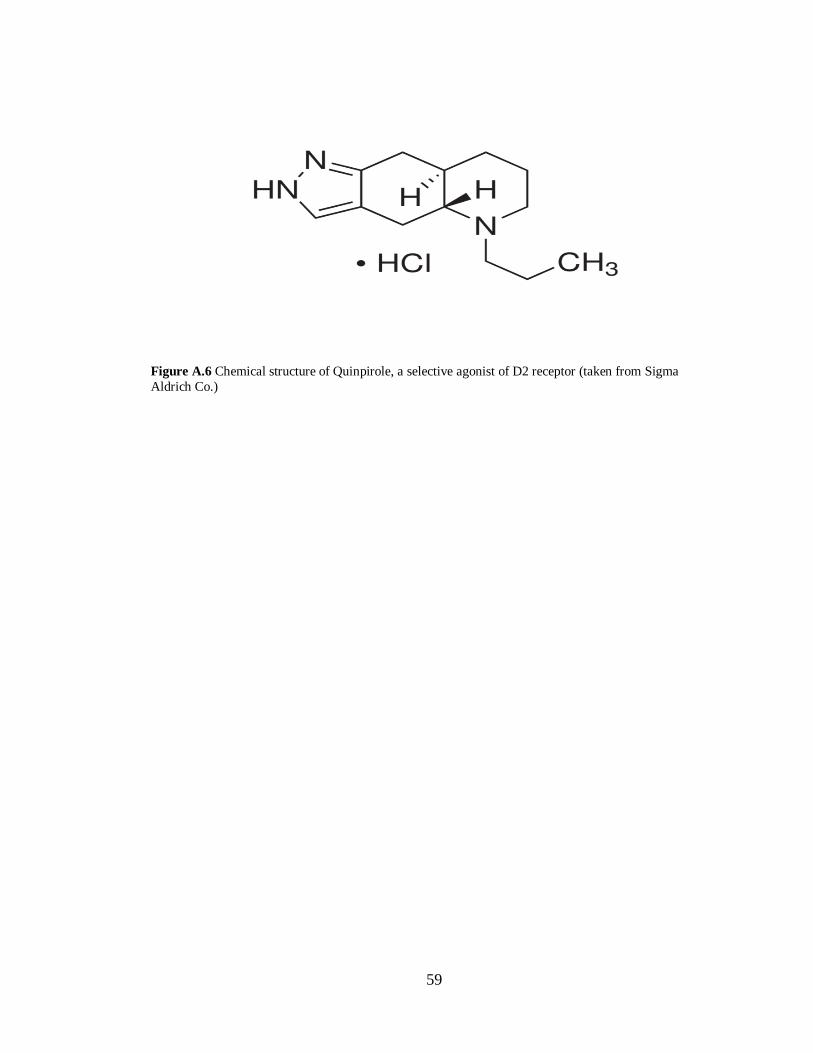
59
Figure A.6 Chemical structure of Quinpirole, a selective agonist of D2 receptor (taken from Sigma
Aldrich Co.)

60
APPENDIX B
NEURO2A CELL CULTURE MEDIUM
Table B.1 Composition of D-MEM with High Glucose
COMPONENT
CONCENTRATION (mg/L)
Amino acids
Glycine 30
L-Arginine hydrochloride 84
L-Cysteine 2HCl 63
L-Glutamine 580
L-Histidine hydrochloride-H2O 42
L-Isoleucine 105
L-Leucine 105
L-Lysine hydrochloride 146
L-Methionine 30
L-Phenylalanine 66
L-Serine 42
L-Threonine 95
L-Tryptophan 16
L-Tyrosine 72
L-Valine 94
Vitamins
Choline chloride 4
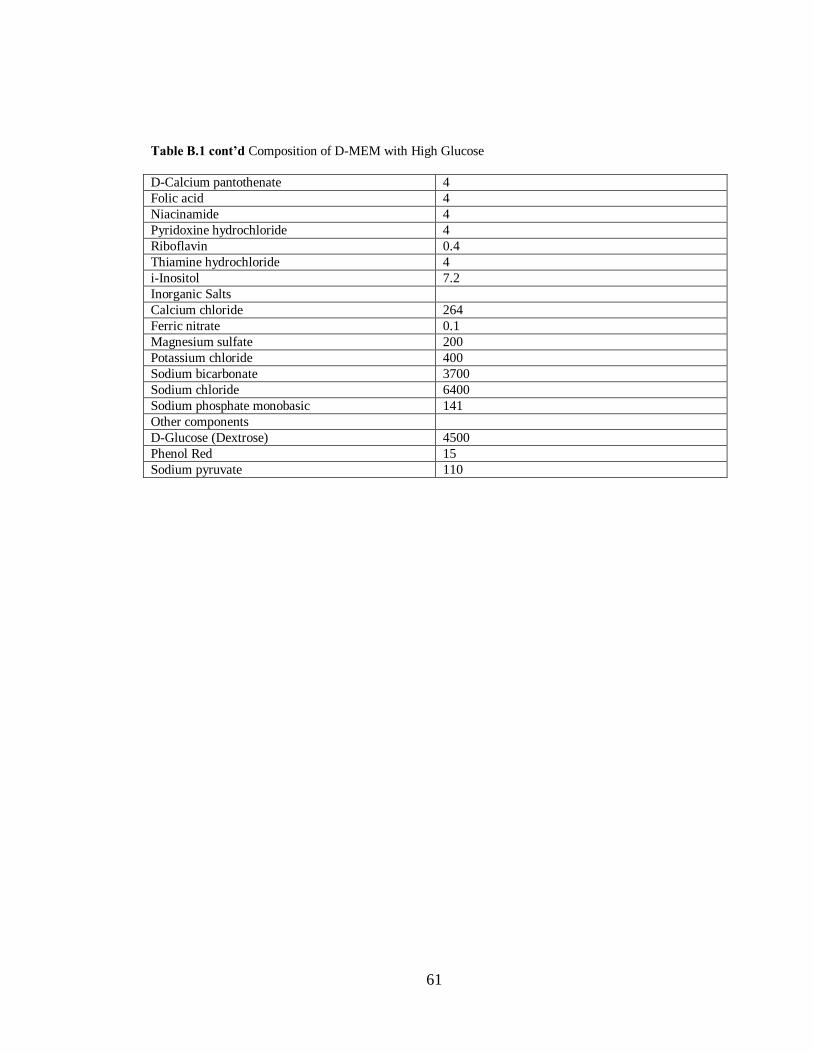
61
Table B.1 cont’d Composition of D-MEM with High Glucose
D-Calcium pantothenate 4
Folic acid 4
Niacinamide 4
Pyridoxine hydrochloride 4
Riboflavin 0.4
Thiamine hydrochloride 4
i-Inositol 7.2
Inorganic Salts
Calcium chloride 264
Ferric nitrate 0.1
Magnesium sulfate 200
Potassium chloride 400
Sodium bicarbonate 3700
Sodium chloride 6400
Sodium phosphate monobasic 141
Other components
D-Glucose (Dextrose) 4500
Phenol Red 15
Sodium pyruvate 110

62
APPENDIX C
BACTERIAL CULTURE MEDIA PREPARATION
Luria- Bertani (LB) Medium
10 g/L tryptone
5 g /L yeast extract
5 g/L NaCl
15 g/L agar is added to LB for solid agar medium preparation.
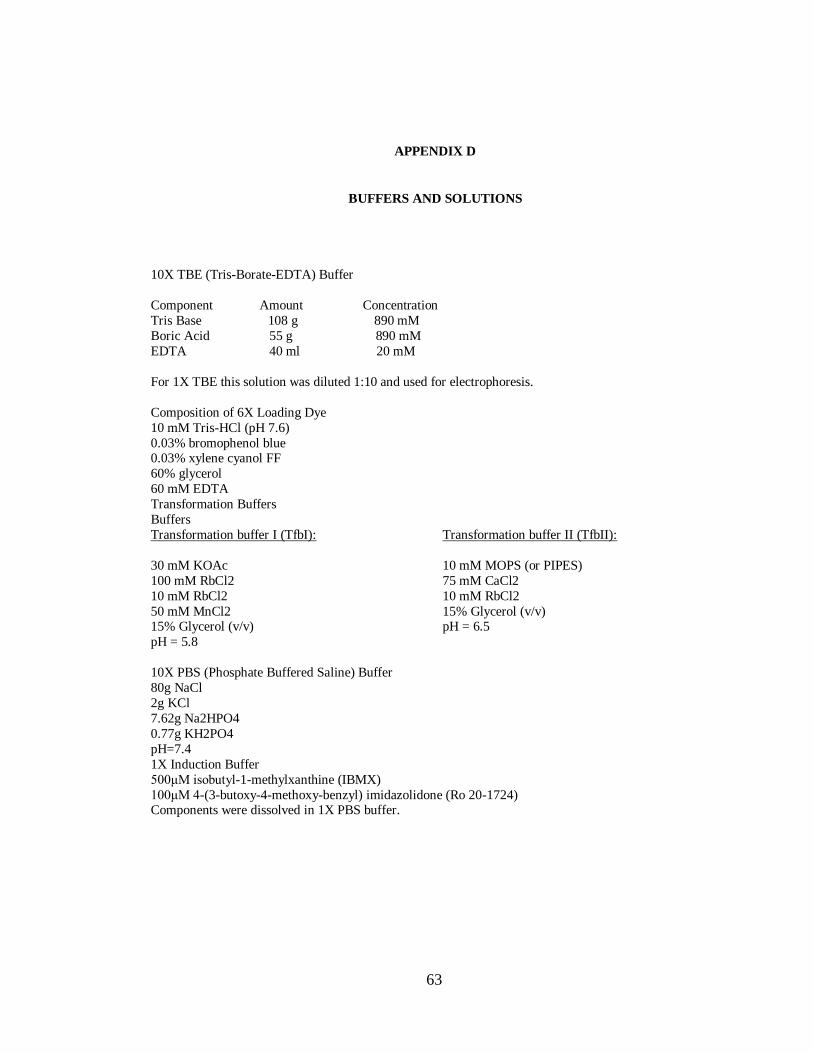
63
APPENDIX D
BUFFERS AND SOLUTIONS
10X TBE (Tris-Borate-EDTA) Buffer
Component Amount Concentration
Tris Base 108 g 890 mM
Boric Acid 55 g 890 mM
EDTA 40 ml 20 mM
For 1X TBE this solution was diluted 1:10 and used for electrophoresis.
Composition of 6X Loading Dye
10 mM Tris-HCl (pH 7.6)
0.03% bromophenol blue 0.03% xylene cyanol FF
60% glycerol
60 mM EDTA
Transformation Buffers
Buffers
Transformation buffer I (TfbI):
30 mM KOAc
100 mM RbCl2
10 mM RbCl2
50 mM MnCl2 15% Glycerol (v/v)
pH = 5.8
Transformation buffer II (TfbII):
10 mM MOPS (or PIPES)
75 mM CaCl2
10 mM RbCl2
15% Glycerol (v/v) pH = 6.5
10X PBS (Phosphate Buffered Saline) Buffer
80g NaCl
2g KCl
7.62g Na2HPO4
0.77g KH2PO4
pH=7.4
1X Induction Buffer
500μM isobutyl-1-methylxanthine (IBMX)
100μM 4-(3-butoxy-4-methoxy-benzyl) imidazolidone (Ro 20-1724) Components were dissolved in 1X PBS buffer.
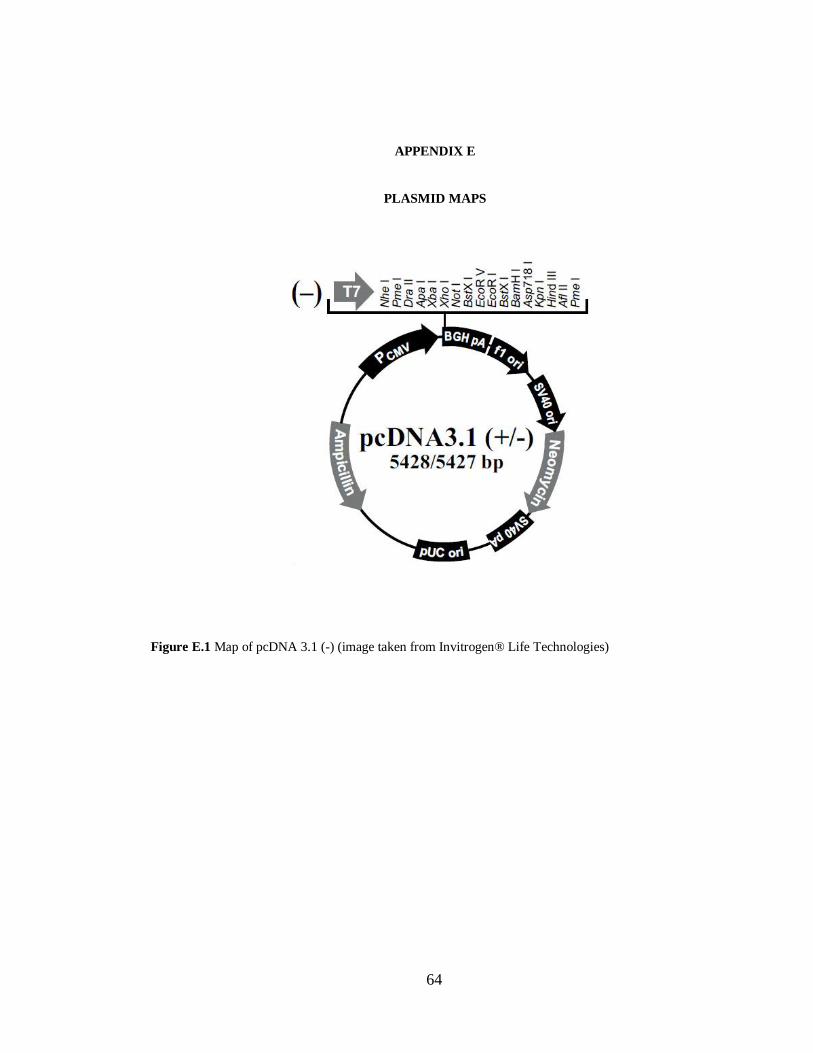
64
APPENDIX E
PLASMID MAPS
Figure E.1 Map of pcDNA 3.1 (-) (image taken from Invitrogen® Life Technologies)
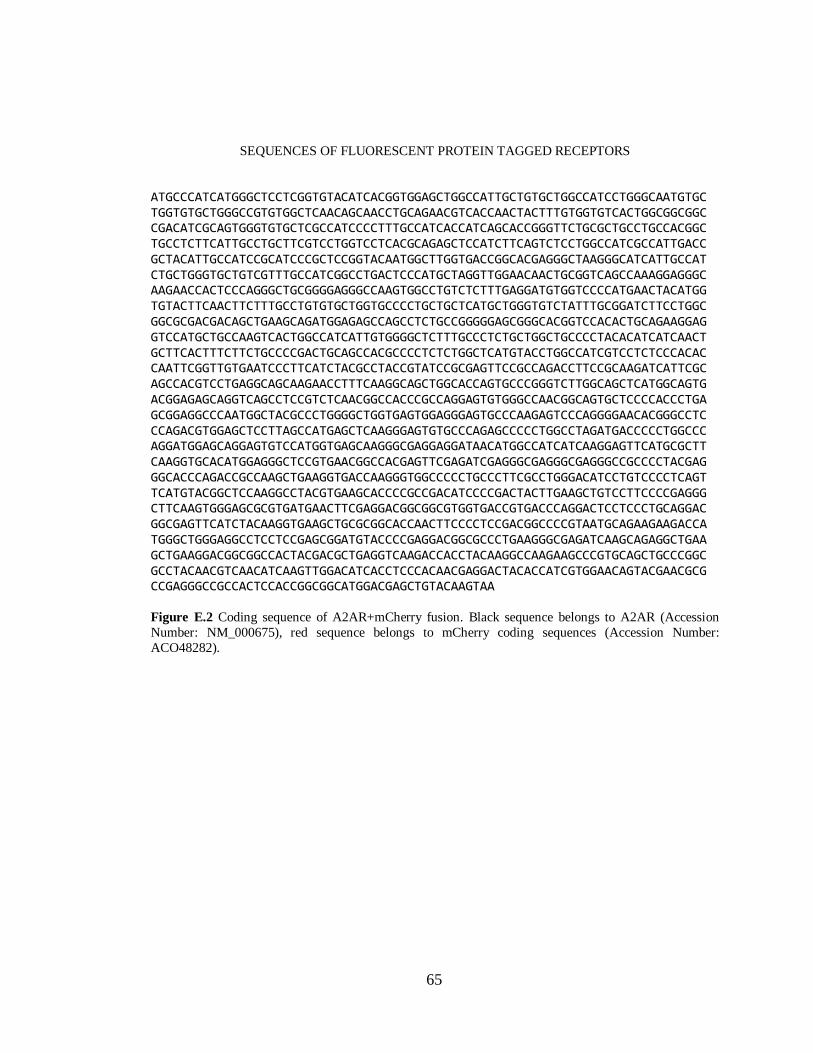
65
SEQUENCES OF FLUORESCENT PROTEIN TAGGED RECEPTORS
ATGCCCATCATGGGCTCCTCGGTGTACATCACGGTGGAGCTGGCCATTGCTGTGCTGGCCATCCTGGGCAATGTGCTGGTGTGCTGGGCCGTGTGGCTCAACAGCAACCTGCAGAACGTCACCAACTACTTTGTGGTGTCACTGGCGGCGGCCGACATCGCAGTGGGTGTGCTCGCCATCCCCTTTGCCATCACCATCAGCACCGGGTTCTGCGCTGCCTGCCACGGCTGCCTCTTCATTGCCTGCTTCGTCCTGGTCCTCACGCAGAGCTCCATCTTCAGTCTCCTGGCCATCGCCATTGACCGCTACATTGCCATCCGCATCCCGCTCCGGTACAATGGCTTGGTGACCGGCACGAGGGCTAAGGGCATCATTGCCATCTGCTGGGTGCTGTCGTTTGCCATCGGCCTGACTCCCATGCTAGGTTGGAACAACTGCGGTCAGCCAAAGGAGGGCAAGAACCACTCCCAGGGCTGCGGGGAGGGCCAAGTGGCCTGTCTCTTTGAGGATGTGGTCCCCATGAACTACATGGTGTACTTCAACTTCTTTGCCTGTGTGCTGGTGCCCCTGCTGCTCATGCTGGGTGTCTATTTGCGGATCTTCCTGGCGGCGCGACGACAGCTGAAGCAGATGGAGAGCCAGCCTCTGCCGGGGGAGCGGGCACGGTCCACACTGCAGAAGGAGGTCCATGCTGCCAAGTCACTGGCCATCATTGTGGGGCTCTTTGCCCTCTGCTGGCTGCCCCTACACATCATCAACTGCTTCACTTTCTTCTGCCCCGACTGCAGCCACGCCCCTCTCTGGCTCATGTACCTGGCCATCGTCCTCTCCCACACCAATTCGGTTGTGAATCCCTTCATCTACGCCTACCGTATCCGCGAGTTCCGCCAGACCTTCCGCAAGATCATTCGCAGCCACGTCCTGAGGCAGCAAGAACCTTTCAAGGCAGCTGGCACCAGTGCCCGGGTCTTGGCAGCTCATGGCAGTGACGGAGAGCAGGTCAGCCTCCGTCTCAACGGCCACCCGCCAGGAGTGTGGGCCAACGGCAGTGCTCCCCACCCTGAGCGGAGGCCCAATGGCTACGCCCTGGGGCTGGTGAGTGGAGGGAGTGCCCAAGAGTCCCAGGGGAACACGGGCCTCCCAGACGTGGAGCTCCTTAGCCATGAGCTCAAGGGAGTGTGCCCAGAGCCCCCTGGCCTAGATGACCCCCTGGCCCAGGATGGAGCAGGAGTGTCCATGGTGAGCAAGGGCGAGGAGGATAACATGGCCATCATCAAGGAGTTCATGCGCTTCAAGGTGCACATGGAGGGCTCCGTGAACGGCCACGAGTTCGAGATCGAGGGCGAGGGCGAGGGCCGCCCCTACGAGGGCACCCAGACCGCCAAGCTGAAGGTGACCAAGGGTGGCCCCCTGCCCTTCGCCTGGGACATCCTGTCCCCTCAGTTCATGTACGGCTCCAAGGCCTACGTGAAGCACCCCGCCGACATCCCCGACTACTTGAAGCTGTCCTTCCCCGAGGGCTTCAAGTGGGAGCGCGTGATGAACTTCGAGGACGGCGGCGTGGTGACCGTGACCCAGGACTCCTCCCTGCAGGACGGCGAGTTCATCTACAAGGTGAAGCTGCGCGGCACCAACTTCCCCTCCGACGGCCCCGTAATGCAGAAGAAGACCATGGGCTGGGAGGCCTCCTCCGAGCGGATGTACCCCGAGGACGGCGCCCTGAAGGGCGAGATCAAGCAGAGGCTGAAGCTGAAGGACGGCGGCCACTACGACGCTGAGGTCAAGACCACCTACAAGGCCAAGAAGCCCGTGCAGCTGCCCGGCGCCTACAACGTCAACATCAAGTTGGACATCACCTCCCACAACGAGGACTACACCATCGTGGAACAGTACGAACGCGCCGAGGGCCGCCACTCCACCGGCGGCATGGACGAGCTGTACAAGTAA
Figure E.2 Coding sequence of A2AR+mCherry fusion. Black sequence belongs to A2AR (Accession
Number: NM_000675), red sequence belongs to mCherry coding sequences (Accession Number:
ACO48282).
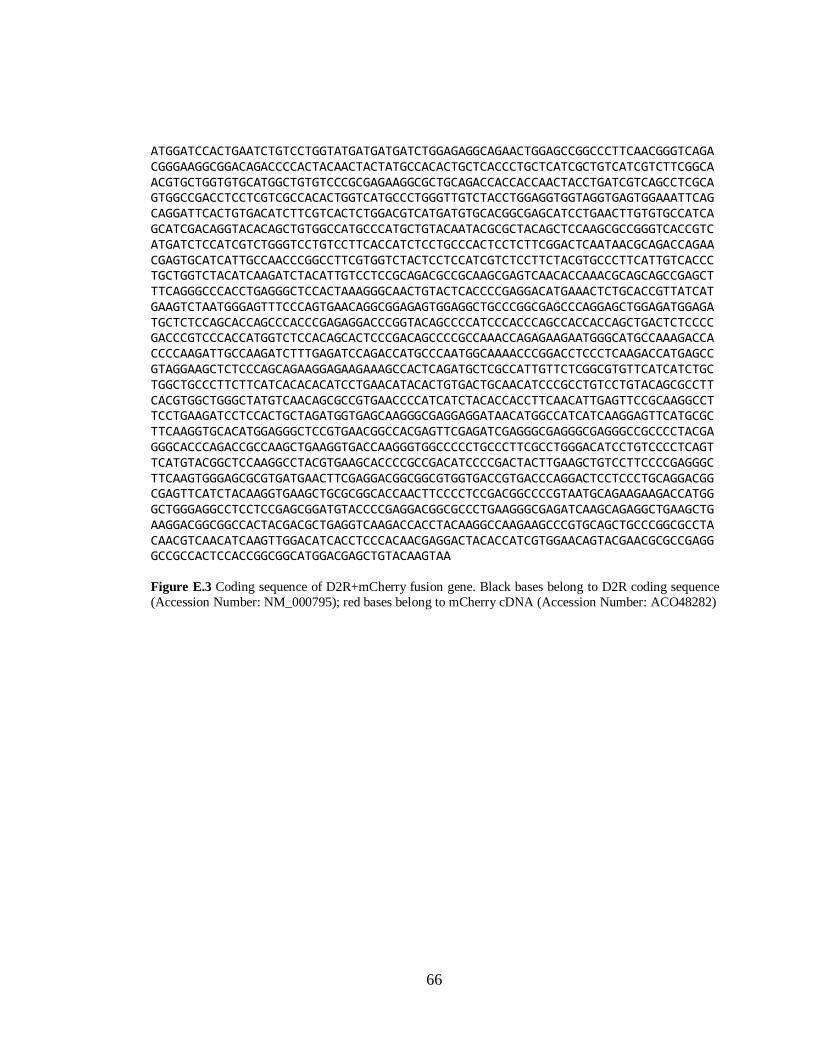
66
ATGGATCCACTGAATCTGTCCTGGTATGATGATGATCTGGAGAGGCAGAACTGGAGCCGGCCCTTCAACGGGTCAGACGGGAAGGCGGACAGACCCCACTACAACTACTATGCCACACTGCTCACCCTGCTCATCGCTGTCATCGTCTTCGGCAACGTGCTGGTGTGCATGGCTGTGTCCCGCGAGAAGGCGCTGCAGACCACCACCAACTACCTGATCGTCAGCCTCGCAGTGGCCGACCTCCTCGTCGCCACACTGGTCATGCCCTGGGTTGTCTACCTGGAGGTGGTAGGTGAGTGGAAATTCAGCAGGATTCACTGTGACATCTTCGTCACTCTGGACGTCATGATGTGCACGGCGAGCATCCTGAACTTGTGTGCCATCAGCATCGACAGGTACACAGCTGTGGCCATGCCCATGCTGTACAATACGCGCTACAGCTCCAAGCGCCGGGTCACCGTCATGATCTCCATCGTCTGGGTCCTGTCCTTCACCATCTCCTGCCCACTCCTCTTCGGACTCAATAACGCAGACCAGAACGAGTGCATCATTGCCAACCCGGCCTTCGTGGTCTACTCCTCCATCGTCTCCTTCTACGTGCCCTTCATTGTCACCCTGCTGGTCTACATCAAGATCTACATTGTCCTCCGCAGACGCCGCAAGCGAGTCAACACCAAACGCAGCAGCCGAGCTTTCAGGGCCCACCTGAGGGCTCCACTAAAGGGCAACTGTACTCACCCCGAGGACATGAAACTCTGCACCGTTATCATGAAGTCTAATGGGAGTTTCCCAGTGAACAGGCGGAGAGTGGAGGCTGCCCGGCGAGCCCAGGAGCTGGAGATGGAGATGCTCTCCAGCACCAGCCCACCCGAGAGGACCCGGTACAGCCCCATCCCACCCAGCCACCACCAGCTGACTCTCCCCGACCCGTCCCACCATGGTCTCCACAGCACTCCCGACAGCCCCGCCAAACCAGAGAAGAATGGGCATGCCAAAGACCACCCCAAGATTGCCAAGATCTTTGAGATCCAGACCATGCCCAATGGCAAAACCCGGACCTCCCTCAAGACCATGAGCCGTAGGAAGCTCTCCCAGCAGAAGGAGAAGAAAGCCACTCAGATGCTCGCCATTGTTCTCGGCGTGTTCATCATCTGCTGGCTGCCCTTCTTCATCACACACATCCTGAACATACACTGTGACTGCAACATCCCGCCTGTCCTGTACAGCGCCTTCACGTGGCTGGGCTATGTCAACAGCGCCGTGAACCCCATCATCTACACCACCTTCAACATTGAGTTCCGCAAGGCCTTCCTGAAGATCCTCCACTGCTAGATGGTGAGCAAGGGCGAGGAGGATAACATGGCCATCATCAAGGAGTTCATGCGCTTCAAGGTGCACATGGAGGGCTCCGTGAACGGCCACGAGTTCGAGATCGAGGGCGAGGGCGAGGGCCGCCCCTACGAGGGCACCCAGACCGCCAAGCTGAAGGTGACCAAGGGTGGCCCCCTGCCCTTCGCCTGGGACATCCTGTCCCCTCAGTTCATGTACGGCTCCAAGGCCTACGTGAAGCACCCCGCCGACATCCCCGACTACTTGAAGCTGTCCTTCCCCGAGGGCTTCAAGTGGGAGCGCGTGATGAACTTCGAGGACGGCGGCGTGGTGACCGTGACCCAGGACTCCTCCCTGCAGGACGGCGAGTTCATCTACAAGGTGAAGCTGCGCGGCACCAACTTCCCCTCCGACGGCCCCGTAATGCAGAAGAAGACCATGGGCTGGGAGGCCTCCTCCGAGCGGATGTACCCCGAGGACGGCGCCCTGAAGGGCGAGATCAAGCAGAGGCTGAAGCTGAAGGACGGCGGCCACTACGACGCTGAGGTCAAGACCACCTACAAGGCCAAGAAGCCCGTGCAGCTGCCCGGCGCCTACAACGTCAACATCAAGTTGGACATCACCTCCCACAACGAGGACTACACCATCGTGGAACAGTACGAACGCGCCGAGGGCCGCCACTCCACCGGCGGCATGGACGAGCTGTACAAGTAA
Figure E.3 Coding sequence of D2R+mCherry fusion gene. Black bases belong to D2R coding sequence
(Accession Number: NM_000795); red bases belong to mCherry cDNA (Accession Number: ACO48282)
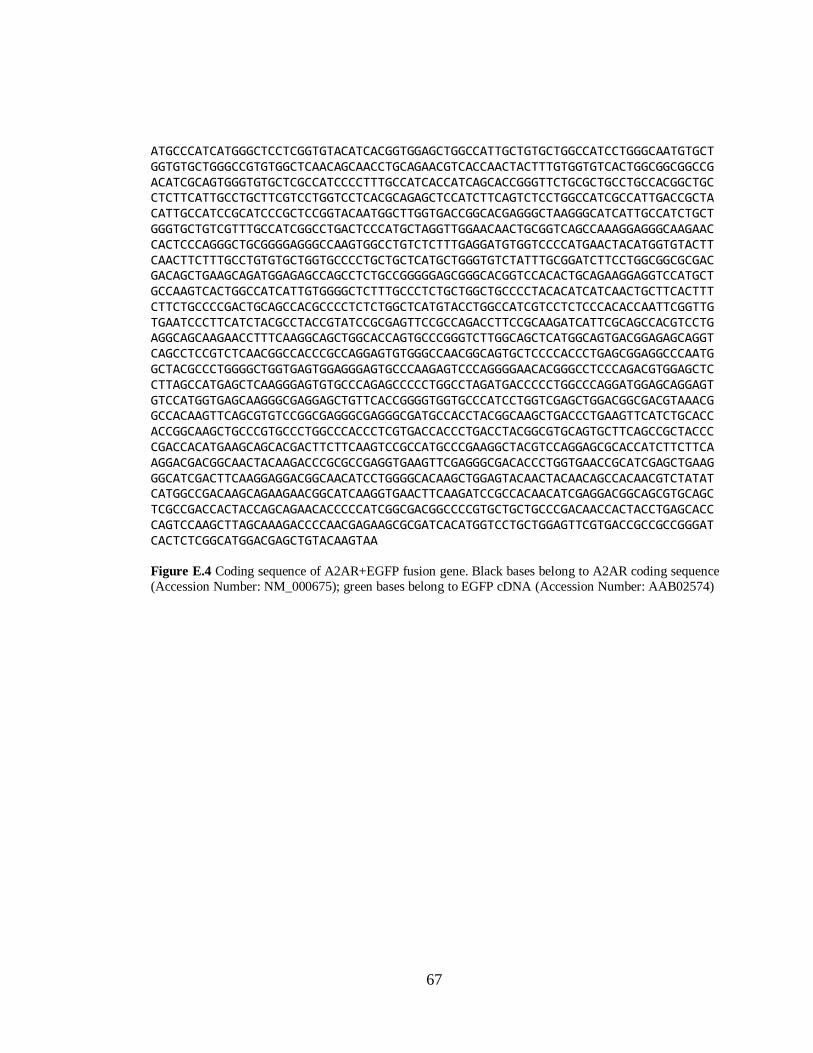
67
ATGCCCATCATGGGCTCCTCGGTGTACATCACGGTGGAGCTGGCCATTGCTGTGCTGGCCATCCTGGGCAATGTGCTGGTGTGCTGGGCCGTGTGGCTCAACAGCAACCTGCAGAACGTCACCAACTACTTTGTGGTGTCACTGGCGGCGGCCGACATCGCAGTGGGTGTGCTCGCCATCCCCTTTGCCATCACCATCAGCACCGGGTTCTGCGCTGCCTGCCACGGCTGCCTCTTCATTGCCTGCTTCGTCCTGGTCCTCACGCAGAGCTCCATCTTCAGTCTCCTGGCCATCGCCATTGACCGCTACATTGCCATCCGCATCCCGCTCCGGTACAATGGCTTGGTGACCGGCACGAGGGCTAAGGGCATCATTGCCATCTGCTGGGTGCTGTCGTTTGCCATCGGCCTGACTCCCATGCTAGGTTGGAACAACTGCGGTCAGCCAAAGGAGGGCAAGAACCACTCCCAGGGCTGCGGGGAGGGCCAAGTGGCCTGTCTCTTTGAGGATGTGGTCCCCATGAACTACATGGTGTACTTCAACTTCTTTGCCTGTGTGCTGGTGCCCCTGCTGCTCATGCTGGGTGTCTATTTGCGGATCTTCCTGGCGGCGCGACGACAGCTGAAGCAGATGGAGAGCCAGCCTCTGCCGGGGGAGCGGGCACGGTCCACACTGCAGAAGGAGGTCCATGCTGCCAAGTCACTGGCCATCATTGTGGGGCTCTTTGCCCTCTGCTGGCTGCCCCTACACATCATCAACTGCTTCACTTTCTTCTGCCCCGACTGCAGCCACGCCCCTCTCTGGCTCATGTACCTGGCCATCGTCCTCTCCCACACCAATTCGGTTGTGAATCCCTTCATCTACGCCTACCGTATCCGCGAGTTCCGCCAGACCTTCCGCAAGATCATTCGCAGCCACGTCCTGAGGCAGCAAGAACCTTTCAAGGCAGCTGGCACCAGTGCCCGGGTCTTGGCAGCTCATGGCAGTGACGGAGAGCAGGTCAGCCTCCGTCTCAACGGCCACCCGCCAGGAGTGTGGGCCAACGGCAGTGCTCCCCACCCTGAGCGGAGGCCCAATGGCTACGCCCTGGGGCTGGTGAGTGGAGGGAGTGCCCAAGAGTCCCAGGGGAACACGGGCCTCCCAGACGTGGAGCTCCTTAGCCATGAGCTCAAGGGAGTGTGCCCAGAGCCCCCTGGCCTAGATGACCCCCTGGCCCAGGATGGAGCAGGAGTGTCCATGGTGAGCAAGGGCGAGGAGCTGTTCACCGGGGTGGTGCCCATCCTGGTCGAGCTGGACGGCGACGTAAACGGCCACAAGTTCAGCGTGTCCGGCGAGGGCGAGGGCGATGCCACCTACGGCAAGCTGACCCTGAAGTTCATCTGCACCACCGGCAAGCTGCCCGTGCCCTGGCCCACCCTCGTGACCACCCTGACCTACGGCGTGCAGTGCTTCAGCCGCTACCCCGACCACATGAAGCAGCACGACTTCTTCAAGTCCGCCATGCCCGAAGGCTACGTCCAGGAGCGCACCATCTTCTTCAAGGACGACGGCAACTACAAGACCCGCGCCGAGGTGAAGTTCGAGGGCGACACCCTGGTGAACCGCATCGAGCTGAAGGGCATCGACTTCAAGGAGGACGGCAACATCCTGGGGCACAAGCTGGAGTACAACTACAACAGCCACAACGTCTATATCATGGCCGACAAGCAGAAGAACGGCATCAAGGTGAACTTCAAGATCCGCCACAACATCGAGGACGGCAGCGTGCAGCTCGCCGACCACTACCAGCAGAACACCCCCATCGGCGACGGCCCCGTGCTGCTGCCCGACAACCACTACCTGAGCACCCAGTCCAAGCTTAGCAAAGACCCCAACGAGAAGCGCGATCACATGGTCCTGCTGGAGTTCGTGACCGCCGCCGGGATCACTCTCGGCATGGACGAGCTGTACAAGTAA
Figure E.4 Coding sequence of A2AR+EGFP fusion gene. Black bases belong to A2AR coding sequence
(Accession Number: NM_000675); green bases belong to EGFP cDNA (Accession Number: AAB02574)
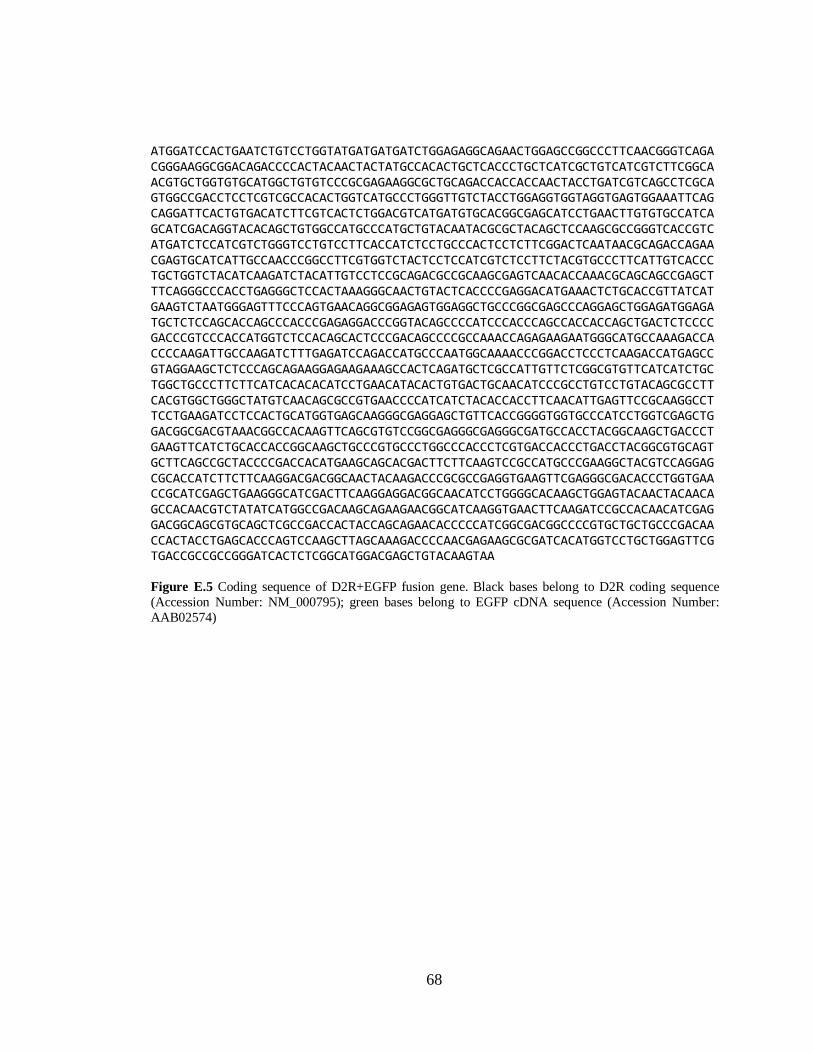
68
ATGGATCCACTGAATCTGTCCTGGTATGATGATGATCTGGAGAGGCAGAACTGGAGCCGGCCCTTCAACGGGTCAGACGGGAAGGCGGACAGACCCCACTACAACTACTATGCCACACTGCTCACCCTGCTCATCGCTGTCATCGTCTTCGGCAACGTGCTGGTGTGCATGGCTGTGTCCCGCGAGAAGGCGCTGCAGACCACCACCAACTACCTGATCGTCAGCCTCGCAGTGGCCGACCTCCTCGTCGCCACACTGGTCATGCCCTGGGTTGTCTACCTGGAGGTGGTAGGTGAGTGGAAATTCAGCAGGATTCACTGTGACATCTTCGTCACTCTGGACGTCATGATGTGCACGGCGAGCATCCTGAACTTGTGTGCCATCAGCATCGACAGGTACACAGCTGTGGCCATGCCCATGCTGTACAATACGCGCTACAGCTCCAAGCGCCGGGTCACCGTCATGATCTCCATCGTCTGGGTCCTGTCCTTCACCATCTCCTGCCCACTCCTCTTCGGACTCAATAACGCAGACCAGAACGAGTGCATCATTGCCAACCCGGCCTTCGTGGTCTACTCCTCCATCGTCTCCTTCTACGTGCCCTTCATTGTCACCCTGCTGGTCTACATCAAGATCTACATTGTCCTCCGCAGACGCCGCAAGCGAGTCAACACCAAACGCAGCAGCCGAGCTTTCAGGGCCCACCTGAGGGCTCCACTAAAGGGCAACTGTACTCACCCCGAGGACATGAAACTCTGCACCGTTATCATGAAGTCTAATGGGAGTTTCCCAGTGAACAGGCGGAGAGTGGAGGCTGCCCGGCGAGCCCAGGAGCTGGAGATGGAGATGCTCTCCAGCACCAGCCCACCCGAGAGGACCCGGTACAGCCCCATCCCACCCAGCCACCACCAGCTGACTCTCCCCGACCCGTCCCACCATGGTCTCCACAGCACTCCCGACAGCCCCGCCAAACCAGAGAAGAATGGGCATGCCAAAGACCACCCCAAGATTGCCAAGATCTTTGAGATCCAGACCATGCCCAATGGCAAAACCCGGACCTCCCTCAAGACCATGAGCCGTAGGAAGCTCTCCCAGCAGAAGGAGAAGAAAGCCACTCAGATGCTCGCCATTGTTCTCGGCGTGTTCATCATCTGCTGGCTGCCCTTCTTCATCACACACATCCTGAACATACACTGTGACTGCAACATCCCGCCTGTCCTGTACAGCGCCTTCACGTGGCTGGGCTATGTCAACAGCGCCGTGAACCCCATCATCTACACCACCTTCAACATTGAGTTCCGCAAGGCCTTCCTGAAGATCCTCCACTGCATGGTGAGCAAGGGCGAGGAGCTGTTCACCGGGGTGGTGCCCATCCTGGTCGAGCTGGACGGCGACGTAAACGGCCACAAGTTCAGCGTGTCCGGCGAGGGCGAGGGCGATGCCACCTACGGCAAGCTGACCCTGAAGTTCATCTGCACCACCGGCAAGCTGCCCGTGCCCTGGCCCACCCTCGTGACCACCCTGACCTACGGCGTGCAGTGCTTCAGCCGCTACCCCGACCACATGAAGCAGCACGACTTCTTCAAGTCCGCCATGCCCGAAGGCTACGTCCAGGAGCGCACCATCTTCTTCAAGGACGACGGCAACTACAAGACCCGCGCCGAGGTGAAGTTCGAGGGCGACACCCTGGTGAACCGCATCGAGCTGAAGGGCATCGACTTCAAGGAGGACGGCAACATCCTGGGGCACAAGCTGGAGTACAACTACAACAGCCACAACGTCTATATCATGGCCGACAAGCAGAAGAACGGCATCAAGGTGAACTTCAAGATCCGCCACAACATCGAGGACGGCAGCGTGCAGCTCGCCGACCACTACCAGCAGAACACCCCCATCGGCGACGGCCCCGTGCTGCTGCCCGACAACCACTACCTGAGCACCCAGTCCAAGCTTAGCAAAGACCCCAACGAGAAGCGCGATCACATGGTCCTGCTGGAGTTCGTGACCGCCGCCGGGATCACTCTCGGCATGGACGAGCTGTACAAGTAA
Figure E.5 Coding sequence of D2R+EGFP fusion gene. Black bases belong to D2R coding sequence
(Accession Number: NM_000795); green bases belong to EGFP cDNA sequence (Accession Number:
AAB02574)
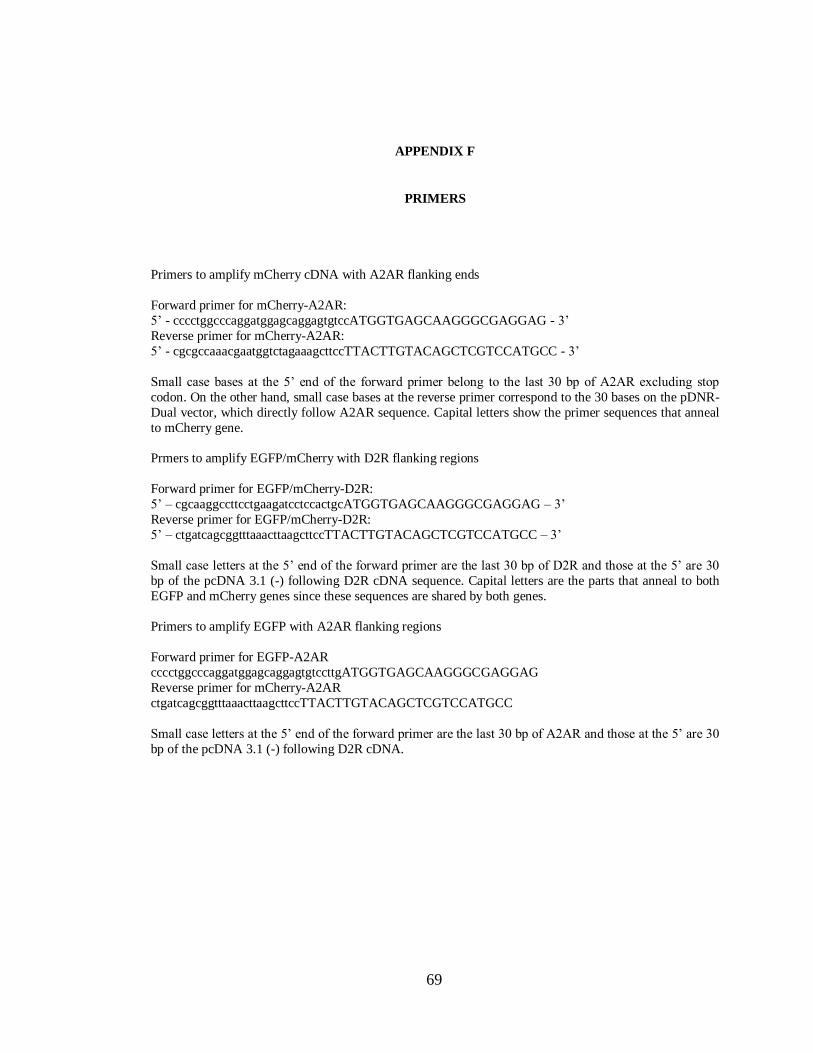
69
APPENDIX F
PRIMERS
Primers to amplify mCherry cDNA with A2AR flanking ends
Forward primer for mCherry-A2AR:
5’ - cccctggcccaggatggagcaggagtgtccATGGTGAGCAAGGGCGAGGAG - 3’
Reverse primer for mCherry-A2AR:
5’ - cgcgccaaacgaatggtctagaaagcttccTTACTTGTACAGCTCGTCCATGCC - 3’
Small case bases at the 5’ end of the forward primer belon to the last 30 bp of A2AR excludin stop
codon. On the other hand, small case bases at the reverse primer correspond to the 30 bases on the pDNR-
Dual vector, which directly follow A2AR sequence. Capital letters show the primer sequences that anneal
to mCherry gene.
Prmers to amplify EGFP/mCherry with D2R flanking regions
Forward primer for EGFP/mCherry-D2R:
5’ – cgcaaggccttcctgaagatcctccactgcATGGTGAGCAAGGGCGAGGAG – 3’
Reverse primer for EGFP/mCherry-D2R:
5’ – ctgatcagcggtttaaacttaagcttccTTACTTGTACAGCTCGTCCATGCC – 3’
Small case letters at the 5’ end of the forward primer are the last 30 bp of D2R and those at the 5’ are 30
bp of the pcDNA 3.1 (-) following D2R cDNA sequence. Capital letters are the parts that anneal to both
EGFP and mCherry genes since these sequences are shared by both genes.
Primers to amplify EGFP with A2AR flanking regions
Forward primer for EGFP-A2AR
cccctggcccaggatggagcaggagtgtccttgATGGTGAGCAAGGGCGAGGAG
Reverse primer for mCherry-A2AR
ctgatcagcggtttaaacttaagcttccTTACTTGTACAGCTCGTCCATGCC
Small case letters at the 5’ end of the forward primer are the last 30 bp of A2AR and those at the 5’ are 30
bp of the pcDNA 3.1 (-) following D2R cDNA.