Embed Size (px)
Citation preview
The Frontiers of New The Frontiers of New Energy ParadigmEnergy Paradigm::
Cultivating the Courage to Create Cultivating the Courage to Create The New DynamicsThe New Dynamics
Partha S. GhoshPartha S. Ghosh
Global Energy Conference Global Energy Conference Houston 2006Houston 2006
Copyright © 2006 Partha S Ghosh. — ConfidentialEnergy Speech PG 6-28-06 2
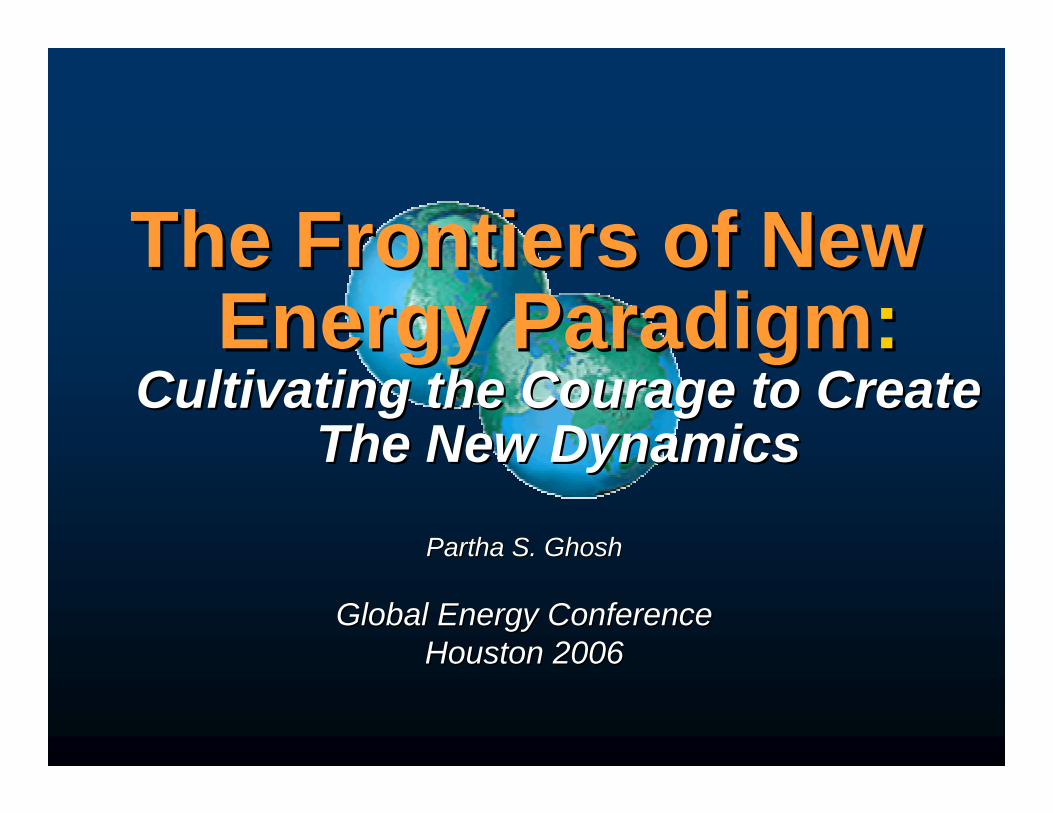
416
3850
17
89
139
0
20
40
60
80
100
120
140
160
180
200
Healthcare &Pharma
Manufacturing Retail &Wholesale
Oil
Rev
enue
s (B
illio
n U
S$)
Total Net Profit in Billion US$ of Fortune Global 50 Companies (2005)1,2
Choices: Where will the Oil & Gas Profits go?
Boston Analytics Research
3b2b
10b9b
2b
11b
8b
Tech FIsFMCG
8 cos. = $139 Billion42 cos. = $214 Billion
Copyright © 2006 Partha S Ghosh. — ConfidentialEnergy Speech PG 6-28-06 3
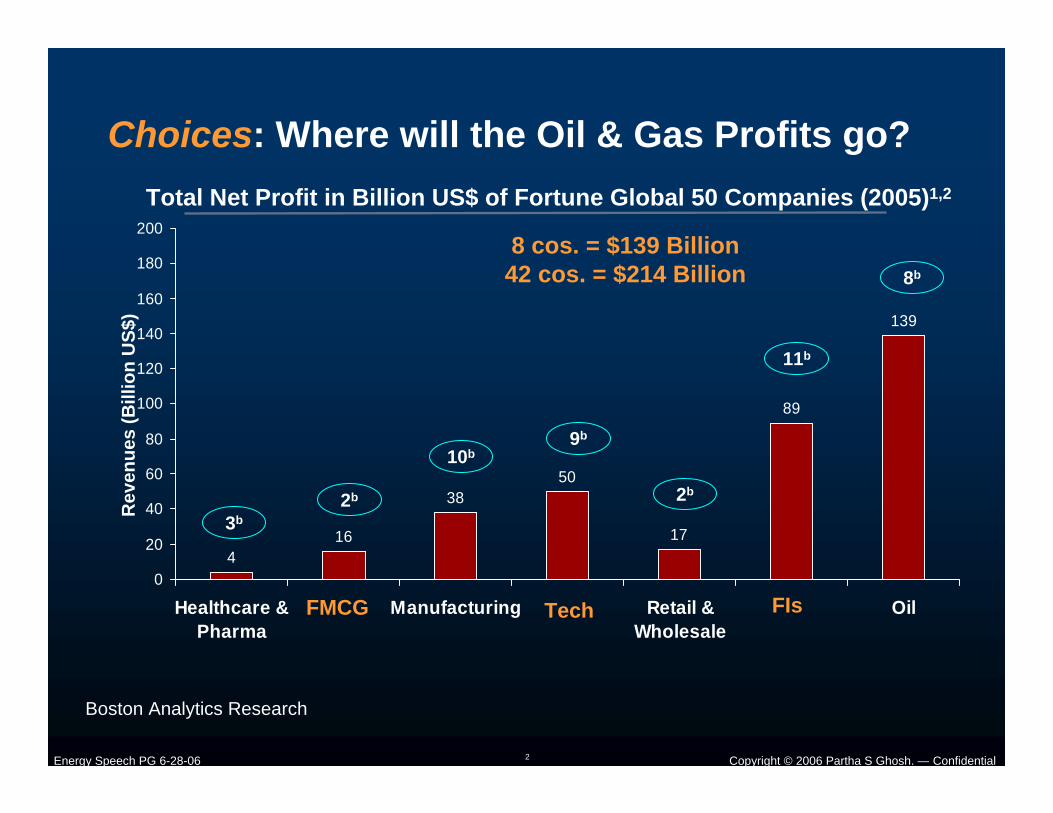
0100200300400500600700
2025 2025
15.2
Courage: Reduction in energy intensity could reduce world energy demand by 14% in 2025
World Energy Demand in Quadrillion Btu (2025)1 :If Energy Intensity is Reduced in Selected Regions
Reductionin India
Reductionin China
Reductionin WesternEurope
Reductionin US
Assumptions:•Energy intensity is reduced by 35% for India and China•Energy intensity is reduced by 20% for Western Europe (WE) and US
10.3 38.226.5
Qua
drill
ion
Btu
Boston Analytics Research
554.8645.0
Copyright © 2006 Partha S Ghosh. — ConfidentialEnergy Speech PG 6-28-06 4
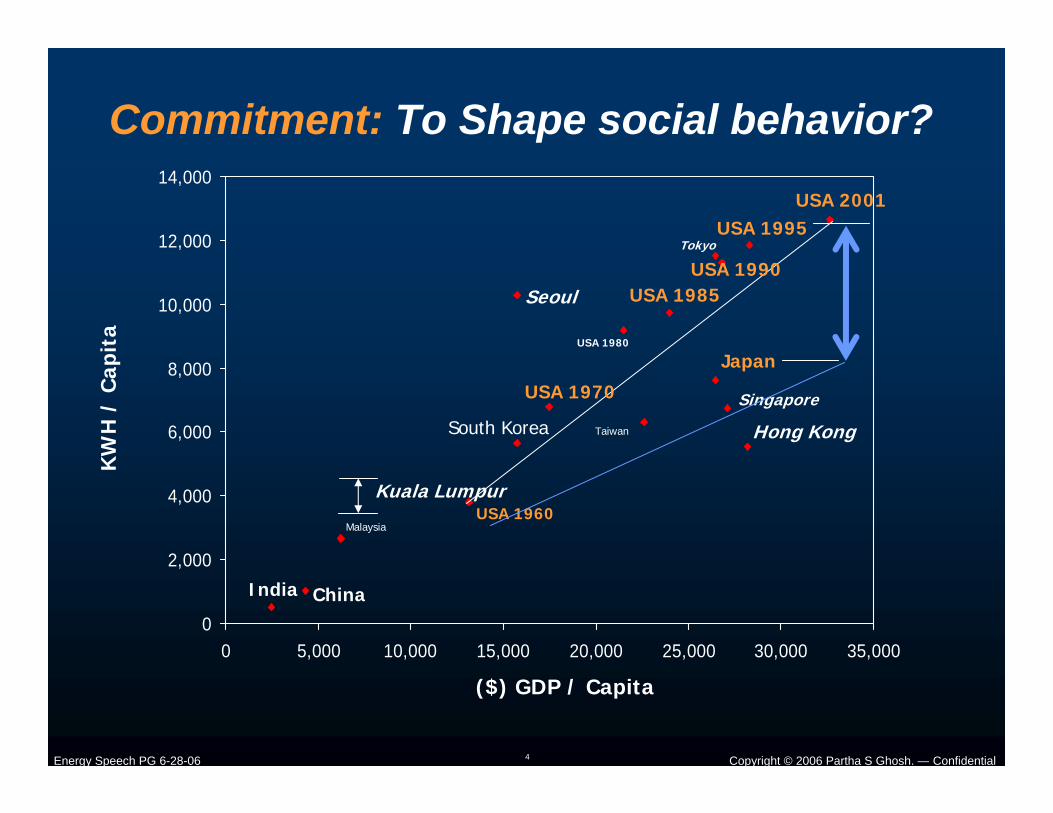
Commitment: To Shape social behavior?
0
2,000
4,000
6,000
8,000
10,000
12,000
14,000
0 5,000 10,000 15,000 20,000 25,000 30,000 35,000
($) GDP / Capita
KW
H /
Cap
ita
India China
Malaysia
Seoul
South Korea Taiwan
Japan
Tokyo
Singapore
Hong Kong
USA 1960
USA 2001
USA 1970
USA 1980
USA 1985USA 1990
USA 1995
Kuala Lumpur
Copyright © 2006 Partha S Ghosh. — ConfidentialEnergy Speech PG 6-28-06 5
ContentsLaws of Large Numbers & Network Effect? Slow Pace of Large scale world wide Energy disruption?
More & better of the Same or New Game? Market Mechanisms vs Cross Border Strategic Diplomacy?
A Call for a Renaissance: Time to rethink, repurpose and reform?
Note: Analyses supported by Boston Analytics
Copyright © 2006 Partha S Ghosh. — ConfidentialEnergy Speech PG 6-28-06 6
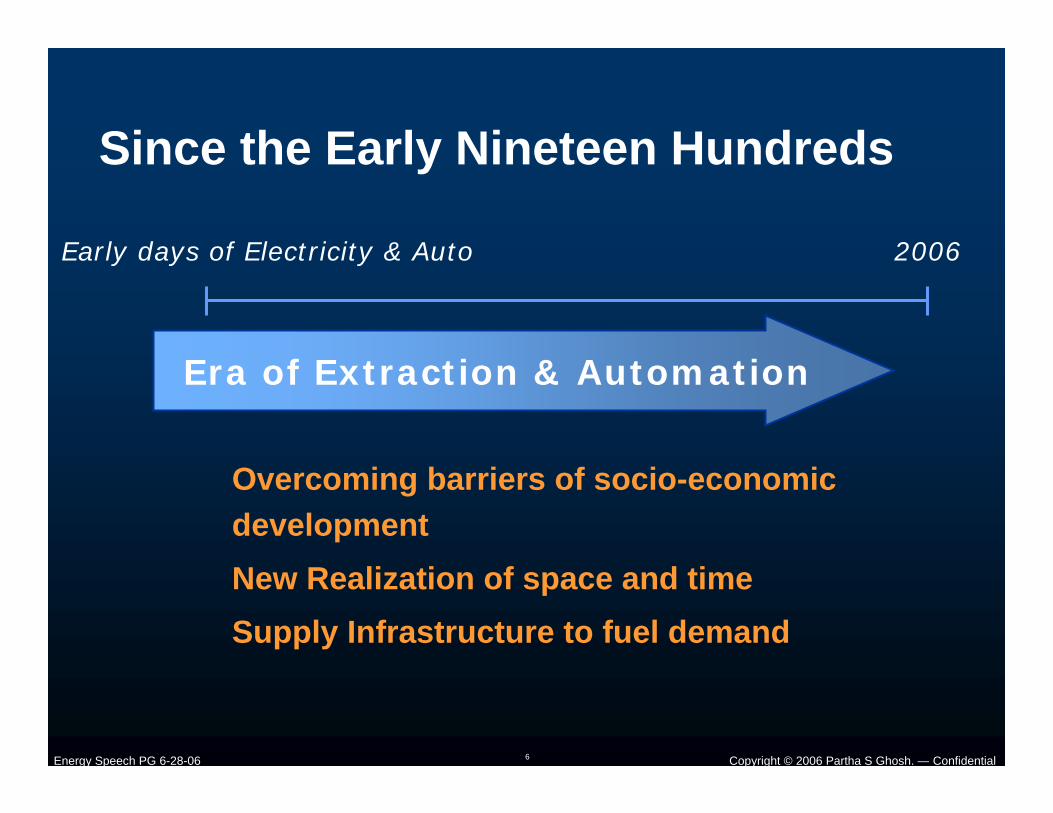
Since the Early Nineteen Hundreds
Early days of Electricity & Auto 2006
Era of Extraction & Automation
Overcoming barriers of socio-economic development
New Realization of space and time Supply Infrastructure to fuel demand
Copyright © 2006 Partha S Ghosh. — ConfidentialEnergy Speech PG 6-28-06 7
0
1
2
3
4
5
6
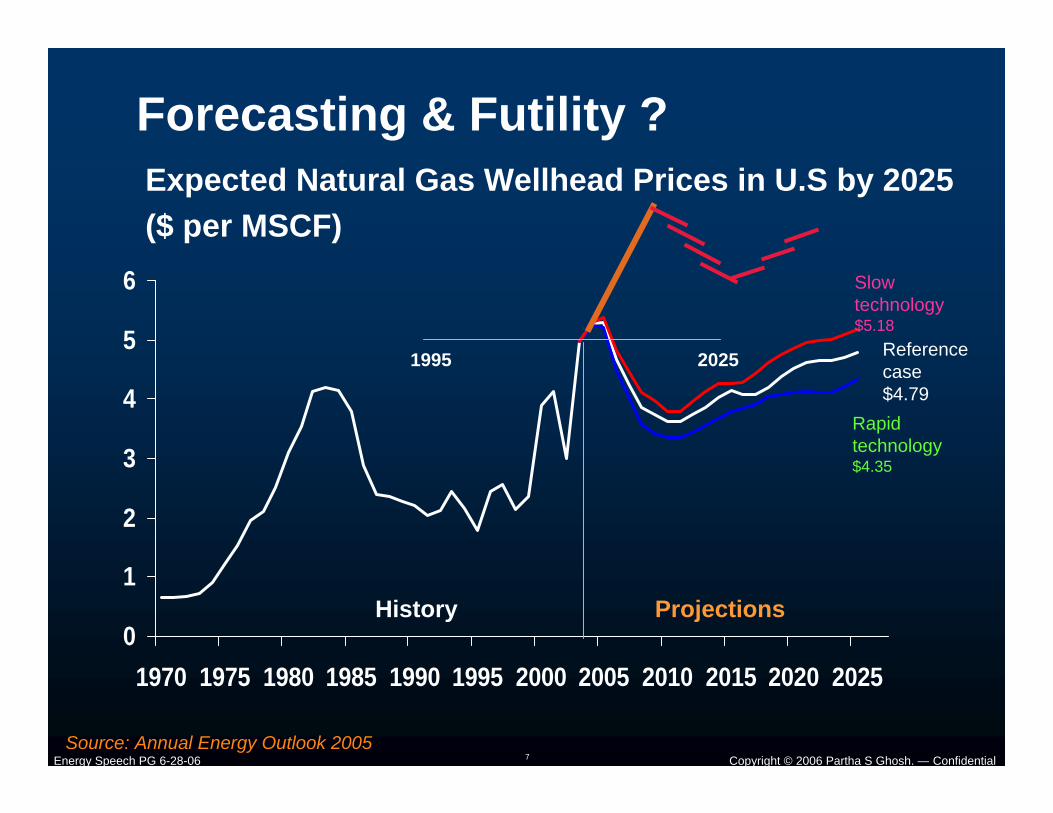
1970 1975 1980 1985 1990 1995 2000 2005 2010 2015 2020 2025
1995 2025
History Projections
Source: Annual Energy Outlook 2005
Reference case$4.79
Rapid technology$4.35
Slow technology$5.18
Expected Natural Gas Wellhead Prices in U.S by 2025 ($ per MSCF)
Forecasting & Futility ?
Copyright © 2006 Partha S Ghosh. — ConfidentialEnergy Speech PG 6-28-06 8
0
10,000
20,000
30,000
40,000
50,000
60,000
70,000
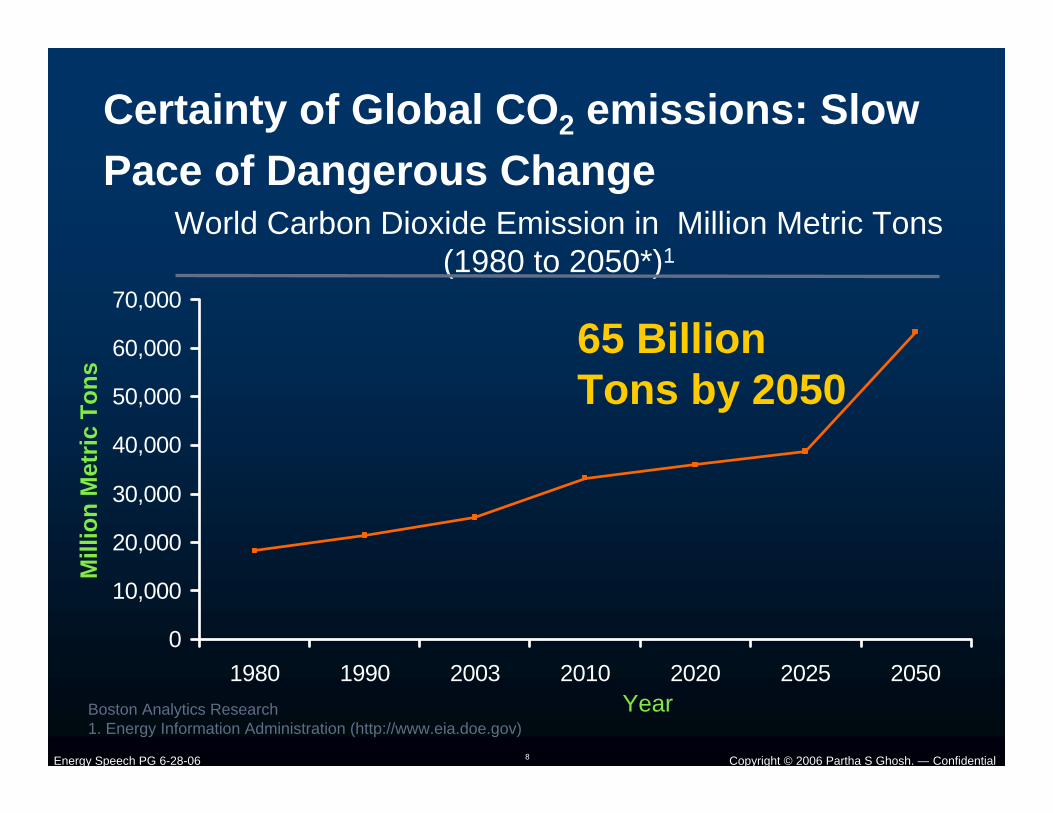
1980 1990 2003 2010 2020 2025 2050Boston Analytics Research1. Energy Information Administration (http://www.eia.doe.gov)
World Carbon Dioxide Emission in Million Metric Tons (1980 to 2050*)1
Mill
ion
Met
ric T
ons
Certainty of Global CO2 emissions: Slow Pace of Dangerous Change
65 Billion Tons by 2050
Year
Copyright © 2006 Partha S Ghosh. — ConfidentialEnergy Speech PG 6-28-06 9
0
20000
40000
60000
80000
100000
0 10000 20000 30000 40000GDP* per Capita
China
India
US
France
Japan
Germany UK
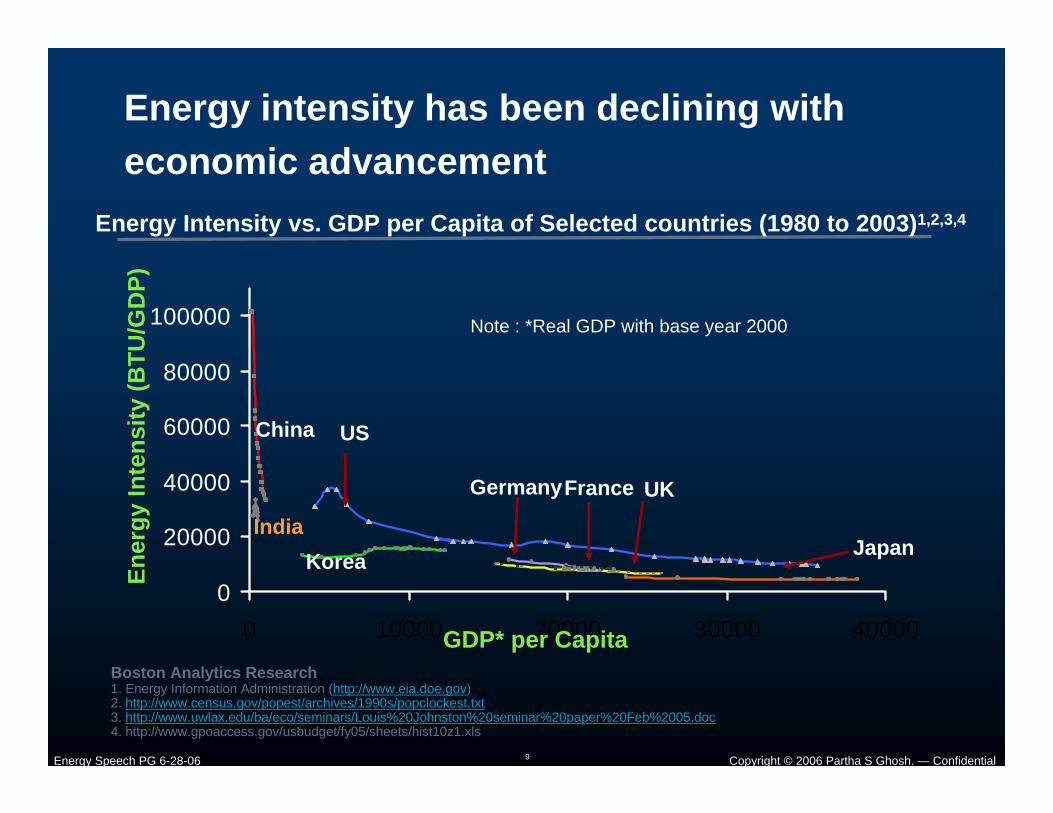
Energy Intensity vs. GDP per Capita of Selected countries (1980 to 2003)1,2,3,4
Note : *Real GDP with base year 2000
Boston Analytics Research1. Energy Information Administration (http://www.eia.doe.gov)2. http://www.census.gov/popest/archives/1990s/popclockest.txt3. http://www.uwlax.edu/ba/eco/seminars/Louis%20Johnston%20seminar%20paper%20Feb%2005.doc4. http://www.gpoaccess.gov/usbudget/fy05/sheets/hist10z1.xls
Energy intensity has been declining with economic advancement
KoreaEner
gy In
tens
ity (B
TU/G
DP)
Copyright © 2006 Partha S Ghosh. — ConfidentialEnergy Speech PG 6-28-06 10
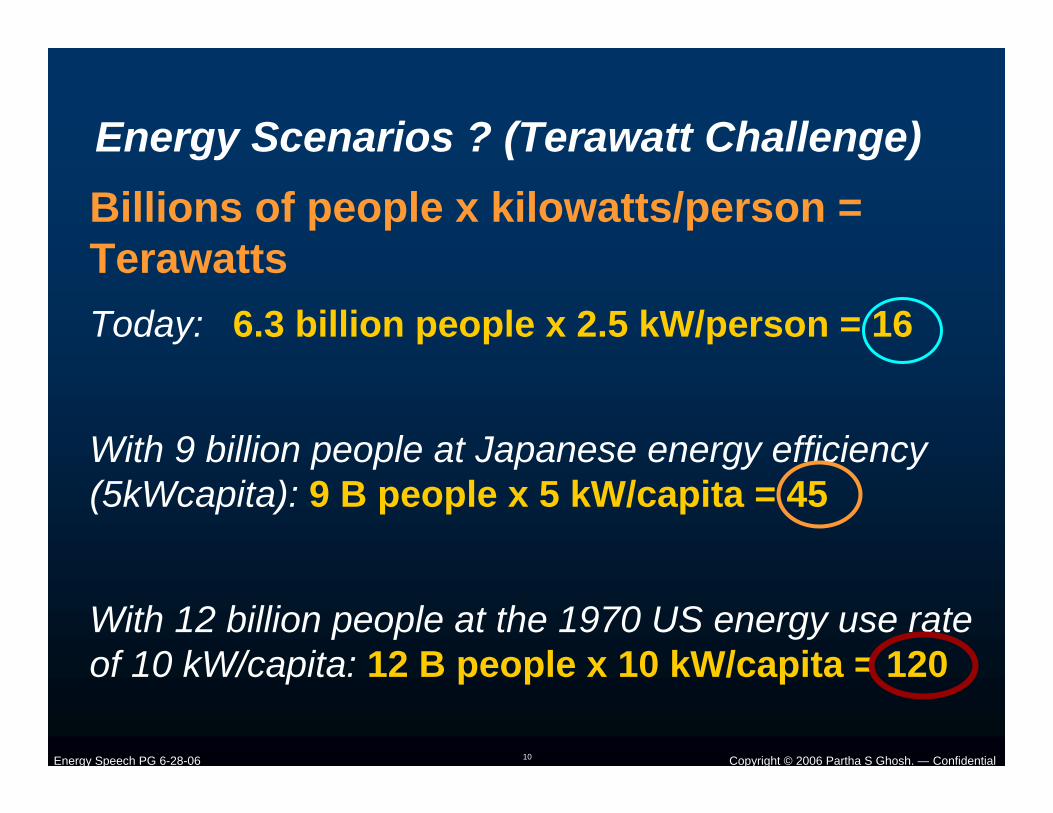
Energy Scenarios ? (Terawatt Challenge)Billions of people x kilowatts/person = TerawattsToday: 6.3 billion people x 2.5 kW/person = 16
With 9 billion people at Japanese energy efficiency (5kWcapita): 9 B people x 5 kW/capita = 45
With 12 billion people at the 1970 US energy use rate of 10 kW/capita: 12 B people x 10 kW/capita = 120
Copyright © 2006 Partha S Ghosh. — ConfidentialEnergy Speech PG 6-28-06 11
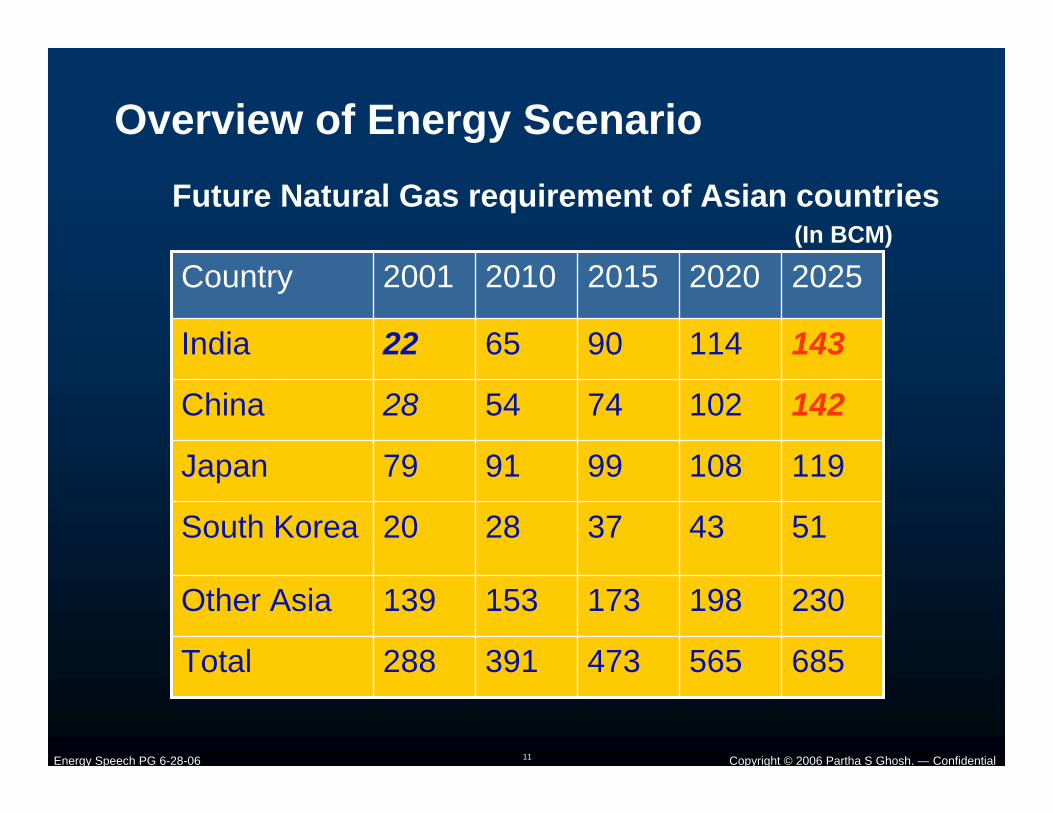
Overview of Energy Scenario
685565473391288Total
230198173153139Other Asia
5143372820South Korea
119108999179Japan
142102745428China
143114906522India
20252020201520102001Country(In BCM)
Future Natural Gas requirement of Asian countries
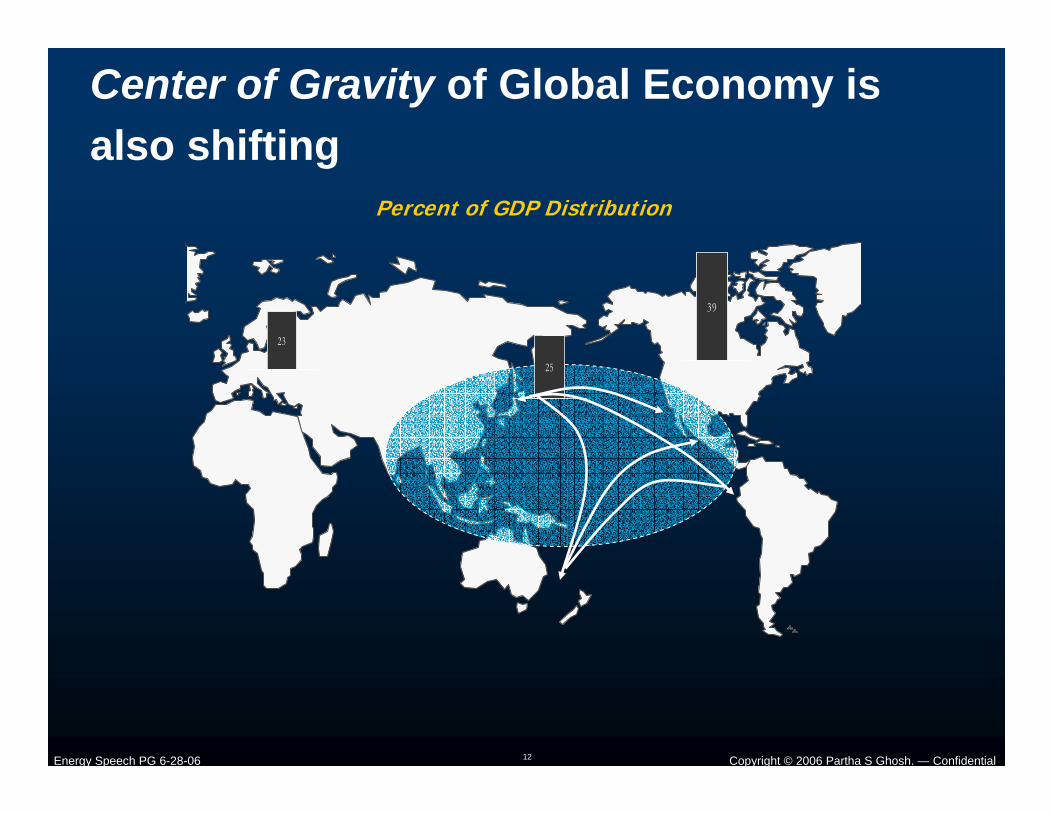
Copyright © 2006 Partha S Ghosh. — ConfidentialEnergy Speech PG 6-28-06 12
Percent of GDP Distribution
Center of Gravity of Global Economy is also shifting
23
25
39
Copyright © 2006 Partha S Ghosh. — ConfidentialEnergy Speech PG 6-28-06 13
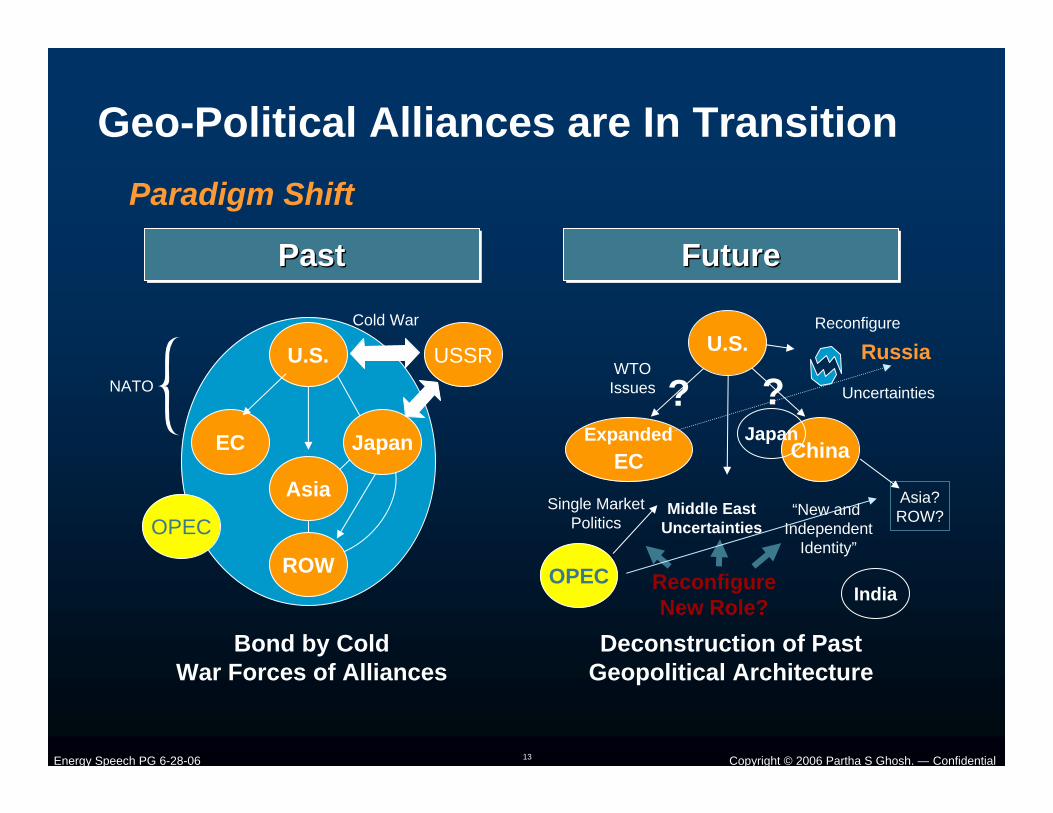
Geo-Political Alliances are In TransitionParadigm Shift
USSR
EC
NATO
Cold War
PastPastPast FutureFutureFuture
Bond by ColdWar Forces of Alliances
ExpandedEC China
Asia?ROW?“New and
IndependentIdentity”
Reconfigure
WTOIssues
Single MarketPolitics
Deconstruction of PastGeopolitical Architecture
Uncertainties
ROW
U.S.
Japan
Asia
?U.S.
?
Reconfigure New Role?
Middle East Uncertainties
Russia
OPEC
OPEC
Japan
India
Copyright © 2006 Partha S Ghosh. — ConfidentialEnergy Speech PG 6-28-06 14
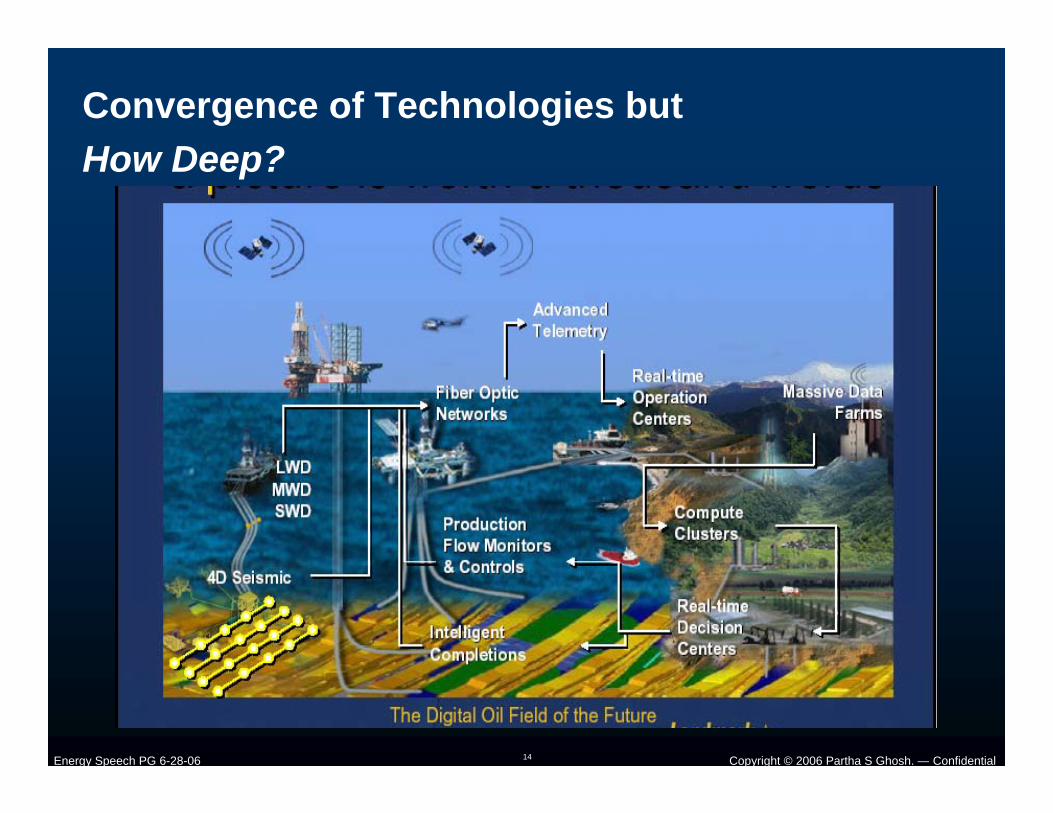
Convergence of Technologies but How Deep?
Copyright © 2006 Partha S Ghosh. — ConfidentialEnergy Speech PG 6-28-06 15
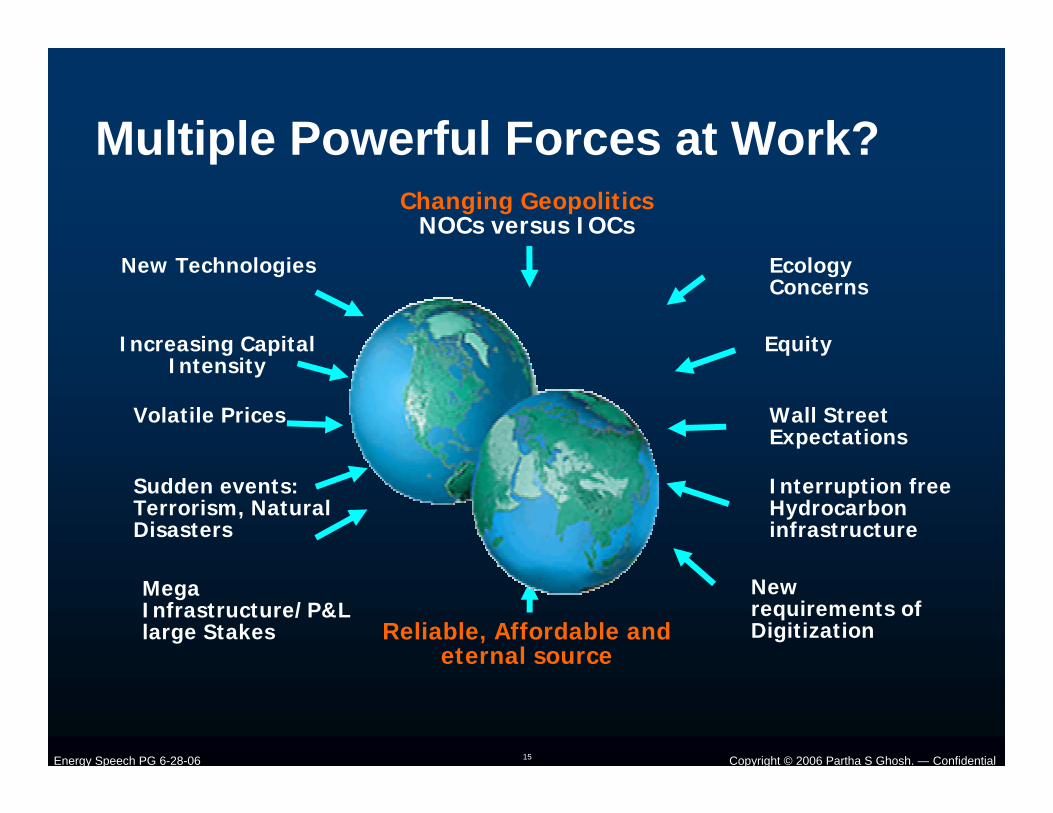
Changing GeopoliticsNOCs versus IOCs
Reliable, Affordable and eternal source
Interruption free Hydrocarbon infrastructure
Wall Street Expectations
Ecology Concerns
Increasing Capital Intensity
Volatile Prices
Sudden events: Terrorism, Natural Disasters
Mega Infrastructure/P&L large Stakes
New Technologies
Equity
Multiple Powerful Forces at Work?
New requirements of Digitization
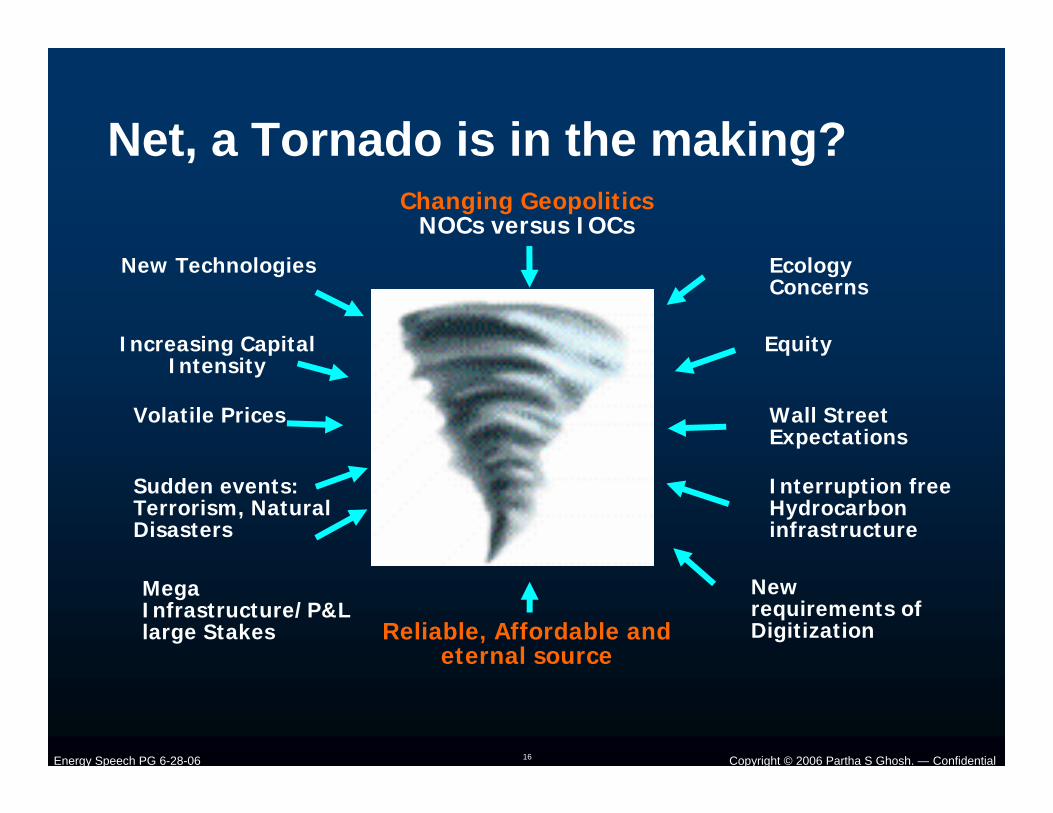
Copyright © 2006 Partha S Ghosh. — ConfidentialEnergy Speech PG 6-28-06 16
Net, a Tornado is in the making?Changing Geopolitics
NOCs versus IOCs
Reliable, Affordable and eternal source
Interruption free Hydrocarbon infrastructure
Wall Street Expectations
Ecology Concerns
Increasing Capital Intensity
Volatile Prices
Sudden events: Terrorism, Natural Disasters
Mega Infrastructure/P&L large Stakes
New Technologies
Equity
New requirements of Digitization
Copyright © 2006 Partha S Ghosh. — ConfidentialEnergy Speech PG 6-28-06 17
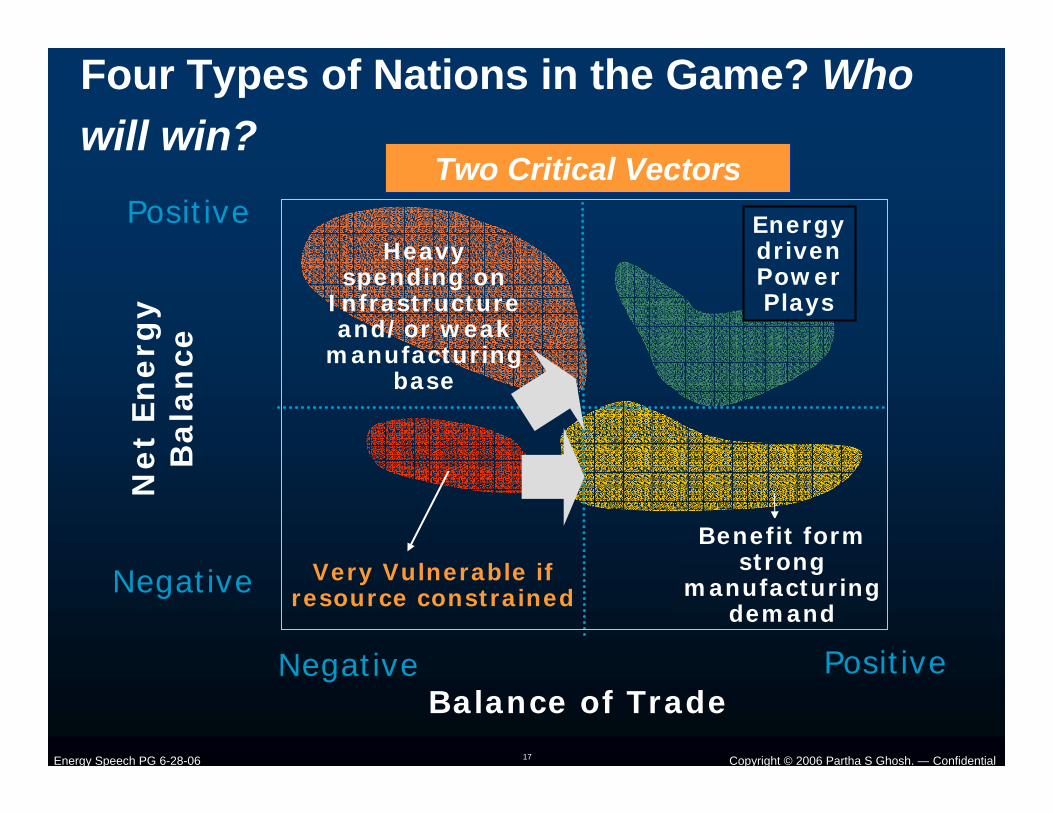
Four Types of Nations in the Game? Who will win?
Net
En
erg
y
Bala
nce
Balance of Trade
Very Vulnerable if resource constrained
Heavy spending on
Infrastructure and/or weak
manufacturing base
Benefit form strong
manufacturing demand
Energy driven Power Plays
Negative
Negative
PositiveTwo Critical Vectors
Positive
Copyright © 2006 Partha S Ghosh. — ConfidentialEnergy Speech PG 6-28-06 18
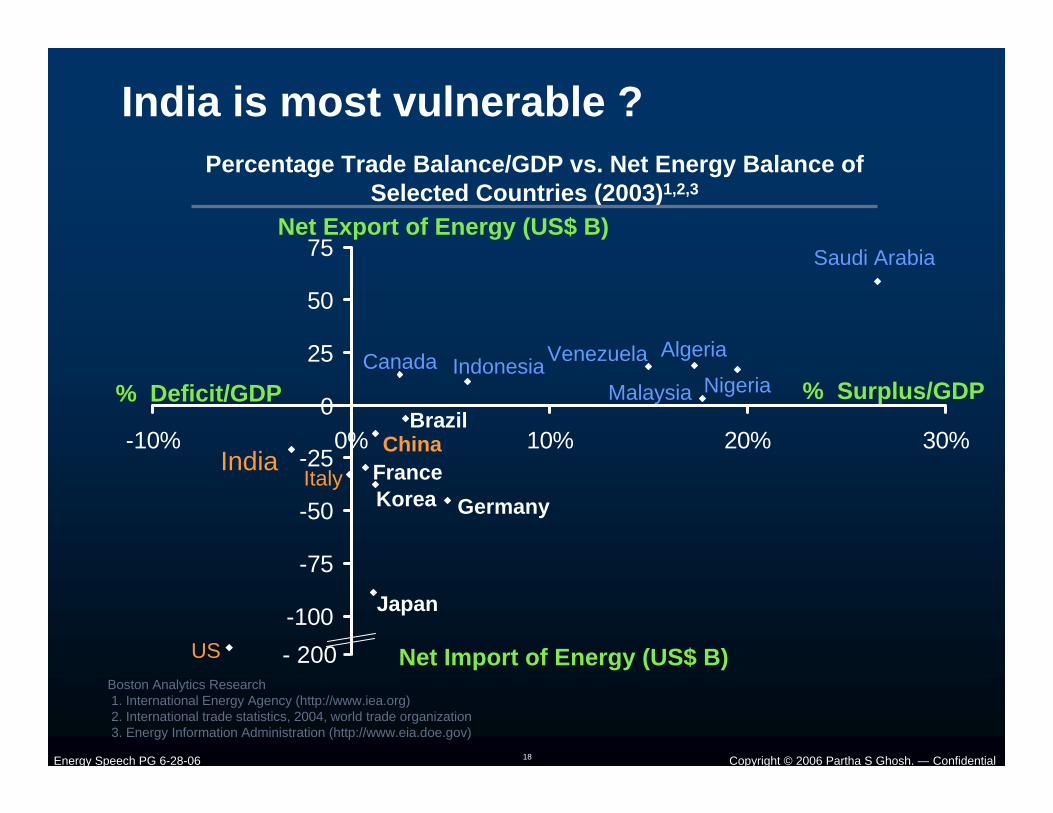
Percentage Trade Balance/GDP vs. Net Energy Balance of Selected Countries (2003)1,2,3
-100
-75
-50
-25
0
25
50
75
-10% 0% 10% 20% 30%
India is most vulnerable ?
Boston Analytics Research1. International Energy Agency (http://www.iea.org)2. International trade statistics, 2004, world trade organization3. Energy Information Administration (http://www.eia.doe.gov)
Net Export of Energy (US$ B)
Net Import of Energy (US$ B)
% Deficit/GDP % Surplus/GDP
IndiaItaly
Japan
Germany
Indonesia
Saudi Arabia
NigeriaMalaysia
AlgeriaVenezuelaCanada
BrazilChina
KoreaFrance
- 200US
Copyright © 2006 Partha S Ghosh. — ConfidentialEnergy Speech PG 6-28-06 19
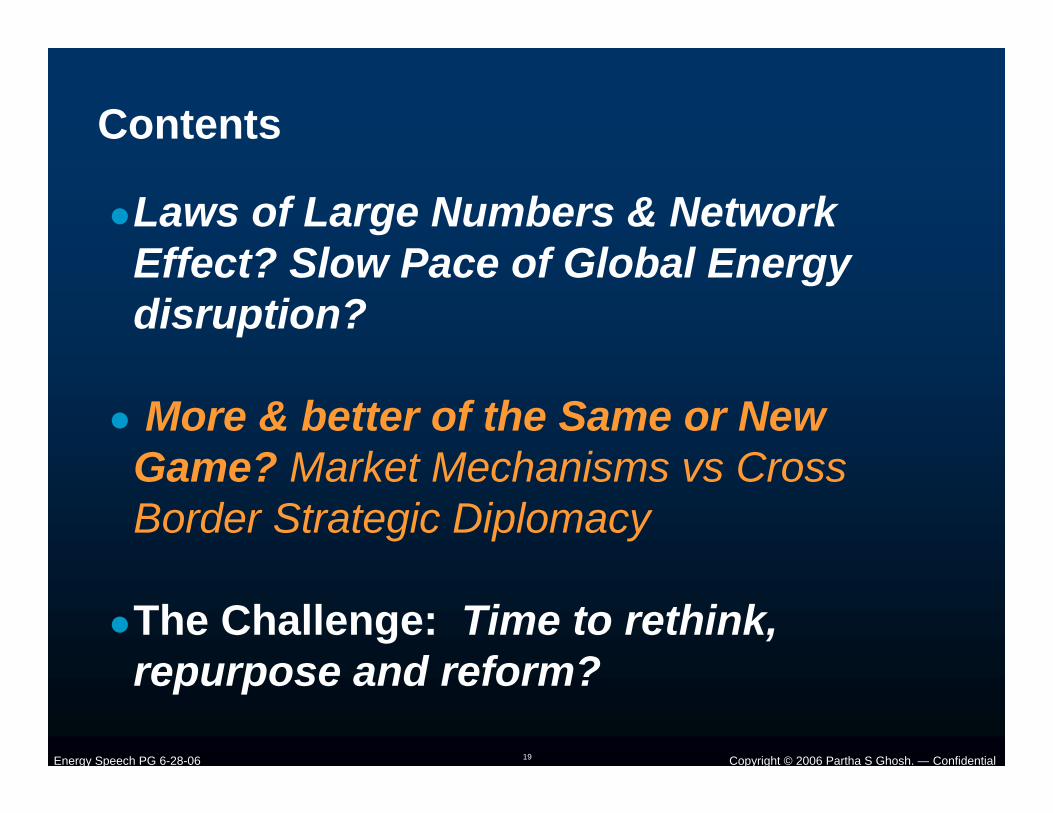
Contents
Laws of Large Numbers & Network Effect? Slow Pace of Global Energy disruption?
More & better of the Same or New Game? Market Mechanisms vs Cross Border Strategic Diplomacy
The Challenge: Time to rethink, repurpose and reform?
Copyright © 2006 Partha S Ghosh. — ConfidentialEnergy Speech PG 6-28-06 20
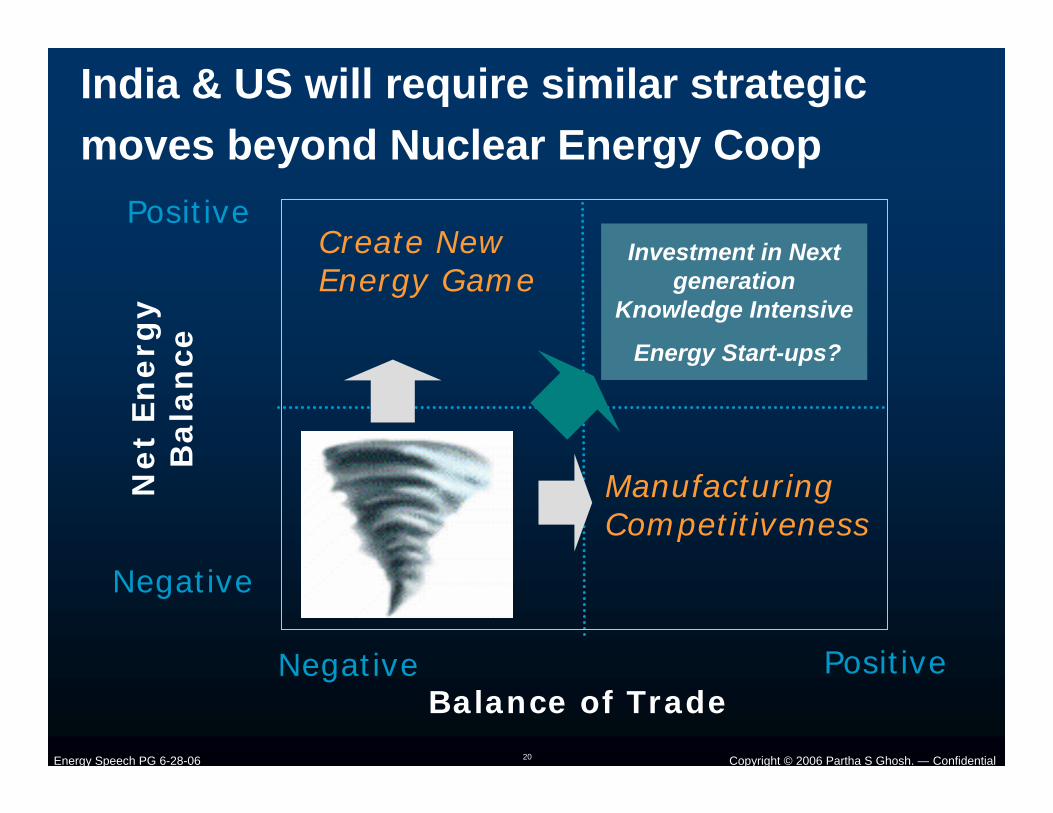
India & US will require similar strategic moves beyond Nuclear Energy Coop
Net
En
erg
y
Bala
nce
Balance of TradeNegative
Negative
Positive
Positive
Investment in Next generation
Knowledge Intensive
Energy Start-ups?
Create New Energy Game
Manufacturing Competitiveness
Copyright © 2006 Partha S Ghosh. — ConfidentialEnergy Speech PG 6-28-06 21
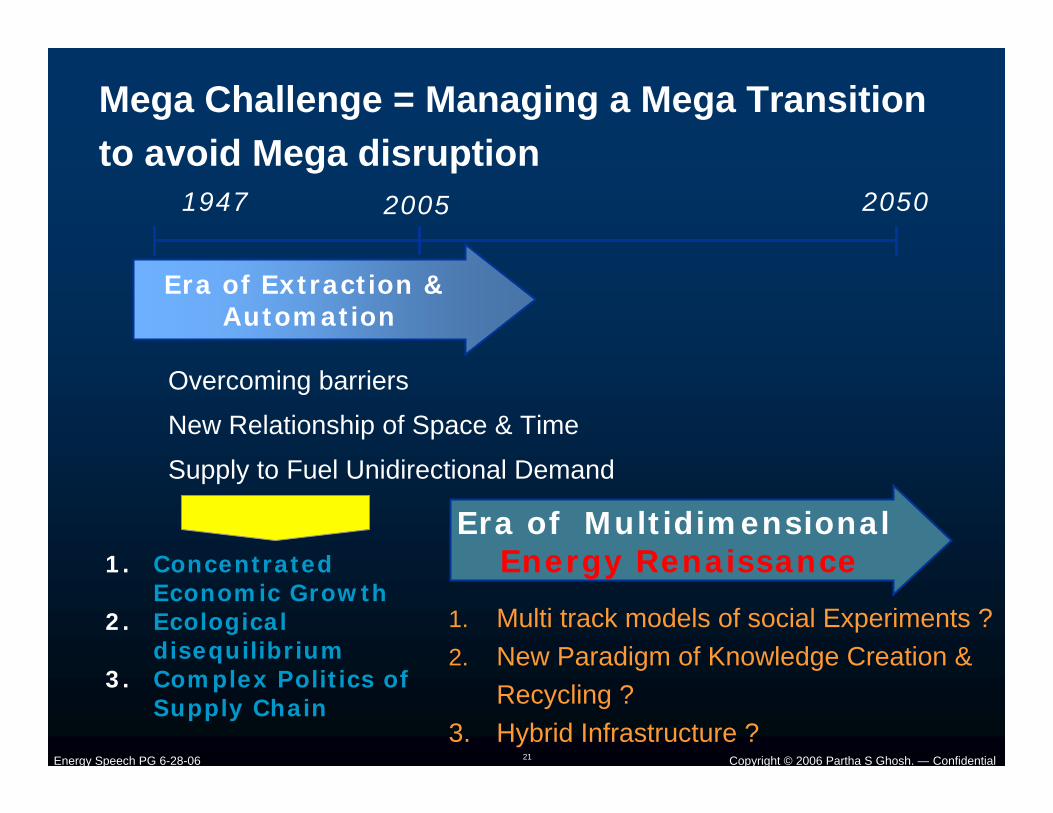
Mega Challenge = Managing a Mega Transition to avoid Mega disruption
Era of Extraction & Automation
Overcoming barriers
New Relationship of Space & Time
Supply to Fuel Unidirectional Demand
Era of Multidimensional Energy Renaissance
1. Multi track models of social Experiments ?2. New Paradigm of Knowledge Creation &
Recycling ?3. Hybrid Infrastructure ?
1947 20502005
1. Concentrated Economic Growth
2. Ecological disequilibrium
3. Complex Politics of Supply Chain
Copyright © 2006 Partha S Ghosh. — ConfidentialEnergy Speech PG 6-28-06 22
Contents
Mega World wide Energy disruption? Laws of Large Numbers & Network Effect
More & better of the Same or New Game? Market Mechanisms vs Cross Border Strategic Diplomacy
The Challenge (7 Imperatives) : Time to Rethink, Repurpose and Reform?
Copyright © 2006 Partha S Ghosh. — ConfidentialEnergy Speech PG 6-28-06 23
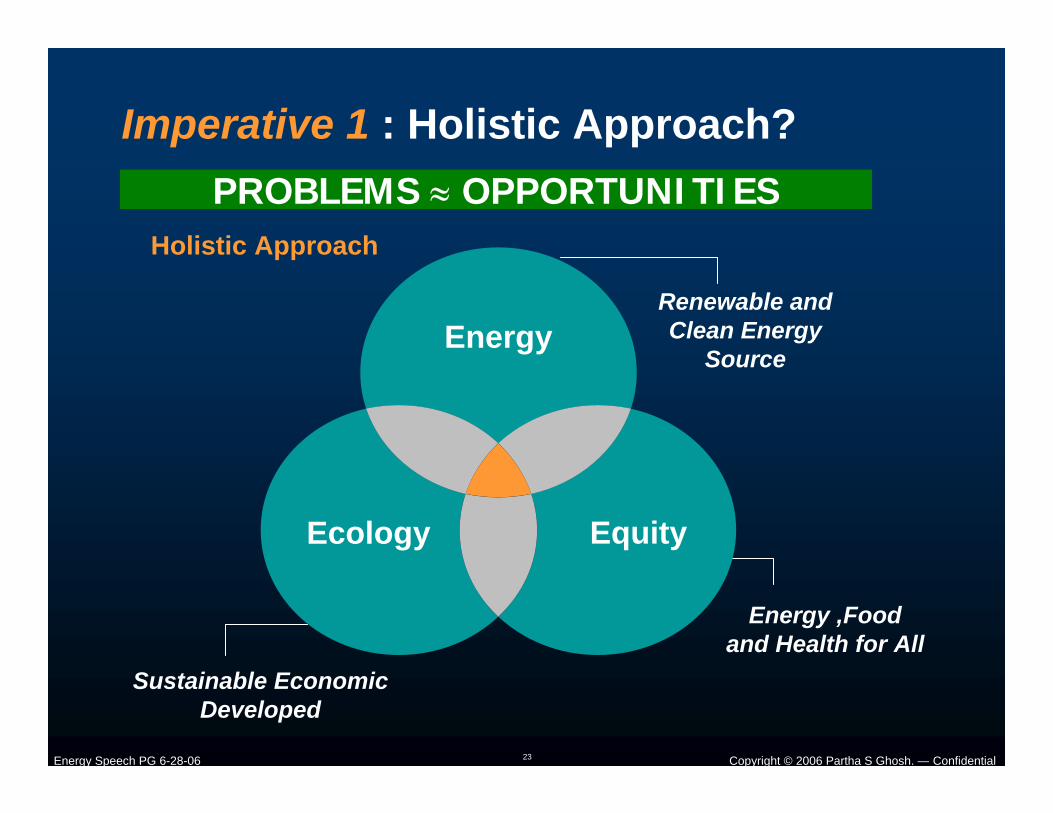
Imperative 1 : Holistic Approach?
Renewable and Clean Energy
SourceEnergy
Ecology Equity
Holistic Approach
Energy ,Food and Health for All
Sustainable Economic Developed
PROBLEMS ≈ OPPORTUNITIES
Copyright © 2006 Partha S Ghosh. — ConfidentialEnergy Speech PG 6-28-06 24
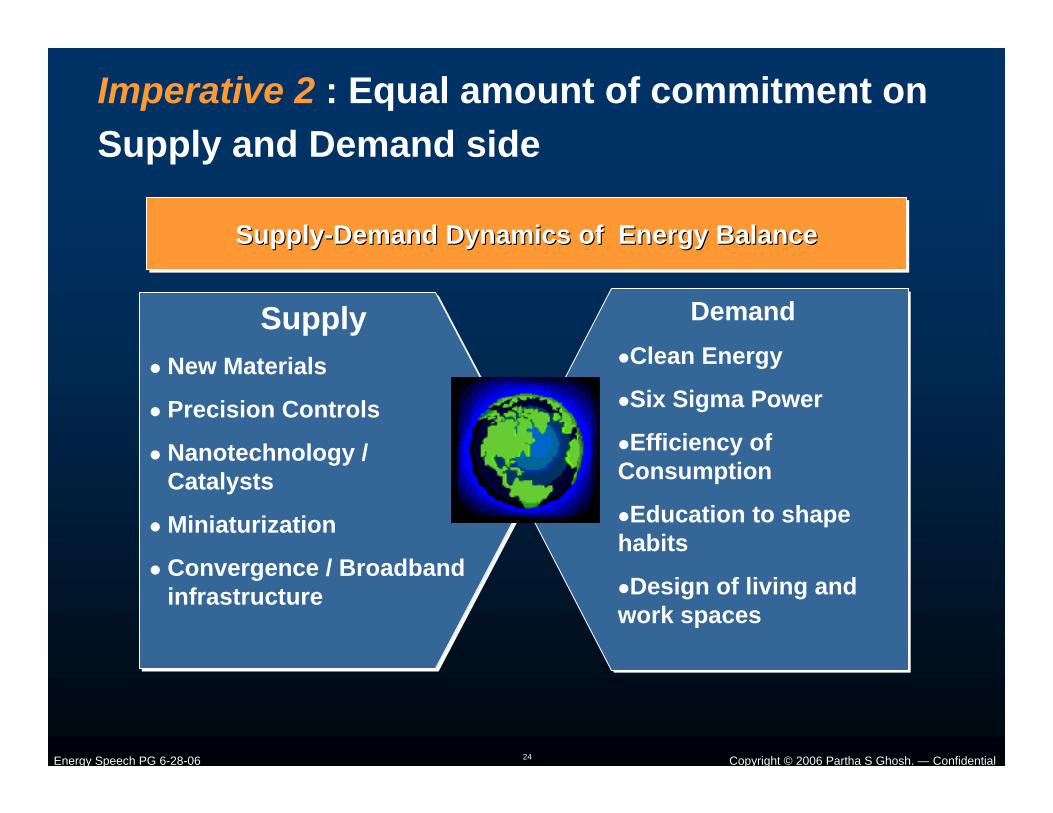
Imperative 2 : Equal amount of commitment on Supply and Demand side
SupplyNew Materials
Precision Controls
Nanotechnology / Catalysts
Miniaturization
Convergence / Broadband infrastructure
SupplyNew Materials
Precision Controls
Nanotechnology / Catalysts
Miniaturization
Convergence / Broadband infrastructure
DemandClean Energy
Six Sigma Power
Efficiency of Consumption
Education to shape habits
Design of living and work spaces
DemandClean Energy
Six Sigma Power
Efficiency of Consumption
Education to shape habits
Design of living and work spaces
Supply-Demand Dynamics of Energy BalanceSupplySupply--Demand Dynamics of Energy BalanceDemand Dynamics of Energy Balance
Copyright © 2006 Partha S Ghosh. — ConfidentialEnergy Speech PG 6-28-06 25
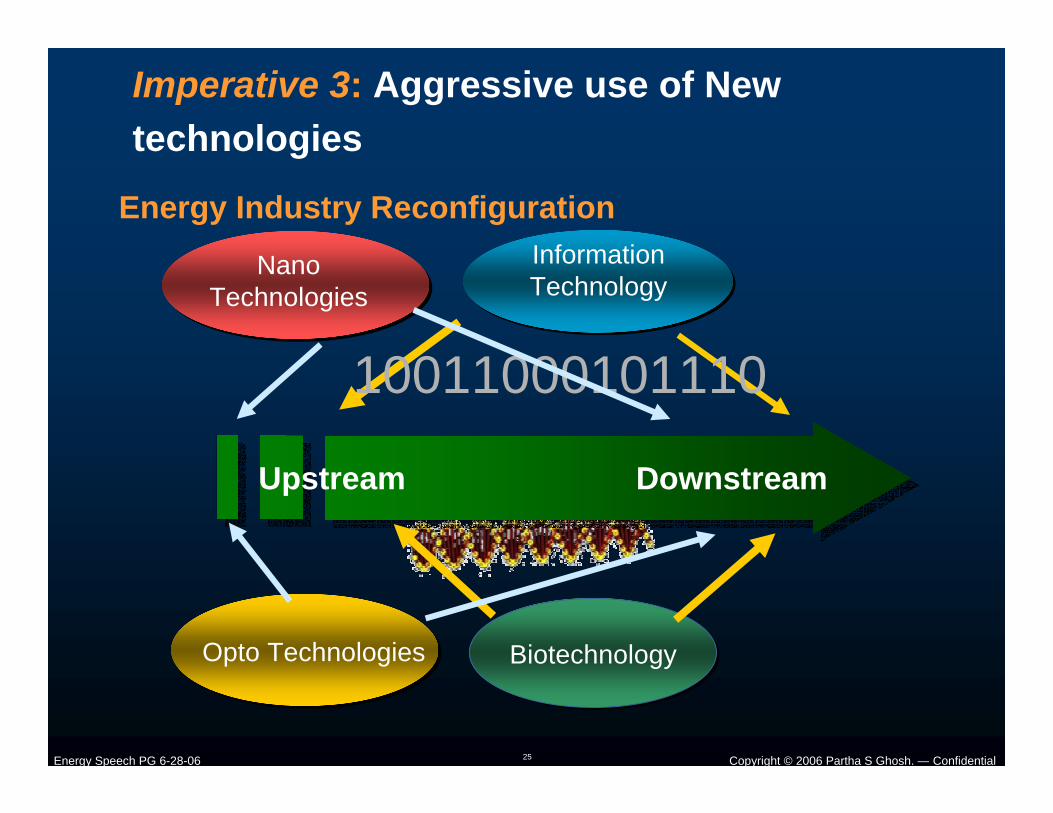
Upstream Downstream
Biotechnology
Information Technology
10011000101110
Energy Industry Reconfiguration
Imperative 3: Aggressive use of New technologies
Nano Technologies
Opto Technologies
Copyright © 2006 Partha S Ghosh. — ConfidentialEnergy Speech PG 6-28-06 26
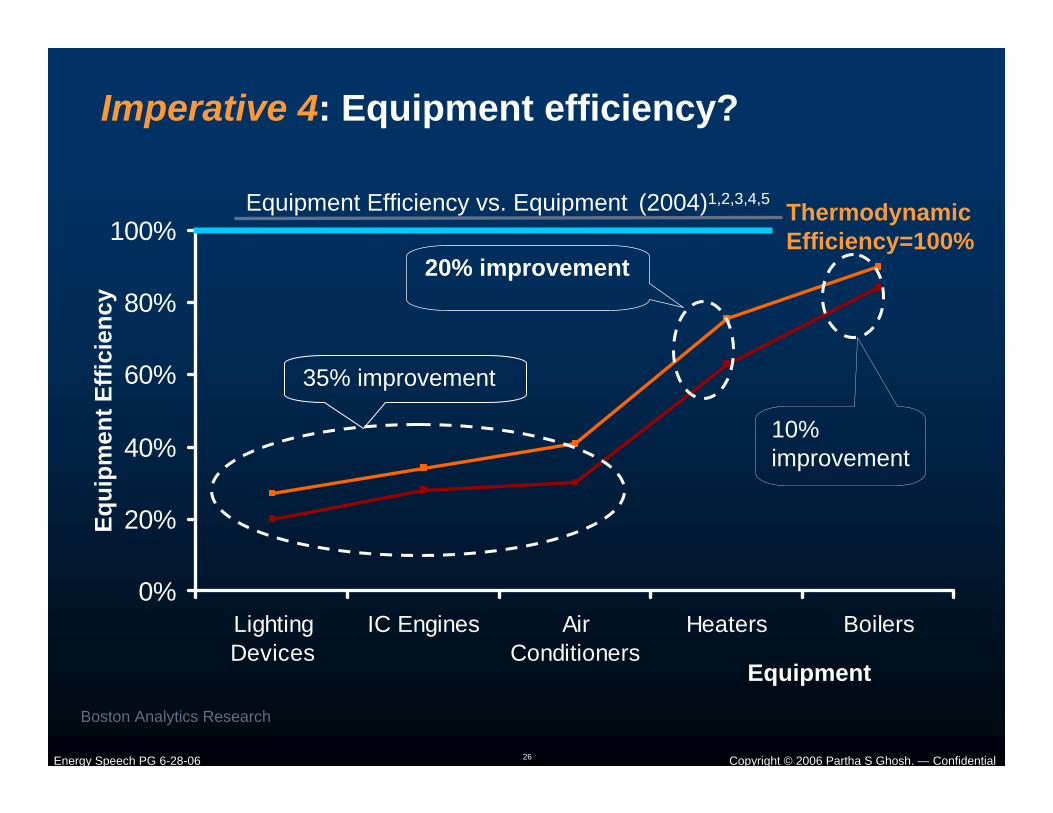
Equipment Efficiency vs. Equipment (2004)1,2,3,4,5
Boston Analytics Research
Imperative 4: Equipment efficiency?
0%
20%
40%
60%
80%
100%
LightingDevices
IC Engines AirConditioners
Heaters Boilers
Equi
pmen
t Effi
cien
cy
Equipment
Thermodynamic Efficiency=100%
35% improvement
20% improvement
10% improvement
Copyright © 2006 Partha S Ghosh. — ConfidentialEnergy Speech PG 6-28-06 27
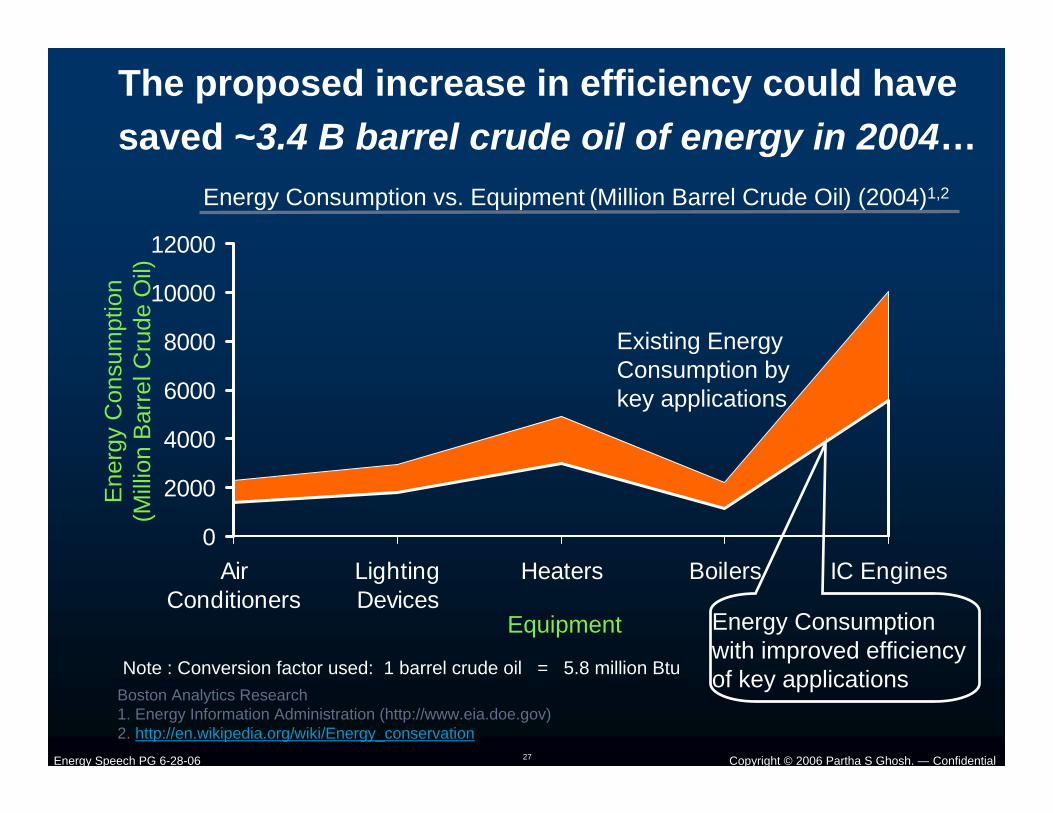
Energy Consumption vs. Equipment (Million Barrel Crude Oil) (2004)1,2
0
2000
4000
6000
8000
10000
12000
AirConditioners
LightingDevices
Heaters Boilers IC Engines
Existing Energy Consumption by key applications
Energy Consumption with improved efficiency of key applications
Ene
rgy
Con
sum
ptio
n (M
illio
n B
arre
l Cru
de O
il)
Equipment
The proposed increase in efficiency could have saved ~3.4 B barrel crude oil of energy in 2004…
Boston Analytics Research1. Energy Information Administration (http://www.eia.doe.gov)2. http://en.wikipedia.org/wiki/Energy_conservation
Note : Conversion factor used: 1 barrel crude oil = 5.8 million Btu
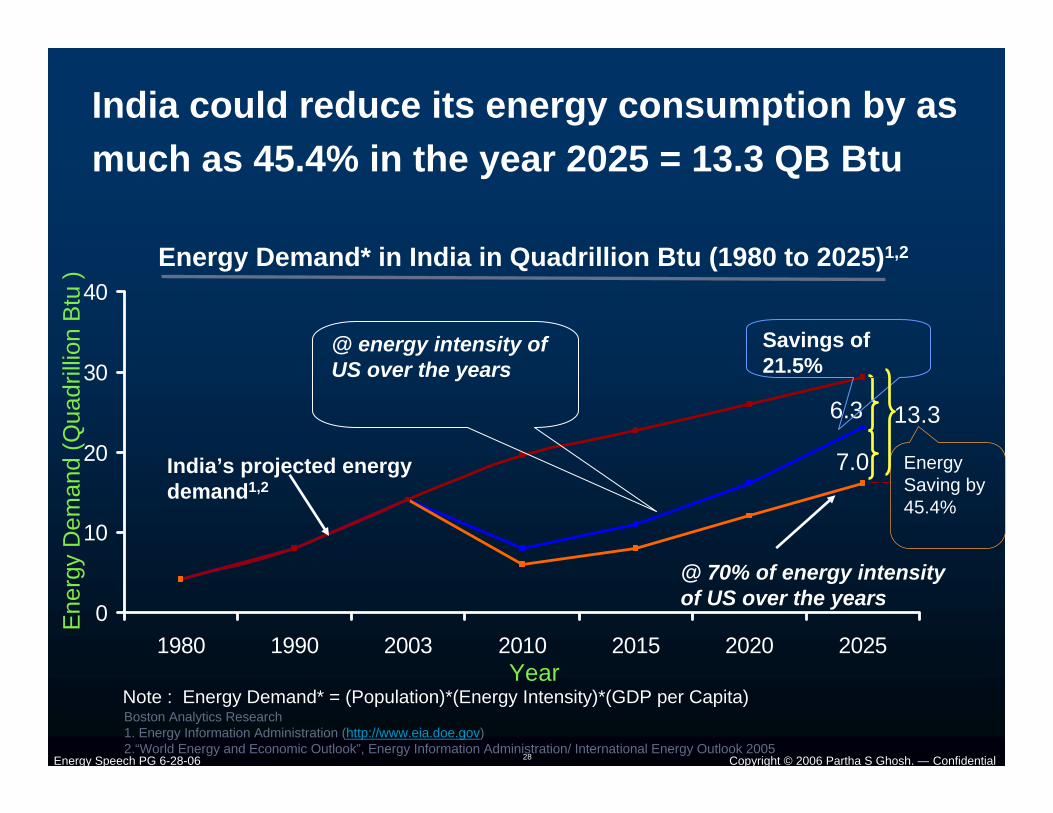
Copyright © 2006 Partha S Ghosh. — ConfidentialEnergy Speech PG 6-28-06 28
7.0
0
10
20
30
40
1980 1990 2003 2010 2015 2020 2025
Energy Demand* in India in Quadrillion Btu (1980 to 2025)1,2
India’s projected energy demand1,2
Ene
rgy
Dem
and
(Qua
drill
ion
Btu
)
Year
Boston Analytics Research1. Energy Information Administration (http://www.eia.doe.gov)2.“World Energy and Economic Outlook”, Energy Information Administration/ International Energy Outlook 2005
6.3
Note : Energy Demand* = (Population)*(Energy Intensity)*(GDP per Capita)
@ 70% of energy intensity of US over the years
Savings of 21.5%
Energy Saving by 45.4%
13.3
@ energy intensity of US over the years
India could reduce its energy consumption by as much as 45.4% in the year 2025 = 13.3 QB Btu
Copyright © 2006 Partha S Ghosh. — ConfidentialEnergy Speech PG 6-28-06 29
0100200300400500600700
2025 2025
15.2
Reduction in energy intensity could reduce world energy demand by 14% in 2025
World Energy Demand in Quadrillion Btu (2025)1 :If Energy Intensity is Reduced in Selected Regions
Projected Energy Demand
Reductionin India
Reductionin China
Reductionin WesternEurope
Reductionin US Projected
Energy Demand afterReductionAssumptions:
•Energy intensity is reduced by 35% for India and China•Energy intensity is reduced by 20% for Western Europe (WE) and US
10.3 38.226.5
Qua
drill
ion
Btu
Boston Analytics Research1. Energy Information Administration (http://www.eia.doe.gov)2.“World Energy and Economic Outlook”, Energy Information Administration/ International Energy Outlook 2005
554.8645.0
Copyright © 2006 Partha S Ghosh. — ConfidentialEnergy Speech PG 6-28-06 30
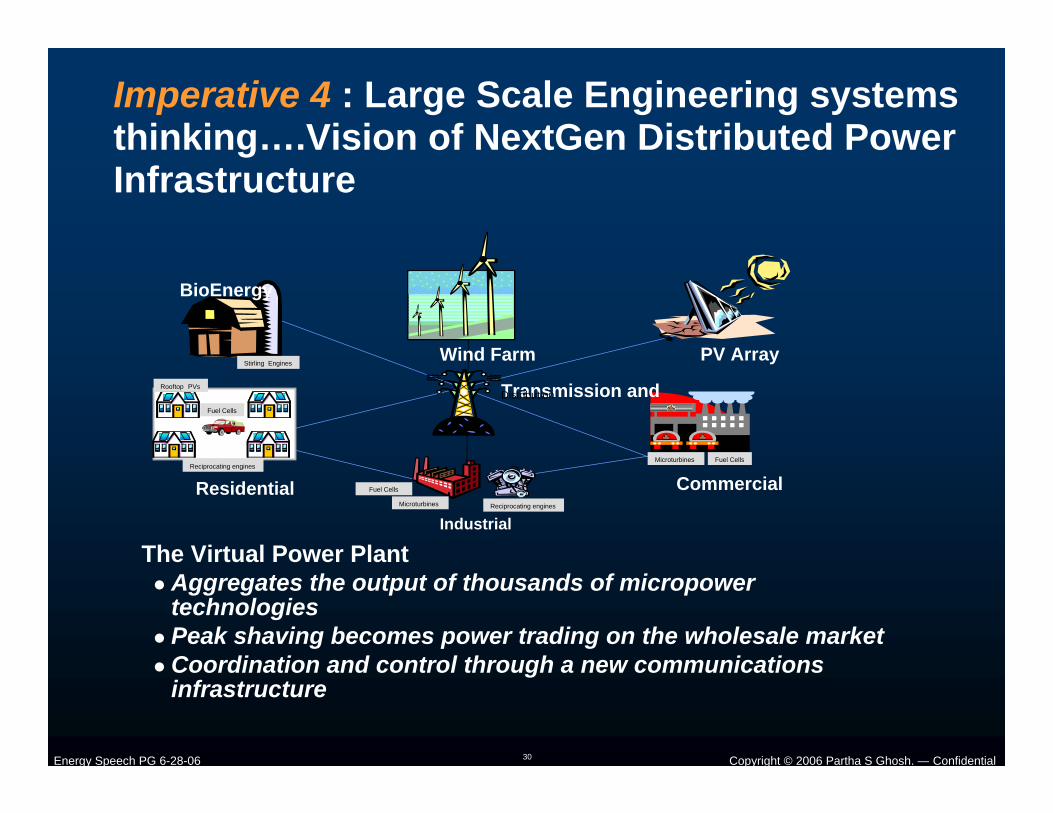
Imperative 4 : Large Scale Engineering systems thinking….Vision of NextGen Distributed Power Infrastructure
The Virtual Power PlantAggregates the output of thousands of micropower technologies Peak shaving becomes power trading on the wholesale marketCoordination and control through a new communications infrastructure
Residential
Rooftop PVs
Fuel Cells
Reciprocating engines
Stirling Engines
BioEnergy
PV Array
CommercialMicroturbines Fuel Cells
IndustrialReciprocating enginesMicroturbines
Transmission andDistribution
Wind Farm
Fuel Cells
Copyright © 2006 Partha S Ghosh. — ConfidentialEnergy Speech PG 6-28-06 31
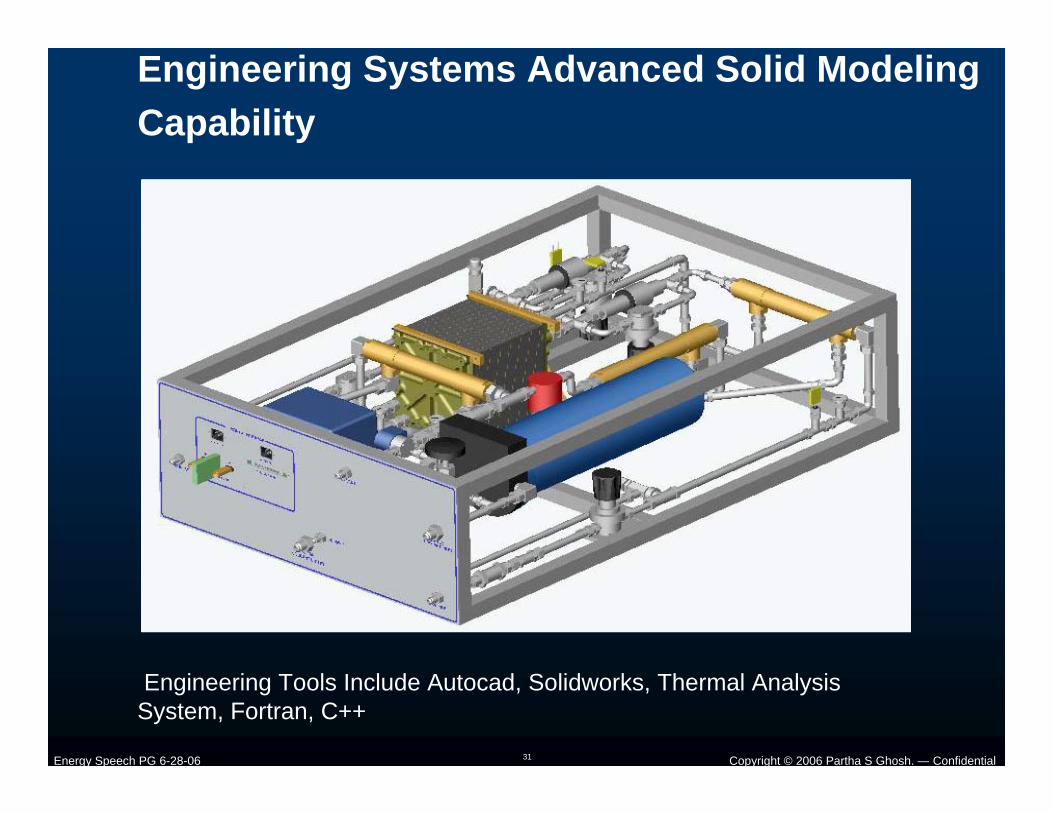
Engineering Systems Advanced Solid Modeling Capability
Engineering Tools Include Autocad, Solidworks, Thermal Analysis System, Fortran, C++
Copyright © 2006 Partha S Ghosh. — ConfidentialEnergy Speech PG 6-28-06 32
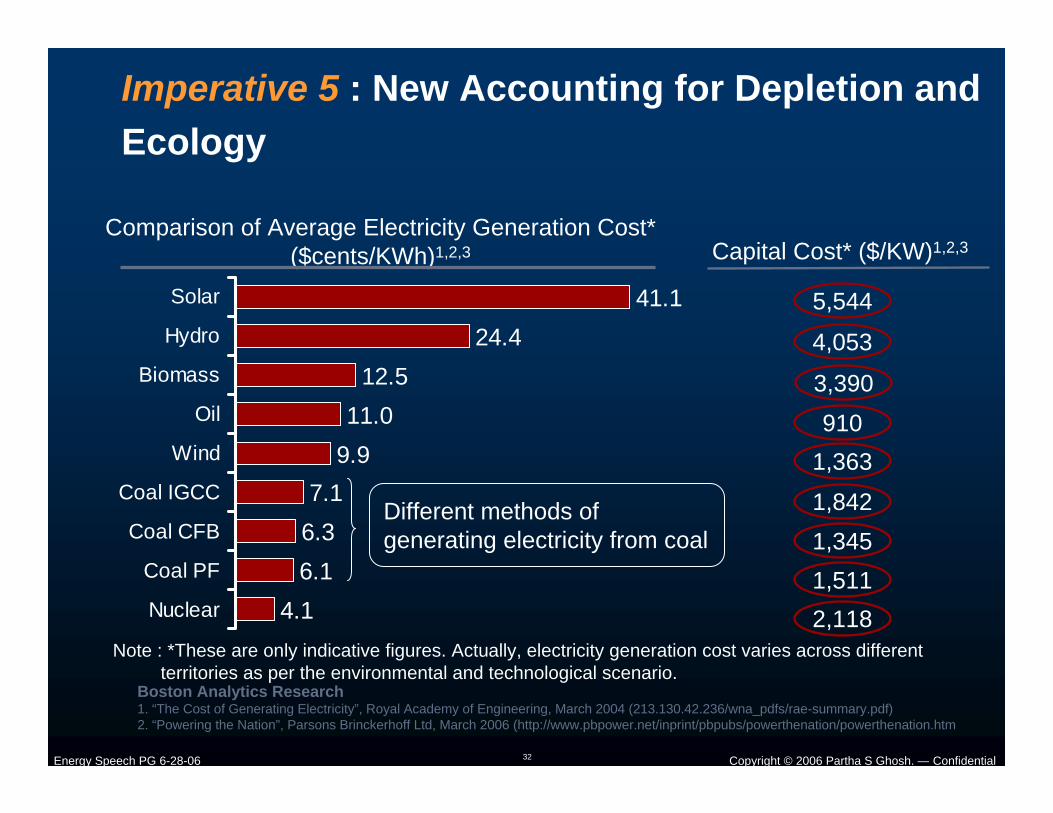
Imperative 5 : New Accounting for Depletion and Ecology
41.124.4
12.511.0
9.97.1
6.36.1
4.1
Solar
Hydro
Biomass
Oil
Wind
Coal IGCC
Coal CFB
Coal PF
Nuclear
Comparison of Average Electricity Generation Cost* ($cents/KWh)1,2,3
Boston Analytics Research1. “The Cost of Generating Electricity”, Royal Academy of Engineering, March 2004 (213.130.42.236/wna_pdfs/rae-summary.pdf)2. “Powering the Nation”, Parsons Brinckerhoff Ltd, March 2006 (http://www.pbpower.net/inprint/pbpubs/powerthenation/powerthenation.htm
Note : *These are only indicative figures. Actually, electricity generation cost varies across different territories as per the environmental and technological scenario.
Capital Cost* ($/KW)1,2,3
3,390910
1,363
1,8421,3451,5112,118
4,053
5,544
Different methods of generating electricity from coal
Copyright © 2006 Partha S Ghosh. — ConfidentialEnergy Speech PG 6-28-06 33
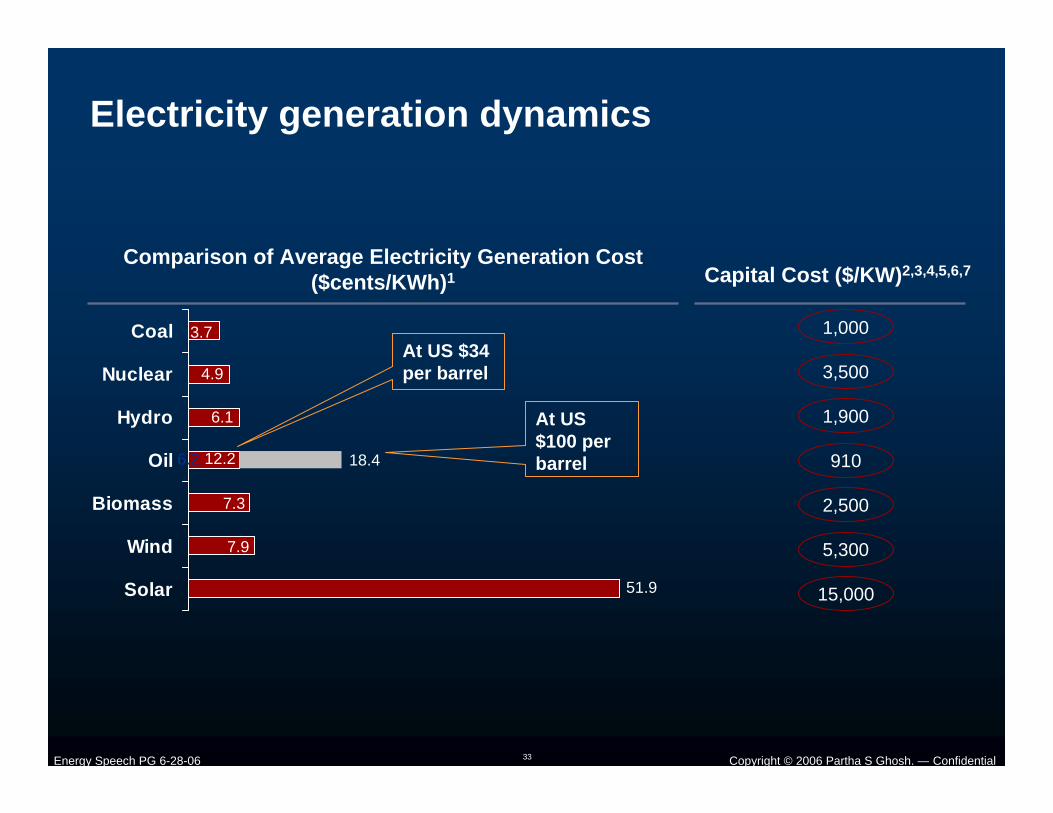
Capital Cost ($/KW)2,3,4,5,6,7
Coal
Nuclear
Hydro
Oil
Biomass
Wind
Solar
Electricity generation dynamics
Comparison of Average Electricity Generation Cost ($cents/KWh)1
3.7
4.9
6.1
7.3
7.9
51.9
6.2
1,000
3,500
1,900
910
2,500
5,300
15,000
12.2 18.4
At US $100 per barrel
At US $34 per barrel
Copyright © 2006 Partha S Ghosh. — ConfidentialEnergy Speech PG 6-28-06 34
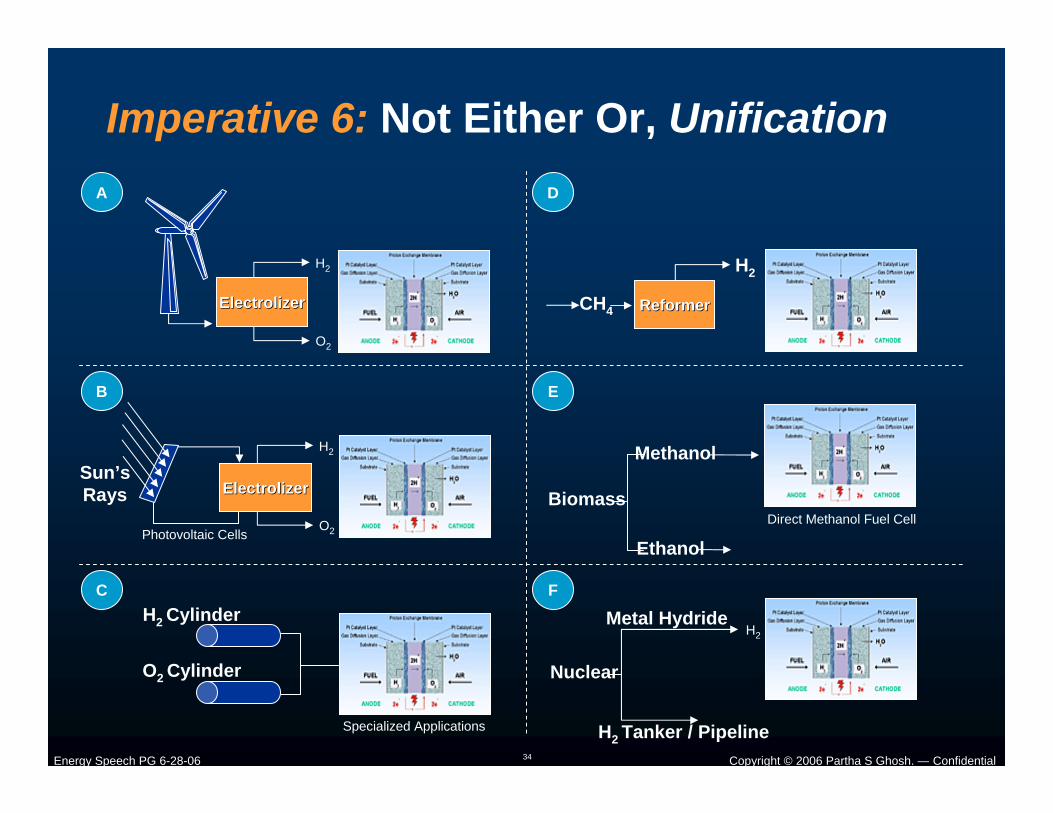
Imperative 6: Not Either Or, UnificationA D
B E
C F
CH4
H2
ReformerReformerElectrolizerElectrolizer
H2
O2
ElectrolizerElectrolizer
H2
O2Photovoltaic Cells
Methanol
Ethanol
Biomass
Nuclear
Metal Hydride
H2 Tanker / Pipeline
Direct Methanol Fuel Cell
Sun’sRays
H2 Cylinder
O2 Cylinder
Specialized Applications
H2
Copyright © 2006 Partha S Ghosh. — ConfidentialEnergy Speech PG 6-28-06 35
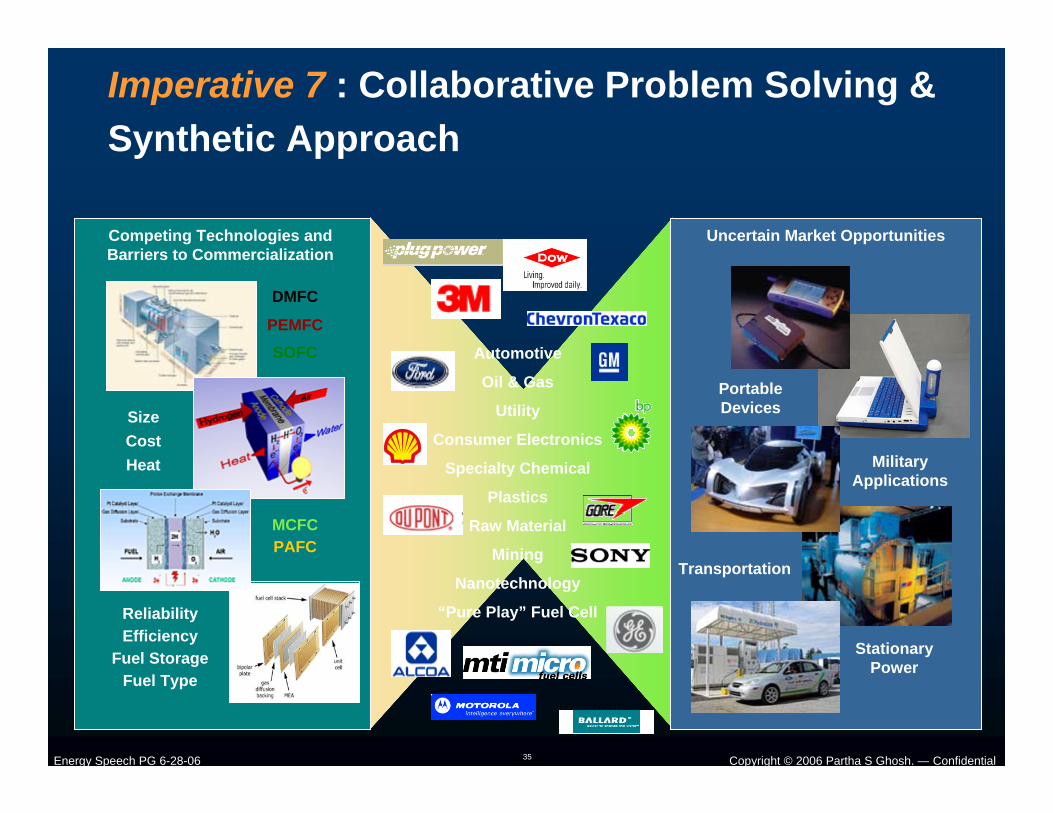
Imperative 7 : Collaborative Problem Solving & Synthetic Approach
Competing Technologies and Barriers to Commercialization
DMFC
PEMFC
MCFCPAFC
SOFC
CostSize
Fuel Type
ReliabilityEfficiency
Fuel Storage
Heat
Transportation
Portable Devices
Military Applications
Stationary Power
Uncertain Market Opportunities
Automotive
Oil & Gas
Utility
Consumer Electronics
Specialty Chemical
Plastics
Raw Material
Mining
Nanotechnology
“Pure Play” Fuel Cell
Copyright © 2006 Partha S Ghosh. — ConfidentialEnergy Speech PG 6-28-06 36
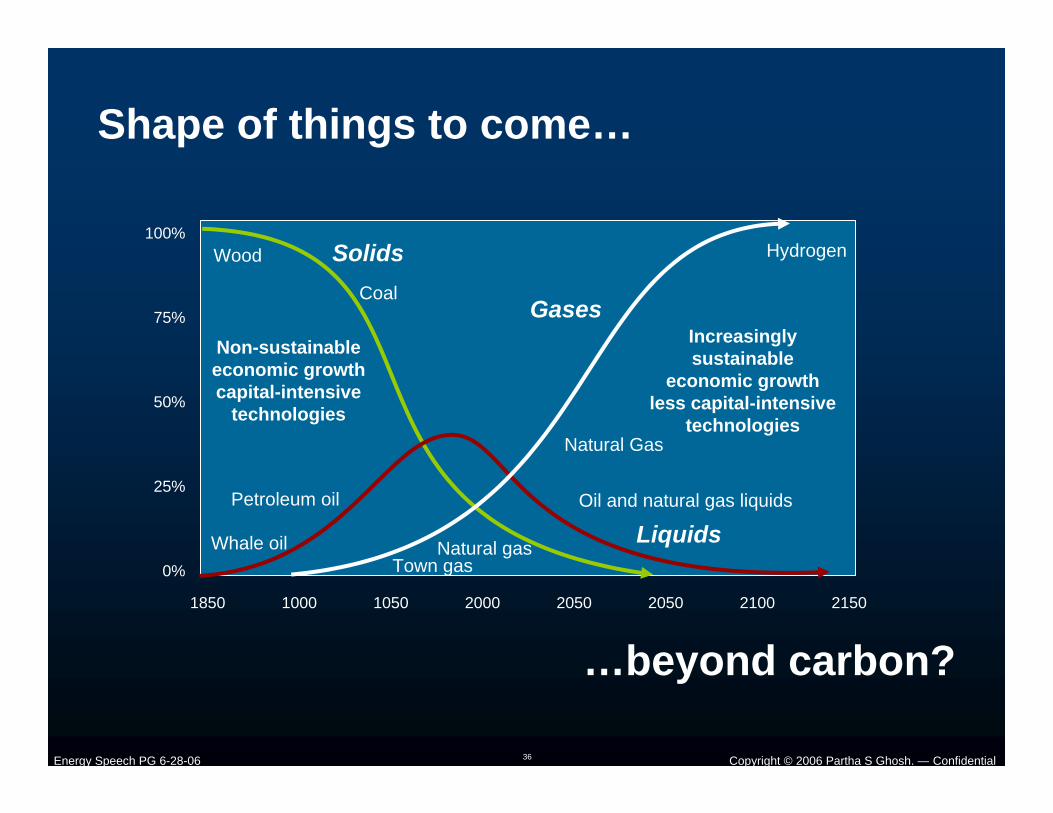
Shape of things to come…
Solids
Gases
HydrogenWood
Coal
Non-sustainable economic growth capital-intensive
technologies
Increasingly sustainable
economic growth less capital-intensive
technologiesNatural Gas
Oil and natural gas liquidsPetroleum oil
…beyond carbon?
100%
75%
50%
25%
0%
1850 1000 1050 2000 2050 2050 2100 2150
Whale oilTown gas
Natural gas Liquids
Copyright © 2006 Partha S Ghosh. — ConfidentialEnergy Speech PG 6-28-06 37
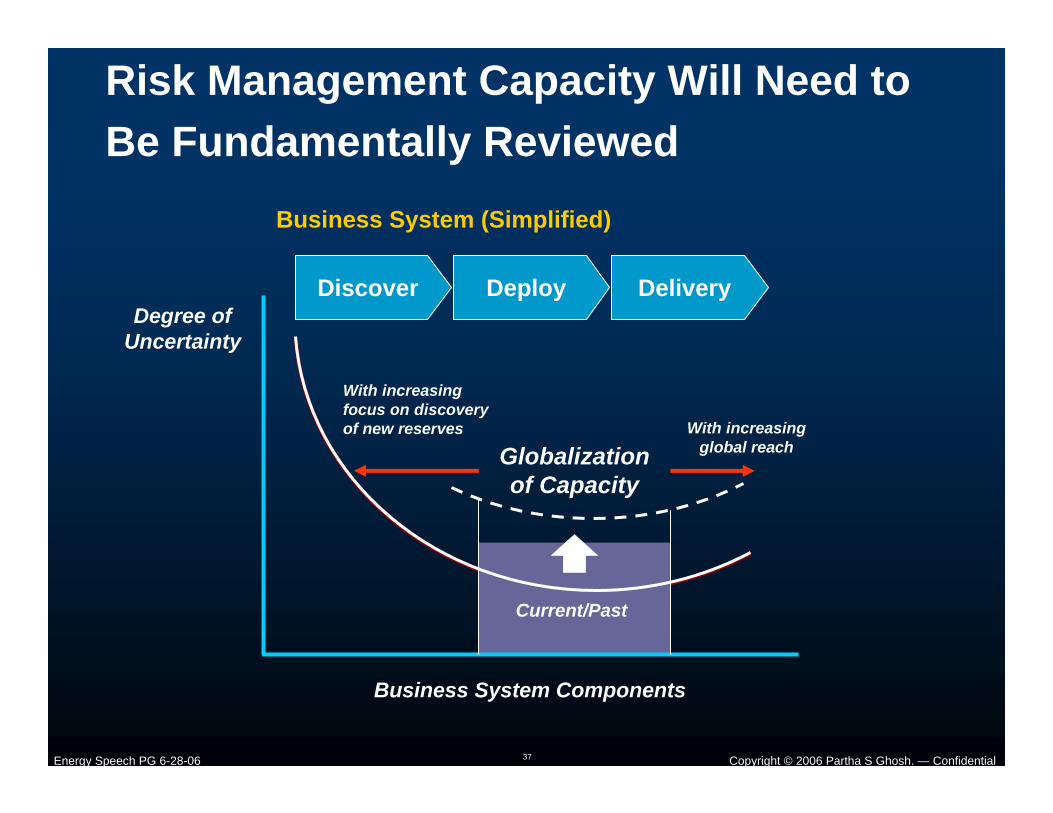
Risk Management Capacity Will Need to Be Fundamentally Reviewed
Degree of Uncertainty
Discover
Business System (Simplified)
Business System Components
Deploy Delivery
Globalization of Capacity
Current/Past
With increasing focus on discovery of new reserves With increasing
global reach
Copyright © 2006 Partha S Ghosh. — ConfidentialEnergy Speech PG 6-28-06 38
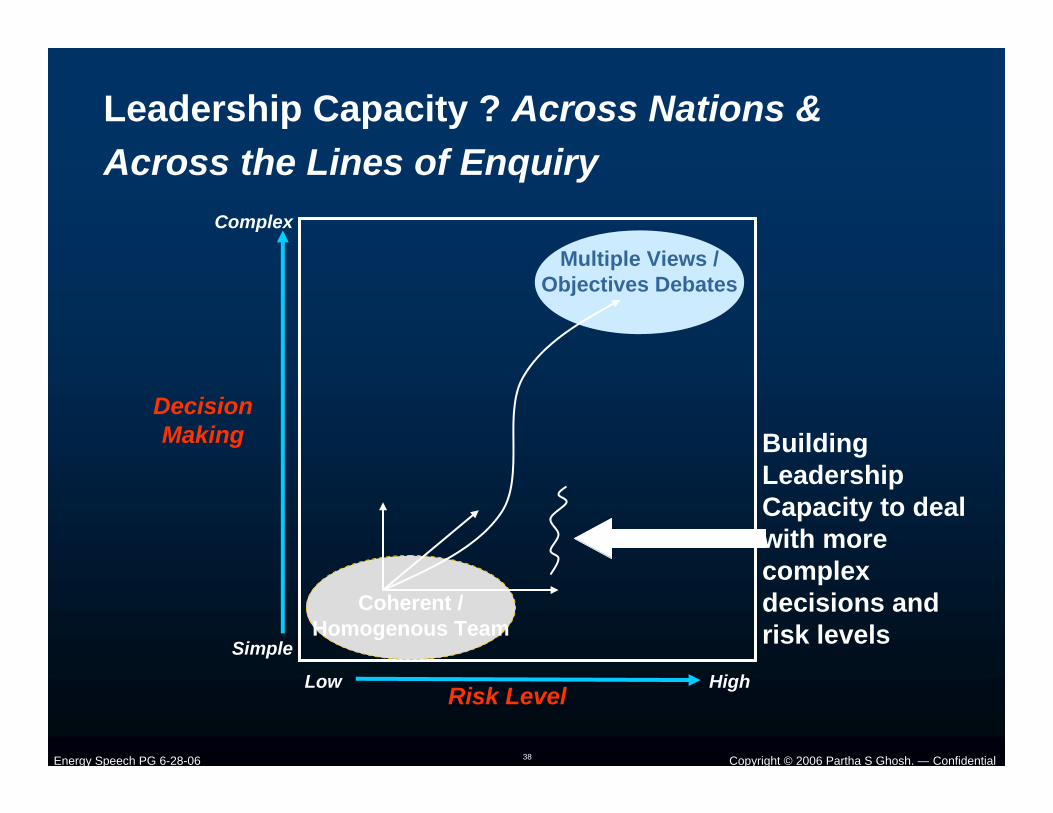
Leadership Capacity ? Across Nations & Across the Lines of Enquiry
Coherent /Homogenous Team
Multiple Views /Objectives Debates
Building Leadership Capacity to deal with more complex decisions and risk levels
Low HighRisk Level
Simple
Complex
Decision Making
Copyright © 2006 Partha S Ghosh. — ConfidentialEnergy Speech PG 6-28-06 39
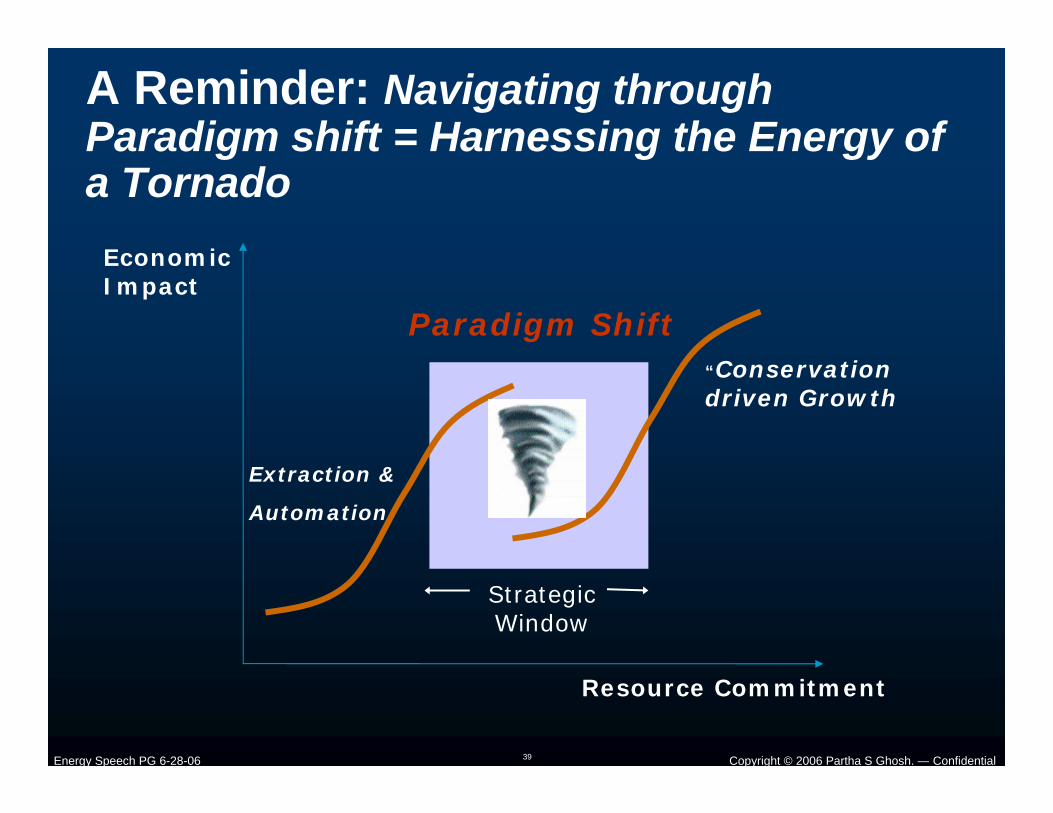
A Reminder: Navigating through Paradigm shift = Harnessing the Energy of a Tornado
Resource Commitment
EconomicImpact
Paradigm Shift“Conservation driven Growth
Extraction &
Automation
Strategic Window

Copyright © 2006 Partha S Ghosh. — ConfidentialEnergy Speech PG 6-28-06 40
The Journey forward . . .
Toward a New Toward a New Integrated Integrated Vision for Vision for Intelligent Intelligent
Holistic Energy Holistic Energy PlaysPlays
Copyright © 2006 Partha S Ghosh. — ConfidentialEnergy Speech PG 6-28-06 41
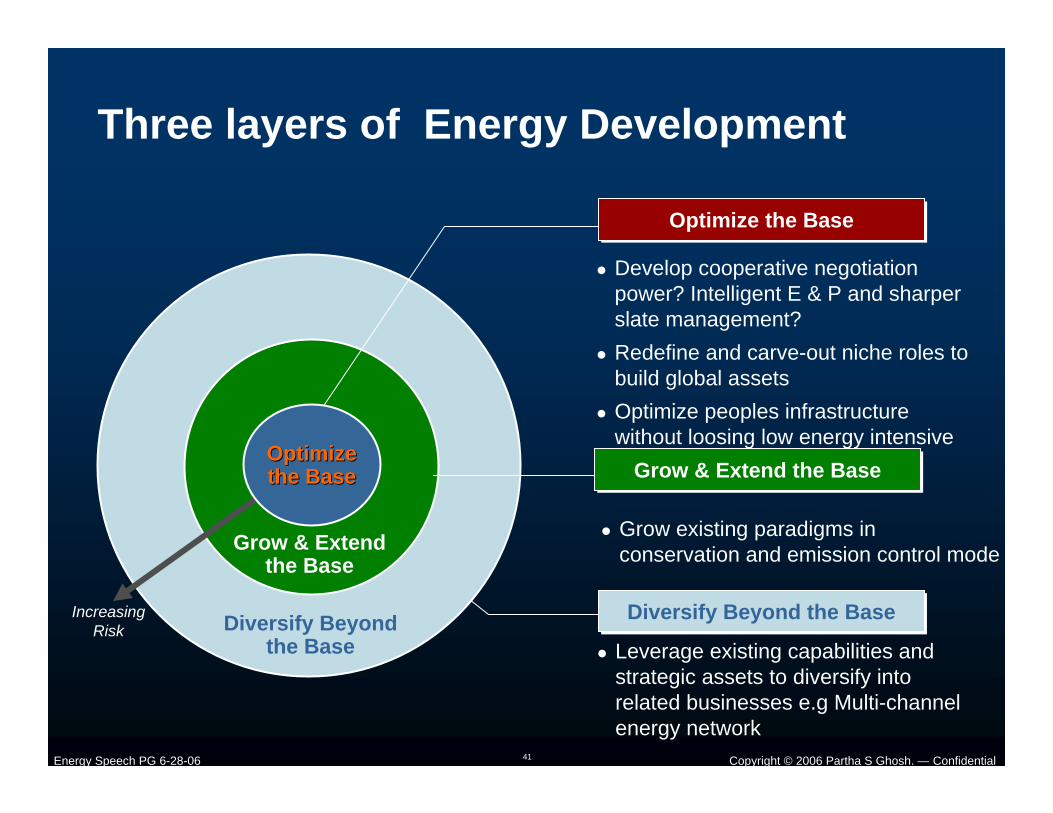
Three layers of Energy Development
Grow & Extend the Base
Diversify Beyond the Base
Grow existing paradigms in conservation and emission control mode
Leverage existing capabilities and strategic assets to diversify into related businesses e.g Multi-channel energy network
Develop cooperative negotiation power? Intelligent E & P and sharper slate management?Redefine and carve-out niche roles to build global assetsOptimize peoples infrastructure without loosing low energy intensive habits
Optimize the BaseOptimize the Base
Grow & Extend the BaseGrow & Extend the Base
Diversify Beyond the BaseDiversify Beyond the BaseIncreasing Risk
OptimizeOptimizethe Basethe Base
Copyright © 2006 Partha S Ghosh. — ConfidentialEnergy Speech PG 6-28-06 42
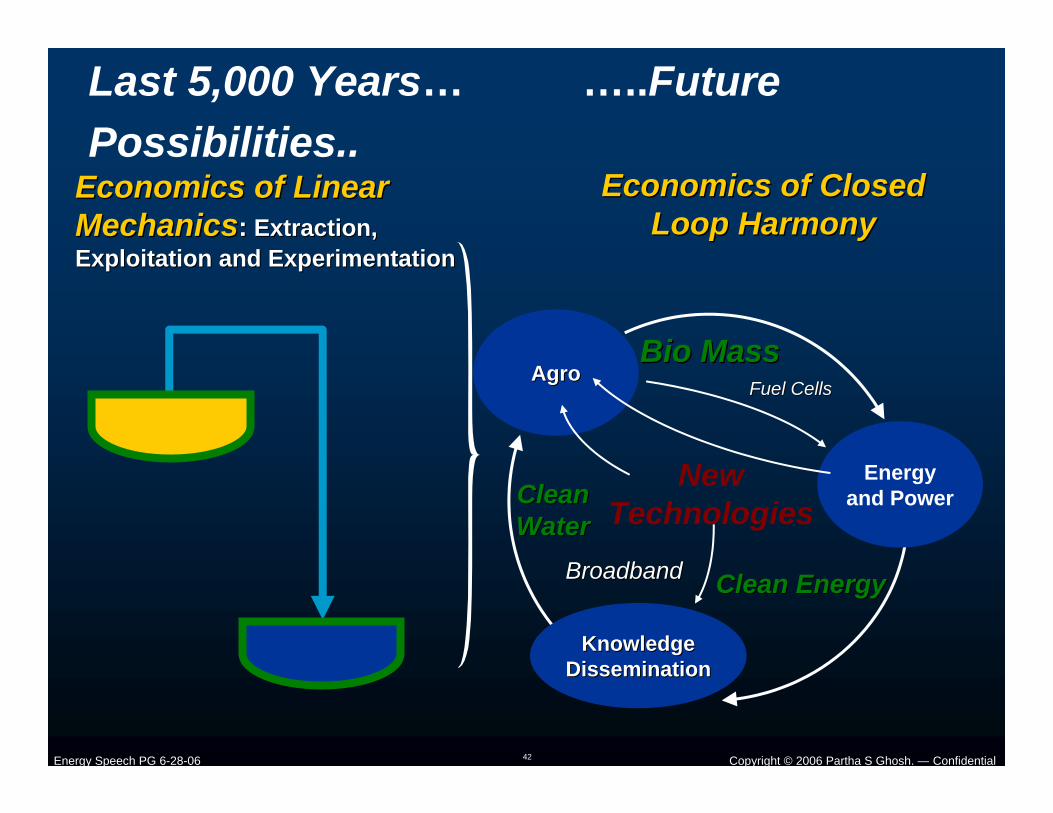
Last 5,000 Years… …..Future Possibilities..
Economics of Linear Economics of Linear MechanicsMechanics:: Extraction, Extraction, Exploitation and ExperimentationExploitation and Experimentation
Economics of Closed Economics of Closed Loop HarmonyLoop Harmony
Knowledge Knowledge DisseminationDissemination
New Technologies
AgroAgro
Energyand PowerClean Clean
WaterWater
Bio MassBio MassFuel CellsFuel Cells
BroadbandBroadband Clean EnergyClean Energy
Copyright © 2006 Partha S Ghosh. — ConfidentialEnergy Speech PG 6-28-06 43
HighLow
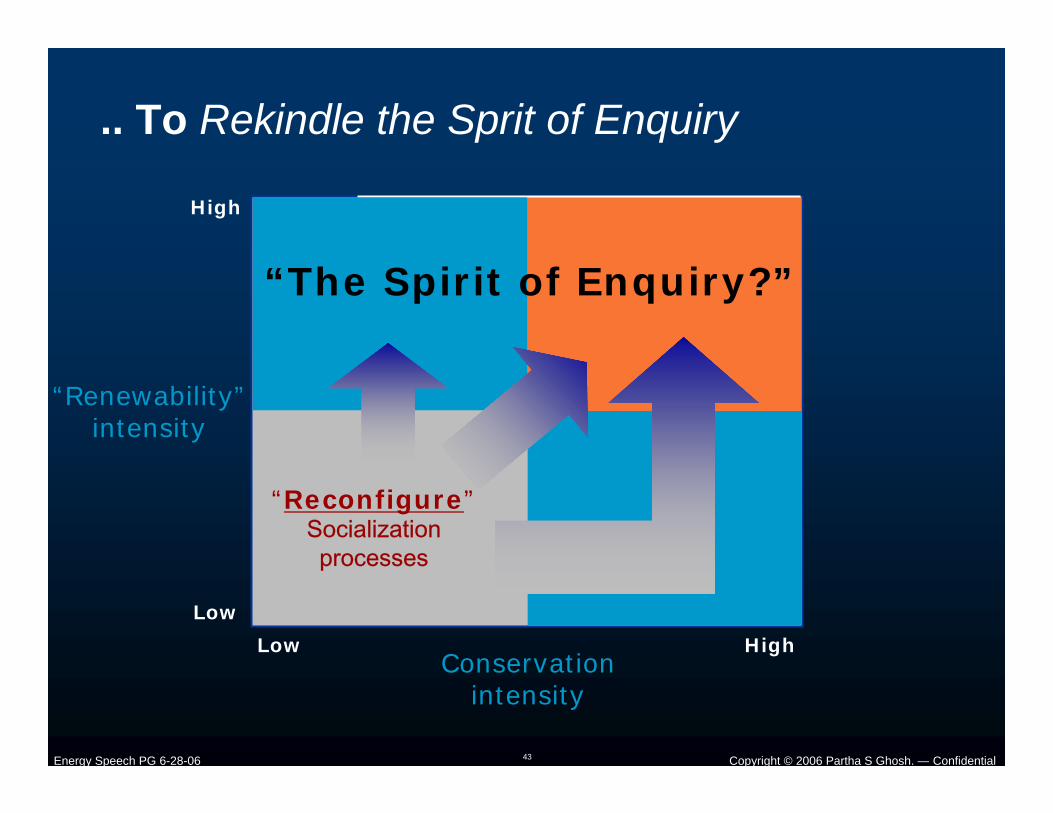
.. To Rekindle the Sprit of Enquiry
“Renewability”intensity
Conservation intensity
High
Low
“Reconfigure”Socialization processes
“The Spirit of Enquiry?”