Embed Size (px)
Citation preview
Edith Cowan University Edith Cowan University
Research Online Research Online
ECU Publications 2013
1-1-2013
The Forms of Bullying Scale (FBS): Validity and reliability The Forms of Bullying Scale (FBS): Validity and reliability
estimates for a measure of bullying victimization and perpetration estimates for a measure of bullying victimization and perpetration
in adolescence in adolescence
Therese M. Shaw Edith Cowan University
Julian J. Dooley Edith Cowan University
Donna S. Cross Edith Cowan University
Stephen R Zubrick
Stacey K. Waters Edith Cowan University
Follow this and additional works at: https://ro.ecu.edu.au/ecuworks2013
Part of the Educational Sociology Commons, and the Student Counseling and Personnel Services
Commons
10.1037/a0032955 This is an Author's Accepted Manuscript of: Shaw, T. M., Dooley, J. J., Cross, D. S., Zubrick, S., & Waters, S. K. (2013). The Forms of Bullying Scale (FBS): Validity and reliability estimates for a measure of bullying victimization and perpetration in adolescence. Psychological Assessment, 25(4), 1045-1057. Available here This article may not exactly replicate the final version published in the APA journal. It is not the copy of record. This Journal Article is posted at Research Online. https://ro.ecu.edu.au/ecuworks2013/743

1
This is a modified version of the following article published in Psychological Assessment:
Shaw, T., Dooley, J.J. Cross, D, Zubrick, S.R. & Waters, S. (2013). The Forms of Bullying Scale (FBS): Validity and Reliability Estimates for a Measure of Bullying Victimization and Perpetration in Adolescence. Psychological Assessment, Jun 2013, doi: 10.1037/a0032955
Note: This article does not exactly replicate the final version published in the APA journal. It is not a copy of the record. Copyright to the published article lies with the American Psychological Association.
The content of Appendices A & B may be reproduced and used for non-commercial research
and educational purposes without seeking written permission. Distribution must be controlled,
meaning only to the participants engaged in the research or enrolled in the educational activity.
In all instances the authors of the content must be acknowledged through appropriate citation.
Any other type of reproduction or distribution of test content is not authorized without written
permission from the copyright holders.
2
The Forms of Bullying Scale (FBS): Validity and reliability estimates for a measure of
bullying victimization and perpetration in adolescence
Thérèse Shaw
Child Health Promotion Research Centre, Edith Cowan University, Perth, Western Australia
Julian J. Dooley Sellenger Centre for Research in Law, Justice and Social Change, Edith Cowan University, Perth,
Western Australia
Donna Cross Child Health Promotion Research Centre, Edith Cowan University, Perth, Western Australia
Stephen R. Zubrick
University of Western Australia, Centre for Child Health Research, Telethon Institute for Child Health Research, Perth, Western Australia
Stacey Waters
Child Health Promotion Research Centre, Edith Cowan University, Perth, Western Australia
Correspondence concerning this article should be addressed to Thérèse Shaw, Child
Health Promotion Research Centre, Edith Cowan University, Perth, Western Australia. E-mail:
Acknowledgements
This research was supported by grants for Study One from the Western Australian
Health Promotion Foundation (Healthway) and for Study Two from Edith Cowan University.
We thank the students and staff in participating study schools as well as colleagues within our
research group who contributed to earlier versions of the scales. We also thank the
researchers who provided feedback on our questionnaire: Professor Peter Smith, Professor
Ersilia Menesini, Associate Professor Marilyn Campbell, and Professor Maritta Välimäki.

3
Abstract
The study of bullying behavior and its consequences for young people depends on valid and
reliable measurement of bullying victimization and perpetration. Whilst numerous self-report
bullying-related measures have been developed, robust evidence of their psychometric
properties is scant and several limitations inhibit their applicability. The Forms of Bullying
Scale (FBS), with versions to measure bullying victimization (FBS-V) and perpetration
(FBS-P), was developed based on existing instruments, for use with 12-15 year old
adolescents to economically yet comprehensively measure both bullying perpetration and
victimization. Measurement properties were estimated. Scale validity was tested using data
from two independent studies of 3,496 Grade 8 and 783 Grade 8-10 students respectively.
Construct validity of scores on the FBS was shown in confirmatory factor analysis. The
factor structure was not invariant across gender. Strong associations between the FBS-V and
FBS-P and separate single item bullying items demonstrated adequate concurrent validity.
Correlations, in directions as expected with social-emotional outcomes (i.e., depression,
anxiety, conduct problems and peer support), provided robust evidence of convergent and
discriminant validity. Responses to the FBS items were found to be valid and concurrently
reliable measures of self-reported frequency of bullying victimization and perpetration, as
well as being useful to measure involvement in the different forms of bullying behaviors.
Keywords
bullying, victimization, measurement, psychometrics, adolescents

4
The Forms of Bullying Scale (FBS): Validity and reliability estimates for a measure of
bullying victimization and perpetration in adolescence
Introduction
Bullying between students at school has been shown to be associated with poorer social,
physical, psychological, and academic outcomes for both the perpetrators and targeted
students (Arseneault, Bowes, & Shakoor, 2010; Card & Hodges, 2008; Nansel et al., 2001;
Wolke, Woods, Bloomfield, & Karstadt, 2001). The study of bullying behavior and its
negative consequences for children and adolescents is reliant on the valid measurement of
bullying victimization and perpetration. While there are several instruments currently
available, there are limited data available on their psychometric properties (Cornell &
Bandyopadhyay, 2010; Felix, Sharkey, Green, Furlong, & Tanigawa, 2011) and their
characteristics may limit their use in certain contexts. This paper describes our reasoning
behind the adaptation of existing scales to develop the Forms of Bullying Scale and testing of
the psychometric properties of the scale.
Bullying has been defined as intentional aggressive behavior repeated over a period of
time, where there is a power imbalance between the person being bullied and the perpetrator
(Olweus, 1996). Bullying behavior can take many forms. Historically it was seen as only
repeated verbal and physical acts. Verbal bullying includes both name-calling and threatening
behaviors, and physical bullying, behaviors typically directed at the victimized person and/or
their property (Slonje & Smith, 2008). Other forms of bullying, such as relational and social
bullying are now also recognized (Monks & Smith, 2006). Relational bullying aims to
damage a person’s peer relationships through exclusion or attempts to break up friendships
(Monks & Smith, 2006). Similarly, social bullying aims to damage a person’s social standing,
usually through spreading nasty rumors or lies about the targeted person, activities often
5
carried out by a third party (Crick & Grotpeter, 1995; Monks & Smith, 2006; Underwood,
2002).
Students involved in bullying have worse mental health outcomes than non-involved
students (Kaltiala-Heino, Rimpelä, Rantanen, & Rimpelä, 2000; Wolke et al., 2001).
Victimized students report higher levels of internalizing problems (Arseneault et al., 2010;
Hawker & Boulton, 2000; Juvonen, Graham, & Schuster, 2003) and lowered social status.
Importantly, acceptance in the peer group, having more friends, and friends able to assist and
protect have been shown to be protective of victimization (Card & Hodges, 2008; Juvonen et
al., 2003; Kendrick, Jutengren, & Stattin, 2012). In comparison, those who bully others are
more likely to be involved in other problem behaviors, such as externalizing conduct
problems, and less likely to engage in pro-social behaviors (Juvonen et al., 2003; Nansel et
al., 2001; Wolke et al., 2001).
Bullying measurement
Although some consensus has been reached on the characteristics of bullying behavior as
outlined in the given definition and the forms bullying takes (Bovaird, 2009; Smith, del
Barrio, & Tokunaga, In press), the approach to measurement of bullying is still under
considerable debate. The consequences of this debate can be seen in the development of a
range of instruments which use different methods to measure bullying (Furlong, Sharkey,
Felix, Tanigawa, & Greif-Green, 2010). The choice of an appropriate format for an
instrument to measure involvement in bullying behaviors is guided by the aim of the study
and therefore the purpose of the measurement (Felix et al., 2011; Greif & Furlong, 2006). If
the research aims to estimate and compare the prevalence of bullying victimization and
perpetration in general, single global questions are often utilized to categorize students as
having been bullied or bullied others (Solberg & Olweus, 2003). Suitable questions and cut-

6
off points for dichotomization of responses in accordance with students’ frequency of
involvement in bullying behaviors have been suggested by Solberg and Olweus (2003).
A second aim may be to estimate the prevalence of different forms of bullying behaviors
(e.g., verbal, relational, etc.) and track changes over time, where a scale comprising items
describing different behaviors would be more relevant. To determine associations between
involvement in bullying behaviors and other variables (e.g., mental health ) a multi-item
scale measuring involvement is more appropriate than a single global question designed to
measure prevalence (Felix et al., 2011). Composite scores, for example, mean scores, on such
a scale would have greater sensitivity and variability than a binary outcome and reflect the
continuous nature of the latent victimization or perpetration variable. Although some authors
have described the choice as being of one or the other, a researcher may opt to use both a
global question as well as a multi-item scale in their study.
As discussed by others (e.g., Furlong et al., 2010; Solberg & Olweus, 2003; Ybarra, Boyd,
Korchmaros, & Oppenheim, 2012) further considerations in instrument choice are whether
self-report or report from another informant will be used; a definition of bullying will be
provided and/or the term bullied used. In addition, choices around question wording, such as
a suitable referent time period and appropriate response options, are pertinent.
Informant
Self-report assessments are most commonly used to measure bullying behaviors (Felix et
al., 2011; Swearer, Siebecker, Johnsen-Frerichs, & Wang, 2010).The relative merits of self-
report versus other types of assessments such as peer- and teacher-nomination have been
comprehensively discussed (Cornell & Bandyopadhyay, 2010; Furlong et al., 2010; Ortega et
al., 2001; Solberg & Olweus, 2003). Self-report taps into the student’s perspective and is thus
more likely to reflect intentionality and power imbalance (Furlong et al., 2010). It provides

7
the opportunity for those victimized to report bullying that may not be known other than to
the student victimized and the perpetrator. Peer and teacher report is problematic within
secondary schools where students change classes and teachers throughout the school day, and
such reports would have limited ability to accurately reflect individual students’ bullying
involvement (Bovaird, 2009; Espelage & Swearer, 2003). Report by third parties, particularly
by teachers may also be limited to more overt than covert forms of bullying (Griffin & Gross,
2004). Among the practical advantages to self-report are the ability to quickly obtain data
from large numbers of students (Ortega et al., 2001) at relatively low cost and without the
ethical and consent issues related to peer-nominations and observational studies (Espelage &
Swearer, 2003; Griffin & Gross, 2004).
Use of definition and term bullied
The use of the word bullied together with a definition of the construct has been endorsed
by several researchers (Ortega et al., 2001; Smith, Cowie, Olafsson, & Liefooghe, 2002;
Solberg & Olweus, 2003). It has been questioned by others, primarily as labeling the
behavior may lead to under-reporting (Greif & Furlong, 2006; Kert, Codding, Tryon, &
Shiyko, 2010) as well as reporting based on different individual understandings of the term
(Smith et al., 2002). Providing a definition aims to ensure some degree of common
understanding of the phenomenon and increase the comparability of responses (Griffin &
Gross, 2004; Solberg & Olweus, 2003). It also enables the researcher to illustrate the three
characteristics of bullying (i.e., intention, repetition, power imbalance), and distinguish
bullying from aggression between equals and playful teasing (Ortega et al., 2001; Solberg &
Olweus, 2003). Ybarra and colleagues (Ybarra et al., 2012) recently assessed the impact of
the use of the term and provision of a written bullying definition. They recommended the
inclusion of the word bully in question wording for English-speaking samples in the USA, as
this had resulted in the lowest rate of misclassification of students. Furthermore, providing a
8
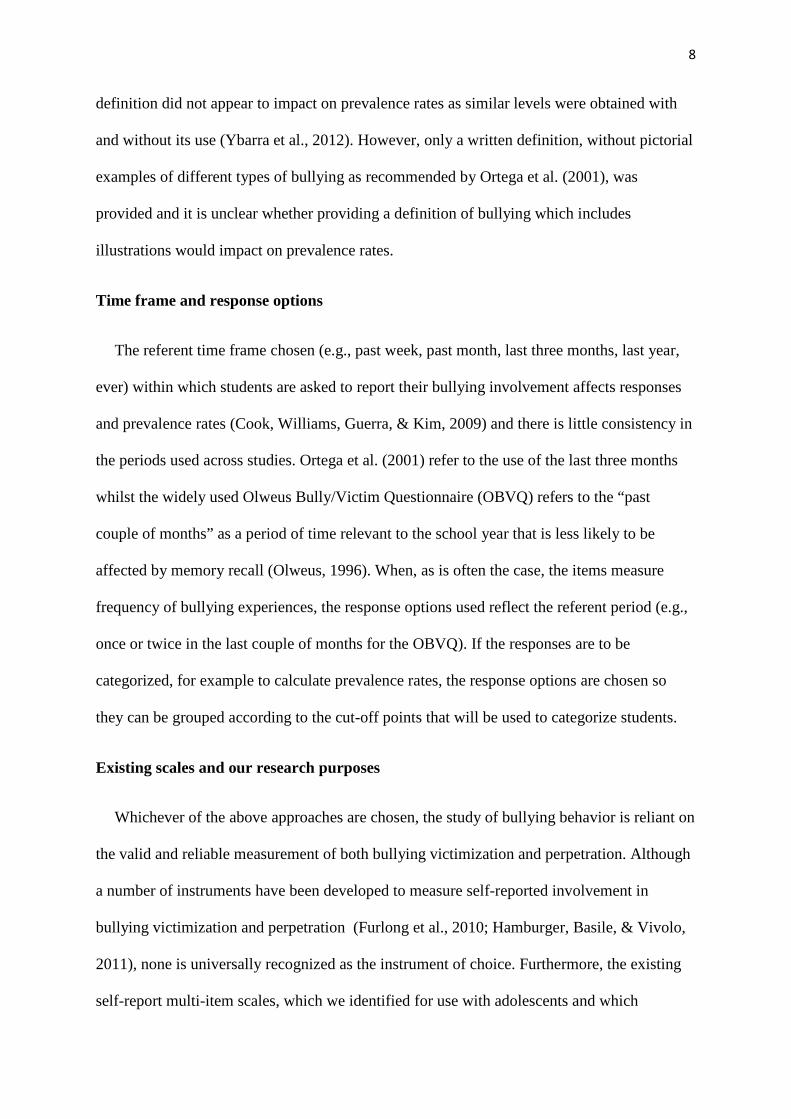
definition did not appear to impact on prevalence rates as similar levels were obtained with
and without its use (Ybarra et al., 2012). However, only a written definition, without pictorial
examples of different types of bullying as recommended by Ortega et al. (2001), was
provided and it is unclear whether providing a definition of bullying which includes
illustrations would impact on prevalence rates.
Time frame and response options
The referent time frame chosen (e.g., past week, past month, last three months, last year,
ever) within which students are asked to report their bullying involvement affects responses
and prevalence rates (Cook, Williams, Guerra, & Kim, 2009) and there is little consistency in
the periods used across studies. Ortega et al. (2001) refer to the use of the last three months
whilst the widely used Olweus Bully/Victim Questionnaire (OBVQ) refers to the “past
couple of months” as a period of time relevant to the school year that is less likely to be
affected by memory recall (Olweus, 1996). When, as is often the case, the items measure
frequency of bullying experiences, the response options used reflect the referent period (e.g.,
once or twice in the last couple of months for the OBVQ). If the responses are to be
categorized, for example to calculate prevalence rates, the response options are chosen so
they can be grouped according to the cut-off points that will be used to categorize students.
Existing scales and our research purposes
Whichever of the above approaches are chosen, the study of bullying behavior is reliant on
the valid and reliable measurement of both bullying victimization and perpetration. Although
a number of instruments have been developed to measure self-reported involvement in
bullying victimization and perpetration (Furlong et al., 2010; Hamburger, Basile, & Vivolo,
2011), none is universally recognized as the instrument of choice. Furthermore, the existing
self-report multi-item scales, which we identified for use with adolescents and which
9
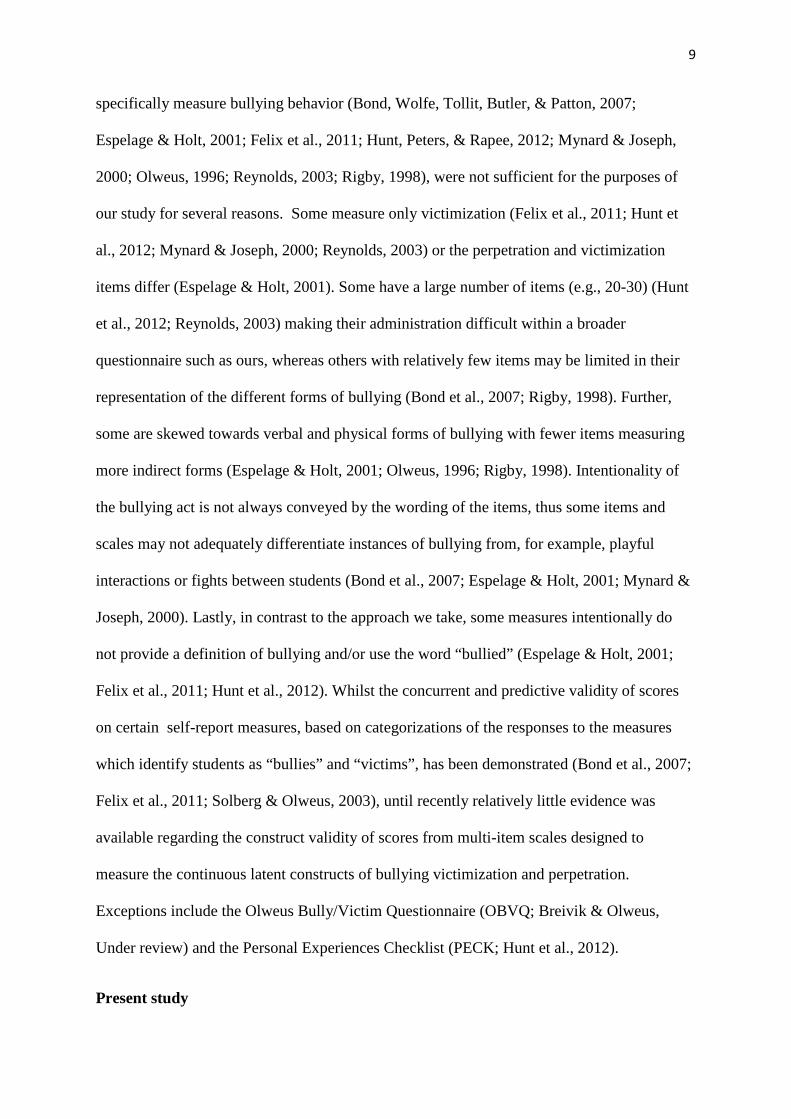
specifically measure bullying behavior (Bond, Wolfe, Tollit, Butler, & Patton, 2007;
Espelage & Holt, 2001; Felix et al., 2011; Hunt, Peters, & Rapee, 2012; Mynard & Joseph,
2000; Olweus, 1996; Reynolds, 2003; Rigby, 1998), were not sufficient for the purposes of
our study for several reasons. Some measure only victimization (Felix et al., 2011; Hunt et
al., 2012; Mynard & Joseph, 2000; Reynolds, 2003) or the perpetration and victimization
items differ (Espelage & Holt, 2001). Some have a large number of items (e.g., 20-30) (Hunt
et al., 2012; Reynolds, 2003) making their administration difficult within a broader
questionnaire such as ours, whereas others with relatively few items may be limited in their
representation of the different forms of bullying (Bond et al., 2007; Rigby, 1998). Further,
some are skewed towards verbal and physical forms of bullying with fewer items measuring
more indirect forms (Espelage & Holt, 2001; Olweus, 1996; Rigby, 1998). Intentionality of
the bullying act is not always conveyed by the wording of the items, thus some items and
scales may not adequately differentiate instances of bullying from, for example, playful
interactions or fights between students (Bond et al., 2007; Espelage & Holt, 2001; Mynard &
Joseph, 2000). Lastly, in contrast to the approach we take, some measures intentionally do
not provide a definition of bullying and/or use the word “bullied” (Espelage & Holt, 2001;
Felix et al., 2011; Hunt et al., 2012). Whilst the concurrent and predictive validity of scores
on certain self-report measures, based on categorizations of the responses to the measures
which identify students as “bullies” and “victims”, has been demonstrated (Bond et al., 2007;
Felix et al., 2011; Solberg & Olweus, 2003), until recently relatively little evidence was
available regarding the construct validity of scores from multi-item scales designed to
measure the continuous latent constructs of bullying victimization and perpetration.
Exceptions include the Olweus Bully/Victim Questionnaire (OBVQ; Breivik & Olweus,
Under review) and the Personal Experiences Checklist (PECK; Hunt et al., 2012).
Present study

10
The limitations of existing self-report instruments for the succinct measurement of the
different forms of bullying amongst adolescents and the general absence of robust estimates
of item and scale validity for bullying measures led us to adapt scales from one of the most
widely used questionnaires, the revised version of the OBVQ (Olweus, 1996), and to a lesser
extent, the Peer Relations Questionnaire (PRQ; Rigby, 1998) into the Forms of Bullying
Scale (FBS). The FBS, which has versions to measure victimization (FBS-V) and
perpetration (FBS-P), is a multi-item scale for use with adolescents (12-15 years), of
sufficient length to comprehensively assess self-reported involvement in different forms of
both bullying victimization and perpetration without being too long to administer within a
broader questionnaire.
The aim of this paper is to describe the Forms of Bullying Scale (FBS) and assess the
validity of the item responses to the FBS as measures of the continuous latent variables of
bullying victimization and perpetration. Since male students are more likely to report direct
forms of bullying (Archer, 2004), we were interested to also test the invariance of the factor
structure of the scale across gender groups.
Method
Construction of the FBS
The items in the FBS were based on the revised version of the OBVQ (Olweus, 1996) and
the PRQ (Rigby, 1998). Based on pilot work with students and teachers, items on the OBVQ
and PRQ were reworded to ensure the FBS was appropriate for secondary school students,
and existing items split or additional ones added to measure the different forms of bullying in
a more detailed way. We also aimed to ensure the wording of each of the items reflected
intent to harm (see Appendix B for the two versions of the FBS).
11
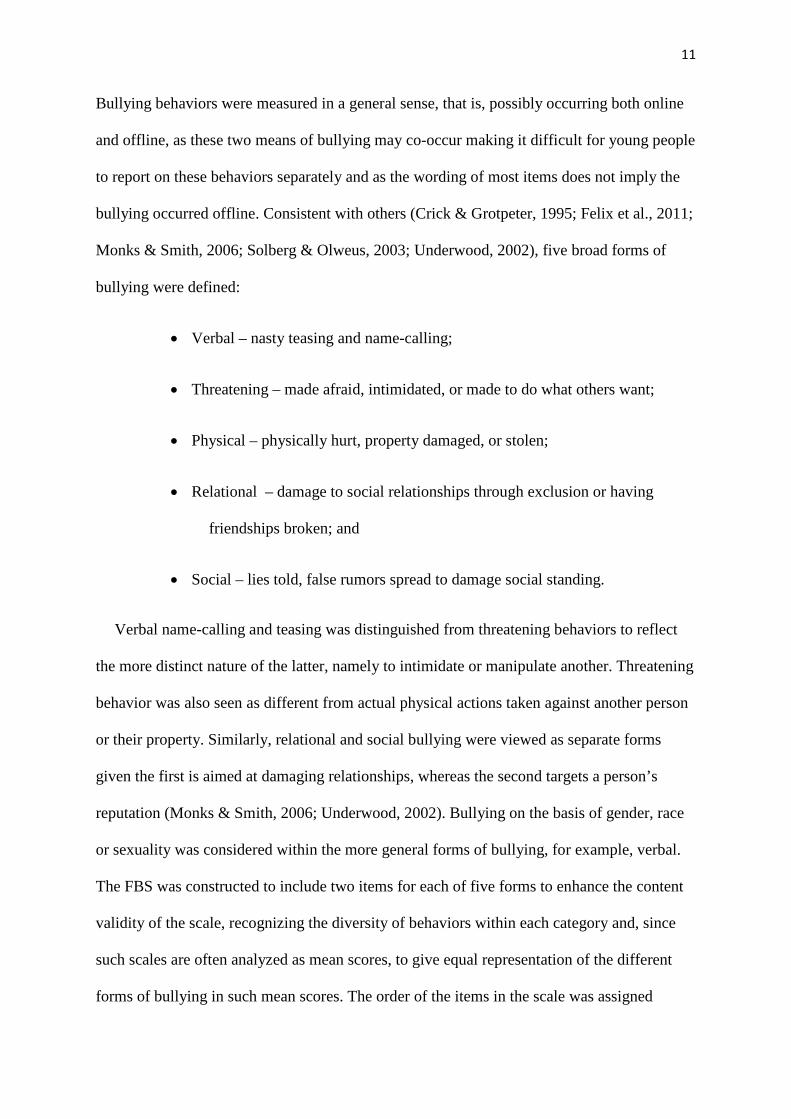
Bullying behaviors were measured in a general sense, that is, possibly occurring both online
and offline, as these two means of bullying may co-occur making it difficult for young people
to report on these behaviors separately and as the wording of most items does not imply the
bullying occurred offline. Consistent with others (Crick & Grotpeter, 1995; Felix et al., 2011;
Monks & Smith, 2006; Solberg & Olweus, 2003; Underwood, 2002), five broad forms of
bullying were defined:
• Verbal – nasty teasing and name-calling;
• Threatening – made afraid, intimidated, or made to do what others want;
• Physical – physically hurt, property damaged, or stolen;
• Relational – damage to social relationships through exclusion or having
friendships broken; and
• Social – lies told, false rumors spread to damage social standing.
Verbal name-calling and teasing was distinguished from threatening behaviors to reflect
the more distinct nature of the latter, namely to intimidate or manipulate another. Threatening
behavior was also seen as different from actual physical actions taken against another person
or their property. Similarly, relational and social bullying were viewed as separate forms
given the first is aimed at damaging relationships, whereas the second targets a person’s
reputation (Monks & Smith, 2006; Underwood, 2002). Bullying on the basis of gender, race
or sexuality was considered within the more general forms of bullying, for example, verbal.
The FBS was constructed to include two items for each of five forms to enhance the content
validity of the scale, recognizing the diversity of behaviors within each category and, since
such scales are often analyzed as mean scores, to give equal representation of the different
forms of bullying in such mean scores. The order of the items in the scale was assigned

12
randomly in two parts so that one item from each form appears in each half of the scale.
Since bullying victimization and perpetration can take the same forms, the two versions of
the scale comprise the same items, with wording changed to reflect victimization and
perpetration as appropriate.
The FBS-V and FBS-P were placed within a broader bullying questionnaire which also
included global questions measuring the bullying behaviors. As recommended by Ortega
(2001), the behavioral items and global questions were preceded by a definition of bullying
(see Appendix A) based on that of Olweus (1996), where examples of different forms of
bullying with pictures illustrating each form were included (with representations of non-cyber
as well as cyber methods), as were two examples of behaviors that are not bullying. A
definition of cyberbullying similar to Smith et al. (2008) was also provided (see Appendix
A). The series of questions on bullying victimization preceded those on perpetration.
The term bullied was used in the question stem and a definition provided to achieve some
commonality of understanding of the phenomenon and to emphasize the distinctive
characteristics, for example, power imbalance, of bullying which distinguish these behaviors
from aggression in general. The word bullied was also used for pragmatic reasons. The
broader questionnaire included questions measuring details of students’ bullying experiences
(e.g., duration, identity of perpetrator, response to being bullied) and use of the word enabled
simple and clear wording for these questions. Further, use of the term in the stem of the
scales aimed to achieve greater consistency between responses to the bullying scales
(behavioral items) and the global questions that followed them. Apart from the use of the
term bullied to elicit responses in line with the definition presented, terms such as
deliberately, to hurt, and nasty were also included within the items to indicate intent.
Repetition was incorporated in terms of the frequency of bullying experiences as indicated by
the response options of the items.

13
All questions referred to the respondents’ experiences in the previous school term, a
period of about ten weeks. The questions were phrased to reflect that students may have been
victimized by one or more perpetrators and similarly, that the bullying may have been
perpetrated as an individual or within a group. The referent period of last term was chosen in
accordance with the recommendations of others of eight (Solberg & Olweus, 2003) or 12
weeks (Ortega et al., 2001) and forms a natural period of time within which students can
recall their experiences. The use of a specific period of time (one term) also enabled the
comparison of changes in students’ bullying experiences over time and the testing of the
impact of an intervention. The response options were similar to those used by others (Felix et
al., 2011; Solberg & Olweus, 2003) and were the same for all four scales: “This did not
happen to me/I did not do this”; “Once or twice”; “Every few weeks”; “About once a week”;
and “Several times a week or more”.
The testing of the FBS followed four stages – feedback was sought from international
bullying research experts; the questionnaire was piloted and focus groups conducted with
students following its administration; the questionnaire was administered to 3,496 students in
an initial study from non-government schools, and subsequently in a second study with 783
students from government schools.
Expert Feedback and Piloting
Feedback on our questionnaire was obtained from four international bullying research
experts. Pilot testing with 50 students aged 12-14 years in two schools (not part of either
sample described below) was also conducted and following completion of the online survey,
focus groups were conducted with the students to assess social relevance, clarity and face
validity of the items. Both consultations resulted in minimal changes to the scale.
14
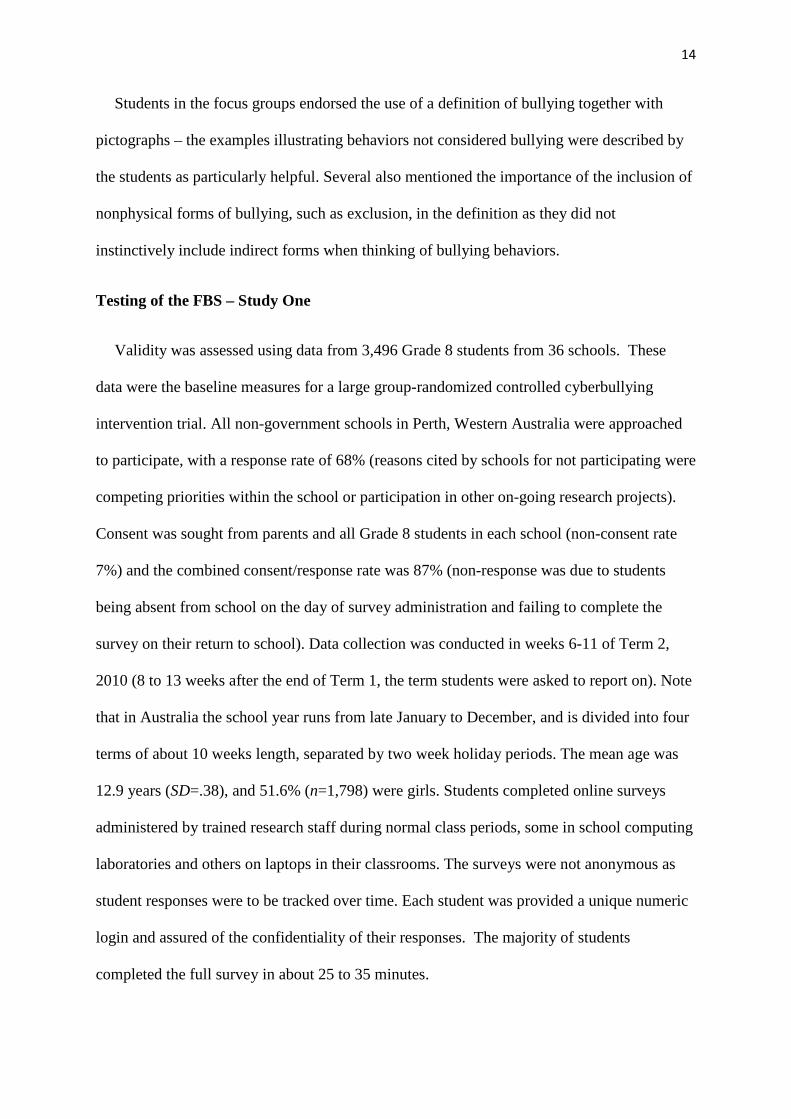
Students in the focus groups endorsed the use of a definition of bullying together with
pictographs – the examples illustrating behaviors not considered bullying were described by
the students as particularly helpful. Several also mentioned the importance of the inclusion of
nonphysical forms of bullying, such as exclusion, in the definition as they did not
instinctively include indirect forms when thinking of bullying behaviors.
Testing of the FBS – Study One
Validity was assessed using data from 3,496 Grade 8 students from 36 schools. These
data were the baseline measures for a large group-randomized controlled cyberbullying
intervention trial. All non-government schools in Perth, Western Australia were approached
to participate, with a response rate of 68% (reasons cited by schools for not participating were
competing priorities within the school or participation in other on-going research projects).
Consent was sought from parents and all Grade 8 students in each school (non-consent rate
7%) and the combined consent/response rate was 87% (non-response was due to students
being absent from school on the day of survey administration and failing to complete the
survey on their return to school). Data collection was conducted in weeks 6-11 of Term 2,
2010 (8 to 13 weeks after the end of Term 1, the term students were asked to report on). Note
that in Australia the school year runs from late January to December, and is divided into four
terms of about 10 weeks length, separated by two week holiday periods. The mean age was
12.9 years (SD=.38), and 51.6% (n=1,798) were girls. Students completed online surveys
administered by trained research staff during normal class periods, some in school computing
laboratories and others on laptops in their classrooms. The surveys were not anonymous as
student responses were to be tracked over time. Each student was provided a unique numeric
login and assured of the confidentiality of their responses. The majority of students
completed the full survey in about 25 to 35 minutes.
15
Testing of the FBS – Study Two
Participants were 783 students from seven government schools in Perth, Western Australia
surveyed in 2011 as part of a cross-sectional study assessing students’ use of technology
(consent/response rate=43%, the fairly low rate was due to the prohibitive consent procedures
required in government schools). Approximately half of the students were in Grade 8 (53%),
17% in Grade 9 and 30% in Grade 10. One half of the students were male (n = 401, 51.2%)
and ranged in age from 12 to 16 years (M = 13.9, SD = .88). Similar sampling and data
collection methods were utilized, and the definition with pictorial representations of bullying
and the bullying scales were the same, as those for the first study.
Ethics
In all instances we obtained parental and student informed consent, and ethical approval
from the Human Research Ethics Committee at Edith Cowan University and the relevant
school authorities.
Analytic Plan
Nonparametric tests and methods that accounted for the highly skewed distributions of the
item and scale mean scores and their ordinal nature, were used throughout the analyses.
In recognition of the manner in which scales are often analyzed in practice, a mean score
was used for each of the FBS-V and FBS-P when calculating the descriptive statistics and
correlations. These mean scores represent a sum of the frequency and the number of different
ways in which a student was bullied or bullied others, with higher scores representing greater
exposure to or involvement in bullying. As is the case with almost all bullying scales, the
composite score for the victimization version is not a measure of the level of harm or impact
on the bullied student. To measure harm, each individual person needs to indicate the effect
16
of the bullying for him or her, as two students can experience different harm from the same
behavior.
Construct validity was assessed through confirmatory factor analyses within the
framework of a reflective rather than a formative measurement model (Bollen & Bauldry,
2011; Bovaird, 2009). However, we caution against the conceptualization of the latent
constructs, in particular victimization, as a trait of the targeted person, which would seem to
imply something inherent in the person which is the cause of his or her victimization. Rather,
as argued by Edwards (2011), we see the causation as occurring at the time of completion of
the questionnaire, where the person responds to the items on the basis of his or her
experiences and self-perception of his or her status or position on the latent continuous scale.
Further justification for the appropriateness of a reflective framework, was the relative
invariance we found in the factor loadings when various items were dropped from the scales,
indicating stability in the latent victimization and perpetration constructs being measured.
The factor analyses were conducted in MPlus Version 6 using the weighted least square
mean variance (WLSMV) estimator as appropriate for ordinal non-normal data (L. K.
Muthen & Muthen, 1998-2009). Since bullying victimization and perpetration are correlated
with some students both being bullied as well as bullying others, two-factor models were
fitted to the combined items from the two scales. Measures of goodness of fit used were the
Root Mean Square Error of Approximation (RMSEA) and Comparative Fit Index (CFI).
Recommended values for the RMSEA are less than .06 (Hu & Bentler, 1998) and .08 (Brown
& Cudeck, 1993), and .95 or higher for the CFI (Hu & Bentler, 1998). The chi-square test is
also reported although this test is sensitive to sample size and departures from normality.
The invariance of the factor loadings and thresholds across gender groups was assessed
with a comparison of the fit of the models assuming and not assuming invariance using the

17
CFI. Differences larger than .002 indicate a lack of measurement invariance (Meade,
Johnson, & Braddy, 2008). The Satorra-Bentler scaled chi-square difference test is also
reported (B. O. Muthen & Muthen, 2012; L. K. Muthen & Muthen, 1998-2009), although
chi-square tests are known to be too liberal with large sample sizes such as this (Joreskog &
Sorbom, 1993).
Concurrent validity was assessed through Mann-Whitney tests comparing the mean scores
for the FBS-V items between the groups of students categorized as having been victimized or
not, based on the global single item question. A similar test was conducted for the mean of
the FBS-P items.
Tests of convergent and discriminant validity were based on hypothesized correlations
between the FBS-V and FBS-P and six measures of mental and social health outcomes
described below, namely depression, anxiety, emotional symptoms, conduct problems, peer
problems and peer support. Spearman correlations were obtained due to the extreme skew in
the data, particularly the FBS-P mean scores.
Symptoms of depression and anxiety were assessed using the Depression Anxiety Stress
Scale (S. Lovibond & P. Lovibond, 1995) which comprised seven items for each of
depression, anxiety and stress respectively (the stress scale was not utilized here). The
validity of DASS scores have been shown previously – DASS depression scale and Beck
Depression Inventory (BDI, Beck & Steer, 1987) r = .74; DASS anxiety scale and Beck
Anxiety Inventory (BAI, Beck & Steer, 1990) r = .81 (P. Lovibond & S. Lovibond, 1995),
and the three factor structure confirmed in a sample of Grade 7-9 students (RMSEA = .052,
CFI = .946) (Szabó, 2010). Item responses ranged from 0 (Does not apply to me) to 3 (Most
of the time). For these data, good model fit was found in confirmatory factor analyses for one
factor models and good internal consistency, for depression (RMSEA = .043, CFI = .993, α =
18
.92) and for anxiety (RMSEA = .033, CFI = .978, α = .82). Mean scores were calculated,
with higher scores reflecting greater symptoms of depression and anxiety.
The Emotional symptoms (e.g., “I get a lot of headaches, stomach-aches, or illness”),
Conduct problems (e.g., “I fight a lot”; “I can make other people do what I want”), Peer
problems (e.g., “Other young people pick on me or bully me” and reverse coded: “Other
people my age generally like me”), and Pro-social behavior (e.g., “I usually share with
others”) subscales of the Strengths and Difficulties Questionnaire (SDQ) were utilized to
measure these four constructs (Goodman, 1997). Each subscale comprises five items with
response options 1 (Not true), 2 (Somewhat true), and 3 (Certainly true). Means were
obtained for each of the subscales, with higher scores representing greater levels of emotional
symptoms (α = .73), pro-social behaviors (α = .72), conduct problems (α = .55), and peer
problems (α = .54). Although the Cronbach’s alpha values of the first two scales were
acceptable, the values for the conduct problems and peer problems scales were below the
standard of .7 in our sample. Unidimensionality of the subscales was demonstrated in
confirmatory factor analyses, for emotional symptoms (RMSEA = .046, CFI = .983), conduct
problems (RMSEA = .029, CFI = .984), pro-social behaviors (RMSEA = .009, CFI = .999),
and to a lesser extent, for peer problems (RMSEA = .037, CFI = .982, allowing the two
positively worded items to covary). Results related to the peer problems scale, therefore,
need to be interpreted in light of the less than optimal performance of the scale in this sample.
Peer support was measured using an eleven item scale adapted from the 24 item
Perceptions of Peer Social Support Scale (Ladd, Kochenderfer, & Coleman, 1996) (e.g.,
“How often would other students invite you to do things with them”). Response options were
1 (Lots of times), 2 (Sometimes), and 3 (Never). The items were reverse coded and a mean
score was calculated, with higher scores reflecting greater perceptions of support by the
19
respondent’s peers (α = .86). A one factor model fitted the data well (RMSEA = .058, CFI =
.933).
At most, 4% of cases were excluded from the analyses due to missing data and, due to the
pairwise deletion approach taken in MPlus when the WLSMV estimator is used, less than 1%
in the confirmatory factor analyses.
Results
Results from the larger study, Study One, are presented first, followed by those of the
second study.
Descriptive statistics
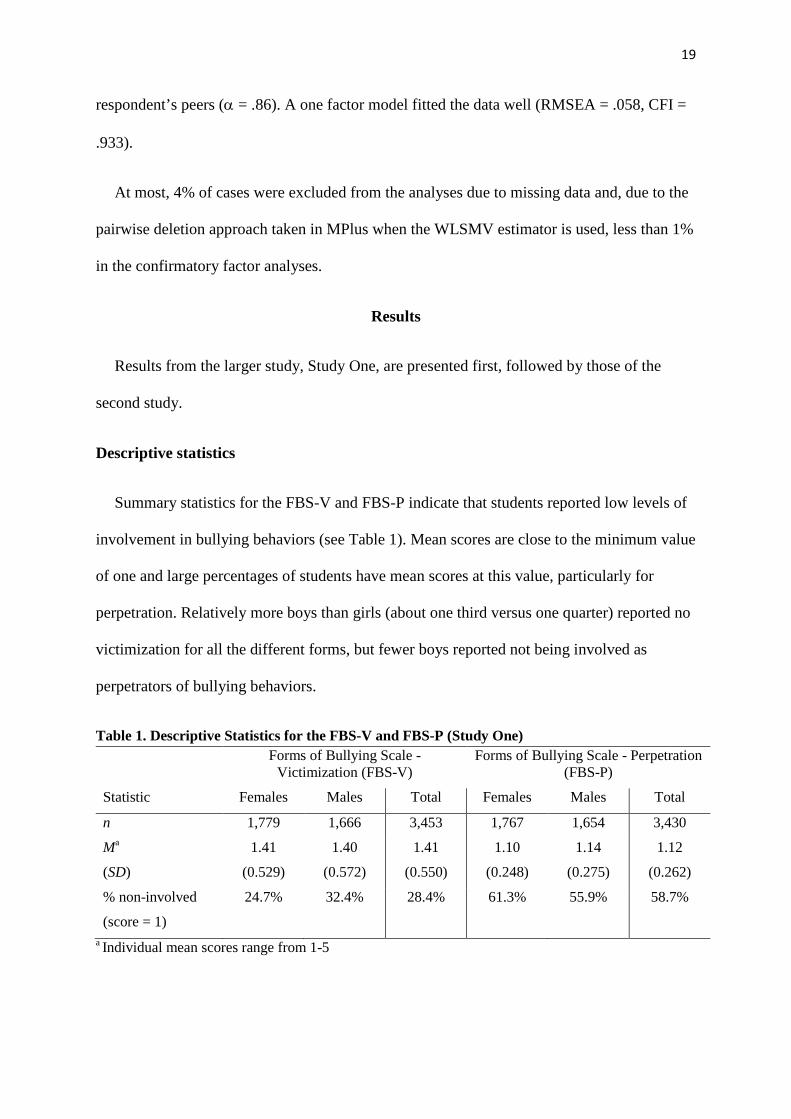
Summary statistics for the FBS-V and FBS-P indicate that students reported low levels of
involvement in bullying behaviors (see Table 1). Mean scores are close to the minimum value
of one and large percentages of students have mean scores at this value, particularly for
perpetration. Relatively more boys than girls (about one third versus one quarter) reported no
victimization for all the different forms, but fewer boys reported not being involved as
perpetrators of bullying behaviors.
Table 1. Descriptive Statistics for the FBS-V and FBS-P (Study One) Forms of Bullying Scale -
Victimization (FBS-V) Forms of Bullying Scale - Perpetration
(FBS-P)
Statistic Females Males Total Females Males Total
n 1,779 1,666 3,453 1,767 1,654 3,430
Ma
(SD)
1.41
(0.529)
1.40
(0.572)
1.41
(0.550)
1.10
(0.248)
1.14
(0.275)
1.12
(0.262)
% non-involved
(score = 1)
24.7% 32.4% 28.4% 61.3% 55.9% 58.7%
a Individual mean scores range from 1-5
20
The correlation between the FBS-V and FBS-P was moderate at .38. The items within
each version of the FBS were sufficiently but not extremely highly correlated, the bivariate
correlations varied between .15 and .62 for the victimization items and .16 and .54 for the
bullying items.
Both the FBS-V and FBS-P displayed high internal consistency reliability, with
Cronbach’s alpha values of .87 (item-to-total correlations .48 - .71) and .85 (item-to-total
correlations .44 - .67) respectively.
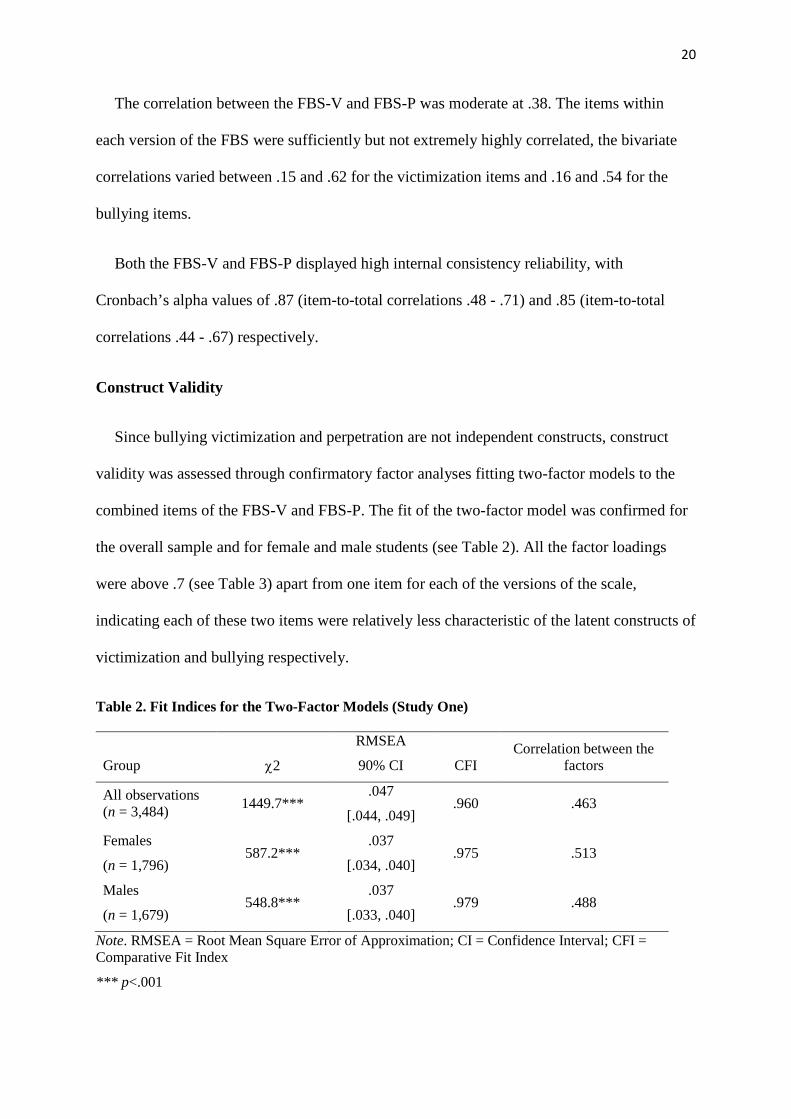
Construct Validity
Since bullying victimization and perpetration are not independent constructs, construct
validity was assessed through confirmatory factor analyses fitting two-factor models to the
combined items of the FBS-V and FBS-P. The fit of the two-factor model was confirmed for
the overall sample and for female and male students (see Table 2). All the factor loadings
were above .7 (see Table 3) apart from one item for each of the versions of the scale,
indicating each of these two items were relatively less characteristic of the latent constructs of
victimization and bullying respectively.
Table 2. Fit Indices for the Two-Factor Models (Study One)
Group χ2
RMSEA
90% CI CFI Correlation between the
factors
All observations (n = 3,484) 1449.7***
.047
[.044, .049] .960 .463
Females
(n = 1,796) 587.2***
.037
[.034, .040] .975 .513
Males
(n = 1,679) 548.8***
.037
[.033, .040] .979 .488
Note. RMSEA = Root Mean Square Error of Approximation; CI = Confidence Interval; CFI = Comparative Fit Index
*** p<.001

21
Table 3. Standardized Factor Loadings in Two-Factor Model (All Observations and per
Gender, Study One)
Item All observations Females Males
Factor 1 Factor 2 Factor 1 Factor 2 Factor 1 Factor 2
Teased .82 .82 .80 .83 .84 .80
Secrets told .83 .79 .85 .80 .81 .79
Friendship broken .66 .72 .69 .74 .72 .75
Made to feel afraid .72 .83 .69 .85 .75 .81
Physically hurt .73 .78 .70 .79 .78 .78
Called names .81 .82 .79 .77 .83 .85
Made to do things .71 .82 .72 .83 .71 .80
Property damage .64 .79 .64 .83 .64 .77
Left out .74 .66 .70 .70 .81 .68
Lies told / Rumors spread .85 .85 .87 .86 .83 .84
Note. Factor 1= Bullying victimization; Factor 2= Bullying perpetration
The factor structure was not invariant across gender groups, difference in CFI = .019 >
.002 and Satorra-Bentler scaled chi-square difference test TRd = 1215.0, df = 96, p < .001;
implying that care needs to be taken when comparing composite scores of these scales for
boys and girls. Overall, the differences in the standardized factor loadings were .11 or less in
magnitude, .03 on average for the victimization and .01 for the bullying items (see Table 3).
On inspection, differences between the gender groups were more evident for the
victimization, difference in CFI = .014 > .002 and TRd = 869.1, df = 49, p < .001, than the

22
perpetration items, difference in CFI = .004 > .002 and TRd = 353.7, df = 49, p < .001. In
further testing of the factor loadings and the corresponding thresholds for each of the items
respectively, based on the difference in CFI criteria, items c, e and i in the FBS-V and item e
in the FBS-P were not invariant for males and females. Items c and i measure relational and
item e physical bullying (see Appendix B for item wording). These differences between the
gender groups are in concordance with the higher likelihood of males engaging in more direct
and girls in relational forms of bullying (Archer, 2004; Crick & Grotpeter, 1995), and are
similar to differences found in testing the OBVQ (Breivik & Olweus, Under review).
To gauge the substantive impact of assuming scalar invariance, we calculated factor scores
for the students in the sample based on assuming and not assuming equal factor loadings (and
thresholds) for the gender groups. The median differences in the factor scores (equal minus
unequal assumption scores) for the FBS-V were -.020 and .019 for males and females
respectively, and for the FBS-P were .045 and -.038 respectively (range of differences -0.22
to 0.15 between values on a four point scale of 1 to 5). Assuming invariance, therefore, would
result in a small average underestimation of the extent of the victimization for males and
overestimation for females, and the opposite would be the case for perpetration.
Concurrent Validity
The survey instrument included global single item questions on frequency of bullying
victimization and perpetration. As recommended (Solberg & Olweus, 2003), the global
questions were used to dichotomize students as being victimized (experienced every few
weeks or more often) or not (having experienced bullying behaviors 1-2 a term or less often)
and similarly, as being perpetrators or not. Validity of the multi-item scale scores were
further assessed by comparing the mean scores on the FBS-V and FBS-P within the groups
defined by the global questions. Comparisons were conducted for the total sample and for

23
each gender group. The victimized/perpetrating groups scored significantly higher on the
corresponding versions of the scale in each instance (see Table 4). These findings were
replicated in each of the gender groups (data not shown as the gender results are similar to
those of the total sample, available from the first author).
Table 4. Mann-Whitney Tests of FBS-V and FBS-P Mean Scores by Groups Based on Global
Questions (Study One)
Global question and grouping M (SD) Mann-Whitney
Z test
Victimization (n = 3,435)
1-2 a term or less 1.27 (0.327) -29.8***
Every few weeks or more often 2.29 (0.786)
Perpetration (n = 3,400)
1-2 a term or less 1.10 (0.186) -14.7***
Every few weeks or more often 1.85 (0.791)
Note. ***p < .001
Convergent and Discriminant Validity
As evidence of convergent validity, we hypothesized that the FBS-V mean score, as a
measure of level of victimization, would correlate positively with measures of depression,
anxiety, and emotional symptoms, as well as peer problems and correlate negatively with
level of peer support. We also hypothesized that scores on the FBS-P for perpetration would
be positively correlated with conduct problems, but negatively with pro-social behaviors.
Furthermore, as evidence of discriminant validity, we expected the FBS-V to correlate more
strongly than the FBS-P with mental health symptoms, and hypothesized stronger
correlations between conduct problems and the FBS-P than would be the case for the
victimization version of the scale.
24
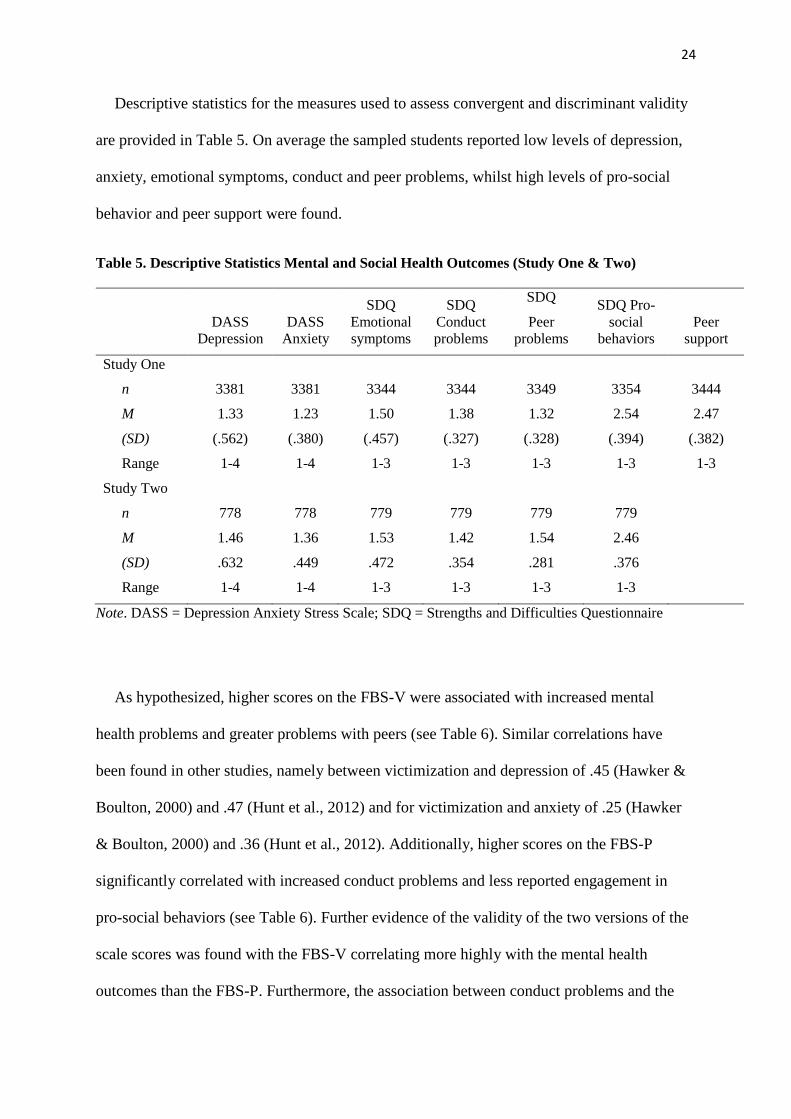
Descriptive statistics for the measures used to assess convergent and discriminant validity
are provided in Table 5. On average the sampled students reported low levels of depression,
anxiety, emotional symptoms, conduct and peer problems, whilst high levels of pro-social
behavior and peer support were found.
Table 5. Descriptive Statistics Mental and Social Health Outcomes (Study One & Two)
DASS Depression
DASS Anxiety
SDQ Emotional symptoms
SDQ Conduct problems
SDQ
Peer problems
SDQ Pro-social
behaviors Peer
support
Study One
n 3381 3381 3344 3344 3349 3354 3444
M 1.33 1.23 1.50 1.38 1.32 2.54 2.47
(SD) (.562) (.380) (.457) (.327) (.328) (.394) (.382)
Range 1-4 1-4 1-3 1-3 1-3 1-3 1-3
Study Two
n 778 778 779 779 779 779
M 1.46 1.36 1.53 1.42 1.54 2.46
(SD) .632 .449 .472 .354 .281 .376
Range 1-4 1-4 1-3 1-3 1-3 1-3
Note. DASS = Depression Anxiety Stress Scale; SDQ = Strengths and Difficulties Questionnaire
As hypothesized, higher scores on the FBS-V were associated with increased mental
health problems and greater problems with peers (see Table 6). Similar correlations have
been found in other studies, namely between victimization and depression of .45 (Hawker &
Boulton, 2000) and .47 (Hunt et al., 2012) and for victimization and anxiety of .25 (Hawker
& Boulton, 2000) and .36 (Hunt et al., 2012). Additionally, higher scores on the FBS-P
significantly correlated with increased conduct problems and less reported engagement in
pro-social behaviors (see Table 6). Further evidence of the validity of the two versions of the
scale scores was found with the FBS-V correlating more highly with the mental health
outcomes than the FBS-P. Furthermore, the association between conduct problems and the
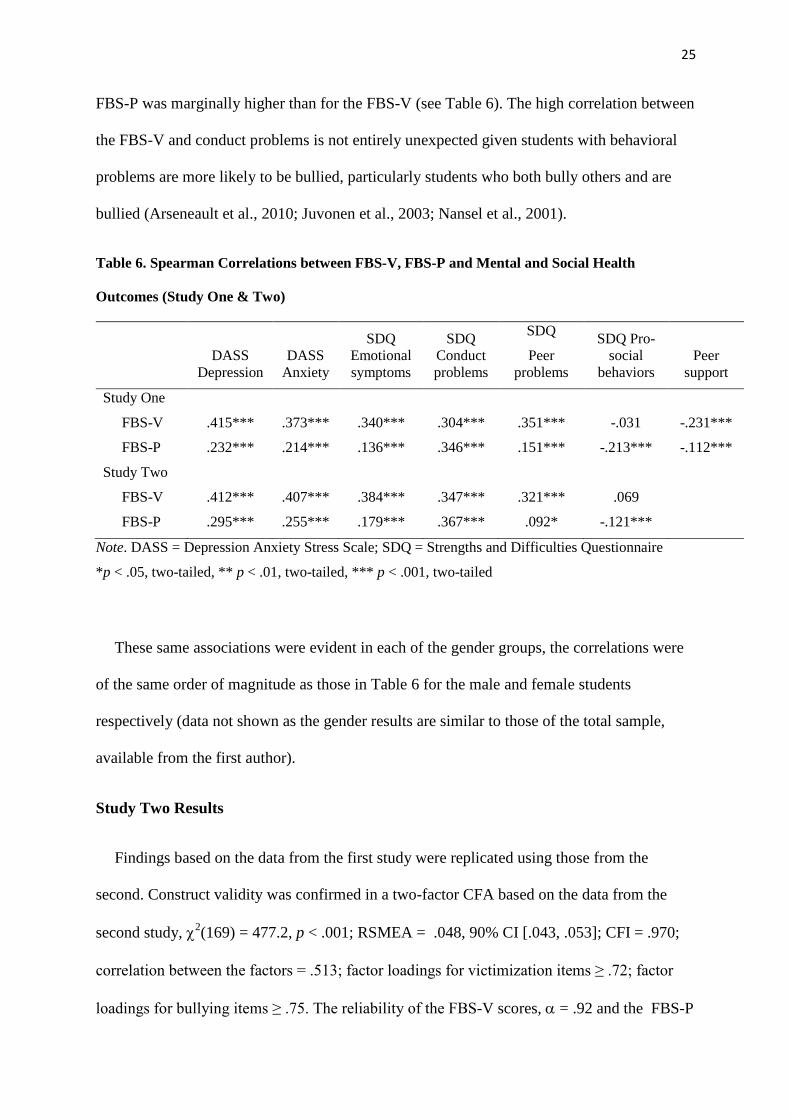
25
FBS-P was marginally higher than for the FBS-V (see Table 6). The high correlation between
the FBS-V and conduct problems is not entirely unexpected given students with behavioral
problems are more likely to be bullied, particularly students who both bully others and are
bullied (Arseneault et al., 2010; Juvonen et al., 2003; Nansel et al., 2001).
Table 6. Spearman Correlations between FBS-V, FBS-P and Mental and Social Health
Outcomes (Study One & Two)
DASS Depression
DASS Anxiety
SDQ Emotional symptoms
SDQ Conduct problems
SDQ
Peer problems
SDQ Pro-social
behaviors Peer
support
Study One
FBS-V .415*** .373*** .340*** .304*** .351*** -.031 -.231***
FBS-P .232*** .214*** .136*** .346*** .151*** -.213*** -.112***
Study Two
FBS-V .412*** .407*** .384*** .347*** .321*** .069
FBS-P .295*** .255*** .179*** .367*** .092* -.121***
Note. DASS = Depression Anxiety Stress Scale; SDQ = Strengths and Difficulties Questionnaire
*p < .05, two-tailed, ** p < .01, two-tailed, *** p < .001, two-tailed
These same associations were evident in each of the gender groups, the correlations were
of the same order of magnitude as those in Table 6 for the male and female students
respectively (data not shown as the gender results are similar to those of the total sample,
available from the first author).
Study Two Results
Findings based on the data from the first study were replicated using those from the
second. Construct validity was confirmed in a two-factor CFA based on the data from the
second study, χ2(169) = 477.2, p < .001; RSMEA = .048, 90% CI [.043, .053]; CFI = .970;
correlation between the factors = .513; factor loadings for victimization items ≥ .72; factor
loadings for bullying items ≥ .75. The reliability of the FBS-V scores, α = .92 and the FBS-P
26
scores, α = .91, were also demonstrated, as were convergent and discriminant validity (see
Table 6) in a similar manner to that based on the larger first study of Grade 8 students. (A
measure of peer support was not included in the second study.) These findings provide some
evidence for the applicability of the scales with Australian students in Grades 8 to 10 (13-15
years of age) and in both government and non-government schools.
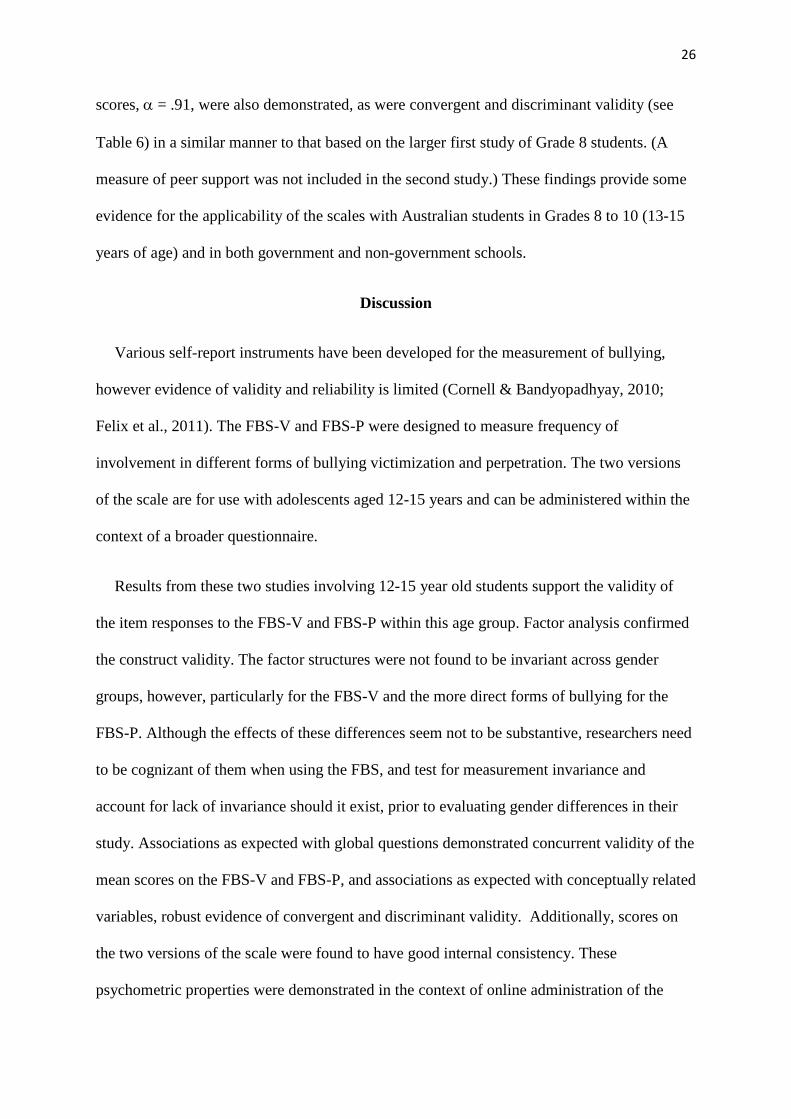
Discussion
Various self-report instruments have been developed for the measurement of bullying,
however evidence of validity and reliability is limited (Cornell & Bandyopadhyay, 2010;
Felix et al., 2011). The FBS-V and FBS-P were designed to measure frequency of
involvement in different forms of bullying victimization and perpetration. The two versions
of the scale are for use with adolescents aged 12-15 years and can be administered within the
context of a broader questionnaire.
Results from these two studies involving 12-15 year old students support the validity of
the item responses to the FBS-V and FBS-P within this age group. Factor analysis confirmed
the construct validity. The factor structures were not found to be invariant across gender
groups, however, particularly for the FBS-V and the more direct forms of bullying for the
FBS-P. Although the effects of these differences seem not to be substantive, researchers need
to be cognizant of them when using the FBS, and test for measurement invariance and
account for lack of invariance should it exist, prior to evaluating gender differences in their
study. Associations as expected with global questions demonstrated concurrent validity of the
mean scores on the FBS-V and FBS-P, and associations as expected with conceptually related
variables, robust evidence of convergent and discriminant validity. Additionally, scores on
the two versions of the scale were found to have good internal consistency. These
psychometric properties were demonstrated in the context of online administration of the
27
scales and providing a definition of bullying, together with pictorial representations of the
different forms of bullying, and the use of the term bullying.
Advantages of the FBS-V and FBS-P are that both bullying victimization and perpetration
are assessed, and with equivalent items. The items can be used to measure prevalence of
involvement in different forms of bullying behaviors and compare this involvement over time
or between groups. Composite scores from the FBS-V and FBS-P can be utilized to test
individual-level associations, for example correlations between level of victimization and
mental health outcomes. The scales are comprehensive of the different forms of bullying
whilst not being too long to include in larger questionnaires measuring other factors of
importance in studies of bullying in schools.
Bullying behavior is typically characterized by repetition, intent, and a power imbalance
and valid measurement of involvement in bullying behaviors requires incorporation of these
characteristics (Greif & Furlong, 2006). The wording of the items in the FBS-V and FBS-P
aimed to convey intent and the response categories measure frequency of involvement.
Unlike the California Bullying Victimization Scale (CBVS, Felix et al., 2011), the FBS-V
and FBS-P items do not specifically refer to an imbalance in power. The nature of a power
imbalance may not be easily defined, for example sources may be differences in physical
strength (or the targeted person may be outnumbered), social status, intelligence,
technological expertise (Greif & Furlong, 2006; Rigby, 2002; Smith, 2012). The power
differential is perhaps more easily specified in terms of its consequences, namely that the
targeted person has difficulty in stopping the behavior, and this approach is taken in the
wording of the definition of bullying which precedes the items. In addition to the definition,
we believe that a disparity in power is further implied through the use of the word bully in the
stem of the question. As recommended by others (Ortega et al., 2001; Solberg & Olweus,
2003), provision of the definition and use of the term bully, helps separate bullying from

28
other acts which are not characterized by these three factors. Additionally, as suggested by
Felix et al. (2011), our use of colored visual depictions of bullying and non-bullying
behaviors may have enhanced students’ ability to take into account the characteristics of
bullying when responding to the scales. Whilst the quality of any pictures is of relevance,
those included in our questionnaire were well received by the students during the piloting
phase and we believe their use is likely to have enhanced students’ understanding of bullying
as defined in the questionnaire. For these reasons, we would recommend the definition
(together with illustrations if possible) be included with the items in a survey. As
acknowledged by Felix et al. (2011), the terms used in the CBVS to describe the power
imbalance i.e.: more popular, smart, strong, are not exhaustive nor necessarily ideal. Further
research with young people is required regarding the appropriate specification of a power
difference.
The validity of the FBS-V and FBS-P scores demonstrated here are as measures of self-
perception. Similar to Juvonen et al. (2001), we view self-report as a measure of a person’s
self-concept, whereas peer and teacher report are to a large extent measures of social
reputation. As such, there is no expectation for high levels of agreement between responses
from different sources. The conceptualization of self-, peer- and teacher-report as different
constructs implies careful consideration needs to be made in relation to the construct that is of
most importance within each research study and therefore, when framing research questions
(Griffin & Gross, 2004). For victimization, the targeted person is arguably the best placed to
report on the occurrence of the victimization. Self-report delivers the perspective of the
person experiencing the bullying and is the most useful measure when researching the
“victim’s plight” or consequences of the victimization such as depression (Felix et al., 2011;
Juvonen et al., 2001). On the other hand, self-report may be limited as a means to measure
perpetration of bullying, where one may wish to be less reliant on self-concept which may

29
lead to under-reporting of such behaviors (Cornell & Bandyopadhyay, 2010). These
differences have resulted in several authors recommending multiple informants be utilized
(Bovaird, 2009; Cornell & Bandyopadhyay, 2010; Griffin & Gross, 2004).
The FBS was developed to measure the major forms of bullying utilizing relatively few
items. In constructing the items to be included in the scale, we used wording which was
general enough to include a range of behaviors within the form of bullying, without being so
broad that young people were not able to relate their experiences to the items. For example,
the item “I was hurt by someone trying to break up a friendship” could include a wide range
of specific behaviors or actions, both online and offline. Furthermore, whilst not necessarily
detailing specific actions, we strengthened items by making the intent clear, e.g. “lies were
told and false rumours spread about me by someone, to make my friends or others not like
me”. Nevertheless, young people may not have found a “fit” for their experiences in the listed
items and the scale may therefore not capture all instances of bullying.
In the FBS bullying behaviors were measured in a general sense, that is, possibly
occurring both online and offline, for three reasons. First, we conceptualize cyberbullying
primarily as bullying behavior (e.g. name-calling, relational, social damage, threatening)
delivered through the use of technology, that is, through different modes rather than as a
different form of bullying (Dooley, Pyżalski, & Cross, 2009; Felix et al., 2011; Smith, 2012;
Smith et al., 2008; Varjas, Henrich, & Meyers, 2009). Whilst the three criteria that
distinguish bullying from aggression, repetition, power imbalance and intent, may be
operationalized differently for cyberbullying, they are still able to be applied (Dooley et al.,
2009; Smith, 2012). For example, the inability to remove a message or image from
circulation by the targeted person can be seen as a differential in power. Second, as is the
case with many bullying scales, the wording of the majority of the items (apart from physical
bullying and damage to property) does not indicate the behaviors are necessarily offline. For
30
example, having rumors or secrets spread about someone could be achieved with and without
the use of technology. Should a researcher therefore, wish to measure only offline instances
of rumor spreading, this would need to be specified in the item. It cannot be assumed that
items from existing scales measure offline behavior simply because they have historically
done so. Third, the bullying behavior may occur both online and offline. For example, what
may start as face-to-face name-calling may be continued on social networking sites or vice
versa. Young peoples’ increasing use of technology in their social interactions, will only
serve to increase the overlap between offline and online bullying. Therefore, we presented
bullying behaviors as possibly occurring offline and/or online as we fundamentally see the
separation of these modes as problematic when measuring adolescents’ involvement in
different forms of bullying as defined in this paper.
Thus the FBS measures, what some refer to as “traditional” forms of bullying, but we see
more globally as forms of bullying which may occur off- or online. It is not intended,
however, to be a comprehensive measure of cyberbullying and as mentioned above, not all
instances of bullying, or more specifically cyberbullying, behaviors may be captured by the
scale. Further, we would recommend that separate cyber specific scales be included in
surveys to enable the exploration of unique aspects of this means of bullying, such as the
differing motivations of the perpetrator and impacts on the targeted person (Menesini, 2012;
Smith, 2012).
Limitations and Future Directions
While use of the FBS is supported by the results of this study, there are some limitations to
the findings. Although the large sample size is a strength, only West Australian metropolitan
secondary schools were included and the generalizability of the results beyond this
population is unknown. Whilst the FBS can be administered in hard copy, the extent to which
31
the results are applicable to modes other than online administration of questionnaires, is also
unclear. The data were collected in a term subsequent from the one that the students were
reporting about, separated by a two week holiday period. Students’ experiences in the current
term may, therefore, have influenced their responses to the questions on bullying involvement
in the previous one. Due to the large sample, it took four to five weeks to collect data from all
study schools, which may also have contributed to some variation in student responses.
Correlations, as measures of validity, can be the result of shared method variance. This is
the variance shared by variables measured by the same method, in this case self-report, which
can artificially inflate the correlations between such variables. The low cross-correlations
between internalizing problems and perpetration on the one hand and externalizing problems
and victimization on the other hand, provide evidence of a lack of shared variance in these
data and therefore, the validity of the results. Zero cross-correlations are not expected
because of the bully-victim subgroup of students who both experience and perpetrate bullying
behaviors and so would be expected to experience both internalizing as well as externalizing
problems.
While scores on the FBS were valid and reliable measures of the frequency of bullying
victimization and perpetration, further testing of the scale with other age groups and in other
contexts is required. Furthermore, it will be of value to explore additions to the FBS, in
particular the victimization version, to measure the severity of different forms of bullying in
terms of the impact or harm as perceived and reported by the targeted person.

32
References
Archer, J. (2004). Sex differences in aggression in real-world settings: A meta-analytic review. Review of General Psychology, 8(4), 291-322.
Arseneault, L., Bowes, L., & Shakoor, S. (2010). Bullying victimization in youths and mental health problems: ‘Much ado about nothing’. Psychological Medicine, 40(5), 717–729. doi: 10.1017/S0033291709991383
Beck, A. T., & Steer, R. A. (1987). Manual for the revised Beck Depression Inventory. San Antonio, Texas: The Psychological Corporation.
Beck, A. T., & Steer, R. A. (1990). Manual for the Beck Anxiety Inventory. San Antonio, Texas: The Psychological Corporation.
Bollen, K. A., & Bauldry, S. (2011). Three Cs in measurement models: Causal indicators, composite indicators, and covariates. Psychological Methods, 16(3), 265-284.
Bond, L., Wolfe, S., Tollit, M., Butler, H., & Patton, G. (2007). A comparison of the Gatehouse Bullying Scale and the Peer Relations Questionnaire for students in secondary school. Journal of School Health, 77(2), 75-79.
Bovaird, J. A. (2009). Scales and surveys. Some problems with measuring bullying behavior. In S. R. Jimerson, S. M. Swearer & D. L. Espelage (Eds.), Handbook of bullying in schools: An international perspective (pp. 277-292). New York: Routledge, Taylor & Francis.
Breivik, K., & Olweus, D. (Under review). An item response theory analysis of the Olweus Bullying Scale. Aggressive Behavior.
Brown, M. W., & Cudeck, R. (1993). Alternative ways of assessing model fit. In K. Bollen & J. S. Long (Eds.), Testing Structural Equation Models (pp. 136-162). Newbury Park: Sage.
Card, N. A., & Hodges, E. V. E. (2008). Peer victimization among schoolchildren: Correlations, causes, consequences, and considerations in assessment and intervention. School Psychology Quarterly; School Psychology Quarterly, 23(4), 451-461.
Cook, C. R., Williams, K. R., Guerra, N. G., & Kim, T. (2009). Variability in the prevalence of bullying and victimization. In S. R. Jimerson, S. M. Swearer & D. L. Espelage (Eds.), Handbook of bullying in schools: An international perspective (pp. 347-362). New York: Routledge, Taylor & Francis.
Cornell, D. G., & Bandyopadhyay, S. (2010). The assessment of bullying. In S. R. Jimerson, S. M. Swearer & D. L. Espelage (Eds.), Handbook of bullying in schools: An international perspective (pp. 265-276). New York: Routledge, Taylor & Francis.
Crick, N. R., & Grotpeter, J. K. (1995). Relational aggression, gender, and social-psychological adjustment. Child Development, 66(3), 710-722.
Dooley, J. J., Pyżalski, J., & Cross, D. (2009). Cyberbullying versus face-to-face bullying. Zeitschrift für Psychologie/Journal of Psychology, 217(4), 182-188.
Edwards, J. R. (2011). The fallacy of formative measurement. Organizational Research Methods, 14(2), 370-388.
Espelage, D. L., & Holt, M. K. (2001). Bullying and victimization during early adolescence: Peer influences and psychosocial correlates. Journal of Emotional Abuse, 2(2/3), 123-142.
Espelage, D. L., & Swearer, S. M. (2003). Research on school bullying and victimization: What have we learned and where do we go from here? School Psychology Review, 32(3), 365-383.
Felix, E. D., Sharkey, J. D., Green, J. G., Furlong, M. J., & Tanigawa, D. (2011). Getting precise and pragmatic about the assessment of bullying: The development of the California Bullying Victimization Scale. Aggressive Behavior, 37, 234-247.
Furlong, M. J., Sharkey, J. D., Felix, E., Tanigawa, D., & Greif-Green, J. (2010). Bullying assessment: A call for increased precision of self-reporting procedures. In S. R. Jimerson, S. Swearer & D. L. Espelage (Eds.), Handbook of bullying in schools: An international perspective (pp. 329-346). New York: Routledge, Taylor & Francis.
Goodman, R. (1997). The Strengths and Difficulties Questionnaire: A research note. Journal of Child Psychology and Psychiatry, 38(5), 581-586.
Greif, J. L., & Furlong, M. J. (2006). The assessment of school bullying. Journal of School Violence, 5(3), 33-50.

33
Griffin, R. S., & Gross, A. M. (2004). Childhood bullying: Current empirical findings and future directions for research. Aggression and Violent Behavior, 9(4), 379-400.
Hamburger, M. E., Basile, K. C., & Vivolo, A. M. (2011). Measuring bullying victimization, perpetration, and bystander experiences: A compendium of assessment tools. Atlanta, GA: Centers for Disease Control and Prevention, National Center for Injury Prevention and Control, Division of Violence Prevention.
Hawker, D. S. J., & Boulton, M. J. (2000). Twenty years' research on peer victimization and psychosocial maladjustment: A meta-analytic review of cross-sectional studies. Journal of Child Psychology and Psychiatry, 41(4), 441-455.
Hu, L., & Bentler, P. M. (1998). Fit indices in covariance structure modeling: Sensitivity to underparameterized model misspecification. Psychological Methods, 3(4), 424-453.
Hunt, C., Peters, L., & Rapee, R. M. (2012). Development of a measure of the experience of being bullied in youth. Psychological Assessment, 24(1), 156-165.
Joreskog, K. G., & Sorbom, D. (1993). LISREL 8: Structural equation modelling with the SIMPLIS command language. Chicago: Scientific Software International.
Juvonen, J., Graham, S., & Schuster, M. A. (2003). Bullying among young adolescents: The strong, the weak, and the troubled. Pediatrics, 112(6), 1231-1237.
Juvonen, J., Nishina, A., & Graham, S. (2001). Self-views versus peer perceptions of victim status among early adolescents. In J. Juvonen & S. Graham (Eds.), Peer harassment in school: A plight of the vulnerable and the victimized (pp. 105-124). New York: Guilford.
Kaltiala-Heino, R., Rimpelä, M., Rantanen, P., & Rimpelä, A. (2000). Bullying at school - an indicator of adolescents at risk for mental disorders. Journal of Adolescence, 23(6), 661-674.
Kendrick, K., Jutengren, G., & Stattin, H. (2012). The protective role of supportive friends against bullying perpetration and victimization. Journal of Adolescence, 35(4), 1069-1080.
Kert, A. S., Codding, R. S., Tryon, G. S., & Shiyko, M. (2010). Impact of the word “bully” on the reported rate of bullying behavior. Psychology in the Schools, 47(2), 193-204.
Ladd, G. W., Kochenderfer, B. J., & Coleman, C. C. (1996). Friendship quality as a predictor of young children's early school adjustment. Child Development, 67(3), 1103-1118.
Lovibond, P., & Lovibond, S. (1995). The structure of negative emotional states: Comparison of the Depression Anxiety Stress Scales (DASS) with the Beck Depression and Anxiety Inventories. Behaviour Research and Therapy, 33(3), 335-343.
Lovibond, S., & Lovibond, P. (1995). Manual for the Depression Anxiety Stress Scales. Sydney: Psychology Foundation.
Meade, A. W., Johnson, E. C., & Braddy, P. W. (2008). Power and sensitivity of alternative fit indices in tests of measurement invariance. Journal of Applied Psychology, 93(3), 568-592.
Menesini, E. (2012). Cyberbullying: The right value of the phenomenon. Comments on the paper “Cyberbullying: An overrated phenomenon?”. European Journal of Developmental Psychology, 9(5), 544-552.
Monks, C. P., & Smith, P. K. (2006). Definitions of bullying: Age differences in understanding of the term, and the role of experience. British Journal of Developmental Psychology, 24(4), 801-821.
Muthen, B. O., & Muthen, L. K. (2012). Chi-square difference testing using the Satorra-Bentler scaled chi-square. Retrieved January 2012, from http://www.statmodel.com/chidiff.shtml.
Muthen, L. K., & Muthen, B. O. (1998-2009). Mplus User's Guide. 5th Edition: Muthén & Muthén. Mynard, H., & Joseph, S. (2000). Development of the multidimensional peer‐victimization scale.
Aggressive Behavior, 26(2), 169-178. Nansel, T. R., Overpeck, M., Pilla, R. S., Ruan, W., Simons-Morton, B., & Scheidt, P. (2001).
Bullying behaviors among US youth. The Journal of the American Medical Association, 285(16), 2094-2100.
Olweus, D. (1996). The Revised Olweus Bully/Victim Questionnaire. Bergen, Norway: Research Centre for Health Promotion, University of Bergen.
Ortega, R., Mora-Merchán, J. A., Singer, M., Smith, P. K., Pereira, B., & Menesini, E. (2001). Final Report of the Working Group on General Survey Questionnaires and Nomination Methods Concerning Bullying. Seville: TMR Project: Nature and Prevention of Bullying.
34
Reynolds, W. M. (2003). Bully victimization: Reynolds Scale for Schools. San Antonio, TX: Psychological Corporation.
Rigby, K. (1998). Manual for the Peer Relations Questionnaire. Point Lonsdale, Victoria (Aust): The Professional Reading Guide for Educational Administrators.
Rigby, K. (2002). New perspectives on bullying. London: Jessica Kingsley Publishers. Slonje, R., & Smith, P. K. (2008). Cyberbullying: Another main type of bullying? Scandinavian
Journal of Psychology, 49(2), 147-154. Smith, P. K. (2012). Cyberbullying: Challenges and opportunities for a research program - A response
to Olweus (2012). European Journal of Developmental Psychology, 9(5), 553-558. Smith, P. K., Cowie, H., Olafsson, R. F., & Liefooghe, A. P. D. (2002). Definitions of bullying: A
comparison of terms used, and age and gender differences, in a fourteen-country international comparison. Child Development, 73(4), 1119-1133.
Smith, P. K., del Barrio, C., & Tokunaga, R. (In press). Definitions of bullying and cyberbullying: How useful are the terms? In S. Bauman, D. Cross & J. Walker (Eds.), Principles of Cyberbullying Research: Definition, Methods and Measures. New York: Routledge, Taylor & Francis.
Smith, P. K., Mahdavi, J., Carvalho, M., Fisher, S., Russell, S., & Tippett, N. (2008). Cyberbullying: its nature and impact in secondary school pupils. Journal of Child Psychology and Psychiatry, 49(4), 376-385.
Solberg, M. E., & Olweus, D. (2003). Prevalence estimation of school bullying with the Olweus Bully/Victim Questionnaire. Aggressive Behavior, 29(3), 239-268.
Swearer, S. M., Siebecker, A. B., Johnsen-Frerichs, L. A., & Wang, C. (2010). Assessment of bullying/victimization: The problem of comparability across studies and across methodologies. In S. R. Jimerson, S. M. Swearer & D. L. Espelage (Eds.), Handbook of bullying in schools: An international perspective (pp. 305-328). New York: Routledge, Taylor & Francis.
Szabó, M. (2010). The short version of the Depression Anxiety Stress Scales (DASS-21): Factor structure in a young adolescent sample. Journal of Adolescence, 33(1), 1-8.
Underwood, M. K. (2002). Sticks and stones and social exclusion: Aggression among girls and boys. In P. K. Smith & C. H. Hart (Eds.), Blackwell handbook of childhood social development (pp. 533-548). Malden, MA: Blackwell.
Varjas, K., Henrich, C. C., & Meyers, J. (2009). Urban middle school students' perceptions of bullying, cyberbullying, and school safety. Journal of School Violence, 8(2), 159-176.
Wolke, D., Woods, S., Bloomfield, L., & Karstadt, L. (2001). Bullying involvement in primary school and common health problems. Archives of Disease in Childhood, 85(3), 197-201.
Ybarra, M. L., Boyd, D., Korchmaros, J. D., & Oppenheim, J. K. (2012). Defining and measuring cyberbullying within the larger context of bullying victimization. Journal of Adolescent Health, 51(1), 53-58.
35
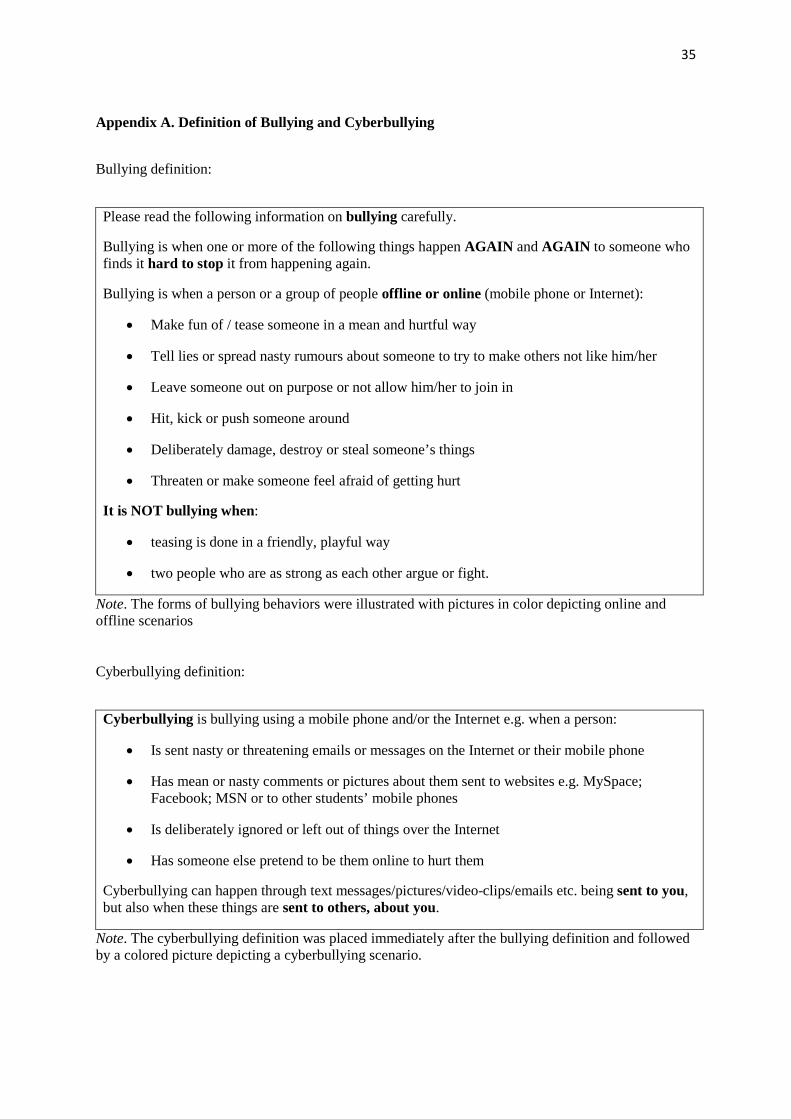
Appendix A. Definition of Bullying and Cyberbullying
Bullying definition:
Please read the following information on bullying carefully.
Bullying is when one or more of the following things happen AGAIN and AGAIN to someone who finds it hard to stop it from happening again.
Bullying is when a person or a group of people offline or online (mobile phone or Internet):
• Make fun of / tease someone in a mean and hurtful way
• Tell lies or spread nasty rumours about someone to try to make others not like him/her
• Leave someone out on purpose or not allow him/her to join in
• Hit, kick or push someone around
• Deliberately damage, destroy or steal someone’s things
• Threaten or make someone feel afraid of getting hurt
It is NOT bullying when:
• teasing is done in a friendly, playful way
• two people who are as strong as each other argue or fight.
Note. The forms of bullying behaviors were illustrated with pictures in color depicting online and offline scenarios
Cyberbullying definition:
Cyberbullying is bullying using a mobile phone and/or the Internet e.g. when a person:
• Is sent nasty or threatening emails or messages on the Internet or their mobile phone
• Has mean or nasty comments or pictures about them sent to websites e.g. MySpace; Facebook; MSN or to other students’ mobile phones
• Is deliberately ignored or left out of things over the Internet
• Has someone else pretend to be them online to hurt them
Cyberbullying can happen through text messages/pictures/video-clips/emails etc. being sent to you, but also when these things are sent to others, about you.
Note. The cyberbullying definition was placed immediately after the bullying definition and followed by a colored picture depicting a cyberbullying scenario.

36
Appendix B. Forms of Bullying Scale
Victimization Version (FBS-V)
Qxx. Last term, how often were you bullied (including cyberbullying) by one or more young people in the following ways?a
a I was TEASED in nasty ways
b SECRETS were told about me to others to hurt me
c I was hurt by someone trying to BREAK UP A FRIENDSHIP
d I was MADE TO FEEL AFRAID by what someone said he/she would do to me
e I was deliberately HURT PHYSICALLY by someone and/or by a group GANGING UP on me
f I was CALLED NAMES in nasty ways
g Someone told me he/she WOULDN’T LIKE ME UNLESS I DID what he/she said
h My THINGS were deliberately DAMAGED, DESTROYED or STOLEN
i Others tried to hurt me by LEAVING ME OUT of a group or NOT TALKING TO ME
j LIES were told and/or FALSE RUMOURS spread about me by someone, to make my friends or others NOT LIKE me
a For each item the respondent chooses one of the five response options as detailed in the Methods section titled “Construction of the FBS”.
37
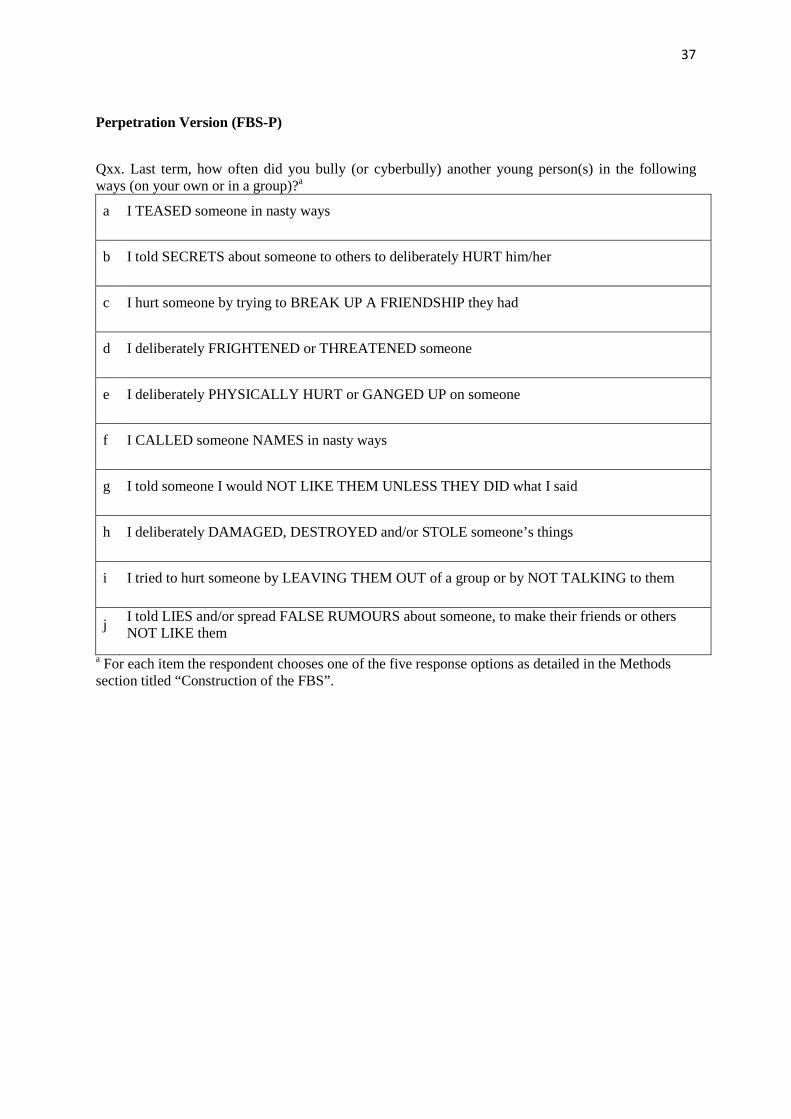
Perpetration Version (FBS-P)
Qxx. Last term, how often did you bully (or cyberbully) another young person(s) in the following ways (on your own or in a group)?a
a I TEASED someone in nasty ways
b I told SECRETS about someone to others to deliberately HURT him/her
c I hurt someone by trying to BREAK UP A FRIENDSHIP they had
d I deliberately FRIGHTENED or THREATENED someone
e I deliberately PHYSICALLY HURT or GANGED UP on someone
f I CALLED someone NAMES in nasty ways
g I told someone I would NOT LIKE THEM UNLESS THEY DID what I said
h I deliberately DAMAGED, DESTROYED and/or STOLE someone’s things
i I tried to hurt someone by LEAVING THEM OUT of a group or by NOT TALKING to them
j I told LIES and/or spread FALSE RUMOURS about someone, to make their friends or others NOT LIKE them
a For each item the respondent chooses one of the five response options as detailed in the Methods section titled “Construction of the FBS”.