Embed Size (px)
Citation preview
The Formation of In-Group Favoritism and Out-Group Prejudice in YoungChildren: Are They Distinct Attitudes?
Frances E. AboudMcGill University
Although standardized measures of prejudice reveal high levels of ethnocentric bias in the preschoolyears, it may reflect in-group favoritism or out-group prejudice. A measure that partially decouples thetwo attitudes was given to White children between 4 and 7 years of age to examine the reciprocal relationbetween and the acquisition and correlates of in-group and out-group attitudes. The two attitudes werereciprocally correlated in 1 sample from a racially homogeneous school but not in a 2nd sample from amixed-race school. In-group favoritism did not appear until 5 years of age but then reached significantlevels; it was strongly related to developing social cognitions. Out-group prejudice was weaker, but itstargets suffer from comparison with the high favoritism accorded in-group members.
Racial prejudice is a predisposition to react unfavorably tomembers of a racial group because of their group affiliation(Aboud, 1988). It involves holding derogatory attitudes or beliefs,expressing negative affect, or displaying hostile or discriminatorybehavior (Brown, 1995). Teachers and parents tend to think prej-udice is low in the early school years because they observe littlehostile or discriminatory behavior (Holmes, 1995). However, stan-dardized measures reveal high levels of pro-White/anti-Black biasin White children 6 years of age (Bigler & Liben, 1993; Doyle &Aboud, 1995) and even as young as 3 years (Katz & Kofkin,1997). Brewer (1999) argued that this may simply be strongin-group identification and attachment and that researchers’ as-sumption about the reciprocal relation between in-group and out-group attitudes has led them to infer, erroneously, that the obser-vation of strong in-group bias implies equally strong out-groupnegativity and that the origins of both reside in intergroup conflict.This assumption has also led to the use of measures that confoundthe two attitudes. Before antibias interventions are implementedwith children, it is important to determine which attitude should beaddressed and whether changing one necessarily changes the other.A separate analysis of in-group and out-group attitudes in relationto social-cognitive underpinnings might also support the thesis thatin-group attachment, but not out-group prejudice, has developmen-tal value.
The present study examined these issues as they apply to in-group and out-group attitudes of young White children. Data fromchildren in the process of forming attitudes about natural, as
opposed to lab-created, groups would seem most appropriate fortesting ideas about the primacy of in-group favoritism and itsrelation to out-group prejudice. Although Brewer (1999) based herevolutionary thesis of the primacy of in-group attachment on thesurvival value of group trust, it seems reasonable to derive devel-opmental implications from these claims. The implications mightconcern the age at which in-group bias is formed, its intensity, andits prevalence. If in-group favoritism is psychologically primary toout-group prejudice, the former might appear at a younger age andreach significantly higher levels among a larger number of chil-dren. More speculatively, if in-group favoritism is somehow nec-essary for basic survival, it might be connected to the unsophisti-cated cognitions of young children, whereas out-group prejudicemight not. Because children acquire these attitudes after 3 years ofage but begin to show some moderation of their biases after age 7(Aboud & Amato, 2001), I focused on the 4–7-year age group.
Are In-Group and Out-Group Attitudes Reciprocal?
Brewer (1999) claimed first that in-group and out-group atti-tudes are not necessarily reciprocally related. Conceptually, this isuncontestable. However, intergroup theories of bias propose that acomparative or competitive motivation leads children to maximizeevaluative differences between their own and other groups (Tajfel,1978). If in-group and out-group attitudes are unrelated, there willexist many different attitude combinations ranging from positive–negative to positive–neutral and positive–positive—an importantdistinction for those implementing antibias school programs, whomay not want to sacrifice in-group positivity for out-group toler-ance (Schofield & Eurich-Fulcer, 2001).
Measures that confound the two attitudes, by allowing respon-dents to select only one group for each positive or negativeevaluation, force a reciprocal relation. Although it is common forolder children to evaluate groups separately (e.g., Augoustinos &Rosewarne, 2001; Bennett, Lyons, Sani, & Barrett, 1998; Kinket &Verkuyten, 1999; A. R. Nesdale, 1999; Rutland, 1999; Singh,Choo, & Poh, 1998), assessments with young children typicallyshow targets simultaneously and require the child to choose one(e.g., the Preschool Racial Attitude Measure [PRAM] of Williams,
This research was supported by a grant from the Social Sciences andHumanities Research Council of Canada.
Thanks are extended to the children, teachers, and principals of White-side Taylor Day Care, Christmas Park Elementary School, WestmountPark School, and Our Lady of Pompeii for participating and to IsabelDorion, Sophie Petitclerc, and Sandy DaSilva for collecting the data.
Helpful comments on earlier drafts were provided by my colleaguesAnna-Beth Doyle and Morton J. Mendelson.
Correspondence concerning this article should be addressed to FrancesE. Aboud, Department of Psychology, 1205 Dr. Penfield Avenue, Mon-treal, Quebec H3A 1B1, Canada. E-mail: [email protected]
Developmental Psychology Copyright 2003 by the American Psychological Association, Inc.2003, Vol. 39, No. 1, 48–60 0012-1649/03/$12.00 DOI: 10.1037/0012-1649.39.1.48
48
This
doc
umen
t is c
opyr
ight
ed b
y th
e A
mer
ican
Psy
chol
ogic
al A
ssoc
iatio
n or
one
of i
ts a
llied
pub
lishe
rs.
This
arti
cle
is in
tend
ed so
lely
for t
he p
erso
nal u
se o
f the
indi
vidu
al u
ser a
nd is
not
to b
e di
ssem
inat
ed b
road
ly.
Best, Boswell, Mattson, & Graves, 1975). The recently developedMultiresponse Racial Attitude (MRA) measure allows for a partialdecoupling of in-group and out-group attitudes in that children canassign each evaluation to more than one group (Black-Gutman &Hickson, 1996; Doyle & Aboud, 1995). However, to date, no studyhas directly examined the relation between children’s in-group andout-group attitudes. Of particular importance is whether the acqui-sition of in-group favoritism (read favoritism, attachment � pos-itive evaluation) in the early years is accompanied by out-groupprejudice. Thus, I tested a strong version of Brewer’s (1999) claimthat in-group and out-group attitudes are not necessarily related,predicting that they would be uncorrelated and that the positive–negative combination would be no more frequent than thepositive–positive or positive–neutral ones.
The Primacy of In-Group Attachment
The second hypothesis of Brewer’s (1999) analysis, as it relatesto the development of prejudice, concerns the primacy of in-groupattachment. The issue of primacy implies that in-group favoritismwill precede and develop more strongly than out-group prejudice.According to Allport (1954) and Cameron, Alvarez, Ruble, andFuligni (2001), children are first likely to prefer their own groupwithout disliking out-groups. Existing studies of preschool-agedWhite children have used either a measure that confounds in-groupand out-group attitudes or an open-ended single question such as“Who would you like to have as friends?” On the latter measure,no changes were found between ages 3 and 6 years (Kowalski &Lo, 2001; Ramsey, 1991). Positive evaluations by themselves maydiscriminate less between target groups than may negative items ifchildren simply want friends. On the confounding measure, pro-White/anti-Black bias was high in some 3-year-olds and rosesignificantly at 5 years of age (Clark, Hocevar, & Dembo, 1980;Katz & Kofkin, 1997); however, there was no way of knowingwhether in-group or out-group bias was responsible for the change.One Israeli researcher who separated the two found that negativeattitudes toward a Jewish man were nonsignificantly higher in6-year-olds than in 3-year-olds, whereas negative attitudes towardan Arab man were considerably higher in 6-year-olds (Bar-Tal,1996; see also Teichman, 2001). This finding places the age ofacquisition of racial attitudes sometime between 3 and 6 years.
To examine the question of primacy, I tested White childrenbetween 4 and 7 years of age on the MRA measure, which assessespositive and negative evaluations. I included the confoundingmeasure, the PRAM, to compare levels with those in previousstudies and to determine whether scores on it are more stronglyrelated to in-group than to out-group attitudes. On the basis ofBrewer’s (1999) analysis, in-group favoritism was expected toreach significant levels among 4- and 5-year-old children and toshow larger age differences than out-group prejudice. Further-more, the pro-White/anti-Black confounded score was expected tocorrelate significantly with in-group favoritism but not with out-group prejudice.
Distinct Social-Cognitive Correlates
The final issue of interest concerns the different underpinningsof in-group and out-group attitudes. Brewer (1999) suggested amore fundamental basis to in-group attachment, namely, the sur-
vival value of mutual trust and cooperation with in-group mem-bers, whether they are personally related or not. From a develop-mental perspective, in-group favoritism is likely to be associatedwith prevalent and early-developing cognitive representations.Two such cognitions are ethnic self-identification and group cat-egorization. Tajfel (1978) originally suggested that prejudice be-gins once the child has learned to categorize ethnic groups and toidentify with one. Support for this view comes mainly from studiesof children placed into one of two teams who then evaluate theirown team more positively than the other team (see Bigler, Brown,& Markell, 2001, who assessed both positive and negative evalu-ations; D. Nesdale & Flesser, 2001; Yee & Brown, 1992). Butthere is little evidence of a strong negative evaluation reflectingprejudice in these studies. Perhaps only in-group attachmentemerges from these cognitions, especially when natural groups,rather than experimentally created ones, are considered (Brewer,1979). The step from categorization and self-identification to at-tachment is thought to require a cognitively simple process ofgeneralization from the self to similar others, whereas the step toout-group prejudice may require a more difficult social compari-son in which the degree of difference is noted and translated intoan evaluation (Aboud & Amato, 2001; Cameron et al., 2001).Alternatively, children may simply infer that similarity is good anddifference is bad. Therefore, in the present study, simple forms ofcategorization and self-identification were assessed, comparable toTajfel’s minimal group manipulation, by asking children whetherthey recognized in-group and out-group members and knew whichgroup they belonged to. A more common form of categorization,that is, accentuation of within-group homogeneity and between-groups difference, was also assessed because it has been impli-cated in in-group attachment as well as out-group stereotyping andprejudice (Brewer & Brown, 1998; Katz, Sohn, & Zalk, 1975).
A more general way of thinking that is common among pre-schoolers is the tendency to attend to only one dominating cue.This manifests as an inability to conserve quantities and to cate-gorize people using multiple attributes. Dominated by one dimen-sion of appraisal, the unsophisticated preoperational child may beconstrained to conclude that the in-group is good and the out-groupis bad. Later-developing processes associated with multiple clas-sification and conservation are credited with the frequently notedrise in middle childhood of positive out-group attitudes (e.g.,Bigler & Liben, 1993; Clark et al., 1980), although they are alsoassociated with a more balanced—negative as well as positive—in-group evaluation. Once again, it is important to determinewhether these abilities are associated with in-group and/or out-group attitudes. Because the focus here was on the acquisitionrather than the decline of favoritism and prejudice, I studied an agegroup that would largely lack conservation and multiple classifi-cation skills.
Brewer (1999) mentioned specific conditions that promote anextension of in-group favoritism to out-group prejudice. One ofthese is the translation of in-group preference to in-group superi-ority, called moral superiority. The construct closest to this in thechild literature is known as egocentrism or sociocentrism, de-scribed as a fixation on one’s in-group perspective (Piaget & Weil,1951). It is manifest in judgments that the in-group perspective isthe only right one and that out-group perspectives are wrong, asopposed to judgments that both perspectives are right (Aboud,1981). The second condition concerns children’s perception of
49IN-GROUP FAVORITISM AND OUT-GROUP PREJUDICE
This
doc
umen
t is c
opyr
ight
ed b
y th
e A
mer
ican
Psy
chol
ogic
al A
ssoc
iatio
n or
one
of i
ts a
llied
pub
lishe
rs.
This
arti
cle
is in
tend
ed so
lely
for t
he p
erso
nal u
se o
f the
indi
vidu
al u
ser a
nd is
not
to b
e di
ssem
inat
ed b
road
ly.
their social world as segmented into racial/ethnic groups. Brewer(1999) suggested that seeing social groups as highly correlatedwith race, rather than as mixed, would give rise to group compar-isons and prejudice.
In this article, two studies are described that tested hypothesesderived from Brewer’s (1999) analysis concerning whether, duringthe years when children acquire race-related attitudes, in-groupand out-group attitudes show differences in relation to each other,to age, and to social cognitions such as recognition, identification,group homogeneity, conservation, multiple classification, egocen-trism, and racial sorting. The first study examined these hypothe-ses with children between 4 and 7 years of age and includedcognitions related to identification and categorization. The secondstudy, conducted at a different school, focused on a narrower agerange during which children were expected to show in-groupfavoritism, in order to determine if in-group and out-group atti-tudes were distinct.
Study 1
Method
Participants
Eighty White children (42 boys and 38 girls) between the ages of 3years 9 months and 6 years 11 months were tested. The mean age was 5years 7 months; 23 children were under 5 years of age, 27 were between 5and 6 years, and 30 were between 6 and 7 years. The children lived in apredominantly White suburban community outside a large metropolitancity and attended preschool or after-school programs in the area. They hadlittle direct contact with Black or Native Indian people living in nearbycommunities; approximately 10% of the school populations were visibleminorities, and teachers were predominantly White.
Attitude MeasuresPreschool Racial Attitude Measure (Williams et al., 1975). The PRAM
Series A consists of six positive and six negative evaluation items tomeasure pro-White/anti-Black bias, as well as four gender-stereotype filleritems. The original pictures of Black and White stimulus persons (male andfemale) were redrawn to vary hair texture as well as skin color. For eachevaluative adjective, the child was shown the corresponding picture of aWhite person and a Black person and was asked which of the two fit thedescription. One point was given for choosing a White figure in responseto a positive evaluation, and one point was given for choosing a Blackfigure in response to a negative evaluation. The maximum score was 12. Asdefined by Williams and Morland (1976), high scores of from 9 to 12indicate pro-White/anti-Black bias.
Multiresponse Racial Attitude measure (Doyle & Aboud, 1995). TheMRA was used to derive separate indices of positive and negative attitudesand to permit the calculation of bias toward Whites, Blacks, and NativeIndians. Twenty evaluative adjectives, 10 positive and 10 negative, takenfrom the PRAM, along with 4 neutral filler items, were each presentedalong with a concrete behavioral example depicted identically on three20 � 20 cm cards. The cards were to be sorted among three boxes, labeledas belonging to a White child, a Black child, and a Native Indian child. Theboxes were identified by same-sex colored drawings of heads, differingonly in skin color and hair texture. That is, a boy set and a girl set ofstimulus persons were created for this and subsequently described mea-sures (except multiple classification) so that participants responded tostimuli of their own gender.
For each adjective, the child was handed the three identical cards andwas instructed to place them in the box or boxes of “people who are that
way.” For example, one item read, “Some children are naughty. They oftendo things like drawing on the wall with crayons. Who is naughty? Is it theBlack child, the White child, the Indian child, or more than one child whois naughty?” The cards depicted an apartment wall with crayon marks onit. Other items can be found in the Appendix.
The number of evaluative adjectives assigned to each box was tallied.Six scores were initially derived, a positive score and a negative score foreach of the three racial groups, each with a possible range from 0 to10. Anin-group evaluation score ranging from �10 (very unfavorable) to �10(very favorable) was created by subtracting the number of negative eval-uations from the number of positive evaluations. An out-group evaluationscore was similarly derived from the difference (positive � negative) inBlack evaluations. Because we did not intend to examine predictors ofattitudes toward Native Indians, and lacked parallel measures with thistarget group, reactions to Native Indians were not further analyzed, al-though the means were similar to those found by Doyle and Aboud (1995).The traditional measure of composite prejudice was also calculated toreflect how much more favorable children were to the in-group than to theout-group (in-group � out-group).
Internal consistency was calculated for each of the six scores by exam-ining responses to the 10 items comprising it. In this sample, Cronbach’salphas were .90 for positive White, .89 for negative White, .83 for positiveBlack, and .79 for negative Black. Test–retest reliabilities1 across a 2-weekinterval for an independent sample of children from 4 to 7 years were asfollows: r(22) � .48 for positive White, .66 for negative White, .68 forpositive Black, and .71 for negative Black ( ps � .05). The differencescores were more reliable: White, r(22) � .61; Black, r(19) � .80 ( ps �.05). T tests conducted on the pairs of test and retest scores yielded nosignificant differences on any of these variables; on average, the differencebetween test and retest scores varied from .13 to .96.
Convergent validity for the MRA has been found with Bigler et al.’s(2001) attitude measure, which uses a different response format in askinghow many children from each group, presented separately, have an eval-uative trait (none, some, half, most, or all; Zargarpour, 2001). The influ-ence of social desirability has been ruled out with the use of a number ofstrategies; these include nonsignificant correlations of attitudes with scoreson the Children’s Social Desirability scale and high similarity betweenevaluations done to reflect the child’s own attitude and evaluations done toreflect the attitude of a friend, for whom social desirability concerns mightbe lower (Aboud & Fenwick, 1999; Doyle, Beaudet, & Aboud, 1988).Predictive validity has been demonstrated by showing (a) positive corre-lations between favorable out-group evaluations on the MRA and favorableout-group statements in children’s private dyadic discussions and (b)negative correlations between favorable in-group evaluations and unfavor-able in-group statements (Aboud & Doyle, 1996). Also, favorable out-group evaluations correlate with having more out-group companions (asreported by classmates), nominating fewer out-group nonfriends, and re-porting a higher quality friendship with an out-group classmate (Aboud,Mendelson, & Purdy, in press).
Social Cognition MeasuresRecognition of racial cues and self-identification. Children were
shown photographs of three Whites, three Blacks, and three Native Indiansand were asked to point to the ones who were White, Black, and Indian.The photographs were of unfamiliar same-sex children, of approximatelythe same age as the participants, who had been judged by 40 Black andWhite college students to be of intermediate attractiveness. The number ofBlack and White stimulus peers accurately recognized constituted thechild’s recognition score (which could range from 0 to 6).
1 Test–retest data were collected after the completion of the studiesreported here and included more explicitly the “none of them” option.
50 ABOUD
This
doc
umen
t is c
opyr
ight
ed b
y th
e A
mer
ican
Psy
chol
ogic
al A
ssoc
iatio
n or
one
of i
ts a
llied
pub
lishe
rs.
This
arti
cle
is in
tend
ed so
lely
for t
he p
erso
nal u
se o
f the
indi
vidu
al u
ser a
nd is
not
to b
e di
ssem
inat
ed b
road
ly.
The following self-identification questions were asked in varying order:“Are you a White Canadian?” “Are you a Black Canadian?” “Are you aCanadian Indian?” The child received one point for each correct answer,that is, yes to the White question and no to the others. A self-identificationscore (from 0 to 2) was created by summing the correct answers to theWhite and Black questions.
Group homogeneity. This measure was intended to assess how muchchildren minimized within-group differences compared with between-groups differences. Children were asked to rate the dissimilarity of six pairsof different-race photographs of children and six pairs of same-race pho-tographs of children. The photographs described previously were used, andratings were made on a 60-cm same–different board spread from left toright on the table. The children were given one pair of photos at a time andwere asked to place them, facing each other on the board, closer togetherthe more similar they were judged to be and farther apart the more differentthey were judged to be (Aboud & Mitchell, 1977). Perceived dissimilaritywas the distance in centimeters between the two. Two variables werecreated to reflect group homogeneity. In-group homogeneity was the meandistance between the two Black–White pairs minus the mean distancebetween the two White pairs (i.e., White–Black dissimilarity minus White–White dissimilarity). An out-group homogeneity score was created bysubtracting Black–Black dissimilarity from White–Black dissimilarity.Higher scores reflect perceptions of within-group homogeneity, and lowerscores reflect within-group differentiation. For example, a child whojudged the between-groups (White–Black) pairs of stimuli to be verydifferent might place them, on average, 50 cm apart; if the same childjudged the within-group (Black–Black) pairs to be quite similar, placingthem 20 cm apart, this would yield an out-group homogeneity score of50 � 20 � 30. Another child with the same between-groups judgmentmight perceive the within-group pair to be relatively different, placingthem 40 cm apart; this would yield a low homogeneity score of 50 �40 � 10. Subtracting the within-group score from the between-groupsscore eliminated potential differences in children’s use of the board (pos-sible range � �60 to �60). Alpha coefficients for this sample were .64 forWhite–Black ratings and .65 for within-group ratings. Previous studieswith kindergarteners have found coefficients of .73 and .80, respectively(Doyle & Aboud, 1995). Construct validity for these distance judgmentscomes from a study involving comparisons of self with various in-groupand out-group members among 5–9-year-old White and Native Indianchildren; White children placed drawings of themselves closer to Whitephotos than to several different out-group photos, whereas Native Indianchildren placed drawings of themselves closer to Native Indian photos(Aboud & Mitchell, 1977).
Conservation. Level of concrete operational thinking was evaluatedusing an adaptation (Gulko, Doyle, Serbin, & White, 1988) of the Gold-schmidt and Bentler Concept Assessment Kit. Seven conservation taskswere administered: area, number, substance, continuous quantity, weight,discontinuous quantity, and volume, in that order. Answers that demon-strated conservation with at least a partially correct explanation werescored as correct; the number of correct answers was the conservationscore (possible range from 0 to 7).
Multiple cross-cutting classification. Two- and three-way classifica-tion tasks were used (Arlin, 1981). The tasks required simultaneous atten-tion to two or three attributes. Each task had three problems: shapes,objects, and people. For example, the two-way people problem usedpictures of Black and White men and women. Three pictures were placedin the quadrants of a square so that race and gender were varied system-atically. The child was asked to choose from among four other pictures ofBlack and White men and women the one that belonged in the fourthquadrant. Instead of following the usual procedure of asking children toexplain their choices verbally, I challenged them by presenting them withan alternative choice. If the correct picture was chosen, an incorrect onewas subsequently offered to see if the child would reject it. If an incorrectpicture was chosen, a correct one was offered to see if the child would
accept it. A score of 0 was given if the answer sequence was select–incorrect and alternative–incorrectly rejected. A score of 2 was given if thesequence was select–correct and alternative–correctly rejected. A scoreof 1 was given for the other sequences, in which only one response wascorrect. The three-way classification task used pictures that varied on threedimensions—race, sex, and age; the matrix was to be completed byselecting from among eight pictures. A score for multiple classification wasobtained by summing scores for the six items (possible range was from 0to 12). Although the tasks have been used with children as young askindergarten age, it was expected that most children in this sample wouldobtain low scores. These would hopefully allow concentration on theacquisition, rather than the decline, of in-group favoritism and out-groupprejudice. The alpha coefficient was .66 in a sample of kindergarteners and.51 in this sample.
Procedure
The children were tested individually by a White woman in threesessions that took place several weeks apart. The order of the measures wascounterbalanced, with the restriction that attitude measures be given inseparate sessions.
Results and Discussion
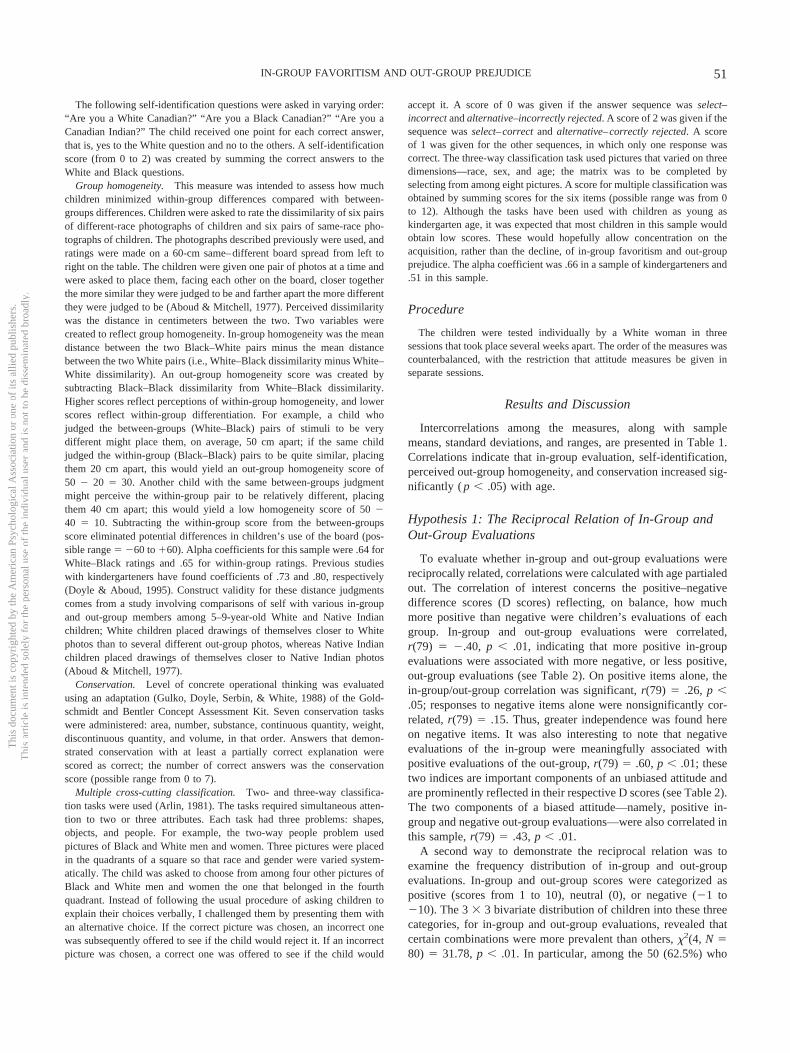
Intercorrelations among the measures, along with samplemeans, standard deviations, and ranges, are presented in Table 1.Correlations indicate that in-group evaluation, self-identification,perceived out-group homogeneity, and conservation increased sig-nificantly ( p � .05) with age.
Hypothesis 1: The Reciprocal Relation of In-Group andOut-Group Evaluations
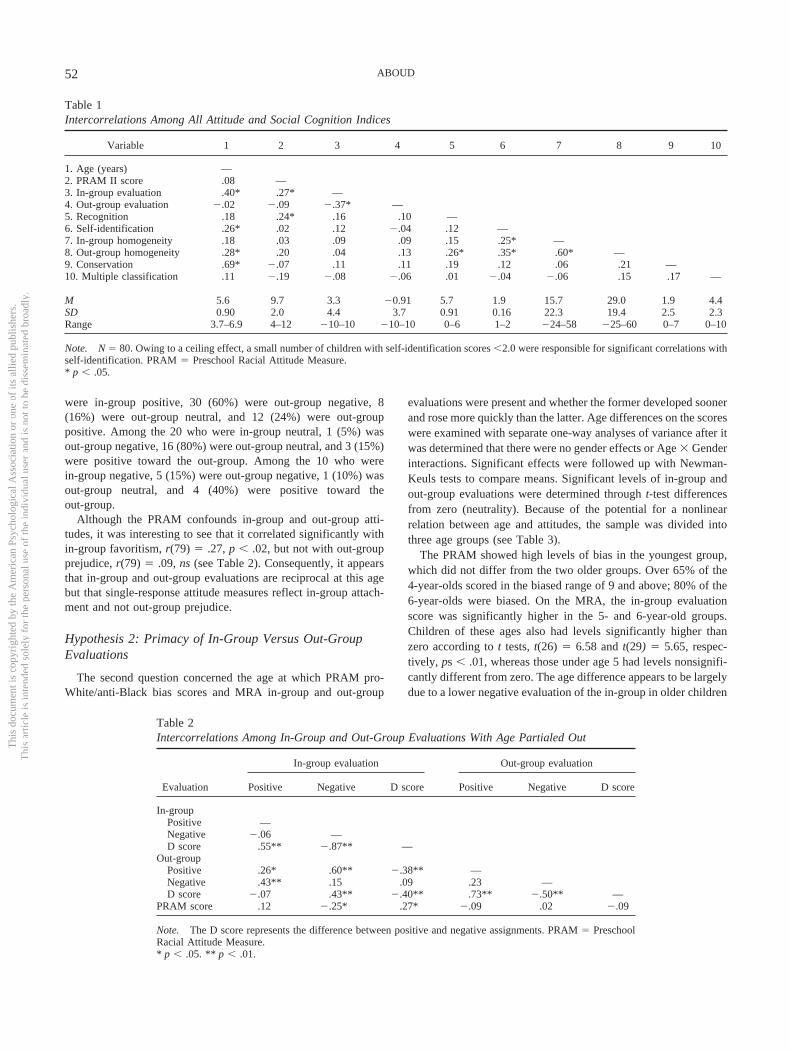
To evaluate whether in-group and out-group evaluations werereciprocally related, correlations were calculated with age partialedout. The correlation of interest concerns the positive–negativedifference scores (D scores) reflecting, on balance, how muchmore positive than negative were children’s evaluations of eachgroup. In-group and out-group evaluations were correlated,r(79) � �.40, p � .01, indicating that more positive in-groupevaluations were associated with more negative, or less positive,out-group evaluations (see Table 2). On positive items alone, thein-group/out-group correlation was significant, r(79) � .26, p �.05; responses to negative items alone were nonsignificantly cor-related, r(79) � .15. Thus, greater independence was found hereon negative items. It was also interesting to note that negativeevaluations of the in-group were meaningfully associated withpositive evaluations of the out-group, r(79) � .60, p � .01; thesetwo indices are important components of an unbiased attitude andare prominently reflected in their respective D scores (see Table 2).The two components of a biased attitude—namely, positive in-group and negative out-group evaluations—were also correlated inthis sample, r(79) � .43, p � .01.
A second way to demonstrate the reciprocal relation was toexamine the frequency distribution of in-group and out-groupevaluations. In-group and out-group scores were categorized aspositive (scores from 1 to 10), neutral (0), or negative (�1 to�10). The 3 � 3 bivariate distribution of children into these threecategories, for in-group and out-group evaluations, revealed thatcertain combinations were more prevalent than others, �2(4, N �80) � 31.78, p � .01. In particular, among the 50 (62.5%) who
51IN-GROUP FAVORITISM AND OUT-GROUP PREJUDICE
This
doc
umen
t is c
opyr
ight
ed b
y th
e A
mer
ican
Psy
chol
ogic
al A
ssoc
iatio
n or
one
of i
ts a
llied
pub
lishe
rs.
This
arti
cle
is in
tend
ed so
lely
for t
he p
erso
nal u
se o
f the
indi
vidu
al u
ser a
nd is
not
to b
e di
ssem
inat
ed b
road
ly.
were in-group positive, 30 (60%) were out-group negative, 8(16%) were out-group neutral, and 12 (24%) were out-grouppositive. Among the 20 who were in-group neutral, 1 (5%) wasout-group negative, 16 (80%) were out-group neutral, and 3 (15%)were positive toward the out-group. Among the 10 who werein-group negative, 5 (15%) were out-group negative, 1 (10%) wasout-group neutral, and 4 (40%) were positive toward theout-group.
Although the PRAM confounds in-group and out-group atti-tudes, it was interesting to see that it correlated significantly within-group favoritism, r(79) � .27, p � .02, but not with out-groupprejudice, r(79) � .09, ns (see Table 2). Consequently, it appearsthat in-group and out-group evaluations are reciprocal at this agebut that single-response attitude measures reflect in-group attach-ment and not out-group prejudice.
Hypothesis 2: Primacy of In-Group Versus Out-GroupEvaluations
The second question concerned the age at which PRAM pro-White/anti-Black bias scores and MRA in-group and out-group
evaluations were present and whether the former developed soonerand rose more quickly than the latter. Age differences on the scoreswere examined with separate one-way analyses of variance after itwas determined that there were no gender effects or Age � Genderinteractions. Significant effects were followed up with Newman-Keuls tests to compare means. Significant levels of in-group andout-group evaluations were determined through t-test differencesfrom zero (neutrality). Because of the potential for a nonlinearrelation between age and attitudes, the sample was divided intothree age groups (see Table 3).
The PRAM showed high levels of bias in the youngest group,which did not differ from the two older groups. Over 65% of the4-year-olds scored in the biased range of 9 and above; 80% of the6-year-olds were biased. On the MRA, the in-group evaluationscore was significantly higher in the 5- and 6-year-old groups.Children of these ages also had levels significantly higher thanzero according to t tests, t(26) � 6.58 and t(29) � 5.65, respec-tively, ps � .01, whereas those under age 5 had levels nonsignifi-cantly different from zero. The age difference appears to be largelydue to a lower negative evaluation of the in-group in older children
Table 1Intercorrelations Among All Attitude and Social Cognition Indices
Variable 1 2 3 4 5 6 7 8 9 10
1. Age (years) —2. PRAM II score .08 —3. In-group evaluation .40* .27* —4. Out-group evaluation �.02 �.09 �.37* —5. Recognition .18 .24* .16 .10 —6. Self-identification .26* .02 .12 �.04 .12 —7. In-group homogeneity .18 .03 .09 .09 .15 .25* —8. Out-group homogeneity .28* .20 .04 .13 .26* .35* .60* —9. Conservation .69* �.07 .11 .11 .19 .12 .06 .21 —10. Multiple classification .11 �.19 �.08 �.06 .01 �.04 �.06 .15 .17 —
M 5.6 9.7 3.3 �0.91 5.7 1.9 15.7 29.0 1.9 4.4SD 0.90 2.0 4.4 3.7 0.91 0.16 22.3 19.4 2.5 2.3Range 3.7–6.9 4–12 �10–10 �10–10 0–6 1–2 �24–58 �25–60 0–7 0–10
Note. N � 80. Owing to a ceiling effect, a small number of children with self-identification scores �2.0 were responsible for significant correlations withself-identification. PRAM � Preschool Racial Attitude Measure.* p � .05.
Table 2Intercorrelations Among In-Group and Out-Group Evaluations With Age Partialed Out
Evaluation
In-group evaluation Out-group evaluation
Positive Negative D score Positive Negative D score
In-groupPositive —Negative �.06 —D score .55** �.87** —
Out-groupPositive .26* .60** �.38** —Negative .43** .15 .09 .23 —D score �.07 .43** �.40** .73** �.50** —
PRAM score .12 �.25* .27* �.09 .02 �.09
Note. The D score represents the difference between positive and negative assignments. PRAM � PreschoolRacial Attitude Measure.* p � .05. ** p � .01.
52 ABOUD
This
doc
umen
t is c
opyr
ight
ed b
y th
e A
mer
ican
Psy
chol
ogic
al A
ssoc
iatio
n or
one
of i
ts a
llied
pub
lishe
rs.
This
arti
cle
is in
tend
ed so
lely
for t
he p
erso
nal u
se o
f the
indi
vidu
al u
ser a
nd is
not
to b
e di
ssem
inat
ed b
road
ly.
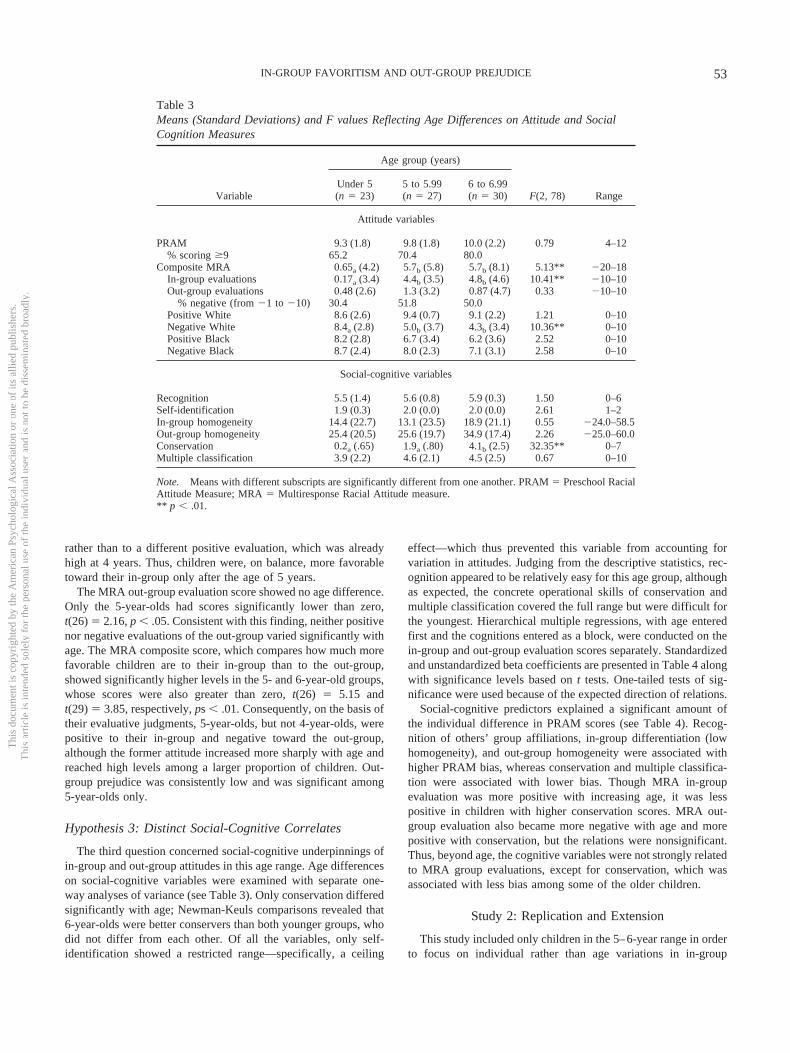
rather than to a different positive evaluation, which was alreadyhigh at 4 years. Thus, children were, on balance, more favorabletoward their in-group only after the age of 5 years.
The MRA out-group evaluation score showed no age difference.Only the 5-year-olds had scores significantly lower than zero,t(26) � 2.16, p � .05. Consistent with this finding, neither positivenor negative evaluations of the out-group varied significantly withage. The MRA composite score, which compares how much morefavorable children are to their in-group than to the out-group,showed significantly higher levels in the 5- and 6-year-old groups,whose scores were also greater than zero, t(26) � 5.15 andt(29) � 3.85, respectively, ps � .01. Consequently, on the basis oftheir evaluative judgments, 5-year-olds, but not 4-year-olds, werepositive to their in-group and negative toward the out-group,although the former attitude increased more sharply with age andreached high levels among a larger proportion of children. Out-group prejudice was consistently low and was significant among5-year-olds only.
Hypothesis 3: Distinct Social-Cognitive Correlates
The third question concerned social-cognitive underpinnings ofin-group and out-group attitudes in this age range. Age differenceson social-cognitive variables were examined with separate one-way analyses of variance (see Table 3). Only conservation differedsignificantly with age; Newman-Keuls comparisons revealed that6-year-olds were better conservers than both younger groups, whodid not differ from each other. Of all the variables, only self-identification showed a restricted range—specifically, a ceiling
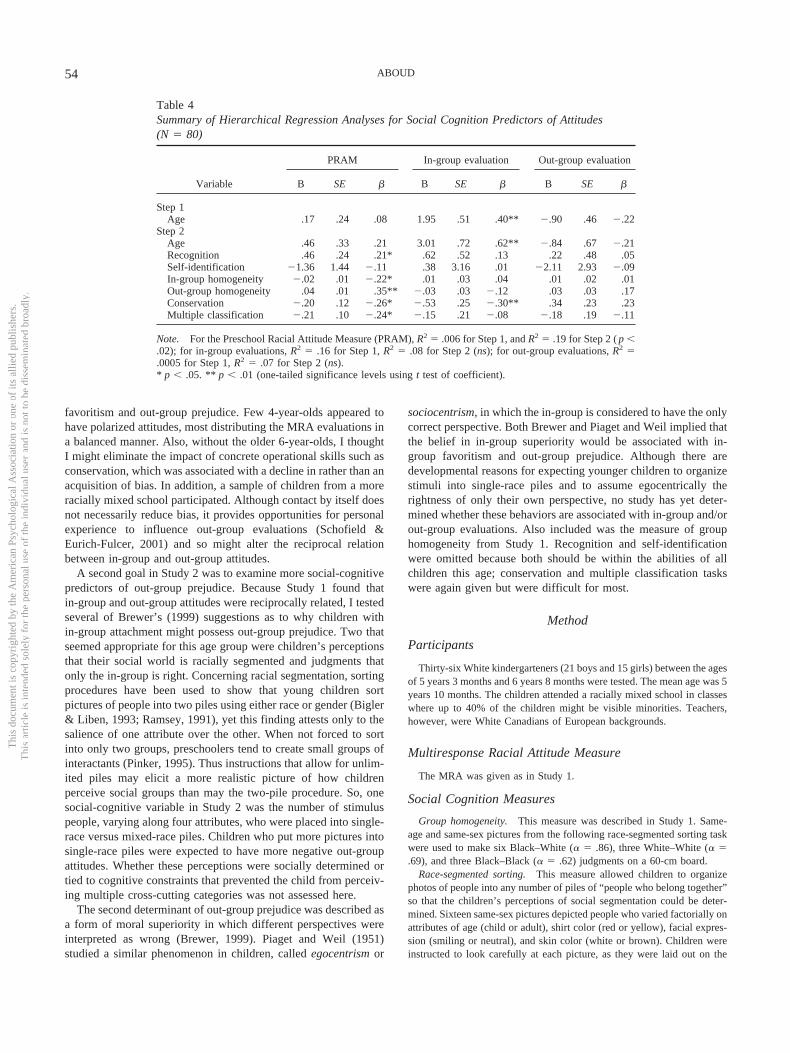
effect—which thus prevented this variable from accounting forvariation in attitudes. Judging from the descriptive statistics, rec-ognition appeared to be relatively easy for this age group, althoughas expected, the concrete operational skills of conservation andmultiple classification covered the full range but were difficult forthe youngest. Hierarchical multiple regressions, with age enteredfirst and the cognitions entered as a block, were conducted on thein-group and out-group evaluation scores separately. Standardizedand unstandardized beta coefficients are presented in Table 4 alongwith significance levels based on t tests. One-tailed tests of sig-nificance were used because of the expected direction of relations.
Social-cognitive predictors explained a significant amount ofthe individual difference in PRAM scores (see Table 4). Recog-nition of others’ group affiliations, in-group differentiation (lowhomogeneity), and out-group homogeneity were associated withhigher PRAM bias, whereas conservation and multiple classifica-tion were associated with lower bias. Though MRA in-groupevaluation was more positive with increasing age, it was lesspositive in children with higher conservation scores. MRA out-group evaluation also became more negative with age and morepositive with conservation, but the relations were nonsignificant.Thus, beyond age, the cognitive variables were not strongly relatedto MRA group evaluations, except for conservation, which wasassociated with less bias among some of the older children.
Study 2: Replication and Extension
This study included only children in the 5–6-year range in orderto focus on individual rather than age variations in in-group
Table 3Means (Standard Deviations) and F values Reflecting Age Differences on Attitude and SocialCognition Measures
Variable
Age group (years)
F(2, 78) RangeUnder 5(n � 23)
5 to 5.99(n � 27)
6 to 6.99(n � 30)
Attitude variables
PRAM 9.3 (1.8) 9.8 (1.8) 10.0 (2.2) 0.79 4–12% scoring �9 65.2 70.4 80.0
Composite MRA 0.65a (4.2) 5.7b (5.8) 5.7b (8.1) 5.13** �20–18In-group evaluations 0.17a (3.4) 4.4b (3.5) 4.8b (4.6) 10.41** �10–10Out-group evaluations 0.48 (2.6) 1.3 (3.2) 0.87 (4.7) 0.33 �10–10
% negative (from �1 to �10) 30.4 51.8 50.0Positive White 8.6 (2.6) 9.4 (0.7) 9.1 (2.2) 1.21 0–10Negative White 8.4a (2.8) 5.0b (3.7) 4.3b (3.4) 10.36** 0–10Positive Black 8.2 (2.8) 6.7 (3.4) 6.2 (3.6) 2.52 0–10Negative Black 8.7 (2.4) 8.0 (2.3) 7.1 (3.1) 2.58 0–10
Social-cognitive variables
Recognition 5.5 (1.4) 5.6 (0.8) 5.9 (0.3) 1.50 0–6Self-identification 1.9 (0.3) 2.0 (0.0) 2.0 (0.0) 2.61 1–2In-group homogeneity 14.4 (22.7) 13.1 (23.5) 18.9 (21.1) 0.55 �24.0–58.5Out-group homogeneity 25.4 (20.5) 25.6 (19.7) 34.9 (17.4) 2.26 �25.0–60.0Conservation 0.2a (.65) 1.9a (.80) 4.1b (2.5) 32.35** 0–7Multiple classification 3.9 (2.2) 4.6 (2.1) 4.5 (2.5) 0.67 0–10
Note. Means with different subscripts are significantly different from one another. PRAM � Preschool RacialAttitude Measure; MRA � Multiresponse Racial Attitude measure.** p � .01.
53IN-GROUP FAVORITISM AND OUT-GROUP PREJUDICE
This
doc
umen
t is c
opyr
ight
ed b
y th
e A
mer
ican
Psy
chol
ogic
al A
ssoc
iatio
n or
one
of i
ts a
llied
pub
lishe
rs.
This
arti
cle
is in
tend
ed so
lely
for t
he p
erso
nal u
se o
f the
indi
vidu
al u
ser a
nd is
not
to b
e di
ssem
inat
ed b
road
ly.
favoritism and out-group prejudice. Few 4-year-olds appeared tohave polarized attitudes, most distributing the MRA evaluations ina balanced manner. Also, without the older 6-year-olds, I thoughtI might eliminate the impact of concrete operational skills such asconservation, which was associated with a decline in rather than anacquisition of bias. In addition, a sample of children from a moreracially mixed school participated. Although contact by itself doesnot necessarily reduce bias, it provides opportunities for personalexperience to influence out-group evaluations (Schofield &Eurich-Fulcer, 2001) and so might alter the reciprocal relationbetween in-group and out-group attitudes.
A second goal in Study 2 was to examine more social-cognitivepredictors of out-group prejudice. Because Study 1 found thatin-group and out-group attitudes were reciprocally related, I testedseveral of Brewer’s (1999) suggestions as to why children within-group attachment might possess out-group prejudice. Two thatseemed appropriate for this age group were children’s perceptionsthat their social world is racially segmented and judgments thatonly the in-group is right. Concerning racial segmentation, sortingprocedures have been used to show that young children sortpictures of people into two piles using either race or gender (Bigler& Liben, 1993; Ramsey, 1991), yet this finding attests only to thesalience of one attribute over the other. When not forced to sortinto only two groups, preschoolers tend to create small groups ofinteractants (Pinker, 1995). Thus instructions that allow for unlim-ited piles may elicit a more realistic picture of how childrenperceive social groups than may the two-pile procedure. So, onesocial-cognitive variable in Study 2 was the number of stimuluspeople, varying along four attributes, who were placed into single-race versus mixed-race piles. Children who put more pictures intosingle-race piles were expected to have more negative out-groupattitudes. Whether these perceptions were socially determined ortied to cognitive constraints that prevented the child from perceiv-ing multiple cross-cutting categories was not assessed here.
The second determinant of out-group prejudice was described asa form of moral superiority in which different perspectives wereinterpreted as wrong (Brewer, 1999). Piaget and Weil (1951)studied a similar phenomenon in children, called egocentrism or
sociocentrism, in which the in-group is considered to have the onlycorrect perspective. Both Brewer and Piaget and Weil implied thatthe belief in in-group superiority would be associated with in-group favoritism and out-group prejudice. Although there aredevelopmental reasons for expecting younger children to organizestimuli into single-race piles and to assume egocentrically therightness of only their own perspective, no study has yet deter-mined whether these behaviors are associated with in-group and/orout-group evaluations. Also included was the measure of grouphomogeneity from Study 1. Recognition and self-identificationwere omitted because both should be within the abilities of allchildren this age; conservation and multiple classification taskswere again given but were difficult for most.
Method
Participants
Thirty-six White kindergarteners (21 boys and 15 girls) between the agesof 5 years 3 months and 6 years 8 months were tested. The mean age was 5years 10 months. The children attended a racially mixed school in classeswhere up to 40% of the children might be visible minorities. Teachers,however, were White Canadians of European backgrounds.
Multiresponse Racial Attitude Measure
The MRA was given as in Study 1.
Social Cognition MeasuresGroup homogeneity. This measure was described in Study 1. Same-
age and same-sex pictures from the following race-segmented sorting taskwere used to make six Black–White (� � .86), three White–White (� �.69), and three Black–Black (� � .62) judgments on a 60-cm board.
Race-segmented sorting. This measure allowed children to organizephotos of people into any number of piles of “people who belong together”so that the children’s perceptions of social segmentation could be deter-mined. Sixteen same-sex pictures depicted people who varied factorially onattributes of age (child or adult), shirt color (red or yellow), facial expres-sion (smiling or neutral), and skin color (white or brown). Children wereinstructed to look carefully at each picture, as they were laid out on the
Table 4Summary of Hierarchical Regression Analyses for Social Cognition Predictors of Attitudes(N � 80)
Variable
PRAM In-group evaluation Out-group evaluation
B SE � B SE � B SE �
Step 1Age .17 .24 .08 1.95 .51 .40** �.90 .46 �.22
Step 2Age .46 .33 .21 3.01 .72 .62** �.84 .67 �.21Recognition .46 .24 .21* .62 .52 .13 .22 .48 .05Self-identification �1.36 1.44 �.11 .38 3.16 .01 �2.11 2.93 �.09In-group homogeneity �.02 .01 �.22* .01 .03 .04 .01 .02 .01Out-group homogeneity .04 .01 .35** �.03 .03 �.12 .03 .03 .17Conservation �.20 .12 �.26* �.53 .25 �.30** .34 .23 .23Multiple classification �.21 .10 �.24* �.15 .21 �.08 �.18 .19 �.11
Note. For the Preschool Racial Attitude Measure (PRAM), R2 � .006 for Step 1, and R2 � .19 for Step 2 ( p �.02); for in-group evaluations, R2 � .16 for Step 1, R2 � .08 for Step 2 (ns); for out-group evaluations, R2 �.0005 for Step 1, R2 � .07 for Step 2 (ns).* p � .05. ** p � .01 (one-tailed significance levels using t test of coefficient).
54 ABOUD
This
doc
umen
t is c
opyr
ight
ed b
y th
e A
mer
ican
Psy
chol
ogic
al A
ssoc
iatio
n or
one
of i
ts a
llied
pub
lishe
rs.
This
arti
cle
is in
tend
ed so
lely
for t
he p
erso
nal u
se o
f the
indi
vidu
al u
ser a
nd is
not
to b
e di
ssem
inat
ed b
road
ly.
table, and to put the pictures into piles of “people who belong together”using as few or as many piles as needed. The number of pictures put intosingle-race piles (meaning that only one race of people were found in thatpile) was the index used. Because children used, on average, 4 piles, andthe range of 1–9 piles was unrelated to age, most had the opportunity toplace from 0 to all of the 16 pictures in single-race piles. The number ofin-group pictures in single-race piles correlated .84 with the number ofout-group pictures in single-race piles, so they were combined.
Egocentric superiority (Aboud, 1981). This task measured whetherchildren judged two different preferences, their own and someone else’s, asboth right (reconcile) or as one right and one wrong (egocentric). First,children rated their own preferences for same-sex photographs of twoWhite, two Black, and two Chinese children on a 60-cm liking board(closer together the more the pictured child was liked and farther away theless the pictured child was liked). The children were asked to compare andevaluate their own ratings with those of three other children in the follow-ing manner: (a) The tester showed a photo of another child of the least-liked ethnicity and indicated that child’s preferences by setting up identicalphotos on a second board in the reverse order to the participating child’spreferences. The tester then asked the child, “This is how you put them;this is how [s/he] put them. Are they the same or are they different? Areboth of you right or is someone wrong?” (b) The tester showed a photo ofa child from the second-to-last-placed ethnicity and indicated that child’spreferences, again in reverse order, but with that child’s in-group as mostliked. Again the tester asked the participating child if both were right or ifsomeone was wrong. (c) The tester then showed a photo of a child from themost-liked ethnicity and indicated that child’s preferences, again in reverseorder to the participating child’s preferences, asking if both were right orif someone was wrong. For each item, 1 point was given if the childindicated that only self-preferences were right (range � 0–3).
ProcedureA White woman tested the children in two separate sessions. The first
session included the measures of group homogeneity, sorting, and egocen-trism. The second session included the MRA and an intergroup behaviormeasure not described in this article. Conservation and multiple classifi-cation tasks were given at the end of the first session but are omitted fromfurther analysis because scores were very low (e.g., only 1 child conservedsubstance).
Results
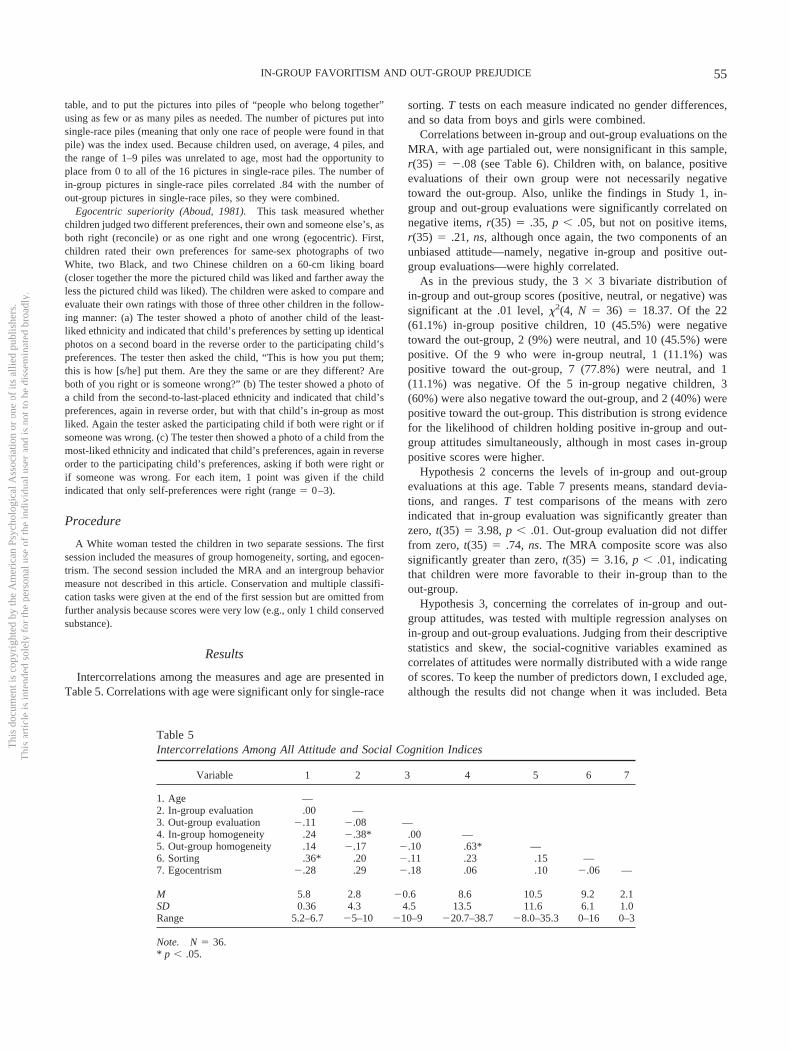
Intercorrelations among the measures and age are presented inTable 5. Correlations with age were significant only for single-race
sorting. T tests on each measure indicated no gender differences,and so data from boys and girls were combined.
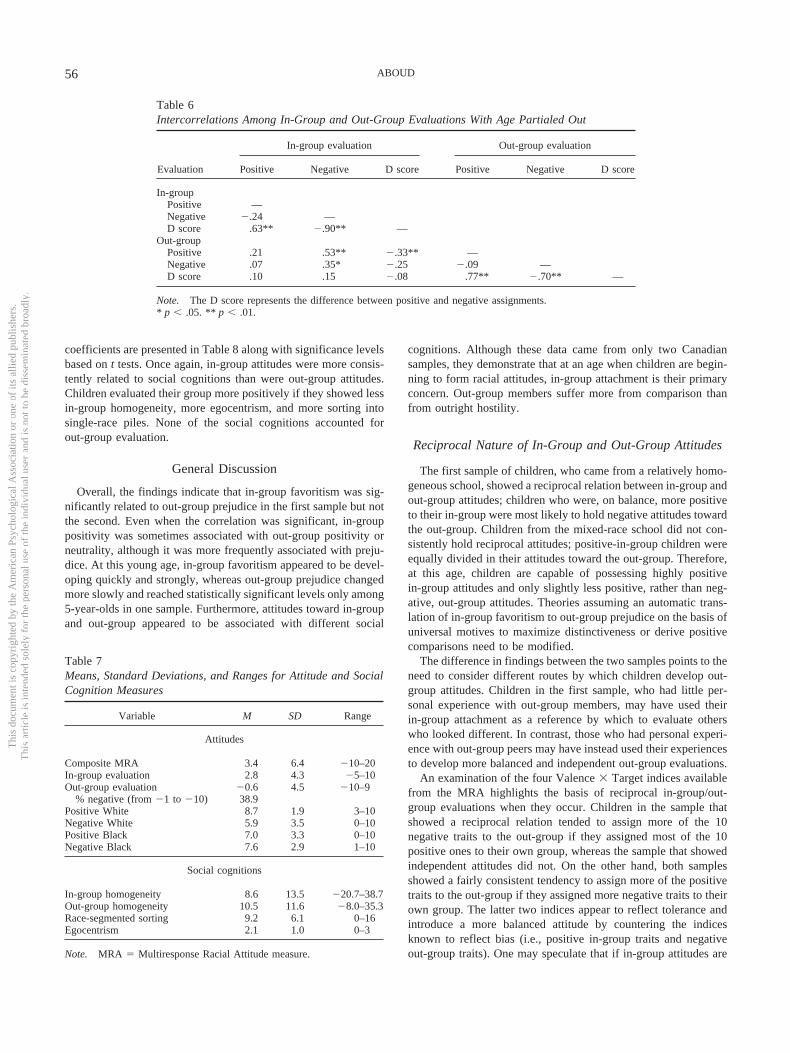
Correlations between in-group and out-group evaluations on theMRA, with age partialed out, were nonsignificant in this sample,r(35) � �.08 (see Table 6). Children with, on balance, positiveevaluations of their own group were not necessarily negativetoward the out-group. Also, unlike the findings in Study 1, in-group and out-group evaluations were significantly correlated onnegative items, r(35) � .35, p � .05, but not on positive items,r(35) � .21, ns, although once again, the two components of anunbiased attitude—namely, negative in-group and positive out-group evaluations—were highly correlated.
As in the previous study, the 3 � 3 bivariate distribution ofin-group and out-group scores (positive, neutral, or negative) wassignificant at the .01 level, �2(4, N � 36) � 18.37. Of the 22(61.1%) in-group positive children, 10 (45.5%) were negativetoward the out-group, 2 (9%) were neutral, and 10 (45.5%) werepositive. Of the 9 who were in-group neutral, 1 (11.1%) waspositive toward the out-group, 7 (77.8%) were neutral, and 1(11.1%) was negative. Of the 5 in-group negative children, 3(60%) were also negative toward the out-group, and 2 (40%) werepositive toward the out-group. This distribution is strong evidencefor the likelihood of children holding positive in-group and out-group attitudes simultaneously, although in most cases in-grouppositive scores were higher.
Hypothesis 2 concerns the levels of in-group and out-groupevaluations at this age. Table 7 presents means, standard devia-tions, and ranges. T test comparisons of the means with zeroindicated that in-group evaluation was significantly greater thanzero, t(35) � 3.98, p � .01. Out-group evaluation did not differfrom zero, t(35) � .74, ns. The MRA composite score was alsosignificantly greater than zero, t(35) � 3.16, p � .01, indicatingthat children were more favorable to their in-group than to theout-group.
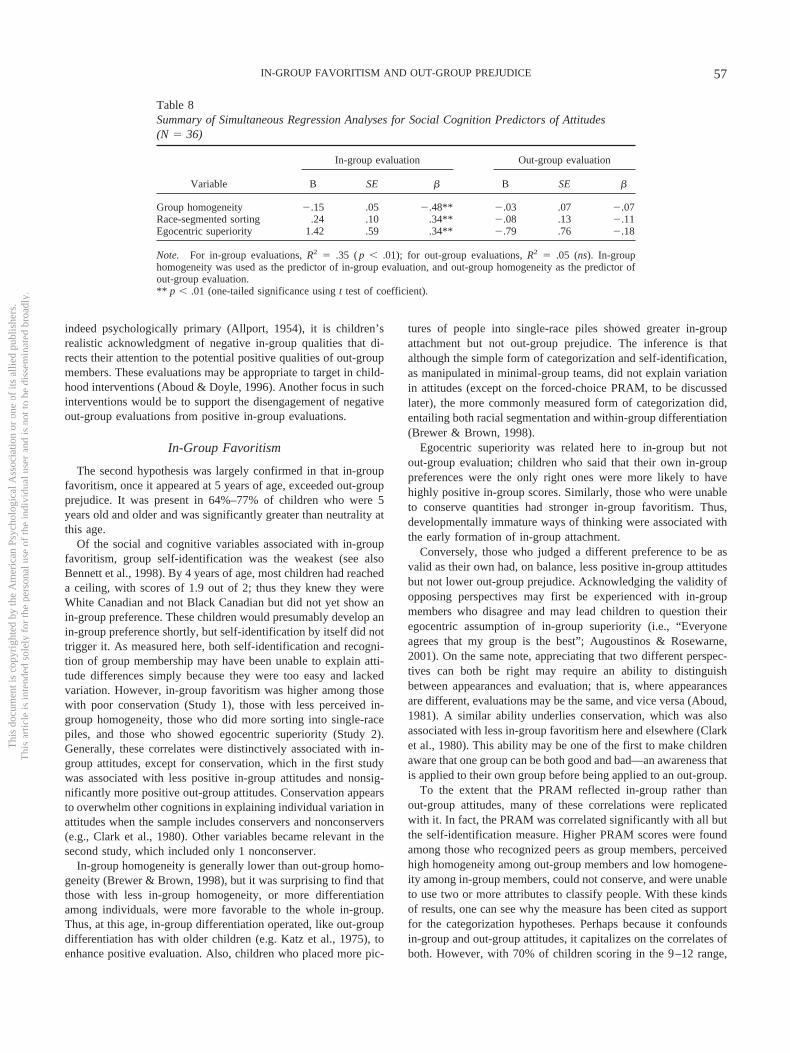
Hypothesis 3, concerning the correlates of in-group and out-group attitudes, was tested with multiple regression analyses onin-group and out-group evaluations. Judging from their descriptivestatistics and skew, the social-cognitive variables examined ascorrelates of attitudes were normally distributed with a wide rangeof scores. To keep the number of predictors down, I excluded age,although the results did not change when it was included. Beta
Table 5Intercorrelations Among All Attitude and Social Cognition Indices
Variable 1 2 3 4 5 6 7
1. Age —2. In-group evaluation .00 —3. Out-group evaluation �.11 �.08 —4. In-group homogeneity .24 �.38* .00 —5. Out-group homogeneity .14 �.17 �.10 .63* —6. Sorting .36* .20 �.11 .23 .15 —7. Egocentrism �.28 .29 �.18 .06 .10 �.06 —
M 5.8 2.8 �0.6 8.6 10.5 9.2 2.1SD 0.36 4.3 4.5 13.5 11.6 6.1 1.0Range 5.2–6.7 �5–10 �10–9 �20.7–38.7 �8.0–35.3 0–16 0–3
Note. N � 36.* p � .05.
55IN-GROUP FAVORITISM AND OUT-GROUP PREJUDICE
This
doc
umen
t is c
opyr
ight
ed b
y th
e A
mer
ican
Psy
chol
ogic
al A
ssoc
iatio
n or
one
of i
ts a
llied
pub
lishe
rs.
This
arti
cle
is in
tend
ed so
lely
for t
he p
erso
nal u
se o
f the
indi
vidu
al u
ser a
nd is
not
to b
e di
ssem
inat
ed b
road
ly.
coefficients are presented in Table 8 along with significance levelsbased on t tests. Once again, in-group attitudes were more consis-tently related to social cognitions than were out-group attitudes.Children evaluated their group more positively if they showed lessin-group homogeneity, more egocentrism, and more sorting intosingle-race piles. None of the social cognitions accounted forout-group evaluation.
General Discussion
Overall, the findings indicate that in-group favoritism was sig-nificantly related to out-group prejudice in the first sample but notthe second. Even when the correlation was significant, in-grouppositivity was sometimes associated with out-group positivity orneutrality, although it was more frequently associated with preju-dice. At this young age, in-group favoritism appeared to be devel-oping quickly and strongly, whereas out-group prejudice changedmore slowly and reached statistically significant levels only among5-year-olds in one sample. Furthermore, attitudes toward in-groupand out-group appeared to be associated with different social
cognitions. Although these data came from only two Canadiansamples, they demonstrate that at an age when children are begin-ning to form racial attitudes, in-group attachment is their primaryconcern. Out-group members suffer more from comparison thanfrom outright hostility.
Reciprocal Nature of In-Group and Out-Group Attitudes
The first sample of children, who came from a relatively homo-geneous school, showed a reciprocal relation between in-group andout-group attitudes; children who were, on balance, more positiveto their in-group were most likely to hold negative attitudes towardthe out-group. Children from the mixed-race school did not con-sistently hold reciprocal attitudes; positive-in-group children wereequally divided in their attitudes toward the out-group. Therefore,at this age, children are capable of possessing highly positivein-group attitudes and only slightly less positive, rather than neg-ative, out-group attitudes. Theories assuming an automatic trans-lation of in-group favoritism to out-group prejudice on the basis ofuniversal motives to maximize distinctiveness or derive positivecomparisons need to be modified.
The difference in findings between the two samples points to theneed to consider different routes by which children develop out-group attitudes. Children in the first sample, who had little per-sonal experience with out-group members, may have used theirin-group attachment as a reference by which to evaluate otherswho looked different. In contrast, those who had personal experi-ence with out-group peers may have instead used their experiencesto develop more balanced and independent out-group evaluations.
An examination of the four Valence � Target indices availablefrom the MRA highlights the basis of reciprocal in-group/out-group evaluations when they occur. Children in the sample thatshowed a reciprocal relation tended to assign more of the 10negative traits to the out-group if they assigned most of the 10positive ones to their own group, whereas the sample that showedindependent attitudes did not. On the other hand, both samplesshowed a fairly consistent tendency to assign more of the positivetraits to the out-group if they assigned more negative traits to theirown group. The latter two indices appear to reflect tolerance andintroduce a more balanced attitude by countering the indicesknown to reflect bias (i.e., positive in-group traits and negativeout-group traits). One may speculate that if in-group attitudes are
Table 6Intercorrelations Among In-Group and Out-Group Evaluations With Age Partialed Out
Evaluation
In-group evaluation Out-group evaluation
Positive Negative D score Positive Negative D score
In-groupPositive —Negative �.24 —D score .63** �.90** —
Out-groupPositive .21 .53** �.33** —Negative .07 .35* �.25 �.09 —D score .10 .15 �.08 .77** �.70** —
Note. The D score represents the difference between positive and negative assignments.* p � .05. ** p � .01.
Table 7Means, Standard Deviations, and Ranges for Attitude and SocialCognition Measures
Variable M SD Range
Attitudes
Composite MRA 3.4 6.4 �10–20In-group evaluation 2.8 4.3 �5–10Out-group evaluation �0.6 4.5 �10–9
% negative (from �1 to �10) 38.9Positive White 8.7 1.9 3–10Negative White 5.9 3.5 0–10Positive Black 7.0 3.3 0–10Negative Black 7.6 2.9 1–10
Social cognitions
In-group homogeneity 8.6 13.5 �20.7–38.7Out-group homogeneity 10.5 11.6 �8.0–35.3Race-segmented sorting 9.2 6.1 0–16Egocentrism 2.1 1.0 0–3
Note. MRA � Multiresponse Racial Attitude measure.
56 ABOUD
This
doc
umen
t is c
opyr
ight
ed b
y th
e A
mer
ican
Psy
chol
ogic
al A
ssoc
iatio
n or
one
of i
ts a
llied
pub
lishe
rs.
This
arti
cle
is in
tend
ed so
lely
for t
he p
erso
nal u
se o
f the
indi
vidu
al u
ser a
nd is
not
to b
e di
ssem
inat
ed b
road
ly.
indeed psychologically primary (Allport, 1954), it is children’srealistic acknowledgment of negative in-group qualities that di-rects their attention to the potential positive qualities of out-groupmembers. These evaluations may be appropriate to target in child-hood interventions (Aboud & Doyle, 1996). Another focus in suchinterventions would be to support the disengagement of negativeout-group evaluations from positive in-group evaluations.
In-Group Favoritism
The second hypothesis was largely confirmed in that in-groupfavoritism, once it appeared at 5 years of age, exceeded out-groupprejudice. It was present in 64%–77% of children who were 5years old and older and was significantly greater than neutrality atthis age.
Of the social and cognitive variables associated with in-groupfavoritism, group self-identification was the weakest (see alsoBennett et al., 1998). By 4 years of age, most children had reacheda ceiling, with scores of 1.9 out of 2; thus they knew they wereWhite Canadian and not Black Canadian but did not yet show anin-group preference. These children would presumably develop anin-group preference shortly, but self-identification by itself did nottrigger it. As measured here, both self-identification and recogni-tion of group membership may have been unable to explain atti-tude differences simply because they were too easy and lackedvariation. However, in-group favoritism was higher among thosewith poor conservation (Study 1), those with less perceived in-group homogeneity, those who did more sorting into single-racepiles, and those who showed egocentric superiority (Study 2).Generally, these correlates were distinctively associated with in-group attitudes, except for conservation, which in the first studywas associated with less positive in-group attitudes and nonsig-nificantly more positive out-group attitudes. Conservation appearsto overwhelm other cognitions in explaining individual variation inattitudes when the sample includes conservers and nonconservers(e.g., Clark et al., 1980). Other variables became relevant in thesecond study, which included only 1 nonconserver.
In-group homogeneity is generally lower than out-group homo-geneity (Brewer & Brown, 1998), but it was surprising to find thatthose with less in-group homogeneity, or more differentiationamong individuals, were more favorable to the whole in-group.Thus, at this age, in-group differentiation operated, like out-groupdifferentiation has with older children (e.g. Katz et al., 1975), toenhance positive evaluation. Also, children who placed more pic-
tures of people into single-race piles showed greater in-groupattachment but not out-group prejudice. The inference is thatalthough the simple form of categorization and self-identification,as manipulated in minimal-group teams, did not explain variationin attitudes (except on the forced-choice PRAM, to be discussedlater), the more commonly measured form of categorization did,entailing both racial segmentation and within-group differentiation(Brewer & Brown, 1998).
Egocentric superiority was related here to in-group but notout-group evaluation; children who said that their own in-grouppreferences were the only right ones were more likely to havehighly positive in-group scores. Similarly, those who were unableto conserve quantities had stronger in-group favoritism. Thus,developmentally immature ways of thinking were associated withthe early formation of in-group attachment.
Conversely, those who judged a different preference to be asvalid as their own had, on balance, less positive in-group attitudesbut not lower out-group prejudice. Acknowledging the validity ofopposing perspectives may first be experienced with in-groupmembers who disagree and may lead children to question theiregocentric assumption of in-group superiority (i.e., “Everyoneagrees that my group is the best”; Augoustinos & Rosewarne,2001). On the same note, appreciating that two different perspec-tives can both be right may require an ability to distinguishbetween appearances and evaluation; that is, where appearancesare different, evaluations may be the same, and vice versa (Aboud,1981). A similar ability underlies conservation, which was alsoassociated with less in-group favoritism here and elsewhere (Clarket al., 1980). This ability may be one of the first to make childrenaware that one group can be both good and bad—an awareness thatis applied to their own group before being applied to an out-group.
To the extent that the PRAM reflected in-group rather thanout-group attitudes, many of these correlations were replicatedwith it. In fact, the PRAM was correlated significantly with all butthe self-identification measure. Higher PRAM scores were foundamong those who recognized peers as group members, perceivedhigh homogeneity among out-group members and low homogene-ity among in-group members, could not conserve, and were unableto use two or more attributes to classify people. With these kindsof results, one can see why the measure has been cited as supportfor the categorization hypotheses. Perhaps because it confoundsin-group and out-group attitudes, it capitalizes on the correlates ofboth. However, with 70% of children scoring in the 9–12 range,
Table 8Summary of Simultaneous Regression Analyses for Social Cognition Predictors of Attitudes(N � 36)
Variable
In-group evaluation Out-group evaluation
B SE � B SE �
Group homogeneity �.15 .05 �.48** �.03 .07 �.07Race-segmented sorting .24 .10 .34** �.08 .13 �.11Egocentric superiority 1.42 .59 .34** �.79 .76 �.18
Note. For in-group evaluations, R2 � .35 ( p � .01); for out-group evaluations, R2 � .05 (ns). In-grouphomogeneity was used as the predictor of in-group evaluation, and out-group homogeneity as the predictor ofout-group evaluation.** p � .01 (one-tailed significance using t test of coefficient).
57IN-GROUP FAVORITISM AND OUT-GROUP PREJUDICE
This
doc
umen
t is c
opyr
ight
ed b
y th
e A
mer
ican
Psy
chol
ogic
al A
ssoc
iatio
n or
one
of i
ts a
llied
pub
lishe
rs.
This
arti
cle
is in
tend
ed so
lely
for t
he p
erso
nal u
se o
f the
indi
vidu
al u
ser a
nd is
not
to b
e di
ssem
inat
ed b
road
ly.
the cognitive variables might be distinguishing between very highand moderate in-group favoritism.
Out-Group Prejudice
The weak levels of out-group prejudice, though significantlygreater than neutrality among 5-year-olds in the first study, under-line the importance of treating out-group bias separately fromin-group bias. When analyzed separately from in-group favoritism,prejudice did not appear until 5 years of age, thus challengingfindings based on the PRAM that out-group prejudice appears atage 3 (Katz & Kofkin, 1997). None of the hypothesized predictors,such as perceived out-group homogeneity, single-race sorting, oregocentric superiority, was significantly associated with out-groupattitudes. These variables appeared to be related as expected toage, to show appropriate variation, and to correlate with in-groupattitudes. However, if the age-appropriate task for young childrenis to develop an in-group attachment, then social cognitions maybe used to facilitate this goal. If struggling with out-group attitudesis a more salient developmental task for children in middle child-hood, then social and cognitive variables might show a strongerlink to out-group attitudes at that age. Although none of Brewer’s(1999) suggestions for predictors of out-group prejudice weresupported here, it would be fair to say that their childhood formmight be more benign than their adult form: Egocentrism mayhave led children to infer that people who held a different per-spective were wrong; but without any moral tone, the inference didnot translate into a negative evaluation. Moreover, even childrenwho organized more photos of people into single-race piles rarelydichotomized; rather, they made single or multiple groups.
Despite the weaker levels of out-group prejudice than of in-group favoritism in this young age group, one can still argue thatout-group prejudice is unnecessarily high and detrimental to boththe experiencer and the target of prejudice. In many aspects ofliving, children will make choices of whom to play with, to workwith, and to talk to on the basis of a comparison. Among childrenolder than 5 years, the preference is strongly for in-group mem-bers. Thus, in aspects of life where in-group alternatives areavailable, out-group members are less likely to receive positiverecognition. Second, despite the nonsignificance of out-group prej-udice levels in one of the two samples, a great many negativeevaluations were actually made of the out-group. Reviews ofmulticultural programs emphasize how difficult these are tochange (Bigler, 1999). Finally, although I did not use a no-information control target, Singh et al. (1998) found that theirsubjects assumed that the control was an in-group member. Thus,the proper comparison standard may be the in-group rather thanneutrality.
Sociocultural and Methodological Issues
The limitations of this study mainly concern (a) the sociocul-tural nature of the samples and (b) the attitude measure. Thechildren in these samples, who live in an environment character-ized as multiethnic and bilingual, may not have the same stereo-types or status expectations about White and Black people as dochildren living in the United States and watching American tele-vision (Graves, 1999). Therefore, prejudice may develop later andbe lower in this sample than in some U.S. locations. However, the
level of in-group favoritism should not differ if it is a develop-mentally valuable process rather than a sociocultural or conflict-based one (Brewer, 1999; Cameron et al., 2001).
The MRA, while going well beyond past measures in partiallydecoupling in-group and out-group attitudes, may still be criticizedfor not encouraging a none or a neither response and for notseparating in-group and out-group further into two separatelypresented targets (Cameron et al., 2001). However, neither of theseoptions is particularly feasible with children as young as 5 years,and no reliable or valid alternative currently exists. A review of 15studies published since 1980 with 5-year-olds and 9 studies withchildren from 6 to 12 years old revealed that most of the studieseither presented racial/ethnic targets together and asked the childto consider whether one or more than one fit the given description(Averhart & Bigler, 1997; Bigler & Liben, 1993; Black-Gutman &Hickson, 1996; Doyle & Aboud, 1995; Doyle et al., 1988) orforced the choice of only one (Corenblum & Annis, 1993; Katz &Kofkin, 1997; Kowalski & Lo, 2001; Ramsey, 1991). Perhaps abetter option is to present targets separately, one at a time (Aboud,1980; Augoustinos & Rosewarne, 2001; Bar-Tal, 1996; Holmes,1995; Semaj, 1980; Teichman, 2001). The major benefit of aseparate presentation is the complete decoupling of the targetsbeing evaluated. However, either the out-group would have to bepresented first or the child would have to be given some warningthat in-group and out-group targets were to be evaluated. Other-wise, in-group targets would be evaluated on the basis of theirunique individual features rather than their group membership(Kinket & Verkuyten, 1999). The concern about using a simulta-neous presentation is that it might heighten intergroup compari-sons, but this has not been supported in research on adolescents oradults (Mummendey, Klink, & Brown, 2001).
Concerning evaluation and response format, most measures inprevious studies included from 6 to 10 positive and an equalnumber of negative traits to be considered separately (Augoustinos& Rosewarne, 2001; Averhart & Bigler, 1997; Bigler & Liben,1993; Black-Gutman & Hickson, 1996; Corenblum & Annis,1993; Doyle & Aboud, 1995; Doyle et al., 1988; Katz & Kofkin,1997; Semaj, 1980). A few studies simply elicited spontaneousevaluations with open-ended questions (Holmes, 1995; Teichman,2001); but a response that depends too much on drawing skill,verbal fluency, or recall may not accurately reflect young chil-dren’s attitudes (Lerner & Schroeder, 1975). Similarly, the use ofonly positive evaluations, such as liking (Aboud, 1980; Kowalski& Lo, 2001; Teichman, 2001), is problematic because item-response analyses on the MRA items indicated that positive itemsdiscriminated less among those with different in-group and out-group scores than did negative items (Ramsay, 2000). Because ofthe concern that children may be reluctant to evaluate peoplenegatively, in particular their own group, Kowalski (2002) pro-vided a miniature “trash can” into which children could thrownegative items they thought applied to none (similar to Davey’s,1983, “Nobody Box”). The lack of such an explicit option in thepresent investigation may have meant that children assigned morenegative items to out-group stimuli than they would have with theoption. However, the concern has always been that social desir-ability will motivate children to avoid negative evaluations. Onemight reasonably ask why many White children in the presentsample avoided assigning negative qualities to in-group membersstarting at the age of 5 years, particularly when they would have
58 ABOUD
This
doc
umen
t is c
opyr
ight
ed b
y th
e A
mer
ican
Psy
chol
ogic
al A
ssoc
iatio
n or
one
of i
ts a
llied
pub
lishe
rs.
This
arti
cle
is in
tend
ed so
lely
for t
he p
erso
nal u
se o
f the
indi
vidu
al u
ser a
nd is
not
to b
e di
ssem
inat
ed b
road
ly.
seen more of these qualities among in-group members at that age.Research shows that when friends talk with each other about raceevaluations, the more persuasive ones voice the belief that allgroups can harbor negative characteristics (Aboud & Doyle,1996).
Finally, the psychometric properties of most measures havebarely been addressed in published papers. Alpha coefficientsshowing internal reliability of multi-item measures range from .55to .91 (Averhart & Bigler, 1997; Black-Gutman & Hickson, 1996;Corenblum & Annis, 1993; Doyle & Aboud, 1995). Besides theMRA, only the PRAM has published test–retest reliability. Fur-thermore, the MRA has solid evidence of validity, whereas thisinformation is lacking for other measures.
In conclusion, according to several criteria, in-group and out-group attitudes appeared to be distinct in our samples of Whitechildren under 7 years of age. In-group favoritism developedat an earlier age and reached higher levels in a larger proportionof the children than did out-group attitudes. In-group favoritismbut not out-group prejudice was associated with lower perceivedgroup homogeneity, higher single-race grouping, and higheregocentrism.
ReferencesAboud, F. E. (1980). A test of ethnocentrism with young children. Cana-
dian Journal of Behavioral Science, 12, 195–209.Aboud, F. E. (1981). Egocentrism, conformity, and agreeing to disagree.
Developmental Psychology, 17, 791–799.Aboud, F. E. (1988). Children and prejudice. New York: Blackwell.Aboud, F. E., & Amato, M. (2001). Developmental and socialization
influences on intergroup bias. In R. Brown & S. Gaertner (Eds.),Blackwell’s handbook of social psychology: Intergroup processes (pp.65–85). Malden, MA: Blackwell.
Aboud, F. E., & Doyle, A. B. (1996). Does talk of race foster prejudice ortolerance in children? Canadian Journal of Behavioral Science, 28,161–170.
Aboud, F. E., & Fenwick, V. (1999). Exploring and evaluating school-based interventions to reduce prejudice. Journal of Social Issues, 55,767–786.
Aboud, F. E., Mendelson, M. J., & Purdy, K. T. (in press). Cross-race peerrelations and friendship quality. International Journal of BehavioralDevelopment.
Aboud, F. E., & Mitchell, F. G. (1977). Ethnic role taking: The effects ofpreference and self-identification. International Journal of Psychol-ogy, 12, 1–17.
Allport, G. W. (1954). The nature of prejudice. Cambridge, MA: Addison-Wesley.
Arlin, P. K. (1981). Piagetian tasks as predictors of reading and mathreadiness in grades K-1. Journal of Educational Psychology, 73, 712–721.
Augoustinos, M., & Rosewarne, D. L. (2001). Stereotype knowledge andprejudice in children. British Journal of Developmental Psychology, 19,143–156.
Averhart, C. J., & Bigler, R. S. (1997). Shades of meaning: Skin tone,racial attitudes, and constructive memory in African American children.Journal of Experimental Child Psychology, 67, 368–388.
Bar-Tal, D. (1996). Development of social categories and stereotypes inearly childhood: The case of “the Arab” concept formation, stereotypeand attitudes by Jewish children in Israel. International Journal ofIntercultural Relations, 20, 341–370.
Bennett, M., Lyons, E. J., Sani, F., & Barrett, M. (1998). Children’ssubjective identification with the group and in-group favoritism. Devel-opmental Psychology, 34, 902–909.
Bigler, R. S. (1999). The use of multicultural curricula and materials tocounter racism in children. Journal of Social Issues, 55, 687–705.
Bigler, R. S., Brown, C. S., & Markell, M. (2001). When groups are notcreated equal: Effects of group status on the formation of intergroupattitudes in children. Child Development, 72, 1151–1162.
Bigler, R. S., & Liben, L. S. (1993). A cognitive-developmental approachto racial stereotyping and reconstructive memory in Euro-Americanchildren. Child Development, 64, 1507–1519.
Black-Gutman, D., & Hickson, F. (1996). The relationship between racialattitudes and social-cognitive development in children: An Australianstudy. Developmental Psychology, 32, 448–456.
Brewer, M. B. (1979). In-group bias in the minimal intergroup situation: Acognitive-motivation analysis. Psychological Bulletin, 86, 307–324.
Brewer, M. B. (1999). The psychology of prejudice: In-group love orout-group hate? Journal of Social Issues, 55, 429–444.
Brewer, M. B., & Brown, R. J. (1998). Intergroup relations. In D. T.Gilbert, S. T. Fiske, & G. Lindzey (Eds.), The handbook of socialpsychology (Vol. 2, pp. 554–594). New York: McGraw-Hill.
Brown, R. (1995). Prejudice: Its social psychology. Cambridge, MA:Blackwell.
Cameron, J. A., Alvarez, J. M., Ruble, D. N., & Fuligni, A. J. (2001).Children’s lay theories about in-groups and out-groups: Reconceptual-izing research on prejudice. Personality and Social Psychology Re-view, 5, 118–128.
Clark, A., Hocevar, D., & Dembo, M. H. (1980). The role of cognitivedevelopment in children’s explanations and preferences for skin color.Developmental Psychology, 16, 332–339.
Corenblum, B., & Annis, R. C. (1993). Development of racial identity inminority and majority children: An affect discrepancy model. CanadianJournal of Behavioural Science, 25, 499–521.
Davey, A. (1983). Learning to be prejudiced: Growing up in multi-ethnicBritain. London: Edward Arnold.
Doyle, A. B., & Aboud, F. E. (1995). A longitudinal study of Whitechildren’s racial prejudice as a social cognitive development. Merrill-Palmer Quarterly, 41, 210–229.
Doyle, A. B., Beaudet, J., & Aboud, F. E. (1988). Developmental patternsin the flexibility of children’s ethnic attitudes. Journal of Cross-CulturalPsychology, 19, 3–18.
Graves, S. B. (1999). Television and prejudice reduction: When doestelevision as a vicarious experience make a difference? Journal of SocialIssues, 55, 707–725.
Gulko, J., Doyle, A. B., Serbin, L., & White, D. (1988). Conservationskills: A replicated study of order of acquisition across tasks. Journal ofGenetic Psychology, 149, 425–440.
Holmes, R. M. (1995). How young children perceive race. Thousand Oaks,CA: Sage.
Katz, P. A., & Kofkin, J. A. (1997). Race, gender, and young children. InS. S. Luthar, J. A. Burack, D. Cicchetti, & J. Weisz (Eds.), Develop-mental psychopathology: Perspectives on adjustment, risk, and disorder(pp. 51–74). New York: Cambridge University Press.
Katz, P. A., Sohn, M., & Zalk, S. R. (1975). Perceptual concomitants ofracial attitudes in urban grade-school children. Developmental Psychol-ogy, 11, 135–144.
Kinket, B., & Verkuyten, M. (1999). Intergroup evaluations and socialcontext: A multilevel approach. European Journal of Social Psychol-ogy, 29, 219–237.
Kowalski, K. (2002). The emergence of ethnic/racial attitudes inpreschool-age children. Manuscript submitted for publication.
Kowalski, K., & Lo, Y-F. (2001). The influence of perceptual features,ethnic labels, and sociocultural information on the development ofethnic/racial bias in young children. Journal of Cross-Cultural Psychol-ogy, 32, 444–455.
Lerner, R. M., & Schroeder, C. (1975). Racial attitudes in young White
59IN-GROUP FAVORITISM AND OUT-GROUP PREJUDICE
This
doc
umen
t is c
opyr
ight
ed b
y th
e A
mer
ican
Psy
chol
ogic
al A
ssoc
iatio
n or
one
of i
ts a
llied
pub
lishe
rs.
This
arti
cle
is in
tend
ed so
lely
for t
he p
erso
nal u
se o
f the
indi
vidu
al u
ser a
nd is
not
to b
e di
ssem
inat
ed b
road
ly.
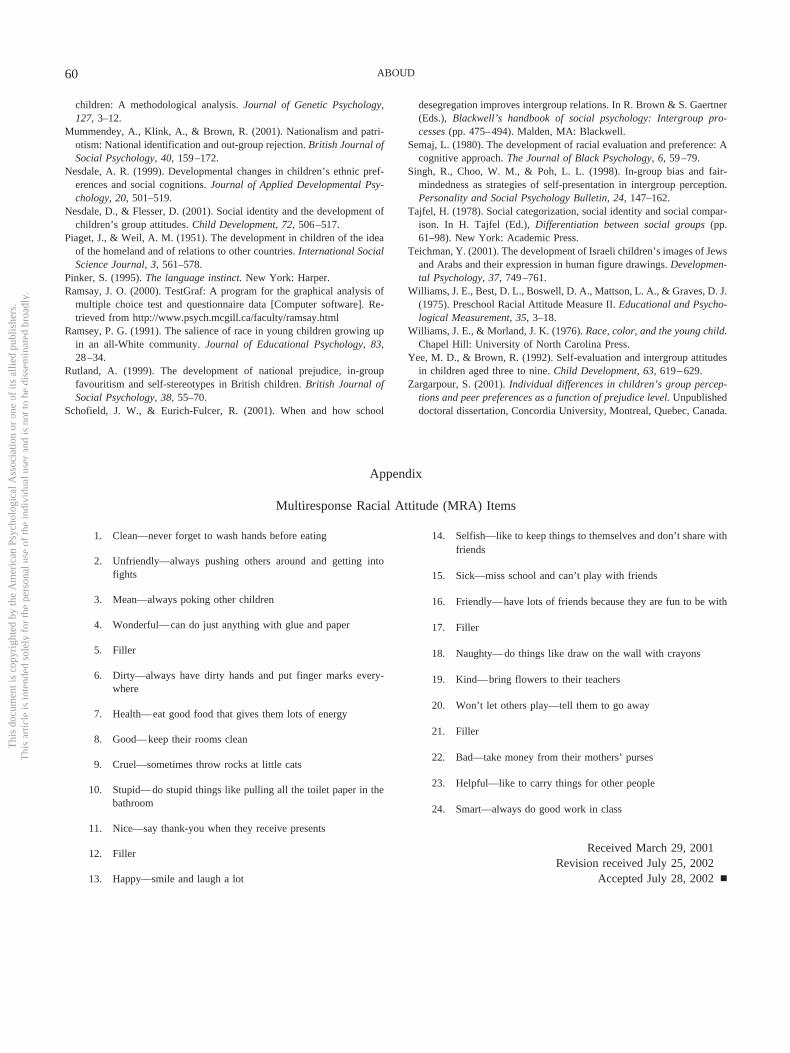
children: A methodological analysis. Journal of Genetic Psychology,127, 3–12.
Mummendey, A., Klink, A., & Brown, R. (2001). Nationalism and patri-otism: National identification and out-group rejection. British Journal ofSocial Psychology, 40, 159–172.
Nesdale, A. R. (1999). Developmental changes in children’s ethnic pref-erences and social cognitions. Journal of Applied Developmental Psy-chology, 20, 501–519.
Nesdale, D., & Flesser, D. (2001). Social identity and the development ofchildren’s group attitudes. Child Development, 72, 506–517.
Piaget, J., & Weil, A. M. (1951). The development in children of the ideaof the homeland and of relations to other countries. International SocialScience Journal, 3, 561–578.
Pinker, S. (1995). The language instinct. New York: Harper.Ramsay, J. O. (2000). TestGraf: A program for the graphical analysis of
multiple choice test and questionnaire data [Computer software]. Re-trieved from http://www.psych.mcgill.ca/faculty/ramsay.html
Ramsey, P. G. (1991). The salience of race in young children growing upin an all-White community. Journal of Educational Psychology, 83,28–34.
Rutland, A. (1999). The development of national prejudice, in-groupfavouritism and self-stereotypes in British children. British Journal ofSocial Psychology, 38, 55–70.
Schofield, J. W., & Eurich-Fulcer, R. (2001). When and how school
desegregation improves intergroup relations. In R. Brown & S. Gaertner(Eds.), Blackwell’s handbook of social psychology: Intergroup pro-cesses (pp. 475–494). Malden, MA: Blackwell.
Semaj, L. (1980). The development of racial evaluation and preference: Acognitive approach. The Journal of Black Psychology, 6, 59–79.
Singh, R., Choo, W. M., & Poh, L. L. (1998). In-group bias and fair-mindedness as strategies of self-presentation in intergroup perception.Personality and Social Psychology Bulletin, 24, 147–162.
Tajfel, H. (1978). Social categorization, social identity and social compar-ison. In H. Tajfel (Ed.), Differentiation between social groups (pp.61–98). New York: Academic Press.
Teichman, Y. (2001). The development of Israeli children’s images of Jewsand Arabs and their expression in human figure drawings. Developmen-tal Psychology, 37, 749–761.
Williams, J. E., Best, D. L., Boswell, D. A., Mattson, L. A., & Graves, D. J.(1975). Preschool Racial Attitude Measure II. Educational and Psycho-logical Measurement, 35, 3–18.
Williams, J. E., & Morland, J. K. (1976). Race, color, and the young child.Chapel Hill: University of North Carolina Press.
Yee, M. D., & Brown, R. (1992). Self-evaluation and intergroup attitudesin children aged three to nine. Child Development, 63, 619–629.
Zargarpour, S. (2001). Individual differences in children’s group percep-tions and peer preferences as a function of prejudice level. Unpublisheddoctoral dissertation, Concordia University, Montreal, Quebec, Canada.
Appendix
Multiresponse Racial Attitude (MRA) Items
1. Clean—never forget to wash hands before eating
2. Unfriendly—always pushing others around and getting intofights
3. Mean—always poking other children
4. Wonderful—can do just anything with glue and paper
5. Filler
6. Dirty—always have dirty hands and put finger marks every-where
7. Health—eat good food that gives them lots of energy
8. Good—keep their rooms clean
9. Cruel—sometimes throw rocks at little cats
10. Stupid—do stupid things like pulling all the toilet paper in thebathroom
11. Nice—say thank-you when they receive presents
12. Filler
13. Happy—smile and laugh a lot
14. Selfish—like to keep things to themselves and don’t share withfriends
15. Sick—miss school and can’t play with friends
16. Friendly—have lots of friends because they are fun to be with
17. Filler
18. Naughty—do things like draw on the wall with crayons
19. Kind—bring flowers to their teachers
20. Won’t let others play—tell them to go away
21. Filler
22. Bad—take money from their mothers’ purses
23. Helpful—like to carry things for other people
24. Smart—always do good work in class
Received March 29, 2001Revision received July 25, 2002
Accepted July 28, 2002 �
60 ABOUD
This
doc
umen
t is c
opyr
ight
ed b
y th
e A
mer
ican
Psy
chol
ogic
al A
ssoc
iatio
n or
one
of i
ts a
llied
pub
lishe
rs.
This
arti
cle
is in
tend
ed so
lely
for t
he p
erso
nal u
se o
f the
indi
vidu
al u
ser a
nd is
not
to b
e di
ssem
inat
ed b
road
ly.


![Discrimination and Favoritism in Bahrain [2005]](https://img.pdfslide.us/doc/110x75/577d28151a28ab4e1ea53356/discrimination-and-favoritism-in-bahrain-2005.jpg)