Embed Size (px)
Citation preview
Hometown favoritism and the quality of government
monitoring: Evidence from rotation of Chinese auditors
Jian Chu, Raymond Fisman, Songtao Tan, and Yongxiang Wang∗
This version: August 6, 2019
Abstract
Audits are a standard mechanism for reducing corruption in government investments. The
quality of audits themselves, however, may be a�ected by relationships between auditor and
target. We study whether provincial chief auditors in China show greater leniency in evaluating
prefecture governments in their hometowns. In city-�xed-e�ect speci�cations � in which the
role of shared background is identi�ed from auditor turnover � we show that hometown auditors
�nd 46 percent less in questionable monies per investigation. This hometown e�ect is similar
throughout the auditor's tenure, and is diminished for audits ordered by the provincial Organi-
zations Department as a result of the departure of top city o�cials. Collectively, we argue that
our �ndings are most readily explained by favoritism rather than an endogenous response by
local o�cials to concerns of better enforcement by hometown auditors. We complement these
city-level �ndings with �rm-level analyses of earnings manipulation by state-owned enterprises
via real activity manipulation (a standard measure from the accounting literature), which we
show is higher under hometown auditors.
JEL classi�cation: D73, G3, M42, H83
Keywords: Social Ties, Audit quality, State-owned enterprise, Government investment, China
∗Nanjing University, Boston University, Renmin University of China, and the University of Southern California.Rui Dong and Junkai Huang provided excellent RA work.
1

Conflict-of-interest Disclosure Statement
Jian Chu
I have nothing to disclose.
Raymond Fisman
I have nothing to disclose.
Songtao Tan
I have nothing to disclose
Yongxiang Wang
I have nothing to disclose.
1 Introduction
Public investment provides essential (and potentially very productive) public goods, such as trans-
port infrastructure and schools. At the same time, public investment may be particularly prone
to corruption (e.g., Tanzi and Davoodi (1998)). One common prescription to limit theft and/or
mismanagement of public projects is the threat of ex post evaluation and audit, which in turn raises
the concern that preexisting relationships between the auditor and those under investigation may
allow corrupt or inept o�cials to avoid detection and/or punishment. Thus, there is an emphasis
on the role of independent auditors to ensure e�ective enforcement (Dabla-Norris et al. (2012)).
While con�ict-of-interest rules restrict the most obvious relationships between monitor and
target, such as family ties and/or business relationships, less visible and/or more di�use ties may
nonetheless facilitate auditor-target collusion, or otherwise compromise the objectivity of oversight.
In this paper, we examine how such ties a�ect the �ndings of provincial audits of municipal fund
expenditures in China. We focus on the provincial chief auditor's city of birth as a source of
potential connection to audit targets. Hometown connections are a natural focus in our setting, as
such ties are a well-documented nexus of favor exchange in China (Fisman et al. (2018)), Vietnam
(Do et al. (2017)) and countries with weak institutions more generally (Hodler and Raschky (2014))
which, we argue, may lead to greater leniency in evaluations of �hometown� expenditures.
We explore this �hometown favoritism� hypothesis by looking at the outcomes of audits in
278 Chinese prefectures during the years 2006-2015. According to the Audit Law of the People's
Republic of China, evaluations are carried out � either directly or indirectly � by province-level audit
departments.1 The chief o�cers of province-level audit departments, like many top o�cials in China,
experience frequent rotation, providing plausible variation for identifying whether lead auditors
show greater leniency for audits of their hometown governments. In our preferred speci�cation
� which includes city �xed e�ects so that the hometown auditor e�ect is identi�ed from auditor
turnover � we �nd that audits turn up 46 percent fewer suspicious expenditures per audit when the
lead auditor is investigating his hometown (we do not �nd that a hometown auditor conducts fewer
audits).2
A natural alternative interpretation for this �nding is that expectation of more e�ective en-
forcement by hometown auditors leads to less questionable behavior. This explanation is premised
1In the case of indirect audits, the prefecture-level audit departments carry out the audits, supervisied by theprovince-level audit department. Major expenditures must be audited directly by the province-level audit department,according to the Audit Law. Even in cases in which the audit is carried out by the prefecture audit department, thecity's chief auditor reports directly to the province's chief auditor.
2We cannot distinguish between auditor-target corruption versus an auditor's preference for leniency towardhometown o�cials. In either case, investigations turn up little suspicious activity. This distinction is analogous tothe �active� versus �passive� waste in the corruption literature, which is rarely able to di�erentiate between the twowithout direct observation of bribery. See Bandiera et al. (2009) for an exception.
2
on the assumption that hometown o�cials have local knowledge or networks that allow them to
better detect suspicious activity and/or sanction it. Local government and SOE o�cials, antic-
ipating stronger enforcement, thus take care to avoid potential violations. We present a pair of
heterogeneity analyses, which collectively suggest that this �deterrence� explanation is unlikely to
account for our main �nding. First, we look at the hometown auditor e�ect as a function of his
tenure. Chief auditor assignments are made in each province by its Organization Department of the
Party Standing Committee (the province's highest authority). As we explain in the next section,
these appointments are governed by a range of considerations, and would be exceedingly di�cult for
prefecture-level bureaucrats (or indeed the chief auditors themselves) to predict. This uncertainty
in the assignment process implies that, in the earlier years of his tenure, a chief auditor oversees
evaluations of projects that were planned and implemented before local o�cials could anticipate the
arrival of a hometown auditor. Thus, if anticipation of strict enforcement were responsible for the
hometown e�ect, we would expect the hometown favoritism e�ect to be muted early in an auditor's
tenure. We do not, however, �nd any evidence of a di�erential e�ect in the auditor's �rst year, or
as a function of the auditor's tenure more generally.
We next examine whether the hometown auditor e�ect di�ers in years in which one of the city's
top two o�cials (the party secretary and the mayor) leaves o�ce. Central government regulation
dictates that, following such departures, audits be directly carried out by the provincial Audit De-
partment and overseen by the provincial Organization Department, the most powerful department
in the province (whose leader always serves on the the provincial Standing Committee), and also
the provincial Discipline Inspection Commission, the provincial division of the CPC Central Com-
mission for Discipline Inspection (CCDI). We argue that Organization Department and Discipline
Inspection Commission oversight will constrain the chief auditor, and as a result any hometown
favoritism will be attenuated in years of top o�cials' departures. Consistent with the disciplining
role of this higher-level oversight, the hometown auditor e�ect drops by nearly half in party secre-
tary and mayor turnover years (that is, we observe less hometown favoritism when one of the city's
top two o�cials leaves o�ce).
Finally, we complement our city-year analyses with �rm-level analyses on earnings manipulation
at state-owned enterprises. Since state-owned enterprises also fall under the purview of provincial
auditors, we examine whether questionable accounting practices are more common in the presence
of a hometown auditor. We focus on earnings management through real activities manipulation
(RAM). In the paper that develops this measure, Roychowdhury (2006) suggests that it captures
�rms' use of price discounts to temporarily boost sales, overproduction to report lower cost of goods
sold, and reduced discretionary expenditures to improve reported margins (Roychowdhury (2006)
further shows that �rms deploy such techniques to meet analyst earnings expectations).
3
The SOE analyses complements our main results on government audits in several ways. First,
our RAM analyses further serve to assess whether the hometown audit e�ect is the result of fa-
voritism or anticipated enforcement. In contrast to audit outcomes, in which favoritism and deter-
rence yield the same prediction, for real activities manipulation the two theories generate opposing
predictions: In the presence of a lenient auditor, a �rm will engage in more questionable accounting
practices, whereas anticipation of greater scrutiny will lead �rms to avoid accounting red �ags.
Second, our SOE sample allows for a more disaggregated analysis, so we may better account for
attributes of potential audit targets. Third, it allows us to examine whether the hometown audit
e�ect manifests itself in public expenditure audits as well as evaluations of quasi-public state en-
terprises (which, in our sample, are partially privatized). Our analyses of earnings manipulation in
state-owned �rms reinforces the view that auditors show greater leniency toward hometown o�cials:
RAM is on average about a �fth of a (within-�rm) standard deviation higher in the presence of a
hometown auditor. This result survives the inclusion of city- as well as �rm �xed-e�ects.
Our work contributes to several related literatures that collectively aim to understand the im-
pediments to e�ective oversight of both public projects and private �rms. In particular, a sizeable
literature in accounting and �nance focuses on the monitoring role of external auditors, and em-
phasizes the potential con�icts that result from ties between a �rm's leadership and and ostensibly
independent auditors. He et al. (2017), for example, show for a sample of Chinese �rms that audit
quality is poorer when external auditors share school ties with audit committee members, and a
large number of earlier papers show that social ties between executives and external auditors sim-
ilarly impair the quality of external auditors' work (see, e.g., Guan et al. (2016) for China, and
Baber et al. (2014) for the U.S.).
These papers focus exclusively on oversight of private �rms by outside monitors that are e�ec-
tively hired on behalf of shareholders to monitor its agents (i.e., the executive), and highlight the
potential con�icts that arise when executives and the board play a role in monitor selection. A
closely related set of concerns arise with the hiring of so-called third party auditors, to monitor
�rms' compliance with national laws and regulations. As observed by Du�o et al. (2013), third-
party auditors are also often hired by the �rm, which creates a similar set of con�icts of interest as
for external auditors.
To our knowledge, we are the �rst to study potential con�icts in monitoring by government
auditors. Our setting is quite distinct from the oversight of private �rms � whether by external
auditors to monitor shareholders' interests or third-party auditors to monitor regulatory compliance
� examined in earlier work. We look at monitors selected by independent bureaucrats who should
be less subject to the con�icts of interest that a�ict a �rm's executive or board. Furthermore,
our focus on oversight of public rather than private activities has distinct political economy and/or
4
welfare implications.
Given our focus on hometown connections, we also contribute to the literature on the role of
social ties in the functioning of bureaucracies in general and in China in particular. This literature
has generally emphasized favoritism as the dominant force (e.g., Fisman et al. (2018) and others),
though Fisman et al. (2019) and Fisman et al. (2017) emphasize that other considerations � whether
better information, enforcement or other concerns � may also play an important role in some
settings.
Finally, our �nding that social ties are associated with greater leniency in oversight has direct
policy implications for the design of con�ict-of-interest rules. In general, there is a tradeo� in
restricting well-connected candidates from monitoring positions: a locally-connected monitor may
have better information or ability to enforce compliance than an outsider, an advantage that needs
to be weighed against the costs of potential favoritism. Our results suggest that favoritism may
be a dominant factor in our setting, which provides a rationale for the existence of rules against
assignment to one's home region precisely to reduce the potential for collusion and/or self-dealing
(see Fisman et al. (2017)). Furthermore, our results suggest potential future directions for the
growing body of work that uses the results of external audits to study accountability and corruption
(e.g., Ferraz and Finan (2008),Ferraz and Finan (2011) Gerardino et al. (2017), and Avis et al.
(2018)). These studies take audit reports themselves as uncorrupted, whereas we highlight the fact
that audits themselves might be subject to bias.
2 Background and Data
2.1 Monitoring and evaluation of Chinese municipal governments
The system of oversight for Chinese governments' revenues and expenditures was delineated in the
Constitution of the People's Republic of China, adopted in 1982. The Constitution stipulated the
creation of a central government body, estabilshed by the State Council, to �supervise through
auditing the revenue and expenditure of all departments under the State Council and of the lo-
cal governments at various levels, and the revenue and expenditure of all �nancial and monetary
organizations, enterprises and institutions of the state� (Article 91 of the Constitution). The Consti-
tution further required that local governments also establish auditing organs. These were required
for governments at the county-level (one level below prefecture/city) and higher. Article 109 of the
Constitution speci�ed that, �the local auditing organs...should report to the corresponding local
government and also auditing organs at the higher level.� That is, the audit department at the
county level was mandated to report to the prefecture-level audit department (in addition to report-
5
ing to the county government), the prefecture audit department to the provincial audit department
(and also the prefecture government), and so forth. Thus, from the initial establishment of China's
governmental audit system, the provincial audit chief's direct authority over the prefectural audit
chief has been codi�ed in law.
The laws contained in the 1982 Constitution also led to the formal establishment of the Na-
tional Audit O�ce of the People's Republic of China in September, 1983, which is a cabinet-level
ministry, one of twenty-six such departments that comprise the State Council, China's chief admin-
istrative body. Among other responsibilities, the National Audit O�ce supervises provincial audit
o�ces throughout the country. By the end of 1983, all provinces had established their own Audit
Departments, with the exception of Fujian and Guangxi, which established theirs in 1984.
The laws formalizing the roles and responsibilities of audit o�ces at various levels were not put
in place until the passage of the 1994 Audit Law, which went into e�ect on January 1, 1995. The
audit law was substantially revised in February 2006, so as to give expanded responsibilities to
each audit o�ce. In particular, the law speci�ed that the local o�ce was required to audit all local
government branches and local SOEs, and also that the local chief audit o�cer would be selected
by the local Party Standing Committee. More importantly (and of particular relevance for our
setting), Article 16 of the law speci�ed that a local audit o�ce has the authority to directly audit
lower-level government sectors and SOEs (that is, the provincial audit o�ce has the authority to
audit any prefectural government department and any SOE controlled by the prefecture.)
In general, provincial auditors tend to focus primarily on more signi�cant audits. While there is
no formal delineation of investigations of municipal expenditures conducted at the prefecture- versus
provincial-level, a review of the practices of several provinces (Hunan, Jiangsu, Sichuan) suggests a
few commonalities. Provincial auditors generally audit the implementation of the �scal budgeting
(revenues and expenditures) of prefecture government departments. Furthermore, when an entire
sector (e.g., the �nance industry or public utilities) faces an audit across the entire province, it is
managed by the provincial audit department, as it requires coordination across multiple prefectures.
Larger individual investments in �xed assets, such as roads or buildings, may fall under the purview
of provincial auditors. SOEs owned by the provincial government are also overseen by the provincial
auditor, rather than the prefectural auditor in the city where the SOE is located. Furthermore, the
provincial Party Standing Committee can order �special audits� at its discretion, which provides
wide latitude for the provincial audit o�ce in its oversight of prefectures.
Finally, the departure of top prefecture o�cials, by law, automatically triggers an audit by the
provincial audit o�ce.3 More speci�cally, the government responsibilities or sectors under direct
3This requirement was put in place for county-level leaders in the Interim Provisions on the Audit of Economic
Responsibilities of Party and Government Leading Cadres at the County Level in May 1999. An expansion of these
6
supervision of the departing o�cer are targeted for provincial audit. For the mayor, the prefecture
government's o�ce would be audited, as well as any other sectors or departments assigned to him
for supervision. For example, if the mayor were mainly in charge of the Education and Finance
Departments (not an unusual situation in Chinese cities), while the vice-mayor supervised the Price
and Policy Departments, then Finance and Education would be audited when the mayor departs,
but not Price and Finance. This audit cannot be undertaken by the prefecture o�ce, since top
prefecture o�cials outrank the prefecture's chief auditor. Crucially, audits conducted immediately
following the departure of one or both of the prefecture's chief o�cers also take place under the
leadership and guidance of the province's Organization Department, the highest administrative
body in the province. Thus, the provincial chief auditor has less discretion in his oversight of a
prefecture in the years of a city chief o�cer's departure.
2.2 Selection of the provincial audit chief
In each provincial audit department, the chief auditor is assisted by, on average, six vice-chief audit
o�cers. It is possible for any government o�cials with the same rank as, or one level below, the
provincial audit chief to be selected as a chief auditor. We obtained the name of each provincial chief
auditor from the audit yearbooks, and hand-collected information on the last job title/position for
each individual. Many chief auditors held lower-level positions as auditors or �nance/tax o�cials
within the same province: 30 percent of provincial chief auditors were provincial vice-chief auditors
immediately before their appointments (which is de�ned as PastAuditor); 15 percent came from the
provincial Finance Department or Tax Bureau, either as vice-chief o�cer (thus the appointment
was a promotion) or chief o�cer (so that the appointment to chief auditor was a lateral move),
which is de�ned as PastFinance. However, many also come from less closely aligned branches of
the bureaucracy: 18 percent served as the vice-chief or chief o�cer4 of a prefecture within the
province, which is de�ned as PastCityLeader ; 5 percent came from the provincial Commission for
Discipline Inspection or provincial Supervision Department, as vice-chief o�cer (PastDiscipline).5
The remaining 32 percent came from di�erent departments within the provincial government (e.g.,
the Education Department, Price Department) or the central government.
The chief auditor is appointed by the provincial Standing Committee (subject to the rubber
stamp approval of the provincial People's Congress). The timing of the appointment is itself un-
provisions were implemented in January 1, 2005, that extended the audit requirements to o�cials with ranks up tothat of mayor (Ting Ju Ji in Chinese Pinyin). See theOpinion on Expanding the Scope of the Economic Responsibility
Audit of Party and Government Leading Cadres to the Level of the Ting Ju Ji, released Nov 24, 2004.4That is, vice-mayor, mayor, party secretary, or vice-party-secretary.5For all but the largest prefectures, the provincial chief auditor has the same rank as the prefecture mayor or
party secretary, so that the appointment of a prefectural chief o�cer as provincial chief auditor would be seen as alateral move, whereas for vice-chief o�cers it would be a promotion.
7
certain, as it depends on the career opportunities of the incumbent chief auditor, who may be
promoted by the provincial Standing Committee to higher o�ce. Furthermore, as the distribution
of successors makes clear, there is a wide range of candidates for the position � even for the 30
percent that are provincial vice-chief auditors, the provincial Standing Committee has 6 candidates
to choose among. Overall, both the timing of turnover and the identity of the successor for the
chief auditor position would be di�cult for prefectural o�cials to anticipate, a point we return to
below.
2.3 Data
The main outcome variables throughout come from public records of prefecture-level audits, recorded
in China Audit Yearbooks. Since 2003, these annual publications have included the number of audit
assignments undertaken and the amount of questionable monies uncovered, aggregated to the city-
level. We utilize the years 2006 to 2015 as the investigations covered by the yearbooks expanded
substantially in 2006.6
Our hand-collected audit data are complemented by hand-collected information on the back-
ground of each provincial chief audit o�cer, using a range of sources, including the China Audit
Yearbooks, o�cial websites of each provincial Audit O�ce, and as needed the website Baidu (China's
Google). Using these sources, we were able to identify the birth city of the full set of 61 provin-
cial chief auditors in our data. We use these background characteristics to generate the following
o�cer-level controls: years as chief auditor (Tenure), age, gender, dummy variables to denote the
department of the o�cial's previous position (PastAuditor, PastFinance, PastCityLeader, PastDis-
cipline), and education category variables to capture highest degree (Education: 4 for doctorate, 3
for master's, 2 for undergraduate degree, 1 for some college or less)) and whether he has a �nance
background (EduFinance).
To identify dates of turnover of top city o�cials (which, recall, triggers an audit overseen by the
Organization Department), we use the Chinese Local Leader Database, accessed via CSMAR, the
most widely used data vendor in China.
We also include (time-varying) city-level variables, which all come from the Chinese City Statis-
tical Yearbooks. City-level covariates include basic political and economic variables, in particular:
the logarithm of GDP per capita, the ratio of industrial output to GDP, the logarithm of total gov-
ernment revenues, the �scal balance (government expenditures divided by income), foreign direct
investment as a fraction of GDP, and average years of education.7
6In the earlier years that prefecture-level audits were reported, the scale and outcome variables di�ered acrossyears � it was only in 2006 that the National Audit O�ce put in place consistent reporting criteria.
7Years of education is a provincial-level variable, as city-level �gures are not available.
8
Finally, for our analysis of SOE earnings management, we use �rm-year level data, also taken
from CSMAR. Our main outcome variable is real activity manipulation (RAM), using the standard
de�nition from Roychowdhury (2006). Intuitively, the RAM measure aims to capture the extent to
which a �rm's activities are adjusted in order to improve reported margins. It includes manipulation
along three dimensions: cash �ow from operations (cash discounts to boost short-term sales),
production costs (overproduction to reduce per-unit costs), and discretionary expenditures (e.g.,
cutbacks to R&D). In practice, each component of RAM is calculated by generating deviations from
predicted values. For example, �abnormal� cash �ow from operations (CFO) is generated as the
residuals from a regression in which cash �ow is a function of the level and growth in sales:
CFOit
Assetsit−1= α0 + α1
1
Assetsit−1+ β1
SalesitAssetsit−1
+ β2∆SalesitAssetsit−1
+ ε
Following Cohen et al. (2008), we sum the (normalized) values of the three measures of activities
manipulation, to generate our overall RAM measure. As an alternative measure of questionable
accounting practices, we use accrual manipulation (AM), as pioneered by Dechow et al. (1995),
calculated as the di�erence between total accruals (revenues and expenses booked but not realized
in a given year) and non-discretionary accruals, which are in turn estimated from a model based
on the gap between revenue and receivables growth.
In our SOE analyses we include the same set of chief auditor controls as for our city-level
analyses, as well as the following �rm-level covariates: the logarithm of total assets, leverage (total
liabilities divided by total assets), ROA (return on assets), MB Ratio (the ratio of market cap to
book value of total equities), log(BoardSize), ownership share of the largest shareholder, whether
the chairperson is also the CEO, the ratio of independent directors to total number of directors,
ownership share of top (vice-CEO and above) managers, a dummy indicating whether the aduitor
is one of the Big 4 Audit �rms (PwC, Deloitte, Ernst & Young, and KPMG) , the ratio of operating
cash �ow to total assets , and the R&D ratio (R&D expenditures divided by sales).
2.4 Data overview
We begin by presenting an overview of the patterns in the data, which will help to motivate some
features of our empirical speci�cations in the next section.
In Figure 1, we show a series of �gures depicting some of the time series patterns in the data.
We begin in Figure 1a by showing the average of the logarithm of suspicious expenditures per
audit across the years in our sample. There is a distinct increase in 2013, a natural result of the
well-publicized anti-corruption crackdown initiated by China's central government in November
9
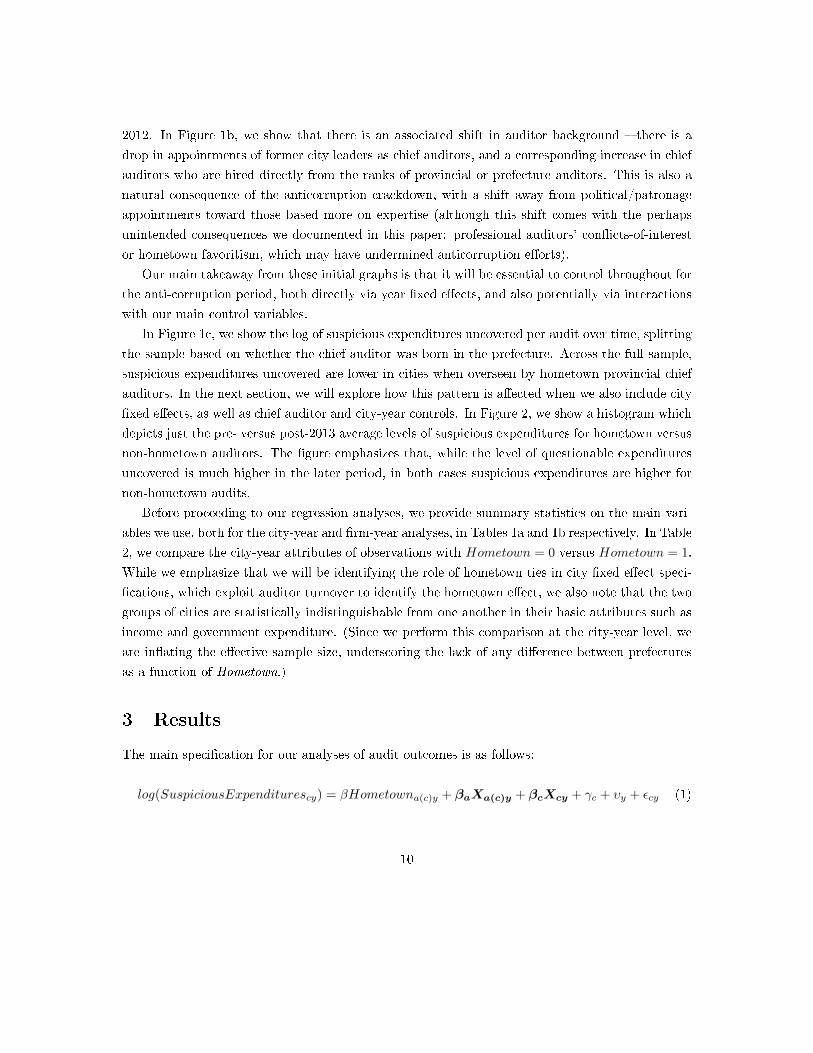
2012. In Figure 1b, we show that there is an associated shift in auditor background � there is a
drop in appointments of former city leaders as chief auditors, and a corresponding increase in chief
auditors who are hired directly from the ranks of provincial or prefecture auditors. This is also a
natural consequence of the anticorruption crackdown, with a shift away from political/patronage
appointments toward those based more on expertise (although this shift comes with the perhaps
unintended consequences we documented in this paper: professional auditors' con�icts-of-interest
or hometown favoritism, which may have undermined anticorruption e�orts).
Our main takeaway from these initial graphs is that it will be essential to control throughout for
the anti-corruption period, both directly via year �xed e�ects, and also potentially via interactions
with our main control variables.
In Figure 1c, we show the log of suspicious expenditures uncovered per audit over time, splitting
the sample based on whether the chief auditor was born in the prefecture. Across the full sample,
suspicious expenditures uncovered are lower in cities when overseen by hometown provincial chief
auditors. In the next section, we will explore how this pattern is a�ected when we also include city
�xed e�ects, as well as chief auditor and city-year controls. In Figure 2, we show a histogram which
depicts just the pre- versus post-2013 average levels of suspicious expenditures for hometown versus
non-hometown auditors. The �gure emphasizes that, while the level of questionable expenditures
uncovered is much higher in the later period, in both cases suspicious expenditures are higher for
non-hometown audits.
Before proceeding to our regression analyses, we provide summary statistics on the main vari-
ables we use, both for the city-year and �rm-year analyses, in Tables 1a and 1b respectively. In Table
2, we compare the city-year attributes of observations with Hometown = 0 versus Hometown = 1.
While we emphasize that we will be identifying the role of hometown ties in city �xed e�ect speci-
�cations, which exploit auditor turnover to identify the hometown e�ect, we also note that the two
groups of cities are statistically indistinguishable from one another in their basic attributes such as
income and government expenditure. (Since we perform this comparison at the city-year level, we
are in�ating the e�ective sample size, underscoring the lack of any di�erence between prefectures
as a function of Hometown.)
3 Results
The main speci�cation for our analyses of audit outcomes is as follows:
log(SuspiciousExpenditurescy) = βHometowna(c)y + βaXa(c)y + βcXcy + γc + υy + εcy (1)
10
β is the coe�cient of interest, relating the hometown status of the chief auditor a(c) in city c to the
suspicious expenditures turned up by his audit. The vectors Xa(c)y and Xcy re�ect (time-varying)
auditor and city attributes, while γc and υy are �xed e�ects for each of the 278 cities and 10 years
in our data. We cluster standard errors at the city-level throughout.
In columns (1) � (4) of Table 3, we present speci�cations that include progressively more con-
trols, adding in city �xed e�ects (column (2)), auditor controls (column (3)), and city-year controls
(column (4)). Across all speci�cations the coe�cient on Hometown is signi�cant at least at the
5 percent level. In our favored speci�cation, which includes controls for auditor and city charac-
teristics, β̂ = 0.49, indicating that suspicious expenditures uncovered by a hometown auditor were
nearly 50 percent lower than those found by non-hometown auditors. In column (5) we limit our
sample exclusively to prefectures for which there is within-city variation in Hometown and obtain
a similar (though marginally smaller) coe�cient on Hometown.
Given the extremely large increase in suspicious expenditures found under the anti-corruption
crackdown, we allow for all control variables to have a di�erent e�ect post-2013; that is, we add
Post2013∗Xa(c)y and Post2013∗Xcy as controls, where Post2013 is an indicator variable denoting
that Y ear ≥ 2013. We additionally allow the relationship between Hometown and suspicious ex-
penditures to di�er under the anti-corruption crackdown by adding the term Hometown∗Post2013.
These results appear in column (6). The direct e�ect of Hometown is less negative than in the
preceding column, and the coe�cient on Hometown ∗ Post2013 is positive, though small in mag-
nitude. Overall, we cannot reject the existence of a comparable e�ect of Hometown before versus
during the anticorruption campaign.8
In the �nal two columns of Table 3, we examine whether the link between hometown auditor and
suspicious expenditures is driven by the number of audits undertaken, versus the value of suspicious
expenditures per audit. In theory both are possible, given the provincial audit o�ce's discretion
in whether to conduct audits in particular areas. We �nd that the overall hometown-expenditure
relation is driven entirely by the per audit rate of suspicious expenditures (column (7)) rather than
the number of audits (column (8)). While ex ante we have no strong prior expectations of whether
hometown ties a�ect thenumber or intensity of audits, the fact that we �nd evidence only for the
latter is most plausibly the result of �xed government rules dictating the audits that take place in
8In this exercise, our aim is to assess whether the 2013 anti-corruption campaign acts as a confounder for therelationship between hometown auditors and suspicious expenditures, rather than speculating about whether thisrelationship should change as a result of the crackdown. We note that corruption � while possibly related to hometownties � is a distinct phenomenon, so that a decline in corruption does not necessarily a�ect hometown favoritism. Thelack of any change in the homeotwn audit e�ect after 2013 has many candidate explanations: it may re�ect that thecampaign was politically-driven, as many have speculated, or that its priorities lay in domains other than auditing.For the purposes of our paper, the main takeaway is that the hometown e�ect is statistically indistinguishable in thepre- versus post-2013 periods.
11
each city, which may limit auditor discretion on this margin.
There are two primary explanations for the low rate of suspicious expenditures uncovered in
chief auditors' hometowns, which have very di�erent implications for the role of hometown ties.
The two accounts build on the classic tradeo� implicated by social connections more broadly �
favoritism versus reduced information frictions, each of which may result from stronger social ties.
Under the alternative information frictions interpretation (which we refer to as the �deterrence�
interpretation), hometown auditors may have the insider knowledge and/or networks that facilitate
more rigorous enforcement. Anticipating more stringent oversight, city o�cials may engage in less
suspicious activity.
One natural approach to testing for the deterrence interpretation is to consider whether the
hometown auditor e�ect varies across his tenure. As we discuss in Section 2.1, there are many
candidates for the provincial chief auditor position, and also uncertainty over the timing of an
incumbent auditor's departure. As a result, it would be very di�cult for city o�cials to forecast
the timing of the incumbent's departure or the identity of his successor. Hence, �rst-year audi-
tors conduct audits of prefecture o�cials who likely did not anticipate the chief auditor's changed
hometown status.
In Table 4 we provide three speci�cations that assess the extent to which the deterrence story is
likely to play a �rst-order role. In column (1) we add the interaction term FirstY ear ∗Hometown(as well as the direct e�ect, FirstY ear) to capture whether there is a di�erential e�ect of hometown
auditors in their �rst year in the position. The coe�cient on the interaction term is positive, though
small in magnitude. It is relatively imprecisely measured, but still implies that one may reject that
the coe�cients on FirstY ear ∗ Hometown and Hometown sum to zero (i.e., that the hometown
e�ect when FirstY ear = 1 is equal to zero) at the 1 percent level. In column (2), instead of
focusing only on the �rst year, we allow the hometown e�ect to vary linearly as a function of the chief
auditor's tenure (Tenure∗Hometown), and in column (3) we also introduce a quadratic interaction(Tenure2 ∗Hometown). In neither of these cases is there any evidence that the hometown e�ect is
stronger in the earlier years of an auditor's tenure.
We may exploit a second dimension of heterogeneity both to assess the plausibility of the de-
terrence view, as well as to further bolster the view that the auditor's hometown ties � rather than
some other correlated attribute � accounts for our main results. Speci�cally, we take advantage
of the di�erential timing of turnover for prefectures' chief o�cers which, as noted in Section 2.1,
automatically triggers an audit jointly overseen by the provincial chief auditor and the provincial
Organization Department. We argue that the additional layer of oversight provided by the Orga-
nization Department � the province's most powerful administrative body � limits the provincial
auditor's scope for leniency, while not limiting his ability to use inside knowledge to evaluate pre-
12
fecture expenditures. Thus, if leniency accounts for the our main hometown e�ect, we expect it
will be reduced in turnover years; we do not expect this to be the case if deterrenceis behind the
lower rate of suspicious expenditures. We de�ne the indicator variable CityTurnovercy to denote
any year y that the mayor or party secretary of prefecture c leaves his position. This is a relatively
infrequent occurrence � there is turnover in 541 (20.5 percent) of our observations, in part because
it is fairly common for both chief executives to be replaced simultaneously (and they generally do
so on a �ve year cycle).
In column (1) of Table 5 we provide estimates of Equation (1), adding CityTurnover and
CityTurnover∗Hometown as covariates. The direct e�ect of CityTurnover is quantitatively small,and statistically insigni�cant. Of greater interest, the coe�cient on CityTurnover ∗ Hometown(0.25) is nearly half the size of the coe�cient on Hometown, but of opposite sign, and signi�cant at
the 5 percent level. Thus, turnover-induced audits overseen by the Organization Department turn
up relatively more suspicious expenditures when targeting the hometown of the province's chief
auditor. Paralleling our presentation of results in Table 3, we show the decomposition of this e�ect
into suspicious expenditures per audit versus number of audits. As before, we �nd that the e�ect
comes entirely from the expenditures-per-audit margin.
Taking stock of the results presented thus far, we argue that they strongly suggest that chief
auditors show greater leniency when assessing their hometown governments.
Firm-level results on SOE earnings manipulation
We next present a set of analyses at the �rm-level of locally-owned state-owned enterprises; these
results complement our city-level �ndings in two ways. First, they allow us to assess the association
between hometown auditors and audit outcomes for a distinct set of organizations � it may give
greater con�dence in our interpretation if we �nd consistent results across the two sets of analyses.
Second, we may build on the vast literature in accounting on earnings manipulation to relate the
presence of a hometown auditor to suspicious behaviors of audited entities, rather than �ndings of
suspicious behaviors uncovered by the auditor. The latter case, which is what we measure in our
city-level analyses, con�ates suspicious actions with the auditor's ability or willingness to uncover
suspicious actions.
As outlined in Section 2.3, we measure earnings management by SOEs primarily based on Real
Activity Manipulation (RAM). Recall that this measure aims to capture three types of manipulation:
cash �ow via cash discounts to generate short-term sales, overproduction to generate higher margins,
and the postponement of discretionary expenditures (e.g., R&D) to boost short-term earnings.
Our main speci�cation is similar to Equation 1, except that the level of observation is at the
13
�rm-year (fy):
RAMfy = βHometowna(c(f))y + βaXa(c(f))y + βcXc(f)y + + βcXfy+ ωf + υy + εfy (2)
As implied by the speci�cation in (2), we maintain our full set of time-varying auditor and city
controls, and add in a set of �rm-level control variables. In our preferred speci�cation, we include
�rm �xed e�ects (ωf ), which absorb the city �xed e�ects we employed in the preceding analyses.
Standard errors are clustered at the city level, to account for the level of identifying variation.
We present results based on equation 2 in Table 6. In column (1) we show results including only
year and �rm �xed e�ects as controls, so that we may identify the hometown-RAM relationship
from auditor turnover. We observe a positive relationship, with a coe�cient of 0.029 on Hometown.
We add progressively more controls in the next set of columns, including auditor characteristics
(column (2)), �rm characteristics (column (3)), and city characteristics (column (4)). The addition
of auditor controls leads to a coe�cient on Hometown of 0.038 (signi�cant at the 5 percent level),
so that the presence of a hometown auditor is associated with an increase of more than 30 percent
of the within-�rm standard deviation in RAM of 0.118 (assuming that real activities do not change
with the presence of a hometown auditor for reasons other than earnings manipulation). The further
addition of �rm and city controls has little e�ect on the estimated relationship. In Appendix Table
A1, we use accruals manipulation (Dechow et al. (1995)) as the outcome. While we observe a
positive correlation between the presence of a hometown auditor and earnings manipulation, the
correlation is quite weak.9
Finally, in Appendix Tables A2 and A3 we repeat our analyses of RAM for two sets of �rms
not overseen by the provincial auditor: centrally-owned SOEs, which are audited by the central
government, and non-SOE �rms. We may view these as placebo tests for the association between
hometown auditors and earnings manipulation. In both cases, the coe�cients on Hometown are
uniformly small and statistically indistinguishable from zero.
4 Conclusion
In this paper we show robust statistical evidence that provincial chief auditors turn up fewer sus-
picious expenditures in audits of government activities in their hometowns. Consistent with these
results re�ecting leniency toward hometown governments, this e�ect is reduced in years that audits
9As suggested by Cohen et al. (2008), accruals versus real activity manipulation may be substitutes. If so, onemay not necessarily expect both measures to be positively correlated with opportunities for manipulation.
14
are overseen by the province Organization Department, which limits the provincial chief auditor's
discretion. We �nd supporting evidence in our analyses of earnings manipulation by locally-owned
SOEs, also overseen by the provincial chief auditor.
To our knowledge, we are the �rst to document the consequences of shared backgrounds on the
quality of government audits. Our �ndings have implications for the optimal design of government
monitoring institutions � we highlight the importance of accounting for a wider range of potential
con�icts-of-interest in the assignment of monitors � and also for researchers in political economy,
in modeling the role of social ties in bureaucracies.
15
References
Avis, E., C. Ferraz, and F. Finan (2018). Do government audits reduce corruption? estimating the
impacts of exposing corrupt politicians. Journal of Political Economy 126 (5), 1912�1964.
Baber, W. R., J. Krishnan, and Y. Zhang (2014). Investor perceptions of the earnings quality
consequences of hiring an a�liated auditor. Review of Accounting Studies 19 (1), 69�102.
Bandiera, O., A. Prat, and T. Valletti (2009). Active and passive waste in government spending:
evidence from a policy experiment. American Economic Review 99 (4), 1278�1308.
Cohen, D. A., A. Dey, and T. Z. Lys (2008). Real and accrual-based earnings management in the
pre-and post-sarbanes-oxley periods. The accounting review 83 (3), 757�787.
Dabla-Norris, E., J. Brumby, A. Kyobe, Z. Mills, and C. Papageorgiou (2012). Investing in public
investment: an index of public investment e�ciency. Journal of Economic Growth 17 (3), 235�
266.
Dechow, P. M., R. G. Sloan, and A. P. Sweeney (1995). Detecting earnings management. Accounting
review , 193�225.
Do, Q.-A., K.-T. Nguyen, and A. N. Tran (2017). One mandarin bene�ts the whole clan: hometown
favoritism in an authoritarian regime. American Economic Journal: Applied Economics 9 (4),
1�29.
Du�o, E., M. Greenstone, R. Pande, and N. Ryan (2013). Truth-telling by third-party auditors
and the response of polluting �rms: Experimental evidence from india. The Quarterly Journal
of Economics 128 (4), 1499�1545.
Ferraz, C. and F. Finan (2008). Exposing corrupt politicians: the e�ects of brazil's publicly released
audits on electoral outcomes. The Quarterly journal of economics 123 (2), 703�745.
Ferraz, C. and F. Finan (2011). Electoral accountability and corruption: Evidence from the audits
of local governments. American Economic Review 101 (4), 1274�1311.
Fisman, R., D. Paravisini, and V. Vig (2017). Cultural proximity and loan outcomes. American
Economic Review 107 (2), 457�92.
Fisman, R., J. Shi, Y. Wang, and W. Wu (2019). Social ties and the selection of china's political
elite. Technical report.
16
Fisman, R., J. Shi, Y. Wang, and R. Xu (2018). Social ties and favoritism in chinese science.
Journal of Political Economy 126 (3), 1134�1171.
Gerardino, M. P., S. Litschig, and D. Pomeranz (2017). Can audits back�re? evidence from public
procurement in chile. Technical report, National Bureau of Economic Research.
Guan, Y., L. N. Su, D. Wu, and Z. Yang (2016). Do school ties between auditors and client
executives in�uence audit outcomes? Journal of accounting and economics 61 (2-3), 506�525.
He, X., J. A. Pittman, O. M. Rui, and D. Wu (2017). Do social ties between external auditors and
audit committee members a�ect audit quality? The Accounting Review 92 (5), 61�87.
Hodler, R. and P. A. Raschky (2014). Regional favoritism. The Quarterly Journal of Eco-
nomics 129 (2), 995�1033.
Roychowdhury, S. (2006). Earnings management through real activities manipulation. Journal of
accounting and economics 42 (3), 335�370.
Tanzi, V. and H. Davoodi (1998). Corruption, public investment, and growth. In The welfare state,
public investment, and growth, pp. 41�60. Springer.
17
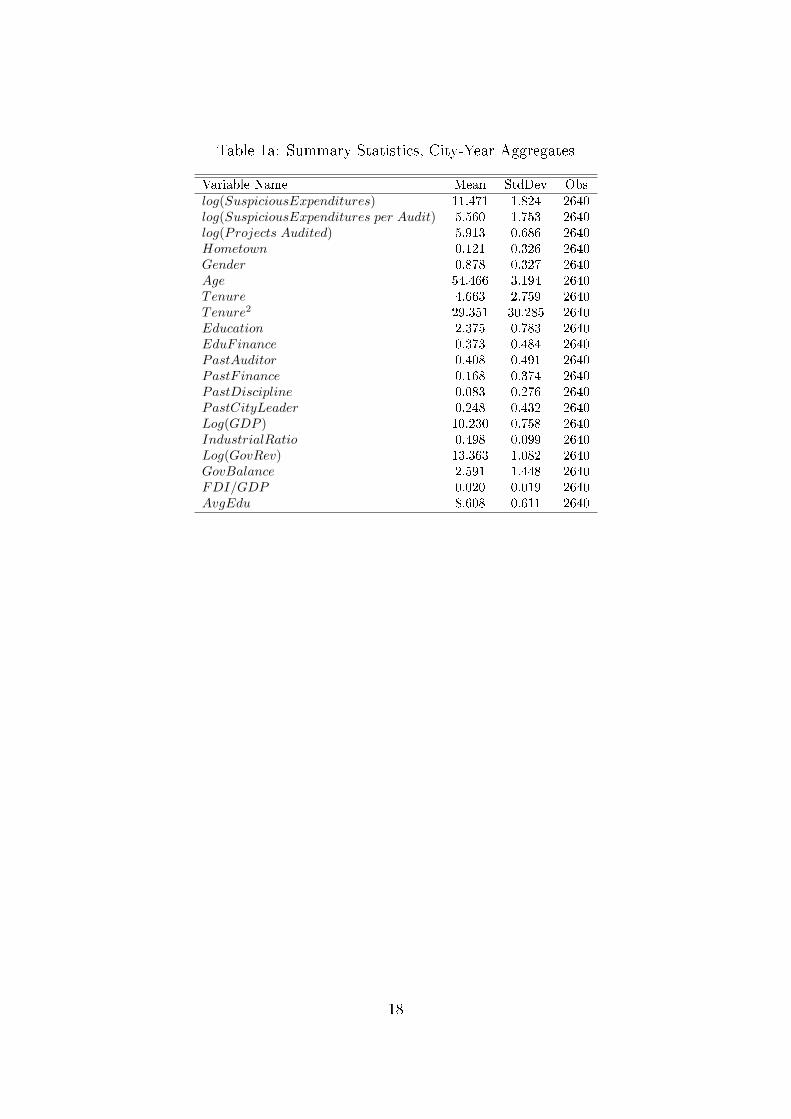
Table 1a: Summary Statistics, City-Year Aggregates
Variable Name Mean StdDev Obs
log(SuspiciousExpenditures) 11.471 1.824 2640log(SuspiciousExpenditures per Audit) 5.560 1.753 2640log(Projects Audited) 5.913 0.686 2640Hometown 0.121 0.326 2640Gender 0.878 0.327 2640Age 54.466 3.194 2640Tenure 4.663 2.759 2640Tenure2 29.351 30.285 2640Education 2.375 0.783 2640EduFinance 0.373 0.484 2640PastAuditor 0.408 0.491 2640PastF inance 0.168 0.374 2640PastDiscipline 0.083 0.276 2640PastCityLeader 0.248 0.432 2640Log(GDP ) 10.230 0.758 2640IndustrialRatio 0.498 0.099 2640Log(GovRev) 13.363 1.082 2640GovBalance 2.591 1.448 2640FDI/GDP 0.020 0.019 2640AvgEdu 8.608 0.611 2640
18
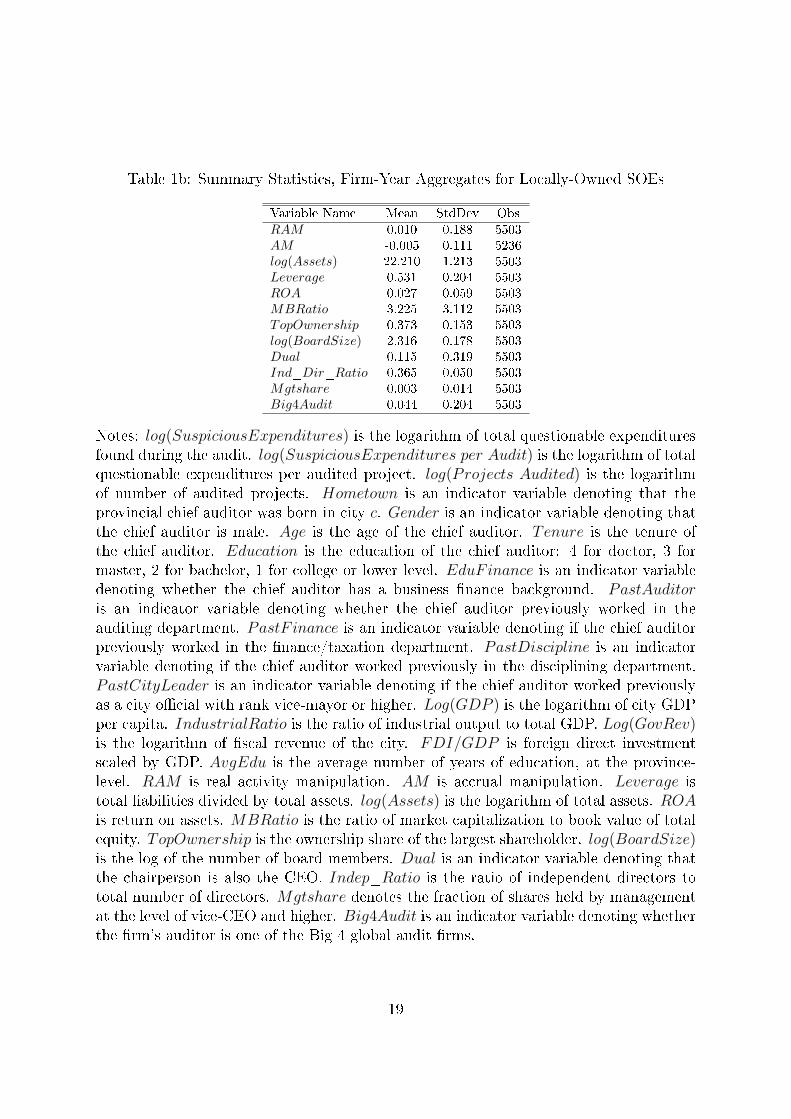
Table 1b: Summary Statistics, Firm-Year Aggregates for Locally-Owned SOEs
Variable Name Mean StdDev Obs
RAM 0.010 0.188 5503AM -0.005 0.111 5236log(Assets) 22.210 1.213 5503Leverage 0.531 0.204 5503ROA 0.027 0.059 5503MBRatio 3.225 3.112 5503TopOwnership 0.373 0.153 5503log(BoardSize) 2.316 0.178 5503Dual 0.115 0.319 5503Ind_Dir_Ratio 0.365 0.050 5503Mgtshare 0.003 0.014 5503Big4Audit 0.044 0.204 5503
Notes: log(SuspiciousExpenditures) is the logarithm of total questionable expendituresfound during the audit. log(SuspiciousExpenditures per Audit) is the logarithm of totalquestionable expenditures per audited project. log(Projects Audited) is the logarithmof number of audited projects. Hometown is an indicator variable denoting that theprovincial chief auditor was born in city c. Gender is an indicator variable denoting thatthe chief auditor is male. Age is the age of the chief auditor. Tenure is the tenure ofthe chief auditor. Education is the education of the chief auditor: 4 for doctor, 3 formaster, 2 for bachelor, 1 for college or lower level. EduFinance is an indicator variabledenoting whether the chief auditor has a business �nance background. PastAuditoris an indicator variable denoting whether the chief auditor previously worked in theauditing department. PastF inance is an indicator variable denoting if the chief auditorpreviously worked in the �nance/taxation department. PastDiscipline is an indicatorvariable denoting if the chief auditor worked previously in the disciplining department.PastCityLeader is an indicator variable denoting if the chief auditor worked previouslyas a city o�cial with rank vice-mayor or higher. Log(GDP ) is the logarithm of city GDPper capita. IndustrialRatio is the ratio of industrial output to total GDP. Log(GovRev)is the logarithm of �scal revenue of the city. FDI/GDP is foreign direct investmentscaled by GDP. AvgEdu is the average number of years of education, at the province-level. RAM is real activity manipulation. AM is accrual manipulation. Leverage istotal liabilities divided by total assets. log(Assets) is the logarithm of total assets. ROAis return on assets. MBRatio is the ratio of market capitalization to book value of totalequity. TopOwnership is the ownership share of the largest shareholder. log(BoardSize)is the log of the number of board members. Dual is an indicator variable denoting thatthe chairperson is also the CEO. Indep_Ratio is the ratio of independent directors tototal number of directors. Mgtshare denotes the fraction of shares held by managementat the level of vice-CEO and higher. Big4Audit is an indicator variable denoting whetherthe �rm's auditor is one of the Big 4 global audit �rms.
19
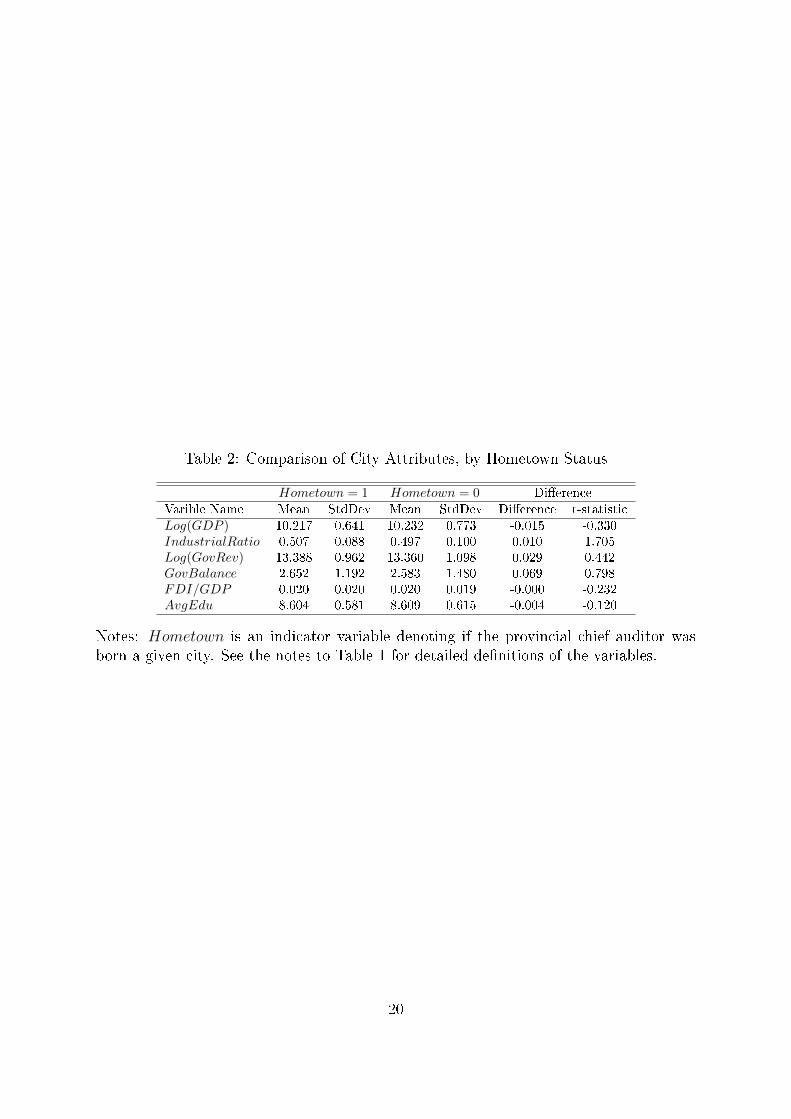
Table 2: Comparison of City Attributes, by Hometown Status
Hometown = 1 Hometown = 0 Di�erence
Varible Name Mean StdDev Mean StdDev Di�erence t-statistic
Log(GDP ) 10.217 0.641 10.232 0.773 -0.015 -0.330IndustrialRatio 0.507 0.088 0.497 0.100 0.010 1.705Log(GovRev) 13.388 0.962 13.360 1.098 0.029 0.442GovBalance 2.652 1.192 2.583 1.480 0.069 0.798FDI/GDP 0.020 0.020 0.020 0.019 -0.000 -0.232AvgEdu 8.604 0.581 8.609 0.615 -0.004 -0.120
Notes: Hometown is an indicator variable denoting if the provincial chief auditor wasborn a given city. See the notes to Table 1 for detailed de�nitions of the variables.
20
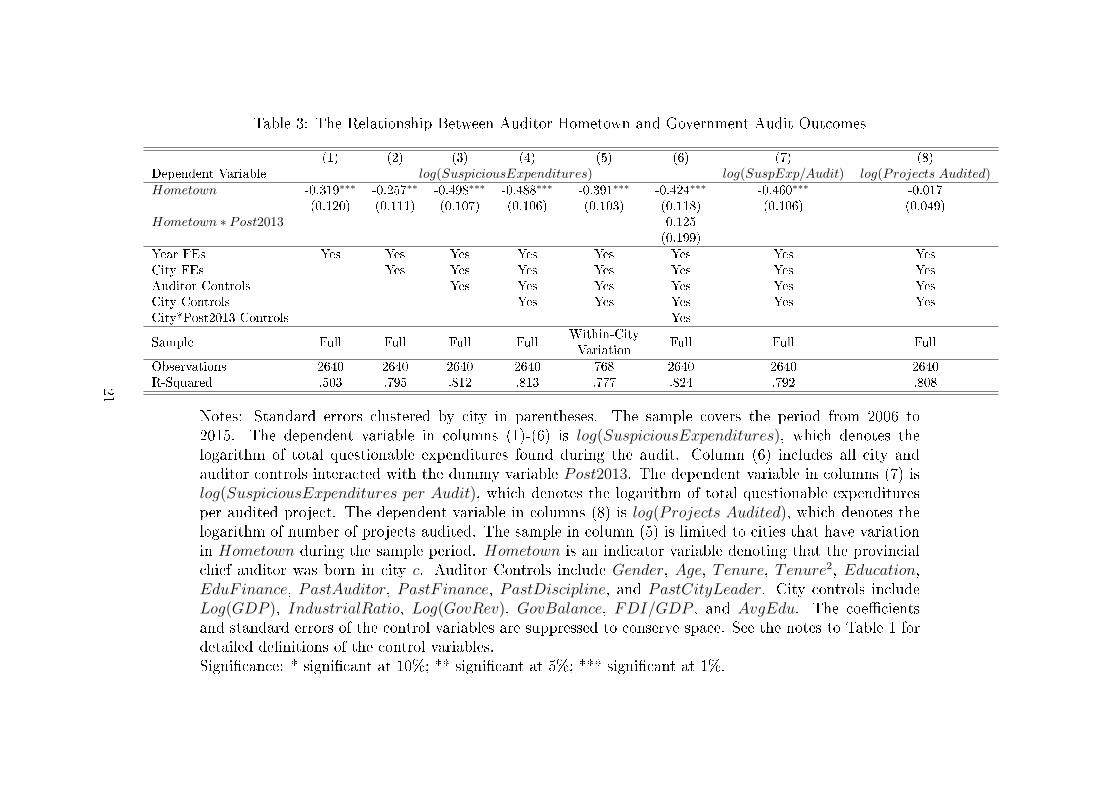
Table 3: The Relationship Between Auditor Hometown and Government Audit Outcomes
(1) (2) (3) (4) (5) (6) (7) (8)Dependent Variable log(SuspiciousExpenditures) log(SuspExp/Audit) log(Projects Audited)Hometown -0.319∗∗∗ -0.257∗∗ -0.498∗∗∗ -0.488∗∗∗ -0.391∗∗∗ -0.424∗∗∗ -0.460∗∗∗ -0.017
(0.120) (0.111) (0.107) (0.106) (0.103) (0.118) (0.106) (0.049)Hometown ∗ Post2013 0.125
(0.199)
Year FEs Yes Yes Yes Yes Yes Yes Yes YesCity FEs Yes Yes Yes Yes Yes Yes YesAuditor Controls Yes Yes Yes Yes Yes YesCity Controls Yes Yes Yes Yes YesCity*Post2013 Controls Yes
Sample Full Full Full FullWithin-CityVariation
Full Full Full
Observations 2640 2640 2640 2640 768 2640 2640 2640R-Squared .503 .795 .812 .813 .777 .824 .792 .808
Notes: Standard errors clustered by city in parentheses. The sample covers the period from 2006 to2015. The dependent variable in columns (1)-(6) is log(SuspiciousExpenditures), which denotes thelogarithm of total questionable expenditures found during the audit. Column (6) includes all city andauditor controls interacted with the dummy variable Post2013. The dependent variable in columns (7) islog(SuspiciousExpenditures per Audit), which denotes the logarithm of total questionable expendituresper audited project. The dependent variable in columns (8) is log(Projects Audited), which denotes thelogarithm of number of projects audited. The sample in column (5) is limited to cities that have variationin Hometown during the sample period. Hometown is an indicator variable denoting that the provincialchief auditor was born in city c. Auditor Controls include Gender, Age, Tenure, Tenure2, Education,EduFinance, PastAuditor, PastF inance, PastDiscipline, and PastCityLeader. City controls includeLog(GDP ), IndustrialRatio, Log(GovRev), GovBalance, FDI/GDP , and AvgEdu. The coe�cientsand standard errors of the control variables are suppressed to conserve space. See the notes to Table 1 fordetailed de�nitions of the control variables.Signi�cance: * signi�cant at 10%; ** signi�cant at 5%; *** signi�cant at 1%.
21
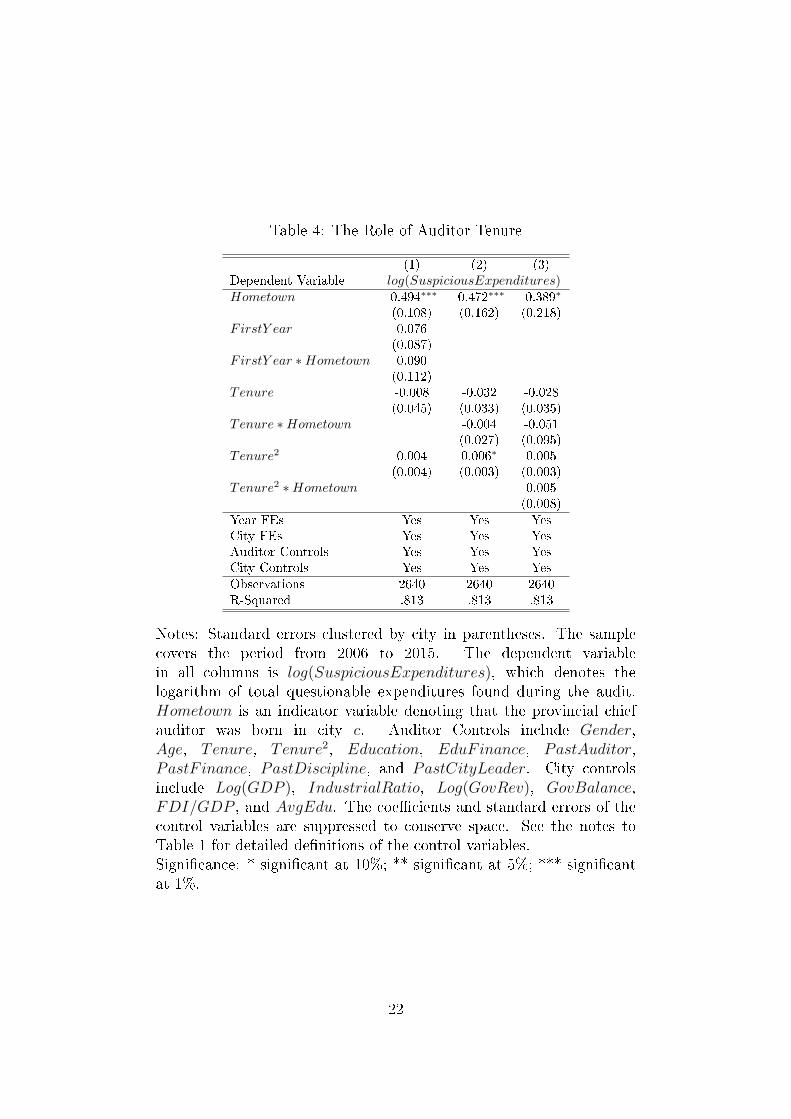
Table 4: The Role of Auditor Tenure
(1) (2) (3)Dependent Variable log(SuspiciousExpenditures)Hometown -0.494∗∗∗ -0.472∗∗∗ -0.389∗
(0.108) (0.162) (0.218)FirstY ear 0.076
(0.087)FirstY ear ∗Hometown 0.090
(0.112)Tenure -0.008 -0.032 -0.028
(0.045) (0.033) (0.035)Tenure ∗Hometown -0.004 -0.051
(0.027) (0.095)Tenure2 0.004 0.006∗ 0.005
(0.004) (0.003) (0.003)Tenure2 ∗Hometown 0.005
(0.008)
Year FEs Yes Yes YesCity FEs Yes Yes YesAuditor Controls Yes Yes YesCity Controls Yes Yes Yes
Observations 2640 2640 2640R-Squared .813 .813 .813
Notes: Standard errors clustered by city in parentheses. The samplecovers the period from 2006 to 2015. The dependent variablein all columns is log(SuspiciousExpenditures), which denotes thelogarithm of total questionable expenditures found during the audit.Hometown is an indicator variable denoting that the provincial chiefauditor was born in city c. Auditor Controls include Gender,Age, Tenure, Tenure2, Education, EduFinance, PastAuditor,PastF inance, PastDiscipline, and PastCityLeader. City controlsinclude Log(GDP ), IndustrialRatio, Log(GovRev), GovBalance,FDI/GDP , and AvgEdu. The coe�cients and standard errors of thecontrol variables are suppressed to conserve space. See the notes toTable 1 for detailed de�nitions of the control variables.Signi�cance: * signi�cant at 10%; ** signi�cant at 5%; *** signi�cantat 1%.
22
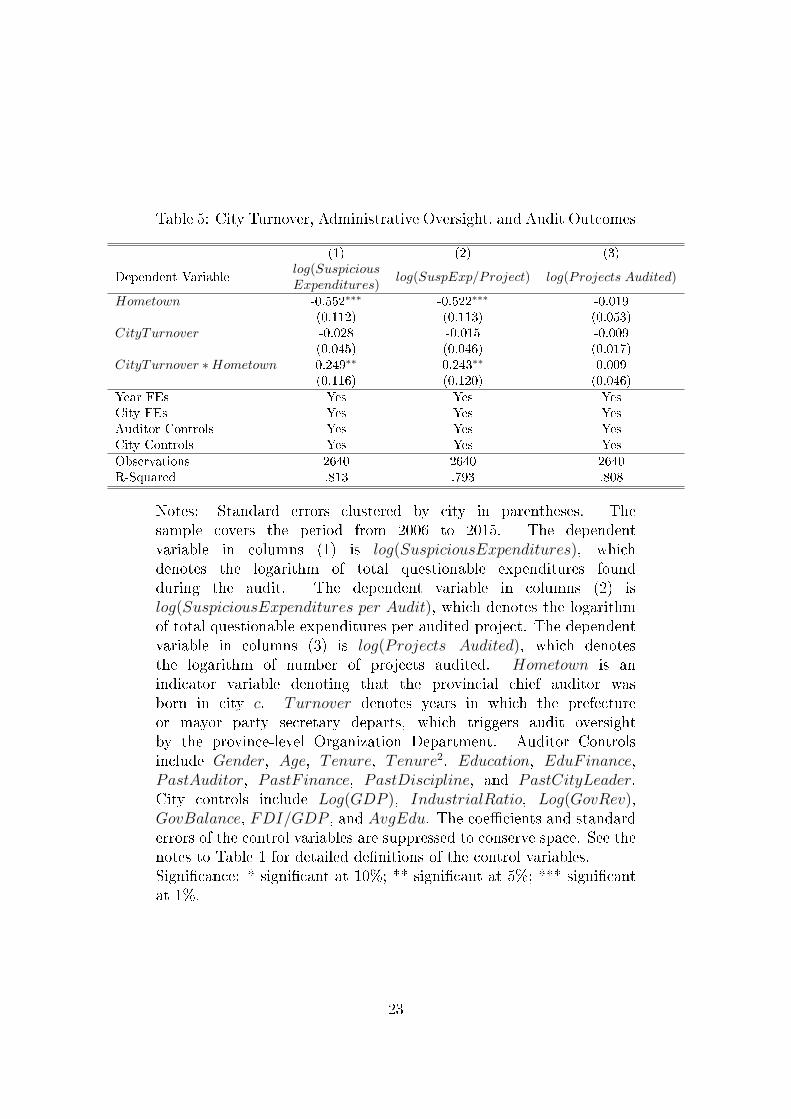
Table 5: City Turnover, Administrative Oversight, and Audit Outcomes
(1) (2) (3)
Dependent Variablelog(SuspiciousExpenditures)
log(SuspExp/Project) log(Projects Audited)
Hometown -0.552∗∗∗ -0.522∗∗∗ -0.019(0.112) (0.113) (0.053)
CityTurnover -0.028 -0.015 -0.009(0.045) (0.046) (0.017)
CityTurnover ∗Hometown 0.249∗∗ 0.243∗∗ 0.009(0.116) (0.120) (0.046)
Year FEs Yes Yes YesCity FEs Yes Yes YesAuditor Controls Yes Yes YesCity Controls Yes Yes Yes
Observations 2640 2640 2640R-Squared .813 .793 .808
Notes: Standard errors clustered by city in parentheses. Thesample covers the period from 2006 to 2015. The dependentvariable in columns (1) is log(SuspiciousExpenditures), whichdenotes the logarithm of total questionable expenditures foundduring the audit. The dependent variable in columns (2) islog(SuspiciousExpenditures per Audit), which denotes the logarithmof total questionable expenditures per audited project. The dependentvariable in columns (3) is log(Projects Audited), which denotesthe logarithm of number of projects audited. Hometown is anindicator variable denoting that the provincial chief auditor wasborn in city c. Turnover denotes years in which the prefectureor mayor party secretary departs, which triggers audit oversightby the province-level Organization Department. Auditor Controlsinclude Gender, Age, Tenure, Tenure2, Education, EduFinance,PastAuditor, PastF inance, PastDiscipline, and PastCityLeader.City controls include Log(GDP ), IndustrialRatio, Log(GovRev),GovBalance, FDI/GDP , and AvgEdu. The coe�cients and standarderrors of the control variables are suppressed to conserve space. See thenotes to Table 1 for detailed de�nitions of the control variables.Signi�cance: * signi�cant at 10%; ** signi�cant at 5%; *** signi�cantat 1%.
23
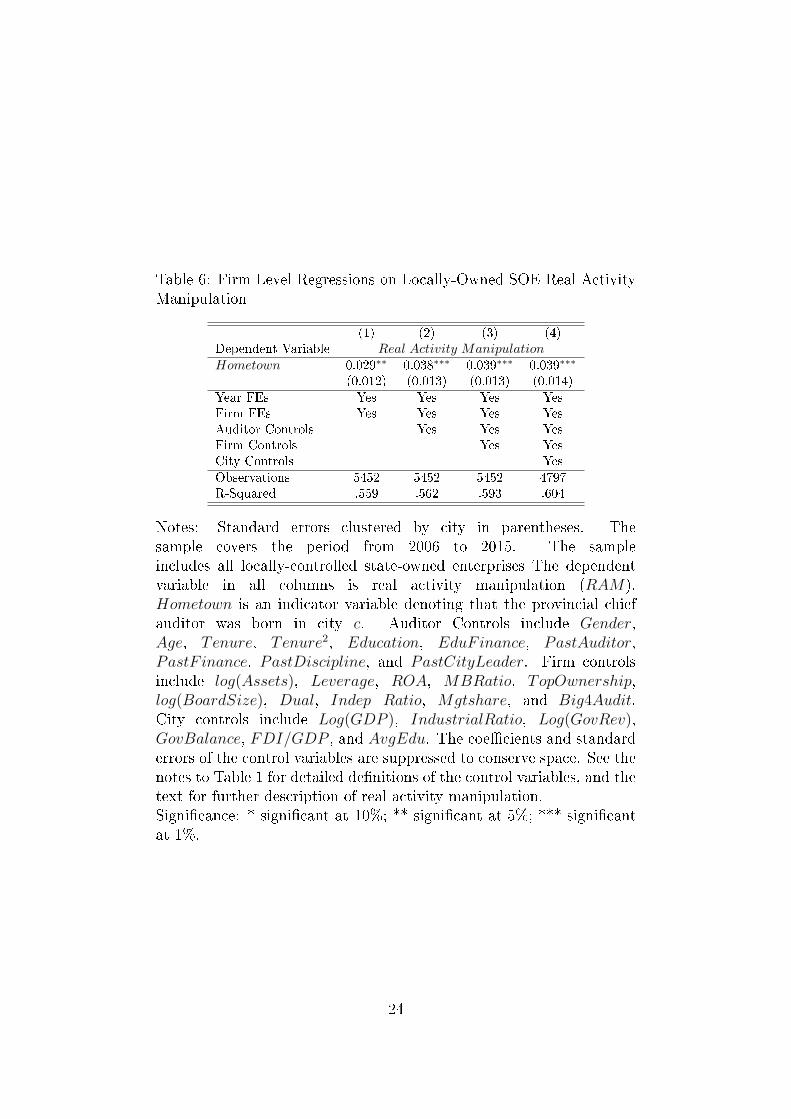
Table 6: Firm Level Regressions on Locally-Owned SOE Real ActivityManipulation
(1) (2) (3) (4)Dependent Variable Real Activity ManipulationHometown 0.029∗∗ 0.038∗∗∗ 0.039∗∗∗ 0.039∗∗∗
(0.012) (0.013) (0.013) (0.014)
Year FEs Yes Yes Yes YesFirm FEs Yes Yes Yes YesAuditor Controls Yes Yes YesFirm Controls Yes YesCity Controls Yes
Observations 5452 5452 5452 4797R-Squared .559 .562 .593 .604
Notes: Standard errors clustered by city in parentheses. Thesample covers the period from 2006 to 2015. The sampleincludes all locally-controlled state-owned enterprises The dependentvariable in all columns is real activity manipulation (RAM).Hometown is an indicator variable denoting that the provincial chiefauditor was born in city c. Auditor Controls include Gender,Age, Tenure, Tenure2, Education, EduFinance, PastAuditor,PastF inance, PastDiscipline, and PastCityLeader. Firm controlsinclude log(Assets), Leverage, ROA, MBRatio, TopOwnership,log(BoardSize), Dual, Indep_Ratio, Mgtshare, and Big4Audit.City controls include Log(GDP ), IndustrialRatio, Log(GovRev),GovBalance, FDI/GDP , and AvgEdu. The coe�cients and standarderrors of the control variables are suppressed to conserve space. See thenotes to Table 1 for detailed de�nitions of the control variables, and thetext for further description of real activity manipulation.Signi�cance: * signi�cant at 10%; ** signi�cant at 5%; *** signi�cantat 1%.
24
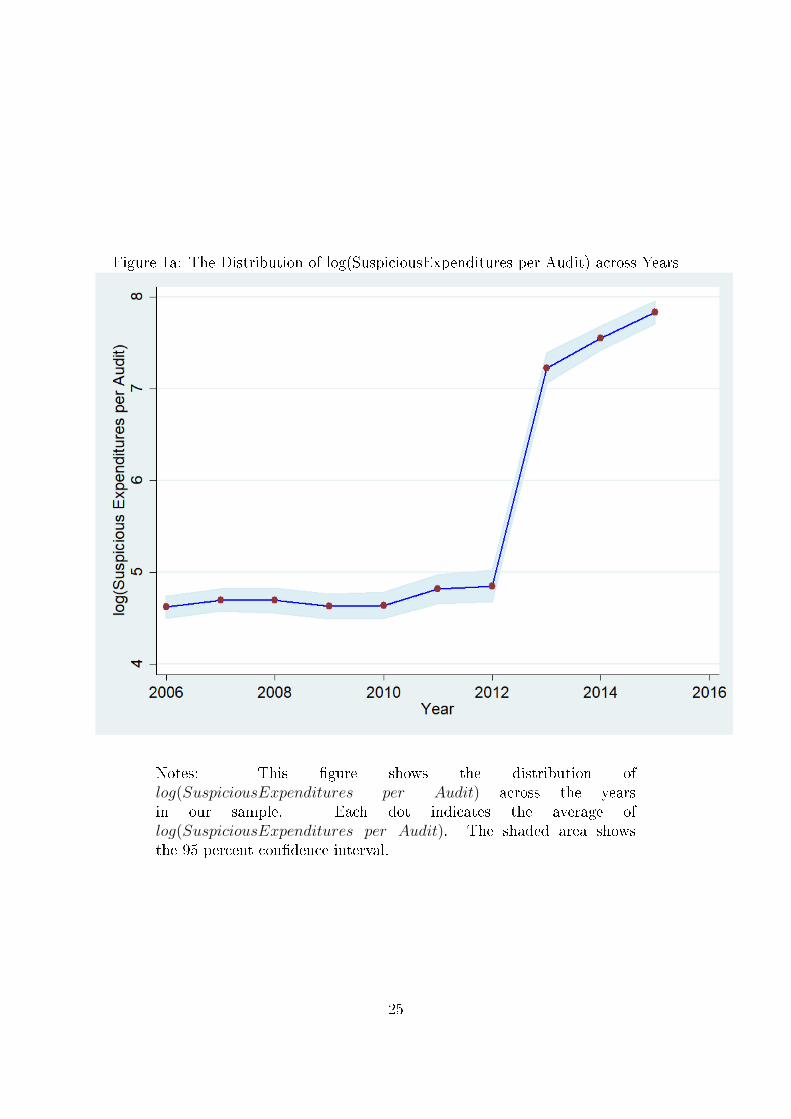
Figure 1a: The Distribution of log(SuspiciousExpenditures per Audit) across Years
Notes: This �gure shows the distribution oflog(SuspiciousExpenditures per Audit) across the yearsin our sample. Each dot indicates the average oflog(SuspiciousExpenditures per Audit). The shaded area showsthe 95 percent con�dence interval.
25
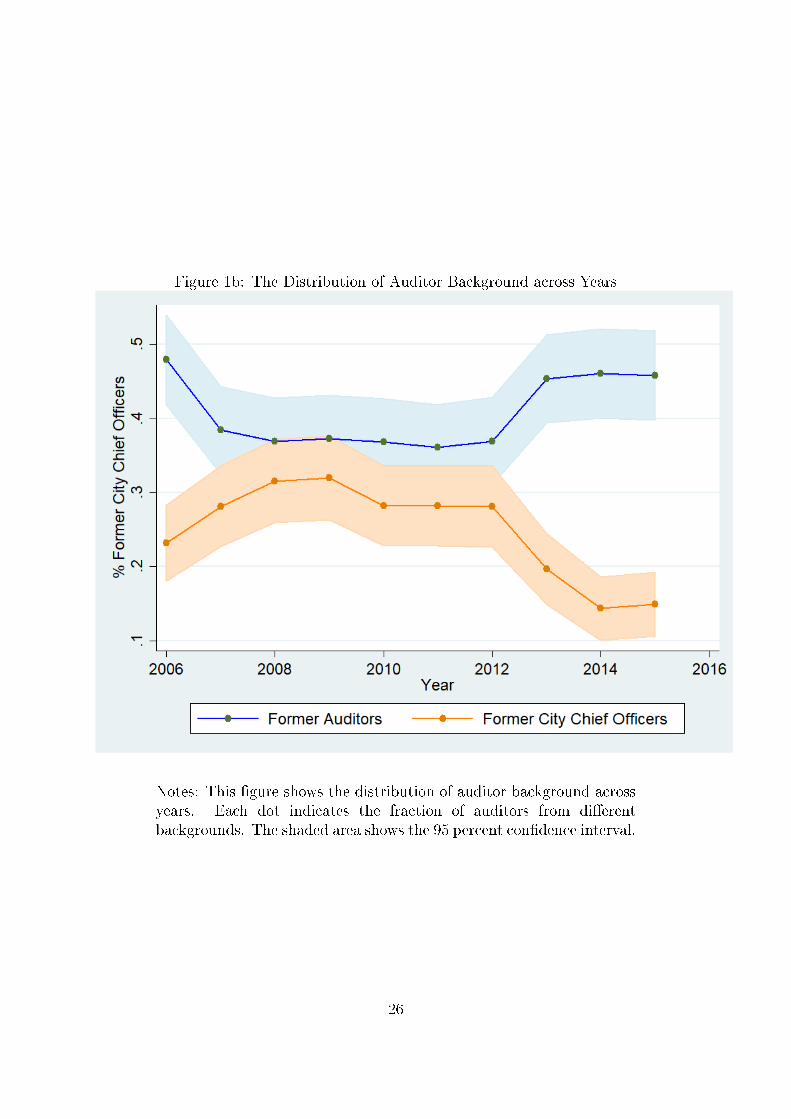
Figure 1b: The Distribution of Auditor Background across Years
Notes: This �gure shows the distribution of auditor background acrossyears. Each dot indicates the fraction of auditors from di�erentbackgrounds. The shaded area shows the 95 percent con�dence interval.
26
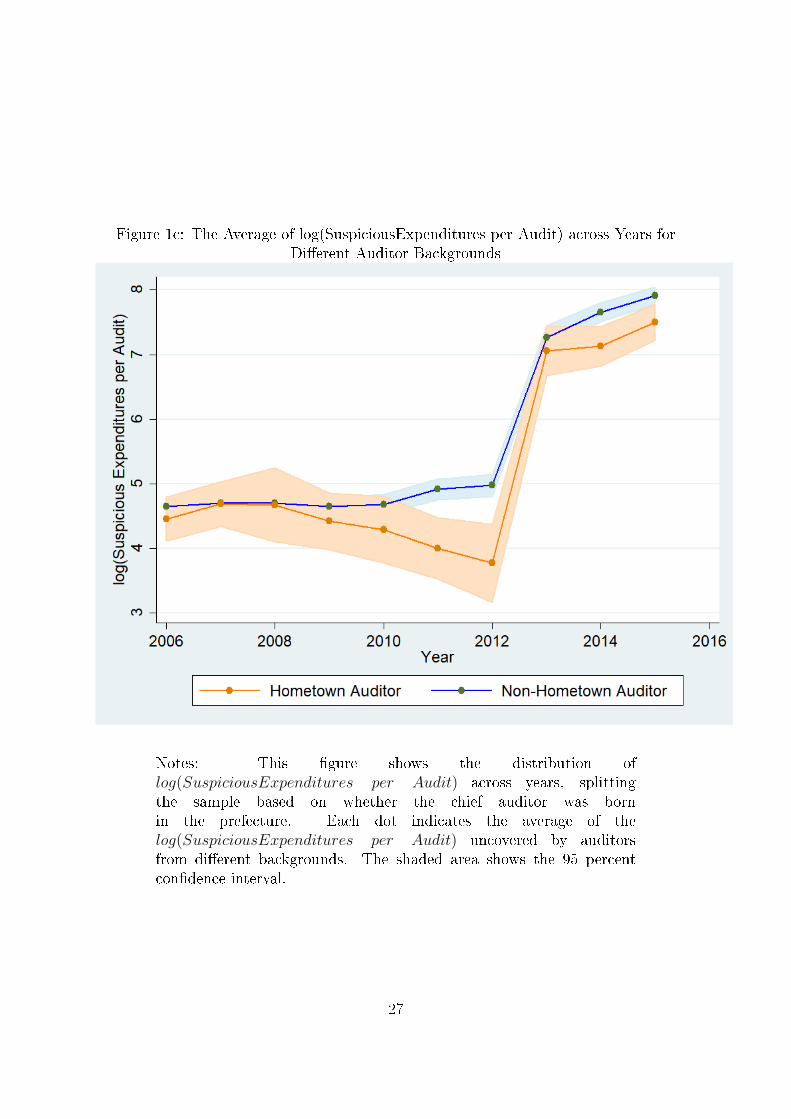
Figure 1c: The Average of log(SuspiciousExpenditures per Audit) across Years forDi�erent Auditor Backgrounds
Notes: This �gure shows the distribution oflog(SuspiciousExpenditures per Audit) across years, splittingthe sample based on whether the chief auditor was bornin the prefecture. Each dot indicates the average of thelog(SuspiciousExpenditures per Audit) uncovered by auditorsfrom di�erent backgrounds. The shaded area shows the 95 percentcon�dence interval.
27
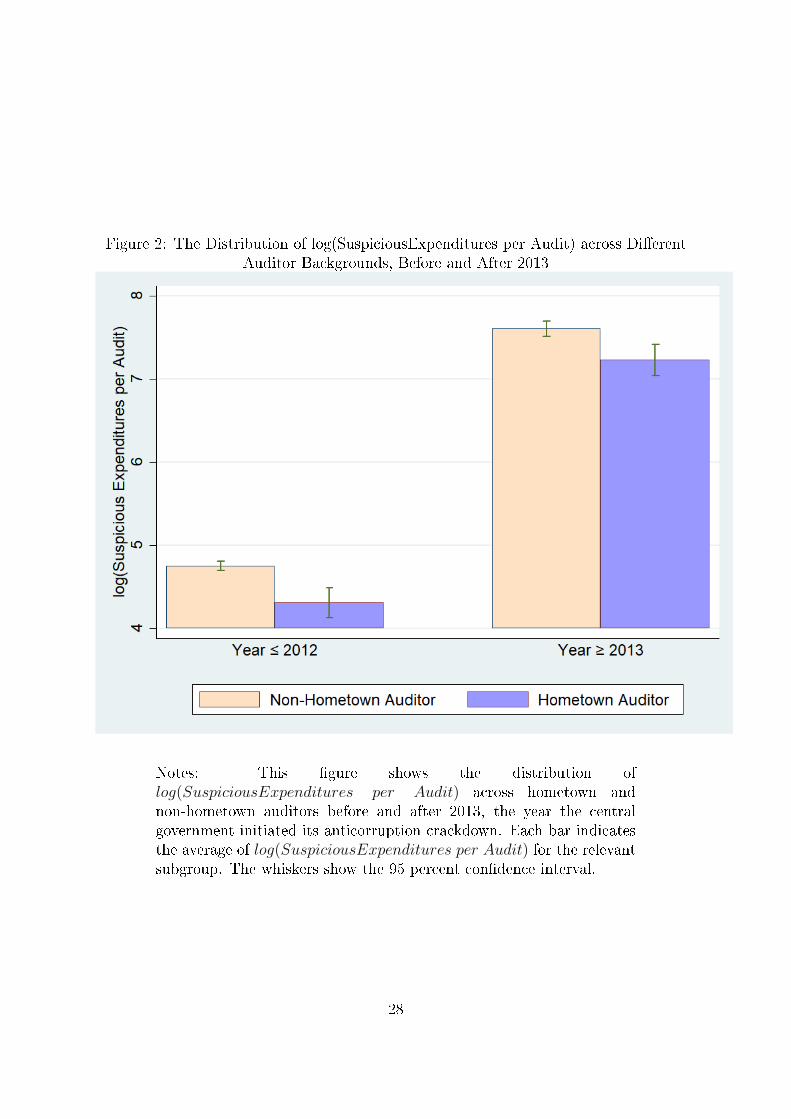
Figure 2: The Distribution of log(SuspiciousExpenditures per Audit) across Di�erentAuditor Backgrounds, Before and After 2013
Notes: This �gure shows the distribution oflog(SuspiciousExpenditures per Audit) across hometown andnon-hometown auditors before and after 2013, the year the centralgovernment initiated its anticorruption crackdown. Each bar indicatesthe average of log(SuspiciousExpenditures per Audit) for the relevantsubgroup. The whiskers show the 95 percent con�dence interval.
28
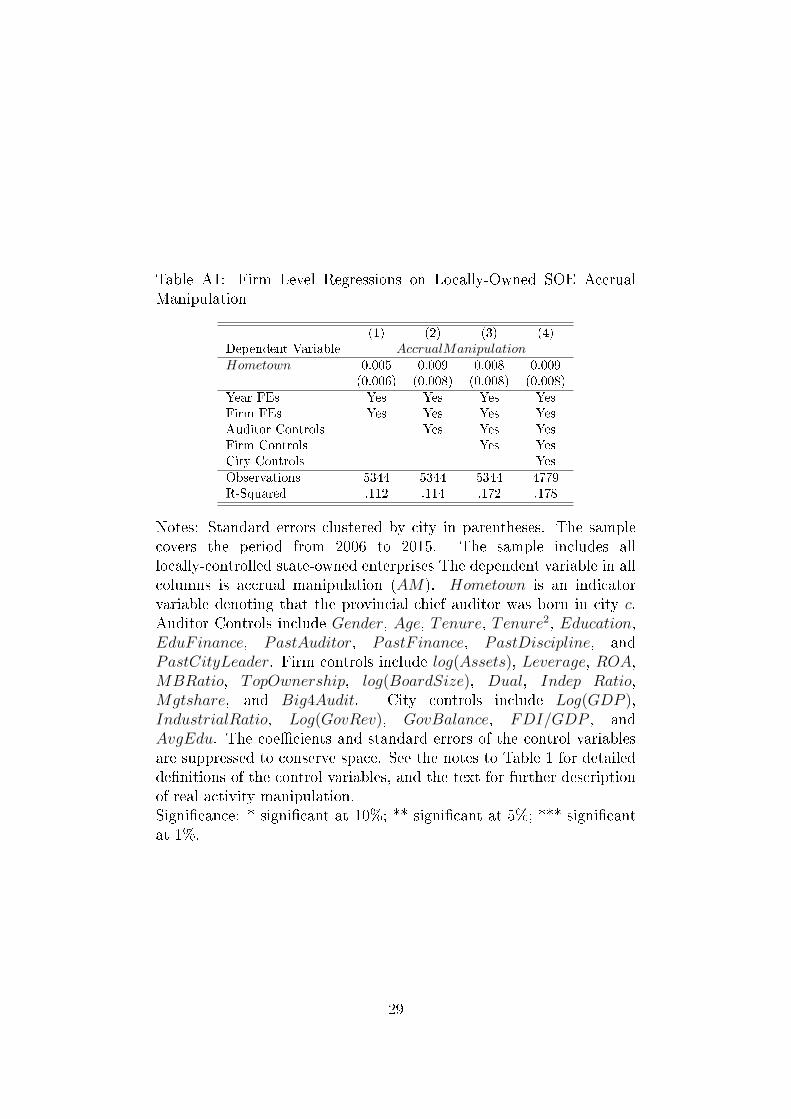
Table A1: Firm Level Regressions on Locally-Owned SOE AccrualManipulation
(1) (2) (3) (4)Dependent Variable AccrualManipulationHometown 0.005 0.009 0.008 0.009
(0.006) (0.008) (0.008) (0.008)
Year FEs Yes Yes Yes YesFirm FEs Yes Yes Yes YesAuditor Controls Yes Yes YesFirm Controls Yes YesCity Controls Yes
Observations 5344 5344 5344 4779R-Squared .112 .114 .172 .178
Notes: Standard errors clustered by city in parentheses. The samplecovers the period from 2006 to 2015. The sample includes alllocally-controlled state-owned enterprises The dependent variable in allcolumns is accrual manipulation (AM). Hometown is an indicatorvariable denoting that the provincial chief auditor was born in city c.Auditor Controls include Gender, Age, Tenure, Tenure2, Education,EduFinance, PastAuditor, PastF inance, PastDiscipline, andPastCityLeader. Firm controls include log(Assets), Leverage, ROA,MBRatio, TopOwnership, log(BoardSize), Dual, Indep_Ratio,Mgtshare, and Big4Audit. City controls include Log(GDP ),IndustrialRatio, Log(GovRev), GovBalance, FDI/GDP , andAvgEdu. The coe�cients and standard errors of the control variablesare suppressed to conserve space. See the notes to Table 1 for detailedde�nitions of the control variables, and the text for further descriptionof real activity manipulation.Signi�cance: * signi�cant at 10%; ** signi�cant at 5%; *** signi�cantat 1%.
29
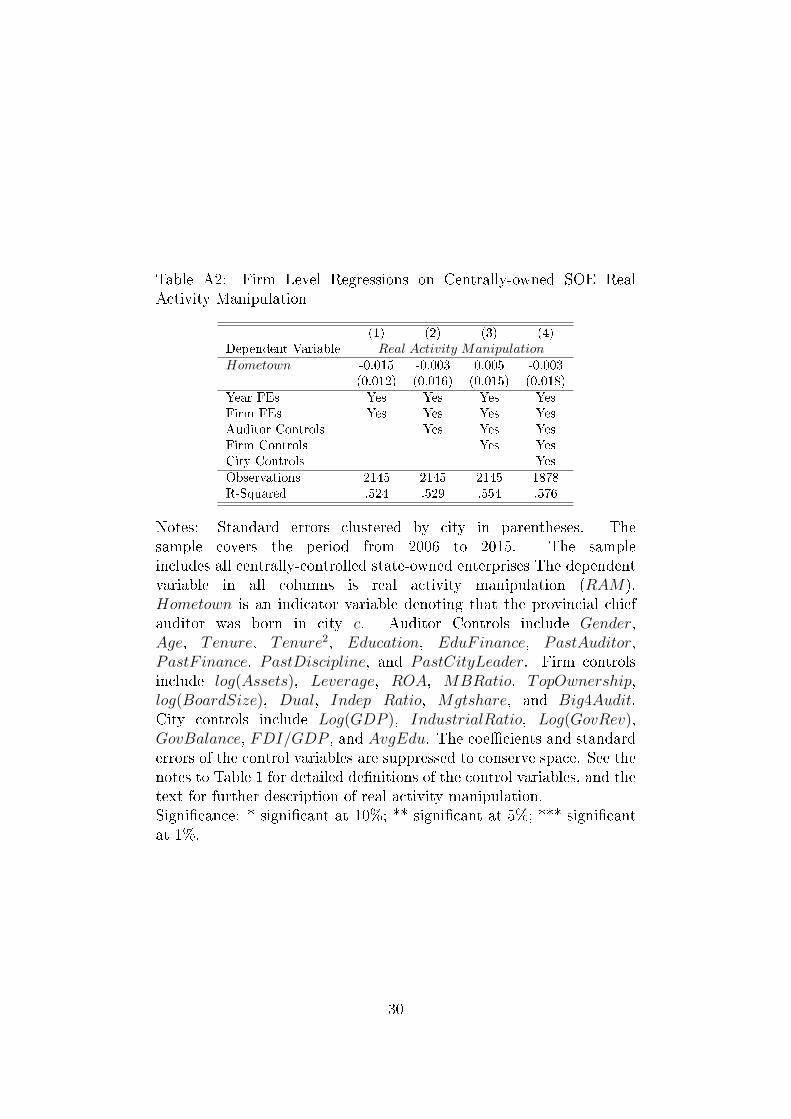
Table A2: Firm Level Regressions on Centrally-owned SOE RealActivity Manipulation
(1) (2) (3) (4)Dependent Variable Real Activity ManipulationHometown -0.015 -0.003 0.005 -0.003
(0.012) (0.016) (0.015) (0.018)
Year FEs Yes Yes Yes YesFirm FEs Yes Yes Yes YesAuditor Controls Yes Yes YesFirm Controls Yes YesCity Controls Yes
Observations 2145 2145 2145 1878R-Squared .524 .529 .554 .576
Notes: Standard errors clustered by city in parentheses. Thesample covers the period from 2006 to 2015. The sampleincludes all centrally-controlled state-owned enterprises The dependentvariable in all columns is real activity manipulation (RAM).Hometown is an indicator variable denoting that the provincial chiefauditor was born in city c. Auditor Controls include Gender,Age, Tenure, Tenure2, Education, EduFinance, PastAuditor,PastF inance, PastDiscipline, and PastCityLeader. Firm controlsinclude log(Assets), Leverage, ROA, MBRatio, TopOwnership,log(BoardSize), Dual, Indep_Ratio, Mgtshare, and Big4Audit.City controls include Log(GDP ), IndustrialRatio, Log(GovRev),GovBalance, FDI/GDP , and AvgEdu. The coe�cients and standarderrors of the control variables are suppressed to conserve space. See thenotes to Table 1 for detailed de�nitions of the control variables, and thetext for further description of real activity manipulation.Signi�cance: * signi�cant at 10%; ** signi�cant at 5%; *** signi�cantat 1%.
30
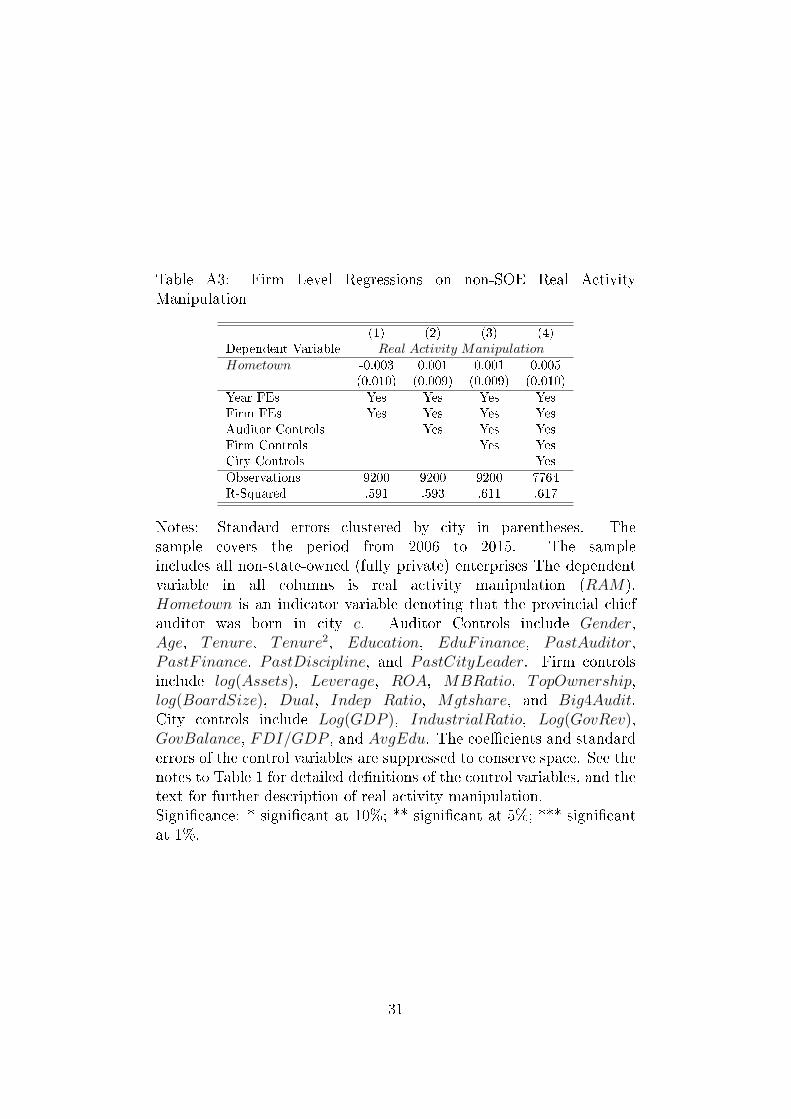
Table A3: Firm Level Regressions on non-SOE Real ActivityManipulation
(1) (2) (3) (4)Dependent Variable Real Activity ManipulationHometown -0.003 0.001 0.001 0.005
(0.010) (0.009) (0.009) (0.010)
Year FEs Yes Yes Yes YesFirm FEs Yes Yes Yes YesAuditor Controls Yes Yes YesFirm Controls Yes YesCity Controls Yes
Observations 9200 9200 9200 7764R-Squared .591 .593 .611 .617
Notes: Standard errors clustered by city in parentheses. Thesample covers the period from 2006 to 2015. The sampleincludes all non-state-owned (fully private) enterprises The dependentvariable in all columns is real activity manipulation (RAM).Hometown is an indicator variable denoting that the provincial chiefauditor was born in city c. Auditor Controls include Gender,Age, Tenure, Tenure2, Education, EduFinance, PastAuditor,PastF inance, PastDiscipline, and PastCityLeader. Firm controlsinclude log(Assets), Leverage, ROA, MBRatio, TopOwnership,log(BoardSize), Dual, Indep_Ratio, Mgtshare, and Big4Audit.City controls include Log(GDP ), IndustrialRatio, Log(GovRev),GovBalance, FDI/GDP , and AvgEdu. The coe�cients and standarderrors of the control variables are suppressed to conserve space. See thenotes to Table 1 for detailed de�nitions of the control variables, and thetext for further description of real activity manipulation.Signi�cance: * signi�cant at 10%; ** signi�cant at 5%; *** signi�cantat 1%.
31