Embed Size (px)
Citation preview
The Foreign Service and Foreign Trade:
Embassies as Export Promotion
Andrew K. Rose
NBER and CEPR
1
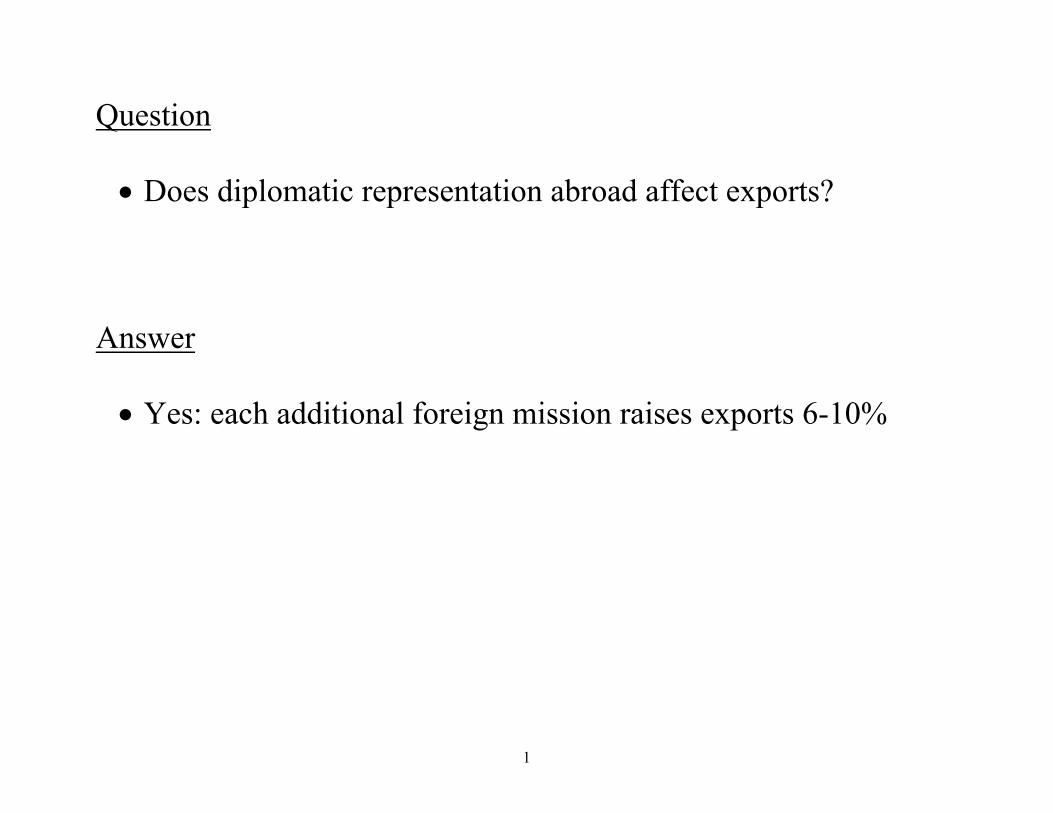
Question
• Does diplomatic representation abroad affect exports?
Answer
• Yes: each additional foreign mission raises exports 6-10%
2
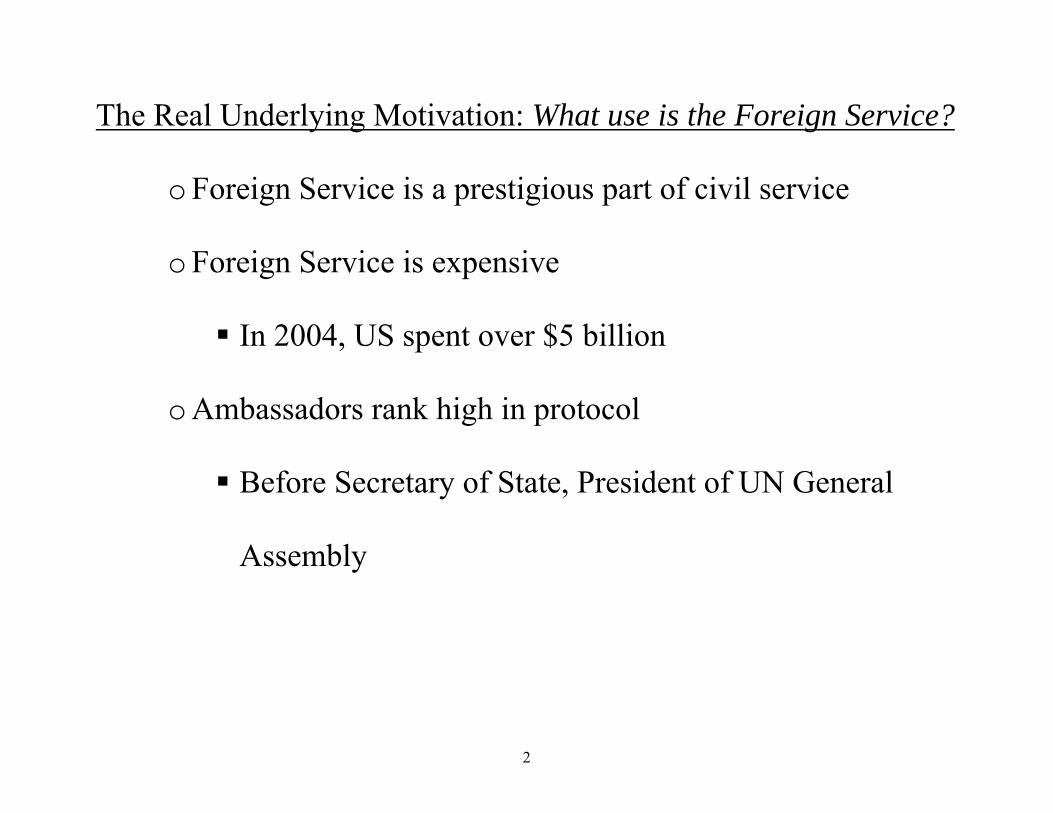
The Real Underlying Motivation: What use is the Foreign Service?
o Foreign Service is a prestigious part of civil service
o Foreign Service is expensive
In 2004, US spent over $5 billion
o Ambassadors rank high in protocol
Before Secretary of State, President of UN General
Assembly

3
Embassies have Much Reduced Importance
o Few decisions made by ambassadors
o Little information advantage
o All because of falling communication cost
In the age of the internet, What is the Role of the Foreign Service?
4
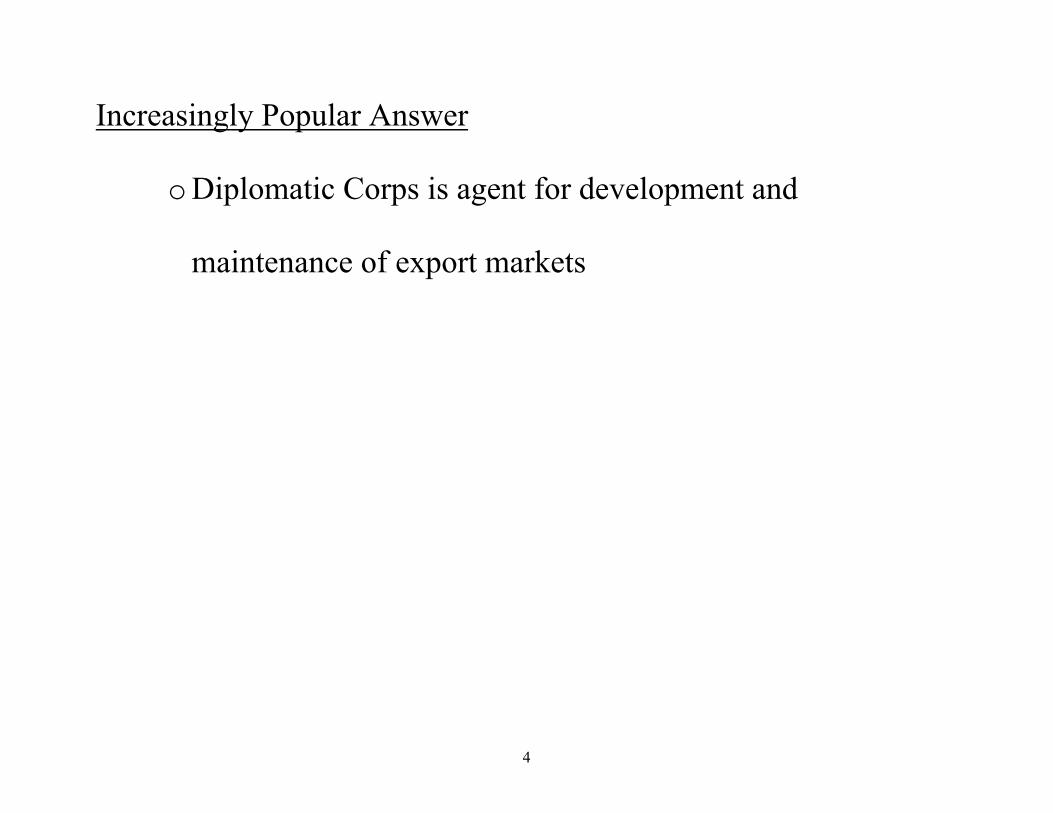
Increasingly Popular Answer
o Diplomatic Corps is agent for development and
maintenance of export markets
5
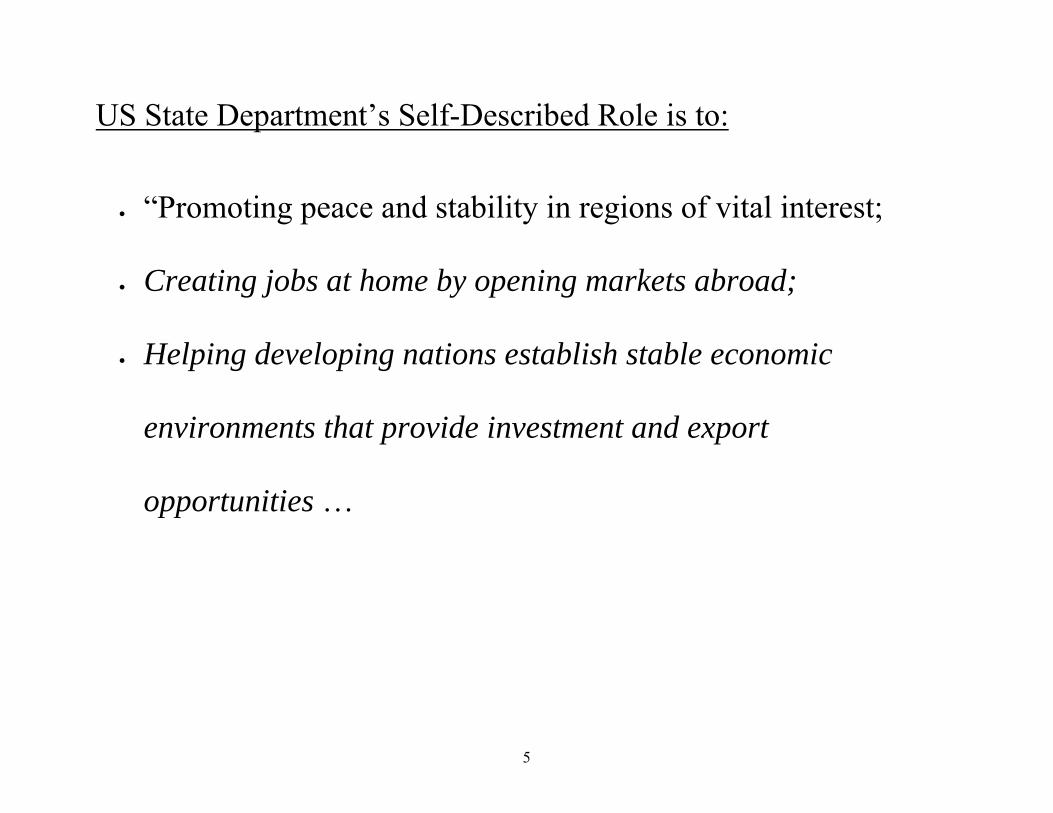
US State Department’s Self-Described Role is to:
• “Promoting peace and stability in regions of vital interest;
• Creating jobs at home by opening markets abroad;
• Helping developing nations establish stable economic
environments that provide investment and export
opportunities …

6
True Elsewhere Too! UK FCO’s role:
“… a range of essential services to the public – from advising British
travellers to issuing UK visas and promoting trade and investment
opportunities overseas.” Further, “The UK is the fifth largest trading
nation: our exports are vital to our national prosperity. One in four jobs
in the UK is linked to business overseas. So the FCO has a key role in
promoting our companies and products abroad. Nearly 1,500 FCO staff
equivalents are engaged in commercial and investment work (about 350
UK-based and just over 1,100 locally-engaged).”
7
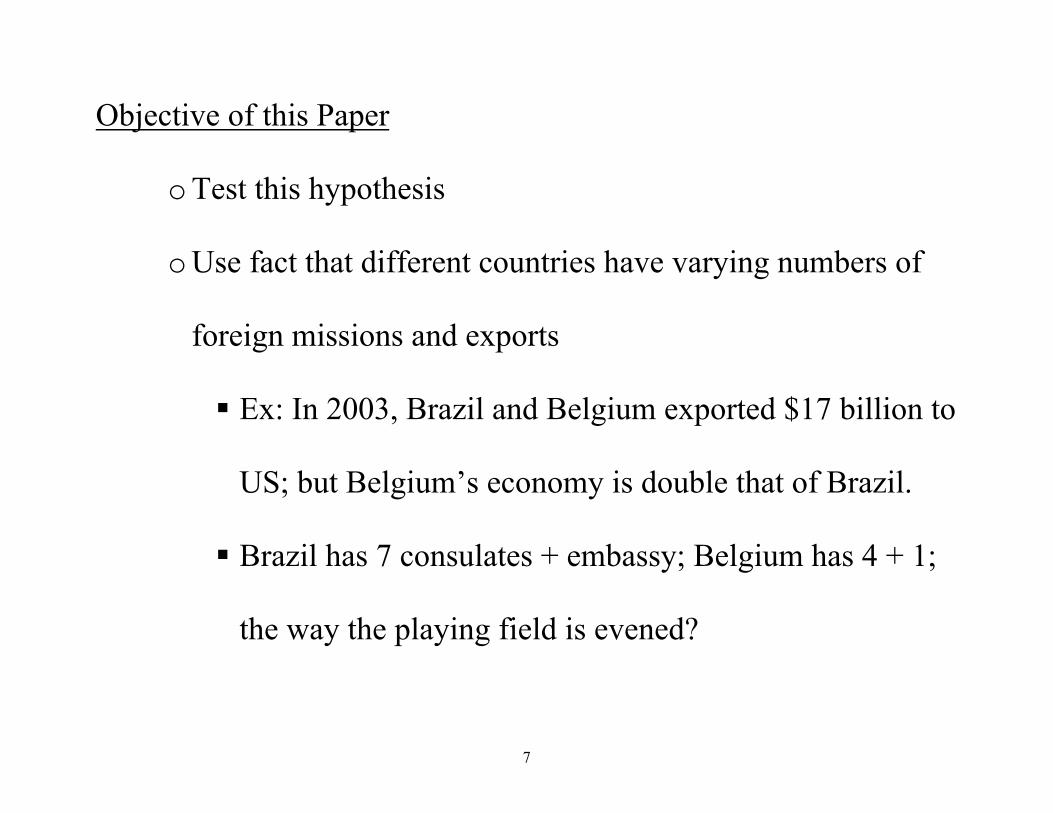
Objective of this Paper
o Test this hypothesis
o Use fact that different countries have varying numbers of
foreign missions and exports
Ex: In 2003, Brazil and Belgium exported $17 billion to
US; but Belgium’s economy is double that of Brazil.
Brazil has 7 consulates + embassy; Belgium has 4 + 1;
the way the playing field is evened?
8
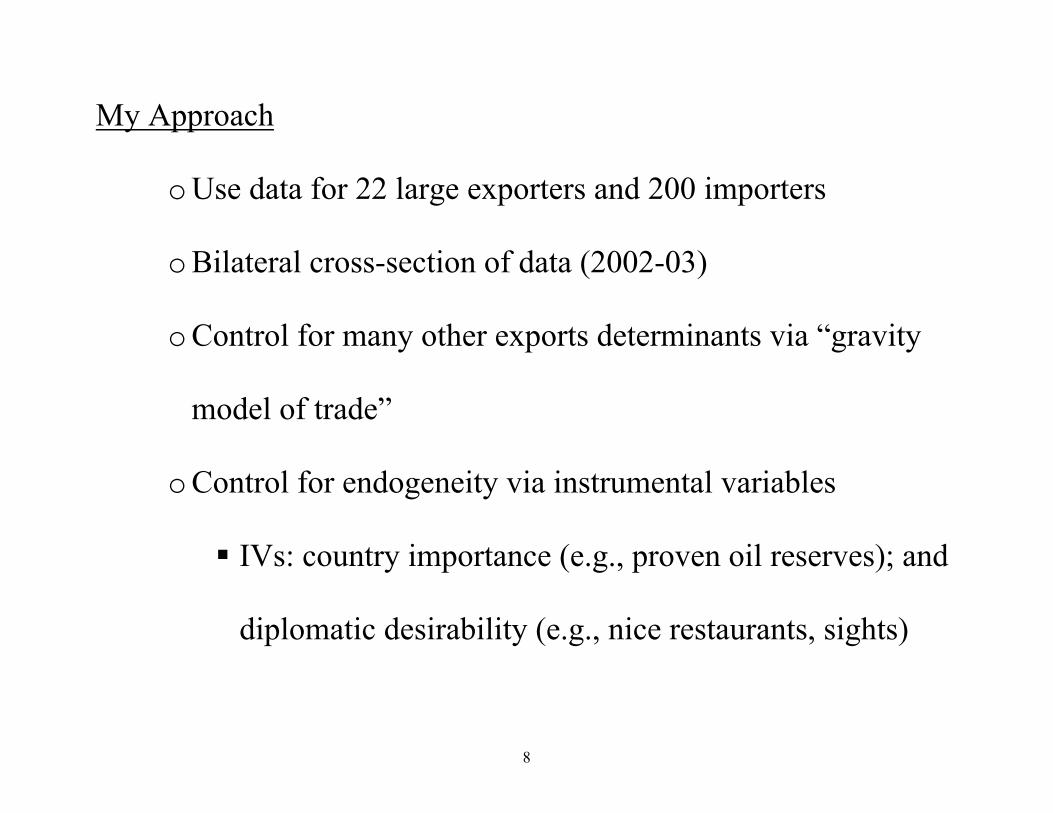
My Approach
o Use data for 22 large exporters and 200 importers
o Bilateral cross-section of data (2002-03)
o Control for many other exports determinants via “gravity
model of trade”
o Control for endogeneity via instrumental variables
IVs: country importance (e.g., proven oil reserves); and
diplomatic desirability (e.g., nice restaurants, sights)

9
Add Foreign Missions to this econometric trade model
o Some embassies cover many countries
Ex: US covers C.A.R. from Chad and Cameroon
o Some countries get only an embassy
Ex: US in Cape Verde
2.Some countries get additional consulates
Ex: US has 6 additional consulates in Canada
10
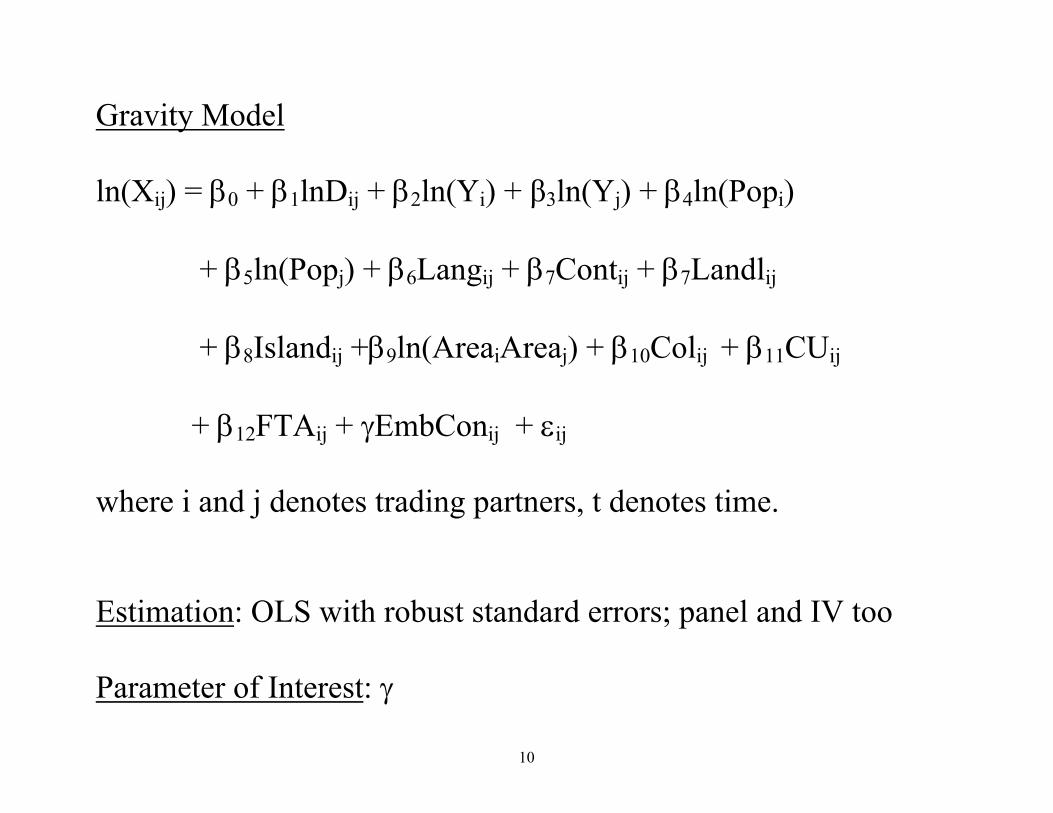
Gravity Model
ln(Xij) = β0 + β1lnDij + β2ln(Yi) + β3ln(Yj) + β4ln(Popi)
+ β5ln(Popj) + β6Langij + β7Contij + β7Landlij
+ β8Islandij +β9ln(AreaiAreaj) + β10Colij + β11CUij
+ β12FTAij + γEmbConij + εij
where i and j denotes trading partners, t denotes time.
Estimation: OLS with robust standard errors; panel and IV too
Parameter of Interest: γ
11
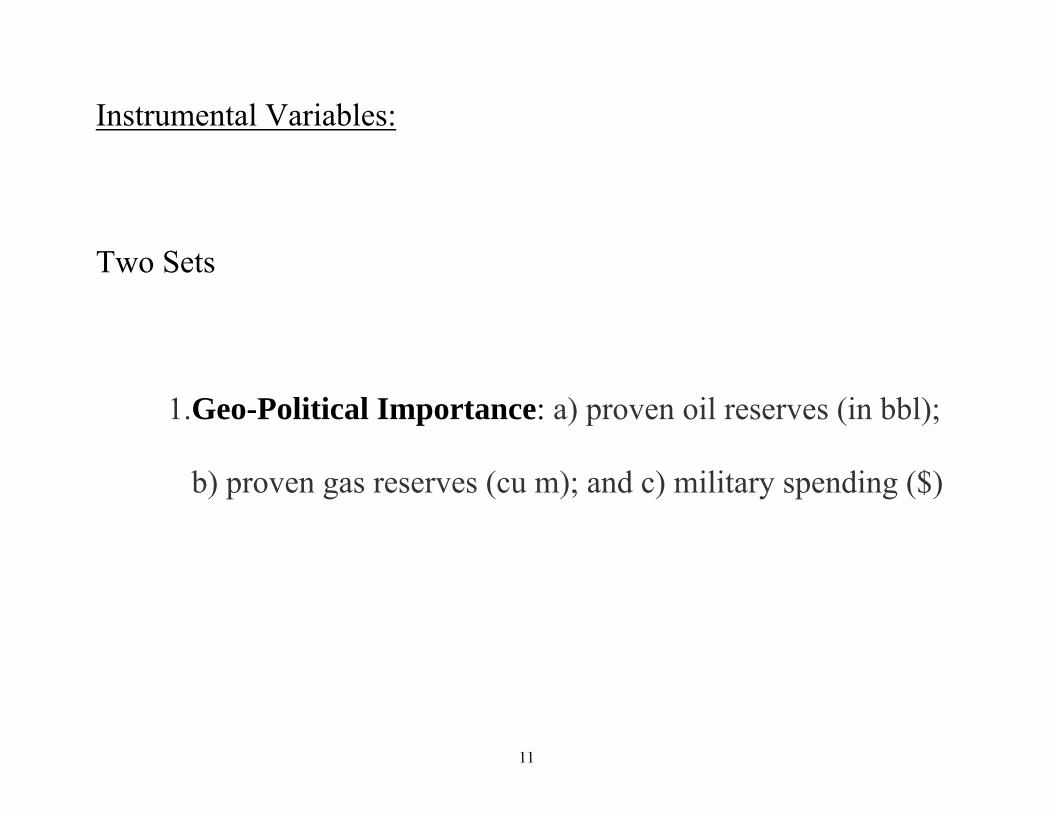
Instrumental Variables:
Two Sets
1.Geo-Political Importance: a) proven oil reserves (in bbl);
b) proven gas reserves (cu m); and c) military spending ($)
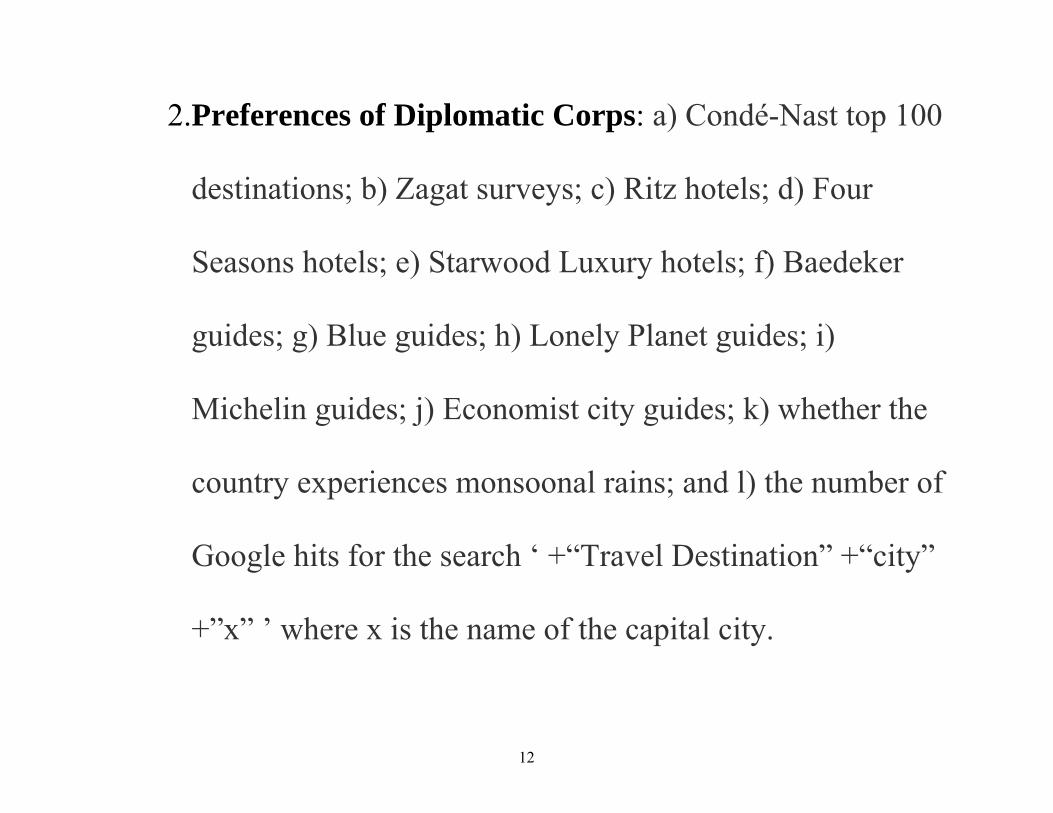
12
2.Preferences of Diplomatic Corps: a) Condé-Nast top 100
destinations; b) Zagat surveys; c) Ritz hotels; d) Four
Seasons hotels; e) Starwood Luxury hotels; f) Baedeker
guides; g) Blue guides; h) Lonely Planet guides; i)
Michelin guides; j) Economist city guides; k) whether the
country experiences monsoonal rains; and l) the number of
Google hits for the search ‘ +“Travel Destination” +“city”
+”x” ’ where x is the name of the capital city.
13
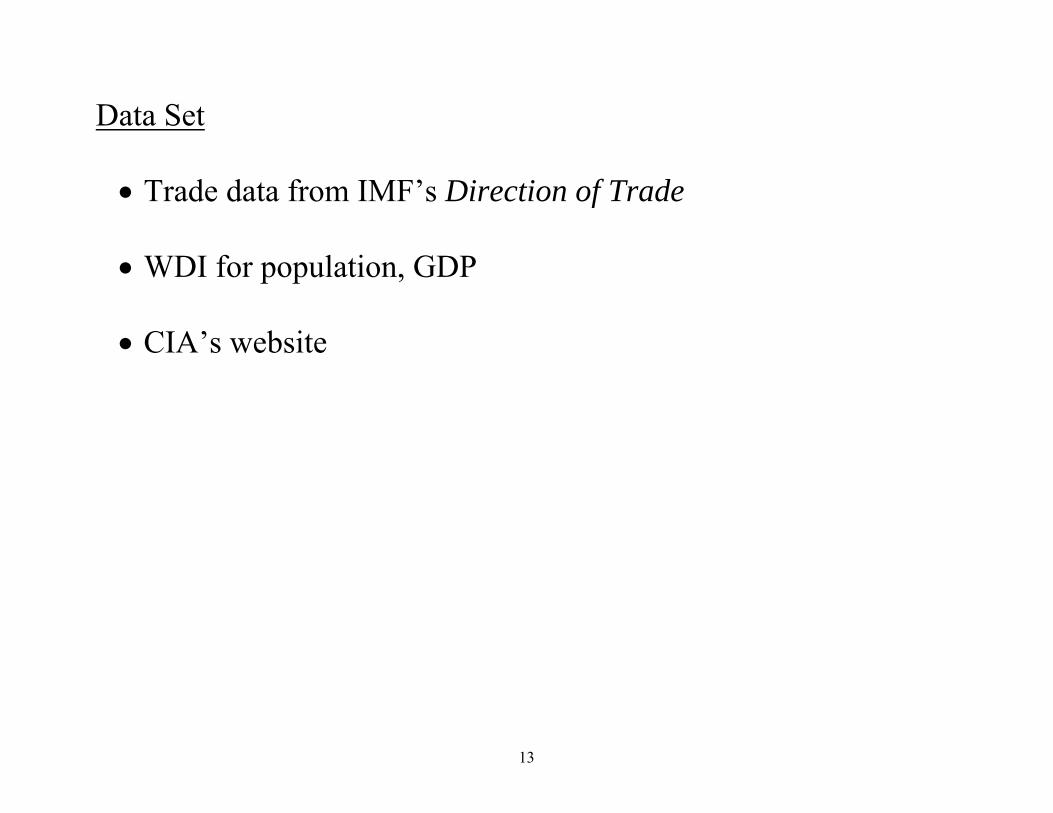
Data Set
• Trade data from IMF’s Direction of Trade
• WDI for population, GDP
• CIA’s website
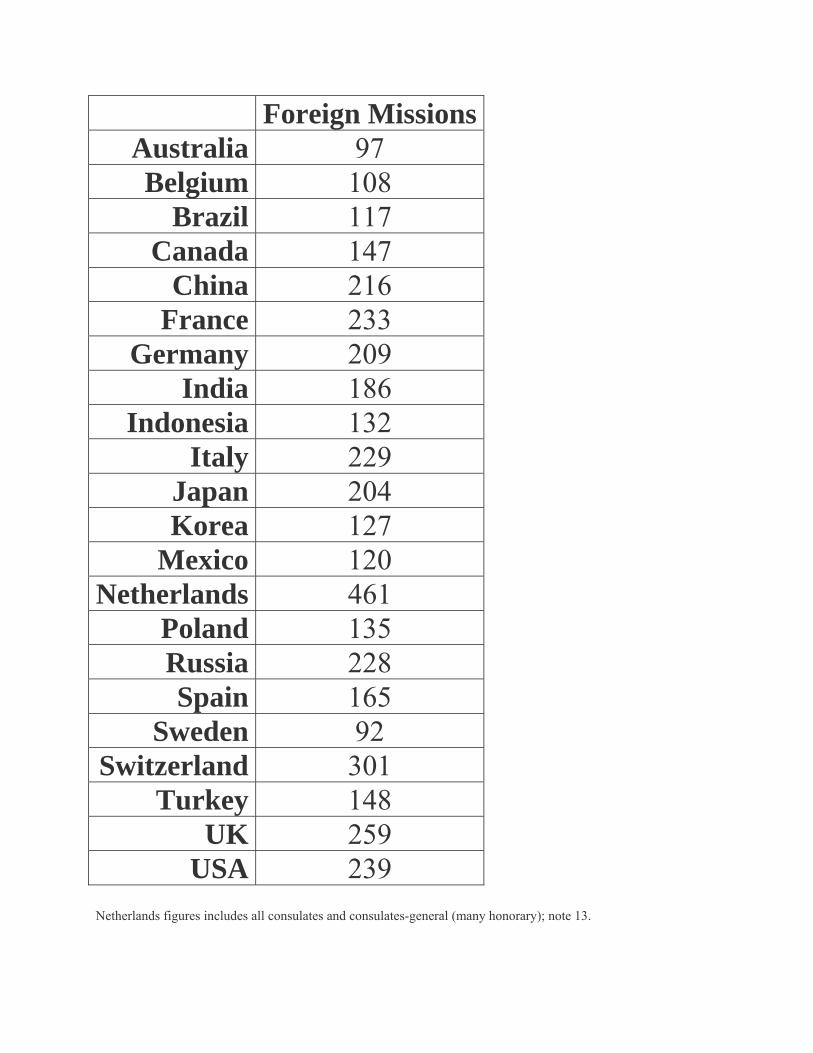
Foreign MissionsAustralia 97 Belgium 108
Brazil 117 Canada 147
China 216 France 233
Germany 209 India 186
Indonesia 132 Italy 229
Japan 204 Korea 127
Mexico 120 Netherlands 461
Poland 135 Russia 228 Spain 165
Sweden 92 Switzerland 301
Turkey 148 UK 259
USA 239 Netherlands figures includes all consulates and consulates-general (many honorary); note 13.

1
Import Destinations
Afghanistan Albania Algeria American Samoa Angola Argentina Aruba Australia
Azerbaijan Antigua & Barbuda Armenia Austria Bahamas Bahrain Bangladesh Barbados
Belize Benin Bhutan Bosnia & Herz. Botswana Brunei Darussalam Bulgaria Burkina Faso Burundi Belarus Belgium Bermuda Bolivia Brazil Cambodia Cameroon Canada Cape Verde Central African Rep. Chad Chile China China, Hong Kong China, Macao
Comoros Congo, Dem. Rep. Costa Rica Cote D’Ivoire Croatia Cuba Czech Rep. Colombia
Congo, Rep Cyprus Denmark Djibouti Dominica Dominican Republic Ecuador Egypt
El Salvador Equatorial Guinea Eritrea Estonia Ethiopia Faeroe Islands Falkland Islands Fiji Finland France French Polynesia Gabon Gambia Georgia Germany Gibraltar Greece Greenland Grenada Guam
Guinea-Bissau Guyana Ghana Guatemala Guinea Haiti Honduras Hungary Iceland India Indonesia Iran
Iraq Ireland Italy Israel Japan Jordan Jamaica Kazakhstan Kenya Kiribati Korea Kuwait
Kyrgyz Rep. Laos Latvia Lebanon Lesotho Liberia Libya Luxembourg
Lithuania Macedonia Madagascar Malaysia Maldives Malta Mauritania Moldova Morocco Myanmar Malawi Mali Mauritius Mexico Mongolia Mozambique
Nepal Netherlands Netherlands Antilles New Caledonia Niger Nigeria North Korea Norway
Namibia Nauru New Zealand Nicaragua Oman Pakistan Palau Panama
Papua New Guinea Paraguay Peru Philippines Poland Portugal Qatar Romania Russia Rwanda Samoa Sao Tome & Principe
Saudi Arabia Senegal Serbia & Montenegro Seychelles Sierra Leone Singapore Slovakia Solomon Islands
Somalia South Africa Spain Sri Lanka St. Helena St. Kitts & Nevis St. Pierre-Miquelon Suriname
Sweden Switzerland Slovenia St. Lucia St. Vincent & Gren. Sudan Swaziland Syria
Tajikistan Tanzania Togo Trinidad & Tobago Tunisia Turkmenistan Tuvalu Thailand Tonga Turkey Uganda Ukraine
United Arab Emirates UK USA Uruguay Uzbekistan Vanuatu Vietnam Venezuela
Wallis-Futuna Yemen Zimbabwe Zambia
2
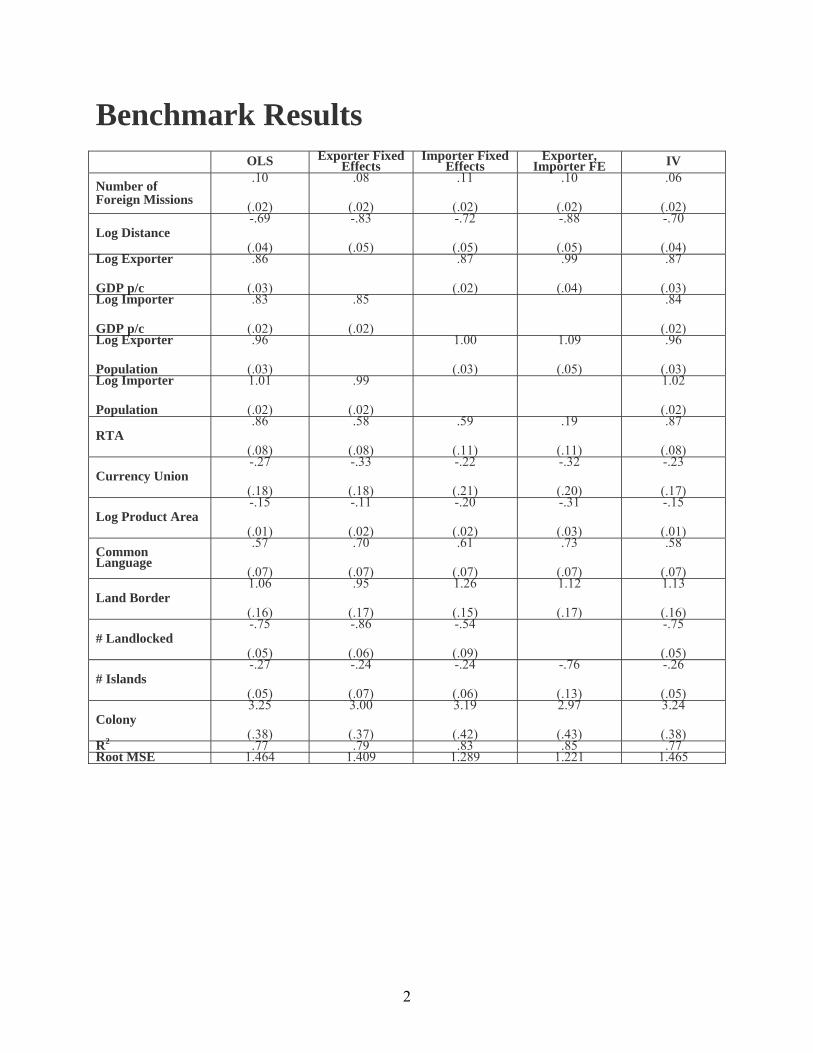
Benchmark Results OLS Exporter Fixed
Effects Importer Fixed
Effects Exporter,
Importer FE IV
Number of Foreign Missions
.10
(.02)
.08
(.02)
.11
(.02)
.10
(.02)
.06
(.02)
Log Distance -.69
(.04)
-.83
(.05)
-.72
(.05)
-.88
(.05)
-.70
(.04) Log Exporter
GDP p/c
.86
(.03)
.87
(.02)
.99
(.04)
.87
(.03) Log Importer
GDP p/c
.83
(.02)
.85
(.02)
.84
(.02) Log Exporter
Population
.96
(.03)
1.00
(.03)
1.09
(.05)
.96
(.03) Log Importer
Population
1.01
(.02)
.99
(.02)
1.02
(.02)
RTA .86
(.08)
.58
(.08)
.59
(.11)
.19
(.11)
.87
(.08)
Currency Union -.27
(.18)
-.33
(.18)
-.22
(.21)
-.32
(.20)
-.23
(.17)
Log Product Area -.15
(.01)
-.11
(.02)
-.20
(.02)
-.31
(.03)
-.15
(.01) Common Language
.57
(.07)
.70
(.07)
.61
(.07)
.73
(.07)
.58
(.07)
Land Border 1.06
(.16)
.95
(.17)
1.26
(.15)
1.12
(.17)
1.13
(.16)
# Landlocked -.75
(.05)
-.86
(.06)
-.54
(.09)
-.75
(.05)
# Islands -.27
(.05)
-.24
(.07)
-.24
(.06)
-.76
(.13)
-.26
(.05)
Colony 3.25
(.38)
3.00
(.37)
3.19
(.42)
2.97
(.43)
3.24
(.38) R2 .77 .79 .83 .85 .77 Root MSE 1.464 1.409 1.289 1.221 1.465
3
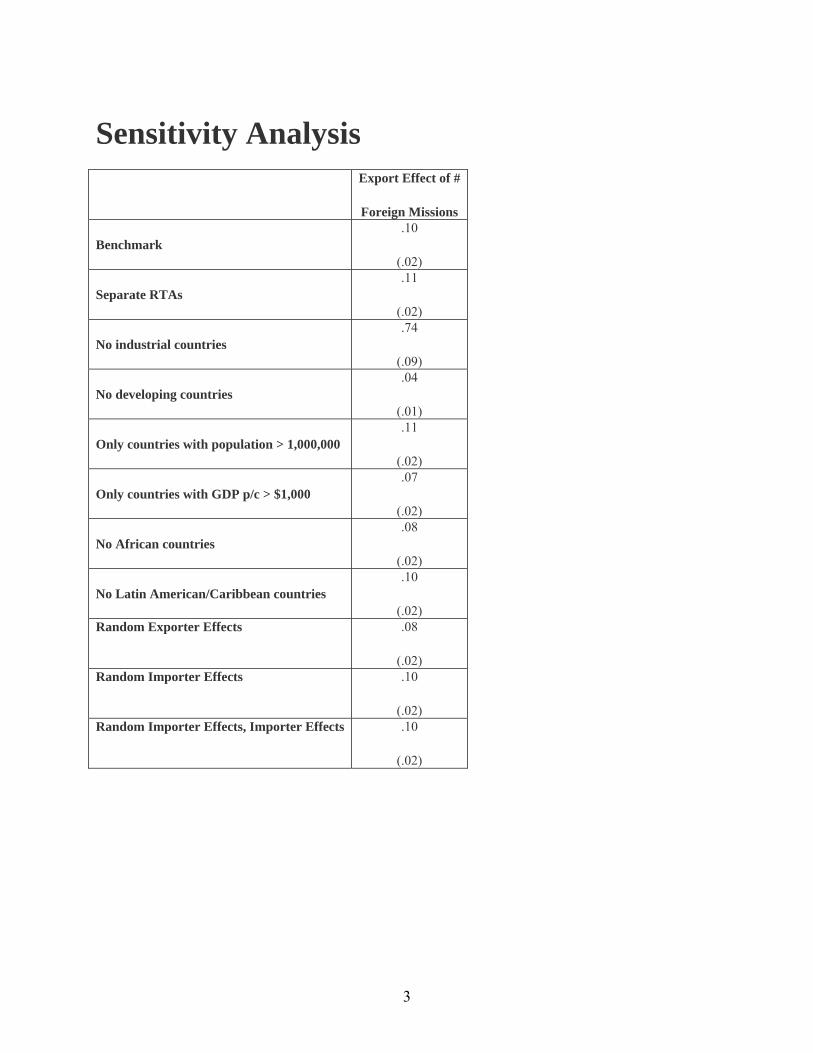
Sensitivity Analysis
Export Effect of #
Foreign Missions
Benchmark .10
(.02)
Separate RTAs .11
(.02)
No industrial countries .74
(.09)
No developing countries .04
(.01)
Only countries with population > 1,000,000 .11
(.02)
Only countries with GDP p/c > $1,000 .07
(.02)
No African countries .08
(.02)
No Latin American/Caribbean countries .10
(.02) Random Exporter Effects .08
(.02) Random Importer Effects .10
(.02) Random Importer Effects, Importer Effects .10
(.02)
4
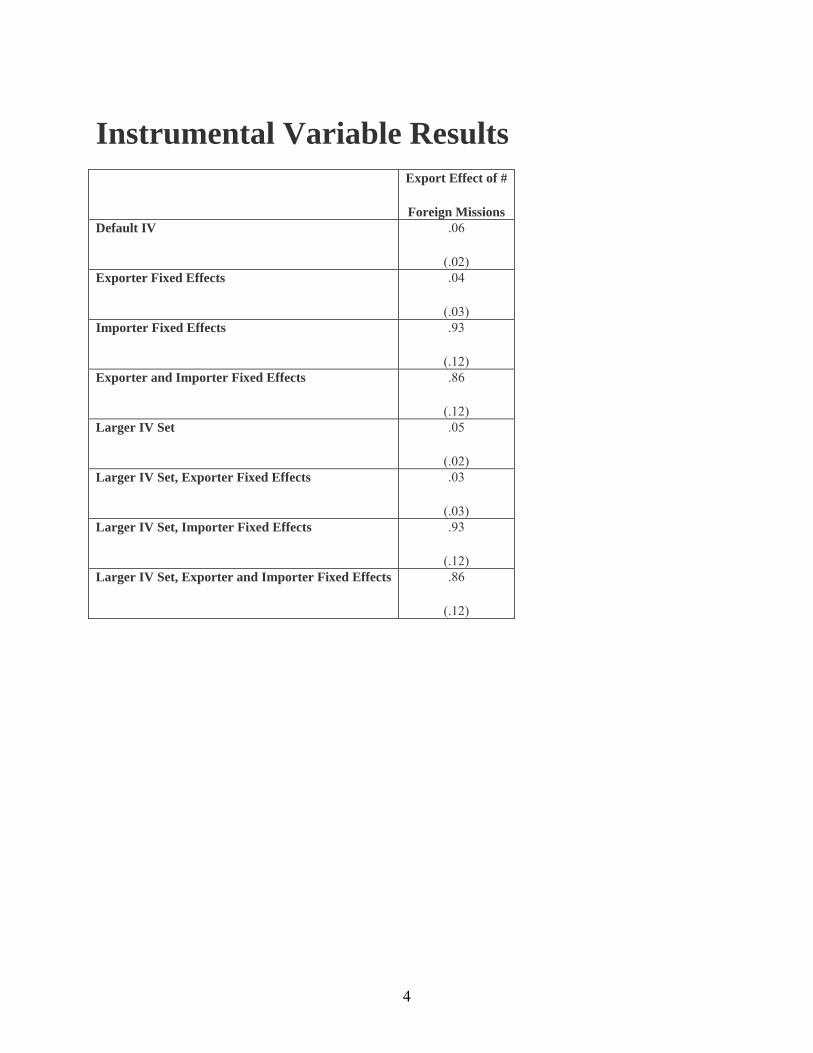
Instrumental Variable Results
Export Effect of #
Foreign Missions Default IV .06
(.02) Exporter Fixed Effects .04
(.03) Importer Fixed Effects .93
(.12) Exporter and Importer Fixed Effects .86
(.12) Larger IV Set .05
(.02) Larger IV Set, Exporter Fixed Effects .03
(.03) Larger IV Set, Importer Fixed Effects .93
(.12) Larger IV Set, Exporter and Importer Fixed Effects .86
(.12)
5
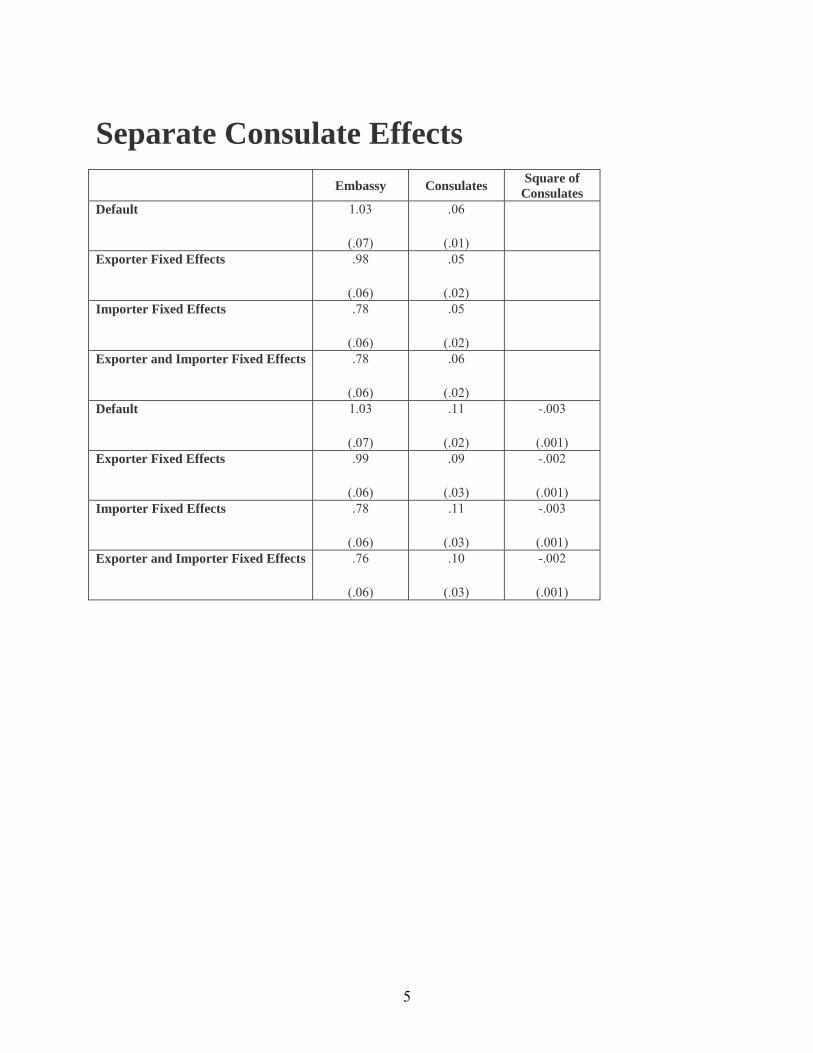
Separate Consulate Effects Embassy Consulates Square of
Consulates Default 1.03
(.07)
.06
(.01)
Exporter Fixed Effects .98
(.06)
.05
(.02)
Importer Fixed Effects .78
(.06)
.05
(.02)
Exporter and Importer Fixed Effects .78
(.06)
.06
(.02)
Default 1.03
(.07)
.11
(.02)
-.003
(.001) Exporter Fixed Effects .99
(.06)
.09
(.03)
-.002
(.001) Importer Fixed Effects .78
(.06)
.11
(.03)
-.003
(.001) Exporter and Importer Fixed Effects .76
(.06)
.10
(.03)
-.002
(.001)
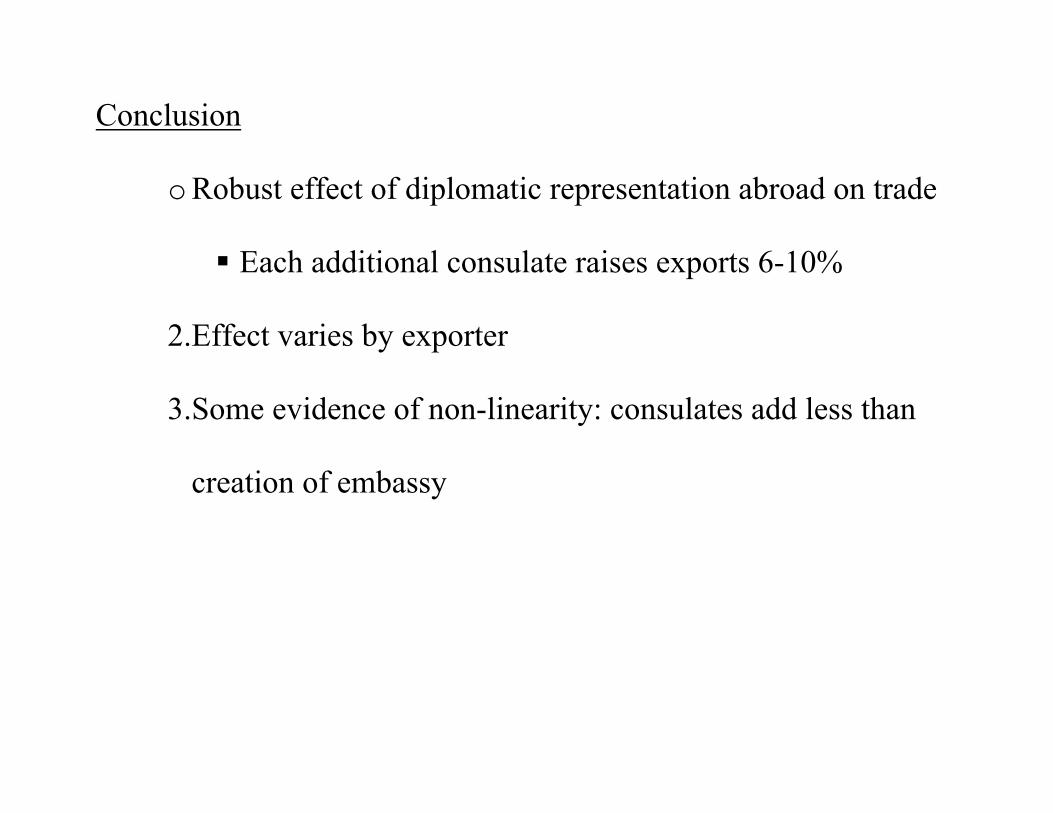
Conclusion
o Robust effect of diplomatic representation abroad on trade
Each additional consulate raises exports 6-10%
2.Effect varies by exporter
3.Some evidence of non-linearity: consulates add less than
creation of embassy