Embed Size (px)
Citation preview

Chapter 21
New Electronic TradingSystems in Foreign Exchange Markets
Dagfinn RimeNorges Bank and Stockholm Institute for Financial Research
I. IntroductionII. The Structure of Foreign
Exchange MarketsA. Information and AgentsB. InstitutionsC. Interbank Trading OptionsD. Transparency
III. Direct Trading and Voice BrokersA. Dealer Behavior
IV. Electronic BrokersA. TransparencyB. LiquidityC. Transaction Costs
469New Economy HandbookCopyright 2003, Elsevier Science (USA). All rights reserved.
D. The Future of Direct Tradingand Voice Brokers
E. Policy ImplicationsV. Internet Trading
A. The Emergence of NonbankCustomer Trading
B. Internet Trading with BanksC. Possible Scenarios
VI. SummaryA. Web Sites on Trading and
NetworksReferences and Further Reading
The foreign exchange market can be divided in two segments: theinterbank market and the customer market. Two advances in tradingtechnology, electronic brokers in the interbank market and internettrading for customers, have significantly changed the structure of theforeign exchange market. In this chapter, we explain the functioningof electronic brokers and internet trading and discuss the economicconsequences. © 2003, Elsevier Science (USA).
EWE21 7/24/03 9:05 PM Page 469
Bid–ask spread Difference between the best buy price (ask) and best sellprice (bid). The initiator of a trade buys at the ask and sells at the lowerbid price. The spread is a measure of transaction costs. The buy price isalso called the “offer.”
Broker Brokers match dealers in the interbank market without being a party to the transactions themselves and without taking positions (cf. dealer).
Call market A market where all traders trade at the same time whencalled upon.
Counterparty credit risk The risk that the market participant on the otherside of a transaction will default. Due to the large trade sizes in foreignexchange markets, credit risk is an important issue.
Dealer A person employed by a bank whose primary business is enteringinto transactions on both sides of wholesale financial markets andseeking profits by taking risks in these markets (cf. broker).
Dealer market Market where orders for execution pass to an inter-mediary (dealer) for execution.
Interbank market The market where dealers trade exclusively with eachother, either bilaterally or through brokers.
Limit order Order to buy a specified quantity up to a maximum price orsell subject to a minimum price (cf. market order).
Liquidity Characteristic of a market where transactions do not exces-sively move prices. It is also easy to have a trade effected quickly without a long search for counterparties (“immediacy”). Liquid marketsusually have low bid–ask spreads, high volume, and (relatively) lowvolatility.
Market maker Dealer ready to quote buy and sell prices upon request.The market maker provides immediacy (liquidity services) to the marketand receives compensation through the spread. There is no formal oblig-ation to quote tight spreads; rather, market making is governed by reciprocity.
Market order Order to buy (or sell) a specified quantity at the best pre-vailing price (cf. limit order).
Order-driven market Market where prices are determined by an orderexecution algorithm from participants sending firm buy and sell orders,which are incorporated into the limit order book (cf. quote-driven ordealer market).
Order flow Signed flow of transactions. The transaction is given a positive (negative) sign if the initiator of the transactions is buying(selling).
Price discovery Determination of prices in a market. Incorporation ofinformation into prices.
470 Rime
EWE21 7/24/03 9:05 PM Page 470
Quote-driven market Refers to a market where market makers post bidand ask quotes upon bilateral request. In the interbank market, theseprices are on a take-it-or-leave-it basis (cf. order-driven market).
Transparency Ability of market participants to observe trade informationin a timely fashion.
I. INTRODUCTION
The 1990s gave us what might prove to be the two biggest changes inforeign exchange market structure since World War II: electronic brokerswere introduced into the interbank market in 1992, and in the late 1990sthe Internet became available as a trading channel for customers. What arethe consequences for the market of these innovations? Is there any reasonto believe that these technological developments have influenced themarket in any significant way? Do not dealers in the foreign exchangemarket still fulfill their function as liquidity providers and aggregate infor-mation in their price setting? And, do not basic macroeconomic variablesstill drive exchange rates, irrespective of trading technology?
In an ideal world with perfect information, these changes to the institu-tions of trading probably would not matter that much at the macro-economic level. In such a world, exchange rates would be determined byexpectations regarding macroeconomic fundamentals like inflation, pro-ductivity growth, and interest rates. Exchange rates will be efficient assetprices when all market participants observe these fundamentals and agreeon how they influence exchange rates. Furthermore, provision of liquiditywould be much less risky than in a situation with imperfect information.However, as empirical evidence has shown all too clearly, models of an idealworld with perfect information do not hold, at least not for horizons shorterthan a year or so.
The microstructure approach to foreign exchange has made somepromising steps toward solving some of these puzzles (see Lyons, 2001a).This approach differs from the traditional macroeconomic approach byallowing for imperfect information and heterogeneous agents and, thereby,leaving a role for trading institutions as such. In such a world, technologi-cal changes such as the introduction of electronic brokers and Internettrading may be significant because they change the structure of the market.A different market structure changes the game played between the market participants. This may influence information aggregation capabili-ties and incentives for liquidity provision and, thereby, different aspects ofmarket quality like efficiency (price discovery), liquidity, and transac-
21. E-Trading Systems in Foreign Exchange Markets 471
EWE21 7/24/03 9:06 PM Page 471
tion costs. We are interested in understanding market structure because a well-functioning foreign exchange market is important for the macro-economy. This chapter considers the impact of technological advances onthe foreign exchange market by focusing on these properties of marketquality.
The new economy and foreign exchange markets is a vast subject. Welimit ourselves to the two major innovations in trading technology becausetrading institutions are an important part of a financial market’s structure.Furthermore, several studies show that trading is important for the determination of exchange rates. There is particular focus on a property of market structure called transparency, i.e., how much of the tradingprocess market participants can observe. Because trading is an importantdeterminant of exchange rates, observation of the trading process is important to enable dealers to set the “correct” exchange rates. On a moregeneral level, transparency relates to how efficiently dealers can aggregateinformation.
There are of course many other uses of information and communicationtechnology (ICT) that have obviously influenced the markets that we donot address here. These include information providers such as Reuters and Bloomberg, computers’ calculation capabilities and the importance for option trading, and of course network technologies and computers ingeneral. Two other technological innovations deserving special atten-tion that we do not consider are the newly started settlement service CLS Bank (Continuous Linked Settlement), which went live on September9, 2002, and the netting technology FXNet. The former links all participat-ing countries’ payment systems for real-time settlement. With such a system in place in 1974, the famous Bankhaus Herstatt default would never had happened. FXNet is a technology for netting out gross lia-bilities. Both are very important for the handling of counterparty credit risk.
Sections II and III provide the background for the introduction of elec-tronic brokers and Internet trading. A brief description and history aregiven of the structure of the market prior to these innovations, followed bysome considerations that dealers take into account in their trading. Thetrading institutions of the 1980s are referenced to clarify the differences.Section IV discusses electronic brokers, whereas Section V discusses Inter-net trading. Section VI provides a summary.
472 Rime
EWE21 7/24/03 9:06 PM Page 472
II. THE STRUCTURE OF FOREIGN EXCHANGEMARKETS
Before we discuss electronic brokers and Internet trading, we need anoverview of the general structure of the foreign exchange market so as tobe able to understand the impact of these new trading institutions.Althoughelectronic brokers were undoubtedly the most significant structural changein the 1990s, the general description given here is valid for the structureboth before and after the introduction of electronic brokers. The reason isthat brokers were present in the market before electronic brokers wereintroduced. The introduction of Internet trading, on the other hand, is stillvery recent, but it may prove to be the most significant structural shift ofthe first decade of the twenty-first century. This shift has the potential tooverthrow the general structure of the market completely, a point that wecome back to in Section V.
A. INFORMATION AND AGENTS
The foreign exchange market is the oldest and largest financial marketin the world, with $1200 billion changing hands every day (April 2001).1
These trades can be divided into interbank trades and customer trades, rep-resenting the two segments of the market. In the interbank market, tradingis either direct (bilateral or taking place between dealers) or brokered(interdealer trades). Prior to the advent of the Internet, customers tradedonly with banks. We could have added customer-to-customer Internet-based trading sites, but we feel it is too early to pay them the same atten-tion as the three methods already mentioned (interbank, both direct andbrokered, and customer–bank). In the 1990s, the market was often dividedinto three groups: customers, dealers, and brokers. However, as brokeringbecomes more and more electronic and also is open to customers throughthe Internet, we feel that it is more natural to focus on two main groups oftraders: customers and dealers. The customers are the ultimate end-users ofcurrency, and they typically make the largest single trades. Customers maybe central banks, governments, importers and exporters of goods, and finan-cial institutions like hedge funds.
Important characteristics of the foreign exchange market are that cus-tomers do not have access to the interbank market and that they do nottrade with each other (except on the customer-to-customer sites mentioned
21. E-Trading Systems in Foreign Exchange Markets 473
1This number includes spot, forward, and swap volumes. In the following, we will focus onspot trading because spot is the most fundamental.
EWE21 7/24/03 9:06 PM Page 473
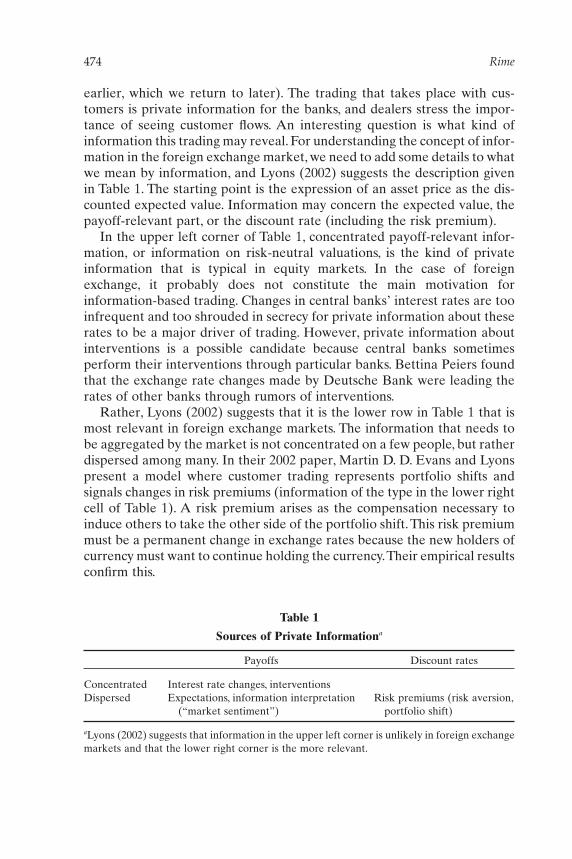
earlier, which we return to later). The trading that takes place with cus-tomers is private information for the banks, and dealers stress the impor-tance of seeing customer flows. An interesting question is what kind ofinformation this trading may reveal. For understanding the concept of infor-mation in the foreign exchange market, we need to add some details to whatwe mean by information, and Lyons (2002) suggests the description givenin Table 1. The starting point is the expression of an asset price as the dis-counted expected value. Information may concern the expected value, thepayoff-relevant part, or the discount rate (including the risk premium).
In the upper left corner of Table 1, concentrated payoff-relevant infor-mation, or information on risk-neutral valuations, is the kind of privateinformation that is typical in equity markets. In the case of foreignexchange, it probably does not constitute the main motivation for information-based trading. Changes in central banks’ interest rates are tooinfrequent and too shrouded in secrecy for private information about theserates to be a major driver of trading. However, private information aboutinterventions is a possible candidate because central banks sometimesperform their interventions through particular banks. Bettina Peiers foundthat the exchange rate changes made by Deutsche Bank were leading therates of other banks through rumors of interventions.
Rather, Lyons (2002) suggests that it is the lower row in Table 1 that ismost relevant in foreign exchange markets. The information that needs tobe aggregated by the market is not concentrated on a few people, but ratherdispersed among many. In their 2002 paper, Martin D. D. Evans and Lyonspresent a model where customer trading represents portfolio shifts andsignals changes in risk premiums (information of the type in the lower rightcell of Table 1). A risk premium arises as the compensation necessary toinduce others to take the other side of the portfolio shift.This risk premiummust be a permanent change in exchange rates because the new holders ofcurrency must want to continue holding the currency.Their empirical resultsconfirm this.
474 Rime
Table 1
Sources of Private Informationa
Payoffs Discount rates
Concentrated Interest rate changes, interventionsDispersed Expectations, information interpretation Risk premiums (risk aversion,
(“market sentiment”) portfolio shift)
aLyons (2002) suggests that information in the upper left corner is unlikely in foreign exchangemarkets and that the lower right corner is the more relevant.
EWE21 7/24/03 9:06 PM Page 474
We can also make an argument for the lower left cell. Because no modelso far has proven to be the correct model for exchange rates, agents arelikely to have different views on exchange rates. Customers’ trading countsthe “votes” of the customers on where the exchange rate is heading. Thehypothesis that information is dispersed has implications for optimalmarket structure: what kind of trading institutions are best fit for aggre-gating dispersed information? We come back to this in Section IV.
B. INSTITUTIONS
The market structure has not always been like the present structure.Prior to telecommunications, trading in foreign exchange markets could bedescribed as a centralized call market. Trading in foreign exchange can betraced back to ancient times, when foreign exchange trading was a way tocircumvent the ban on usury. In the sixteenth century, trading in foreignexchange occurred every third month at fairs in the Genoa area, each ofwhich lasted for 8 days.2 However, telecommunications changed the generalstructure of the foreign exchange market, and it has been more or less unal-tered from the early 1930s up to the present.3 Drawing on the theory of themicrostructure of financial markets, we can describe the current interbankforeign exchange market as follows:
1. Trading is decentralized across several locations, as opposed tocentralized on an exchange as is the case in many equity markets.
2. There is continuous trading around the clock, as opposed to onlywhen called upon as in a call market.
3. There are several dealers that provide liquidity, as opposed to thespecialist on the NYSE floor in earlier days, for example.
4. Liquidity is both quote-driven, i.e., created by quoting bid and askprices in response to trading initiatives (market making or dealermarket), and order-driven, i.e., by entering limit orders with brokers(auction market).
5. The market is relatively opaque, i.e., has low transparency comparedwith many equity markets.
21. E-Trading Systems in Foreign Exchange Markets 475
2The Genoa fairs lasted from 1532 to 1763 [see chapters by M. de Cecco in Newman et al.(1992)]. After this, Amsterdam and then London took over as the main location for currencytrading.
3It is difficult to find information on market structure from earlier periods. Several brokersstarted up in London in the 1930s with brokering over the telephone. Really active trading inforeign exchange, however, did not start until the mid-1960s, when regulations were eased inseveral European countries.
EWE21 7/24/03 9:06 PM Page 475
The introduction of telecommunications allowed decentralized trade ofthe asset foreign exchange, as is most natural. Banks want to be presentwhere the customers are, and because an exchange rate is the relative priceof two assets from two different countries, it is natural to have a decen-tralized market. Given that customers are in different time zones and mayhave an interest in the same asset, say $, trading must also be continuousaround the clock. Finally, given the geographical pattern of customers andthe fact that several banks serve them, it is natural to have a number ofdealers acting as liquidity providers in each currency pair. The decentral-ized structure also makes it very difficult to regulate foreign exchangetrading, and the market structure has therefore evolved endogenously.These factors, together with the lack of regulatory disclosure requirements,mean that the foreign exchange markets are characterized by low transparency.
All of this has economic consequences. Low transparency means that fewof the dispersed signals that order flow may reveal will be observed by asingle dealer. In a centralized call market, which is more transparent, infor-mation aggregation will typically be faster and more accurate. The lack ofregulation is also important. Disclosure requirements are imposed onequity markets so that more trading, and hence more information, isobserved by the market participants. As will be discussed later, the tradinginstitutions also have implications for risk sharing.
C. INTERBANK TRADING OPTIONS
Foreign exchange trading typically follows a sequence. Customers’trading is the primary source of currency demand, and the sequence startswith a customer contacting her bank with a wish to trade (dealers nevertake the initiative). The bank acts as market maker and gives quotes to thecustomer. Customers do not have access to the interbank market, so anexporter cannot contact his counterparty or the counterparty’s bankdirectly. For a customer, trading with the counterparty directly involvescredit risk, which could be handled more efficiently by a bank. A dealer inthe bank then turns to the interbank market to cover the customer trade.Interbank trading actually accounts for between 60% and 80% of the totalvolume of foreign exchange trading, and we will come back to this issue inthe next section because it is closely related to trading institutions.
In the interbank market, the dealer has several options, as illustrated bythe 2 ¥ 2 matrix in Table 2. In a multiple-dealer market, the dealer maychoose to provide liquidity as a market maker and give quotes when con-tacted by other dealers (incoming trade), or he may trade on other market
476 Rime
EWE21 7/24/03 9:06 PM Page 476
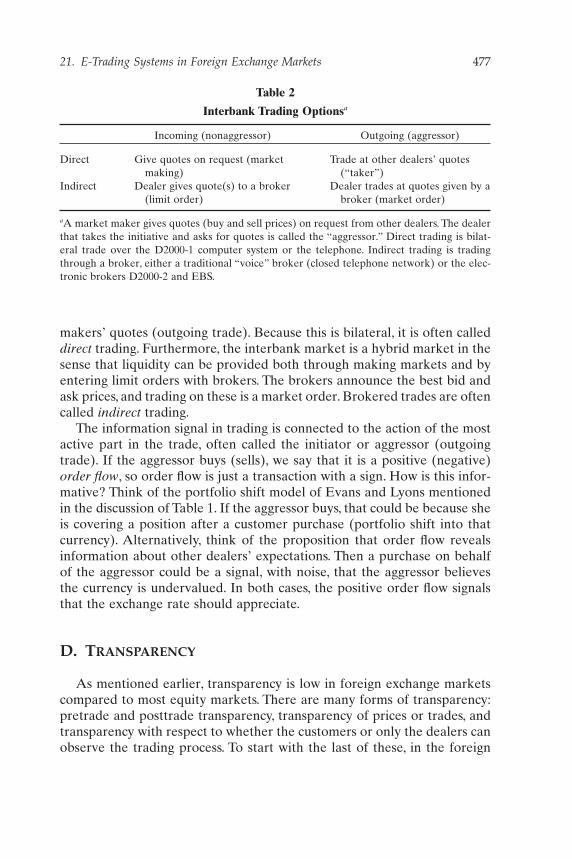
makers’ quotes (outgoing trade). Because this is bilateral, it is often calleddirect trading. Furthermore, the interbank market is a hybrid market in thesense that liquidity can be provided both through making markets and byentering limit orders with brokers. The brokers announce the best bid andask prices, and trading on these is a market order. Brokered trades are oftencalled indirect trading.
The information signal in trading is connected to the action of the mostactive part in the trade, often called the initiator or aggressor (outgoingtrade). If the aggressor buys (sells), we say that it is a positive (negative)order flow, so order flow is just a transaction with a sign. How is this infor-mative? Think of the portfolio shift model of Evans and Lyons mentionedin the discussion of Table 1. If the aggressor buys, that could be because sheis covering a position after a customer purchase (portfolio shift into thatcurrency). Alternatively, think of the proposition that order flow revealsinformation about other dealers’ expectations. Then a purchase on behalfof the aggressor could be a signal, with noise, that the aggressor believesthe currency is undervalued. In both cases, the positive order flow signalsthat the exchange rate should appreciate.
D. TRANSPARENCY
As mentioned earlier, transparency is low in foreign exchange marketscompared to most equity markets. There are many forms of transparency:pretrade and posttrade transparency, transparency of prices or trades, andtransparency with respect to whether the customers or only the dealers canobserve the trading process. To start with the last of these, in the foreign
21. E-Trading Systems in Foreign Exchange Markets 477
Table 2
Interbank Trading Optionsa
Incoming (nonaggressor) Outgoing (aggressor)
Direct Give quotes on request (market Trade at other dealers’ quotes making) (“taker”)
Indirect Dealer gives quote(s) to a broker Dealer trades at quotes given by a(limit order) broker (market order)
aA market maker gives quotes (buy and sell prices) on request from other dealers. The dealerthat takes the initiative and asks for quotes is called the “aggressor.” Direct trading is bilat-eral trade over the D2000-1 computer system or the telephone. Indirect trading is tradingthrough a broker, either a traditional “voice” broker (closed telephone network) or the elec-tronic brokers D2000-2 and EBS.
EWE21 7/24/03 9:06 PM Page 477
exchange markets only the dealers can observe anything other than theirown trading. The trades with customers that initiate the trading sequenceare only observed by the bank that receives the order and, hence, areprivate information for the banks. In the interbank market, trades that aremade directly between two dealers are only observed by the two dealers.The lack of disclosure requirements also ensures that these trades will notbe observed by other dealers after the trade is made. Indirect trading ismore transparent because the price and sign (buying or selling by theaggressor) of the last trades are observable. In this sense, trading throughbrokers is what determines the level of trade transparency. This level hasevolved endogenously as a result of dealers’ indirect trading.
Price transparency is higher than trade transparency, but until recentlycustomers’ ability to see prices was less than that of dealers. However, com-pared to many equity markets with indirect trading, transparency is still low.In many equity markets a trader may be able to see the identity of the bestbid and ask and often also a part of or the entire order book (all the otherlimit orders). In the case of a trade, both the size and the identity of thecounterparties are revealed in many equity markets.
III. DIRECT TRADING AND VOICE BROKERS
In this section, we provide a further elaboration on the working of theinterbank market prior to the electronic brokers by discussing how indirectand direct trading actually functions and affects dealers’ behavior. As men-tioned earlier, the trading institutions have been more or less unaltered fora long time, perhaps since the early 1930s when the first telephone brokersstarted. The composition of direct versus indirect trading has changed overtime, however. For telephone brokers, the main innovation came in the1960s when brokers started operating through private telephone networks.These are installed free of charge in banks by brokers. The brokerannounces the best (limit order) bid and ask prices over intercoms at thedealers’ desk. If the dealer wants to trade at a limit order, i.e., submit amarket order, he picks up the phone with the direct line and just says“mine” if he is buying (at the ask price) and “yours” if he is selling (at thebid price). The voice broker then knows which of the two announced pricesat which he is trading. After a trade the broker announces the price andwhether it was traded on the bid or the ask price. The size of the trade isnot announced, but standard sizes are 1 and 5 million. This announcementwas the only signal on marketwide order flow that the dealer received.Tele-phone brokers are often called voice brokers due to the announcementsover intercom systems. Voice brokers were very popular up to the mid-
478 Rime
EWE21 7/24/03 9:06 PM Page 478

1980s at least. The main advantage for the dealers is that the dealer staysanonymous until the trade is made.
Direct trading was made by telephone or telex in the 1970s. In February1981, Reuters introduced the Reuters Market Data Service (RMDS), whichwas like a bilateral bulletin board for conveying trading interest, for sub-sequent trading over the telephone. This system was replaced in 1987 byReuters Dealing 2000-1, a closed network for bilateral electronic commu-nication. Although a system for electronic trading, it did not revolutionizethe market. The D2000-1 is more like an advanced telephone and made thedirect trading that used to take place over the telephone more efficient.D2000-1 quickly became the dominant tool for trading bilaterally. Thedealers “chat” in much the same manner as with “instant messengers” onthe Internet. Furthermore, trade tickets, needed to check trades and for set-tlement with counterparties, were sent automatically to the back office, andthe dealer could trade faster and more efficiently with up to four conver-sations going simultaneously. With this system in place, direct tradingstarted to take market share from voice brokers, and in the late 1980s toearly 1990s, interbank volume was split 50/50 between direct trading andvoice brokers.
Table 3 reports some volume numbers from the United Kingdom, UnitedStates, and Japan, the three largest single markets, to help us get an idea ofthe size of the market. First we notice that in London alone there is tradingfor over $500 billion each day, down from over $630 in 1998. The foreignexchange market had grown rapidly from the collapse of Bretton Woods inthe early 1970s, until the downturn in volume that we see from 1998. Totalvolume has decreased similarly, down to $1200 billion in 2001 from $1490billion in 1998. We will come back to the downturn in the next section. Theincrease in volume through the 1980s and 1990s was primarily driven byincreased globalization, a dramatic increase in trading with customers in thelate 1980s, and more banks entering the foreign exchange market.The intro-duction of D2000-1 might, however, have been a useful trading tool in thisprocess. Not only could the system handle more trades simultaneously (thedealer could contact four market makers simultaneously) but D2000-1 alsomade cross-border trading easier. Voice brokers are quite regional. Thereare New York-based, London-based, Frankfurt-based, and Tokyo-basedbrokers, brokers serving Scandinavia, etc. Chatting electronically seems tobe less hampered by borders.
Notice also the high interbank share of foreign exchange volume in Table3. During the 1990s, the interbank share was between 60% and 80%,possibly at the high end for financial centers. This has been interpreted asspeculative trading on the part of the banks, because it cannot be relatedto goods trading, etc. However, within this trading structure with a high
21. E-Trading Systems in Foreign Exchange Markets 479
EWE21 7/24/03 9:06 PM Page 479
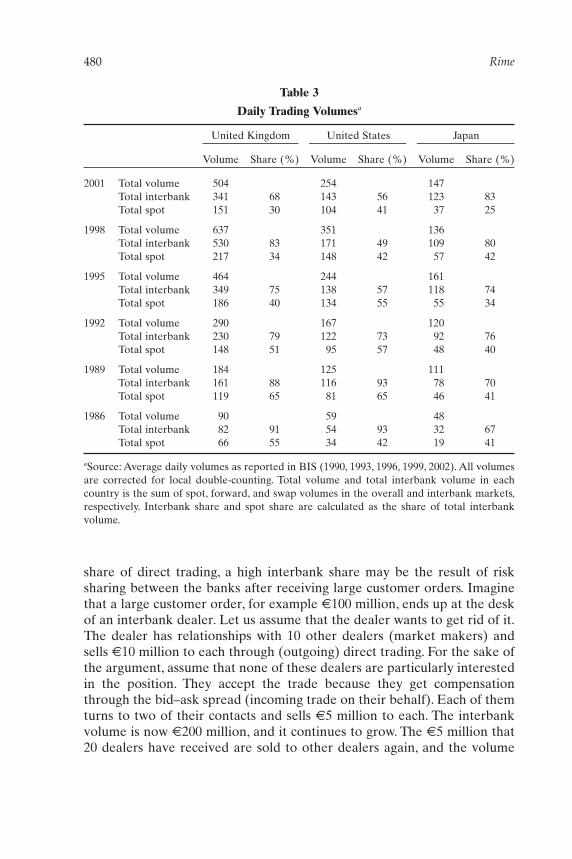
share of direct trading, a high interbank share may be the result of risksharing between the banks after receiving large customer orders. Imaginethat a large customer order, for example €100 million, ends up at the deskof an interbank dealer. Let us assume that the dealer wants to get rid of it.The dealer has relationships with 10 other dealers (market makers) andsells €10 million to each through (outgoing) direct trading. For the sake ofthe argument, assume that none of these dealers are particularly interestedin the position. They accept the trade because they get compensationthrough the bid–ask spread (incoming trade on their behalf). Each of themturns to two of their contacts and sells €5 million to each. The interbankvolume is now €200 million, and it continues to grow. The €5 million that20 dealers have received are sold to other dealers again, and the volume
480 Rime
Table 3
Daily Trading Volumesa
United Kingdom United States Japan
Volume Share (%) Volume Share (%) Volume Share (%)
2001 Total volume 504 254 147Total interbank 341 68 143 56 123 83Total spot 151 30 104 41 37 25
1998 Total volume 637 351 136Total interbank 530 83 171 49 109 80Total spot 217 34 148 42 57 42
1995 Total volume 464 244 161Total interbank 349 75 138 57 118 74Total spot 186 40 134 55 55 34
1992 Total volume 290 167 120Total interbank 230 79 122 73 92 76Total spot 148 51 95 57 48 40
1989 Total volume 184 125 111Total interbank 161 88 116 93 78 70Total spot 119 65 81 65 46 41
1986 Total volume 90 59 48Total interbank 82 91 54 93 32 67Total spot 66 55 34 42 19 41
aSource: Average daily volumes as reported in BIS (1990, 1993, 1996, 1999, 2002). All volumesare corrected for local double-counting. Total volume and total interbank volume in eachcountry is the sum of spot, forward, and swap volumes in the overall and interbank markets,respectively. Interbank share and spot share are calculated as the share of total interbankvolume.
EWE21 7/24/03 9:06 PM Page 480
reaches €300 million! The customer trade is passed on like a “hot potato.”When the process comes to an end, all dealers, including our initial dealer,hold a share of the initial customer order. Large interbank trading flowscould, in other words, be a consequence of a market structure with a highshare of direct trading.
A. DEALER BEHAVIOR
How do the dealers behave in such a hybrid market? We can use thedealer studied by Lyons in 1992 (see Lyons, 2001a) as an example of howa market maker works. The dealer operated as a market maker in a NewYork investment bank in 1992 and traded almost entirely by giving quoteson the D2000-1 system (market making e.g., direct incoming trading).
A market maker sets bid and ask prices, the difference being the spreadand the midpoint typically being her expectation. The spread is a functionof three components: (i) adverse selection protection; (ii) risk management;and (iii) order processing costs and rents. To discourage informed tradersand make money from the uninformed (she always loses to the betterinformed), the market maker increases the spread with trade size, hence,making it more expensive to trade. Similarly, the spread increases with size as compensation for taking on the risk in the trade. The part of thespread due to order processing costs and rents is usually modeled as a constant.
The spread is measured in “pips,” with one pip being the fourth decimalin most exchange rates (the fifth in £ exchange rates). The median spreadfor the dmark/$ dealer studied by Lyons (2001a) was three pips, and themedian trade size was $3 million. Geir Bjønnes and Dagfinn Rime find, insimilar data for direct trading from 1998, a median spread of two pips, witha median trade size of $1 million. The spread was relatively constant up to$5 million. This may seem like a tiny transaction cost. If the dmark/$ wastrading at 1.8, then a two-pip spread is only slightly more than one basispoint (1%/100), and buying $1 million would cost approximately $55. Whenone realizes that, in April 1998, dmark/$ was traded for almost $100 billiondaily in the interbank market alone (corrected for double counting), therisk sharing process mentioned earlier becomes quite expensive ($5.5million daily in interbank dmark/$ trading alone).
The dealer that makes the contact (aggressor) asks for bid and ask pricesfor a given size without revealing his trading intentions. In “direct” trading,market makers are expected to give tight quotes promptly on request, andthe aggressor is similarly expected to reply quickly. The quotes are on atake-it-or-leave-it basis. If there is a trade, the server analyzes the conver-
21. E-Trading Systems in Foreign Exchange Markets 481
EWE21 7/24/03 9:06 PM Page 481
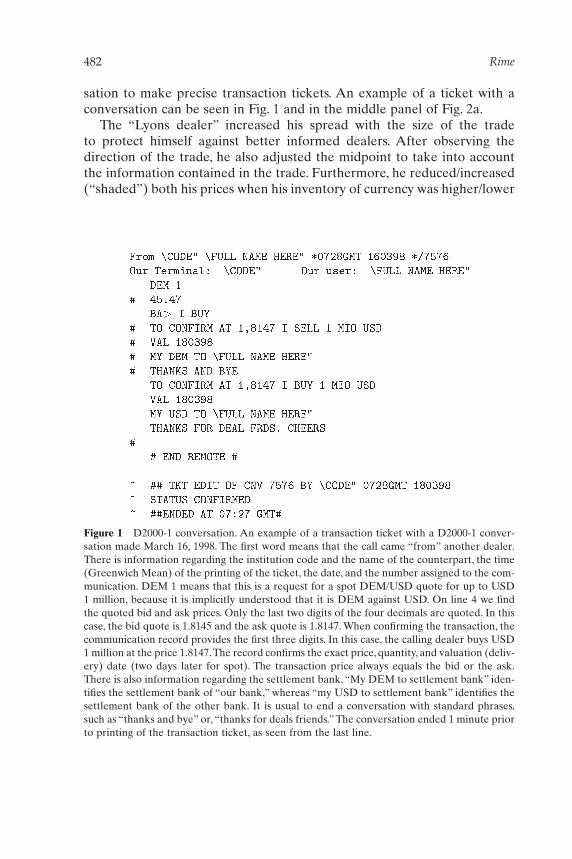
sation to make precise transaction tickets. An example of a ticket with aconversation can be seen in Fig. 1 and in the middle panel of Fig. 2a.
The “Lyons dealer” increased his spread with the size of the trade to protect himself against better informed dealers. After observing thedirection of the trade, he also adjusted the midpoint to take into accountthe information contained in the trade. Furthermore, he reduced/increased(“shaded”) both his prices when his inventory of currency was higher/lower
482 Rime
Figure 1 D2000-1 conversation. An example of a transaction ticket with a D2000-1 conver-sation made March 16, 1998. The first word means that the call came “from” another dealer.There is information regarding the institution code and the name of the counterpart, the time(Greenwich Mean) of the printing of the ticket, the date, and the number assigned to the com-munication. DEM 1 means that this is a request for a spot DEM/USD quote for up to USD1 million, because it is implicitly understood that it is DEM against USD. On line 4 we findthe quoted bid and ask prices. Only the last two digits of the four decimals are quoted. In thiscase, the bid quote is 1.8145 and the ask quote is 1.8147. When confirming the transaction, thecommunication record provides the first three digits. In this case, the calling dealer buys USD1 million at the price 1.8147.The record confirms the exact price, quantity, and valuation (deliv-ery) date (two days later for spot). The transaction price always equals the bid or the ask.There is also information regarding the settlement bank. “My DEM to settlement bank” iden-tifies the settlement bank of “our bank,” whereas “my USD to settlement bank” identifies thesettlement bank of the other bank. It is usual to end a conversation with standard phrases,such as “thanks and bye” or, “thanks for deals friends.” The conversation ended 1 minute priorto printing of the transaction ticket, as seen from the last line.
EWE21 7/24/03 9:06 PM Page 482
21. E-Trading Systems in Foreign Exchange Markets 483
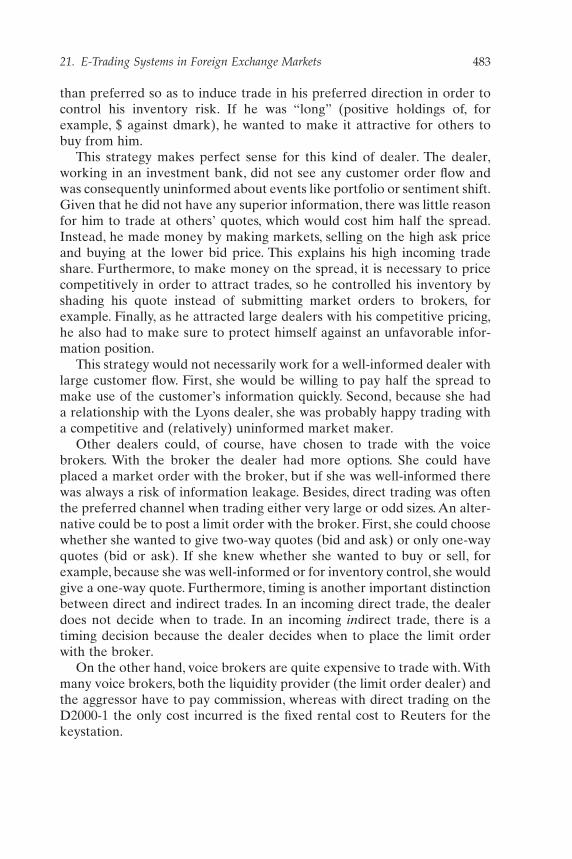
than preferred so as to induce trade in his preferred direction in order tocontrol his inventory risk. If he was “long” (positive holdings of, forexample, $ against dmark), he wanted to make it attractive for others tobuy from him.
This strategy makes perfect sense for this kind of dealer. The dealer,working in an investment bank, did not see any customer order flow andwas consequently uninformed about events like portfolio or sentiment shift.Given that he did not have any superior information, there was little reasonfor him to trade at others’ quotes, which would cost him half the spread.Instead, he made money by making markets, selling on the high ask priceand buying at the lower bid price. This explains his high incoming tradeshare. Furthermore, to make money on the spread, it is necessary to pricecompetitively in order to attract trades, so he controlled his inventory byshading his quote instead of submitting market orders to brokers, forexample. Finally, as he attracted large dealers with his competitive pricing,he also had to make sure to protect himself against an unfavorable infor-mation position.
This strategy would not necessarily work for a well-informed dealer withlarge customer flow. First, she would be willing to pay half the spread tomake use of the customer’s information quickly. Second, because she hada relationship with the Lyons dealer, she was probably happy trading witha competitive and (relatively) uninformed market maker.
Other dealers could, of course, have chosen to trade with the voicebrokers. With the broker the dealer had more options. She could haveplaced a market order with the broker, but if she was well-informed therewas always a risk of information leakage. Besides, direct trading was oftenthe preferred channel when trading either very large or odd sizes. An alter-native could be to post a limit order with the broker. First, she could choosewhether she wanted to give two-way quotes (bid and ask) or only one-wayquotes (bid or ask). If she knew whether she wanted to buy or sell, forexample, because she was well-informed or for inventory control, she wouldgive a one-way quote. Furthermore, timing is another important distinctionbetween direct and indirect trades. In an incoming direct trade, the dealerdoes not decide when to trade. In an incoming indirect trade, there is atiming decision because the dealer decides when to place the limit orderwith the broker.
On the other hand, voice brokers are quite expensive to trade with. Withmany voice brokers, both the liquidity provider (the limit order dealer) andthe aggressor have to pay commission, whereas with direct trading on theD2000-1 the only cost incurred is the fixed rental cost to Reuters for thekeystation.
EWE21 7/24/03 9:06 PM Page 483

What were the consequences of the introduction of electronic directtrading through D2000-1? Probably not very extensive. As mentionedearlier, D2000-1 merely replaced the telephone as the tool for directtrading. The fact that it was more efficient, both for the dealer and for theback office, might have led to a decrease in the order processing cost of thespread and, hence, lower spreads. More efficient trading could also haveallowed more trading, which again could have resulted in a more liquidmarket. In a more liquid market, meaning one in which it is easier to tradewithout a price impact, the risk of taking on a trade is lower because it iseasier to get rid of as well, and the inventory part of the spread may alsohave decreased.There is insufficient foreign exchange spread data availableto allow anything precise to be said about this. We do know from marketparticipants that spreads decreased during the late 1980s, but the mainreason might have been increased competition between the banks and amore liquid market due to more active customers.
IV. ELECTRONIC BROKERS
Electronic brokers collect orders from screens connected together in anetwork and match the orders, hence letting the screens represent a morecentralized marketplace. As such they are perfectly suited to a decentral-ized market in need of efficient matching. The foreign exchange market,with its decentralized structure and quickly growing volumes, was alsoamong the early adopters of electronic brokers.4 Subsequently, many equitymarkets also adopted electronic brokers.
Today there are two electronic brokers in the interbank market.The first,Dealing 2000-2, was introduced by Reuters in April 1992. The D2000-2system comes bundled together with the previously mentioned directsystem, D2000-1. A year later, in April 1993, Minex was launched by Japanese banks, with EBS (Electronic Broking Services) following in September 1993. The EBS Partnership was established by several majormarket making banks to counter the dominant role of Reuters, and EBSacquired Minex in December 1995 and thereby gained a significant market share in Asia. Figure 2a shows the Dealing 2000 screen, which con-sists of both D2000-1 and D2000-2,5 whereas Figure 2b shows the EBSscreen.
484 Rime
4The government bond markets, another decentralized market sharing many propertieswith foreign exchange markets, was even earlier in adopting electronic brokers.
5Reuters Dealing 2000 was replaced by Dealing 3000 in 2000.
EWE21 7/24/03 9:06 PM Page 484
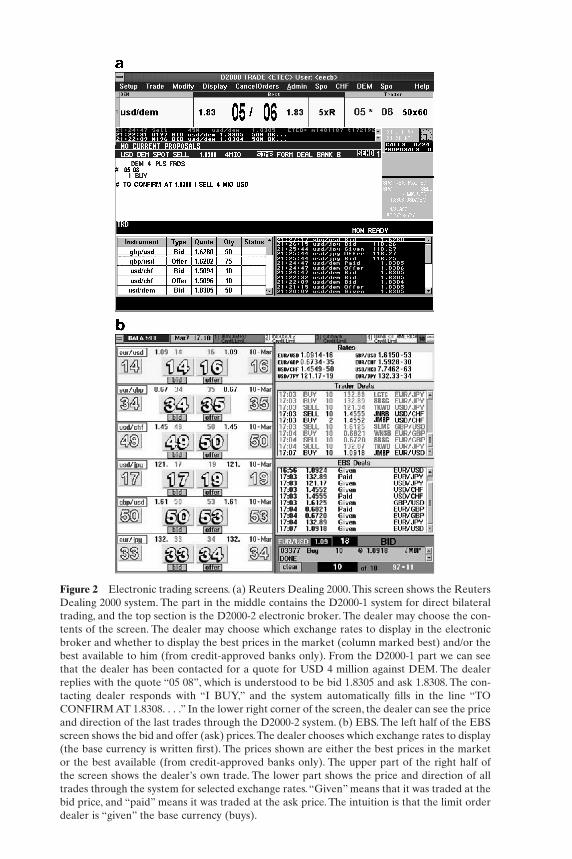
Figure 2 Electronic trading screens. (a) Reuters Dealing 2000. This screen shows the ReutersDealing 2000 system. The part in the middle contains the D2000-1 system for direct bilateraltrading, and the top section is the D2000-2 electronic broker. The dealer may choose the con-tents of the screen. The dealer may choose which exchange rates to display in the electronicbroker and whether to display the best prices in the market (column marked best) and/or thebest available to him (from credit-approved banks only). From the D2000-1 part we can seethat the dealer has been contacted for a quote for USD 4 million against DEM. The dealerreplies with the quote “05 08”, which is understood to be bid 1.8305 and ask 1.8308. The con-tacting dealer responds with “I BUY,” and the system automatically fills in the line “TOCONFIRM AT 1.8308. . . .” In the lower right corner of the screen, the dealer can see the priceand direction of the last trades through the D2000-2 system. (b) EBS. The left half of the EBSscreen shows the bid and offer (ask) prices.The dealer chooses which exchange rates to display(the base currency is written first). The prices shown are either the best prices in the marketor the best available (from credit-approved banks only). The upper part of the right half ofthe screen shows the dealer’s own trade. The lower part shows the price and direction of alltrades through the system for selected exchange rates. “Given” means that it was traded at thebid price, and “paid” means it was traded at the ask price. The intuition is that the limit orderdealer is “given” the base currency (buys).
EWE21 7/24/03 9:06 PM Page 485

The electronic brokers work in a manner similar to voice brokers;they actually offer speakers as well. When a limit order is entered, there isfirst a price priority to ensure that it is always the best prices that are tradedon and then a time priority (price–time priority). Market orders are givenpriority according to time of entry, and the system matches the counter-parties automatically.6 As with voice brokers, the entry of orders is anony-mous, but both parties see the counterparty’s identity immediately after thetrade.
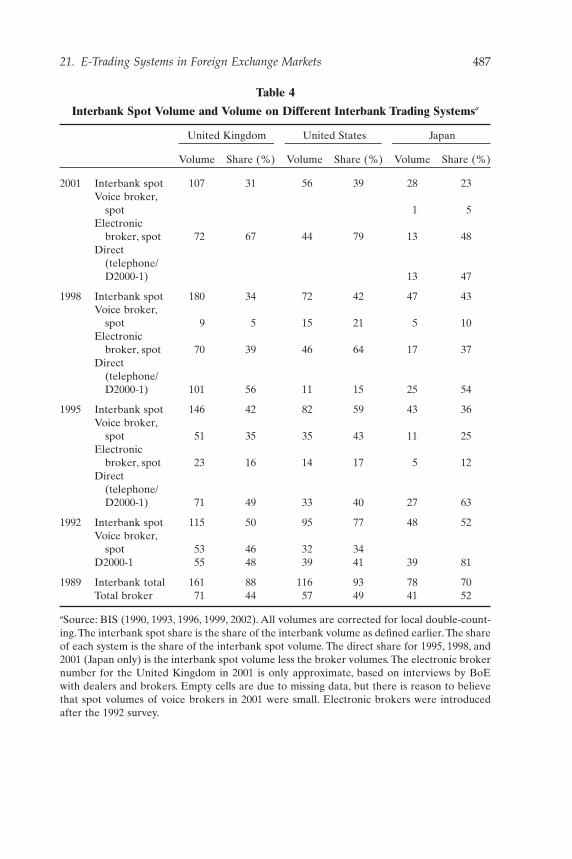
Electronic brokers differ from voice brokers in three respects, and wewill come back to each later on. First, electronic brokers offer a higher levelof transparency. Second, the fee structure makes electronic brokerscheaper. Finally, electronic brokers match orders much more efficiently, atleast for liquid standardized instruments. Table 4 compares spot volumesand shares of interbank spot volumes for direct trading, electronic brokers,and voice brokers. Initially, electronic brokers took market shares only fromthe voice brokers, but later direct trading also lost market share to elec-tronic brokers.Today electronic brokers constitute the main trading channelin the interbank market. In Japan, electronic brokers had almost three timesmore $/€ spot trading than D2000-1 in April 2001 and twice as much ¥/$spot trading.
A. TRANSPARENCY
The introduction of electronic brokers has definitely led to higher trans-parency in the market. First, dealers can see the price and sign of all trades,not just the ones that the voice broker manages to announce. Hence, post-trade transparency is higher. Second, it is easier to follow the evolution ofseveral exchange rates, so price transparency is higher. The dealer decideswhich exchange rates to display on the screen. Furthermore, even if thedealers cannot see the whole order book, they do have more pretrade infor-mation with electronic brokers than with voice brokers. In the top right-hand part of the D2000 screen, and at the side of the bid and offer (ask) onthe EBS screen, the dealers can see the best bid and ask prices for tradeslarger than 10 million. Although this means higher transparency, the infor-mation is not particularly useful. As can be seen from the EBS screen, allfigures here are equal to the best bid and ask prices. In periods with highliquidity, spreads can be more or less constant up to 10 million, as can beseen from the 16:00 o’clock graph in Fig. 3b.
486 Rime
6Electronic brokers therefore are also called automatic matching or electronic matchingsystems.
EWE21 7/24/03 9:06 PM Page 486
21. E-Trading Systems in Foreign Exchange Markets 487
Table 4
Interbank Spot Volume and Volume on Different Interbank Trading Systemsa
United Kingdom United States Japan
Volume Share (%) Volume Share (%) Volume Share (%)
2001 Interbank spot 107 31 56 39 28 23Voice broker,
spot 1 5Electronic
broker, spot 72 67 44 79 13 48Direct
(telephone/D2000-1) 13 47
1998 Interbank spot 180 34 72 42 47 43Voice broker,
spot 9 5 15 21 5 10Electronic
broker, spot 70 39 46 64 17 37Direct
(telephone/D2000-1) 101 56 11 15 25 54
1995 Interbank spot 146 42 82 59 43 36Voice broker,
spot 51 35 35 43 11 25Electronic
broker, spot 23 16 14 17 5 12Direct
(telephone/D2000-1) 71 49 33 40 27 63
1992 Interbank spot 115 50 95 77 48 52Voice broker,
spot 53 46 32 34D2000-1 55 48 39 41 39 81
1989 Interbank total 161 88 116 93 78 70Total broker 71 44 57 49 41 52
aSource: BIS (1990, 1993, 1996, 1999, 2002). All volumes are corrected for local double-count-ing. The interbank spot share is the share of the interbank volume as defined earlier. The shareof each system is the share of the interbank spot volume. The direct share for 1995, 1998, and2001 (Japan only) is the interbank spot volume less the broker volumes. The electronic brokernumber for the United Kingdom in 2001 is only approximate, based on interviews by BoEwith dealers and brokers. Empty cells are due to missing data, but there is reason to believethat spot volumes of voice brokers in 2001 were small. Electronic brokers were introducedafter the 1992 survey.
EWE21 7/24/03 9:06 PM Page 487
488 Rime
1.74
1.745
1.75
1.755
0 10 20 30 40 50 60
2:18:00:00.00
1.74
1.742
1.744
1.746
1.748
1.75
1.752
1.754
1.756
1.758
0 10 20 30 40 50 60 70 80
2:16:00:00.00
a
b
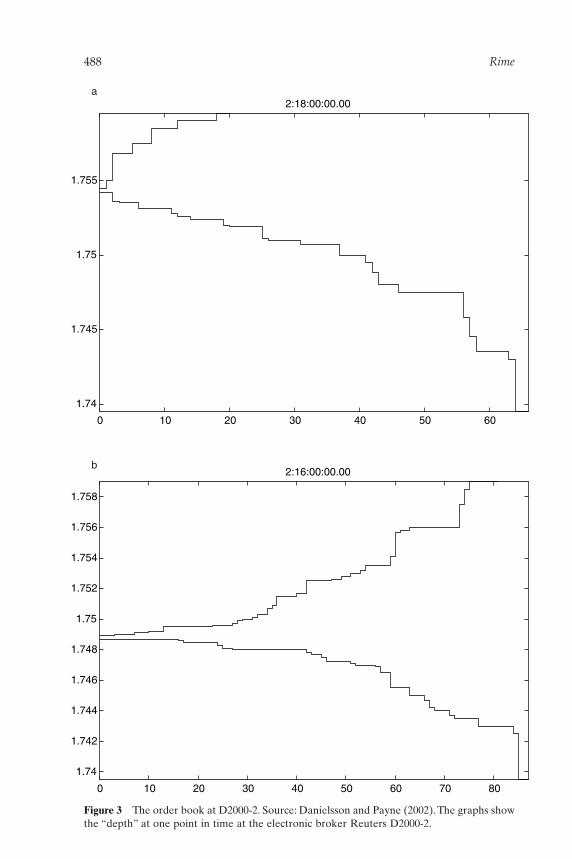
Figure 3 The order book at D2000-2. Source: Danielsson and Payne (2002). The graphs showthe “depth” at one point in time at the electronic broker Reuters D2000-2.
EWE21 7/24/03 9:06 PM Page 488
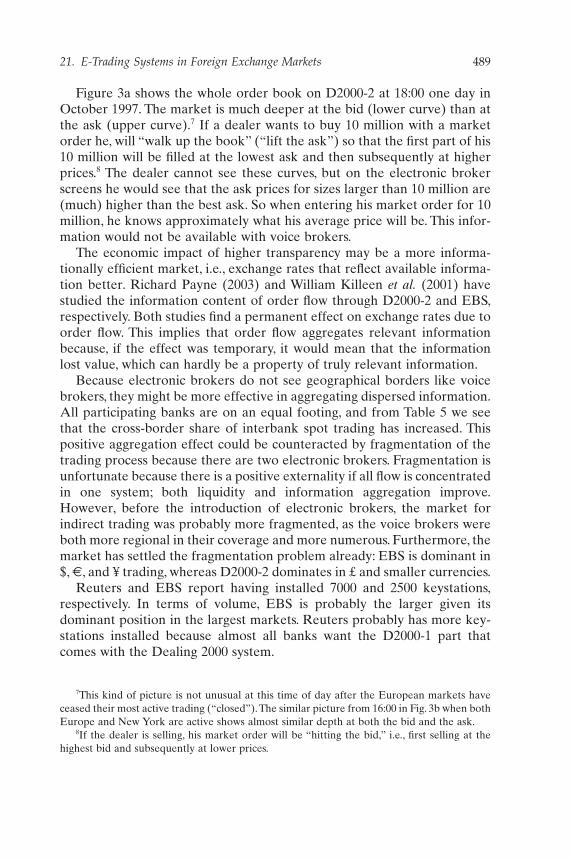
Figure 3a shows the whole order book on D2000-2 at 18:00 one day inOctober 1997. The market is much deeper at the bid (lower curve) than atthe ask (upper curve).7 If a dealer wants to buy 10 million with a marketorder he, will “walk up the book” (“lift the ask”) so that the first part of his10 million will be filled at the lowest ask and then subsequently at higherprices.8 The dealer cannot see these curves, but on the electronic brokerscreens he would see that the ask prices for sizes larger than 10 million are(much) higher than the best ask. So when entering his market order for 10million, he knows approximately what his average price will be. This infor-mation would not be available with voice brokers.
The economic impact of higher transparency may be a more informa-tionally efficient market, i.e., exchange rates that reflect available informa-tion better. Richard Payne (2003) and William Killeen et al. (2001) havestudied the information content of order flow through D2000-2 and EBS,respectively. Both studies find a permanent effect on exchange rates due toorder flow. This implies that order flow aggregates relevant informationbecause, if the effect was temporary, it would mean that the informationlost value, which can hardly be a property of truly relevant information.
Because electronic brokers do not see geographical borders like voicebrokers, they might be more effective in aggregating dispersed information.All participating banks are on an equal footing, and from Table 5 we seethat the cross-border share of interbank spot trading has increased. Thispositive aggregation effect could be counteracted by fragmentation of thetrading process because there are two electronic brokers. Fragmentation isunfortunate because there is a positive externality if all flow is concentratedin one system; both liquidity and information aggregation improve.However, before the introduction of electronic brokers, the market for indirect trading was probably more fragmented, as the voice brokers wereboth more regional in their coverage and more numerous. Furthermore, themarket has settled the fragmentation problem already: EBS is dominant in$, €, and ¥ trading, whereas D2000-2 dominates in £ and smaller currencies.
Reuters and EBS report having installed 7000 and 2500 keystations,respectively. In terms of volume, EBS is probably the larger given its dominant position in the largest markets. Reuters probably has more key-stations installed because almost all banks want the D2000-1 part thatcomes with the Dealing 2000 system.
21. E-Trading Systems in Foreign Exchange Markets 489
7This kind of picture is not unusual at this time of day after the European markets haveceased their most active trading (“closed”).The similar picture from 16:00 in Fig. 3b when bothEurope and New York are active shows almost similar depth at both the bid and the ask.
8If the dealer is selling, his market order will be “hitting the bid,” i.e., first selling at thehighest bid and subsequently at lower prices.
EWE21 7/24/03 9:06 PM Page 489
The increased transparency probably represents the greatest progress forthe foreign exchange market. At first glance, it might seem optimal to havea perfectly transparent market. But then informed dealers do not haveincentives to participate, and hence less information will be aggregated.Furthermore, higher transparency makes it more risky to take on largetrades from customers because it is more difficult to offset the trade beforethe rest of the market is aware of it. As suggested in Section III, inventorycontrol after the customer trades is very important in the foreign exchangemarket. However, the transparency of the interbank foreign exchangemarket prior to electronic brokers was so low that in this case the improve-ment in transparency is probably welfare improving.And there are no signsthat dealers do not want to trade using the electronic brokers, despite thehigher transparency.As Table 4 shows, the volume and share of trading havebeen increasing since their introduction.
490 Rime
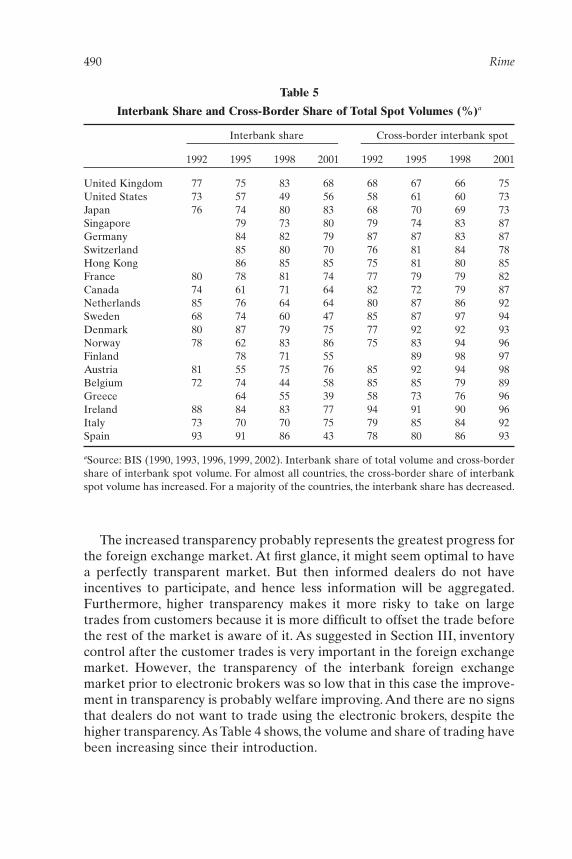
Table 5
Interbank Share and Cross-Border Share of Total Spot Volumes (%)a
Interbank share Cross-border interbank spot
1992 1995 1998 2001 1992 1995 1998 2001
United Kingdom 77 75 83 68 68 67 66 75United States 73 57 49 56 58 61 60 73Japan 76 74 80 83 68 70 69 73Singapore 79 73 80 79 74 83 87Germany 84 82 79 87 87 83 87Switzerland 85 80 70 76 81 84 78Hong Kong 86 85 85 75 81 80 85France 80 78 81 74 77 79 79 82Canada 74 61 71 64 82 72 79 87Netherlands 85 76 64 64 80 87 86 92Sweden 68 74 60 47 85 87 97 94Denmark 80 87 79 75 77 92 92 93Norway 78 62 83 86 75 83 94 96Finland 78 71 55 89 98 97Austria 81 55 75 76 85 92 94 98Belgium 72 74 44 58 85 85 79 89Greece 64 55 39 58 73 76 96Ireland 88 84 83 77 94 91 90 96Italy 73 70 70 75 79 85 84 92Spain 93 91 86 43 78 80 86 93
aSource: BIS (1990, 1993, 1996, 1999, 2002). Interbank share of total volume and cross-bordershare of interbank spot volume. For almost all countries, the cross-border share of interbankspot volume has increased. For a majority of the countries, the interbank share has decreased.
EWE21 7/24/03 9:06 PM Page 490
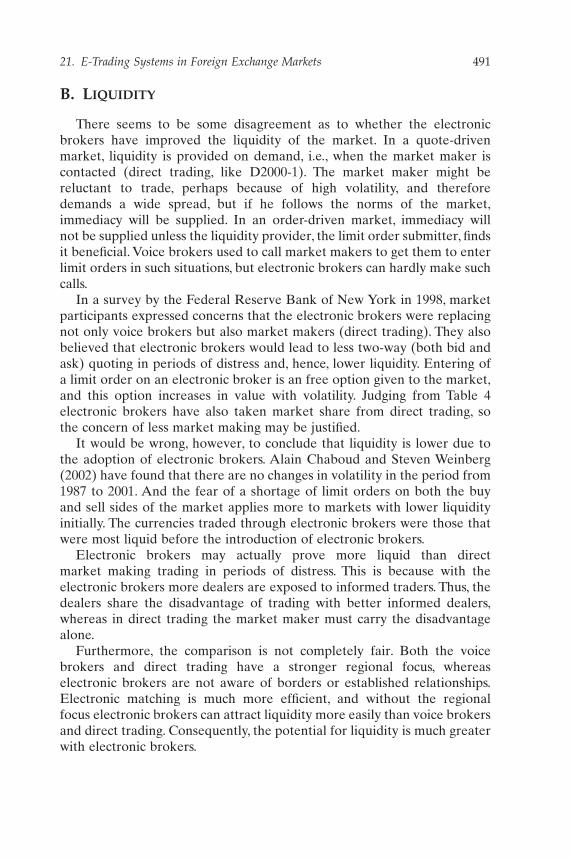
B. LIQUIDITY
There seems to be some disagreement as to whether the electronicbrokers have improved the liquidity of the market. In a quote-drivenmarket, liquidity is provided on demand, i.e., when the market maker is contacted (direct trading, like D2000-1). The market maker might be reluctant to trade, perhaps because of high volatility, and therefore demands a wide spread, but if he follows the norms of the market,immediacy will be supplied. In an order-driven market, immediacy will not be supplied unless the liquidity provider, the limit order submitter, findsit beneficial. Voice brokers used to call market makers to get them to enterlimit orders in such situations, but electronic brokers can hardly make suchcalls.
In a survey by the Federal Reserve Bank of New York in 1998, marketparticipants expressed concerns that the electronic brokers were replacingnot only voice brokers but also market makers (direct trading). They alsobelieved that electronic brokers would lead to less two-way (both bid andask) quoting in periods of distress and, hence, lower liquidity. Entering ofa limit order on an electronic broker is an free option given to the market,and this option increases in value with volatility. Judging from Table 4 electronic brokers have also taken market share from direct trading, so the concern of less market making may be justified.
It would be wrong, however, to conclude that liquidity is lower due tothe adoption of electronic brokers. Alain Chaboud and Steven Weinberg(2002) have found that there are no changes in volatility in the period from1987 to 2001. And the fear of a shortage of limit orders on both the buyand sell sides of the market applies more to markets with lower liquidityinitially. The currencies traded through electronic brokers were those thatwere most liquid before the introduction of electronic brokers.
Electronic brokers may actually prove more liquid than direct market making trading in periods of distress. This is because with the electronic brokers more dealers are exposed to informed traders. Thus, thedealers share the disadvantage of trading with better informed dealers,whereas in direct trading the market maker must carry the disadvantagealone.
Furthermore, the comparison is not completely fair. Both the voicebrokers and direct trading have a stronger regional focus, whereas electronic brokers are not aware of borders or established relationships.Electronic matching is much more efficient, and without the regional focus electronic brokers can attract liquidity more easily than voice brokersand direct trading. Consequently, the potential for liquidity is much greaterwith electronic brokers.
21. E-Trading Systems in Foreign Exchange Markets 491
EWE21 7/24/03 9:06 PM Page 491
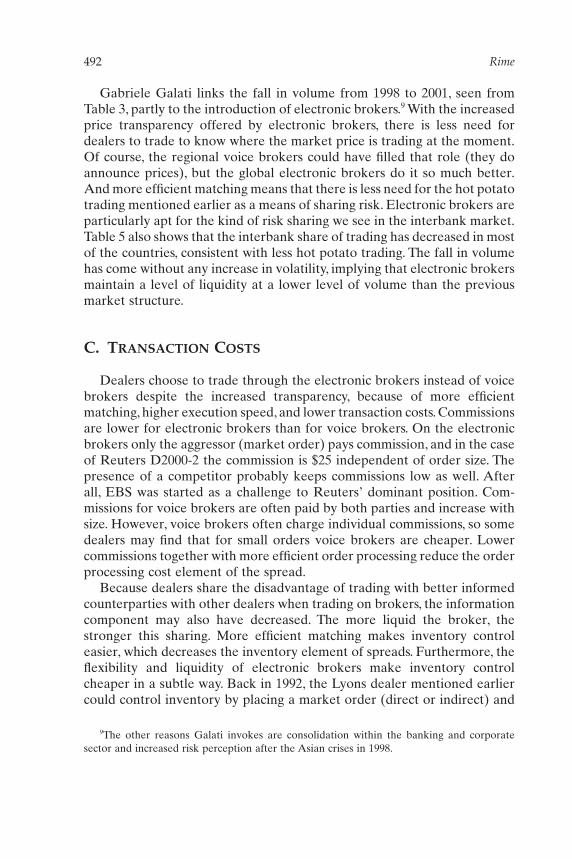
Gabriele Galati links the fall in volume from 1998 to 2001, seen fromTable 3, partly to the introduction of electronic brokers.9 With the increasedprice transparency offered by electronic brokers, there is less need fordealers to trade to know where the market price is trading at the moment.Of course, the regional voice brokers could have filled that role (they doannounce prices), but the global electronic brokers do it so much better.And more efficient matching means that there is less need for the hot potatotrading mentioned earlier as a means of sharing risk. Electronic brokers areparticularly apt for the kind of risk sharing we see in the interbank market.Table 5 also shows that the interbank share of trading has decreased in mostof the countries, consistent with less hot potato trading. The fall in volumehas come without any increase in volatility, implying that electronic brokersmaintain a level of liquidity at a lower level of volume than the previousmarket structure.
C. TRANSACTION COSTS
Dealers choose to trade through the electronic brokers instead of voicebrokers despite the increased transparency, because of more efficientmatching, higher execution speed, and lower transaction costs. Commissionsare lower for electronic brokers than for voice brokers. On the electronicbrokers only the aggressor (market order) pays commission, and in the caseof Reuters D2000-2 the commission is $25 independent of order size. Thepresence of a competitor probably keeps commissions low as well. Afterall, EBS was started as a challenge to Reuters’ dominant position. Com-missions for voice brokers are often paid by both parties and increase withsize. However, voice brokers often charge individual commissions, so somedealers may find that for small orders voice brokers are cheaper. Lowercommissions together with more efficient order processing reduce the orderprocessing cost element of the spread.
Because dealers share the disadvantage of trading with better informedcounterparties with other dealers when trading on brokers, the informationcomponent may also have decreased. The more liquid the broker, thestronger this sharing. More efficient matching makes inventory controleasier, which decreases the inventory element of spreads. Furthermore, theflexibility and liquidity of electronic brokers make inventory controlcheaper in a subtle way. Back in 1992, the Lyons dealer mentioned earliercould control inventory by placing a market order (direct or indirect) and
492 Rime
9The other reasons Galati invokes are consolidation within the banking and corporatesector and increased risk perception after the Asian crises in 1998.
EWE21 7/24/03 9:06 PM Page 492
paying half the spread, by shading quotes, or by placing a limit order witha (less liquid) voice broker. The dealers studied by Bjønnes and Rime in1998 used a different strategy: they placed limit orders at the best bid whenthey wanted to increase inventory (buy) and thereby avoided the cost of“shading” to induce trade in their preferred direction. In calm periods,brokers’ liquidity was so good that they did not have to improve upon thebest prices in order to control inventory.
Finally, because the dealer can decide on the time of submission of limitorders, there is more scope for active timing that is not available withincoming direct trades.A dealer who wants to buy immediately, e.g., in orderto utilize information, can either submit a market order at the best ask orenter a limit order that improves the best bid. Of course this kind of“shading” is a signal to the rest of the market, but so is a market order.The advantages are that the dealer does not pay commissions on the limitorder and that she may trade at a better price than with a market order.This strategy makes the spread tighter, especially because it is seldom thesame dealer that submits both best bid and best ask.
The decrease in spreads should not be exaggerated. Spreads were alsosmall in 1992 according to the study by Lyons (three pips), whereas evidence from electronic brokers shows spreads around two pips. CharlesGoodhart et al. find that the average spread in both dmark/$ and $/€ wasbetween 2.5 and 3 pips using data from 1997 and 1999, respectively. In themeantime volume also increased, so that the direct impact of electronicbrokers as such is difficult to evaluate. For customers and small banks thegains are significant, however. Small banks did not have access to tightspreads earlier, and higher price transparency has enabled customers tohave a more precise view of spreads in the interbank market, which has led to smaller spreads for customers.
To this should be added the suggestion that the effective spread in $/€may be higher than that for dmark/$ because the electronic brokers arerigidly set at four decimals. Because a typical dmark/$ exchange rate was1.8 and the typical $/€ rate is somewhat below parity, each pip is more valuable. The electronic brokers so far have set the quote at 4 decimals,but perhaps 5 decimals should have been used.
D. THE FUTURE OF DIRECT TRADING AND VOICE BROKERS
So far electronic brokers have taken market share from both voicebrokers and direct trading.This does not mean that voice brokers and directtrading will disappear from the market. Electronic brokers are most suit-able for very liquid markets, and the foreign exchange market is much more
21. E-Trading Systems in Foreign Exchange Markets 493
EWE21 7/24/03 9:06 PM Page 493
than $/€. Many smaller currencies are not traded on electronic brokersbecause their markets are not liquid enough. And in periods of distress,some direct trading may be wanted because then there are always tradingpossibilities, whereas the liquidity of electronic brokers may diminishduring such periods. The release by EBS of a direct trading product calledEBSTrader constitutes further evidence. Furthermore, it is no means surethat a purely electronic broker market would be optimal. The results aremixed (see Larry Harris, 2002).
Voice brokers too have a role in the market. In less liquid currencies theycan use their knowledge of positions to track down counterparties. Voicebrokers are also moving into less liquid derivatives. Instead, what we canexpect to see is more derivative trading through electronic brokers.Forwards were introduced on the D2000-2 in 1997, and attempts are being made to set up electronic brokers, independently of Reuters and EBS,for options trading.
E. POLICY IMPLICATIONS
What are the consequences for the authorities? Increased transparencyis also beneficial for the authorities. Several central banks have electronicbrokers installed and use them for market monitoring, among other things.10
Electronic brokers may prove useful for secret interventions, given pretradeanonymity and matching without human interventions and possible infor-mation leakages as with voice brokers.
If we come to a situation where the majority of interbank trading isdirected through the two electronic brokers, the systems may also proveuseful in attempts to regulate the foreign exchange market. By regulatingbrokers and requiring banks to use only regulated electronic brokers, theway could be opened for implementing trading halts, for example. Anotherpossibility is to collect a transaction tax (“Tobin tax”) through the electronicbrokers.
Will we see electronic brokers with open limit order books, i.e., so thatdealers can see the curves in Figure 3? Many equity markets have intro-duced this. Some equity markets have done it to counter competing tradingvenues and thereby attract liquidity. For the sake of argument, we leave thequestion of competing trading venues like Internet sites for customers forthe next section.
494 Rime
10A questionnaire survey of central bank use of electronic brokers has been conducted forthis chapter. Many central banks required confidentiality for their replies, which prevents usfrom being specific.
EWE21 7/24/03 9:06 PM Page 494
In the foreign exchange market, an open limit order would be a giantleap with respect to transparency. So far transparency has evolved endoge-nously and at a rather low level. Reuters and EBS will probably not openthe book unless the users, the banks, want it. Interbank trading is very muchabout inventory control because the customer orders are so much largerthan the ordinary interbank transaction. Opening the book as in equitymarkets would make it much more difficult to control inventory because itwould be harder to hide one’s trading intentions.
Even if an open book could improve efficiency, it is by no means certainthat regulators should try to implement it. The increased inventory costscould feed back to customer spreads because it becomes more risky to takeon large positions.
V. INTERNET TRADING
Internet trading represents a possible structural change in the bank–customer relationship. Through the 1999s, customers’ trading was an im-portant source of both income and information for banks. Internet tradinghas made the customer segment much more competitive and may increasethe transparency of customers’ trading, thereby changing the informationrole of customers. In this section we discuss the evolution of customertrading, the consequences of Internet trading, and what may lie ahead.
In the early 1990s, customers’ access to information on interbank marketactivity was low, and they were relatively loyal to their banks. Customersrequested quotes from banks over the telephone. A Reuters service calledFXFX provided customers with information on interbank prices, butspreads on FXFX were much wider than in the interbank market. The mid-point was quite accurate, though. Banks used this screen as an advertisingchannel to customers. In this period, customer trading was very profitablefor banks.
During the 1990s, price transparency for customers increased, partly asa result of electronic brokers that made interbank transaction prices easierto collect and publish on-line. This, together with a increasing concern onthe part of customers about noncompetitive terms and being locked in withtheir banks, led customers to start shopping around at several banks forquotes. The customer segment became more competitive.
A. THE EMERGENCE OF NONBANK CUSTOMER TRADING
In the mid-1990s several Electronic Communication Networks (ECNs)were set up in the United States as alternative trading venues for equity
21. E-Trading Systems in Foreign Exchange Markets 495
EWE21 7/24/03 9:06 PM Page 495

trading. In these markets, customers were also concerned about noncom-petitive pricing by their brokers trading on the NYSE and NASDAQ, andthey could often get better terms with the ECNs. In the same spirit, CMCstarted Deal4Free, the first nonbank Internet site for customer trading,in May 1996. Later, several nonbank Internet sites were established for customer-to-customer trading, such as IFX Markets (1999), MatchbookFX(September 1999, closed down in 2000), HotSpotFX (February 2001),OANDA (March 2001), and ChoiceFX. Most of these systems are orga-nized as crossing networks, but they try to resemble electronic brokers.Crossing networks are trading systems that obtain their prices from anothertrading venue; hence, there is no price discovery. However, some, likeCMC’s Deal4Free, are more like traditional direct trading with their ownprice discovery, whereas some, like ChoiceFX, depend on limit orders fromcustomers (like an electronic broker).
Most of the independent sites start up as crossing networks because theycannot expect to get sufficient limit orders to create a viable market. Someof them, like Deal4Free and IFX, operated as market makers prior to theInternet and provide some liquidity on their own.The sites mimic electronicbrokers, but most often the site is counterparty to all trades. This suits customers because they do not want to take the counterparty risk them-selves, but on the other hand they could be concerned that the site may nottake sufficient account of their needs as the site also trades on its own. Thesites can be counterparty to all transactions because customers must placea margin account with the sites and because they control the matching.Some of the sites probably hope to some day have sufficient liquidity, i.e.,limit orders, to have a true exchange, but many are happy being crossingnetworks. It is important to note that crossing networks are dependent onthe interbank market (primary market) and therefore cannot replace it.They can attract a lot of customers from the banks, however, and therebyinfluence the interbank market.
Transparency differs from site to site. ChoiceFX is very similar to the interbank electronic brokers, whereas HotSpotFX, ChoiceFX, andMatchbookFX (before cease of business) show the whole order book.Knowledge of the whole book is useful even in a crossing network for tworeasons: first, it may give a signal on marketwide customer flow, and second,it may be useful for timing of trading.
Whether nonbank sites will be a major force depends on whether theygive competitive terms. In many cases they do not. The interbank spreadfor volumes of €1–5 million is two pips, and the customer spread could bethree to five pips for good customers. Some of the nonbank sites advertisethese kinds of spreads, but then for one-tenth of the volume. The focus formany nonbank sites is the small customers, and they might be competitive
496 Rime
EWE21 7/24/03 9:06 PM Page 496
in this subsegment, but they will not be a major force. That does not meanthat their presence does not influence the competition for customers; itdoes.
B. INTERNET TRADING WITH BANKS
Banks’ initial response to the nonbank Internet trading sites for cus-tomers was to establish their own customer sites. In these sites, pricing is still given on request, but the administration of orders is easier for bothcustomers and banks. The first network-based trading opportunity offeredto customers by a bank was a closed network called FX Connect, intro-duced by State Street in August 1996. The introduction of the bank-independent Currenex, which started trading in April 2000, was a turningpoint. This was the first multibank site, meaning that several banks wereinvited to provide prices. Immediately afterward, FX Connect opened upits system to other dealers as liquidity providers. FXall followed with theirfirst trading in May 2001, established initially with seven major banks asowners in June 2000.The last addition was Atriax, started in December 2000and backed by Reuters and three of the biggest banks. The big four sitesquickly became FXConnect, Currenex, FXall, and Atriax, but Atriax waslater closed down in early April 2002. More details on the four multibanksites are provided in Table 6.
According to a survey made by TowerGroup in March 2002, volumestraded through banks’ Internet portals are still limited. FX Connect by StateStreet is the largest with $6 billion as a daily average for March 2002. FXallwas second with $1.5 billion and Currenex was third with $1.1 billion,whereas Atriax had $0.3 billion (just before they closed down). The volumeof banks’ proprietary customer sites was estimated to be $5.5 billion aggre-gated. This should be compared with the total volumes of other financialinstitutions ($329 billion) and nonfinancial customers ($156 billion) fromthe most recent survey by BIS. The total Internet bank volume of $14.4billion is small, so far, compared to the traditional volume. The aggregatevolume of the nonbank independent portals is probably lower. Euromoneyreports strong growth for these sites since and reports $10 billion and $4billion on normal days in November 2002 for FX Connect and FXall,respectively.
The lack of convincing success (several portals have closed downalready) is probably related to the facts that (i) many customers are worriedabout security with Internet-based trading (FX Connect started as a closednetwork) and (ii) the portals are struggling with high costs, as true straightthrough processing (STP) is expensive to install. STP means that the trades
21. E-Trading Systems in Foreign Exchange Markets 497
EWE21 7/24/03 9:06 PM Page 497

498 Rime
Tabl
e 6
Ove
rvie
w o
f M
ulti
bank
Int
erne
t Tra
ding
a
Atr
iax
Cur
rene
xF
Xal
lF
X C
onne
ct
Shar
ehol
ders
Thr
ee b
anks
,Reu
ters
,V
C fi
rms,
one
corp
orat
e,Fo
urte
en b
anks
Stat
e St
reet
empl
oyee
son
e ba
nk,e
mpl
oyee
sFi
rst
publ
ic t
radi
ngJu
ne 2
8,20
01A
pril
27,2
000
May
10,
2001
Apr
il 20
00 (
1996
)Tr
ansa
ctio
n fe
eP
aid
by p
rice
mak
ers
Bot
h co
unte
rpar
ties
Pai
d by
pri
ce m
aker
sP
aid
by p
rice
mak
ers
Num
bers
of
bank
s co
mpe
ting
Unl
imit
edU
nlim
ited
Unl
imit
edU
p to
5P
rici
ngR
eque
st f
or q
uote
Req
uest
+st
ream
ing
Req
uest
+st
ream
ing
Req
uest
for
quo
tepr
ices
(au
to–m
anua
l pr
ices
feed
)R
eal-
tim
e st
ream
ing
firm
Y
esY
esN
opr
ices
Num
ber
of c
urre
ncie
s43
160
Unl
imit
edU
nlim
ited
Num
ber
liqui
dity
pro
vide
rsA
bout
70
4553
34N
umbe
r of
cus
tom
ers
300
(app
roxi
mat
ely)
200
(app
roxi
mat
ely)
Und
iscl
osed
425
Cus
tom
er t
ype
Cor
pora
tes
50%
,C
orpo
rate
s 75
%,
Cor
pora
tes
40%
,10
0% in
vest
ors
inve
stor
s 50
% (
est.)
inve
stor
s 25
%in
vest
ors
60%
a Sour
ce:E
urom
oney
,FX
Wee
k,an
d co
mpa
nies
’ w
eb p
ages
.Atr
iax
ceas
ed b
usin
ess
in A
pril
2002
.Num
ber
of l
iqui
dity
pro
vide
rs m
ean
bank
s pr
ovid
ing
pric
es.
EWE21 7/24/03 9:06 PM Page 498
enter directly into the customers’ systems without any manual work. In asurvey by Euromoney after the demise of Atriax, a majority believed thatthere would be only two multibank portals within a short time. Which ofthe three remaining big ones will disappear is difficult to say from banks’practices. Today most banks participate in two or three of the multibankportals in addition to running their own (single-bank) portal.
So far the main consequence of Internet trading is limited to transactioncosts for customers. As Table 6 shows, requesting quotes, as in marketmaking, as opposed to trading through brokers is still the most common.Compared with earlier practice, multibank portals enable the customer to obtain quotes from more banks, more efficiently, and this increases thecompetition. With pricing on request, customer order flow will still beprivate information held by banks.With an electronic broker for customers,as with interbank brokers, customer trading would, to a lesser extent, beprivate information. More recently, at least two of the portals have startedworking with structures more similar to those of crossing networks, withprices feeding into the system automatically.
C. POSSIBLE SCENARIOS
Lyons (2002) suggests three possible scenarios with regard to thebank–customer relationship. In the first, Internet trading proves so succ-sessful that banks lose their entire customer trading. Hence, interbanktrading will also vanish because customer trading is the primary reason forinterbank trade in the first place. Because there is a positive externality withcentralized trading, a network benefit, a centralized electronic broker thatreaps all network benefits will probably emerge. Customers trade with each other, while the banks act as legal middlemen for the counterpartiesin the settlement of the trade. Lyons believes that a centralized electronicbroker would be more efficient in providing liquidity than the current deal-ership structure, where dealers, acting as market makers, fill orders fromtheir own inventory.The reason for this is that the risks associated with suchtrading are high, and the efficient matching performed by electronic brokersmakes them very efficient for risk sharing. Furthermore, the banks have an advantage in settling the trades because they are better at credit management. This centralized electronic broker will offer much highertransparency than there is at present, but customer order flow will still beinformative.
The second scenario is a continuation of the current state of affairs, withbanks having all customer trading. In this scenario, banks give customersfavorable terms so as to keep away the competition from nonbank sites.
21. E-Trading Systems in Foreign Exchange Markets 499
EWE21 7/24/03 9:06 PM Page 499
Banks are willing to do this because they are able to profit from the infor-mation in their customer order flows.
In the final scenario, one of the interbank electronic brokers allows cus-tomers to trade alongside dealers. If a nonbank site acquired considerableliquidity, the owners of EBS, one of the interbank electronic brokers, couldopen their system to customers and offer much higher liquidity than theirnonbank competitor. In this scenario, the banks again would be middlemenbetween customers. This third scenario implies higher transparency thanthere is in today’s structure, but unless the electronic broker in which cus-tomers participate is an open one, customer order flow will remain privateinformation because one cannot tell identities from the electronic brokers.Information about marketwide order flow will be much better, however.
Of these scenarios, the second, the continuation of the current bank–customer structure, is most likely. If the first were about to emerge, the third scenario would certainly put a stop to it. However, of the three scenarios, it is the second that the banks prefer. They would rather keepinformation about their customer flows private than share it. So banksquote tight spreads to customers, keep the nonbank sites at a low level, andgain by their informational advantage. We see that this is how FXall andFX Connect are set up: price competitively, so as to gain customer flow andkeep the nonbank sites away, but within a dealership structure so as to keepthe customer order flow private information.
Let us end this section by drawing attention to the CLS Bank mentionedin the Introduction. Currently, banks are better at handling counterpartyrisk than nonbank sites. Because only banks can participate in the CLSBank, this system will give banks an even larger advantage in handlingcounterparty risk, making it even more difficult for nonbank sites to attractlarge flows.
VI. SUMMARY
In this chapter, we have discussed the possible consequences of elec-tronic trading in foreign exchange markets. The first electronic tradingsystem in the foreign exchange market was the Reuters D2000-1 system for direct trading. Its contribution was merely to replace trading over thetelephone or telex and to make direct trading more efficient. The impacton the market structure as such was small.
In 1992 electronic brokers were introduced. They quickly took marketshares from the traditional voice brokers, because of their lower costs. Atthe end of the 1990s, they also took market shares from direct trading.Theirmain advantage is the very efficient matching they offer, which is so impor-
500 Rime
EWE21 7/24/03 9:06 PM Page 500
tant for controlling risk in foreign exchange markets.Their introduction hasmade the market more transparent and, thus, hopefully also more efficient,but this is hard to test. When it comes to liquidity provision, the interbankmarket is still a hybrid market. However, it is more transparent, more centralized, more effective in matching, and with a shift of focus frommarket making to order books. When it comes to consequences for volatil-ity and transaction costs, the effect of electronic brokers seems to bemodest. Transaction costs have not changed much since 1992, and volatilityhas stayed more or less the same. In the coming years, we expect to seemore derivative trading on electronic brokers.
Internet trading is relatively recent in the area of foreign exchange.Independent Internet sites have challenged the banks’ relationship withcustomers and made competition for customers stiffer, with lower transac-tion costs for customers as a result. Will these nonbank Internet sites beable to take over banks’ dominant position as liquidity providers to cus-tomers? Most likely not. The banks believe that customer order flow isimportant private information and, hence, are willing to fight for it. Fur-thermore, they have the necessary means to win the war. At the momentthe bank-based Internet sites have more liquidity and are pricing compet-itively so as to keep the nonbank sites out of the main market. If this doesnot succeed, they can let customers into the interbank market.We will mostlikely see a consolidation of Internet sites in the future as the site withhighest liquidity reaps the network effects and becomes dominant. This sitewill have liquidity provided by several banks. This might lead to an increasein customer flow transparency, but should not alter the private informationnature of customer trading.
It is important to note that the structure of the foreign exchange markethas evolved endogenously with the banks in the driver seat. The structureand previous changes in structure have probably been beneficial for thebanks. Do the private interests of banks go hand in hand with public interest? One could of course argue that the market should be regulated,that trading should be more transparent, etc., but it is not certain that thiswould lead to a welfare improving outcome. Transaction costs are low forcustomers too, and the market has implemented new systems that maketrading more efficient in handling the peculiarities of foreign exchange.However, volumes are also extremely large in the foreign exchange market,making the amounts used on transaction costs considerable, and the efficiency of foreign exchange rates, or the lack thereof, is an open question. The introduction of electronic trading has made the market more centralized and, hence, more accessible to regulation. Regulation of foreign exchange markets is no longer a utopia and should be considered.
21. E-Trading Systems in Foreign Exchange Markets 501
EWE21 7/24/03 9:06 PM Page 501
A. WEB SITES ON TRADING AND NETWORKS
As of Dec. 31st 2002:
1. Academic sitesa. Nicholas Economides’ site for network economics
(www.stern.nyu.edu/networks/site.html).b. Ian Domiwitz’ page for trade automation
(www.smeal.psu.edu/faculty/ihd1/automation.html).2. Interbank trading systems
a. EBS (www.ebs.com).b. Reuters D3000
(about.reuters.com/products/dealing3000/index.asp).c. Reuters D3000 and D2000
(about.reuters.com/transactions/tran00m.htm).3. Multibank Internet trading
a. FXall (www.fxall.com). Supported by 55 banks. Voted best inEuromoney’s 2002 FX poll, second in market share. Startedtrading in May 2001; tradable prices are fed automatically intothe system from other systems.
b. Currenex (www.currenex.com). Owned by nonbank investors.Trading started in April 2000.
c. FX Connect (can be reached through www.globallink.com).Initially a closed system owned by State Street, now an Internetplatform where 33 banks participate. Rated first in market sharein Euromoney’s 2002 FX poll. Opened up to other banks inMarch 2000.
d. Centradia (www.centradia.com).4. Single-bank Internet trading11
a. Citigroup’s CitiFX (www.citifx.citibank.com). Trading occurs atdaily fixings on prices from EBS and Reuters.
b. Goldman Sachs (fx.gs.com).c. Dresdner Kleinwort Wasserstein’s Piranha FX
(www.drkw.com/online/fx).d. Deutsche Bank’s db markets (www.deutsche-bank.de/
tradingproducts_e.htm with further links to db markets).e. Credit Suisse First Boston’s PrimeFX (www.csfb.com/primetrade/
index.shtml and www.csfb.com/fixed_income/pdf/PrimeFX.pdf).f. Canadian Imperial (www.fxdealing.cibc.com).
502 Rime
11These pages are usually for registered customers only. The list here contains only thosethat have some information for nonregistered customers.
EWE21 7/24/03 9:06 PM Page 502
5. Nonbank sites for Internet tradinga. HotSpotFX, on-line trading (www.hotspotfx.com). A system that
resembles an electronic broker, but for customers.b. IG Markets, on-line trading (www.igforex.com).c. OANDA (fxtrade.oanda.com). Test the trading platform with
virtual money.d. FXDealerDirect (www.fxdd.com). Direct trading software for the
retail market.e. DealStation (www.mgforex.com). Direct trading.f. GAIN Capital (www.gaincapital.com). Internet electronic broker.g. ChoiceFX (www.choicefx.com).h. CMC’s Deal4Free Forex (www.deal4free.com/forex). Direct
trading. Voted best independent nonbank platform inEuromoney’s 2001 Internet Awards.
i. GFT’s DealBookFX (www.gftforex.com/products/dealbookfx).j. GCI (www.gcitrading.com).k. CMS (www.cms-forex.com).l. IFX Markets (www.ifxmarkets.com).
6. General informationa. Yahoo
(dir.yahoo.com/Business_and_Economy/Shopping_and_Services/Financial_Services/Investment_Services/Brokerages/Currencies/Internet_Trading).
b. Business.com(www.business.com/directory/financial_services/investment_banking_and_brokerage/brokerage_firms/foreign_exchange_brokers).
c. Euromoney magazine (www.euromoney.com). All but the fourlatest issues are free to the public, including their FX poll.
d. FXStreet (www.fxstreet.com). A portal to on-line brokers.e. FXlinks (www.fxlinks.com). A portal to trading and analysis.f. FXWeek magazine (www.fxweek.com). Lots of useful links,
surveys of banks, and bank revenues.g. The Money museum (www.moneymuseum.com). A web site of
Olsen & Associates.h. The Foreign Exchange Committee of Federal Reserve Bank of
New York (www.newyorkfed.org/fxc/fxc.html).7. Continuous Linked Settlement (www.cls-services.com)8. FXNet (www.fxnet.com)
21. E-Trading Systems in Foreign Exchange Markets 503
EWE21 7/24/03 9:06 PM Page 503
ACKNOWLEDGMENTS
The author acknowledges helpful comments from Jan Strømme, Jan Engebretsen, TinaKane, Steinar Holden, Tommy Sveen, Randi Næs, Johannes Skjeltorp, Haakon O. Aa. Solheim,and two anonymous reviewers. Editorial assistance by Beverly Wahl is appreciated. Anyremaining errors are the author’s responsibility. The views expressed here do not necessarilyexpress those of Norges Bank (Central Bank of Norway).
REFERENCES AND FURTHER READING
Balling, M., Lierman, F., and Mullineux, A., Eds. (2003). “Technology and Finance. Challengesfor Financial Market, Business Strategies and Policy Makers.” London, UK: Routledge.
BIS (2001).“Electronic Finance:A New Perspective and Challenges.” Number 7 in BIS Papers.Basel, Switzerland: Bank for International Settlements.
BIS (1990, 1993, 1996, 1999, 2002). “Central Bank Survey of Foreign Exchange and DerivativeMarket Activity.” Basel, Switzerland: Bank for International Settlements, Monetary andEconomic Department.
Chaboud,A., and Weinberg, S. (2002). Foreign exchange markets in the 1990s: Intraday marketvolatility and the growth of electronic trading. In “Market Functioning and Central BankPolicy” (BIS, Ed.), Number 12 in BIS Papers, pp. 138–147. Basel, Switzerland: Bank forInternational Settlements.
Danielsson, J., and Payne, R. (2002). “Liquidity Determination in an Order Driven Market.”Mimeo, Financial Markets Group, LSE.
Economides, N. (2001). The impact of the internet on financial markets. Journal of FinancialTransformation 1:8.
Economides, N. (1996). The economics of networks. International Journal of IndustrialOrganization 14:673.
Harris, L. (2002). “Trading and Exchanges: Market Microstructure for Practitioners.” OxfordUniversity Press.
Killeen, W. P., Lyons, R. K., and Moore, M. J. (2001). “Fixed versus flexible: Lessons from EMSorder flow. Working Paper 8491, NBER.
Lyons, R. K. (2002). The future of the foreign exchange market. Brookings-Wharton Papers onFinancial Services.
Lyons, R. K. (2001a). “The Microstructure Approach to Exchange Rates.” Cambridge, MA:MIT Press.
Lyons, R. K. (2001b). New perspective on FX markets: Order-flow analysis. InternationalFinance 4:303.
Madhavan, A. (2000). Market microstructure: A survey. Journal of Financial Markets 3:205.Newman, P., Milgate, M., and Eatwell, J., Eds. (1992). “The New Palgrave Dictionary of Money
& Finance.” London: Macmillan Press.Payne, R. (2003). Informed trade in spot foreign exchange markets: An empirical investiga-
tion. Journal of International Economics, in press.
504 Rime
EWE21 7/24/03 9:06 PM Page 504