Embed Size (px)
Citation preview

The following materials are key exhibits from the book that may be
helpful in teaching Please contact us with any
questions, requests or comments!

CHAPTER 1
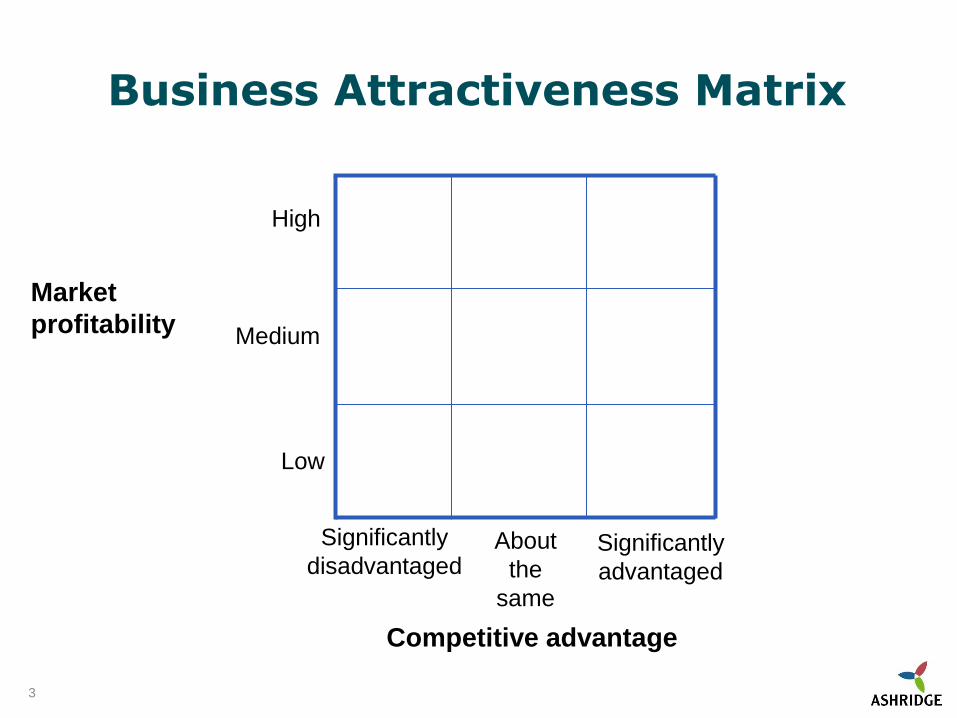
Market
profitability
Low
Medium
Significantly
advantaged
About
the
same
Significantly
disadvantaged
High
Competitive advantage
Business Attractiveness Matrix
3
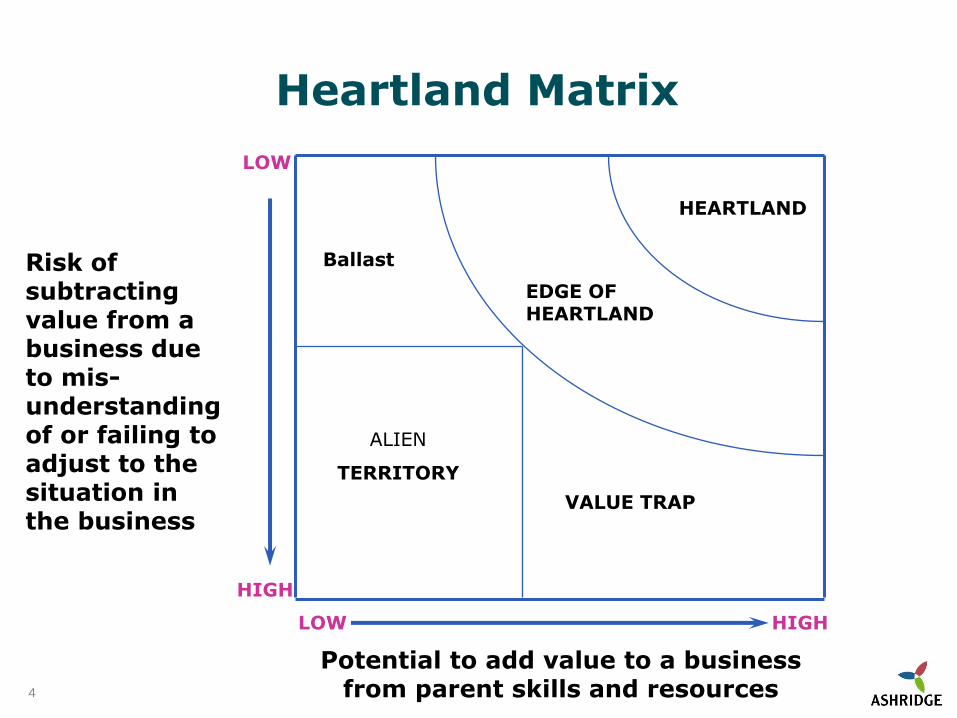
Heartland Matrix
4
Risk of subtracting value from a business due to mis-understanding of or failing to adjust to the situation in the business
HEARTLAND
EDGE OF HEARTLAND
Ballast
VALUE TRAP
ALIEN
TERRITORY
LOW
HIGH
LOW HIGH
Potential to add value to a business from parent skills and resources
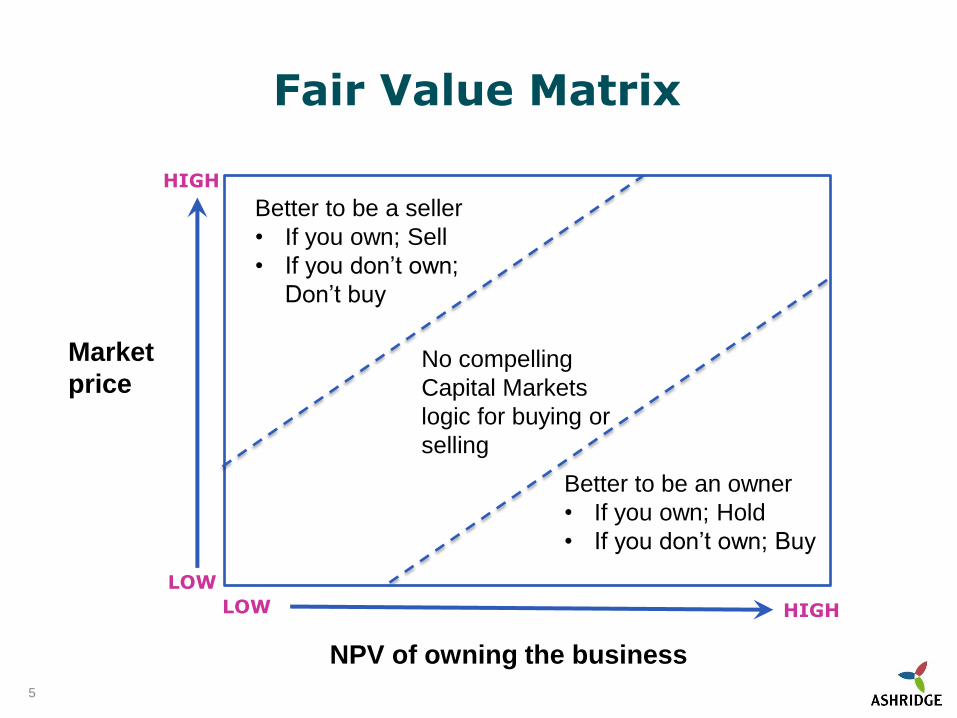
Fair Value Matrix
5
Market
price
NPV of owning the business
Better to be a seller
• If you own; Sell
• If you don’t own;
Don’t buy
No compelling
Capital Markets
logic for buying or
selling
Better to be an owner
• If you own; Hold
• If you don’t own; Buy
HIGH
LOW
LOW HIGH

CHAPTER 2
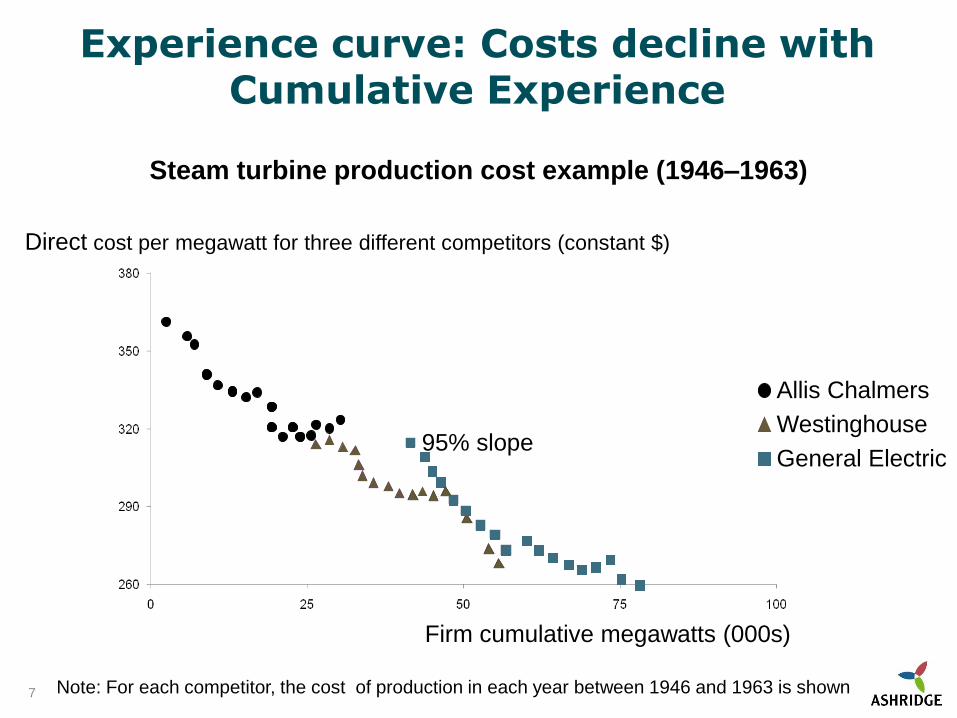
Experience curve: Costs decline with Cumulative Experience
Steam turbine production cost example (1946–1963)
Firm cumulative megawatts (000s)
95% slope
Allis Chalmers
Westinghouse
General Electric
Direct cost per megawatt for three different competitors (constant $)
Note: For each competitor, the cost of production in each year between 1946 and 1963 is shown 7
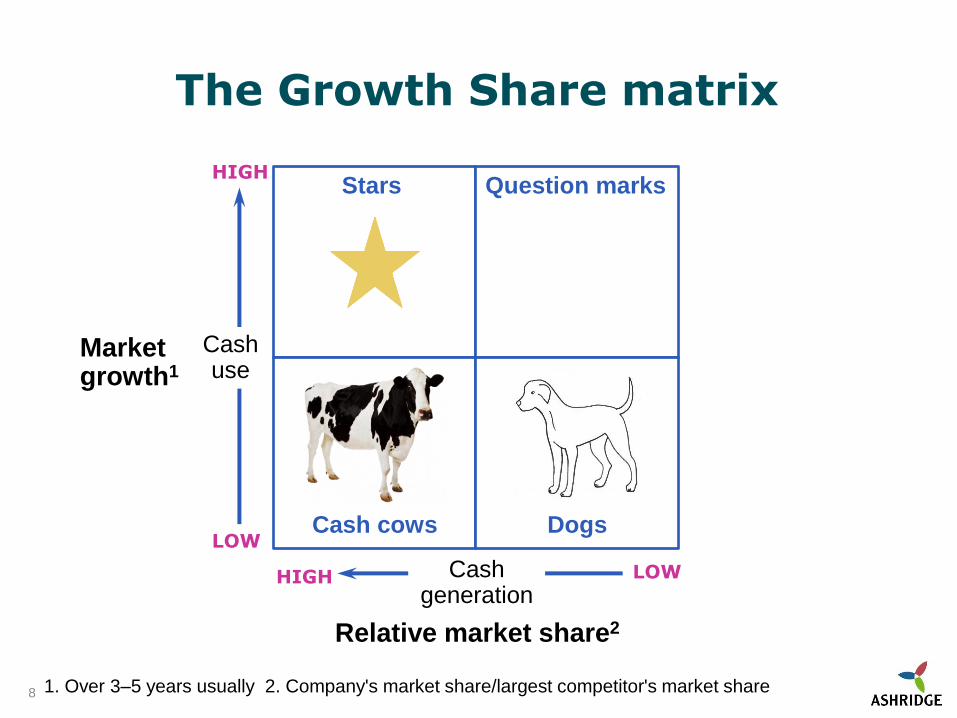
The Growth Share matrix
8
Market growth1
Relative market share2
Stars
? Question marks
1. Over 3–5 years usually 2. Company's market share/largest competitor's market share
Cash cows Dogs
HIGH
LOW
HIGH LOW
Cash use
Cash generation
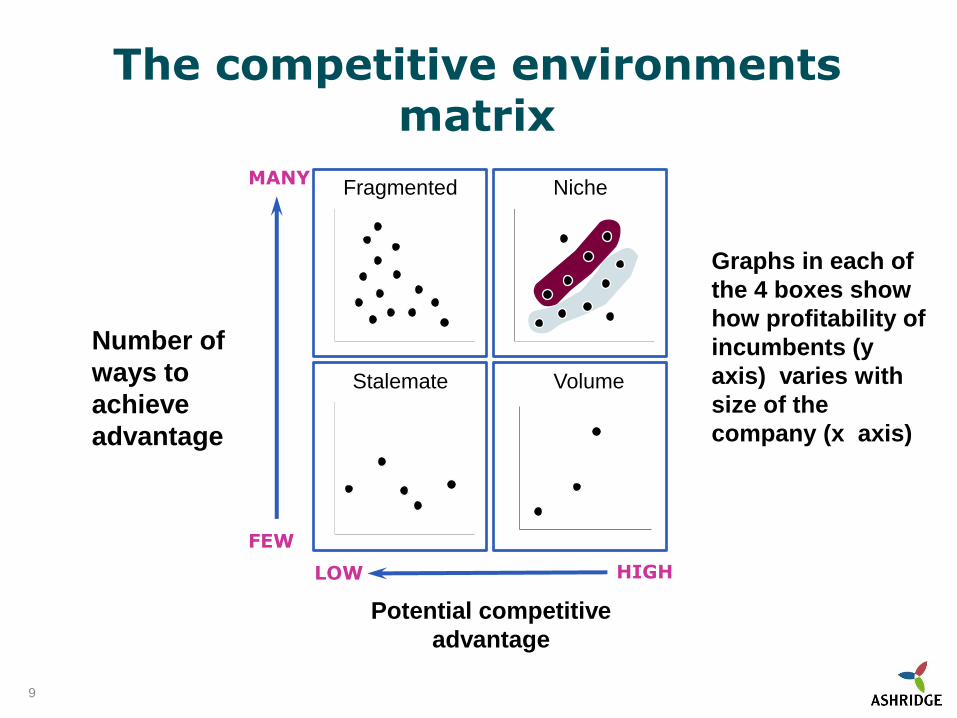
Fragmented
Stalemate
The competitive environments matrix
Niche
Volume
Potential competitive
advantage
Number of
ways to
achieve
advantage
Graphs in each of
the 4 boxes show
how profitability of
incumbents (y
axis) varies with
size of the
company (x axis)
MANY
FEW
LOW HIGH
9
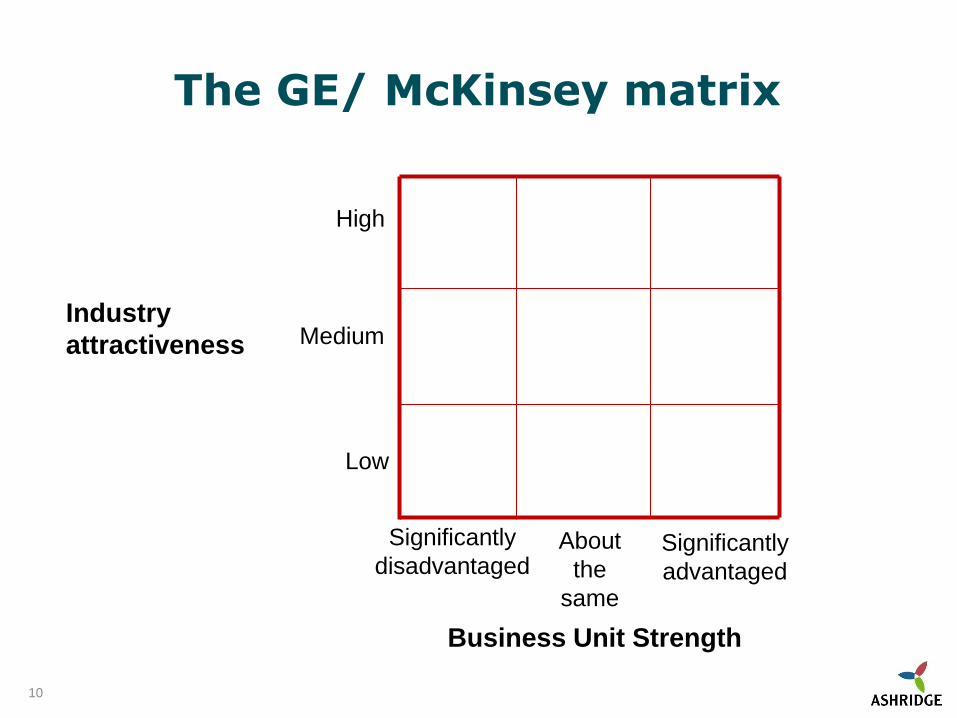
The GE/ McKinsey matrix
Industry
attractiveness
Business Unit Strength
Low
Medium
Significantly
advantaged
About
the
same
Significantly
disadvantaged
High
10

CHAPTER 3
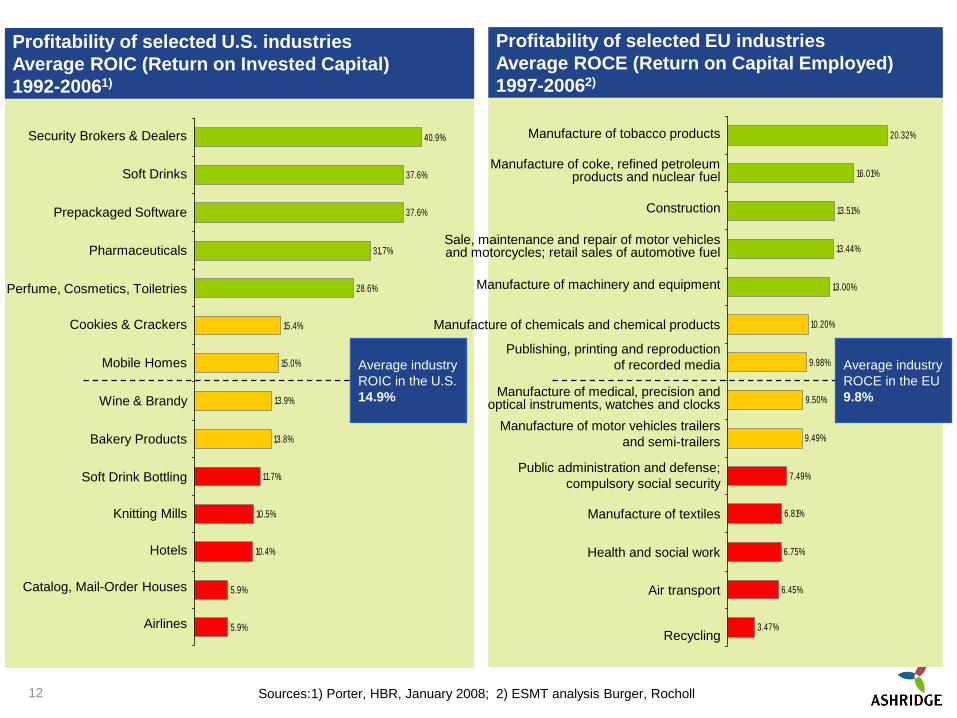
Sources: 1) Porter, HBR, January 2008; 2) ESMT analysis Burger, Rocholl
Profitability of selected U.S. industries
Average ROIC (Return on Invested Capital)
1992-20061)
Profitability of selected EU industries
Average ROCE (Return on Capital Employed)
1997-20062)
5.9%
5.9%
10.4%
10.5%
11.7%
13.8%
13.9%
15.0%
15.4%
28.6%
31.7%
37.6%
37.6%
40.9%
Average industry
ROIC in the U.S.
14.9%
3.47%
6.45%
6.75%
6.81%
7.49%
9.49%
9.50%
9.98%
10.20%
13.00%
13.44%
13.51%
16.01%
20.32%
Average industry
ROCE in the EU
9.8%
Airlines
Catalog, Mail-Order Houses
Hotels
Knitting Mills
Soft Drink Bottling
Perfume, Cosmetics, Toiletries
Pharmaceuticals
Prepackaged Software
Soft Drinks
Security Brokers & Dealers
Cookies & Crackers
Mobile Homes
Bakery Products
Wine & Brandy
Public administration and defense;
compulsory social security
Manufacture of textiles
Health and social work
Air transport
Recycling
Manufacture of medical, precision and optical instruments, watches and clocks
Manufacture of motor vehicles trailers
and semi-trailers
Manufacture of chemicals and chemical products
Publishing, printing and reproduction
of recorded media
Manufacture of tobacco products
Manufacture of coke, refined petroleum products and nuclear fuel
Construction
Sale, maintenance and repair of motor vehicles and motorcycles; retail sales of automotive fuel
Manufacture of machinery and equipment
12
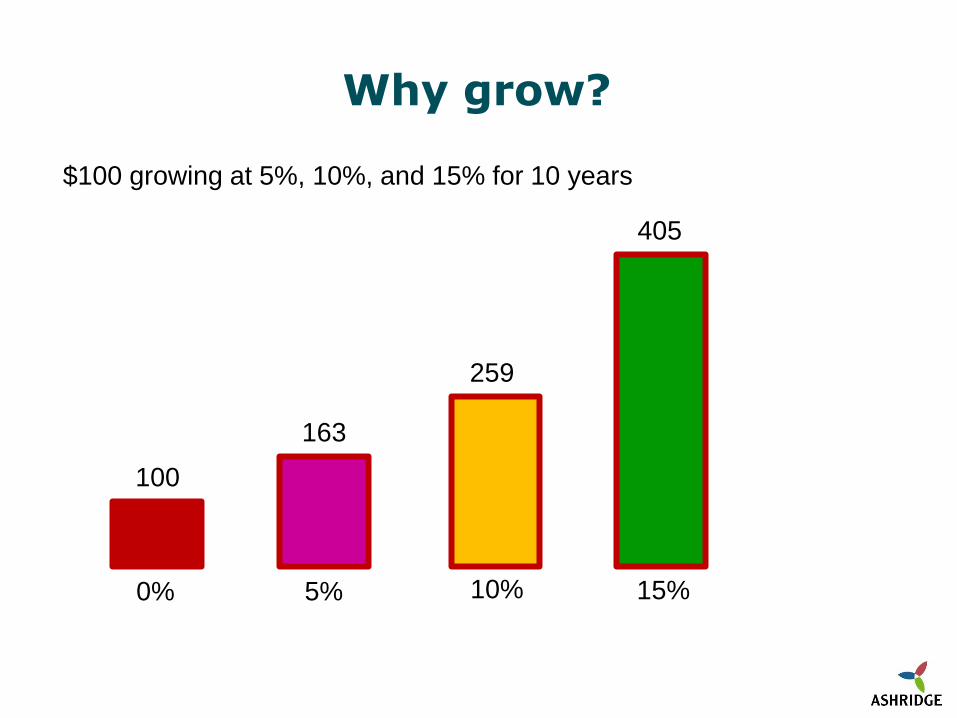
Why grow?
$100 growing at 5%, 10%, and 15% for 10 years
5% 0% 10% 15%
100
163
259
405

CHAPTER 4
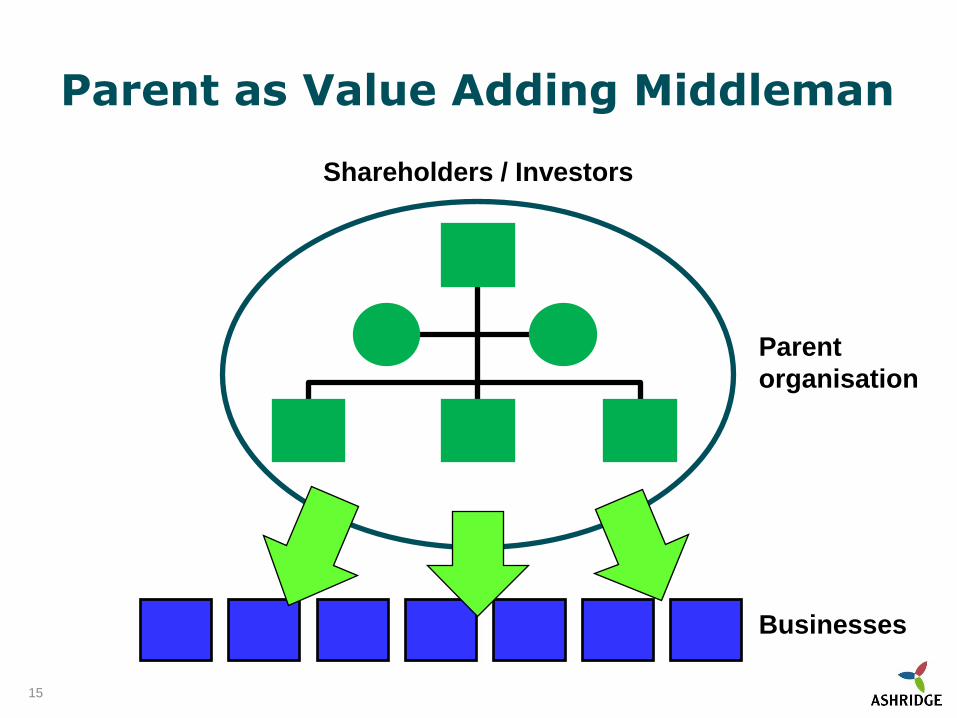
Parent as Value Adding Middleman
15
Parent
organisation
Businesses
Shareholders / Investors
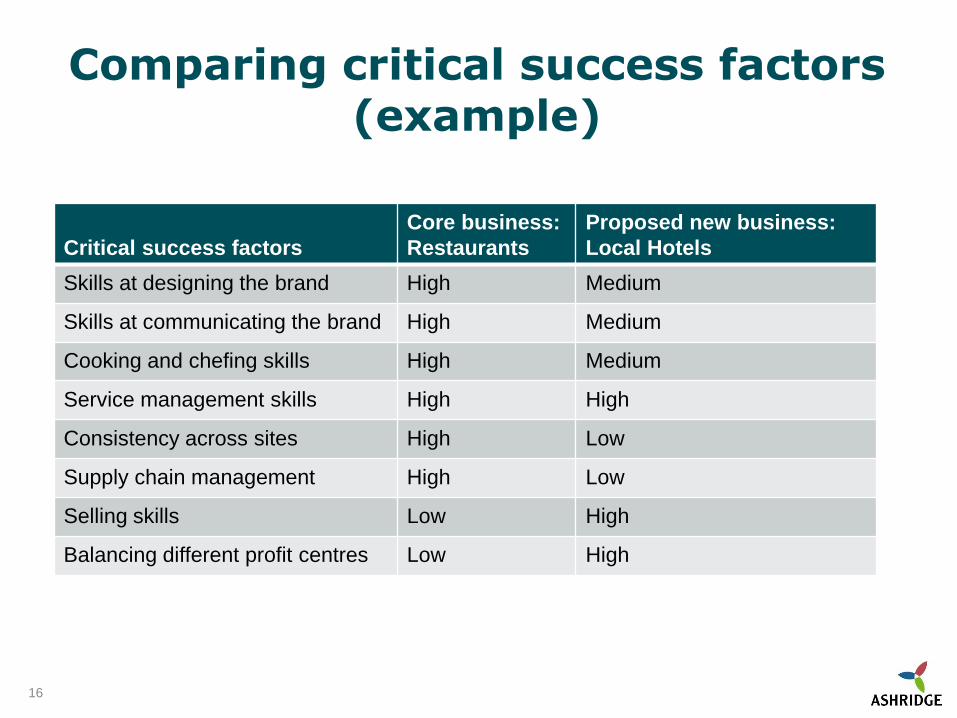
Comparing critical success factors (example)
Critical success factors
Core business:
Restaurants
Proposed new business:
Local Hotels
Skills at designing the brand High Medium
Skills at communicating the brand High Medium
Cooking and chefing skills High Medium
Service management skills High High
Consistency across sites High Low
Supply chain management High Low
Selling skills Low High
Balancing different profit centres Low High
16

CHAPTER 5
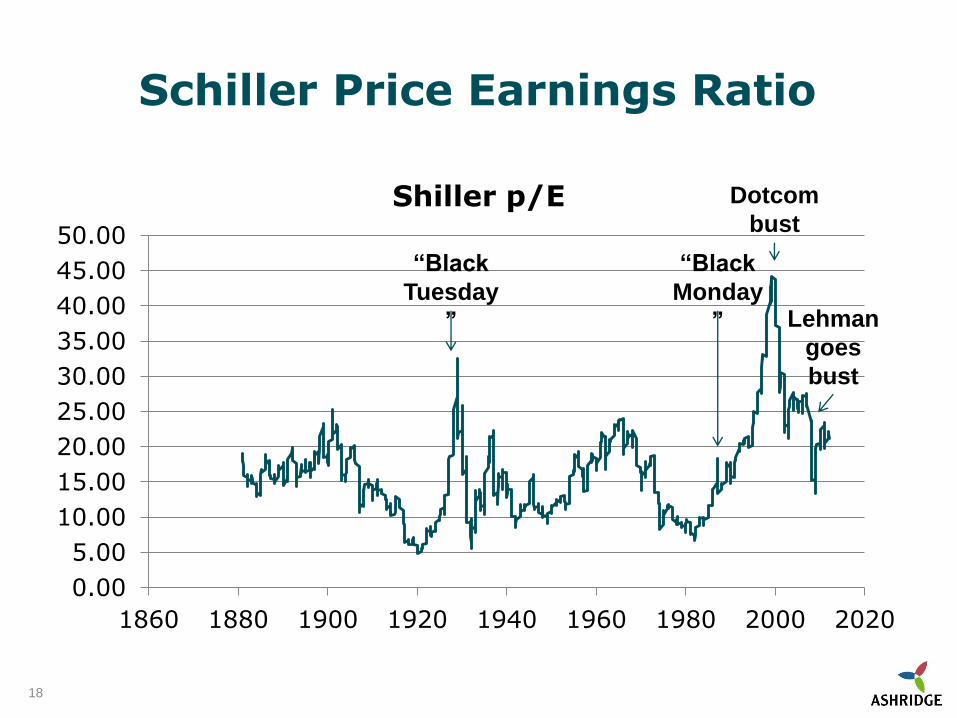
Schiller Price Earnings Ratio
18
0.00
5.00
10.00
15.00
20.00
25.00
30.00
35.00
40.00
45.00
50.00
1860 1880 1900 1920 1940 1960 1980 2000 2020
Shiller p/E
“Black
Monday
”
“Black
Tuesday
”
Dotcom
bust
Lehman
goes
bust
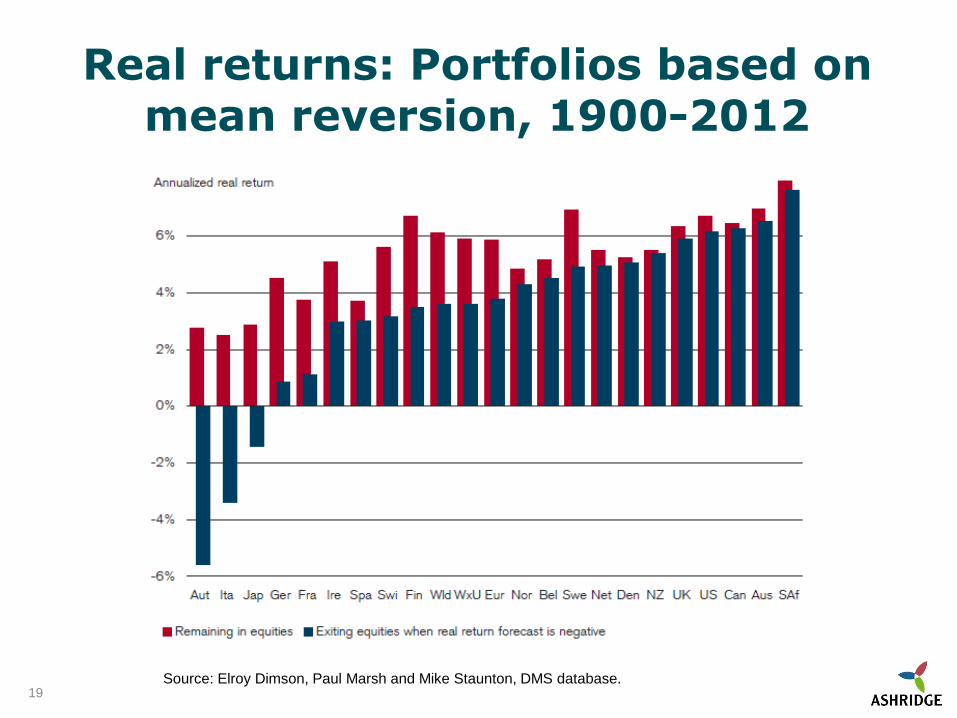
Real returns: Portfolios based on mean reversion, 1900-2012
Source: Elroy Dimson, Paul Marsh and Mike Staunton, DMS database. 19

CHAPTER 6
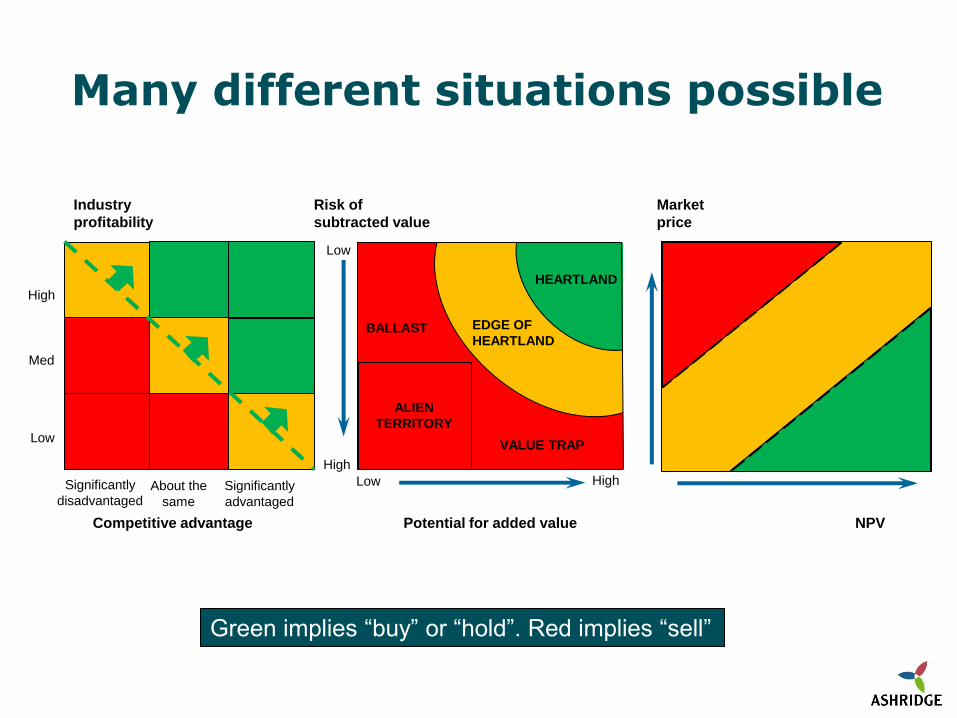
Many different situations possible
Significantly
disadvantaged About the
same
High
Med
Low
Significantly
advantaged
Industry
profitability
Competitive advantage
Risk of
subtracted value
HEARTLAND
EDGE OF
HEARTLAND BALLAST
VALUE TRAP
ALIEN
TERRITORY
Low
High
Low
Potential for added value
High
Market
price
NPV Competitive advantage
Green implies “buy” or “hold”. Red implies “sell”

CHAPTER 10
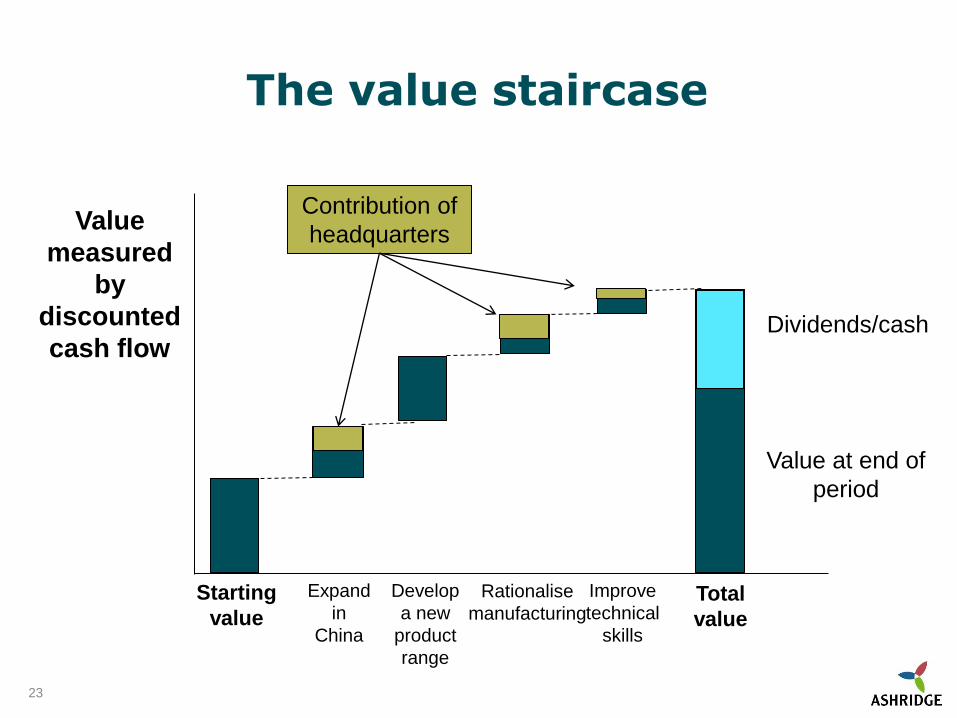
The value staircase
23
Starting
value
Contribution of
headquarters
Dividends/cash
Value at end of
period
Value
measured
by
discounted
cash flow
Expand
in
China
Develop
a new
product
range
Rationalise
manufacturing
Improve
technical
skills
Total
value

CHAPTER 11
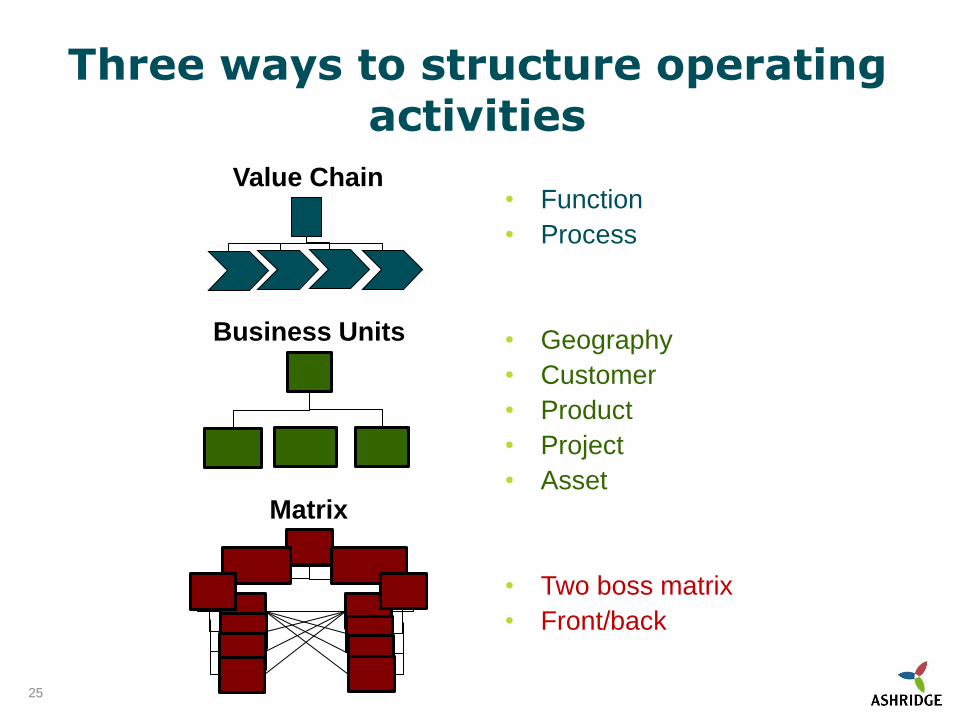
Three ways to structure operating activities
• Function
• Process
• Geography
• Customer
• Product
• Project
• Asset
• Two boss matrix
• Front/back
25
Value Chain
Business Units
Matrix

CHAPTER 13
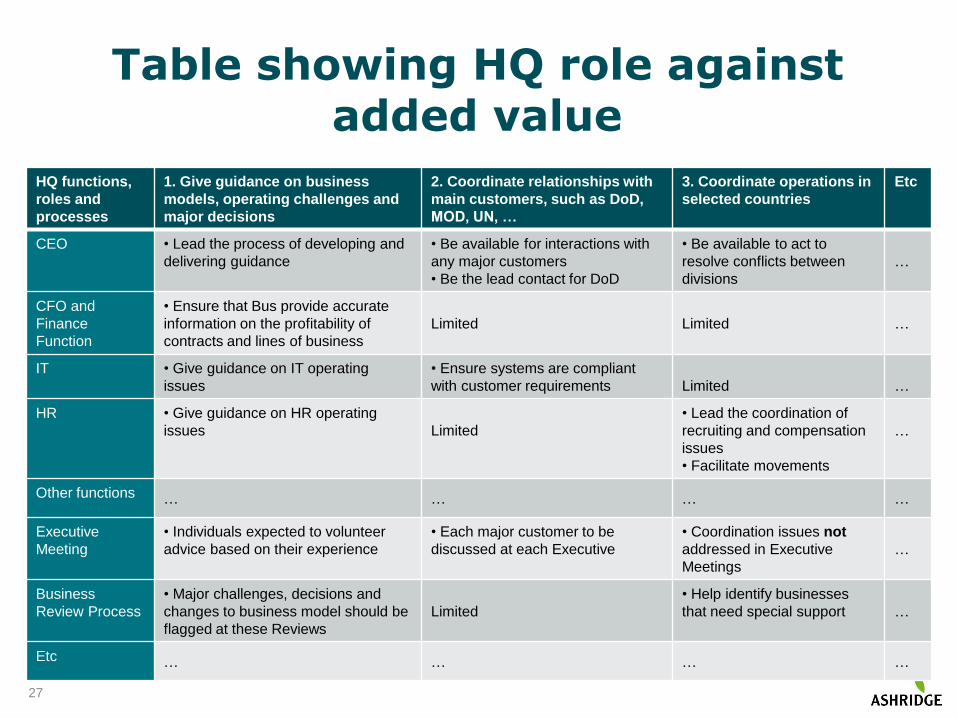
Table showing HQ role against added value
HQ functions,
roles and
processes
1. Give guidance on business
models, operating challenges and
major decisions
2. Coordinate relationships with
main customers, such as DoD,
MOD, UN, …
3. Coordinate operations in
selected countries
Etc
CEO • Lead the process of developing and
delivering guidance
• Be available for interactions with
any major customers
• Be the lead contact for DoD
• Be available to act to
resolve conflicts between
divisions
…
CFO and
Finance
Function
• Ensure that Bus provide accurate
information on the profitability of
contracts and lines of business
Limited
Limited
…
IT • Give guidance on IT operating
issues
• Ensure systems are compliant
with customer requirements
Limited
…
HR • Give guidance on HR operating
issues
Limited
• Lead the coordination of
recruiting and compensation
issues
• Facilitate movements
…
Other functions … … … …
Executive
Meeting
• Individuals expected to volunteer
advice based on their experience
• Each major customer to be
discussed at each Executive
• Coordination issues not
addressed in Executive
Meetings
…
Business
Review Process
• Major challenges, decisions and
changes to business model should be
flagged at these Reviews
Limited
• Help identify businesses
that need special support
…
Etc … … … …
27
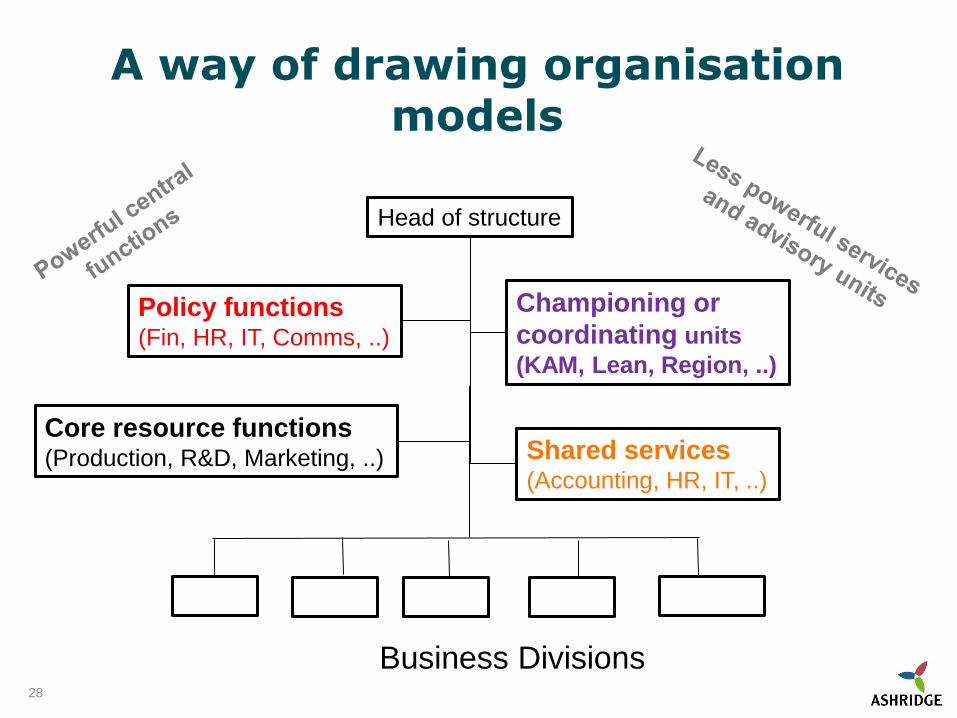
A way of drawing organisation models
28
Shared services (Accounting, HR, IT, ..)
Core resource functions (Production, R&D, Marketing, ..)
Championing or
coordinating units
(KAM, Lean, Region, ..)
Head of structure
Policy functions (Fin, HR, IT, Comms, ..)
Business Divisions
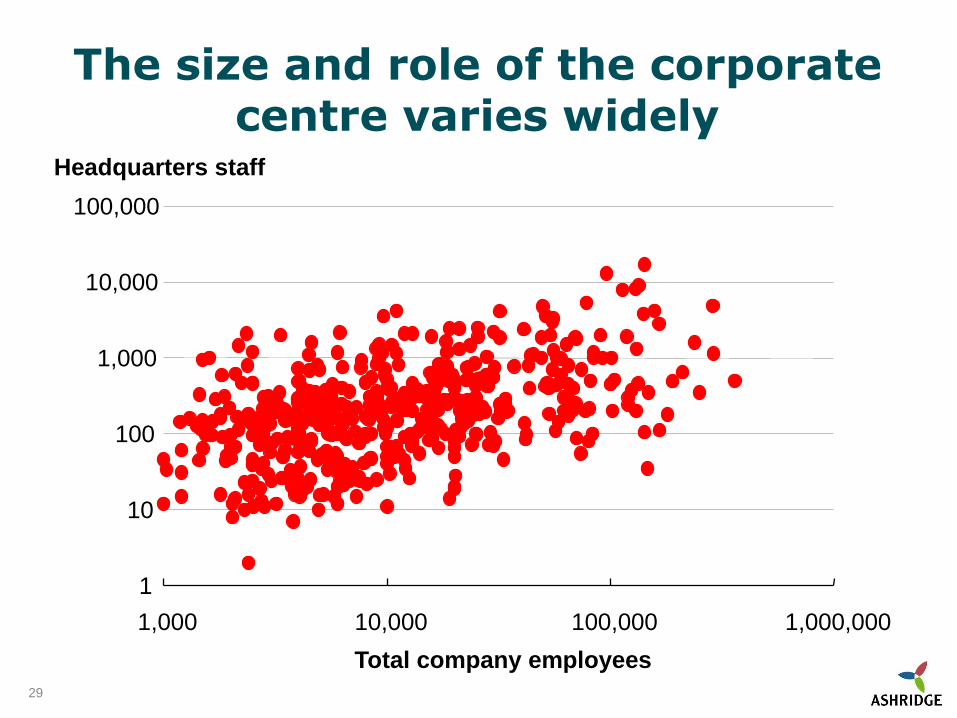
The size and role of the corporate centre varies widely
29
Headquarters staff
1
10
100
1,000
10,000
100,000
1,000 10,000 100,000 1,000,000
Total company employees