Embed Size (px)
Citation preview
The Financial Crisis of 2007–2009: Why
Did It Happen and What Did We Learn?
Anjan V. Thakor
Olin Business School, Washington University in St. Louis, and ECGI
This review of the literature on the 2007–2009 crisis discusses the precrisis condi-
tions, the crisis triggers, the crisis events, the real effects, and the policy responses to
the crisis. The precrisis conditions contributed to the housing price bubble and the
subsequent price decline that led to a counterparty-risk crisis in which liquidity
shrank due to insolvency concerns. The policy responses were influenced both by
the initial belief that it was a market-wide liquidity crunch and the subsequent
learning that insolvency risk was a major driver. I suggest directions for future
research and possible regulatory changes. (JEL G20, G21, E58, G28)
In its analysis of the crisis, my testimony before the Financial CrisisInquiry Commission drew the distinction between triggers and vul-nerabilities. The triggers of the crisis were the particular events orfactors that touched off the events of 2007–2009—the proximatecauses, if you will. Developments in the market for subprime mort-gages were a prominent example of a trigger of the crisis. In con-trast, the vulnerabilities were the structural, and more fundamental,weaknesses in the financial system and in regulation and supervi-sion that served to propagate and amplify the initial shocks.
Chairman Ben Bernanke, April 13, 20121
Introduction
Financial crises are a centuries-old phenomena (see Reinhart and Rogoff2008, 2009, 2014), and there is a substantial literature on the subject(e.g., Allen and Gale 1998, 2000; Diamond and Dybvig 1983;
I thank Arnoud Boot, Jennifer Dlugosz, Emre Ergungor, Stuart Greenbaum, Roni Kisin, Asaf Manela,Giorgia Piacentino, an anonymous referee, and, especially, Paolo Fulghieri (editor) and the other editorsof the journal for helpful comments. I alone am responsible for any errors (either omission or commis-sion) or misstatements. Send correspondence to Anjan V. Thakor, Washington University in St. Louis,Olin Business School, CB1133, One Brookings Drive, St. Louis, MO 63130; telephone: 314-935-7197;fax: 314-935-6359. E-mail: [email protected].
1 Bernanke, B. S. “Some Reflections on the Crisis and the Policy Response.” Speech at the Russell SageFoundation and the Century Foundation Conference on “Rethinking Finance,” New York, April 13,2012.
� The Author 2015. Published by Oxford University Press on behalf of The Society for FinancialStudies. All rights reserved. For Permissions, please e-mail: [email protected]:10.1093/rcfs/cfv001 Advance Access publication April 13, 2015
Gennaioli, Shleifer, and Vishny 2015; Gorton 2010; Thakor forthcom-ing). Despite this familiarity, the financial crisis of 2007–2009 came as amajor shock that is widely regarded as the worst financial crisis since theGreat Depression of the 1930s, and rightly so. The crisis threatened theglobal financial system with total collapse, led to the bailouts of manylarge uninsured financial institutions by their national governments,caused sharp declines in stock prices, followed by smaller and more ex-pensive loans for corporate borrowers as banks pulled back on their long-term and short-term credit facilities, and caused a decline in consumerlending and lower investments in the real sector.2 For a detailed accountof these events, see the excellent review by Brunnermeier (2009).
Atkinson, Luttrell, and Rosenblum (2013) estimate that the financialcrisis cost the United States an estimated 40% to 90% of one year’soutput, an estimated $6 to $14 trillion, the equivalent of $50,000 to$120,000 for every U.S. household. Even these staggering estimatesmay be conservative. The loss of total U.S. wealth from the crisis—including human capital and the present value of future wage income—is estimated in this paper to be as high as $15 to $30 trillion, or100%–190% of 2007 U.S. output. The wide ranges in these estimatesreflect uncertainty about how long it will take the output of the economyto return to noninflationary capacity levels of production.
As Lo (2012) points out, we do not have consensus on the causes of thecrisis. This survey discusses the various contributing factors. I believe thata combination of global macroeconomic factors and U.S. monetarypolicy helped to create an environment in which financial institutionsenjoyed a long period of sustained profitability and growth, which ele-vated perceptions of their skills in risk management (see Thakor 2015a),possibly increased bullishness in a non-Bayesian manner (e.g., Gennaioli,Shleifor, and Vishny 2015), and encouraged financial innovation. Thefinancial innovation was driven by advances in information technologythat helped make all sorts of securities marketable, spurred the growth ofthe subprime mortgage market, and made banking more intertwined withmarkets (see Boot 2014; Boot and Thakor 2014).
These innovative securities led to higher risks in the industry,3 andeventually these risks led to higher-than-expected defaults, causing thesecurities to fall out of favor with investors, precipitating a crisis (e.g.,Gennaioli, Shleifer, and Vishny 2012). The early signs of the crisis camein the form of withdrawals by investors/depositors and sharp increases in
2 See Campello, Graham, and Harvey (2010), Gorton and Metrick (2012), and Santos (2011).
3 The higher risk associated with financial innovation was systematic, partly because the new securitieswere traded, market-based securities that not only caused banks to become more connected with themarket but were also more connected with each other since banks were holding similar securities forinvestment purposes.
Review of Corporate Finance Studies / v 4 n 2 2015
156
risk premia and collateral requirements against secured borrowing. Thesedevelopments were interpreted by U.S. regulators and the government asindications of a market-wide liquidity crisis, so most of the initial regu-latory and government initiatives to stanch the crisis took the form ofexpanded liquidity facilities for a variety of institutions and ex post ex-tension of insurance for (a prior uninsured) investors. As the crisis con-tinued despite these measures, there was growing recognition that theroot cause of the liquidity stresses seemed to be counterparty risk andinstitution-specific insolvency concerns linked to the downward revisionsin the assessments of the credit qualities of subprime mortgages andmany asset-backed securities. This then led to additional regulatory ini-tiatives targeted at coping with counterparty risk. It is argued that someof the government initiatives—despite their temporary nature and theireffectiveness—have created the expectation of future ad hoc expansionsof the safety net to uninsured sectors of the economy, possibly creatingvarious sorts of moral hazard going forward. This crisis is thus a story ofprior regulatory beliefs about underlying causes of the crisis being heavilyinfluenced by historical experience (especially the Great Depression thatmany believe was prolonged by fiscal tightening by the government andinadequate liquidity provision by the central bank),4 followed by learningthat altered these beliefs, and the resulting innovations in regulatory re-sponses whose wisdom is likely to be the subject of ongoing debate andresearch.
All of these policy interventions were ex post measures to deal with aseries of unexpected events. But what about the ex ante regulatory ini-tiatives that could have made this crisis less likely? The discussion of thecausal events in Section 2 sheds light on what could have occurred before2006, but a more extensive discussion of how regulation can enhancebanking stability appears in Thakor (2014). In a nutshell, it appearsthat what we witnessed was a massive failure of societal risk manage-ment, and it occurred because a sustained period of profitable growth inbanking created a false sense of security among all; the fact that bankssurvived the bursting of the dotcom bubble further reinforced this beliefin the ability of banks to withstand shocks and survive profitably. Thisled politicians to enact legislation to further the dream of universal homeownership that may have encouraged risky bank lending to excessively
4 Massive deposit withdrawals experienced by New York banks in February 1933 led to these banksturning to the U.S. Federal Reserve as a Lender of Last Resort (LOLR). However, on March 4, 1933,the Fed shut off the liquidity spigot and declared a week-long bank “holiday.” Many believe this denialof liquidity to the banking system is what led to the darkest days of the Great Depression. This view ofthe Great Depression is not shared by all, however. Some believe the problem then was also insolvency,not illiquidity, just as in the subprime crisis.
The Financial Crisis of 2007–2009
157
leveraged consumers.5 Moreover, it caused banks to operate with lesscapital than was prudent and to extend loans to excessively leveragedconsumers, caused rating agencies to underestimate the true risks, andled investors to demand unrealistically low risk premia. Two simple regu-latory initiatives may have created a less crisis-prone financial system—significantly raising capital requirements in the commercial and shadowbanking systems during the halcyon precrisis years and putting in placeregulatory mechanisms—either outright proscriptions or price-based in-ducements—to ensure that banks focused on originating and securitizingonly those mortgages that involved creditworthy borrowers with suffi-cient equity. This is perhaps twenty-twenty hindsight, but some mighteven dispute that these are the right conclusions to draw from this crisis.If so, what did we really learn?
There is a sense that this crisis simply reinforced old lessons learnedfrom previous crises and a sense that it revealed new warts in the financialsystem. Reinhart and Rogoff’s (2009) historical study of financial crisesreveals a recurring pattern—most financial crises are preceded by highleverage on the balance sheets of financial intermediaries and asset pricebooms. Claessens and Kodres (2014) identify two additional “commoncauses” that seem to play a role in crises: financial innovation that createsnew instruments whose returns rely on continued favorable economicconditions (e.g., Fostel and Geanakoplos 2012), and financial liberaliza-tion and deregulation. Given that these causes go back centuries, onemust wonder whether, as a society, we simply do not learn or whetherthe perceived benefits of the precrisis economic boom are deemed to belarge enough to make the occasional occurrence of crises one worthbearing.
Numerous valuable new lessons have emerged as well—insolvency andcounterparty risk concerns were primary drivers of this crisis, the shadowbanking sector was highly interconnected with the banking system andthus a major influence on the systemic risk of the financial system, highleverage contributes to an endogenous increase in systemic risk (espe-cially when it occurs simultaneously on the balance sheets of consumersas well as financial institutions), and piecemeal regulation of depositoryinstitutions in a highly fragmented regulatory structure that leaves theshadow banking system less regulated makes it easy for financial institu-tions to circumvent microprudential regulation and engage in financialinnovation, some of which increases systemic risk. Moreover, state andfederal regulators implement similar regulations in different ways (seeAgarwal et al. 2014), adding to complexity in the implementation of
5 See Agarwal et al. (2012). Fannie Mae and Freddie Mac received a mandate to support low-incomehousing in 2003. This was actually helpful to these agencies in expanding their activities beyond theirinitial charter and in growing by purchasing subprime residential mortgage-backed securities.
Review of Corporate Finance Studies / v 4 n 2 2015
158
regulation and elevating uncertainty about the responses of regulatedinstitutions to these regulations. And, finally, compensation practicesand other aspects of corporate culture in financial institutionsmay have encouraged fraud (see Piskorski, Seru, and Witkin forthcom-ing), adding another wrinkle to the conditions that existed prior to thecrisis.
However, it is also clear that our learning is far from complete. Thepursuit of easy-money monetary policies in many countries seems to re-flect the view that liquidity is still a major impediment and that thesepolicies are needed to facilitate continued growth-stimulus objectives, butit is unlikely that such policies will help allay concerns about insolvencyand counterparty risks, at least as a first-order effect. The persistence oflow-interest rate policies encourage banks to chase higher yields by takinghigher risks, thereby increasing the vulnerability of the financial system tofuture crises. And the complexity of regulations like Dodd-Frank makesthe reactions of banks—that seek novel ways to lighten their regulatoryburden—to these regulations more uncertain. All this means that some ofthe actions of regulators and central banks may inadvertently make thefinancial system more fragile rather than less.
This retrospective look at the 2007–2009 crisis also offers some ideasfor looking ahead. Three specific ideas are discussed in Section 5 andpreviewed here: First, the research seems to indicate that higher levelsof capital in banking would significantly enhance financial stability, withlittle, if any, adverse impact on bank value. However, much of our re-search on this issue is qualitative and does not lend itself readily to cali-bration exercises that can inform regulators how high to set capitalrequirements. The section discusses some recent research that hasbegun to calculate the level of optimal capital requirements. We needmore of this kind of research. Second, there needs to be more normativeresearch on the optimal design of the regulatory infrastructure. Mostresearch attention has been focused on the optimal design of regulations,but we need more research on the kinds of regulatory institutions neededto implement simple and effective regulations consistently, without thetensions created by multiple regulators with overlapping jurisdictions.Third, beyond executive compensation practices,6 we have virtually noresearch on culture in banking.7 Yet, managerial misconduct—whether itis excessive risk taking or information misrepresentation to clients—is areflection of not only compensation incentives but also the corporateculture in banking. This area is sorely in need of research.
6 It is argued that ROE is used extensively as a performance benchmark for executive compensation inbanking. This may provide one explanation for why bankers resist higher capital requirements.
7 For an initial stab at this, see Thakor (2015b).
The Financial Crisis of 2007–2009
159
1. What Happened and When
The financial crisis of 2007–2009 was the culmination of a credit crunchthat began in the summer of 2006 and continued into 2007.8 Most agreethat the crisis had its roots in the U.S. housing market, although I will lateralso discuss some of the factors that contributed to the housing pricebubble that burst during the crisis. The first prominent signs of problemsarrived in early 2007, when Freddie Mac announced that it would nolonger purchase high-risk mortgages, and New Century FinancialCorporation, a leading mortgage lender to risky borrowers, filed for bank-ruptcy.9 Another sign was that during this time the ABX indexes—whichtrack the prices of credit default insurance on securities backed by residen-tial mortgages—began to reflect higher expectations of default risk.10
While the initial warning signs came earlier, most people agree that thecrisis began in August 2007, with large-scale withdrawals of short-termfunds from various markets previously considered safe, as reflected insharp increases in the “haircuts” on repos and difficulties experiencedby asset-backed commercial paper (ABCP) issuers who had trouble roll-ing over their outstanding paper.11
Causing this stress in the short-term funding markets in the shadowbanking system during 2007 was a pervasive decline in U.S. house prices,leading to concerns about subprime mortgages.12 As indicated earlier, theABX index reflects these concerns at the beginning of 2007 (seeBenmelech and Dlugosz 2009; Brunnermeier 2009; Gorton and Metrick2012). The credit rating agencies (CRAs) downgraded asset-backed finan-cial instruments in mid-2007.13 The magnitude of the rating actions—interms of the number of securities affected and the average downgrade—inmid-2007 appeared to surprise investors.14 Benmelech and Dlugosz
8 The credit crunch was the symptom, rather than the cause, of the crisis.
9 See Marshall (2009).
10 See Benmelech and Dlugosz (2009).
11 See Gorton and Metrick (2012). A “repo” is a repurchase transaction, a vehicle for short-term borrowingsecured by a marketable security. A “haircut” on a repo is the discount relative to the market value of thesecurity offered as collateral in a repurchase transaction that the borrower must accept in terms of howmuch it can borrow against that collateral.
12 The shadow banking system consists of a variety of nondepository financial institutions—like investmentbanks, brokerage houses, finance companies, insurance companies, securitization structures for a varietyof asset-backed securities, and money-market mutual funds—that borrow (mostly short-term) in thefinancial market, using funding arrangements like commercial paper and repos that are backed by,among other things, the securities generated by securitization.
13 See Marshall (2009).
14 “The odds are only about 1 in 10,000 that a bond will go from highest grade, AAA, to the low-qualityCCC level during a calendar year,” as reported in “Anatomy of a Ratings Downgrade,” BusinessWeek,October 1, 2007. This notion that investors were “surprised” by the realization of a previously unforeseenrisk is similar to Gennaioli, Shleifer, and Vishny’s (2012) assumptions that investors ignore tail risks, aswell as the idea of Fostel and Geanakoplos (2012) that financial innovation created new securities whosereturns significantly depended on the continuation of favorable economic conditions.
Review of Corporate Finance Studies / v 4 n 2 2015
160
(2009) show that a large number of structured finance securities weredowngraded in 2007–2008, and the average downgrade was 5–6 notches.This is substantially higher than the historical average. For example,during the 2000–2001 recession, when one-third of corporate bondswere downgraded, the average downgrade was 2–3 notches.
Consequently, credit markets continued to tighten. The FederalReserve opened up short-term lending facilities and deployed other inter-ventions (described later in the paper) to increase the availability of li-quidity to financial institutions. But this failed to prevent thehemorrhaging, as asset prices continued to decline.
In early 2008, institutional failures reflected the deep stresses that werebeing experienced in the financial market. Mortgage lender CountrywideFinancial was bought by Bank of America in January 2008. And then inMarch 2008, Bear Stearns, the sixth largest U.S. investment bank, wasunable to roll over its short-term funding due to losses caused by pricedeclines in mortgage-backed securities (MBS). Its stock price had a pre-crisis fifty-two-week high of $133.20 per share, but plunged precipitouslyas revelations of losses in its hedge funds and other businesses emerged.JP Morgan Chase made an initial offer of $2 per share for all the out-standing shares of Bear Stearns, and the deal was consummated at $10per share when the Federal Reserve stepped in with a financial assistancepackage.
The problems continued as IndyMac, the largest mortgage lender inthe United States, collapsed and was taken over by the federal govern-ment. Things worsened as Fannie Mae and Freddie Mac (with ownershipof $5.1 trillion of U.S. mortgages) became sufficiently financially dis-tressed and were taken over by the government in September 2008. Thenext shock was when Lehman Brothers filed for Chapter 11 bankruptcyon September 15, 2008, failing to raise the capital it needed to underwriteits downgraded securities. On the same day, AIG, a leading insurer ofcredit defaults, received $85 billion in government assistance, as it faced asevere liquidity crisis. The next day, the Reserve Primary Fund, a moneymarket fund, “broke the buck,” causing a run on these funds. Interbanklending rates spiked.
On September 25, 2008, savings and loan giant, Washington Mutual,was taken over by the FDIC, and most of its assets were transferred to JPMorgan Chase.15 By October, the cumulative weight of these events had
15 He and Manela (2012) note that Washington Mutual actually suffered two separate bank runs. One wasa gradual withdrawal of deposits totaling $9 billion during the first 20 days in July 2008 after Indy Macfailed, and the other resulted in $15 billion in deposit withdrawals during 15 days in September 2008, thenculminating in the FDIC takeover.
The Financial Crisis of 2007–2009
161
caused the crisis to spread to Europe. In October, global cooperationamong central banks led them to announce coordinated interest ratecuts and a commitment to provide unlimited liquidity to institutions.However, there were also signs that this was being recognized as an in-solvency crisis. So the liquidity provision initiatives were augmented byequity infusions into banks. By mid-October, the U.S. Treasury had in-vested $250 billion in nine major banks.
The crisis continued into 2009. By October, the unemployment rate inthe United States rose to 10%.
2. Cause and Effect: The Causes of the Crisis and Its Real Effects
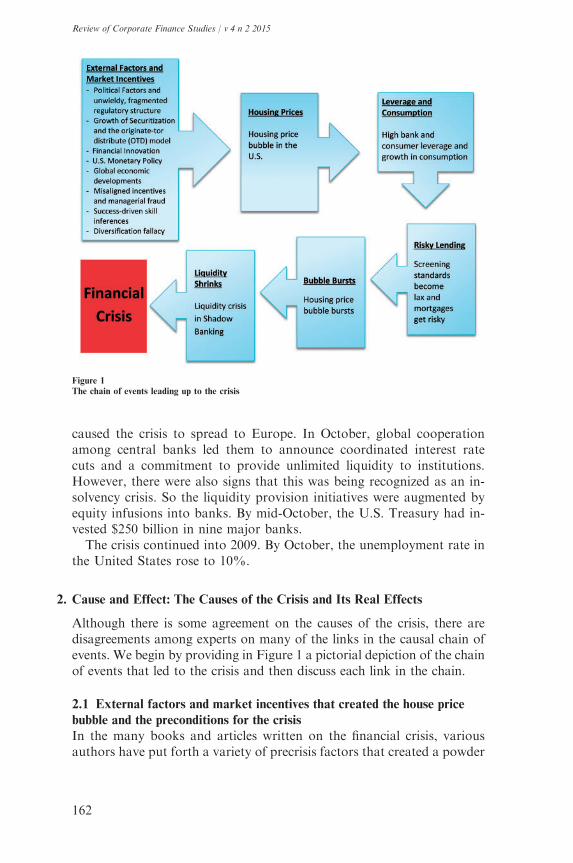
Although there is some agreement on the causes of the crisis, there aredisagreements among experts on many of the links in the causal chain ofevents. We begin by providing in Figure 1 a pictorial depiction of the chainof events that led to the crisis and then discuss each link in the chain.
2.1 External factors and market incentives that created the house price
bubble and the preconditions for the crisis
In the many books and articles written on the financial crisis, variousauthors have put forth a variety of precrisis factors that created a powder
Figure 1
The chain of events leading up to the crisis
Review of Corporate Finance Studies / v 4 n 2 2015
162
keg just waiting to be lit. Lo (2012) provides an excellent summary andcritique of twenty-one books on the crisis. He observes that there is noconsensus on which of these factors were the most significant, but we willdiscuss each in turn.
2.1.1 Political factors. Rajan (2010) reasons that economic inequitieshad widened in the United States due to structural deficiencies in theeducational system that created unequal access for various segments ofsociety. Politicians from both parties viewed the broadening of homeownership as a way to deal with this growing wealth inequality—a pol-itical proclivity that goes back at least to the 19th century HomesteadAct—and therefore undertook legislative initiatives and other induce-ments to make banks extend mortgage loans to a broader borrowerbase by relaxing underwriting standards, and this led to riskier mortgagelending.16 The elevated demand for houses pushed up house prices andled to the housing price bubble. In this view, politically motivated regu-lation was a contributing factor in the crisis.
This point has been made even more forcefully by Kane (2009, forth-coming) who argues that, for political reasons, most countries (includingthe United States) establish a regulatory culture that involves three elem-ents: (1) politically directed subsidies to selected bank borrowers, (2)subsidized provision of implicit and explicit repayment guarantees tothe creditors of banks, and (3) defective government monitoring andcontrol of the problems created by the first two elements. These elements,Kane (2009) argues, undermine the quality of bank supervision and pro-duce financial crises.
Perhaps these political factors can explain the very complicated regu-latory structure for U.S. banking. Agarwal et al. (2014) present evidencethat regulators tend to implement identical rules inconsistently becausethey have different institutional designs and potentially conflicting incen-tives. For U.S. bank regulators, they show that federal regulators aresystematically tougher and tend to downgrade supervisory ratingsalmost twice as frequently as state supervisors for the same bank.These differences in regulatory “toughness” increase the effective
16 One of these initiatives involves the strengthening of the Community Reinvestment Act (CRA) in themid-1990s. Agarwal et al. (2012) provide evidence that they interpret as suggesting that the CRA led toriskier lending by banks. They find that in the six quarters surrounding the CRA exams, lending increaseson average by 5% every quarter, and loans in those quarters default about 15% more often. Anotherimportant development was the regulatory change represented by the Bankruptcy Abuse Prevention andConsumer Protection Act of 2005 (BAPCA). BAPCA expanded the definition of repurchase agreementsto include mortgage loans, mortgage-related securities, and interest from these loans and securities. Thismeant that repo contracts on MBS, collateralized debt obligations (CDOs), and the like as collateralbecame exempt from automatic stay in bankruptcy (see Acharya and Oncu 2011). This made MBS andother mortgage-related securities more liquid, increasing demand for these securities and creating stron-ger mortgage origination incentives for banks. Song and Thakor (2012) provide a theory of how politicsshapes bank regulation.
The Financial Crisis of 2007–2009
163
complexity of regulations and impede the implementation of simple regu-latory rules, making the response of regulated institutions to regulationsless predictable than in theoretical models and generating another poten-tial source of financial fragility.
A strikingly different view of political influence lays the blame on de-regulation motivated by political ideology. Deregulation during the 1980screated large and powerful financial institutions with significant politicalclout to block future regulation, goes the argument presented by Johnsonand Kwak (2010). This “regulatory capture” created a crisis-prone finan-cial system with inadequate regulatory oversight and a cozy relationshipbetween government and big banks.
2.1.2 Growth of securitization and the OTDmodel. It has been suggestedthat the desire of the U.S. government to broaden ownership was alsoaccompanied by monetary policy that facilitated softer lending standardsby banks. In particular, an empirical study of Euro-area and U.S. Banklending standards by Maddaloni and Paydro (2011) finds that low short-term interest rates (generated by an “easy money” monetary policy) leadto softer standards for household and business loans. Moreover, thissoftening is amplified by the originate-to-distribute (OTD) model of se-curitization,17 weak supervision over bank capital, and a lax monetarypolicy.18 These conditions thus made it attractive for commercialbanks to expand mortgage lending in the period leading to the crisisand for investment banks to engage in warehouse lending using nonbankmortgage lenders. Empirical evidence also has been provided thatthe OTD model encouraged banks to originate risky loans in everincreasing volumes. Purnanandam (2011) documents that a one-standard-deviation increase in a bank’s propensity to sell off its loansincreases the default rate by about 0.45 percentage points, representingan overall increase of 32%.
The effect of these developments in terms of the credit that flowed intothe housing market to enable consumers to buy homes was staggering.19
Total loan originations (new and refinanced loans) rose from $500 billionin 1990 to $2.4 trillion in 2007, before declining to $900 billion in the firsthalf of 2008. Total amount of mortgage loans outstanding increased from$2.6 to $11.3 trillion over the same period. Barth et al. (2009) show that
17 Many investment banks retained the asset-backed securities they could not sell and financed them withincreased leverage. This made these banks riskier.
18 It can be shown theoretically that the OTD model of securitization makes it less costly for banks to relaxcredit standards, invest less in screening, and make riskier loans, resulting in higher systematic risk. SeeCortes and Thakor (2015).
19 As of early 2009, the U.S. housing market was valued at about $19.3 trillion. See Barth et al. (2009).
Review of Corporate Finance Studies / v 4 n 2 2015
164
the subprime share of home mortgages grew from 8.7% in 1995 to a peakof 13.5% in 2005.
2.1.3 Financial innovation. Prior to the financial crisis, we witnessed anexplosion of financial innovation for over two decades. One contributingfactor was information technology, which made it easier for banks todevelop tradable securities and made commercial banks more intertwinedwith the shadow banking system and with financial markets. But, ofcourse, apart from information technology, there had to be economicincentives for banks to engage in innovation. Thakor (2012) developsan innovation-based theory of financial crises, which starts with the ob-servation that financial markets are very competitive, so with standardfinancial products—those whose payoff distributions everybody agreeson—it is hard for financial institutions to have high profit margins.This encourages the search for new financial products, especially thosewhose creditworthiness not everybody agrees on. The lack of unanimityof the investment worth of the new financial products limits how com-petitive the market for those products will be and allows the offeringinstitutions to earn high initial profits.20
But such new products are also riskier by virtue of lacking a history.The reason is that it is not only competitors who may disagree that theseare products worthy of investment but also the financiers of the institu-tions offering these products, and there is a paucity of historical data thatcan be relied upon to eliminate the disagreement. When this happens,short-term funding to the innovating institutions will not be rolled over,and a funding crisis ensues. The explosion of new asset-backed securitiescreated by securitization prior to the crisis created an ideal environmentfor this to occur.
This view of how financial innovation can trigger financial crises is alsorelated to Gennaioli, Shleifer, and Vishny’s (2012) model in which newsecurities—with tail risks that investors ignore—are oversupplied to meethigh initial demand and then dumped by investors when a recognition ofthe risks induces a flight to safety. Financial institutions are then leftholding these risky securities.
These theories explain the 2007–2009 crisis, as well as many previouscrises. For example, perhaps the first truly global financial crisis occurredin 1857 and was preceded by significant financial innovation to enableinvestments by British and other European banks in U.S. railroads andother assets.
20 As long as investors agree on these financial products being worthy of investment. The risk that investorsmay later change their minds is a form of “model risk.”
The Financial Crisis of 2007–2009
165
2.1.4 U.S. monetary policy. Taylor (2009) argues that the easy-moneymonetary policy followed by the U.S. Federal Reserve, especially in thesix or seven years prior to the crisis, was a major contributing factor tothe price boom and subsequent bust that led to the crisis. Taylor (2009)presents evidence that monetary policy was too “loose fitting” during2007–2009 in the sense that actual interest rate decisions fell well belowwhat historical experience would suggest policy should be based on theTaylor rule.21
Taylor (2009) shows that these unusually low interest rates, a part of adeliberate monetary policy choice by the Federal Reserve, accelerated thehousing boom and thereby ultimately led to the housing bust. The paperpresents a regression to estimate the empirical relationship between theinterest rate and housing starts, showing that there was a high positivecorrelation between the intertemporal decline in interest rates during2001–2007 and the boom in the housing market. Moreover, a simulationto see what would have happened in the counterfactual event that theTaylor rule interest rate policy had been followed indicates that we wouldnot have witnessed the same housing boom that occurred in reality. Andwithout a housing boom, there would be no bubble to burst and no crisis.
The impact of low interest rates on housing prices was amplified by theincentives the low interest rate environment provided for lenders to makeriskier (mortgage) loans. When the central bank keeps interest loans lowfor so long, it pushes down banks’ net interest margins, and one way forbanks to respond is to elevate these margins by taking on more risk. Thisinduced banks to increase the borrower pool by lending to previouslyexcluded high-risk borrowers, further fueling the housing price boom.
It was not only the U.S. central bank that followed an easy-moneypolicy and experienced a housing boom. In Europe, deviations from theTaylor rule varied in size across countries due to differences in inflationand GDP growth. The country with the largest deviation from the rulewas Spain, and it had the biggest boom in housing, as measured by thechange in housing investment as a share of GDP. Austria had the smal-lest deviation from the rule and also experienced the smallest change inhousing investment as a share of GDP.
Taylor (2009) notes that there was apparently coordination amongcentral banks to follow this easy-money policy. A significant fractionof the European Central Bank (ECB) interest rate decisions can be ex-plained by the influence of the Federal Reserve’s interest rate decisions.
21 The “Taylor rule” is a monetary policy rule that stipulates how much the central bank should change thenominal interest rate in response to changes in inflation, output, or other economic conditions.Specifically, the rule, attributed to John B. Taylor, stipulates each 1% increase in inflation should bemet with a more than 1% increase in the nominal interest rate by the central bank.
Review of Corporate Finance Studies / v 4 n 2 2015
166
2.1.5 Global economic developments. Jagannathan, Kapoor, andSchaumburg (2013) have pointed to developments in the global economyas a contributing factor. In the past two decades, the global labor markethas been transformed, with emerging-market countries—most notablyChina—accounting for an increasing percentage of global GDP. Theopening up of emerging-market economies, combined with centrally con-trolled exchange rates to promote exports, has led to the accumulationof large amounts of savings in these countries. And the lack of exten-sive social safety nets means that these savings have not been depleted byelevated domestic consumption. Rather, the savers have sought to investin safe assets, resulting in huge inflows of investments in the United Statesin assets like Treasury bonds and AAA-rated mortgages. When coupledwith the easy-money monetary policy pursued in the United States overroughly the same time period, the result was a very large infusion ofliquidity into the United States and Western Europe, which contributedto exceptionally low mortgage interest rates.
This would normally lead to an increase in inflation as more money isavailable to purchase goods and services. However, the rise of emerging-market economies meant that companies like Wal-Mart, IBM, and Nikecould move procurement, manufacturing, and a variety of back-officesupport services to these countries with lower labor costs.Consequently, core inflation stayed low in the west and put little pressureon central banks to reverse their easy-money monetary policies.
It is argued that the flood of this “hot money” found its way into realestate, increasing demand for housing, and pushing house prices to un-precedented levels.
2.1.6 Misaligned incentives. There are many who have suggested mis-aligned incentives also played a role. The argument goes as follows.Financial institutions, especially those that viewed themselves as toobig to fail (TBTF), took excessive risks because de jure safety-net pro-tection via deposit insurance and de facto safety-net protection due toregulatory forbearance stemming from the reluctance to allow such in-stitutions to fail.22 Such risk taking was permitted due to lax oversightby regulators whose incentives were not aligned with those of taxpayers.23
Moreover, “misguided” politicians facilitated this with their overzeal-ous embrace of unregulated markets.24 This is also the essence of the
22 See Bebchuk and Fried (2010) and Litan and Bailey (2009), for example. This risk taking also involvedcorrelated asset choices and correlated high leverage choices by financial institutions. See Acharya,Mehran, and Thakor (2013) and Goel, Song, and Thakor (2014) for theories of correlated leverageand asset choices.
23 See, for example, Boot and Thakor (1993), Kane (1990), and Barth, Caprio, and Levine (2012).
24 See Johnson and Kwak (2010) and Stiglitz (2010).
The Financial Crisis of 2007–2009
167
report of the U.S. government’s Financial Crisis Inquiry Commission(FCIC).25
The risk taking was a part of the aggressive growth strategies of banks.These strategies were pursued to elevate net interest margins that weredepressed by the prevailing low-interest-rate monetary policy environ-ment, as discussed earlier. Banks grew by substantially increasing theirmortgage lending, which provided increased “throughput” for investmentbanks to securitize these mortgages and create and sell securities thatenhanced these banks’ profits, with credit rating agencies being viewedas complicit due to their willingness to assign high ratings to structuredfinance products.26 This increase in financing was another facilitatingfactor in pushing up home prices. The presence of government safetynets also created incentives for banks to pursue high leverage, as thecredit ratings and market yields of bank debt remained less sensitive toleverage increases than for nonfinancial firms.27 Combined with riskierasset portfolio strategies, this increased the fragility of banks. Moreover,reputational concerns may have also played a role. Thakor (2005) de-velops a theory in which banks that have extended loan commitmentsoverlend during economic booms and high stock price periods, sowingthe seeds of a subsequent crisis. The prediction of the theory that there isoverlending by banks during the boom that precedes the crisis seems tobe supported by the data. There is also evidence of managerial fraud andother misconduct that may have exacerbated the misalignment of incen-tives at the bank level. Piskorski, Seru, and Witkin (2014) provide evi-dence that buyers of mortgages received false information about the truequality of assets in contractual disclosures made by selling intermediariesin the nonagency market. They show that misrepresentation incentivesbecame stronger as the housing market boomed, peaking in 2006. What is
25 The report claims that industry players and government regulators saw warning signs of the impendingcrisis but chose to ignore them. It blames the Federal Reserve for being too supportive of industry growthobjectives, including a desire to encourage growth in the subprime lending market. Nonetheless, it ap-pears that there were some in the Federal Reserve System and other regulatory agencies who had con-cerns. Andrews (2007) writes “Edward M. Gramlich, a Federal Reserve governor who died in September,warned nearly seven years ago that a fast-growing new breed of lenders as luring many people into riskymortgages they could not afford. But when Mr. Gramlich privately urged Fed examiners to investigatemortgage lenders affiliated with national banks, he was rebuffed by Alan Greenspan, the Fed chairman.In 2001, a senior Treasury official, Sheila C. Bair, tried to persuade subprime lenders to adopt a code of‘best practices’ and to let outside monitors verify their compliance. None of the lenders would agree tothe monitors, and many rejected the code itself. Even those who did adopt those practices, Ms. Bairrecalled recently, soon let them slip.”
26 The incentives for rating agencies to issue “inflated” ratings have been attributed to the “issuer pays”model, which involves the issuer of the debt securities paying the rating agency to obtain a rating.Competition for business among rating agencies is then typically viewed as incenting rating agenciesto cater to the issuer’s wishes by assigning “inflated” ratings. See Becker and Milbourn (2011) for em-pirical evidence.
27 See Pfleiderer (2012). The incentive to increase leverage in the presence of safety nets is not a newphenomenon. After the Bank of England was established as a lender of last resort, many Britishbanks became highly levered, and this was a contributing factor to the 1857 crisis.
Review of Corporate Finance Studies / v 4 n 2 2015
168
somewhat surprising is that even reputable intermediaries were involvedin misrepresentation, suggesting that managerial career concerns werenot strong enough to deter this sort of behavior.28 Consequently, theelement of surprise on the part of investors when true asset qualitiesbegan to be revealed was likely greater than it would have been absentthe fraud and may have added to the precipitous decline in liquidityduring the crisis.
2.1.7 Success-driven skill inferences. One weakness in the misaligned-in-centives theory is that it fails to explain the timing of the crisis of 2007–2009. After all, these incentives have been in place for a long time, so whydid they become such a big problem in 2007 and not before? Thakor(forthcoming) points out that there are numerous perplexing facts aboutthis crisis that cannot be readily explained by the misaligned incentivesstory of the crisis, and thus, as important as misaligned incentives were,they cannot be the whole story of the crisis. For example, the financialsystem was flush with liquidity prior to the crisis, but then liquidity declinedsharply during the crisis. Why? Moreover, the recent crisis followed a longperiod of high profitability and growth for the financial sector, and duringthose good times, there was little warning of the onset and severity of thecrisis from any of the so-called “watchdogs” of the financial system-ratingagencies, regulators, and creditors of the financial system.29
If misaligned incentives were the major cause of the crisis, then onewould expect a somewhat different assessment of potential risks from theone expressed above. Thakor (2015a) develops a theory of risk manage-ment over the business cycle to explain how even rational inferences canweaken risk management and sow the seeds of a crisis.30 The idea is asfollows. Suppose that there is a high probability that economic out-comes—most notably the probabilities of loan defaults—are affectedby the skills of bankers in managing credit risk and a relatively smallprobability that these outcomes are purely exogenous, that is, drivensolely by luck or factors beyond the control of bankers. Moreover,there is uncertainty and intertemporal learning about the probabilitythat outcomes are purely exogenous. Banks initially make relatively
28 Cortes and Thakor (2015) develop a model that explains how managerial career concerns get diluted inthe securitization of large loan pools.
29 During 2004–2007, the period directly leading to the crisis, the IMF reported that individual financialinstitutions were sound. The Independent Evaluation Office (IEO) of the IMF (2011) recently criticizedthe IMF for failing to warn about risks and vulnerabilities in the financial system.
30 A related theory is developed by Thakor (forthcoming), where the “availability heuristic”—a behavioralbias that leads agents to use mental shortcuts that rely on readily available data to draw inferences—leadsto an overestimation of the skill of bankers. This permits very risky investments to be financed by thinly-capitalized banks, increasing the probability of a future crisis. This theory explains why the economy fallsto pieces after a crisis and predicts that the development of a loan resale market will improve loanliquidity but increase the probability of a financial crisis.
The Financial Crisis of 2007–2009
169
safe loans because riskier (potentially more profitable) loans are viewedas being too risky and hence not creditworthy. Suppose that these safeloans successfully pay off over time. As this happens, everybody ration-ally revises upward their beliefs about the abilities of banks to manage(credit) risk. Moreover, because aggregate defaults are low, the probabil-ity that outcomes are purely exogenous is also revised downward.Consequently, it becomes possible for banks to finance riskier loans.And if these successfully pay off, then even riskier loans are financed.This way, increased risk taking in banking continues unabated, and noone talks about an impending crisis.
Eventually, even though the probability of the event is low, it is possiblethat a large number of defaults will occur across banks in the economy. Atthis stage, investors revise their beliefs about the skills of bankers, as well asbeliefs about the probability that outcomes are purely exogenous. Becausebeliefs about bankers’ skills were quite high prior to the occurrence of largeaggregate defaults, investors infer with a relatively high probability thatoutcomes are indeed driven by luck. This causes beliefs about the riskinessof loans to move sharply in the direction of prior beliefs. And since onlyrelatively safe loans could be financed with these prior beliefs, the suddendrop in beliefs about the risk-management abilities of banks causes in-vestors to withdraw funding for the loans that are suddenly viewed asbeing “excessively risky.” This theory predicts that when there is a suffi-ciently long period of high profitability and low loan defaults, then bankrisk-taking increases and that a financial crisis occurs only when its ex anteprobability is being viewed as being sufficiently low.
2.1.8 The diversification fallacy. Prior to the crisis, many believed thatdiversification was a cure-all for all sorts of risks. In particular, by pool-ing (even subprime) mortgages from various geographies and then issuingsecurities against these pools that were sold into the market, it wasbelieved that the benefits of two kinds of diversification were achieved:geographic diversification of the mortgage pool and then the holding ofclaims against these pools by diversified investors in the capital market.However, many of these securities were being held by interconnected andsystemically important institutions that operated in the financial market,so what the process actually did was to concentrate risk on the balancesheets of institutions in a way that created greater systemic risk. Clearly,advances in information technology and financial innovation were facil-itating factors in these developments.
2.2 Housing prices respond to external factors and market incentives
As a consequence of the factors just discussed, house prices in the UnitedStates experienced significant appreciation prior to the crisis, especiallyduring the period 1998–2005. The Case-Shiller U.S. national house price
Review of Corporate Finance Studies / v 4 n 2 2015
170
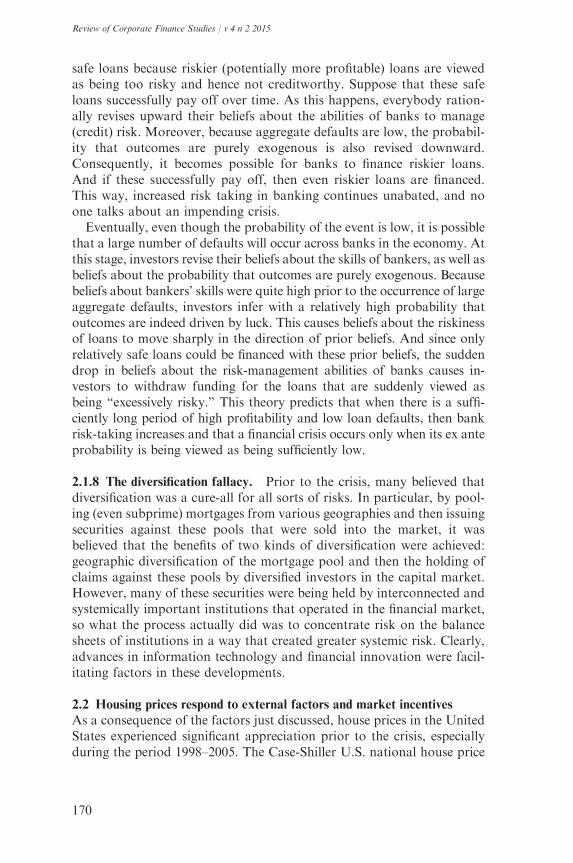
index more than doubled between 1987 and 2005, with a significant por-tion of the appreciation occurring after 1998. Further supporting empir-ical evidence that there was a housing price bubble is the observation thatthe ratio of house prices to renting costs appreciated significantly around1999.31 See Figure 2.
2.3 Leverage and consumption rise to exacerbate the problem
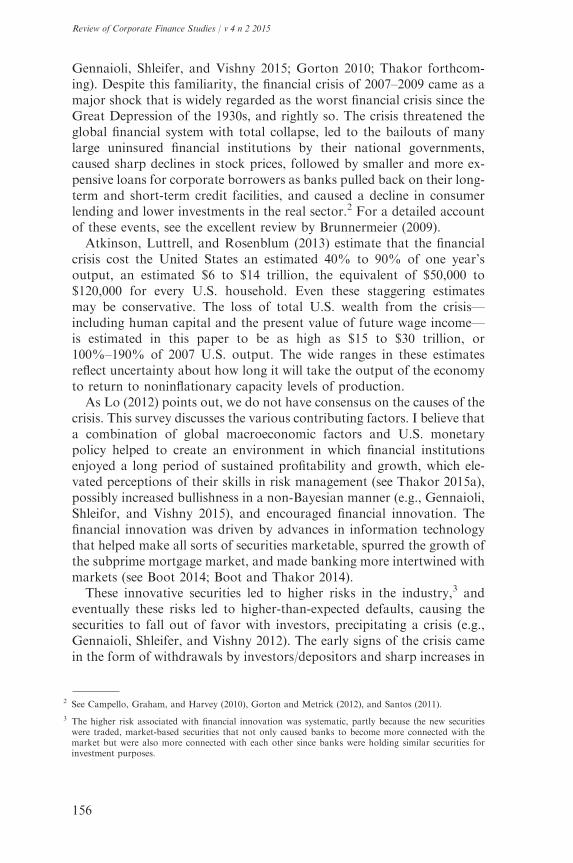
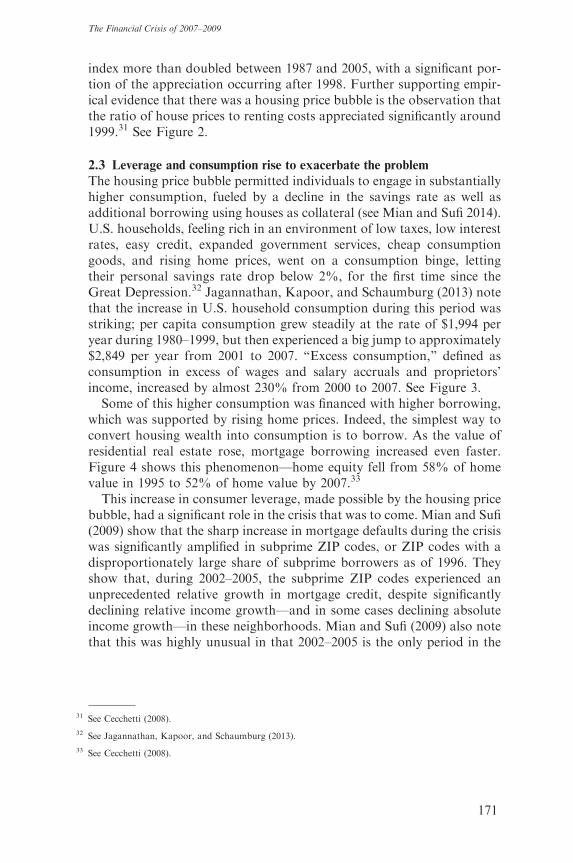
The housing price bubble permitted individuals to engage in substantiallyhigher consumption, fueled by a decline in the savings rate as well asadditional borrowing using houses as collateral (see Mian and Sufi 2014).U.S. households, feeling rich in an environment of low taxes, low interestrates, easy credit, expanded government services, cheap consumptiongoods, and rising home prices, went on a consumption binge, lettingtheir personal savings rate drop below 2%, for the first time since theGreat Depression.32 Jagannathan, Kapoor, and Schaumburg (2013) notethat the increase in U.S. household consumption during this period wasstriking; per capita consumption grew steadily at the rate of $1,994 peryear during 1980–1999, but then experienced a big jump to approximately$2,849 per year from 2001 to 2007. “Excess consumption,” defined asconsumption in excess of wages and salary accruals and proprietors’income, increased by almost 230% from 2000 to 2007. See Figure 3.
Some of this higher consumption was financed with higher borrowing,which was supported by rising home prices. Indeed, the simplest way toconvert housing wealth into consumption is to borrow. As the value ofresidential real estate rose, mortgage borrowing increased even faster.Figure 4 shows this phenomenon—home equity fell from 58% of homevalue in 1995 to 52% of home value by 2007.33
This increase in consumer leverage, made possible by the housing pricebubble, had a significant role in the crisis that was to come. Mian and Sufi(2009) show that the sharp increase in mortgage defaults during the crisiswas significantly amplified in subprime ZIP codes, or ZIP codes with adisproportionately large share of subprime borrowers as of 1996. Theyshow that, during 2002–2005, the subprime ZIP codes experienced anunprecedented relative growth in mortgage credit, despite significantlydeclining relative income growth—and in some cases declining absoluteincome growth—in these neighborhoods. Mian and Sufi (2009) also notethat this was highly unusual in that 2002–2005 is the only period in the
31 See Cecchetti (2008).
32 See Jagannathan, Kapoor, and Schaumburg (2013).
33 See Cecchetti (2008).
The Financial Crisis of 2007–2009
171
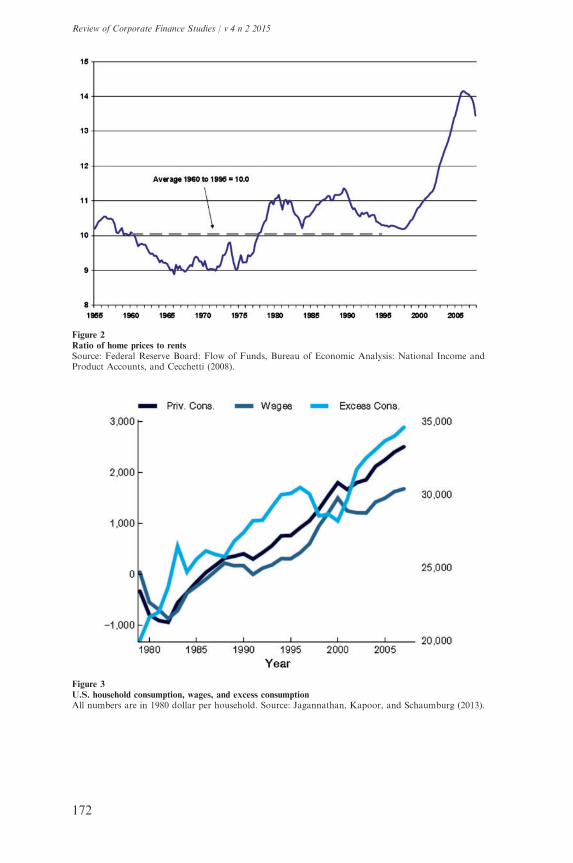
Figure 3
U.S. household consumption, wages, and excess consumption
All numbers are in 1980 dollar per household. Source: Jagannathan, Kapoor, and Schaumburg (2013).
Figure 2
Ratio of home prices to rents
Source: Federal Reserve Board: Flow of Funds, Bureau of Economic Analysis: National Income andProduct Accounts, and Cecchetti (2008).
Review of Corporate Finance Studies / v 4 n 2 2015
172
past eighteen years during which personal income and mortgage creditgrowth were negatively correlated.34
The notion that the housing price bubble and its subsequent collapsewere due to a decoupling of credit flow from income growth has recentlybeen challenged by Adelino, Schoar, and Severino (2015). Using data onindividual mortgage transactions rather than whole zip codes, they showthat the previous findings were driven by a change in borrower composi-tion, i.e., higher-income borrowers buying houses in areas where houseprices go up. They conclude that middle-income and high-income bor-rowers contributed most significantly to the house price bubble and thenthe subsequent defaults after 2007.
What made the situation worse is that this increase in consumer lever-age—and that too by those who were perhaps least equipped to handleit—was also accompanied by an increase in the leverage of financial in-stitutions, especially investment banks and others in the shadow bankingsystem, which turned out to be the epicenter of the crisis.35 This madethese institutions fragile and less capable of handling defaults on con-sumer mortgages and sharp declines in the prices of mortgage-backedsecurities (MBS) than they would have been had they been not asthinly capitalized.
The observation that high leverage in financial institutions contributedto the 2007–2009 crisis is sometimes challenged on the grounds that
Figure 4
Evolution of equity and borrowing in residential real estate
Source: Federal Reserve Flow of Funds and Cecchetti (2008).
34 The study attributes this disassociation from 2002–2005 to the increase in the securitization of subprimemortgages.
35 See Goel, Song, and Thakor (2014).
The Financial Crisis of 2007–2009
173
commercial banks were well above the capital ratios required by regula-tion prior to the start of the crisis. For example, based on a study of bankholding companies (BHCs) during 1992–2006, Berger et al. (2008) docu-ment that banks set their target capital levels substantially above well-capitalized regulatory minima and operated with more capital thanrequired by regulation. However, such arguments overlook two import-ant points. First, U.S. investment banks, which were at the epicenter ofthe subprime crisis, had much lower capital levels than BHCs. Second, itis now becoming increasingly clear that regulatory capital requirementshave both been too low to deal with systemic risk issues and also been tooeasy to game within the risk-weighting framework of Basel I and Basel II.Moreover, the flexibility afforded by Basel II to permit institutions to useinternal models to calculate required capital may explain the high lever-age of investment banks.
Another argument to support the idea that higher capital in bankingwould not have helped much is that the losses suffered during the crisis bymany institutions far exceeded any reasonable capital buffer they couldhave had above regulatory capital requirements. The weakness in thisargument is that it fails to recognize that the prescription to have morecapital in banking is not just based on the role of capital in absorbingactual losses before they threaten the deposit insurance fund but also onthe incentive effects of capital on the risk management choices of banks.Indeed, it is the second role that is typically emphasized more in theresearch on this subject, and it has to do with influencing the probabilitiesof hitting financial insolvency states, rather than how much capital canhelp once the bank is in one of those states.
Whether it is the incentive effect or the direct risk-absorption effect ofcapital or a combination, the key question for policy makers is “doeshigher capital increase the ability of banks to survive a financial crisis?”Berger and Bouwman (2013) document that commercial banks withhigher capital have a greater probability of surviving a financial crisisand that small banks with higher capital are more likely to survive duringnormal times as well. This is also consistent with Gauthier, Lehar, andSouissi (2012), who provide evidence that capital requirements based onbanks’ contributions to the overall risk of the banking system can reducethe probability of failure of an individual bank and that of a systemiccrisis by 25%. Even apart from survival, higher capital appears to facili-tate bank performance. Beltratti and Stulz (2012) show that large bankswith higher precrisis tier-one capital (i.e., at the end of 2006) had signifi-cantly higher stock returns during the crisis.36
36 This does not necessarily rule out “model risk,” that is, lenders relying on an incorrect model of borrowerrisk determination.
Review of Corporate Finance Studies / v 4 n 2 2015
174
There is also evidence of learning that speaks—albeit indirectly—tothis issue. Calomiris and Nissim (2014) find that how the stock marketviews leverage has also changed as a result of the crisis. They documentthat while the market rewarded higher leverage with high market valuesprior to the crisis, leverage has become associated with lower valuesduring and after the crisis.
2.4 Risky lending and diluted screening add fuel to the fire
In Ramakrishnan and Thakor’s (1984) theory of financial intermediation,a raison d’etre for banks is specialization in screening borrowers with apriori unknown default risk (see also Allen 1990; Bhattacharya andThakor 1993; Coval and Thakor 2005; Millon and Thakor 1985). Thispaves the way for banks to provide a host of relationship banking services(see Boot and Thakor 2000). Thus, if these screening incentives are af-fected by the business model banks use to make loans, it has importantimplications. Keys et al. (2010) provide empirical evidence indicating thatsecuritization may have weakened the incentives of banks to screen theborrowers whose loans had a high likelihood of being securitized. Thereis also additional evidence that during the dramatic growth of the sub-prime (securitized) mortgage market, the quality of the market declinedsignificantly. Demyanyk and Van Hemert (2011) document that the qual-ity of loans deteriorated for six consecutive years prior to the crisis.37 Thefact that lenders seemed aware of the growing default risk of these loansis suggested by the higher rates lenders charged borrowers as the decadeprior to the crisis progressed. For a similar decrease in the quality of theloan (e.g., a higher loan-to-value ratio), a loan made early in the decadewas associated with a smaller interest rate increase than a loan made latein the decade. Thus, even though lenders may have underestimated thecredit risks in their loans, Demyanyk and Van Hemert (2011) note thatthey do seem to have been aware that they were making discerniblyriskier loans.38
There is also evidence that these lenders took steps to shed some ofthese elevated risks from their balance sheets. Purnanandam (2011) showsthat from the end of 2006 until the beginning of 2008, originators of loanstended to sell their loans, collect the proceeds, and then use them to ori-ginate new loans and repeat the process. The paper also shows that bankswith high involvement in the OTD market during the precrisis period
37 The quality of loans is measured as the performance of loans, adjusted for differences in borrowercharacteristics, such as the credit score, level of indebtedness, loan amount, and ability to providedocumentation, differences in loan characteristics, such as product type, amortization term, loanamount, and mortgage interest rate, and macroeconomic conditions, such as house price appreciation,level of neighborhood income, and change in unemployment
38 This does not necessarily rule out “model risk,” that is, lenders relying on an incorrect model of borrowerrisk determination.
The Financial Crisis of 2007–2009
175
originated excessively poor-quality mortgages, and this result cannot beexplained by differences in observable borrower quality, geographical lo-cation of the property, or the cost of capital for high-OTD and low-OTDbanks. This evidence suggests that the OTD model induced originatingbanks to have weaker incentives to screen borrowers before extendingloans in those cases in which banks anticipated that the loans would besecuritized. However, this effect is stronger for banks with lower capital,suggesting that capital strengthens the screening incentives of banks.39
2.5 The bubble bursts to set the stage for the crisis
Most accounts of the financial crisis attribute the start of the crisis to thebursting of the housing price bubble and the fact that the failure ofLehman Brothers in September 2008 signaled a dramatic deepening ofthe crisis. But exactly what caused the housing price bubble to burst?Most papers tend to gloss over this issue.
Some papers cite evidence that run-ups in house prices are a common-place occurrence prior to the start of a crisis.40 But they do not explainwhat caused the bubble to burst. However, we can get some insights intowhat happened by scrutinizing the dynamics of loan defaults in relationto initial home price declines and how this fueled larger subsequent pricedeclines, causing the bubble to burst. Home prices reached their peak inthe second quarter of 2006. Holt (2009) points out that initial decline inhome prices from that peak was a rather modest 2% from the secondquarter of 2006 to the fourth quarter of 2006.
With prime mortgages held by creditworthy borrowers, such a smalldecline is unlikely to lead to a large number of defaults, and especially notdefaults that are highly correlated across geographic regions of theUnited States. The reason is that these borrowers have 20% of equityin the home when they buy the home, so a small price drop does not putthe mortgage “under water” and threaten to trigger default.
Not so with subprime mortgages. Even the small decline in home pricespushed these highly risky borrowers over the edge. Foreclosure ratesincreased by 43% over the last two quarters of 2006 and increased bya staggering 75% in 2007 compared with 2006, as documented byLiebowitz (2008). Homeowners with adjustable rate mortgages that hadlow teaser rates to attract them to buy homes were hit the hardest. Thedrop in home prices meant that they had negative equity in their homes(since many of them put no money down in the first place), and whentheir rates adjusted upward, they found themselves hard pressed to make
39 This may provide one explanation for Berger and Bouwman’s (2013) finding that higher-capital bankshave a higher probability of surviving a financial crisis.
40 See Reinhart and Rogoff (2008) for evidence on this.
Review of Corporate Finance Studies / v 4 n 2 2015
176
the higher monthly mortgage payments.41 As these borrowers defaulted,credit rating agencies began to downgrade mortgage-backed securities.This tightened credit markets, pushed up interest rates, and acceleratedthe downward price spiral, eventually jeopardizing the repayment abilityof even prime borrowers. From the second quarter of 2006 to the end of2007, foreclosure rates for fixed-rate mortgages increased by about 55%for prime borrowers and by about 80% for subprime borrowers. Thingswere worse for those with adjustable-rate mortgages—their foreclosurerates increased by much higher percentages for prime and subprime bor-rowers, as noted by Liebowitz (2008).
2.6 Liquidity shrinks as the crisis begins to set in
Before the crisis, the shadow banking sector of the U.S. economy hadexperienced dramatic growth. This was significant because the shadowbanking system is intricately linked with the “official” insured bankingsystem and supported by the government by backup guarantees. Forexample, insured banks write all sorts of put options sold to shadowbanks and also are financed in part by the shadow banking system. Ifan insured bank defaults on an insured liability in the shadow bankingsystem, it tempts the government to step in and “cover” shadow banks to“protect” the insured bank. One notable aspect of the shadow bankingsystem is its heavy reliance on short-term debt, mostly repurchase agree-ments (repos) and commercial paper. As Bernanke (2010) notes, repoliabilities of U.S. broker dealers increased dramatically in the fouryears before the crisis. The IMF (2010) estimates that total outstandingrepo in U.S. markets at between 20% and 30% of U.S. GDP in each yearfrom 2002 to 2007, with even higher estimates for the European Union—a range of 30% to 50% of EU GDP per year from 2002 to 2007.
A repo transaction is essentially a “collateralized” deposit.42 The col-lateral used in repo transactions consisted of Treasury bonds, mortgage-backed securities (MBS), commercial paper, and similar highly liquidsecurities. As news about defaults on mortgages began to spread, con-cerns about the credit qualities of MBS began to rise. The bankruptcyfilings of subprime mortgage underwriters and the massive downgrades ofMBS by the rating agencies in mid-2007 created significant downwardrevisions in perceptions of the credit qualities of many types of collateralbeing used in repo transactions (as well as possibly the credit-screeninginvestments and abilities of originators of the underlying mortgages) and
41 Adding to the woes of these borrowers were “negative amortization” loans in which part of the interestwas added to the principal (to lower initial payments), so that the principal increased, rather than falling,over time.
42 See Gorton and Metrick (2012).
The Financial Crisis of 2007–2009
177
caused repo haircuts to spike significantly. This substantially diminishedshort-term borrowing capacity in the shadow banking sector.
The ABCP market fell by $350 billion in the second half of 2007. Manyof these programs required backup support from their sponsors to coverthis shortfall. As the major holders of ABCPs, MMFs were adverselyaffected, and when the Reserve Primary Fund broke the buck, ABCPyields rose for outstanding paper. Many shrinking ABCP programs soldtheir underlying assets, putting further downward pressure on prices.43
All of these events led to numerous MMFs requiring assistance from theirsponsors to avoid breaking the buck.
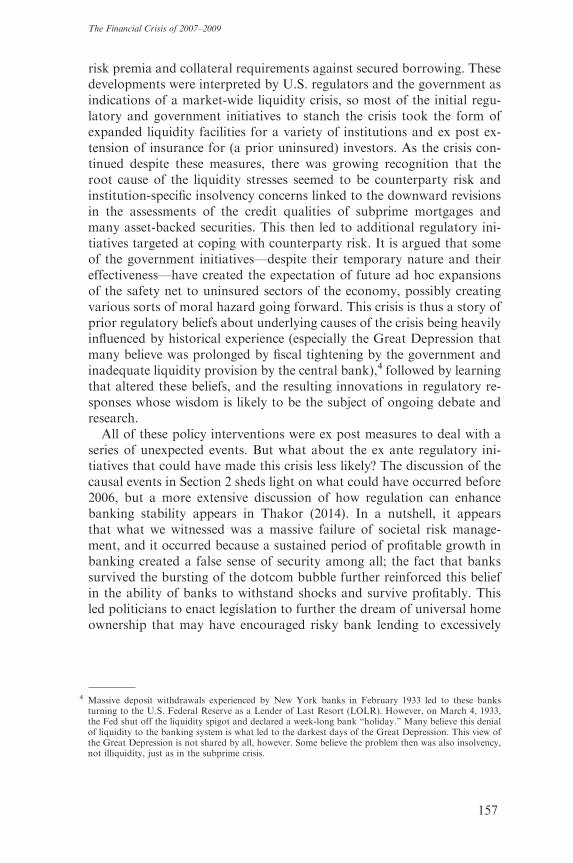
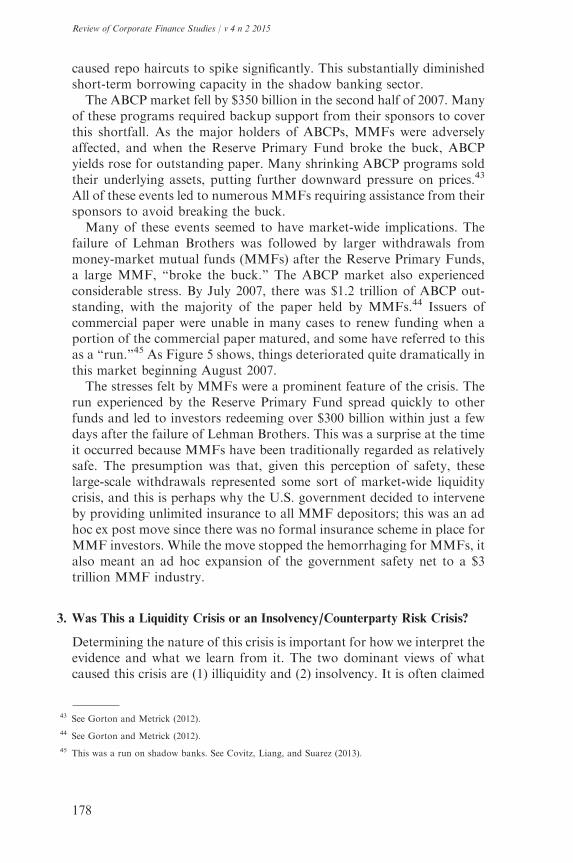
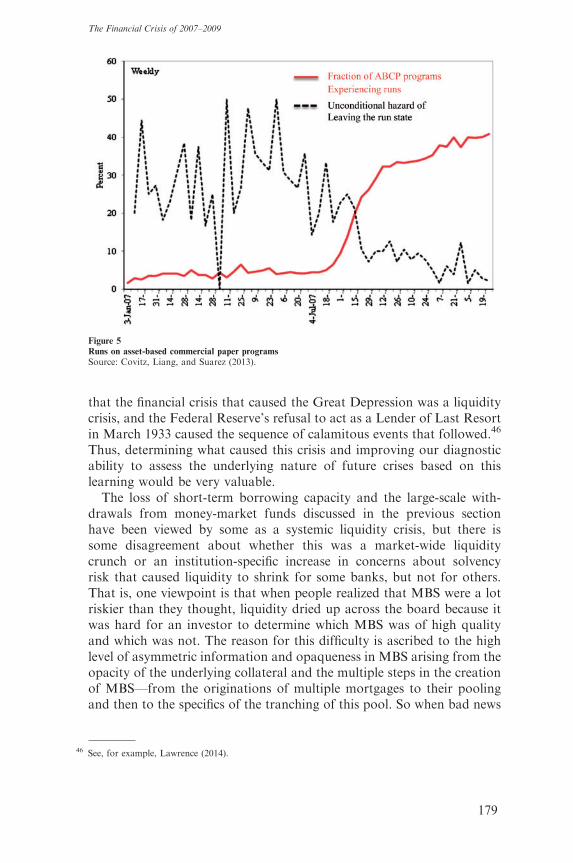
Many of these events seemed to have market-wide implications. Thefailure of Lehman Brothers was followed by larger withdrawals frommoney-market mutual funds (MMFs) after the Reserve Primary Funds,a large MMF, “broke the buck.” The ABCP market also experiencedconsiderable stress. By July 2007, there was $1.2 trillion of ABCP out-standing, with the majority of the paper held by MMFs.44 Issuers ofcommercial paper were unable in many cases to renew funding when aportion of the commercial paper matured, and some have referred to thisas a “run.”45 As Figure 5 shows, things deteriorated quite dramatically inthis market beginning August 2007.
The stresses felt by MMFs were a prominent feature of the crisis. Therun experienced by the Reserve Primary Fund spread quickly to otherfunds and led to investors redeeming over $300 billion within just a fewdays after the failure of Lehman Brothers. This was a surprise at the timeit occurred because MMFs have been traditionally regarded as relativelysafe. The presumption was that, given this perception of safety, theselarge-scale withdrawals represented some sort of market-wide liquiditycrisis, and this is perhaps why the U.S. government decided to interveneby providing unlimited insurance to all MMF depositors; this was an adhoc ex post move since there was no formal insurance scheme in place forMMF investors. While the move stopped the hemorrhaging for MMFs, italso meant an ad hoc expansion of the government safety net to a $3trillion MMF industry.
3. Was This a Liquidity Crisis or an Insolvency/Counterparty Risk Crisis?
Determining the nature of this crisis is important for how we interpret theevidence and what we learn from it. The two dominant views of whatcaused this crisis are (1) illiquidity and (2) insolvency. It is often claimed
43 See Gorton and Metrick (2012).
44 See Gorton and Metrick (2012).
45 This was a run on shadow banks. See Covitz, Liang, and Suarez (2013).
Review of Corporate Finance Studies / v 4 n 2 2015
178
that the financial crisis that caused the Great Depression was a liquiditycrisis, and the Federal Reserve’s refusal to act as a Lender of Last Resortin March 1933 caused the sequence of calamitous events that followed.46
Thus, determining what caused this crisis and improving our diagnosticability to assess the underlying nature of future crises based on thislearning would be very valuable.
The loss of short-term borrowing capacity and the large-scale with-drawals from money-market funds discussed in the previous sectionhave been viewed by some as a systemic liquidity crisis, but there issome disagreement about whether this was a market-wide liquiditycrunch or an institution-specific increase in concerns about solvencyrisk that caused liquidity to shrink for some banks, but not for others.That is, one viewpoint is that when people realized that MBS were a lotriskier than they thought, liquidity dried up across the board because itwas hard for an investor to determine which MBS was of high qualityand which was not. The reason for this difficulty is ascribed to the highlevel of asymmetric information and opaqueness in MBS arising from theopacity of the underlying collateral and the multiple steps in the creationof MBS—from the originations of multiple mortgages to their poolingand then to the specifics of the tranching of this pool. So when bad news
Figure 5
Runs on asset-based commercial paper programs
Source: Covitz, Liang, and Suarez (2013).
46 See, for example, Lawrence (2014).
The Financial Crisis of 2007–2009
179
arrived about mortgage defaults, there was a (nondiscriminating) market-wide effect. See Gorton (2010) for this interpretation of the data.
A theoretical argument supporting the idea that this was a liquiditycrisis is provided by Diamond and Rajan (2011). In their model, banksface the prospect of a random exogenous liquidity shock at a future datebefore loans mature, at which time they may have to sell their assets in amarket with a limited number of “experts” who can value the assetscorrectly. The assets may thus have to be sold at fire-sale prices, andthe bank may face insolvency as a result. This may cause depositors torun the bank, causing more assets to be dumped and a further pricedecline. They argue that those with access to cash can therefore purchaseassets at very low prices and enjoy high returns, causing holders of cashto demand high returns today and inducing banks to hold on to illiquidassets; this exacerbates the future price decline and illiquidity. Moreover,illiquidity means lower lending initially.
While the liquidity view focuses on the liability side of the bank’s bal-ance sheet—the inability of banks to roll over short-term funding whenhit with a liquidity shock—the insolvency view focuses on shocks to theasset side. It says that when the quality of a bank’s assets was perceived tobe low, lenders began to reduce the credit they were willing to extend tothe bank. According to this view, the crisis was a collection of bank-specific events, and not a market-wide liquidity crunch. Banks with thebiggest declines in asset quality perceptions were the ones experiencingthe biggest funding shortages.
While one can argue that the underlying causes discussed in the previ-ous section can be consistent with either viewpoint of the crisis and theend result is the same regardless of which viewpoint is correct—banksface dramatically reduced access to liquidity—the triggering events, thetestable predictions, and the appropriate policy interventions are all dif-ferent. In this section I will discuss the differences with respect to thetriggering events and testable predictions. I will discuss what the existingempirical evidence has to say and also suggest new empirical tests thatcan focus more sharply on distinguishing between these viewpoints. Notethat empirically distinguishing between these two viewpoints is quitechallenging because of the endogeneity created by the relationship be-tween solvency and liquidity risks. A market-wide liquidity crunch canlead to fire sales (e.g., Shleifer and Vishny 2011) that can depress assetprices, diminish financing capacity, and lead to insolvency. And liquiditycrunches are rarely sunspot phenomena—they are typically triggered bysolvency concerns.47
47 So if there are no solvency concerns and banks are sufficiently highly capitalized, liquidity problems arelikely to be nonexistent over even intermediate time horizons, primarily because market participants with
Review of Corporate Finance Studies / v 4 n 2 2015
180
3.1 The triggering events
If a liquidity shortage caused this crisis, then what could be identified astriggering events? The Diamond and Rajan (2011) model suggests that asharp increase in the demand for liquidity by either the bank’s depositorsor borrowers could provide the liquidity shock that could trigger a crisis.In the data one should observe this in the form of a substantial increase indeposit withdrawals at banks as well as a significant increase in loancommitment takedowns by borrowers prior to the crisis.
If this was an insolvency crisis, then the trigger for the crisis should beunexpectedly large defaults on loans or asset-backed securities that causethe risk perceptions of investors to change substantially. This is impliedby the theories developed in the papers of Gennaioli, Shleifer, and Vishny(2012) and Thakor (2012, 2015a, forthcoming). I will use these differenttriggering events when I discuss how empirical tests might be designed infuture research.
3.2 The testable predictions
Given below are some testable predictions that differ across the twoviewpoints.
Prediction 1. If this was a liquidity crisis, then all institutions that reliedon short-term debt should have experienced funding declines andengaged in fire sales during the crisis.48 If this was an insolvency crisis,then only those banks whose poor operating performance (e.g., higher-than-expected default-related losses) should have experienced declines infunding and lending.
The idea behind a liquidity crisis is that a liquidity shock suffered bybanks and the consequent fire sale (or asset-trading freeze) and lendingdecline should affect all banks because these developments influence themarket prices of the assets banks hold. By contrast, a crisis caused byinsolvency concerns is more discriminating.
Prediction 2. If this was a liquidity crisis, then it would have beenpreceded by large deposit withdrawals and/or large loan commitment
relatively deep pockets will take advantage of opportunities created by short-term liquidity short-ages. Such self-correcting market mechanisms will largely obviate the need for any governmentintervention.
48 An essential difference between a liquidity and a solvency crisis is that the former is a market-widephenomenon that engulfs all banks, whereas the latter is a bank-specific phenomenon that affects onlybanks whose solvency is in question due to perceptions of deteriorating asset quality. For example, indiscussing the liquidity crisis in their model, Diamond and Rajan (2011) note “Moreover, the institu-tional overhang will affect lending not only by distressed banks, but also by healthy potential lenders, afeature that distinguishes this explanation from those where the reluctance to lend is based on the poorhealth of either the bank or its borrowers.”
The Financial Crisis of 2007–2009
181
takedowns (both representing liquidity shocks) at banks.49 If this was aninsolvency crisis, it would have been preceded by deteriorating loan/assetquality at banks.
Prediction 3. If this was a liquidity crisis, it would have affected banks withall capital structures (within the range of high-leverage capital structuresobserved in practice).50 If this was an insolvency crisis, its adverse effectwould be significantly greater for banks with lower capital ratios.
Capital does not play a prominent role as a trigger in theories of li-quidity crises, but it plays a central role in models in which the bank’ssolvency risk is endogenously determined. For example, in Holmstromand Tirole (1997) and Mehran and Thakor (2011), the amount of capitalthe bank has affects its monitoring incentive and hence the borrower’sdefault risk (see the extensive discussion of this in Thakor 2014). Theimplication is that the bank’s solvency risk is decreasing in its capitalratio.
Prediction 4. If this was a liquidity crisis (with a substantial increase in theexpected return on holding cash), then borrowing costs would haveincreased regardless of the collateral offered. If this was an insolvencycrisis, then borrowing costs would depend on the collateral offered, andthe spread between the costs of unsecured and secured borrowing wouldincrease significantly prior to and during the crisis.
If the crisis was indeed triggered by a liquidity shock that raised theexpected return on holding cash, investors would demand a high returnto lend money, regardless of how much collateral was offered. Dependingon the circumstances, the “haircut” may vary, so more or less collateralmay be offered, but the fact will remain that the price of obtaining li-quidity will be high. By contrast, if it was an insolvency crisis, thenoffering collateral will diminish insolvency concerns, so one should ob-serve a significant increase in the difference between the rates on un-secured and secured borrowing.51
3.3 The existing empirical evidence and possible new tests
On prediction 1, the evidence seems to point to this being an insolvencycrisis. Boyson, Helwege, and Jindra (2014) examine funding sources and
49 This is consistent with the interpretation of the liquidity shock in Diamond and Rajan (2011).
50 The implications of a liquidity crisis for banks with different capital structures are hard to derive sincemodels in which a liquidity crisis arises typically involve no capital structure choice for the bank—thebank is funded entirely with deposits or short-term debt, for example, Diamond and Dybvig (1983) andDiamond and Rajan (2011).
51 This difference is always positive for any risky lending, regardless of whether it is a liquidity or aninsolvency crisis, but the point is that a liquidity crisis should not cause the difference to spike upsignificantly, whereas an insolvency crisis should.
Review of Corporate Finance Studies / v 4 n 2 2015
182
asset sales at commercial banks, investment banks, and hedge funds. Thepaper hypothesizes that if liquidity dries up in the financial market, in-stitutions that rely on short-term debt will be forced to sell assets at fire-sale prices. The empirical findings are, however, that the majority ofcommercial and investment banks did not experience funding declinesduring the crisis and did not engage in the fire sales predicted to accom-pany liquidity shortages. The paper does find evidence of pockets ofweakness that are linked to insolvency concerns. Problems at financialinstitutions that experienced liquidity shortages during the crisis origi-nated on the asset side of their balance sheets in the form of shocks toasset value. Commercial banks’ equity and asset values are documentedto have been strongly affected by the levels of net charge-offs, whereasinvestment banks’ asset changes seemed to reflect changes in marketvaluation.52
Another piece of evidence comes from MMFs. The notion that MMFswere almost as safe as money was debunked by Kacperczyk and Schnabl(2013), who examined the risk-taking behavior of MMFs during 2007–2010. They document four noteworthy results. First, MMFs faced anincrease in their opportunity to take risk starting in August 2007. Byregulation, MMFs are required to invest in highly rated, short-termdebt securities. Before August 2007, the debt securities MMFs couldinvest in were relatively low in risk, yielding no more than 25 basispoints above U.S. Treasuries. However, the repricing of risk followingthe run on ABCP conduits in August 2007 caused this yield spread toincrease to 125 basis points. The MMFs now had a significant risk choice:either invest in a safe instrument like U.S. Treasuries or in a much riskierinstrument like a bank obligation.
Second, the paper documents that fund flows respond positively tohigher realized yields, and this relationship is stronger after August2007. This created strong incentives for MMFs to take higher risk toincrease their yields.
Third, the MMFs did take risks, the paper finds. The funds sponsoredby financial intermediaries that had more money-fund business tookmore risk.
Of course, this by itself does not settle the issue of whether these eventswere due to a liquidity shock that prompted investors to withdraw moneyfrom MMFs, turn inducing higher risk taking by fund managers, orwhether the withdrawals were due to elevated risk perceptions.However, Kacperczyk and Schnabl (2010) point out that the increase
52 Fahlenbrach, Prilmeier, and Stulz (2012) support the idea that problems faced by institutions in this crisiswere specific to these institutions and not to market-wide phenomena. The paper shows that a bank’sstock return performance during the 1998 crisis predicts its stock return performance and failure likeli-hood during the 2007–2009 crisis, highlighting the importance of bank-specific attributes like businessmodels and credit culture.
The Financial Crisis of 2007–2009
183
in yield spreads in August 2007 had to do with the fact that outstandingABCP fell sharply in August 2007 following news of the failure of BearStearns’ hedge funds that had invested in subprime mortgages and BNPParibas’ suspension of withdrawals from its investment funds due to theinability to assess the values of mortgages held by the funds. Moreover,the massive withdrawals from MMFs from September 16–19, 2008, weretriggered by the Reserve Primary Fund announcing that it had sufferedsignificant losses on its holdings of Lehman Brothers Commercial paper.Thus, it appears that the runs suffered by MMFs were mainly due to assetrisk and solvency concerns, rather than a liquidity crisis per se, eventhough what may have been most salient during the early stages of thecrisis had the appearance of a liquidity crunch.
As for the second prediction, I am not aware of any evidence that largedeposit withdrawals or commitment takedowns preceded this crisis, par-ticularly before asset quality concerns became paramount. There is evi-dence, however, that loan quality was deteriorating prior to the crisis.The Demyanyk and Van Hemert (2011) evidence, as well as the evidenceprovided by Purnanandam (2011), points to this. It also indicates thatlenders seemed to be aware of this, which may explain the elevated coun-terparty risk concerns when the crisis broke.
Now consider the third prediction. There seems to be substantial evi-dence that banks with higher capital ratios were less adversely affected bythe crisis. Banks with higher precrisis capital (1) were more likely tosurvive the crisis and gained market share during the crisis (Berger andBouwman 2013), (2) took less risk prior to the crisis (Beltratti and Stulz2012), and (3) exhibited smaller contractions in lending during the crisis(Carlson, Shan, and Warusawithana 2013).
Turning to the fourth prediction, the empirical evidence provided byTaylor and Williams (2009) is illuminating. Taylor and Williams (2009)examine the LIBOR-OIS Spread. This spread is equal to the three-monthLIBOR minus the three-month Overnight Index Swap (OIS). The OIS isa measure of what the market expects the federal funds rate to be over thethree-month period comparable to the three-month LIBOR. SubtractingOIS from LIBOR controls for interest rate expectations, thereby isolatingrisk and liquidity effects. Figure 6 shows the behavior of this spread justbefore and during the crisis.
The figure indicates that the spread spiked in early August 2007 andstayed high. This was a problem because the spread not only is a measureof financial stress but it affects how monetary policy is transmitted due tothe fact that rates on loans and securities are indexed to LIBOR. Anincrease in the spread, holding fixed the OIS, increases the cost ofloans for borrowers and contracts the economy. Policy makers thushave an interest in bringing down the spread. But just like a doctorwho cannot effectively treat a patient if he misdiagnoses the disease, so
Review of Corporate Finance Studies / v 4 n 2 2015
184
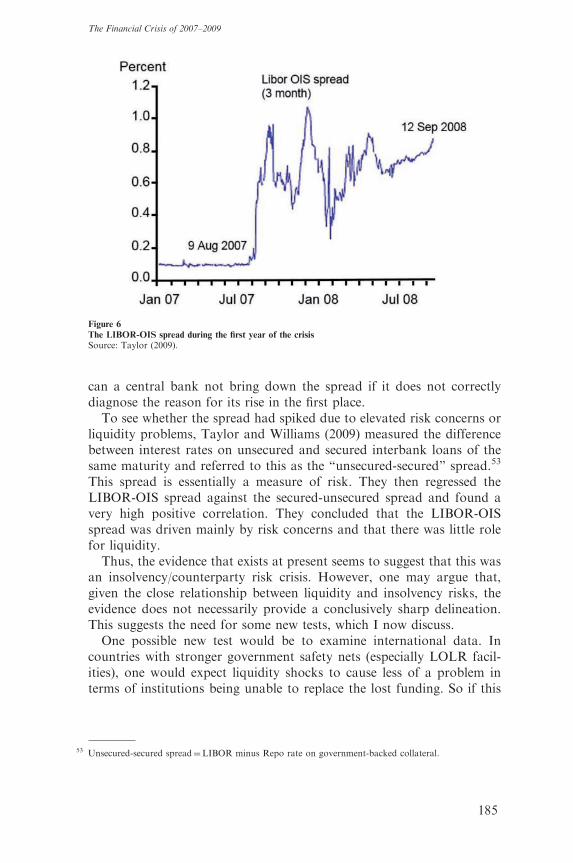
can a central bank not bring down the spread if it does not correctlydiagnose the reason for its rise in the first place.
To see whether the spread had spiked due to elevated risk concerns orliquidity problems, Taylor and Williams (2009) measured the differencebetween interest rates on unsecured and secured interbank loans of thesame maturity and referred to this as the “unsecured-secured” spread.53
This spread is essentially a measure of risk. They then regressed theLIBOR-OIS spread against the secured-unsecured spread and found avery high positive correlation. They concluded that the LIBOR-OISspread was driven mainly by risk concerns and that there was little rolefor liquidity.
Thus, the evidence that exists at present seems to suggest that this wasan insolvency/counterparty risk crisis. However, one may argue that,given the close relationship between liquidity and insolvency risks, theevidence does not necessarily provide a conclusively sharp delineation.This suggests the need for some new tests, which I now discuss.
One possible new test would be to examine international data. Incountries with stronger government safety nets (especially LOLR facil-ities), one would expect liquidity shocks to cause less of a problem interms of institutions being unable to replace the lost funding. So if this
Figure 6
The LIBOR-OIS spread during the first year of the crisis
Source: Taylor (2009).
53 Unsecured-secured spread¼LIBOR minus Repo rate on government-backed collateral.
The Financial Crisis of 2007–2009
185
was a liquidity crisis, then it should have been worse in countries withweaker safety nets. On the other hand, stronger safety nets induce greaterrisk taking, so if this was an insolvency crisis, it should have been worsein countries with stronger safety nets.
Another test would be to look for exogenous variation to get a betterhandle on causality by examining whether it was the drying up of liquid-ity that induced price declines for mortgage-backed securities or whetherit was the price declines (due to elevated risk concerns) that induced theliquidity evaporation.
A third test would be to conduct a difference-in-differences analysis toexamine the changes in funding costs during the crisis for banks withdifferent amounts of collateral. If this was a liquidity crisis, the amount ofcollateral should not matter much—borrowing costs should rise for allborrowers due to the higher expected returns demanded by those withliquidity available for lending. If this was an insolvency crisis, the increasein borrowing costs should be significantly negatively related to collateralsince collateral has both incentive and sorting effects in addition to beinga direct source of safety for the lender. This test is in the spirit of theTaylor and Williams (2009) test discussed earlier, but that test speaks tospreads at the aggregate level, whereas I am suggesting a more borrower-specific test.
While these new tests can potentially provide valuable insights, theyalso will be helpful in better understanding the extent to which regulatoryactions and monetary policy contributed to what appears to have been aninsolvency crisis. The political desire for universal home ownership led tothe adoption of regulations that permitted (and possibly encouraged)riskier mortgage lending, and the easy-money monetary policies in theUnited States and Europe facilitated access to abundant liquidity to fi-nance these mortgages (see Section 2). Thus, the availability of excessliquidity—rather than its paucity—may have sown the seeds for laxunderwriting standards and excessively risky lending that subsequentlyengendered insolvency concerns. This suggests that in a sense this may becalled a “liquidity crisis” after all, but one caused by too much liquidity,rather than too little. Future research could flesh out this idea theoretic-ally, and empirical tests could focus on whether excess precrisis liquidityis causally linked to crises; see Berger and Bouwman (2014) for evidencethat excess liquidity creation predicts future crises.
4. The Real Effects of the Crisis
This financial crisis had significant real effects. These included lower house-hold credit demand and lower credit supply (resulting in reduced consumerspending), as well as reduced corporate investment and higher unemploy-ment. I now discuss each of the real effects in this section.
Review of Corporate Finance Studies / v 4 n 2 2015
186
4.1 Credit demand effects
The argument for why the crisis adversely affected household demand forcredit has been presented by Mian, Rao, and Sufi (2013), and it goes asfollows: First, due to a variety of reasons discussed earlier (including easycredit with relaxed underwriting standards, booming house prices, andlow interest rates), household debt went up significantly. Then the burst-ing of the house price bubble shocked household balance sheets, deplet-ing household net worth. In response, the highly levered householdsreduced consumption. However, the relatively unlevered householdsdid not increase consumption to offset this decline because of variousfrictions in the economy related to nominal price rigidities and a lowerbound of zero on nominal interest rates.
Mian, Rao, and Sufi (2013) show that this interaction between precrisishousehold leverage and decline in consumption made a major contribu-tion to the events witnessed during the crisis. In particular, their evidenceindicates that the large accumulation of household debt54 prior to therecession, in combination with the decline in house prices, explains theonset, severity, and length of the subsequent consumption collapse. Thedecline in consumption was much stronger in high-leverage counties withlarger house price declines and in areas with greater reliance on housingas a source of wealth. Thus, as house prices plunged, so did consumptionand the demand for credit.
4.2 Credit supply effects
There is persuasive empirical evidence that the crisis caused a significantdecline in the supply of credit by banks. One piece of evidence is thatsyndicated loans declined during the crisis, which is important since syn-dicated lending is a major source for credit for the corporate sector (seeIvashina and Scharfstein 2010). The syndicated loan market includes notonly banks but also investment banks, institutional investors, hedgefunds, mutual funds, insurance companies, and pension funds. The evi-dence is that syndicated lending began to fall in mid-2007, and, starting inSeptember 2008, this decline accelerated. Syndicated lending volume inthe last quarter of 2008 was 47% lower than in the prior quarter and 79%lower than in the second quarter of 2007, which was the height of thecredit boom. Lending declined across all types of corporate loans.
Accompanying the fall in lending volume was an increase in the priceof credit. Santos (2011) documents that firms paid higher loan spreadsduring the crisis, and the increase was higher for firms that borrowedfrom banks that incurred larger losses. This result holds even when
54 Facilitated, according to Taylor (2009), by the Federal Reserve’s easy-money monetary policies.
The Financial Crisis of 2007–2009
187
firm-specific, bank-specific, and loan-specific factors are controlled for,and the endogeneity of bank losses is taken into account.
As usual, separating supply and demand effects is difficult. Puri,Rocholl, and Steffen (2011) examine whether there are discernible reduc-tions in credit supply, even when overall demand for credit is declining.They examine German savings banks, which operate in specific geogra-phies and are required by law to serve only local customers. In eachgeography there is a Landesbank, owned by the savings bank in thatarea. These Landesbanken (the regional banks) had varying degrees ofexposure to U.S. subprime mortgages. Losses on these exposures there-fore varied across these Landesbanken, requiring different amounts ofequity injections from their respective savings banks. In other words,different savings banks were impacted differently, depending on thelosses suffered by their Landesbanken. What the paper uncovers is thatthe savings banks that were hit harder cut back on credit more. Theaverage rate at which loan applicants were rejected was significantlyhigher than the rate at which rejections occurred at unaffected banks.
Campello, Graham, and Harvey (2010) survey 1,050 chief financialofficers (CFOs) in thirty-nine countries in North America, Europe, andAsia and provide evidence of reduced credit supply during the crisis.About 20% of the surveyed firms in the United States (about 14% inEurope and 8.5% in Asia) indicated that they were very affected in thesense that they faced reduced availability of credit. Consequently, theycut back on capital expenditures, dividends, and employment.
4.3 Reduction in corporate investment and increase in unemployment
With both household consumption going down and credit availabilitybecoming more scarce and expensive, it is not surprising that corporateinvestment fell and unemployment spiked. The United States entered adeep recession, with almost nine million jobs lost during 2008 and 2009,which represented about 6% of the workforce. It also discouraged manyfrom trying to re-enter the workforce after the crisis abated, leading thelabor participation rate to plunge. This meant that subsequent measure-ments of the unemployment rate tended to understate the true unemploy-ment rate. Even measured unemployment rose every month from 6.2% inSeptember 2008 to 7.6% in January 2009. U.S. housing prices declinedabout 30% on average, and the U.S. stock market fell approximately50% by mid-2009. The U.S. automobile industry was also hit hard.Car sales fell 31.9% in October 2008 compared with September 2008.55
A causal link between the reduction in credit supply during the crisisand an increase in unemployment is provided by Haltenhof, Lee, and
55 See Marshall (2009).
Review of Corporate Finance Studies / v 4 n 2 2015
188
Stebunovs (2014). They provide evidence that household access to bankloans seemed to matter more than firm access to bank loans in determin-ing the drop in employment in the manufacturing sector, but reducedaccess to commercial and industrial loans and to consumer installmentloans played a significant role.
5. The Policy Responses to the Crisis
Beginning in August 2007, the governments of all developed countriesundertook a variety of policy interventions to mitigate the financial crisis.The IMF (2009) identifies as many as 153 separate policy actions takenby thirteen countries, including forty-nine in the United States alone.That represents too large a set of policy interventions to discuss here.So I will briefly describe the major categories of interventions here56 andthen provide a brief assessment.
5.1 The policy responses
The policy responses fell in four major groups: provision of short-termliquidity to financial institutions, provision of liquidity directly to bor-rowers and investors, expansion of open market operations, and initia-tives designed to address counterparty risk. See Figure 7.
5.1.1 Expansion of traditional role of central bank as lender of last resort in
providing short-term liquidity. This set of interventions included the dis-count window, Term Auction Faculty (TAF), Primary Dealer CreditFacility (PDCF), and Term Securities Lending Facility (TSLF). TheFederal Reserve also approved bilateral currency swap agreements withfourteen foreign central banks to assist these central banks in the provi-sion of dollar liquidity to banks in their jurisdictions.
The discount window has long been a primary liquidity-provision toolused by the Fed. In December 2007, the TAF was introduced to supple-ment the discount window. The TAF provided credit to depository insti-tutions through an auction mechanism. Like discount window loans,TAF loans had to be fully collateralized. The final TAF auction washeld on March 8, 2010.
The PDCF was established in March 2008 in response to strains in thetriparty repo market and the resulting liquidity pressures faced by pri-mary securities dealers. Primary dealers are broker-dealers that serve asthe trading counterparties for the Federal Reserve’s open-market oper-ations and thus play a pivotal role in providing liquidity in the market forU.S. treasuries. The PDCF served as an overnight loan facility for
56 This discussion is based on the Board of Governors of the Federal Reserve; available at www.federalre-serve.gov/monetarypolicy/bst_crisisresponse.html.
The Financial Crisis of 2007–2009
189
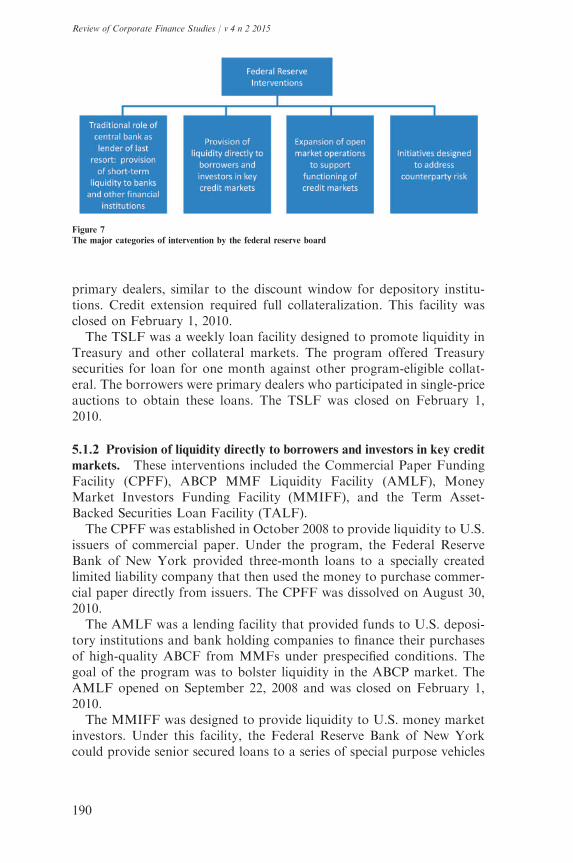
primary dealers, similar to the discount window for depository institu-tions. Credit extension required full collateralization. This facility wasclosed on February 1, 2010.
The TSLF was a weekly loan facility designed to promote liquidity inTreasury and other collateral markets. The program offered Treasurysecurities for loan for one month against other program-eligible collat-eral. The borrowers were primary dealers who participated in single-priceauctions to obtain these loans. The TSLF was closed on February 1,2010.
5.1.2 Provision of liquidity directly to borrowers and investors in key credit
markets. These interventions included the Commercial Paper FundingFacility (CPFF), ABCP MMF Liquidity Facility (AMLF), MoneyMarket Investors Funding Facility (MMIFF), and the Term Asset-Backed Securities Loan Facility (TALF).
The CPFF was established in October 2008 to provide liquidity to U.S.issuers of commercial paper. Under the program, the Federal ReserveBank of New York provided three-month loans to a specially createdlimited liability company that then used the money to purchase commer-cial paper directly from issuers. The CPFF was dissolved on August 30,2010.
The AMLF was a lending facility that provided funds to U.S. deposi-tory institutions and bank holding companies to finance their purchasesof high-quality ABCF from MMFs under prespecified conditions. Thegoal of the program was to bolster liquidity in the ABCP market. TheAMLF opened on September 22, 2008 and was closed on February 1,2010.
The MMIFF was designed to provide liquidity to U.S. money marketinvestors. Under this facility, the Federal Reserve Bank of New Yorkcould provide senior secured loans to a series of special purpose vehicles
Figure 7
The major categories of intervention by the federal reserve board
Review of Corporate Finance Studies / v 4 n 2 2015
190
to finance the purchase of eligible assets. This essentially “insured”money market investors who might have otherwise suffered losses dueto the decline in the values of their holdings. The MMIFF wasannounced on October 21, 2008 and dissolved on October 30, 2009.
TALF was created to help market participants meet the credit needs ofhouseholds and small businesses by supporting the issuance of asset-backed securities collateralized by consumer and small-business loans.The goal was to revive the consumer-credit securitization market. Thefacility was launched in March 2009 and dissolved by June 2010.
5.1.3 Expansion of OpenMarket operations. The goal of these initiativeswas to support the functioning of credit markets and put downwardpressure on long-term interest rates. These initiatives involved the pur-chase of longer-term securities for the Federal Reserve’s portfolio. Forexample, starting in September 2012, the Federal Open MarketCommittee (FOMC) decided to purchase agency-guaranteed MBS atthe rate of $40 billion per month. In addition, starting January 2013,the Fed began purchasing longer-term Treasury securities at the rate of$45 billion per month as part of its “Quantitative Easing” programs.
5.1.4 Initiatives designed to address counterparty risk. These initiativesincluded various programs. One was the Troubled Asset RepurchaseProgram (TARP), which was initially authorized in October 2008 andended on October 3, 2010. The original idea was for the government tobuy troubled, illiquid assets from financial institutions in order to dimin-ish concerns about their solvency and to stabilize markets.57 In practice,it took the form of the government buying equity (the Capital PurchaseProgram) and taking ownership in various financial and nonfinancialfirms and providing help to consumers to avoid home foreclosures.
The willingness of the U.S. government to take equity positions inbanks was also accompanied by regulatory demands that banks recap-italize themselves through other means as well. The implied threat thatthe alternative to recapitalization via shareholder-provided equity wasthe infusion of equity (and thus the assumption of some ownership) bythe government was an effective one. No bank wanted to be nationa-lized. The result was that U.S. banks were recapitalized fairly quickly.In retrospect, this may have been one of the most effective policy re-sponses to the crisis, as the contrast with the struggling banking systemsin the Euro zone—where regulators did not force banks to recapital-ize—reveals.
57 Tirole (2012) develops a theoretical model in which such intervention by the central bank can unfreezethe credit market.
The Financial Crisis of 2007–2009
191
Another program involved the Federal Reserve purchasing direct obli-gations of housing-related Government-Sponsored Enterprises (GSEs).The goal of these purchases, combined with the purchases of mortgage-backed securities by Fannie Mae, Freddie Mac, and Ginnie Mae, was tomake it cheaper and easier for people to buy homes. The idea was that thisgoal would be served if the spread between GSE debt and U.S. Treasurydebt narrowed, and it was believed that these purchases would do that.
In addition to these programs, the Federal Reserve also introducedstress tests of large banks, in order to determine their ability to withstandsystemic shocks of various magnitudes. These simulations were designedto shed light on how much capital and access to liquidity banks wouldneed if confronted with the kinds of shocks that pummeled banks duringthe crisis of 2007–2009 and hence to provide early-warning signals toboth banks and regulators.
5.2 Assessment of policy initiatives
Many believe that the liquidity support provided by central banks waseffective in calming markets in the initial phases of the crisis. However,there is no consensus on whether these were the right measures for thelong run or whether the problem was even correctly diagnosed. At thevery least, markets exhibited considerable volatility after the collapse ofLehman Brothers, indicating that central banks were learning as theywent along—building the bridge as they walked on it, so to speak—and not all the initiatives had the intended effects.
A key issue for central banks was to determine whether the unfoldingevents were due to liquidity or counterparty risk arising from asymmetricinformation about the quality of assets on bank balance sheets and theopaqueness of those balance sheets. The Federal Reserve and theEuropean Central Bank (ECB) clearly believed it was a liquidity problem,at least until the failure of Lehman Brothers, and this is reflected in manyof the measures discussed earlier. But if the issue was counterparty risk,then the proper approach would have been to require banks to make theirbalance sheets more transparent, deal directly with the rising mortgagedefaults, and undertake measures to infuse more capital into financialinstitutions, possibly with government assistance to supplement private-sector infusions.
Some of the programs that were developed in the later stages of thecrisis were directed at dealing with the counterparty risk issue. Theseinclude TARP’s Capital Purchase Program, the purchases of GSE debt,and large-bank stress tests, all of which were discussed in the previoussection.
Perhaps it should come as no surprise that the initial assessment ofcentral banks was that this was a market-wide liquidity crunch, sincebeliefs about the underlying causes of the crisis were conditioned on
Review of Corporate Finance Studies / v 4 n 2 2015
192
historical experience, especially that associated with the GreatDepression.58 There are many who believe that what began as a recessionturned into a big depression back then because the “gold standard”pegged currencies to gold stocks, so when the drop in global demandcaused balance-of-payments crises in various countries due to gold out-flows, governments and central banks responded by tightening monetarypolicy and exercising greater fiscal restraint. This led to the view thatinterest rate reductions and monetary-stimulus initiatives like quantita-tive easing were the appropriate policy responses to crises. Of course,every crisis is different, and the circumstances that existed around thetime the subprime crisis hit the economy were quite different from thosethat preceded the Great Depression. Nonetheless, the rapid escalation ofunanticipated problems made quick policy responses an imperative, andthe time for deep explorations of the root causes of observable events wassimply not there.
As discussed earlier, the existing evidence suggests that this was aninsolvency crisis. The Taylor and Williams (2009) paper discussed earlieralso examines the effect of some of the policy interventions to shed fur-ther light on this issue. Taylor and Williams (2009) show that the TAFhad little effect on the LIBOR-OIS spread. Moreover, the sharp reduc-tion in the federal funds rate during the crisis—the Fed funds target ratewent from 5.25% in August 2007 to 2% in April 2008—also did notsucceed in reducing the LIBOR-OIS spread (see Figure 6). However, itcaused a depreciation of the dollar and caused oil prices to jump, causinga sharp decline in world economic growth.
Taylor and Williams (2009) go on to show that in October 2008, thecrisis worsened as the LIBOR-OIS spread spiked even further. That is,more than a year after it started, the crisis worsened. Some point to thefailure of Lehman Brothers in September 2008 as a proximate cause.Taylor and Williams (2009) suggest, however, that that may have beenmore a symptom than a cause and that the real culprit may have been theelevated perception of risk in the fundamentals, fueled by sinking houseprices and rising oil prices.
The main point brought out by the Taylor and Williams (2009) ana-lysis is that counterparty risk concerns generated by rising insolvency riskperceptions were an important driver of short-term funding strains for
58 See, for example, Bernanke (2000). The subprime crisis of 2007–2009 has been frequently compared withthe Great Depression. The Economist (November 8, 2013) notes, “Since the start of what some now callthe “Great Recession” in 2007, economists have been unable to avoid comparing it with the Depressionof the early 1930s. For some, the comparisons are explicit. Economists like Paul Krugman and BarryEichengreen have drawn parallels between the two slumps. Oliver Blanchard, chief economist of theInternational Monetary Fund (IMF), warned several times over the last few years that the world riskedfalling into a new ‘Great Depression,’ Economic historians themselves have had an unprecedented role inpolicy making during the recent crisis. Ben Bernanke at the Federal Reserve and Obama-administrationadvisors like Christina Romer all have academic backgrounds in the discipline.”
The Financial Crisis of 2007–2009
193
banks during August 2007–2008. This suggests that interventions de-signed to address counterparty risk (like capital infusions and stresstests) should have been implemented earlier than they were. Their ana-lysis does not necessarily imply that liquidity facilities for banks were nothelpful in the early stages of the crisis or that liquidity was not a concernof any magnitude during the crisis. One problem with making a deter-mination of whether liquidity interventions by the Federal Reserve servedany useful purpose is that we do not observe the counterfactual, that is,we do not know how market participants would have reacted in theabsence of the liquidity intervention. While it is true that borrowing atthe discount window was somewhat limited until 2008, it is difficult toknow what would have happened had the discount window assuranceprovided by the role of the Federal Reserve as a Lender of Last Resort(LOLR) been absent.59 Would the absence of the initial liquidity inter-ventions have exacerbated the later counterparty risk concerns?
Even apart from the issue of whether the real problem was liquidity orcounterparty risk, the massive ex post expansion of the governmentsafety net to mutual fund investors and nondepository institutions todeal with the crisis raises the possibility that the expectations of marketparticipants about the nature of implicit government guarantees havebeen significantly altered insofar as future crisis events are concerned.This has potentially significant moral hazard implications that may dis-tort not only the behavior of investors and institutions but also possiblyregulators who may feel compelled to adopt more intensive regulation tocope with the greater moral hazard.
5.3 What should have been done ex ante?
While one can play “Monday morning quarterback” with the govern-ment initiatives to cope with the crisis and learn a lot about which re-sponses will serve us well in the future, it is even more important to reflecton what should have been done ex ante to reduce the probability ofoccurrence of the crisis. For such an exercise, the root-cause analysis inSection 2 is helpful. This analysis reveals that a rich set of factors inter-acted to generate this crisis, but if one were to try and extract the mostessential drivers, one would conclude that the long period of sustainedbanking profitability was at the heart of the problem, since it is thisperiod of relatively tranquil prosperity that corrupted risk managementat many levels by creating the belief that banks were highly skilled atmanaging a variety of complex risks (see Thakor 2015a). It tempted
59 Market disruptions that occurred outside the Taylor and Williams (2009) sample period (e.g., during andafter Fall 2008) may have reflected liquidity concerns. In September 2008, even high-quality nonfinancialcompanies seemed to experience higher borrowing costs and constraints on borrowing in the commercialpaper market. Of course, this may simply have reflected the perception of dimming prospects for the realeconomy, rather than a market-wide liquidity crunch per se.
Review of Corporate Finance Studies / v 4 n 2 2015
194
politicians to push the home-ownership agenda by creating regulatoryand other inducements for banks to originate and securitize risky mort-gages because banks were viewed as being capable of handling the risks.It tempted consumers to become excessively highly leveraged, therebyincreasing the likelihood of default on mortgages (see, for example,Mian, Rao, and Sufi, 2013). It deterred regulators from imposing sub-stantially higher capital requirements on banks because the diversifica-tion and risk-management skills of bankers were considered to be goodenough to contain whatever risks were associated with the massive finan-cial innovation that was occurring. It encouraged banks to engage infinancial innovation and operate with relatively low levels of capital. Itled credit rating agencies to underestimate risks and assign ratings thatturned out ex post to be inflated.
Given this, what should we think of doing prospectively? Three issuesare discussed below.
5.3.1 Higher capital requirements and more research on quantitative esti-
mates of optimal capital requirements. In an environment in which a longsequence of good outcomes induces a “false sense of security,” as discussedabove, it would be useful to consider higher capital requirements in boththe depository financial institutions sector and in shadow banking.60
Purnanandam’s (2011) empirical evidence indicates that banks withhigher capital control credit risk more effectively when it comes to mort-gages. Moreover, as Thakor (2014) discusses, increasing capital require-ments will reduce correlated risk taking by banks, and hence lead to lowersystemic risk.61 In addition, if only mortgages with sufficient borrowerequity can be securitized, then consumer leverage can also be limited.While these initiatives are unlikely to suffice by themselves to reduce theprobability of future crises to socially acceptable levels, they may go a longway in enhancing financial stability. Moreover, by achieving some reduc-tion in the probability of future crises, they will also reduce the probabilityof ad hoc ex post expansions of the government safety net that carry withthem the baggage of increased moral hazard.
60 For example, regulatory-mandated “haircuts” in repo transactions and “skin-in-the-game” requirementsfor securitized mortgages (requiring originating banks to hold some of the equity tranche in securitiza-tions) are ways to implement capital requirements in shadow banking. By ensuring that shadow banksare subject to the necessary capital requirements, regulators can minimize the ability of depositoryinstitutions to evade higher capital requirements by shifting activities to the less-regulated shadow bank-ing sector. This would counter one of the typical arguments made against raising capital requirements forbanks.
61 Admati et al. (2012) also advocate higher capital requirements, partly on the basis of the observation thatdebt overhang problems obstruct the voluntary infusion of more capital by banks themselves. Pfleiderer(2012) points out that one reason why banks are attracted to high leverage is that implicit and explicitsafety nets provide banks higher credit ratings and hence lower yields on their debt than other firms.
The Financial Crisis of 2007–2009
195
Increasing capital in banking also has other advantages. Sufficientlywell capitalized institutions have little need to engage in fire sales of assetsand therefore are unlikely to run into funding constraints (Shleifer andVishny (2011) discuss the macroeconomic effects of fire sales). This leadsto high liquidity in the market (see Brunnermeier and Pedersen 2009),indicating that liquidity risk can be diminished without having institu-tions keep lots of low-return liquid assets (like cash) on their balancesheets. Thakor (2014) discusses how higher bank capital reduces insolv-ency risk by attenuating asset-substitution moral hazard and strengthen-ing the bank’s monitoring and screening incentives. So, higher levels ofbank capital can reduce both liquidity risk and insolvency risk.
There have been two major impediments to the adoption of highercapital requirements in banking. One is that regulators have used back-ward-looking models of risk assessments (e.g., Rajan, Seru, and Vig2015), which makes it difficult to overcome the temptation to keep capitalrequirements low during economic booms and periods of low defaults.The use of stress tests, and calculations of capital surcharges based onthose tests, can help to partially overcome this problem. The second im-pediment is that our models of bank capital structure are largely quali-tative,62 so, while they can identify the factors that will tend to tilt thebank’s optimal capital structure in one direction or the other, they are notamenable to calibration exercises that provide the magnitudes of (sociallyoptimal) bank capital requirements. This makes it difficult to answerquestions like “what should regulators set minimum capital requirementsat?” And if we cannot answer such questions, the guidance we can pro-vide to regulators is limited. With differences of opinion, even amongresearchers, about the desirability of asking banks to keep more capital,this limitation creates the risk that debates on this may devolve into mereassertions based largely on assumptions made in qualitative models thatcannot be tested.
Fortunately, recent research has begun to address this issue by calcu-lating how increases in bank capital requirements may affect the cost ofcapital and profitability of banks. For example, Hanson, Kashyap, andStein (2011) argue that a ten percentage-point increase in capital require-ments will increase the weighted average cost of capital for banks by amere 25 basis points, which the authors describe as “. . . a small effect.”Kisin and Manela (2014) use a clever empirical approach to estimate theshadow cost of bank capital requirements. They document that a ten
62 A related impediment is the disagreement, even among qualitatively oriented capital structure models,related to whether banks should be highly levered or have high levels of capital. See Thakor (2014) for adiscussion of these competing theoretical viewpoints.
Review of Corporate Finance Studies / v 4 n 2 2015
196
percentage point increase in capital requirements would impose an aver-age cost per bank of only 4% of annual profits, leading to an increase inlending rates of only 3 basis points. Roger and Vitek (2012) develop amacroeconometric model to determine how global GDP would respondto an increase in bank capital requirements, and conclude that monetarypolicy responses would largely offset any adverse impact of capitalrequirements.
So, the costs of significantly higher capital requirements appear to besmall. What about the benefits? Mehran and Thakor (2011) provide em-pirical evidence that the bank value is increasing in bank capital in thecross-section. This militates against the notion that increasing capital inbanking will necessarily jeopardize shareholder value in banking—aclaim often made by bankers in resisting calls for higher capitallevels—thereby questioning a basic premise of the presumed trade-offbetween financial stability and bank value creation.63 However, it doesnot tell us how high capital requirements should be set. Some recentpapers have started taking a stab at this. For example, Nguyen (2014)develops a general equilibrium model in which a dynamic banking sectorendogenously determines aggregate growth. It takes into account therisk-shifting behavior of inadequately capitalized banks that causes finan-cial fragility and calculates the optimal level of minimum tier-one capitalrequirements at 8%. This exceeds what is prescribed by both the Basel IIand III accords, but it is below what many believe is needed for financialstability (e.g., Acharya, Engle, and Richardson 2012; Admati andHellwig 2013). Nguyen (2014) also shows that increasing bank capitalrequirements can produce welfare gains greater than 1% of lifetime con-sumption. While one might quibble with the parameter values that pro-duce such precise estimates, the benefit of engaging in serious modelingthat is aimed at extracting such estimates cannot be overstated. The goodnews is that policymakers are already beginning to pay heed to the callsfor higher capital. The bad news is that despite the capital surchargesbased on stress-test results, the largest U.S. and European banks are stillundercapitalized as of end 2014. The largest European banks (each withassets exceeding $100 billion) that account for 78% of all EU bankingassets have only 4% capital as a percentage of total assets (leverageratio). The situation is better in the United States where regulatorshave decided on a minimum 5% leverage ratio (above the 3% Basel IIIminimum), but as of December 2014, the largest U.S. Bank HoldingCompanies need to raise about $68 billion in capital to comply.
63 The basic premise is that higher bank capital levels lead to lower bank values because they decreaseshareholder value in banking or they lead to less discipline on banks, causing banks, in turn, to engage ina lower level of value-creating activities. See Thakor (2014) for a detailed discussion.
The Financial Crisis of 2007–2009
197
5.3.2 Designing a more integrated regulatory structure. Apart from theweakness of pre-crisis regulation in being insufficiently attentive to con-sumer and bank leverage, there was also little attention paid to thegrowth of the repo market and its escalating importance in the short-term funding of shadow banks. Concerns about the credit risks asso-ciated with the collateral used in repo transactions and the solvency ofshadow banks that are heavily reliant on repos for short-term fundinghad a lot to do with what triggered the subprime crisis. Part of the reasonfor this inattention was due to the enormously complex yet fragmentedregulatory structure for financial institutions that was discussed earlier.This produced inconsistent and often conflicting regulation, andmade “regulatory arbitrage” easy, allowing risks that were regulatedand monitored in one sector to migrate in an amplified form to anotherless regulated or unregulated sector.64 A more integrated approach to theregulation of depository institutions and shadow banks—that havebecome increasingly connected through time—would have helped toalert regulators to the early warning signs. The creation of theFinancial Stability Oversight Council (FSOC) under the Dodd-FrankAct is intended to eliminate some of these informational gaps.However, other than that, this Act seems to have done little to dealwith possible future episodes of insolvency-driven stresses in the repomarket or the associated drying up of short-term liquidity (see, for ex-ample, Acharya and Oncu 2011). Since the repo market is likely to ex-perience bouts of illiquidity when the rest of the financial market is in astate of duress, this risk is potentially systemic, so not dealing with it inregulatory reform is a significant oversight. We need more normativeresearch on the optimal design of regulatory agencies.
5.3.3 Bank misconduct, corporate governance, and corporate culture. Finally,the quality of corporate governance in banking has also been questioned.One could argue that if equity governance were strengthened, the case forhigher capital requirements could be made stronger. Nonfinancial com-panies are not allowed to take ownership positions in banks in the UnitedStates. An investor with more than a 10% ownership stake in a bank isdeemed to be “controlling shareholder” and thus must become a bankholding company (BHC). A BHC cannot invest in non-bank activities, soeffectively ownership of banks is denied to many types of firms that createvalue through more effective governance, for example, private equityfirms. This constraint on equity ownership in banks means that equitygovernance in banking is likely to be weaker than in nonfinancial
64 A good example is credit default swaps (CDSs), an insurance policy that was not regulated by either theFederal Reserve or insurance regulations because regulation tends to be based on product labels ratherthan on economic function, and there is little coordination among regulators.
Review of Corporate Finance Studies / v 4 n 2 2015
198
corporations, which, in turn, makes equity less attractive for banks thanfor nonfinancials. What makes the situation worse is that controllingbank shareholders are deemed to be a “source of strength” for theirinstitutions, which means they may be required by bank regulators toprovide substantial incremental investments when the bank is consideredto be financially impaired. This further reduces the attractiveness of bankequity investments for nonbank investors.
Whether stronger equity governance will suffice to significantly alterbank behavior is questionable. The culture of an organization has animportant effect on its performance (see, for example, Bouwman 2013;Cameron et al. 2014). We need a lot more research on corporate culturein banking and how regulators should assess and monitor it.
6. Conclusion
This paper has reviewed a very large body of research on the causes andeffects of the most devastating financial crisis since the Great Depression,and the policy responses undertaken by central banks to deal with thecrisis. It appears that the crisis resulted from the interaction of manyfactors: politics, monetary policy, global economic developments, mis-aligned incentives, fraud, growth of securitization, a fragmented regula-tory structure, and a complacency born of success-driven skill inferences.The existing evidence suggests that these factors produced an insolvency/counterparty risk crisis, in contrast to the more popular view that thiswas primarily a liquidity crisis.65
It is well recognized that dealing with insolvency risk to diminish thelikelihood of future crises will call for banks to operate with higher cap-ital levels. One encouraging piece of evidence is that the value of bankcapital seems to have been enhanced in the “eyes” of the market in thepostcrisis period compared to the precrisis period, as documented byCalomiris and Nissim (2014). For regulators, an important question ishow should we assess the trade-offs between bank capital and stability?Thakor’s (2014) review of the extensive research on this topic concludesthat the impact of bank capital on systemic risk has to be at the heart ofany such assessment. It appears that higher levels of capital in bankingwill reduce both insolvency and liquidity risks. Gauthier, Lehar, andSouissi (2012) show that a properly designed capital requirement canreduce the probability of a systemic crisis by 25%. Of course, we needto know how to measure systemic risk for purposes of calibration ofregulatory capital requirements. Acharya, Engle, and Richardson
65 As discussed earlier, the interaction of political factors, regulatory initiatives, and monetary policy mayhave created the incentives for financial institutions to take excessive risk, then leading to elevatedinsolvency concerns and the crisis. That is, excess liquidity may have led to an insolvency crisis.
The Financial Crisis of 2007–2009
199
(2012) discuss the measurement of systemic risk and implementableschemes to regulate it.66 We need more of this kind of research, including
models that are amenable to quantitative estimations of socially optimal
capital requirements. Moreover, it is also clear that we need to better
understand the interaction between bank capital, borrower capital, mon-
etary policy and asset prices. The recent theory proposed by di Lasio(2013) provides a microfounded justification for macroprudential regula-
tion that involves countercyclical capital buffers and higher capital re-
quirements during periods of lower fundamental risk. This theory can be
a useful starting point for the examination of more complex interactions
involving monetary policy.Two other issues deserve research attention. One is the effect that
regulatory complexity has on the efficacy of regulation. An example is
the enormous complexity of the Dodd-Frank Act. While an important
goal of the regulation is to eliminate the too-big-to-fail problem, it is
doubtful it will achieve that goal.67 The other issue is how regulators
should deal with corporate culture in banking.68 Culture is an importantdriver of risk management, but we know little about it.
References
Acharya, V. V., and T. Sabri Oncu. 2011. The repurchase agreement (repo) market. In V. V. Acharya, T.F. Cooley, M. P. Richardson, and I. Walter (Eds.), In regulating Wall Street: The Dodd-Frank Act andthe new architecture of global finance. Hoboken, NJ: John Wiley and Sons.
Acharya, V., R. Engle, and M. Richardson. 2012. Capital shortfall: A new approach to ranking andregulating systemic risks. American Economic Review Papers and Proceedings 102:59–64.
Acharya, V., H. Mehran, and A. Thakor. 2013. Caught between Scylla and Charybdis? Regulating bankleverage when there is rent-seeking and risk-shifting. Working Paper, Washington University in St.Louis.
Acharya, V., and A. Thakor. 2013. The dark side of liquidity creation: Leverage and systemic risk.Working Paper, NYU and Washington University in St. Louis.
Adelino, M., A. Schoar, and F. Severino. 2015. Changes in buyer composition and the expansion ofcredit during the boom. NBER Working Paper No. 20848.
Admati, A., P. DeMarzo, M. Hellwig, and P. Pfleiderer. 2012. Debt overhang and capital regulation.Working Paper, Stanford University.
Admati, A., and M. Hellwig. 2013. The bankers’ new clothes: What is wrong with banking and what to doabout it. Princeton: Princeton University Press.
Agarwal, S., E. Benmelech, N. Bergman, and A. Seru. 2012. Did the Community Reinvestment Act(CRA) lead to risky lending? NBER Working Paper No. 18609.
66 They have developed a new measure of systemic risk, SRISK, which calculates the amount of capitalbanks would need to withstand a systemic crisis, defined as a 40% drop in equity market value.
67 For papers dealing with the pros and cons of large banks, see Bertay, Demirguc-Kunt, and Huizinga(2013) and Hughes and Mester (2013).
68 See Thakor (2015b) for a discussion. Guiso, Sapienza, and Zingales (2014) examine the impact of gov-ernance structure on corporate culture.
Review of Corporate Finance Studies / v 4 n 2 2015
200
Agarwal, S., D. Lucca, A. Seru, and F. Trebbi. 2014. Inconsistent regulators: Evidence from banking.Quarterly Journal of Economics 129:889–938.
Allen, F. 1990. The market for information and the origin of financial intermediation. Journal ofFinancial Intermediation 1:3–30.
Allen, F., and D. Gale. 1998. Optimal financial crises. Journal of Finance 53:1245–84.
———. 2000. Bubbles and crises. Economic Journal 1110:236–55.
———. 2000. Financial contagion. Journal of Political Economy 108:1–33.
Andrews, E. 2007. Fed shrugged as subprime crisis spread. New York Times, December 18. http://www.nytimes.com/2007/12/18/business/18subprime.html.
Atkinson, T., D. Luttrell, and H. Rosenblum. 2013. How bad was it? The costs and consequences of the2007–09 financial crisis. Staff Paper No. 20. Federal Reserve Bank of Dallas.
Barth, J., G. Caprio, and R. Levine. 2012. The guardians of finance: Making them work for us.Cambridge: MIT Press.
Barth, J., T. Li, W. Lu, T. Phumiwasana, and G. Yago. 2009. The rise and fall of the U.S. mortgage andcredit markets: A comprehensive analysis of the meltdown. Hoboken, NJ: John Wiley & Sons.
Bebchuk, L., and J. Fried. 2010. Paying for long-term performance. University of Pennsylvania LawReview 155:1915–60.
Becker, B., and T. Milbourn. 2011. How did increased competition affect credit ratings? Journal ofFinancial Economics 101:493–514.
Beltratti, A., and R. Stulz. 2012. The credit crisis around the globe: Why did some banks perform better?Journal of Financial Economics 105:1–17.
Benmelech, E., and J. Dlugosz. 2009. The credit rating crisis. NBERMacroeconomics Annual 24:161–207.
Bernanke, B. 2000. Essays on the Great Depression. Princeton: Princeton University Press.
———. 2010. Causes of the recent financial and economic crisis. Statement before the Financial CrisisInquiry Commission, Washington DC.
Berger, A., and C. Bouwman. 2013. How does capital affect bank performance during financial crises?Journal of Financial Economics 109:146–76.
———. 2014. Bank liquidity creation, monetary, policy, and financial crises. Working Paper, WhartonFinancial Institutions Center.
Berger, A., R. DeYoung, M. Flannery, D. Lee, and O. Oztekin. 2008. How do large banking organiza-tions manage their capital ratios? Journal of Financial Services Research 34:123–49.
Bertay, A., A. Demirguc-Kunt, and H. Huizinga. 2013. Do we need big banks? Evidence on perform-ance, strategy, and market discipline. Journal of Financial Intermediation 22:532–58.
Bhattacharya, S., and A. Thakor. 1993. Contemporary banking theory. Journal of FinancialIntermediation 3:2–50.
Boot, A. 2014. Financial sector in flux. Journal of Money, Credit and Banking 46:129–35.
Boot, A., and A. Thakor. 1993. Self-interested bank regulation. American Economic Review 83:206–12.
———. 2000. Can relationship banking survive competition? Journal of Finance 55:679–714.
———. 2014. Commercial banking and shadow banking: The accelerating integration of banks andmarkets and its implications for regulation. In A. Berger, P. Molyneux, and J. Wilson (Eds.), Oxfordhandbook of banking. 2nd edition. Oxford: Oxford University Press.
The Financial Crisis of 2007–2009
201
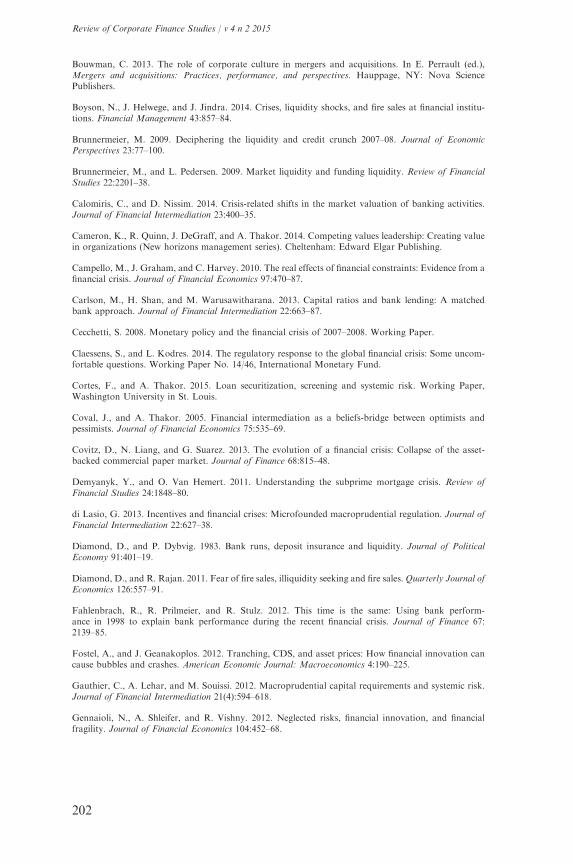
Bouwman, C. 2013. The role of corporate culture in mergers and acquisitions. In E. Perrault (ed.),Mergers and acquisitions: Practices, performance, and perspectives. Hauppage, NY: Nova SciencePublishers.
Boyson, N., J. Helwege, and J. Jindra. 2014. Crises, liquidity shocks, and fire sales at financial institu-tions. Financial Management 43:857–84.
Brunnermeier, M. 2009. Deciphering the liquidity and credit crunch 2007–08. Journal of EconomicPerspectives 23:77–100.
Brunnermeier, M., and L. Pedersen. 2009. Market liquidity and funding liquidity. Review of FinancialStudies 22:2201–38.
Calomiris, C., and D. Nissim. 2014. Crisis-related shifts in the market valuation of banking activities.Journal of Financial Intermediation 23:400–35.
Cameron, K., R. Quinn, J. DeGraff, and A. Thakor. 2014. Competing values leadership: Creating valuein organizations (New horizons management series). Cheltenham: Edward Elgar Publishing.
Campello, M., J. Graham, and C. Harvey. 2010. The real effects of financial constraints: Evidence from afinancial crisis. Journal of Financial Economics 97:470–87.
Carlson, M., H. Shan, and M. Warusawitharana. 2013. Capital ratios and bank lending: A matchedbank approach. Journal of Financial Intermediation 22:663–87.
Cecchetti, S. 2008. Monetary policy and the financial crisis of 2007–2008. Working Paper.
Claessens, S., and L. Kodres. 2014. The regulatory response to the global financial crisis: Some uncom-fortable questions. Working Paper No. 14/46, International Monetary Fund.
Cortes, F., and A. Thakor. 2015. Loan securitization, screening and systemic risk. Working Paper,Washington University in St. Louis.
Coval, J., and A. Thakor. 2005. Financial intermediation as a beliefs-bridge between optimists andpessimists. Journal of Financial Economics 75:535–69.
Covitz, D., N. Liang, and G. Suarez. 2013. The evolution of a financial crisis: Collapse of the asset-backed commercial paper market. Journal of Finance 68:815–48.
Demyanyk, Y., and O. Van Hemert. 2011. Understanding the subprime mortgage crisis. Review ofFinancial Studies 24:1848–80.
di Lasio, G. 2013. Incentives and financial crises: Microfounded macroprudential regulation. Journal ofFinancial Intermediation 22:627–38.
Diamond, D., and P. Dybvig. 1983. Bank runs, deposit insurance and liquidity. Journal of PoliticalEconomy 91:401–19.
Diamond, D., and R. Rajan. 2011. Fear of fire sales, illiquidity seeking and fire sales. Quarterly Journal ofEconomics 126:557–91.
Fahlenbrach, R., R. Prilmeier, and R. Stulz. 2012. This time is the same: Using bank perform-ance in 1998 to explain bank performance during the recent financial crisis. Journal of Finance 67:2139–85.
Fostel, A., and J. Geanakoplos. 2012. Tranching, CDS, and asset prices: How financial innovation cancause bubbles and crashes. American Economic Journal: Macroeconomics 4:190–225.
Gauthier, C., A. Lehar, and M. Souissi. 2012. Macroprudential capital requirements and systemic risk.Journal of Financial Intermediation 21(4):594–618.
Gennaioli, N., A. Shleifer, and R. Vishny. 2012. Neglected risks, financial innovation, and financialfragility. Journal of Financial Economics 104:452–68.
Review of Corporate Finance Studies / v 4 n 2 2015
202
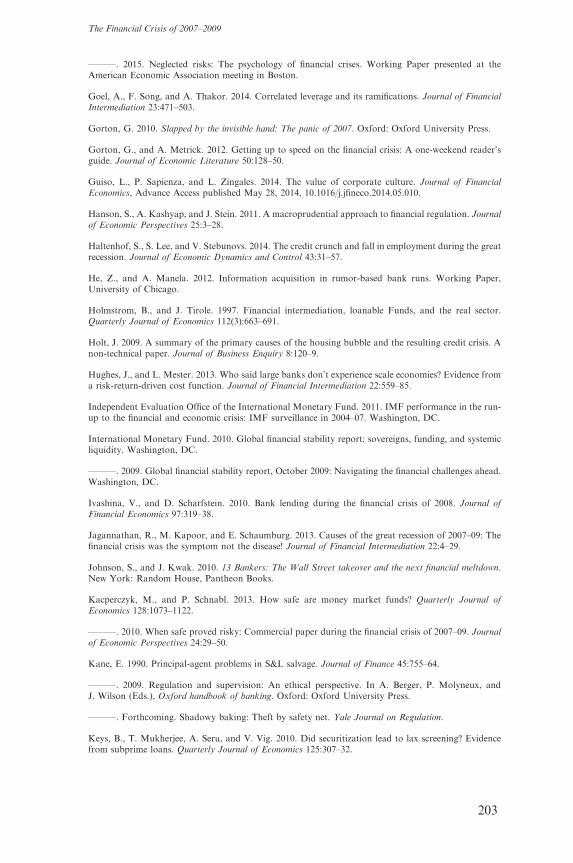
———. 2015. Neglected risks: The psychology of financial crises. Working Paper presented at theAmerican Economic Association meeting in Boston.
Goel, A., F. Song, and A. Thakor. 2014. Correlated leverage and its ramifications. Journal of FinancialIntermediation 23:471–503.
Gorton, G. 2010. Slapped by the invisible hand: The panic of 2007. Oxford: Oxford University Press.
Gorton, G., and A. Metrick. 2012. Getting up to speed on the financial crisis: A one-weekend reader’sguide. Journal of Economic Literature 50:128–50.
Guiso, L., P. Sapienza, and L. Zingales. 2014. The value of corporate culture. Journal of FinancialEconomics, Advance Access published May 28, 2014, 10.1016/j.jfineco.2014.05.010.
Hanson, S., A. Kashyap, and J. Stein. 2011. A macroprudential approach to financial regulation. Journalof Economic Perspectives 25:3–28.
Haltenhof, S., S. Lee, and V. Stebunovs. 2014. The credit crunch and fall in employment during the greatrecession. Journal of Economic Dynamics and Control 43:31–57.
He, Z., and A. Manela. 2012. Information acquisition in rumor-based bank runs. Working Paper,University of Chicago.
Holmstrom, B., and J. Tirole. 1997. Financial intermediation, loanable Funds, and the real sector.Quarterly Journal of Economics 112(3):663–691.
Holt, J. 2009. A summary of the primary causes of the housing bubble and the resulting credit crisis. Anon-technical paper. Journal of Business Enquiry 8:120–9.
Hughes, J., and L. Mester. 2013. Who said large banks don’t experience scale economies? Evidence froma risk-return-driven cost function. Journal of Financial Intermediation 22:559–85.
Independent Evaluation Office of the International Monetary Fund. 2011. IMF performance in the run-up to the financial and economic crisis: IMF surveillance in 2004–07. Washington, DC.
International Monetary Fund. 2010. Global financial stability report: sovereigns, funding, and systemicliquidity. Washington, DC.
———. 2009. Global financial stability report, October 2009: Navigating the financial challenges ahead.Washington, DC.
Ivashina, V., and D. Scharfstein. 2010. Bank lending during the financial crisis of 2008. Journal ofFinancial Economics 97:319–38.
Jagannathan, R., M. Kapoor, and E. Schaumburg. 2013. Causes of the great recession of 2007–09: Thefinancial crisis was the symptom not the disease! Journal of Financial Intermediation 22:4–29.
Johnson, S., and J. Kwak. 2010. 13 Bankers: The Wall Street takeover and the next financial meltdown.New York: Random House, Pantheon Books.
Kacperczyk, M., and P. Schnabl. 2013. How safe are money market funds? Quarterly Journal ofEconomics 128:1073–1122.
———. 2010. When safe proved risky: Commercial paper during the financial crisis of 2007–09. Journalof Economic Perspectives 24:29–50.
Kane, E. 1990. Principal-agent problems in S&L salvage. Journal of Finance 45:755–64.
———. 2009. Regulation and supervision: An ethical perspective. In A. Berger, P. Molyneux, andJ. Wilson (Eds.), Oxford handbook of banking. Oxford: Oxford University Press.
———. Forthcoming. Shadowy baking: Theft by safety net. Yale Journal on Regulation.
Keys, B., T. Mukherjee, A. Seru, and V. Vig. 2010. Did securitization lead to lax screening? Evidencefrom subprime loans. Quarterly Journal of Economics 125:307–32.
The Financial Crisis of 2007–2009
203
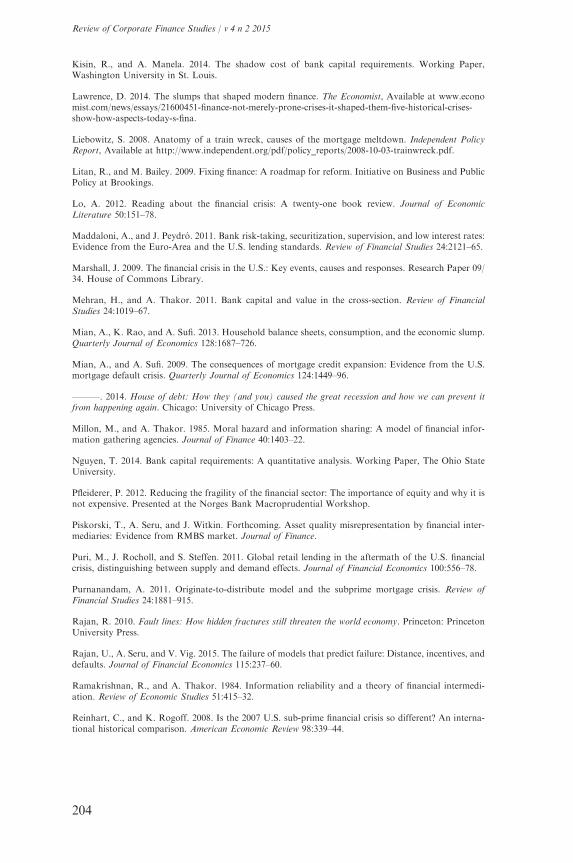
Kisin, R., and A. Manela. 2014. The shadow cost of bank capital requirements. Working Paper,Washington University in St. Louis.
Lawrence, D. 2014. The slumps that shaped modern finance. The Economist, Available at www.economist.com/news/essays/21600451-finance-not-merely-prone-crises-it-shaped-them-five-historical-crises-show-how-aspects-today-s-fina.
Liebowitz, S. 2008. Anatomy of a train wreck, causes of the mortgage meltdown. Independent PolicyReport, Available at http://www.independent.org/pdf/policy_reports/2008-10-03-trainwreck.pdf.
Litan, R., and M. Bailey. 2009. Fixing finance: A roadmap for reform. Initiative on Business and PublicPolicy at Brookings.
Lo, A. 2012. Reading about the financial crisis: A twenty-one book review. Journal of EconomicLiterature 50:151–78.
Maddaloni, A., and J. Peydro. 2011. Bank risk-taking, securitization, supervision, and low interest rates:Evidence from the Euro-Area and the U.S. lending standards. Review of Financial Studies 24:2121–65.
Marshall, J. 2009. The financial crisis in the U.S.: Key events, causes and responses. Research Paper 09/34. House of Commons Library.
Mehran, H., and A. Thakor. 2011. Bank capital and value in the cross-section. Review of FinancialStudies 24:1019–67.
Mian, A., K. Rao, and A. Sufi. 2013. Household balance sheets, consumption, and the economic slump.Quarterly Journal of Economics 128:1687–726.
Mian, A., and A. Sufi. 2009. The consequences of mortgage credit expansion: Evidence from the U.S.mortgage default crisis. Quarterly Journal of Economics 124:1449–96.
———. 2014. House of debt: How they (and you) caused the great recession and how we can prevent itfrom happening again. Chicago: University of Chicago Press.
Millon, M., and A. Thakor. 1985. Moral hazard and information sharing: A model of financial infor-mation gathering agencies. Journal of Finance 40:1403–22.
Nguyen, T. 2014. Bank capital requirements: A quantitative analysis. Working Paper, The Ohio StateUniversity.
Pfleiderer, P. 2012. Reducing the fragility of the financial sector: The importance of equity and why it isnot expensive. Presented at the Norges Bank Macroprudential Workshop.
Piskorski, T., A. Seru, and J. Witkin. Forthcoming. Asset quality misrepresentation by financial inter-mediaries: Evidence from RMBS market. Journal of Finance.
Puri, M., J. Rocholl, and S. Steffen. 2011. Global retail lending in the aftermath of the U.S. financialcrisis, distinguishing between supply and demand effects. Journal of Financial Economics 100:556–78.
Purnanandam, A. 2011. Originate-to-distribute model and the subprime mortgage crisis. Review ofFinancial Studies 24:1881–915.
Rajan, R. 2010. Fault lines: How hidden fractures still threaten the world economy. Princeton: PrincetonUniversity Press.
Rajan, U., A. Seru, and V. Vig. 2015. The failure of models that predict failure: Distance, incentives, anddefaults. Journal of Financial Economics 115:237–60.
Ramakrishnan, R., and A. Thakor. 1984. Information reliability and a theory of financial intermedi-ation. Review of Economic Studies 51:415–32.
Reinhart, C., and K. Rogoff. 2008. Is the 2007 U.S. sub-prime financial crisis so different? An interna-tional historical comparison. American Economic Review 98:339–44.
Review of Corporate Finance Studies / v 4 n 2 2015
204
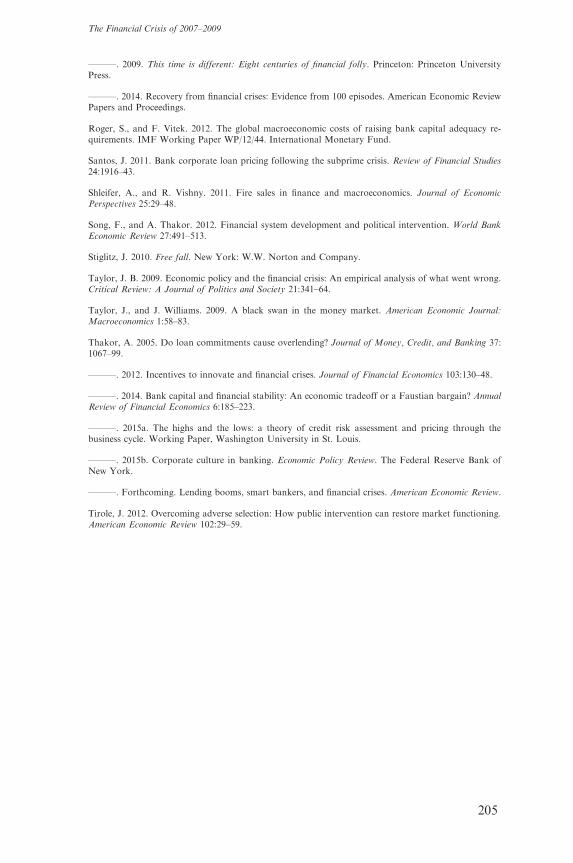
———. 2009. This time is different: Eight centuries of financial folly. Princeton: Princeton UniversityPress.
———. 2014. Recovery from financial crises: Evidence from 100 episodes. American Economic ReviewPapers and Proceedings.
Roger, S., and F. Vitek. 2012. The global macroeconomic costs of raising bank capital adequacy re-quirements. IMF Working Paper WP/12/44. International Monetary Fund.
Santos, J. 2011. Bank corporate loan pricing following the subprime crisis. Review of Financial Studies24:1916–43.
Shleifer, A., and R. Vishny. 2011. Fire sales in finance and macroeconomics. Journal of EconomicPerspectives 25:29–48.
Song, F., and A. Thakor. 2012. Financial system development and political intervention. World BankEconomic Review 27:491–513.
Stiglitz, J. 2010. Free fall. New York: W.W. Norton and Company.
Taylor, J. B. 2009. Economic policy and the financial crisis: An empirical analysis of what went wrong.Critical Review: A Journal of Politics and Society 21:341–64.
Taylor, J., and J. Williams. 2009. A black swan in the money market. American Economic Journal:Macroeconomics 1:58–83.
Thakor, A. 2005. Do loan commitments cause overlending? Journal of Money, Credit, and Banking 37:1067–99.
———. 2012. Incentives to innovate and financial crises. Journal of Financial Economics 103:130–48.
———. 2014. Bank capital and financial stability: An economic tradeoff or a Faustian bargain? AnnualReview of Financial Economics 6:185–223.
———. 2015a. The highs and the lows: a theory of credit risk assessment and pricing through thebusiness cycle. Working Paper, Washington University in St. Louis.
———. 2015b. Corporate culture in banking. Economic Policy Review. The Federal Reserve Bank ofNew York.
———. Forthcoming. Lending booms, smart bankers, and financial crises. American Economic Review.
Tirole, J. 2012. Overcoming adverse selection: How public intervention can restore market functioning.American Economic Review 102:29–59.
The Financial Crisis of 2007–2009
205