Embed Size (px)
Citation preview
Technical Report 2001-01 ================================================================================================================================================
National Climatic Data Center
The FCC Integrated Surface Hourly Database,A New Resource of Global Climate Data
US Department of CommerceNOAA/ NESDISNational Climatic Data CenterAsheville, NC 28801-5696November, 2001
================================================================================================================================================
1
================================================================================================================================================
National Climatic Data Center Technical Report No. 2001-01
The FCC Integrated Surface Hourly Database,A New Resource of Global Climate Data
Neal Lott, Rich Baldwin, Pete Jones
November 2001(Front cover depicts the location of stations in the database.)
U.S. Dept of CommerceNational Oceanic and Atmospheric AdministrationNational Environmental Satellite Data and Information ServiceNational Climatic Data CenterAsheville, NC 28801-5001
================================================================================================================================================
2
Table of Contents
Introduction 3Background 3
Participating Agencies 3The Problem 4
Development of ISH 4Input Data Sources 4The Process 5Methodology and Milestones 7
Results and Conclusion 8Project Deliverables 8Benefits 9Database Inventory 10Map of WMO Block Locations 11
Acknowledgments 12References 12Appendix A – Processing Details and Design 13
Data Flow Diagrams 14Merge of TD3280 with TD9956 18Merge of TD3280/9956 with TD3240 20Relational Database Structure 21Dataset Dictionary: Format Properties 22The Station History Tables 23The Inventory Tables 23
System Design and Development 23Phases of the Development Process 23Design Phase 24Alpha Phase 24
Beta Phase 24Production Phase 24Configuration Management and Revision Control System 24Directory Structure and File Location 25Shared Object Code Libraries 25The Linked List Library 26The Oralib Library 26
Appendix B – ISH File Format 27Appendix C – ISH Oracle Table Structures 34

3
Introduction
As a result of Environmental Services Data and Information Management (ESDIM) funding, Officeof Global Programs (OGP) funding, and extensive contributions from member agencies in theFederal Climate Complex (FCC), the National Climatic Data Center (NCDC) has completed twophases of the Integrated Surface Hourly (ISH) database project:
1) The “database build” phase, producing ISH version 1 – The new database collects all of theNCDC and Navy surface hourly data (TD3280), NCDC hourly precipitation data (TD3240), and AirForce Datsav3 surface hourly data (TD9956), into one global database. The database totalsapproximately 350 gigabytes, for nearly 20,000 stations, with data from as early as 1900 to present. The building of the database involved extensive research, data format conversions, time-of-observation conversions, and development of extensive metadata to drive the processing andmerging. This included the complex handling of input data stored in three different station-numbering/ID systems.
2) The first phase of quality control, producing ISH version 2 – This includes a) correction of errorsidentified after the “database build” phase (e.g., due to input data file problems); b) research,development, and programming of algorithms to correct random and systematic errors in the data, toimprove the overall quality of the database; and c) data processing of the full period of record archivethrough these quality control algorithms (to be completed by early 2002).
The database has been archived on NCDC’s Hierarchical Data Storage System (HDSS, tape-roboticsystem), and is in the process of being placed on-line. All surface hourly climatic elements are nowstored in one consistent format for the full period of record. The database will be operationallyupdated on a weekly basis for 2001 and beyond.
Surface hourly is the most-used type of climatic data for NOAA customer-servicing and research,involving requests for the hourly data and for applications/products produced from the data. ISH willgreatly simplify servicing and use of the data, in that users will not have to acquire portions of threedatasets with differing formats, and will not have to deal with and program for the inconsistenciesand overlaps between the three input datasets. Also, these accomplishments have created an end-to-end process for routine database updates. Finally, the database is being placed on-line for WWWaccess, and the more recent data are being placed onto a CDROM product.
Background
Participating Agencies
The Federal Climate Complex (FCC) is comprised of the Department of Commerce’s NationalClimatic Data Center (NCDC), and two components of the Department of Defense (DOD)--the AirForce Combat Climatology Center (AFCCC) and the US Navy’s Fleet Numerical Meteorological andOceanographic Command Detachment (FNMOC Det). The FCC provides the nation's climatologicalsupport. The purpose of the FCC is to provide a single location for the long term stewardship of thenation's climatological data, and to provide the opportunity for customers to request anyclimatological data product from a single location.
4
The Problem
Surface-based meteorological data are by far the most-used, most-requested type of climatologicaldata. However, a single integrated database of global hourly meteorological observations did notexist. Researchers requiring surface climatic data often acquired the data from several sources in avariety of formats, greatly complicating the design of their applications and increasing the cost ofusing the data. For example, when someone needed all available surface hourly data for a selectedregion (U.S. or worldwide) and time, they would receive data from three datasets which differed informat, units of storage, and levels of quality control. Alternately, the user would simply choosewhich one of the datasets might be able to meet their requirements, which often resulted inincomplete or inaccurate results. Many users complained about the problems this created in datausage, and in getting complete, accurate results.
An integrated upper air observational database (Comprehensive Aerological Reference Data Set--CARDS) was produced by NCDC to meet similar needs for upper air data. The ISH database ismuch larger in volume than CARDS, and will have an even greater frequency of usage. Additionally, the currently available datasets of monthly resolution (e.g., monthly precipitationtotals) being used for climate change research do not provide the hourly and daily resolution requiredto describe regional climatologies and investigate extreme events, such as a 1-day rainfall eventcausing flash flooding. These monthly datasets also do not usually provide other needed parameterssuch as cloud data, visibility, wind speed, snow depth, etc. Therefore, this project was required toproduce a single, integrated, quality-controlled, complete global climatic database of hourly data, foruse in numerous applications, by private and public researchers, corporations, universities, andgovernment agencies.
Development of ISH
Input Data Sources
The datasets used as input for the ISH database were:
1) NCDC and Navy surface hourly data, referred to as TD3280 (Steurer, Bodosky, 2000). (TD is anold reference to “tape deck.”) - Data Type: ASCII character data.- Quality Control: Undergoes extensive automated and manual quality control.- Data Origin: Mainly from Automated Surface Observing System (ASOS) stations currently, andpreviously from diskettes from the stations along with key-entered data.- Content/Elements: Comprises about 1400 National Weather Service (NWS) and U.S. Navy stations historically,generally for 1948 to present. About 380 stations currently active. Includes most surface elements observed in the U.S. (wind speed and direction, temperature, dewpoint, cloud data, sea level pressure, altimeter setting, station pressure, present weather, andvisibility). Wind gust, precipitation amount, and snow depth are not included. "Specials" are not included and only synoptic hours (every 3rd hour) are included for 1965-1981(for most stations).
5
2) AFCCC Datsav3 surface hourly data, referred to as TD9956 (AFCCC, 1998).- Data Type: ASCII character data.- Quality Control: Extensive automated quality control; plus manual quality control for USAFstations.- Data Origin: Mainly from Global Telecommunication System, various other sources, and keyeddata prior to 1973. The keyed data include over 100 “tapedecks” which were laboriously convertedto Datsav3 format by AFCCC, thus providing a great deal of data prior to 1973 for a number ofinternational stations.- Content/Elements: Comprises about 20,000 global stations historically, with many stations for 1973 to present, andsome as far back as 1900. About 10,000 stations currently active. Includes all elements mentioned above for TD3280, along with wind gust, precipitation amount,snow depth, and other elements as reported by each station. Also includes "Specials." Observational practices vary by country.
3) NCDC hourly precipitation data, referred to as TD3240 (Steurer, Hammer, 2000).- Data Type: ASCII character data.- Quality Control: Undergoes automated and manual quality control.- Data Origin: Various sources including ASOS and weighing rain gage data from stations.- Content/Elements: Hour-by-hour precipitation amounts. Includes NWS stations and various cooperative observing sites. About 2800 stations currently active, with data generally for 1948 to present. ISH includes TD3240 stations which also have data available in either TD9956 or TD3280.
These three datasets were the most logical starting point for ISH, as they were the most-used hourlydatasets available, and have also been subjected to considerable quality control and have adequatestation history information available. If funding permits, other datasets and data sources will beadded to ISH in the future.
The Process
All necessary metadata within the FCC were collected, coordinated, and loaded into a set ofrelational database tables. NCDC uses Oracle for this requirement. The metadata includes importantinformation about the data such as station histories, dataset documentation, and inventories; alongwith critical information to control the process of merging the data. Since the three input datasources are archived in dissimilar station numbering/identification systems, the metadata mustprovide a cross-reference to identify data for the same location (i.e., same station with data in each ofthe three input datasets). This station history then controls the overall process flow and data merging,and also must account for station number changes over time.
A time conversion control file was used to convert the TD3280 and TD3240 data to Greenwich MeanTime (GMT), so that all input data were then in GMT time convention. The ISH data are therefore inthe same time convention as CARDS upper air and many other global databases, model output,
6
satellite data, etc. This is quite important for potential GIS applications. The creation of this timeconversion control file was very cumbersome, involving research of several sources of informationconcerning time zones, time zone changes historically, etc. We had to account for time zone changesto properly merge the data.
We included a quality control check for TD9956 vs. TD3280 to ensure that the data were actually forthe same location at the same time before performing the intra-observational merge, which creates acomposite observation for that date-time. The quality control check was conducted on a daily basis(i.e., on each day’s data) to determine if the data for that day should actually be merged intocomposite observations. Temperature, dew point, and wind direction were compared for each datavalue (e.g., temperature at a given station-date-time in TD9956 vs. temperature at same station-date-time in TD3280) to obtain a percent score for the day for coincident data. Criteria of 1-degreeCelsius for temperature and dew point, and 10 degrees for wind direction were used as the pass/faillimits for each element, with an overall 80% score for the day required to perform the intra-observational merge for that day. In other words, 80% of the data values compared would have tomeet the limit checks to “pass” for the day. Failure of these checks sometimes pointed to timeconversion problems, updates to the control file, and re-processing of those stations. Subjectiveanalysis of the data before and after processing proved this quality control check and the limitsapplied to be quite effective.
Procedures, algorithms, and then computer programs were written to merge the surface hourlydatasets into one common database. More than one billion surface weather observations (covering1900 to present) for approximately 20,000 global locations were accessed and merged during thisprocess. Examples of input data types were: Automated Surface Observing System (ASOS),Automated Weather Observing System (AWOS), Synoptic, Airways, Metar, Coastal Marine (C-MAN), Buoy, and various others. Both military (e.g., USAF, Navy, etc.) and civilian stations,automated and manual observations, are included in the database.
The final version 1 database (see Lott, 2000) includes all observed elements at hourly intervals (everythree hours for some stations), such as temperature, dew point, visibility, wind speed and direction,wind gust, cloud data, precipitation, snow depth, and many others. The database and subsequentproducts are available to all three organizations to support the FCC mission and its numerouscustomers.
To develop the version 2 database, we researched, developed, programmed, and processed the datathrough 54 quality control (QC) algorithms. This phase of quality control subjects each observationto a series of validity checks, extreme value checks, internal (within observation) consistency checks,and external (versus another observation for the same station) continuity checks. Therefore, it maybe referred to as an inter/intra-observational quality control, and is entirely automated during theprocessing stage. However, it does not include any spatial quality control (“buddy” checks withnearby stations), which is planned for later development.
An example of just one of the algorithms performed is the continuity check for temperature, whichdoes a “two-sided” continuity validation on each temperature value for periods ranging from 1 hourto 24 hours. An increase in the temperature of 8 degrees Celsius in one hour (e.g., from 10 C to 18C) prompts a check on the next available (i.e., next reported) temperature–if that value then decreasesby at least 8 degrees in an hour (e.g., 18 C to 9 C), then that indicates a very improbable “spike” in
7
the data, and the erroneous value (e.g., 18 C) is changed to indicate “missing” for that observation. However, the original value is saved in a separate section of the data record for future use if needed. The same would apply for a downward “spike” in the data, and similar checks are performed forperiods out to 24 hours, to allow for missing data and for part-time stations which do not reporthourly or three-hourly data. The validation always checks the closest values available temporally(i.e., before and after the data point being checked), and the limit is automatically adjusted based onthe elapsed time between values.
In addition, a selected number of systematic deficiencies are addressed with specific algorithms tocorrect those problems. Though all climatic elements are checked to some extent, the main elementsvalidated are: wind data, temperature and dew point data, pressure data, cloud data, visibility andpresent weather data, precipitation amounts, snowfall and snow depth. As mentioned above, theinput datasets had already been subjected to a great deal of quality control, so this additional qualitycontrol was designed to address problems which were less likely to have already been corrected. Detailed documentation on each of these QC algorithms is available (Lott, 2001).
See Appendix A for further details on the database design and processing.
Methodology and Milestones
Often, when creating a software system, there are numerous approaches that can be used. However,there are often specific reasons to go one route as opposed to another. Such is the case with the ISHpopulation and management system.
When looking at a consolidated dataset that is to be accessed later from a relational database, and isthe amalgamation of three datasets, the first idea is to consider doing the bulk of the work within thecontext of the Oracle database vs. performing the merging and preparation work beforehand. Thelatter approach was chosen due to the limited disk storage resources available to store all three parentdatasets in Oracle. So the bulk of the prep work was done using Fortran and C programs.
Another historical note of interest is the number of people that worked on the system. During thecourse of several years there was a team effort of contractors and government employees working onthe task. The responsibility for the contractors has been primarily the actual programming while thegovernment employees, while doing some programming, have been primarily involved in testing theresults. As is true with many software projects, the code evolved with time, and as necessary, work-arounds were developed to fix source code when problems developed.
Toward the end of the development phase, the original workstation for development and testing wasreplaced with a newer 64-bit workstation. Although the change should have been transparent to theISH system, it was not. Many problems began to appear with code that had been working before thechange. After much research, no cause could be identified, although evidence seemed to point to asystem memory utilization problem. In any case, some work-arounds were put into place in order forsome of the components to start working again.
One of the goals for ISH is to have the entire dataset available for query via the NNDC Climate DataOnline (CDO) system (Lott, Anders, 2000). With the difficult and tedious task of blending the datafrom the three sources completed, end-users may then extract what is needed with relative ease and
8
can focus on their research or studies, rather than getting bogged down in the merging process. Asecond goal is to continue to add to and improve this global baseline database for research andapplications requiring data of this type, by adding additional datasets (i.e., merge into ISH), anddeveloping/applying more extensive quality control checks.
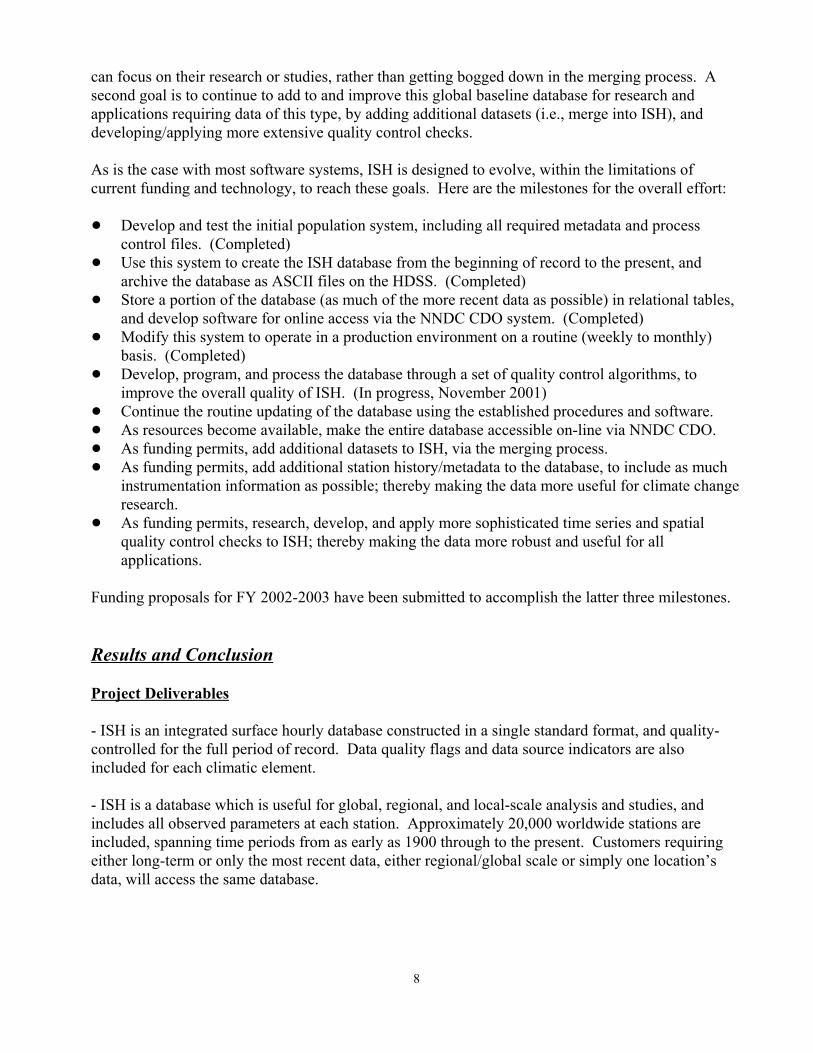
As is the case with most software systems, ISH is designed to evolve, within the limitations ofcurrent funding and technology, to reach these goals. Here are the milestones for the overall effort:
! Develop and test the initial population system, including all required metadata and processcontrol files. (Completed)
! Use this system to create the ISH database from the beginning of record to the present, andarchive the database as ASCII files on the HDSS. (Completed)
! Store a portion of the database (as much of the more recent data as possible) in relational tables,and develop software for online access via the NNDC CDO system. (Completed)
! Modify this system to operate in a production environment on a routine (weekly to monthly)basis. (Completed)
! Develop, program, and process the database through a set of quality control algorithms, toimprove the overall quality of ISH. (In progress, November 2001)
! Continue the routine updating of the database using the established procedures and software.! As resources become available, make the entire database accessible on-line via NNDC CDO.! As funding permits, add additional datasets to ISH, via the merging process.! As funding permits, add additional station history/metadata to the database, to include as much
instrumentation information as possible; thereby making the data more useful for climate changeresearch.
! As funding permits, research, develop, and apply more sophisticated time series and spatialquality control checks to ISH; thereby making the data more robust and useful for allapplications.
Funding proposals for FY 2002-2003 have been submitted to accomplish the latter three milestones.
Results and Conclusion
Project Deliverables
- ISH is an integrated surface hourly database constructed in a single standard format, and quality-controlled for the full period of record. Data quality flags and data source indicators are alsoincluded for each climatic element.
- ISH is a database which is useful for global, regional, and local-scale analysis and studies, andincludes all observed parameters at each station. Approximately 20,000 worldwide stations areincluded, spanning time periods from as early as 1900 through to the present. Customers requiringeither long-term or only the most recent data, either regional/global scale or simply one location’sdata, will access the same database.

9
- The overall system includes a complete on-line (WWW) inventory of the database for users toquery, an on-line browse system for customers to browse and become familiar with the data, anddirect on-line access to selected data from the integrated database.
Benefits
- The new, integrated database is a global baseline database and the first of its kind, and can be usedby both U.S. and global customers.
- This effort contributes to the ESDIM goal of improving access for users. Researchers will beserviced more quickly and in a much more efficient manner at a lower cost to the FCC agencies (ascompared to the personnel resources now required to access multiple datasets for customers). This inturn will reduce the overall operating costs to the government and the access and development costsfor the users of the data.
- ISH provides a common data format for development of FCC applications software, for NOAANational Data Center applications, and for all researchers and users of the data to develop applicationprograms easily and efficiently. Also, the database contains daily parameters (e.g.,maximum/minimum temperature, daily precipitation) which can be used to generate daily summaries.
- The data can be used in important national and international research programs such as the WorldClimate Program; the US Weather Research Program; the Global Energy and Water ExchangeProgram; the International Geosphere Biosphere Program core projects in water, land, ocean, andbiosphere; and NOAA's Office of Global Programs Climate and Global Change Program. Numerousenvironmental studies, coastal zone research, climatic extremes research, and blending with otherdata types (e.g., satellite, NEXRAD data) will utilize the integrated database.
- This integrated database will be coordinated with and integrated into the goals and objectives of theNational Environmental Data Index (NEDI), the NESDIS Virtual Data System (NVDS), theIntergovernmental Panel on Climate Change (IPCC), as well as other Climate and Global Changeinitiatives. The FCC agencies will continue to append to the database with future datastreams,thereby allowing for continued growth of the database into future years.

10
Database Inventory
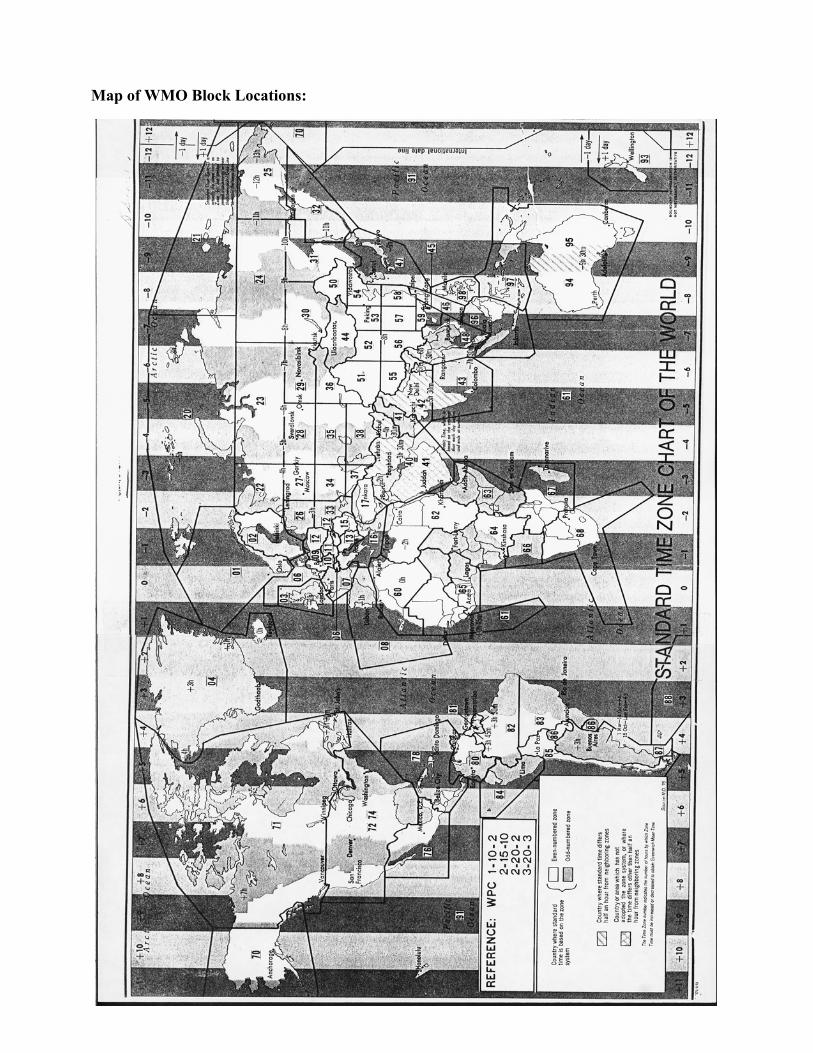
The following table provides an inventory by WMO block of the number of stations in the ISHdatabase having at least one year of data. See the map on next page for WMO block locations.
WMO Bk Stations WMO Bk Stations WMO Bk Stations WMO Bk Stations 01 297 30 230 58 189 88 36 02 413 31 227 59 149 89 124 03 593 32 102 60 193 91 234 04 105 33 190 61 128 92 12 06 275 34 170 62 125 93 82 07 297 35 143 63 143 94 622 08 165 36 130 64 155 95 163 09 74 37 208 65 123 96 92 10 491 38 202 66 30 97 67 11 226 40 356 67 186 98 85 12 219 41 202 68 270 99 334 13 153 42 225 69 548 14 71 43 151 70 223 15 322 44 100 71 1085 16 280 45 13 72 2113 17 122 46 60 74 700 20 59 47 521 76 261 21 58 48 350 78 244 22 180 50 52 80 130 23 177 51 68 81 27 24 116 52 107 82 144 25 99 53 118 83 290 26 220 54 178 84 101 27 147 55 22 85 163 28 237 56 163 86 57 29 178 57 243 87 183
11
Map of WMO Block Locations:
12
Acknowledgments
There were many people who contributed to this project’s success. The key members of the teamwere: Rich Baldwin, NCDC; Vickie Wright, NCDC; Dee Dee Anders, NCDC; Danny Brinegar,NCDC; Neal Lott, NCDC; Pete Jones, Marada Corporation; and Fred Smith, Marada Corporation. As mentioned previously, the Air Force (AFCCC) and Navy (FNMOC Det) contributed to the effort. Of particular note is Bob Boreman (NCDC) who devoted a great deal of time and effort to ISH,especially in the research and development of the time conversion control file. Bob passed away inJuly 2001 and will be greatly missed.
References
AFCCC. Documentation for Datsav3 Surface Hourly Data. [Asheville, N.C.]: Air Force CombatClimatology Center, 1998.
Lott, Neal. Quality Control of USAF Datsav3 Surface Hourly Data–Versions 7 and 8. [Asheville,N.C.]: USAF Environmental Technical Applications Center, 1991.
Lott, Neal. Data Documentation for Federal Climate Complex Integrated Surface Hourly Data. [Asheville, N.C.]: National Climatic Data Center, 2000.
Lott, Neal. Quality Control Documentation for Federal Climate Complex Integrated Surface HourlyData. [Asheville, N.C.]: National Climatic Data Center, 2001.
Lott, Neal and Dee Dee Anders. NNDC Climate Data Online for Use in Research, Applications, andEducation. Twelfth Conference on Applied Climatology. Pages 36-39. American MeteorologicalSociety, May 8-11, 2000, Asheville, NC.
Plantico, Marc and J. Neal Lott. Foreign Weather Data Servicing at NCDC. ASHRAE Transactions1995, V. 101, Pt 1.
Steurer, Pete and Matt Bodosky. Data Documentation for Surface Hourly Airways Data, TD3280. [Asheville, N.C.]: National Climatic Data Center, 2000.
Steurer, Pete and Greg Hammer. Data Documentation for Hourly Precipitation Data, TD3240. [Asheville, N.C.]: National Climatic Data Center, 2000.
13
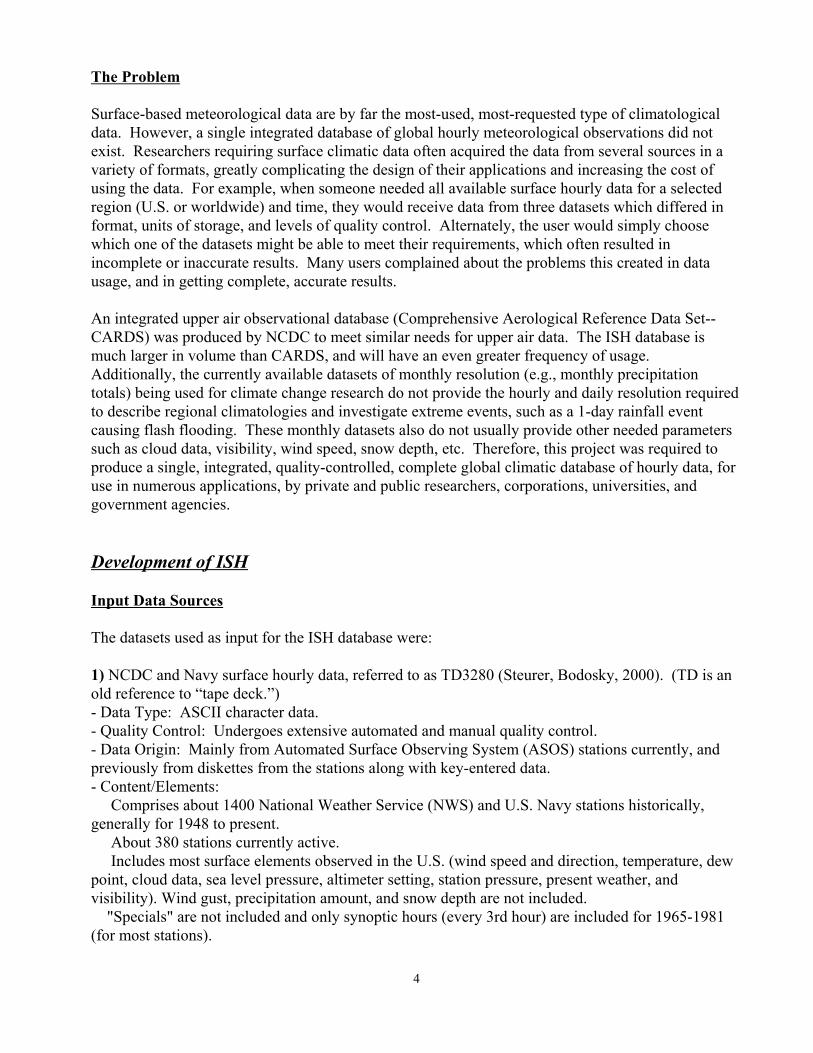
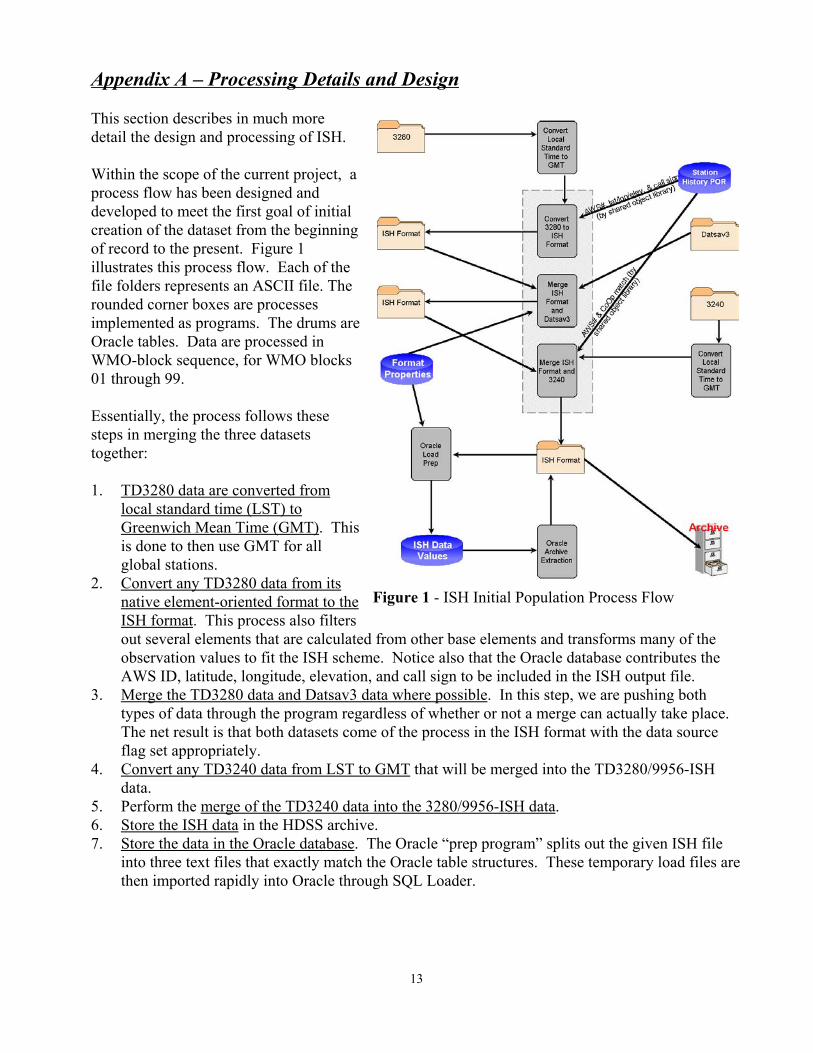
Figure 1 - ISH Initial Population Process Flow
Appendix A – Processing Details and Design
This section describes in much moredetail the design and processing of ISH.
Within the scope of the current project, aprocess flow has been designed anddeveloped to meet the first goal of initialcreation of the dataset from the beginningof record to the present. Figure 1illustrates this process flow. Each of thefile folders represents an ASCII file. Therounded corner boxes are processesimplemented as programs. The drums areOracle tables. Data are processed inWMO-block sequence, for WMO blocks01 through 99.
Essentially, the process follows thesesteps in merging the three datasetstogether:
1. TD3280 data are converted fromlocal standard time (LST) toGreenwich Mean Time (GMT). Thisis done to then use GMT for allglobal stations.
2. Convert any TD3280 data from itsnative element-oriented format to theISH format. This process also filtersout several elements that are calculated from other base elements and transforms many of theobservation values to fit the ISH scheme. Notice also that the Oracle database contributes theAWS ID, latitude, longitude, elevation, and call sign to be included in the ISH output file.
3. Merge the TD3280 data and Datsav3 data where possible. In this step, we are pushing bothtypes of data through the program regardless of whether or not a merge can actually take place. The net result is that both datasets come of the process in the ISH format with the data sourceflag set appropriately.
4. Convert any TD3240 data from LST to GMT that will be merged into the TD3280/9956-ISHdata.
5. Perform the merge of the TD3240 data into the 3280/9956-ISH data.6. Store the ISH data in the HDSS archive.7. Store the data in the Oracle database. The Oracle “prep program” splits out the given ISH file
into three text files that exactly match the Oracle table structures. These temporary load files arethen imported rapidly into Oracle through SQL Loader.
14
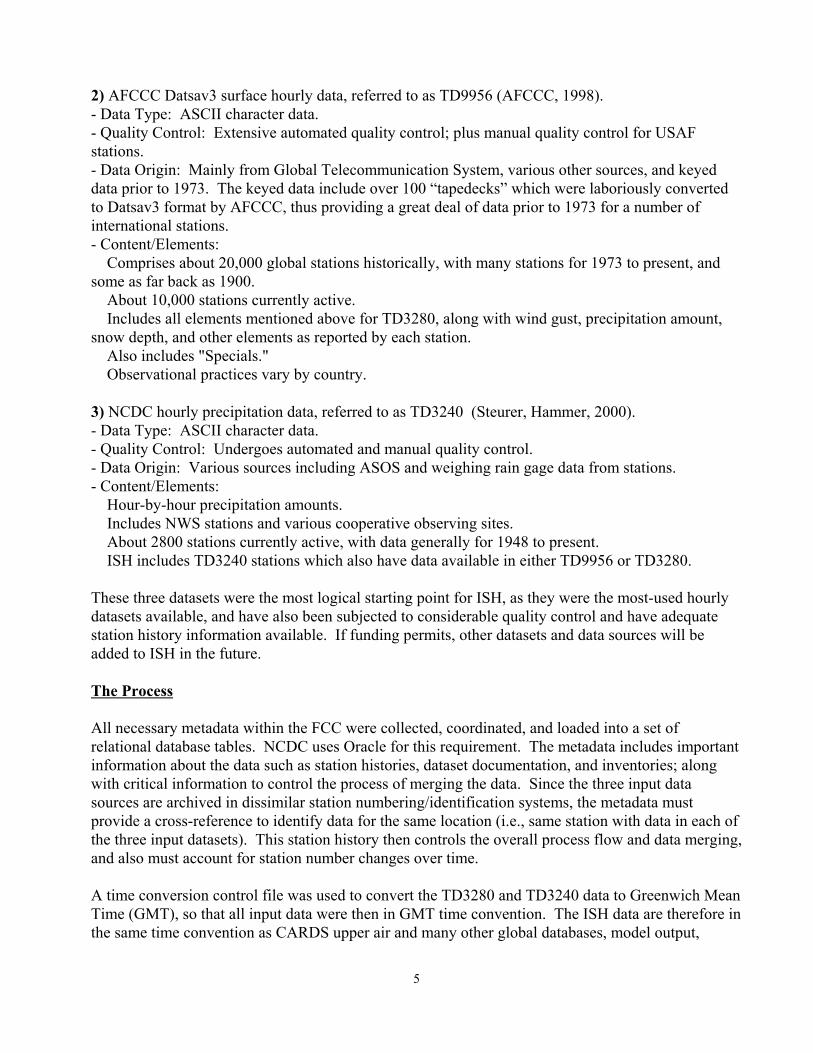
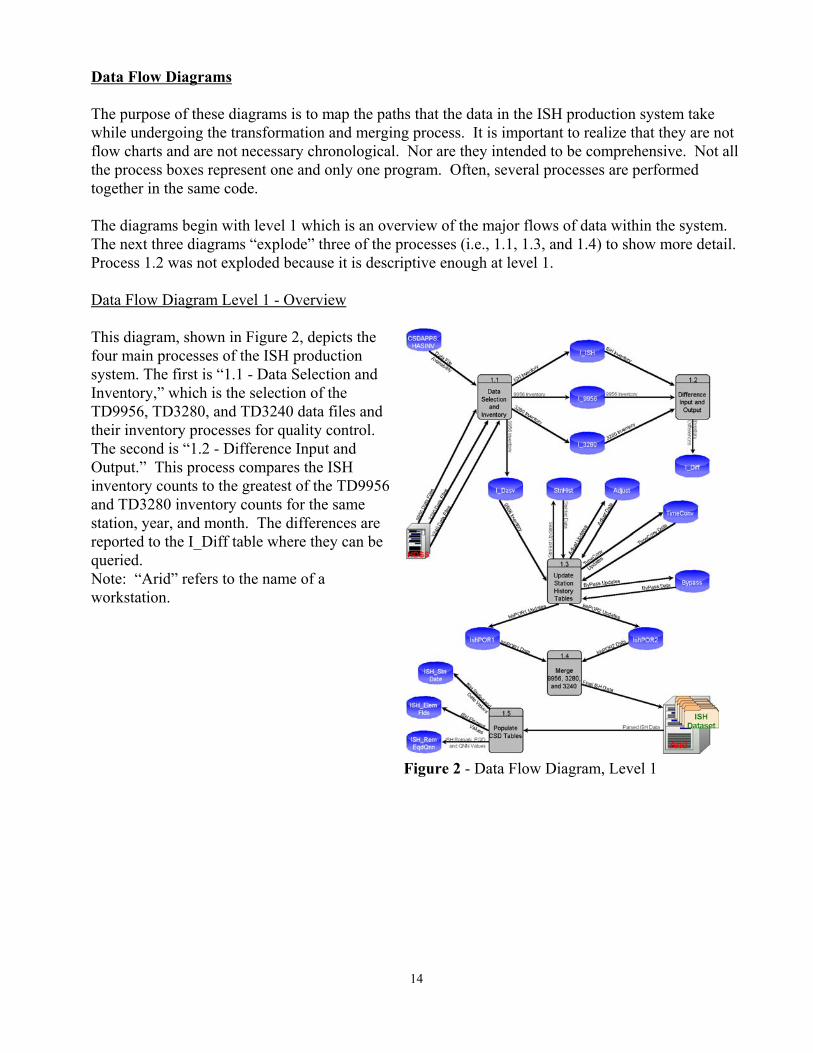
Figure 2 - Data Flow Diagram, Level 1
Data Flow Diagrams
The purpose of these diagrams is to map the paths that the data in the ISH production system takewhile undergoing the transformation and merging process. It is important to realize that they are notflow charts and are not necessary chronological. Nor are they intended to be comprehensive. Not allthe process boxes represent one and only one program. Often, several processes are performedtogether in the same code.
The diagrams begin with level 1 which is an overview of the major flows of data within the system. The next three diagrams “explode” three of the processes (i.e., 1.1, 1.3, and 1.4) to show more detail. Process 1.2 was not exploded because it is descriptive enough at level 1.
Data Flow Diagram Level 1 - Overview
This diagram, shown in Figure 2, depicts thefour main processes of the ISH productionsystem. The first is “1.1 - Data Selection andInventory,” which is the selection of theTD9956, TD3280, and TD3240 data files andtheir inventory processes for quality control. The second is “1.2 - Difference Input andOutput.” This process compares the ISHinventory counts to the greatest of the TD9956and TD3280 inventory counts for the samestation, year, and month. The differences arereported to the I_Diff table where they can bequeried.Note: “Arid” refers to the name of aworkstation.

15
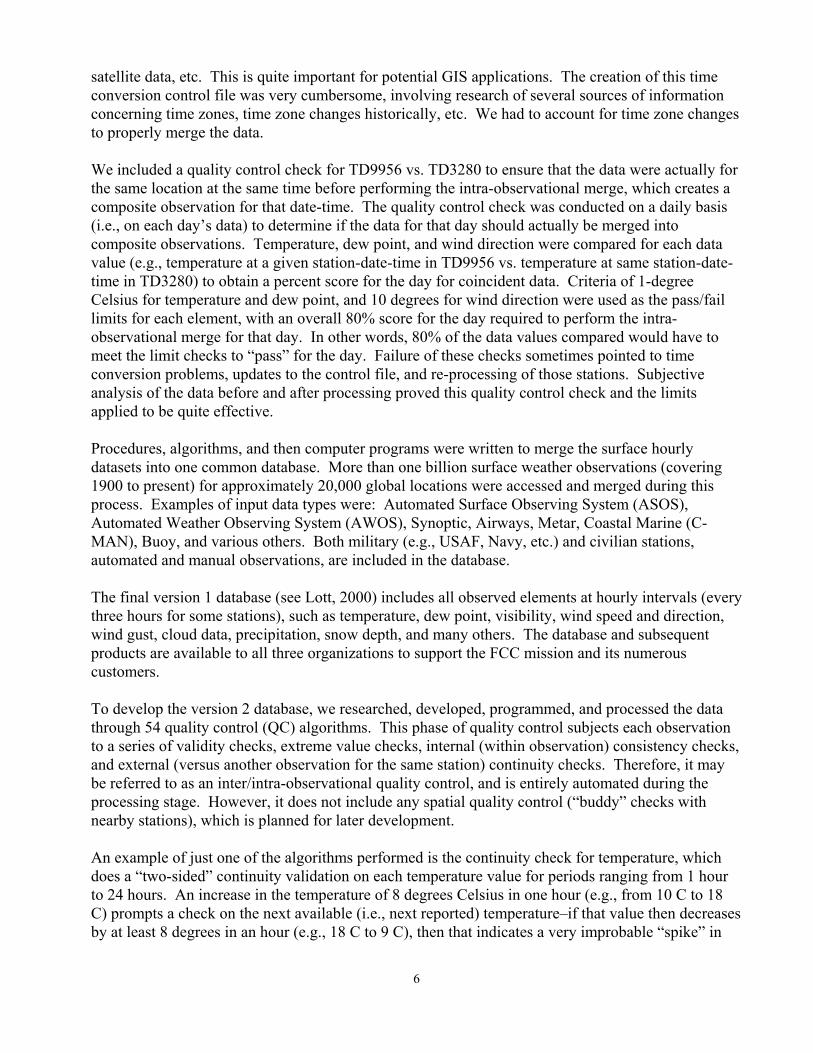
Figure 3 - Data Flow Diagram, Level 1.1 - DataSelection and Inventory
Data Flow Diagram Level 1.1 - DataSelection and Inventory
This diagram, shown in Figure 3, outlines theflow of data from the various components ofthe data selection and inventory process. Essentially, this is the code that the useremploys to bring the desired TD3240,TD3280, and TD9956 data files to theworkstation for conversion, merging, andinventory. If the requested files are alreadyavailable, then it checks for date differencesto determine if what’s already available is thelatest/best data to use. If not, the newest datafiles are transferred for processing.
The inventory component is run inconjunction with the merging processes toprovide primarily two things. First, they areused to be sure that after the transformations,eliminations, merging, and repackaging ofthe conversion and merging programs arefinished, that none of the essential datavalues have been lost. Second, theinventories can be used to provide athumbnail sketch of the dataset for users to quickly identify what is available.
16
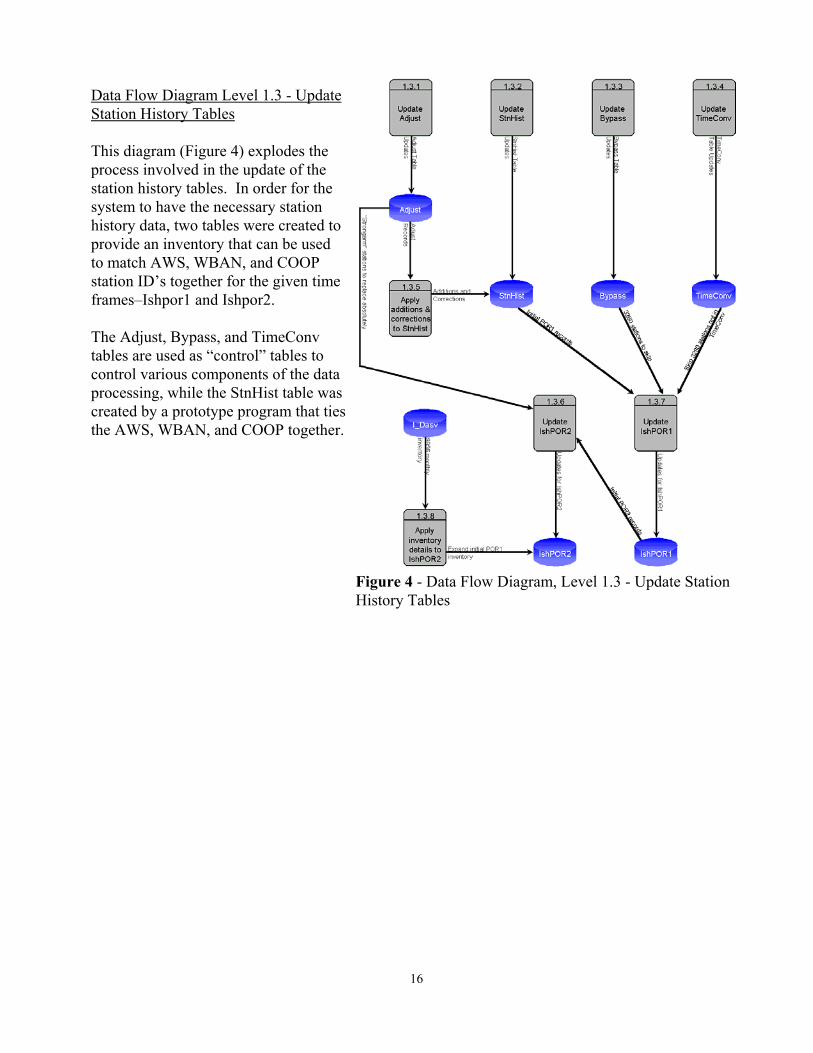
Figure 4 - Data Flow Diagram, Level 1.3 - Update StationHistory Tables
Data Flow Diagram Level 1.3 - UpdateStation History Tables
This diagram (Figure 4) explodes theprocess involved in the update of thestation history tables. In order for thesystem to have the necessary stationhistory data, two tables were created toprovide an inventory that can be usedto match AWS, WBAN, and COOPstation ID’s together for the given timeframes–Ishpor1 and Ishpor2.
The Adjust, Bypass, and TimeConvtables are used as “control” tables tocontrol various components of the dataprocessing, while the StnHist table wascreated by a prototype program that tiesthe AWS, WBAN, and COOP together.

17
Figure 5 - Data Flow Diagram, Level 1.4 - Merge of 9956, 3280,and 3240 Datasets
Data Flow Diagram Level 1.4 - Merge TD9956, 3280, and 3240
This final data flow diagramshows the data flows that passbetween the various pieces of themerging process. Note that thefile-level merge control (process1.4.2) is implemented as a Perlscript to call the other programs asneeded based on the requesteddata to be merged. The IshPOR1& IshPOR2 tables supply stationdata and the data necessary tomatch the TD3280, TD3240, andTD9956 data on a record byrecord basis.
Notice also that there are twolevels to the merge: file andrecord. At the file level, a broaddecision is reached as to whichTD3280 and TD3240 files areavailable to select to blend withthe requested TD9956 data. Atthe record level, the latestcandidate TD3280 and TD3240files have already been pulledfrom the HDSS and the decisionlevel is narrowed down to eachrecord (actually, each element ineach record) where availableTD3280 data generally takepriority over the same TD9956data for the same station at thesame date.

18
StartRead
Record from Datsav3 File
Datsav3 EOF?
Set data source flag = 5 and finish processing
3280/ISH file
3280/ISH EOF?
Set data source flag = 4 and finish processing Datsav3 file
Stop
Hourly type and min = 00, 50-59?
Read record from
3280/ISH file
Set data source flag = 4 and write
Datsav3 record to file for current
station
Are date/times equal?
Pass element checks?
Does Datsav3 time fit within 50-59
window?
Is 3280/ISH time later than Datsav3
time?
Set data source flag
= 2 and write 3280/ISH
record to file for current
station
Merge obs into ISH format, favoring
3280 over Datsav3.
Find Datsav3 record
closest to time in
3280/ISH record
Set data source flag = 1 and write
Datsav3/ISH record to file for current
station
Set data source flag = 4 and write
Datsav3/ISH record to file for current
station
Set data source flag = 5 and write 3280/ISH
record to file for current
station
Set data source flag
= 3 and write ISH record to file for current station
A
Are stations equal?
Set data source flag
= 4 and write out any prior
Datasv3 records
Datsav3 stn id < 3280 stn id?
Set data source flag = 4
and write remaining Datsav3
records for current station
Set data source flag = 5
and write remaining 3280/ISH
records for current station
B
B
A
Yes
No
No Yes Yes
No
No Yes
NoYes
Yes
Yes
No
No
Yes
NoYes
No
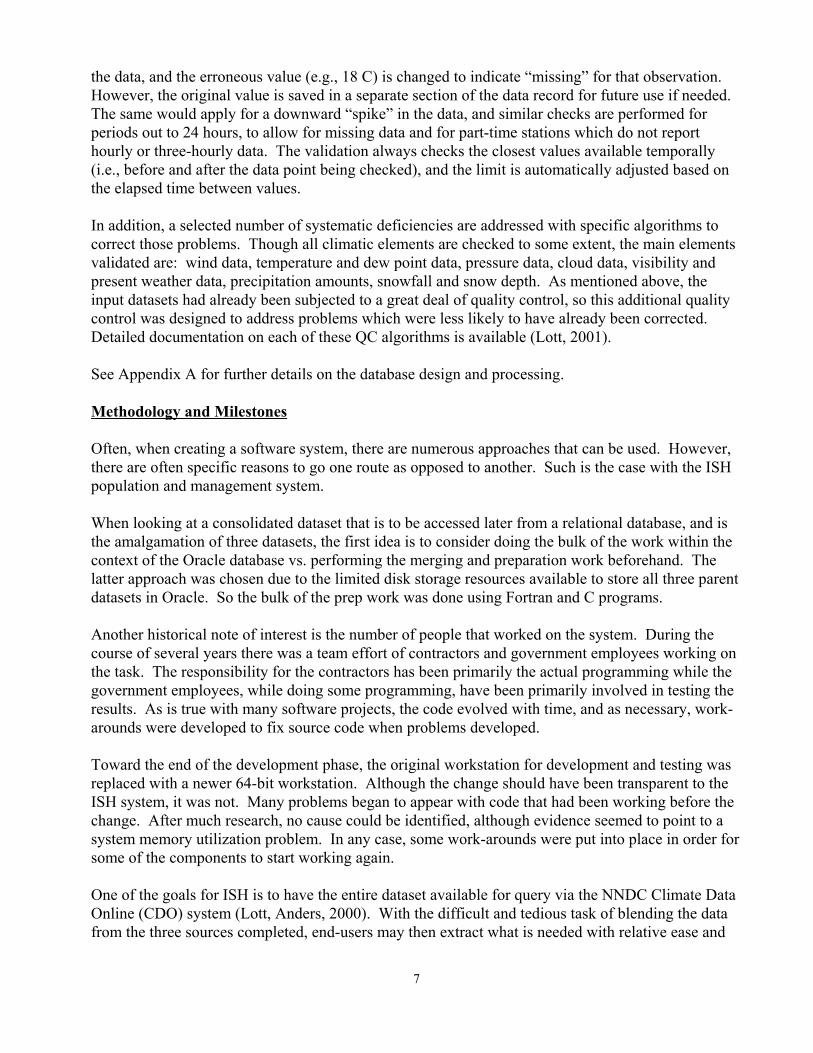
Figure 6 - General merge logic flowchart for TD3280 and TD9956.
Merge of TD3280 (ISH Format) with TD9956 (Datsav3 Format)
! Initialization! Reads and process command line input, trap any associated errors.! Opens input and output files, traps errors.! Call the daily merge routine for merging data by day.! Load include files (nodes.h, state.h, record.h, element.h, rules.h).! Build a linked list containing information from ISHPOR2 table.! Set processing state variables.
! Processing! Process TD9956 data.
! Check of input TD9956 file unit is made and state variables set.! Read TD9956 data record and store in element data structures.! Blank lines are trapped and any data stored in prior records is written out.! State variables are set to control conditions for TD9956 input.
19
! Date and time variables and AWS and WBAN station identifiers are set.! Checks for specials and hourly type records (00 min or 50-59 min) are
performed.! Specials and non-hourly records are written out with source code 4.! Processing continues by returning to item (1a) above to prepare to read another
TD9956 record.! Process TD3280 data
! File unit conditions are checked and state variables set for the TD3280 (ISH).! Read TD3280 data record into a element data structure.! Blank lines are skipped in the TD3280 file.
! Merging! Comparison of AWS station identifiers from the TD9956 and TD3280. Check
for various station/date ordering conditions, reset invalid station identifiers(999999), reset state variables, synchronize station identifiers by writing outrecords and linked-list buffers.
! Comparison of current record date versus current processing date.! Records with matching dates are added to linked-lists for the current
processing date (00 hours and 50-59 minute).! Records not matching the current processing date signify a new day or
data gap. Continue merge process evaluation; set state variables.! Compute merge criteria values for temperature, dew point and wind direction.
! If the merge criteria pass set percentage, then merge all records in eachof the TD3280 and TD9956 data linked lists. Write out records withsource code 3.
! If the merge criteria fails, the TD9956 record will have a source code of1 and the TD3280 record will have a source code of 2. If there is nomatching observation for either the TD3280 or TD9956 record, thenthe TD9956 record is written with a source code of 4 and the TD3280record is written out with a source code of 5. (Note: all ADD elementsare sorted before each record is written.)
! Special merging conditions.! The TD9956 data is used to fill in any missing data in the TD3280
record.! Retain TD9956 and TD3280 element MWn information.! Retain TD9956 and TD3280 EQD information.
! Reset state variables before reading additional records. Read from appropriatefile units as dictated by state variables.
! Cleanup! Reset linked-list and other variables to null after each day processed.! When TD9956 EOF mark is reached, merge and flush linked-list buffers.! Write out sorted element records and reset state variables.! Complete TD3280 file if necessary.

20
Merge of TD3280/9956 (ISH Format) with TD3240
! Initialization! Reads and process command line input, trap any associated errors.! Open input and output files, trap errors.! Call the merge routine for processing passing the I/O units! Load the include files.! Build a linked-list from the decompressed TD3240 data file for start and stop ranges.! Remove observations which have flags indicating erroneous data.! Set processing state variables.
! Processing! Process TD9956/3280 ISH formatted data
! Check the condition of the file unit and state variables.! Read the1st record into element data structure (same as w/ the TD9956/3280
merge program.! Date and time variables are set.! Checks for specials and hourly type records (00 min or 50-59 min) are
performed.! Write specials out with source code 4.! File unit conditions are checked and state variables set for the TD3240 data in
ISH format.! Process TD3240 data
! Pop 1st node from TD3240 linked-list.! Check state variables, date and time in the event the new record is a time
duplicate of the prior record (source code 1 or 2). Use source code 2.! Merging
! Comparison of station identifiers! Test station identifier equality. Throw an error if not true.! Function in place to fetch coop identifier from ISHPOR1! Checks station ordering conditions for synchronization
! Continued processing for equality of date and time.! Add TD3240 information to (00 and 50-59 minute) ISH records.! Increment precipitation elements.! Insure all elements are sorted before written.! Write out data in the 50-59 linked-list not merged with TD3240 data.
! Trap from data gaps and duplicate time records (1 or 2 source code)! Cleanup.
! Reset variables to null after each day processed! When 9956/3280(ISH) EOF is reached write all buffers.
21
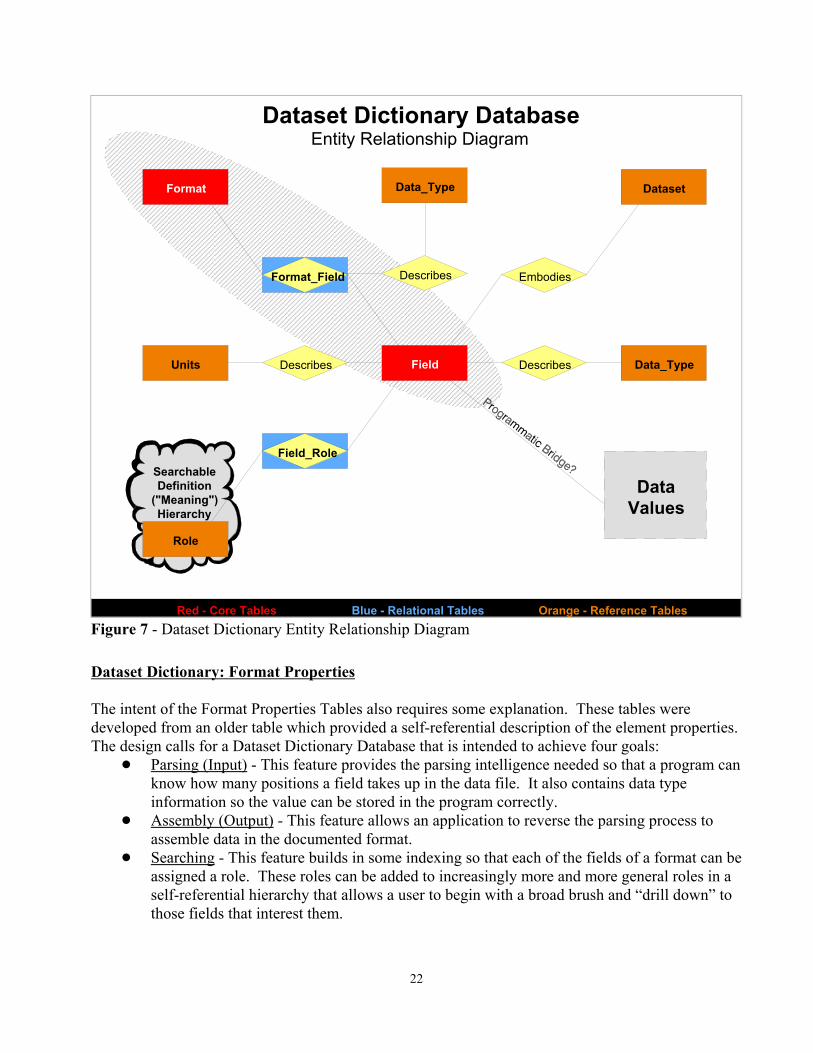
Relational Database Structure
The ISH relational database contains more than just the tables needed to make the dataset availableon-line. It also stores some support tables that provide station history, format properties, andinventory data. In fact, there are four groups of tables:
! Format Properties Tables - These are Field, Format, and Format_Field. The purpose ofthese tables is to provide formatting properties such as data type, length, default missingvalue, etc., to programs needing to parse or assemble data in the ISH format.
! ISH Data Tables - These three tables, ISH_StnDate, ISH_ElemFlds, and ISH_RemEqdQnn,store the actual ISH data that is to be available to users of the CDO system.
! Inventory Tables - There are a number of tables that store various parts of the ISHinventory. They are: I_3280, I_9956, I_Dasv, I_Diff, I_ISH, and I_IshElem.
! Station History POR Tables - These tables, Adjust, Bypass, IshPOR1, IshPOR2, StnHist,and TimeConv provide the necessary station history information needed to supply location,time-frame, and matching information to various components of the system.
The design of the relational (Oracle) database changed and grew over the course of the developmenteffort. To that end, the three core data tables, ISH_StnDate, ISH_ElemFlds, and ISH_RemEqdQnn,are structured in an attempt to balance the rules of normalization with some denormalization in orderto save space and to facilitate partitioning.
22
������������������������������������������������������������������������������������������������������������������������������������������������������������������������������������������������������������������������������������������������������������������������������������������������������������������������������������������������������������������������������������������������������������������������������������������������������������������������������������������������������������������������������������������������������������������������������������������������������������������������������������������������������������������������������������������������������������������������������������������������������������������������������������������������������������������������������������������������������������������������������������������������������������������������������������������������������������������������������������������������������������������������������������������������������������������������������������������������������������������������������������������������������������������������������������������������������������������������������������������������������������������������������������������������������������������������������������������������������������������������������������������������������������������������������������������������������������������������������������������������������������������������������������������������������������������������������������������������������������������������������������������������������������������������������������������������������������������������������������������������������������������������������������������������������������������������������������������������������������������������������������������������������������������������������������������������������������������������������������������������������������������������������������������������������������������������������������������������������������������������������������������������������������������������������������������������������������������������������������������������������������������������������������������������������������������������������������������������������������������������������������������������������������������������������������������������������������������������������������������������������������������������������������������������������������������������������������������������������������������������������������������������������������������������������������������������������������������������������������������������������������������������������������������������������������������������������������������������������������������������������������������������������������������������������������������������������������������������������������������������������������������������������������������������������������������������������������
Dataset Dictionary DatabaseEntity Relationship Diagram
Orange - Reference TablesRed - Core Tables Blue - Relational Tables
Field
Format
Format_Field
Units Data_TypeDescribesDescribes
Searchable Definition
("Meaning") Hierarchy
Embodies
Dataset
Role
Field_Role
Data Values
Data_Type
Describes
Figure 7 - Dataset Dictionary Entity Relationship Diagram
Dataset Dictionary: Format Properties
The intent of the Format Properties Tables also requires some explanation. These tables weredeveloped from an older table which provided a self-referential description of the element properties. The design calls for a Dataset Dictionary Database that is intended to achieve four goals:
! Parsing (Input) - This feature provides the parsing intelligence needed so that a program canknow how many positions a field takes up in the data file. It also contains data typeinformation so the value can be stored in the program correctly.
! Assembly (Output) - This feature allows an application to reverse the parsing process toassemble data in the documented format.
! Searching - This feature builds in some indexing so that each of the fields of a format can beassigned a role. These roles can be added to increasingly more and more general roles in aself-referential hierarchy that allows a user to begin with a broad brush and “drill down” tothose fields that interest them.
23
! Documenting - This feature attaches long names and text descriptions to the fields so that aformat can be documented right out of the database.
If the database were to be normalized completely, it would call for separate tables for each of theelements with keys to the ISH_StnDate table. However, this makes any SELECT statementspotentially quite long and juggling that many tables can be confusing. So all the elements are storedin the ISH_ElemFlds table with a sequence number primary key to hold it all together. See AppendixB for details on the elements contained within the database, and the ASCII file structure prior toloading into Oracle.
The ISH_RemEqdQnn table holds the remarks, EQD, and QNN sections, respectively. Thesesections are not split out into individual fields, but are kept intact for further parsing later, if desired. There is a one to one relationship between an entry in ISH_StnHist and in ISH_RemEqdQnn. Thereason for this is to save space since not all ISH records will have these sections.
The Year column is repeated in all three tables so that they can be partitioned. This improves queryperformance and allows part of each of the tables to be taken “off-line” by year for loading or repairwhile the rest of the tables are available for use.
The Station History Tables
The core station history tables IshPOR1 and IshPOR2 are the ones used to add missing station datasuch as lat/lon/elev, call signs, etc. They are also used to match station ID’s so that the correct AWSstation ID can be paired up with the correct WBAN and COOP stations for the same time period. The Adjust, Bypass, StnHist, and TimeConv tables contribute to the building of these two tables.
The Inventory Tables
Each of these tables holds monthly observation counts (ie, number of data records for each station)for the respective data source. For example, I_9956 holds the counts for the TD9956 data for eachstation and year processed. The I_3280 holds the TD3280 counts, etc. The I_Diff table is thedifference of the TD3280/9956 (whichever is greatest) and the I_ISH count for the same station anddate. This table is used to identify any possible loss of data during the processing.
System Design and Development
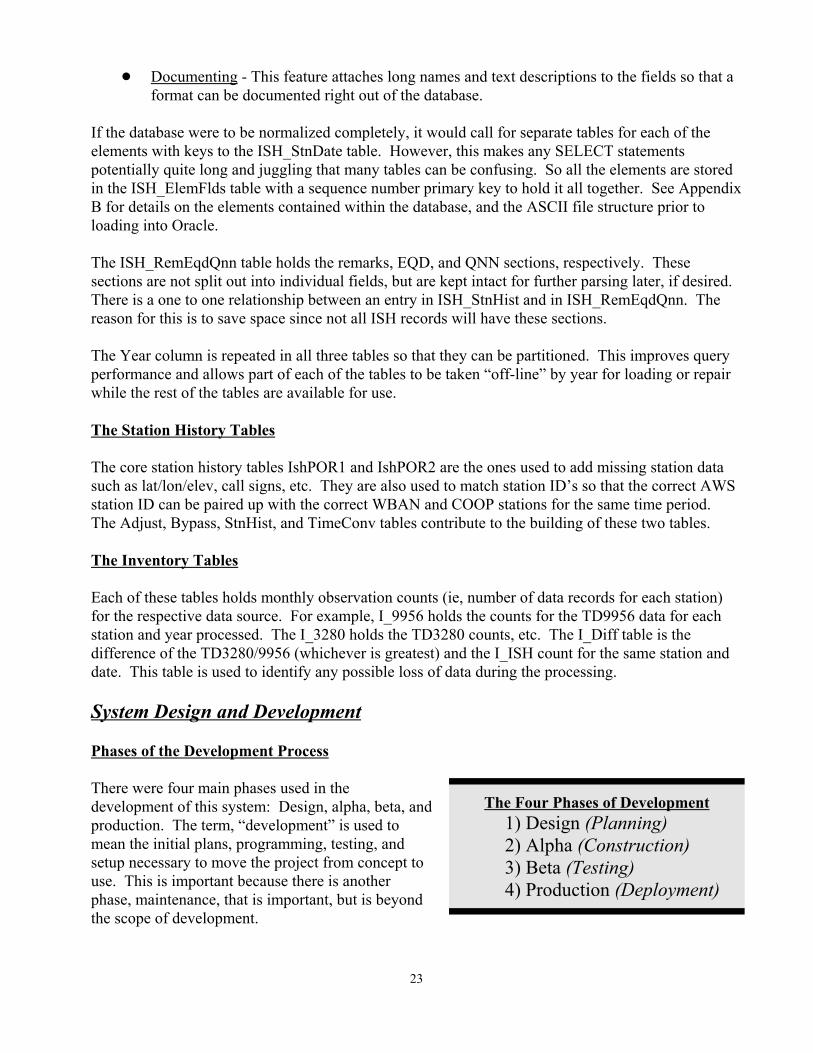
Phases of the Development Process
There were four main phases used in thedevelopment of this system: Design, alpha, beta, andproduction. The term, “development” is used tomean the initial plans, programming, testing, andsetup necessary to move the project from concept touse. This is important because there is anotherphase, maintenance, that is important, but is beyondthe scope of development.
The Four Phases of Development1) Design (Planning)2) Alpha (Construction)3) Beta (Testing)4) Production (Deployment)
24
The dividing line between the phases is not always distinct; in fact, there are often overlap periodswhere two or even three of the phases are occurring simultaneously. Often a program will have partsof it that demote back to previous phases before “getting it right.” But eventually all the phases arecompleted for all the components of the system at which point the development is finished.
Design Phase
Any information system must begin here. If the requirements are not understood clearly, then thedevelopment, testing, and production phases will be frustrating, time-consuming, and less stable. Ideally, the development team should meet together frequently to hash out the design ideas on paper. They should also involve the end-users as much as is reasonable. Once the ideas are expressed onpaper, the actual programming and testing can begin. The rule of thumb is, “A problem well-definedis half-solved.”
Alpha Phase
The alpha phase is the time involved in the initial programming work. The only testing done duringthis phase is by the programmer who does some rudimentary testing to insure that the program is atleast performing the basic functionality in a way that is expected. At this stage, the developer is freeto code and organize his or her files in whatever way he or she chooses.
Beta Phase
By the time the code is promoted to beta phase, more control must be placed on the development toinsure uniformity and maintainability. The user circle of this phase grows from the primarydeveloper to the other developers and decision-makers in the project. Most of the testing is doneduring this time with revisions being made by the developer as the testing reveals bugs or designchanges.
Production Phase
In this final phase, the scope of users expands further to include those outside the development groupwho will interact with the system on a regular basis. The early stages of this phase will also includesome testing, mainly to verify that the system will actually run in the production environment. Somesmall coding may also take place, primarily for process control scripts.
Configuration Management (CM) and Revision Control System (RCS)
Revision control helps manage the various versions of source files that are created as the systemevolves. It allows the developers to roll back to prior versions if necessary and to inject commentswith each update that describes the changes made.
The tool used in the development of ISH was RCS. This tool was chosen because it is simple to use,freely available, and seemed to match the level of sophistication needed by this system. It wasapplied only to code in the beta phase.
25
program_directory_name1
bin
run
scripts
srcprogram_directory_name2
bin
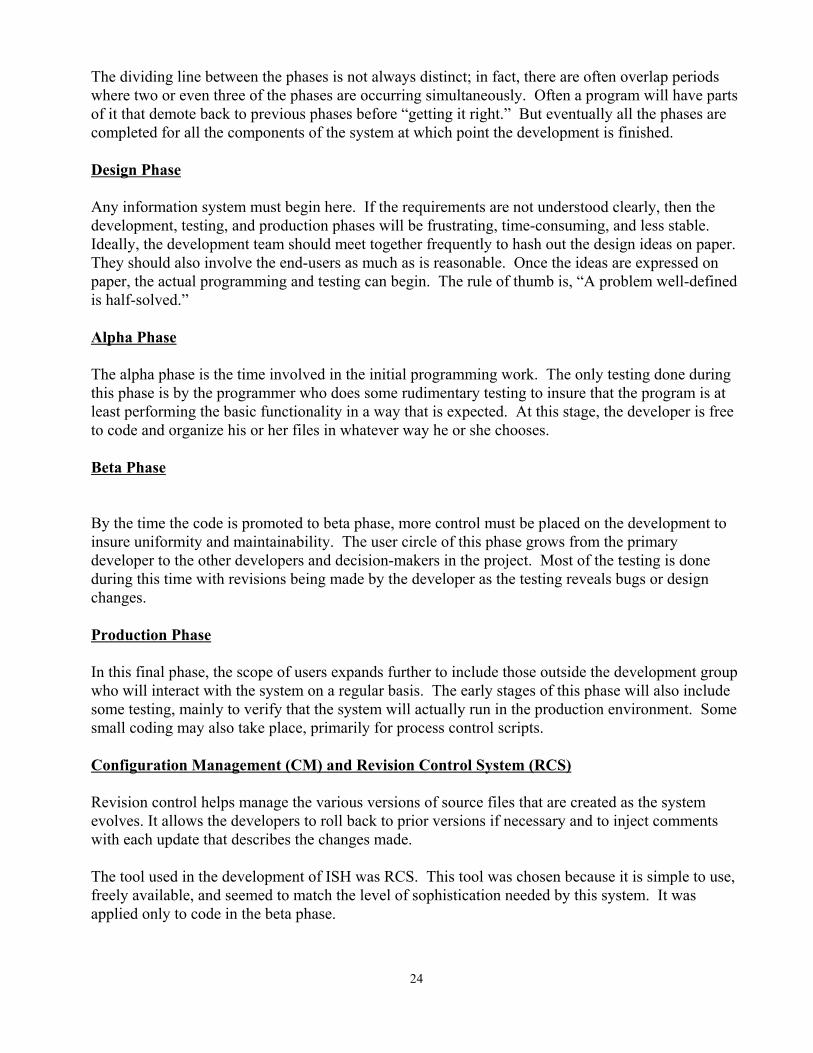
Figure 8 - Beta and ProductionDirectory Tree Structure
Directory Structure and File Locations
There were also special directories used in the beta phase to furtherorganize the programs. The basic structure is shown in Figure 8.Each program has its own directory under which are foursubdirectories: bin, run, scripts, and src. The ./bin directory holdsthe executable. ./run holds any test input, output, log, etc., files thatare run against the program. The ./scripts directory holds anyscripts used to launch the program or control the compilation, andthe ./src directory holds the source files.
Shared Object Code Libraries
Shared object code libraries are repositories of pre-compiled codethat can be linked into a program to add functionality. Here are thestrongest advantages to using these libraries:
! Faster development with shared code. Once the code has beendeveloped and tested, it can be reused by may differentprograms with very little additional effort. The code is readilyavailable, providing immediate functionality for the developer.
! Uniformity in style and behavior. Because code can be soeasily shared, it provides a uniform way of dealing withcommon issues that all these programs face.
! Easier maintenance. Because the libraries are actually referred to at runtime, they can beupdated without having to recompile the programs that use them.
! Hides complex coding. When there are tasks to be done that require a specific knowledge and/orsystem paths to develop, these libraries can really make the job easier. For example, accessingOracle from a C or Fortran program can be a headache because of the lack of clear, platform-specific documentation for the precompiler. Writing the embedded SQL code is fairly easy. Compiling it correctly, though, has proven to be a separate, non-trivial matter. If thisfunctionality can be made available in a shared object library, however, then the task of writingC and Fortran programs that work with Oracle becomes far less daunting.
There are a total of three of these libraries built in conjunction with the ISH system with two of themintended for use as outlined above. These two are discussed in the next two parts below. The thirdone, the wrapper.c library, is intended for exclusive use with the TD3280 to ISH conversion program.
26
NULLNULL
*vpDataNode
sPtrNode*spPriorLink*spNextLink
(Your Data Node)
*vpDataNode
sPtrNode*spPriorLink*spNextLink
(Your Data Node)
*vpDataNode
sPtrNode*spPriorLink*spNextLink
(Your Data Node)
Both nodes together are a "link"
Figure 9 - Linked list structure used by the linklist shared object library.
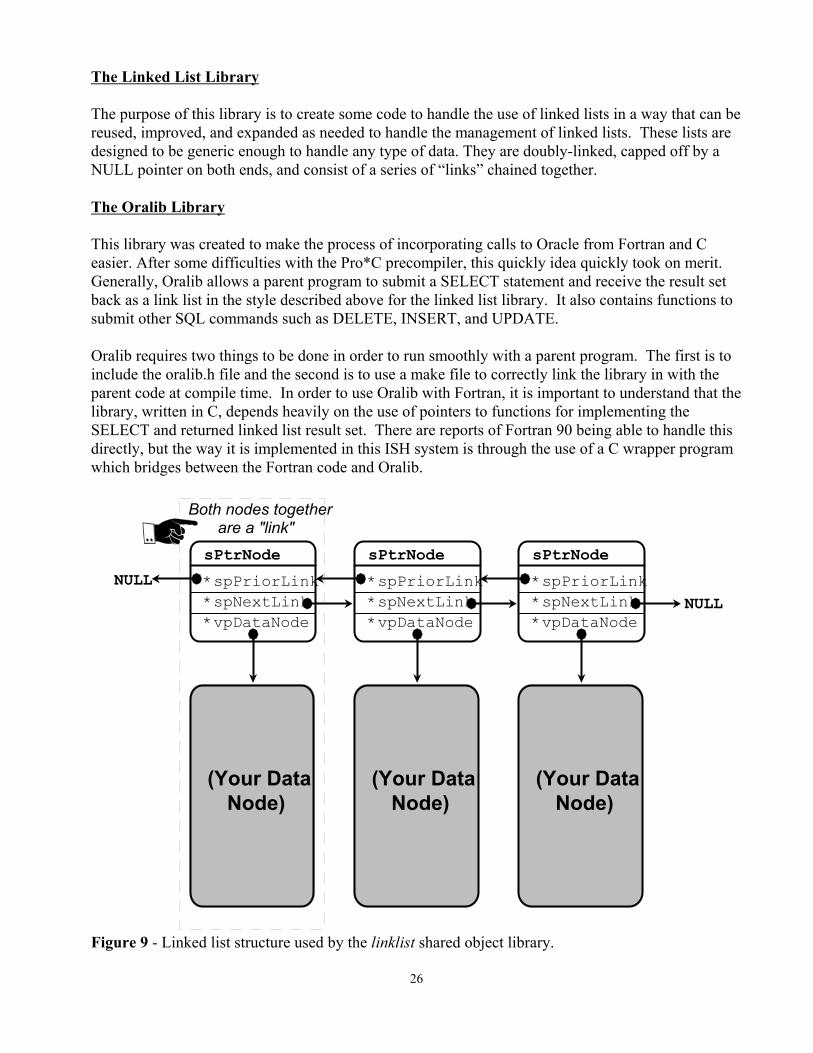
The Linked List Library
The purpose of this library is to create some code to handle the use of linked lists in a way that can bereused, improved, and expanded as needed to handle the management of linked lists. These lists aredesigned to be generic enough to handle any type of data. They are doubly-linked, capped off by aNULL pointer on both ends, and consist of a series of “links” chained together.
The Oralib Library
This library was created to make the process of incorporating calls to Oracle from Fortran and Ceasier. After some difficulties with the Pro*C precompiler, this quickly idea quickly took on merit. Generally, Oralib allows a parent program to submit a SELECT statement and receive the result setback as a link list in the style described above for the linked list library. It also contains functions tosubmit other SQL commands such as DELETE, INSERT, and UPDATE.
Oralib requires two things to be done in order to run smoothly with a parent program. The first is toinclude the oralib.h file and the second is to use a make file to correctly link the library in with theparent code at compile time. In order to use Oralib with Fortran, it is important to understand that thelibrary, written in C, depends heavily on the use of pointers to functions for implementing theSELECT and returned linked list result set. There are reports of Fortran 90 being able to handle thisdirectly, but the way it is implemented in this ISH system is through the use of a C wrapper programwhich bridges between the Fortran code and Oralib.
27
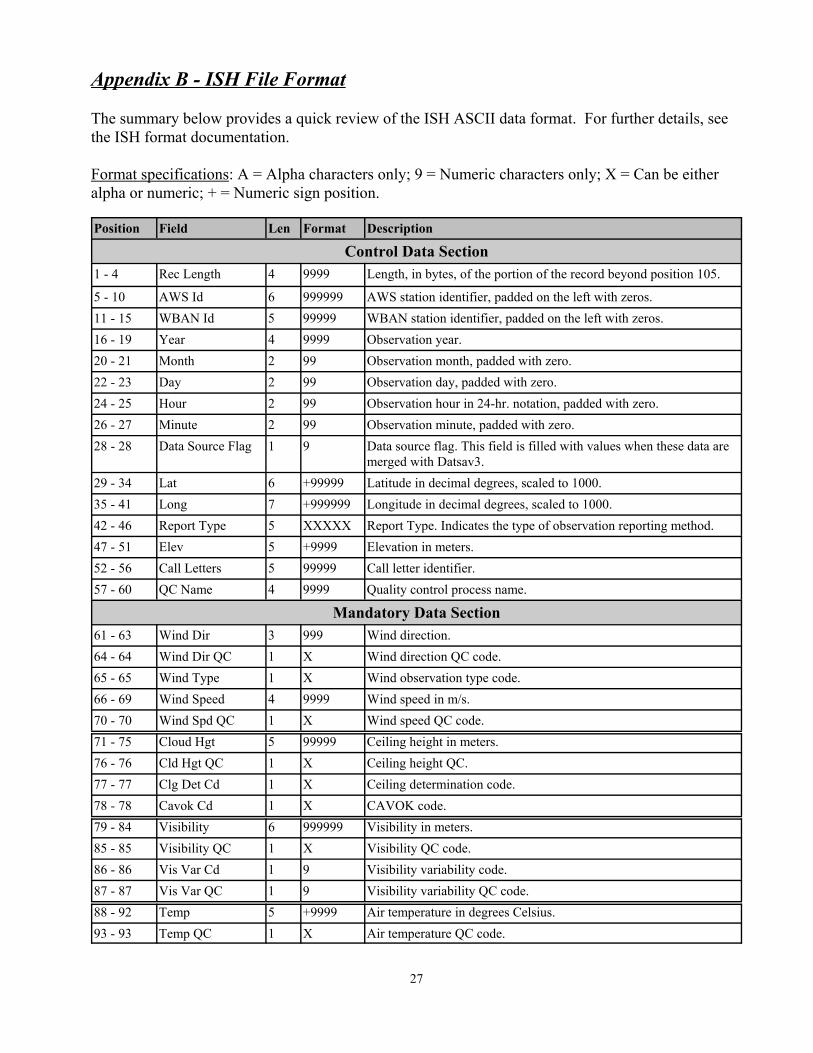
Appendix B - ISH File Format
The summary below provides a quick review of the ISH ASCII data format. For further details, seethe ISH format documentation.
Format specifications: A = Alpha characters only; 9 = Numeric characters only; X = Can be eitheralpha or numeric; + = Numeric sign position.
Position Field Len Format Description
Control Data Section1 - 4 Rec Length 4 9999 Length, in bytes, of the portion of the record beyond position 105.
5 - 10 AWS Id 6 999999 AWS station identifier, padded on the left with zeros.11 - 15 WBAN Id 5 99999 WBAN station identifier, padded on the left with zeros.16 - 19 Year 4 9999 Observation year.20 - 21 Month 2 99 Observation month, padded with zero.22 - 23 Day 2 99 Observation day, padded with zero.24 - 25 Hour 2 99 Observation hour in 24-hr. notation, padded with zero.26 - 27 Minute 2 99 Observation minute, padded with zero.28 - 28 Data Source Flag 1 9 Data source flag. This field is filled with values when these data are
merged with Datsav3.29 - 34 Lat 6 +99999 Latitude in decimal degrees, scaled to 1000.35 - 41 Long 7 +999999 Longitude in decimal degrees, scaled to 1000.42 - 46 Report Type 5 XXXXX Report Type. Indicates the type of observation reporting method.47 - 51 Elev 5 +9999 Elevation in meters.52 - 56 Call Letters 5 99999 Call letter identifier.57 - 60 QC Name 4 9999 Quality control process name.
Mandatory Data Section61 - 63 Wind Dir 3 999 Wind direction.64 - 64 Wind Dir QC 1 X Wind direction QC code.65 - 65 Wind Type 1 X Wind observation type code.66 - 69 Wind Speed 4 9999 Wind speed in m/s.70 - 70 Wind Spd QC 1 X Wind speed QC code.71 - 75 Cloud Hgt 5 99999 Ceiling height in meters.76 - 76 Cld Hgt QC 1 X Ceiling height QC.77 - 77 Clg Det Cd 1 X Ceiling determination code.78 - 78 Cavok Cd 1 X CAVOK code.79 - 84 Visibility 6 999999 Visibility in meters.85 - 85 Visibility QC 1 X Visibility QC code.86 - 86 Vis Var Cd 1 9 Visibility variability code.87 - 87 Vis Var QC 1 9 Visibility variability QC code.88 - 92 Temp 5 +9999 Air temperature in degrees Celsius.93 - 93 Temp QC 1 X Air temperature QC code.
28
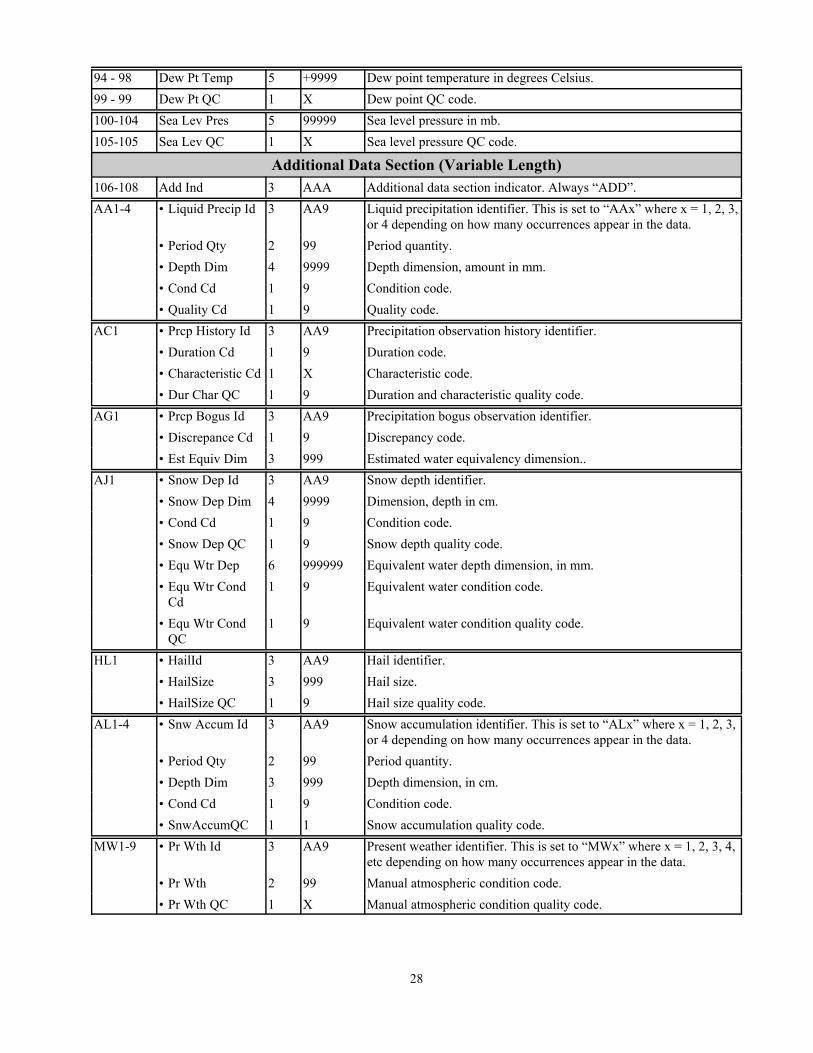
94 - 98 Dew Pt Temp 5 +9999 Dew point temperature in degrees Celsius.99 - 99 Dew Pt QC 1 X Dew point QC code.100-104 Sea Lev Pres 5 99999 Sea level pressure in mb.105-105 Sea Lev QC 1 X Sea level pressure QC code.
Additional Data Section (Variable Length)106-108 Add Ind 3 AAA Additional data section indicator. Always “ADD”.AA1-4 • Liquid Precip Id 3 AA9 Liquid precipitation identifier. This is set to “AAx” where x = 1, 2, 3,
or 4 depending on how many occurrences appear in the data.• Period Qty 2 99 Period quantity.• Depth Dim 4 9999 Depth dimension, amount in mm.• Cond Cd 1 9 Condition code.• Quality Cd 1 9 Quality code.
AC1 • Prcp History Id 3 AA9 Precipitation observation history identifier.• Duration Cd 1 9 Duration code.• Characteristic Cd 1 X Characteristic code.• Dur Char QC 1 9 Duration and characteristic quality code.
AG1 • Prcp Bogus Id 3 AA9 Precipitation bogus observation identifier.• Discrepance Cd 1 9 Discrepancy code.• Est Equiv Dim 3 999 Estimated water equivalency dimension..
AJ1 • Snow Dep Id 3 AA9 Snow depth identifier.• Snow Dep Dim 4 9999 Dimension, depth in cm.• Cond Cd 1 9 Condition code.• Snow Dep QC 1 9 Snow depth quality code.• Equ Wtr Dep 6 999999 Equivalent water depth dimension, in mm.• Equ Wtr Cond
Cd1 9 Equivalent water condition code.
• Equ Wtr CondQC
1 9 Equivalent water condition quality code.
HL1 • HailId 3 AA9 Hail identifier.• HailSize 3 999 Hail size.• HailSize QC 1 9 Hail size quality code.
AL1-4 • Snw Accum Id 3 AA9 Snow accumulation identifier. This is set to “ALx” where x = 1, 2, 3,or 4 depending on how many occurrences appear in the data.
• Period Qty 2 99 Period quantity.• Depth Dim 3 999 Depth dimension, in cm.• Cond Cd 1 9 Condition code.• SnwAccumQC 1 1 Snow accumulation quality code.
MW1-9 • Pr Wth Id 3 AA9 Present weather identifier. This is set to “MWx” where x = 1, 2, 3, 4,etc depending on how many occurrences appear in the data.
• Pr Wth 2 99 Manual atmospheric condition code.• Pr Wth QC 1 X Manual atmospheric condition quality code.
29
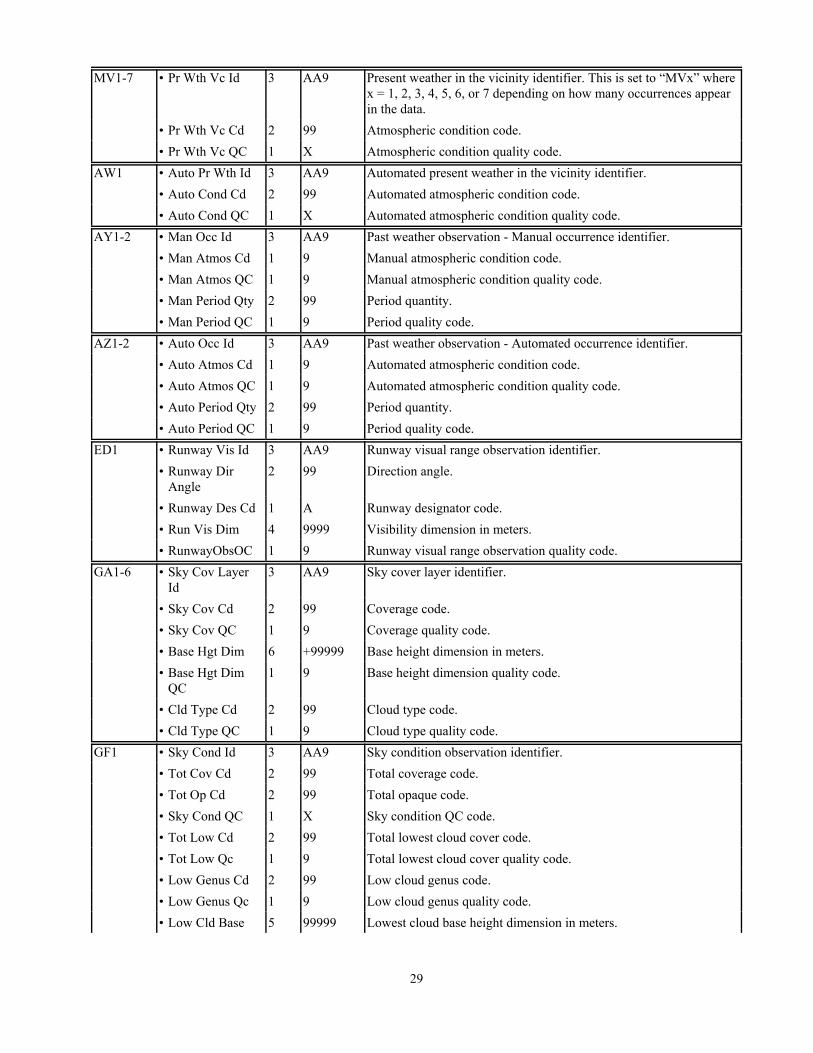
MV1-7 • Pr Wth Vc Id 3 AA9 Present weather in the vicinity identifier. This is set to “MVx” wherex = 1, 2, 3, 4, 5, 6, or 7 depending on how many occurrences appearin the data.
• Pr Wth Vc Cd 2 99 Atmospheric condition code.• Pr Wth Vc QC 1 X Atmospheric condition quality code.
AW1 • Auto Pr Wth Id 3 AA9 Automated present weather in the vicinity identifier.• Auto Cond Cd 2 99 Automated atmospheric condition code.• Auto Cond QC 1 X Automated atmospheric condition quality code.
AY1-2 • Man Occ Id 3 AA9 Past weather observation - Manual occurrence identifier.• Man Atmos Cd 1 9 Manual atmospheric condition code.• Man Atmos QC 1 9 Manual atmospheric condition quality code.• Man Period Qty 2 99 Period quantity.• Man Period QC 1 9 Period quality code.
AZ1-2 • Auto Occ Id 3 AA9 Past weather observation - Automated occurrence identifier.• Auto Atmos Cd 1 9 Automated atmospheric condition code.• Auto Atmos QC 1 9 Automated atmospheric condition quality code.• Auto Period Qty 2 99 Period quantity.• Auto Period QC 1 9 Period quality code.
ED1 • Runway Vis Id 3 AA9 Runway visual range observation identifier.• Runway Dir
Angle2 99 Direction angle.
• Runway Des Cd 1 A Runway designator code.• Run Vis Dim 4 9999 Visibility dimension in meters.• RunwayObsOC 1 9 Runway visual range observation quality code.
GA1-6 • Sky Cov LayerId
3 AA9 Sky cover layer identifier.
• Sky Cov Cd 2 99 Coverage code.• Sky Cov QC 1 9 Coverage quality code.• Base Hgt Dim 6 +99999 Base height dimension in meters.• Base Hgt Dim
QC1 9 Base height dimension quality code.
• Cld Type Cd 2 99 Cloud type code.• Cld Type QC 1 9 Cloud type quality code.
GF1 • Sky Cond Id 3 AA9 Sky condition observation identifier.• Tot Cov Cd 2 99 Total coverage code.• Tot Op Cd 2 99 Total opaque code.• Sky Cond QC 1 X Sky condition QC code.• Tot Low Cd 2 99 Total lowest cloud cover code.• Tot Low Qc 1 9 Total lowest cloud cover quality code.• Low Genus Cd 2 99 Low cloud genus code.• Low Genus Qc 1 9 Low cloud genus quality code.• Low Cld Base 5 99999 Lowest cloud base height dimension in meters.

30
• Low Cld BaseQc
1 9 Lowest cloud base height dimension quality code.
• Mid Cld 2 99 Mid cloud genus code.• Mid Cld Qc 1 9 Mid cloud genus quality code.• Hi Cld 2 99 High cloud genus code.• Hi Cld Qc 1 9 High cloud genus quality code.
GD1-6 • Sky Sum Id 3 AA9 Sky cover summation identifier.• Cov Code 1 1 9 Coverage code 1.• Cov Code 2 2 99 Coverage code 2.• Cov QC 1 X Coverage QC code.• Hgt Dim 6 +99999 Height dimension in meters.• Hgt Dim QC 1 X Height dimension QC code.• Char Code 1 9 Characteristic code.
GG1-6 • Bel Stat Cld Id 3 AA9 Below station cloud layer identifier.• Bel Stat Cov Cd 2 99 Coverage code.• Bel Stat Cov QC 1 9 Coverage quality code.• Top Hgt Dim 5 99999 Top height dimension in meters.• Top Hgt Dim QC 1 9 Top height dimension quality code.• Type Cd 2 99 Type code.• Type QC 1 9 Type quality code.• Top Code 2 99 Top code.• Top QC 1 9 Top quality code.
GJ1 • Sun Obs Id 3 AA9 Sunshine observation identifier.• Sun Dur Qty 4 9999 Sunshine duration quantity.• Sun Dur QC 1 9 Sunshine duration quality code.
IA1 • Grd Sfc Obs Id 3 AA9 Ground surface observation identifier.• Grd Sfc Obs Cd 2 99 Ground surface observation code.• Grd Sfc Obs Qc 1 9 Ground surface observation quality code.
IA2 • GSO Min TmpId
3 AA9 Ground surface observation minimum temperature identifier.
• GSO Min TmpQty
3 999 Minimum temperature period quantity.
• GSO Min Tmp 5 +9999 Minimum temperature in Celsius.• GSO Min Tmp
QC1 9 Minimum temperature quality code.
KA1-2 • Xair Temp Id 3 AA9 Extreme air temperature identifier.• Period Qty 3 999 Period quantity.• Xair Temp Cd 1 X Extreme air temperature code for minimum or maximum.• Xair Temp 5 +9999 Extreme air temperature in Celsius.• Xair Temp QC 1 9 Extreme air temperature quality code.
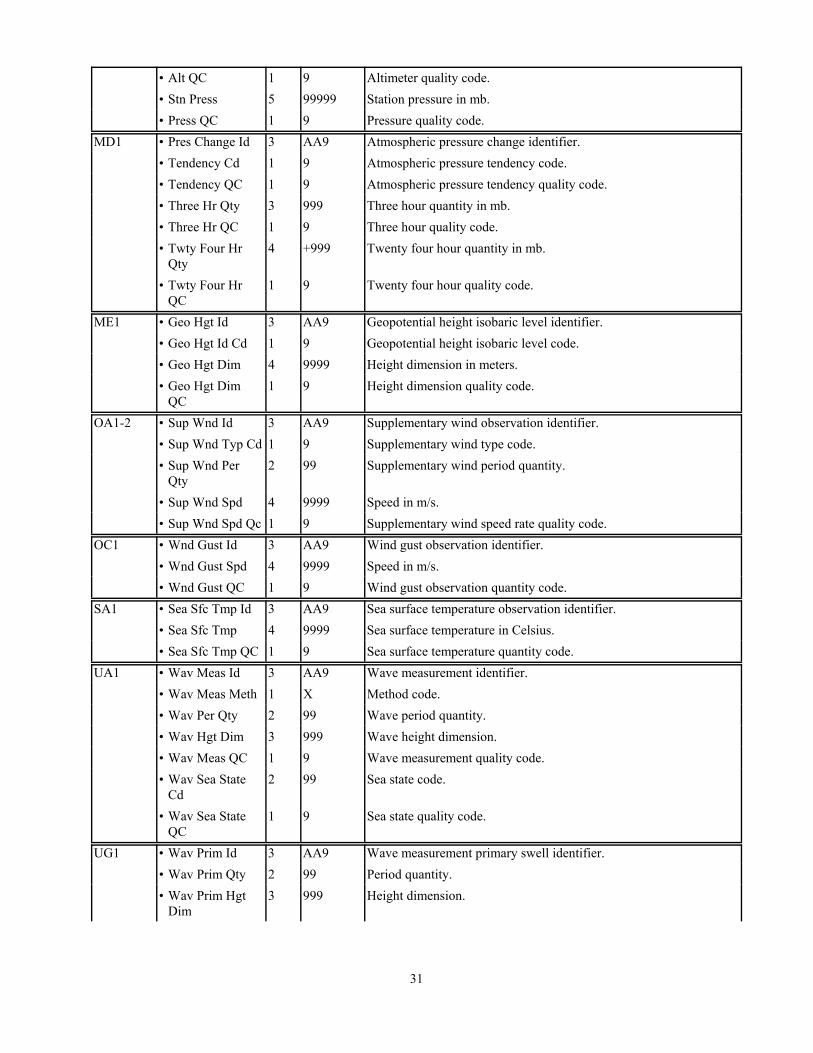
MA1 • Press Id 3 AA9 Atmospheric pressure identifier.• Altimeter 5 99999 Altimeter setting in mb.
31
• Alt QC 1 9 Altimeter quality code.• Stn Press 5 99999 Station pressure in mb.• Press QC 1 9 Pressure quality code.
MD1 • Pres Change Id 3 AA9 Atmospheric pressure change identifier.• Tendency Cd 1 9 Atmospheric pressure tendency code.• Tendency QC 1 9 Atmospheric pressure tendency quality code.• Three Hr Qty 3 999 Three hour quantity in mb.• Three Hr QC 1 9 Three hour quality code.• Twty Four Hr
Qty4 +999 Twenty four hour quantity in mb.
• Twty Four HrQC
1 9 Twenty four hour quality code.
ME1 • Geo Hgt Id 3 AA9 Geopotential height isobaric level identifier.• Geo Hgt Id Cd 1 9 Geopotential height isobaric level code.• Geo Hgt Dim 4 9999 Height dimension in meters.• Geo Hgt Dim
QC1 9 Height dimension quality code.
OA1-2 • Sup Wnd Id 3 AA9 Supplementary wind observation identifier.• Sup Wnd Typ Cd 1 9 Supplementary wind type code.• Sup Wnd Per
Qty2 99 Supplementary wind period quantity.
• Sup Wnd Spd 4 9999 Speed in m/s.• Sup Wnd Spd Qc 1 9 Supplementary wind speed rate quality code.
OC1 • Wnd Gust Id 3 AA9 Wind gust observation identifier.• Wnd Gust Spd 4 9999 Speed in m/s.• Wnd Gust QC 1 9 Wind gust observation quantity code.
SA1 • Sea Sfc Tmp Id 3 AA9 Sea surface temperature observation identifier.• Sea Sfc Tmp 4 9999 Sea surface temperature in Celsius.• Sea Sfc Tmp QC 1 9 Sea surface temperature quantity code.
UA1 • Wav Meas Id 3 AA9 Wave measurement identifier.• Wav Meas Meth 1 X Method code.• Wav Per Qty 2 99 Wave period quantity.• Wav Hgt Dim 3 999 Wave height dimension.• Wav Meas QC 1 9 Wave measurement quality code.• Wav Sea State
Cd2 99 Sea state code.
• Wav Sea StateQC
1 9 Sea state quality code.
UG1 • Wav Prim Id 3 AA9 Wave measurement primary swell identifier.• Wav Prim Qty 2 99 Period quantity.• Wav Prim Hgt
Dim3 999 Height dimension.

32
• Wav Prim DirAngl
3 999 Direction angle.
• Wav Prim QC 1 9 Primary swell quality code.UG2 • Wav Sec Id 3 AA9 Wave measurement secondary swell identifier.
• Wav Sec Qty 2 99 Period quantity.• Wav Sed Hgt
Dim3 999 Height dimension.
• Wav Sec DirAngl
3 999 Direction angle.
• Wav Sec QC 1 9 Secondary swell quality code.WA1 • Plat Ice AccId 3 AA9 Platform ice accretion identifier.
• Plat Ice Src Cd 1 9 Source code.• Plat Ice Thk Dim 3 999 Thickness dimension.• Plat Ice Tend Cd 1 9 Tendency code.• Plat Ice QC 1 9 Platform ice accretion quality code.
WG1 • Wtr Ice Hist Id 3 AA9 Water surface ice historical observation identifier.• Ice Edge Brng
Cd2 99 Ocean ice observation edge bearing code.
• Edge Dist Dim 2 99 Edge distance dimension.• Edge Orient Cd 2 99 Edge orientation code.• Form Type Cd 2 99 Formation type code.• Nav Effect Cd 2 99 Navigation effect code.• Wtr Icd Hist QC 1 9 Water surface ice historical observation quality code.
WD1 • Wtr Ice Id 3 AA9 Water surface ice observation identifier.• Ice Edge Brng
Cd2 99 Ocean ice observation edge bearing code.
• Uni Con Rate 3 999 Uniform concentration rate.• Non Uni Con
Rate2 99 Non-uniform concentration rate.
• Ship Rel Pos Cd 1 9 Ship relative position code.• Ship Penet Cd 1 9 Ship penetrability code.• Ice Trend Cd 1 9 Ice trend code.• Dev Cd 2 99 Development code.• Gr Ber Bit Pres
Cd1 9 Growler-bergy-bit presence code.
• Gr Ber Bit Qty 3 999 Growler-bergy-bit quantity.• Iceberg Qty 3 999 Iceberg quantity.• Wtr Icd QC 1 9 Water surface ice observation quality code.
Remarks Section (Variable Length)REM • Rem Sect Id 3 AAA Remarks section identifier.SYN • Syn Rem Id 3 AAA Synoptic remark identifier.
• Rem Len Qty 3 999 Remark length quantity.• Rem Text 250 X (250) Remark text.
33
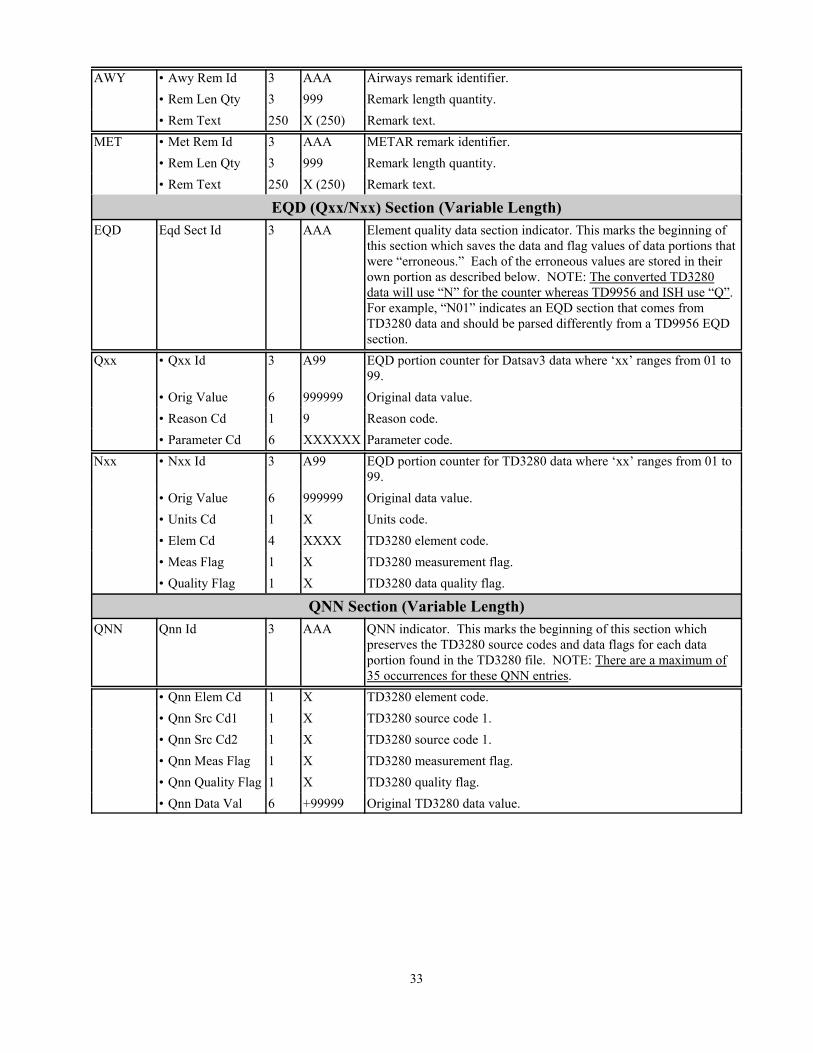
AWY • Awy Rem Id 3 AAA Airways remark identifier.• Rem Len Qty 3 999 Remark length quantity.• Rem Text 250 X (250) Remark text.
MET • Met Rem Id 3 AAA METAR remark identifier.• Rem Len Qty 3 999 Remark length quantity.• Rem Text 250 X (250) Remark text.
EQD (Qxx/Nxx) Section (Variable Length)EQD Eqd Sect Id 3 AAA Element quality data section indicator. This marks the beginning of
this section which saves the data and flag values of data portions thatwere “erroneous.” Each of the erroneous values are stored in theirown portion as described below. NOTE: The converted TD3280data will use “N” for the counter whereas TD9956 and ISH use “Q”. For example, “N01” indicates an EQD section that comes fromTD3280 data and should be parsed differently from a TD9956 EQDsection.
Qxx • Qxx Id 3 A99 EQD portion counter for Datsav3 data where ‘xx’ ranges from 01 to99.
• Orig Value 6 999999 Original data value.• Reason Cd 1 9 Reason code.• Parameter Cd 6 XXXXXX Parameter code.
Nxx • Nxx Id 3 A99 EQD portion counter for TD3280 data where ‘xx’ ranges from 01 to99.
• Orig Value 6 999999 Original data value.• Units Cd 1 X Units code.• Elem Cd 4 XXXX TD3280 element code.• Meas Flag 1 X TD3280 measurement flag.• Quality Flag 1 X TD3280 data quality flag.
QNN Section (Variable Length)QNN Qnn Id 3 AAA QNN indicator. This marks the beginning of this section which
preserves the TD3280 source codes and data flags for each dataportion found in the TD3280 file. NOTE: There are a maximum of35 occurrences for these QNN entries.
• Qnn Elem Cd 1 X TD3280 element code.• Qnn Src Cd1 1 X TD3280 source code 1.• Qnn Src Cd2 1 X TD3280 source code 1.• Qnn Meas Flag 1 X TD3280 measurement flag.• Qnn Quality Flag 1 X TD3280 quality flag.• Qnn Data Val 6 +99999 Original TD3280 data value.

34
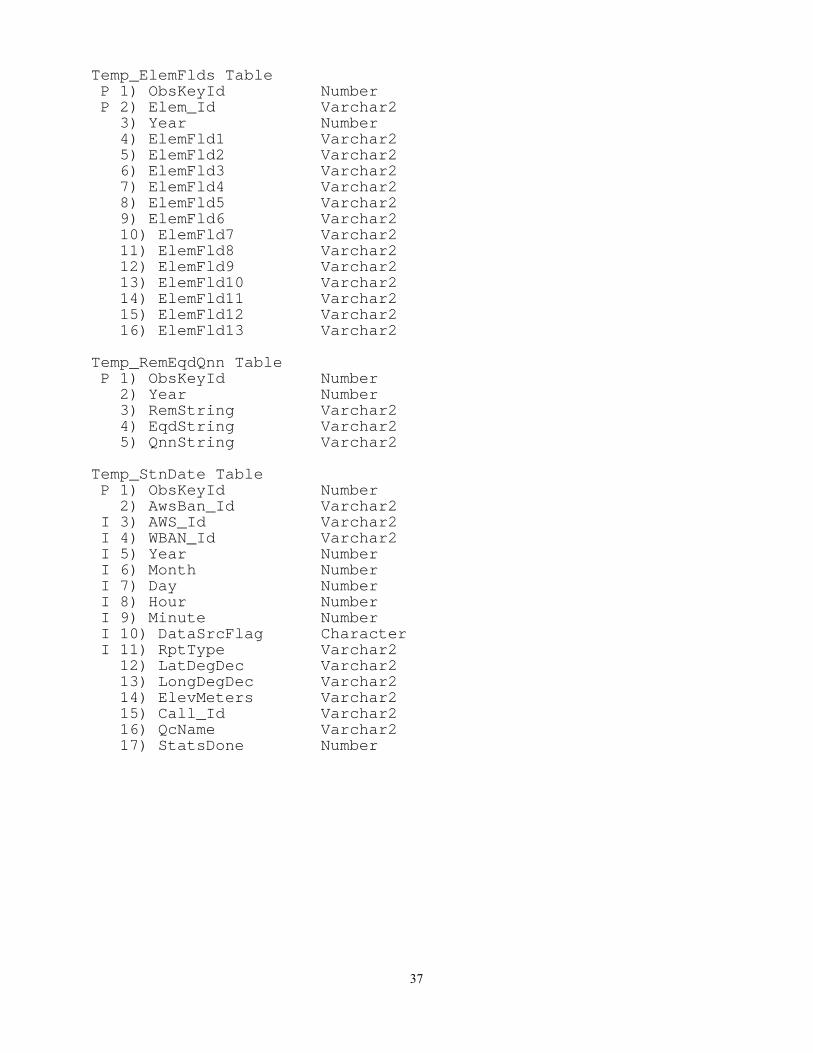
Appendix C - ISH Oracle Table Structures
The summary below provides a quick review of the ISH relational table formats. It is not intendedas a detailed review of the table structures.(I = indexed field, P = primary key)
Climate Data Online (CDO) ISH Tables (used in building and providingweb access to the data):
Column Name Data TypeISH_Country_Alias Table I 1) CDO_Abbrev Varchar2(2) I 2) AWS_Country_Id Varchar2(2) 3) Source Varchar2(10)
ISH_Hist Table 1) AWS_Id Varchar2(6) 2) WBAN_Id Varchar2(5) 3) CoOp_Id Varchar2 4) Begin_Date Varchar2 5) End_Date Varchar2 6) Stn_Name Varchar2 7) SStn_Name Varchar2 8) State_Prov_Id Varchar2 9) LatDegDec Varchar2 10) LongDegDec Varchar2 11) ElevMetersTenth Varchar2 12) Call_Sign Varchar2 13) ICAO_Id Varchar2 14) AWS_Country_Id Varchar2 15) WMO_No Varchar2 16) Country Varchar2 17) County Varchar2 18) Climate_Dv Varchar2 19) DataCnt Number 20) FIPS_Country_Id Varchar2
Format Properties Tables for CDO:
Dataset_Field Table P 1) DatasetId Number P 2) Field_Id Number 3) Source_Table Varchar2 4) Source_Col Varchar2 5) Where_Cond Varchar2
35
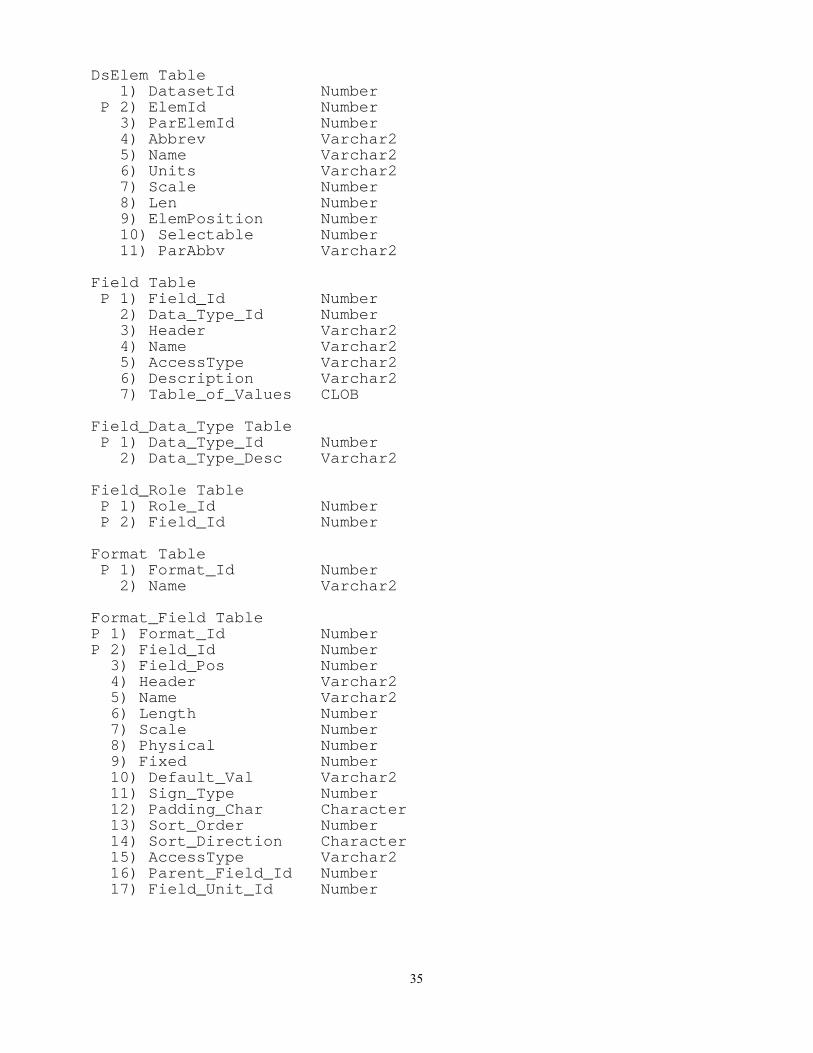
DsElem Table 1) DatasetId Number P 2) ElemId Number 3) ParElemId Number 4) Abbrev Varchar2 5) Name Varchar2 6) Units Varchar2 7) Scale Number 8) Len Number 9) ElemPosition Number 10) Selectable Number 11) ParAbbv Varchar2
Field Table P 1) Field_Id Number 2) Data_Type_Id Number 3) Header Varchar2 4) Name Varchar2 5) AccessType Varchar2 6) Description Varchar2 7) Table_of_Values CLOB
Field_Data_Type Table P 1) Data_Type_Id Number 2) Data_Type_Desc Varchar2
Field_Role Table P 1) Role_Id Number P 2) Field_Id Number
Format Table P 1) Format_Id Number 2) Name Varchar2
Format_Field TableP 1) Format_Id NumberP 2) Field_Id Number 3) Field_Pos Number 4) Header Varchar2 5) Name Varchar2 6) Length Number 7) Scale Number 8) Physical Number 9) Fixed Number 10) Default_Val Varchar2 11) Sign_Type Number 12) Padding_Char Character 13) Sort_Order Number 14) Sort_Direction Character 15) AccessType Varchar2 16) Parent_Field_Id Number 17) Field_Unit_Id Number
36
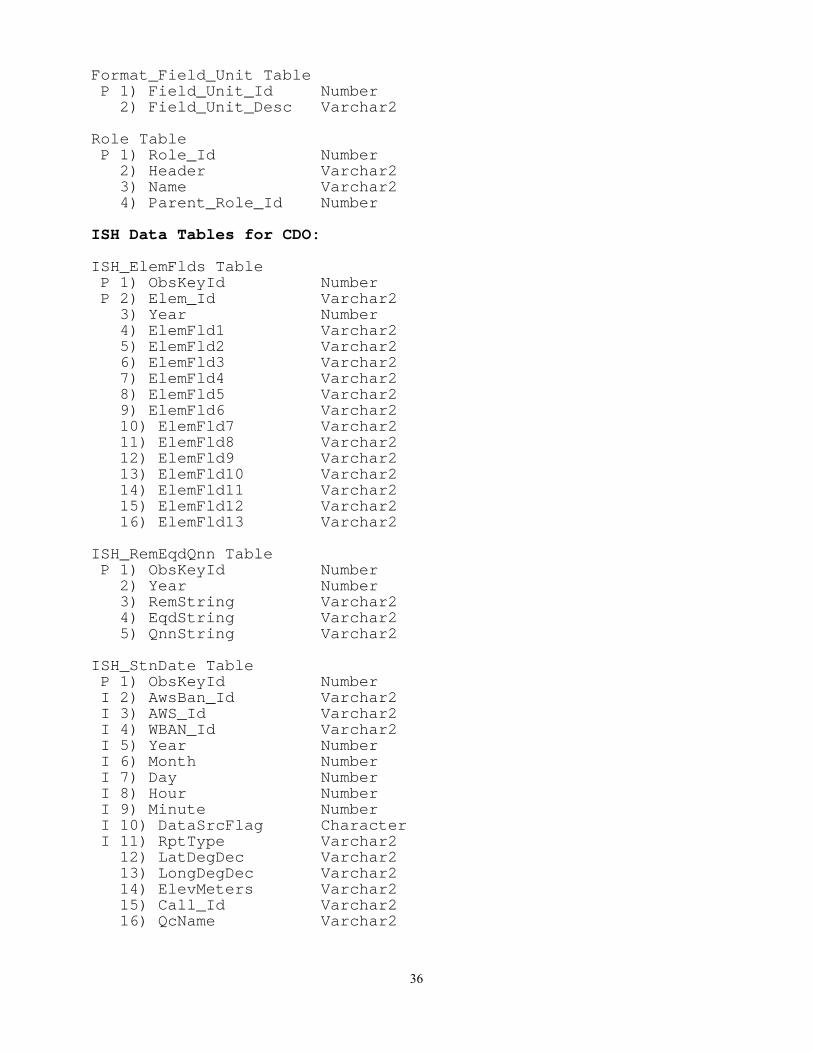
Format_Field_Unit Table P 1) Field_Unit_Id Number 2) Field_Unit_Desc Varchar2
Role Table P 1) Role_Id Number 2) Header Varchar2 3) Name Varchar2 4) Parent_Role_Id Number
ISH Data Tables for CDO:
ISH_ElemFlds Table P 1) ObsKeyId Number P 2) Elem_Id Varchar2 3) Year Number 4) ElemFld1 Varchar2 5) ElemFld2 Varchar2 6) ElemFld3 Varchar2 7) ElemFld4 Varchar2 8) ElemFld5 Varchar2 9) ElemFld6 Varchar2 10) ElemFld7 Varchar2 11) ElemFld8 Varchar2 12) ElemFld9 Varchar2 13) ElemFld10 Varchar2 14) ElemFld11 Varchar2 15) ElemFld12 Varchar2 16) ElemFld13 Varchar2
ISH_RemEqdQnn Table P 1) ObsKeyId Number 2) Year Number 3) RemString Varchar2 4) EqdString Varchar2 5) QnnString Varchar2
ISH_StnDate Table P 1) ObsKeyId Number I 2) AwsBan_Id Varchar2 I 3) AWS_Id Varchar2 I 4) WBAN_Id Varchar2 I 5) Year Number I 6) Month Number I 7) Day Number I 8) Hour Number I 9) Minute Number I 10) DataSrcFlag Character I 11) RptType Varchar2 12) LatDegDec Varchar2 13) LongDegDec Varchar2 14) ElevMeters Varchar2 15) Call_Id Varchar2 16) QcName Varchar2
37
Temp_ElemFlds Table P 1) ObsKeyId Number P 2) Elem_Id Varchar2 3) Year Number 4) ElemFld1 Varchar2 5) ElemFld2 Varchar2 6) ElemFld3 Varchar2 7) ElemFld4 Varchar2 8) ElemFld5 Varchar2 9) ElemFld6 Varchar2 10) ElemFld7 Varchar2 11) ElemFld8 Varchar2 12) ElemFld9 Varchar2 13) ElemFld10 Varchar2 14) ElemFld11 Varchar2 15) ElemFld12 Varchar2 16) ElemFld13 Varchar2
Temp_RemEqdQnn Table P 1) ObsKeyId Number 2) Year Number 3) RemString Varchar2 4) EqdString Varchar2 5) QnnString Varchar2
Temp_StnDate Table P 1) ObsKeyId Number 2) AwsBan_Id Varchar2 I 3) AWS_Id Varchar2 I 4) WBAN_Id Varchar2 I 5) Year Number I 6) Month Number I 7) Day Number I 8) Hour Number I 9) Minute Number I 10) DataSrcFlag Character I 11) RptType Varchar2 12) LatDegDec Varchar2 13) LongDegDec Varchar2 14) ElevMeters Varchar2 15) Call_Id Varchar2 16) QcName Varchar2 17) StatsDone Number
38
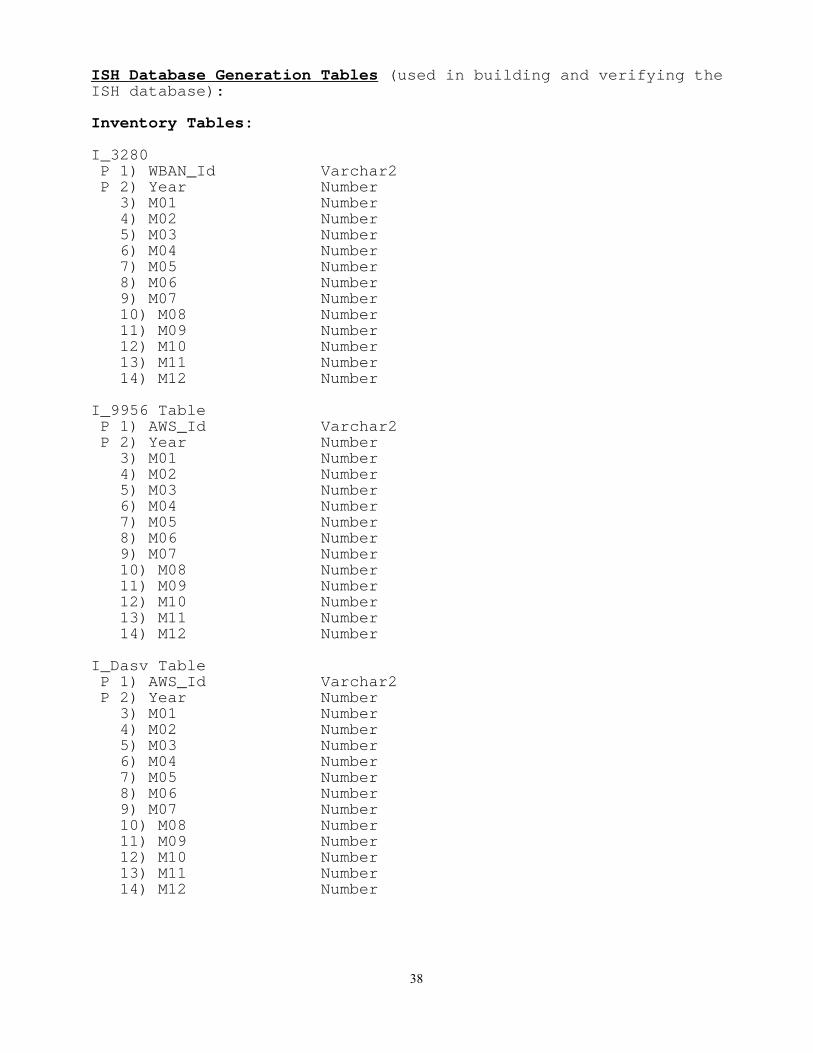
ISH Database Generation Tables (used in building and verifying theISH database):
Inventory Tables:
I_3280 P 1) WBAN_Id Varchar2 P 2) Year Number 3) M01 Number 4) M02 Number 5) M03 Number 6) M04 Number 7) M05 Number 8) M06 Number 9) M07 Number 10) M08 Number 11) M09 Number 12) M10 Number 13) M11 Number 14) M12 Number
I_9956 Table P 1) AWS_Id Varchar2 P 2) Year Number 3) M01 Number 4) M02 Number 5) M03 Number 6) M04 Number 7) M05 Number 8) M06 Number 9) M07 Number 10) M08 Number 11) M09 Number 12) M10 Number 13) M11 Number 14) M12 Number
I_Dasv Table P 1) AWS_Id Varchar2 P 2) Year Number 3) M01 Number 4) M02 Number 5) M03 Number 6) M04 Number 7) M05 Number 8) M06 Number 9) M07 Number 10) M08 Number 11) M09 Number 12) M10 Number 13) M11 Number 14) M12 Number

39
I_Diff Table P 1) AWS_Id Varchar2 P 2) WBAN_Id Varchar2 P 3) Year Number 4) M01 Number 5) M02 Number 6) M03 Number 7) M04 Number 8) M05 Number 9) M06 Number 10) M07 Number 11) M08 Number 12) M09 Number 13) M10 Number 14) M11 Number 15) M12 Number
I_ISH Table P 1) AWS_Id Varchar2 P 2) WBAN_Id Varchar2 P 3) Year Number 4) M01 Number 5) M02 Number 6) M03 Number 7) M04 Number 8) M05 Number 9) M06 Number 10) M07 Number 11) M08 Number 12) M09 Number 13) M10 Number 14) M11 Number 15) M12 Number
I_IshElem Table P 1) AWS_Id Varchar2 P 2) WBAN_Id Varchar2 P 3) Year Number P 4) Month_Id Number P 5) Elem_Id Varchar2 6) Elem_Count Number
Reference Tables:
Data_Source Table 1) DataSrcCd Character 2) DataSrcDesc Varchar2

40
ISH_Load_Stats Table I 1) AWS_Id Varchar2 I 2) WBAN_Id Varchar2 I 3) Year Number I 4) Month Number I 5) Day Number I 6) DataSrcFlag Character I 7) RptType Varchar2 8) Pre_S_Cnt Number 9) Pre_E_Cnt Number 10) Pre_R_Cnt Number 11) Post_S_Cnt Number 12) Post_E_Cnt Number 13) Post_R_Cnt Number
ISH_QC Table P 1) AWS_Id Varchar2 P 2) WBAN_Id Varchar2 P 3) Year Number P 4) Algorithm_Num Number 5) Errors_Corrected Number 6) Suspects Number
Station History Tables:
Adjust Table 1) AWS_Id Varchar2 2) WBAN_Id Varchar2 3) CoOp_Id Varchar2 4) Begin_Date Varchar2 5) End_Date Varchar2 6) Override_Flag Number
Bypass Table 1) WBAN_Id Varchar2
IshPOR1 Table 1) AWS_Id Varchar2 2) WBAN_Id Varchar2 3) CoOp_Id Varchar2 4) Begin_Date Varchar2 5) End_Date Varchar2 6) LatDegDec Varchar2 7) LongDegDec Varchar2 8) ElevMeters Varchar2 9) Call_Sign Varchar2 10) Updated Number
IshPOR2 Table 1) AWS_Id Varchar2 2) WBAN_Id Varchar2 3) Begin_Date Varchar2 4) End_Date Varchar2 5) End_Date2 Number
41
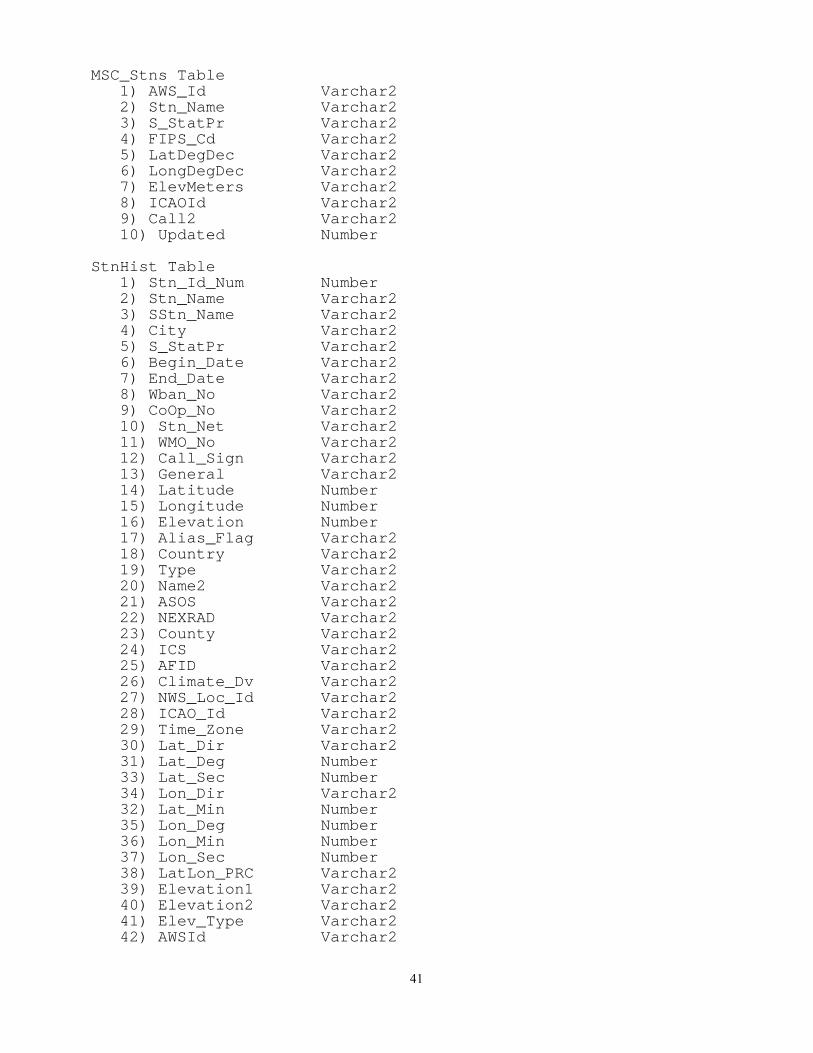
MSC_Stns Table 1) AWS_Id Varchar2 2) Stn_Name Varchar2 3) S_StatPr Varchar2 4) FIPS_Cd Varchar2 5) LatDegDec Varchar2 6) LongDegDec Varchar2 7) ElevMeters Varchar2 8) ICAOId Varchar2 9) Call2 Varchar2 10) Updated Number
StnHist Table 1) Stn_Id_Num Number 2) Stn_Name Varchar2 3) SStn_Name Varchar2 4) City Varchar2 5) S_StatPr Varchar2 6) Begin_Date Varchar2 7) End_Date Varchar2 8) Wban_No Varchar2 9) CoOp_No Varchar2 10) Stn_Net Varchar2 11) WMO_No Varchar2 12) Call_Sign Varchar2 13) General Varchar2 14) Latitude Number 15) Longitude Number 16) Elevation Number 17) Alias_Flag Varchar2 18) Country Varchar2 19) Type Varchar2 20) Name2 Varchar2 21) ASOS Varchar2 22) NEXRAD Varchar2 23) County Varchar2 24) ICS Varchar2 25) AFID Varchar2 26) Climate_Dv Varchar2 27) NWS_Loc_Id Varchar2 28) ICAO_Id Varchar2 29) Time_Zone Varchar2 30) Lat_Dir Varchar2 31) Lat_Deg Number 33) Lat_Sec Number 34) Lon_Dir Varchar2 32) Lat_Min Number 35) Lon_Deg Number 36) Lon_Min Number 37) Lon_Sec Number 38) LatLon_PRC Varchar2 39) Elevation1 Varchar2 40) Elevation2 Varchar2 41) Elev_Type Varchar2 42) AWSId Varchar2
42
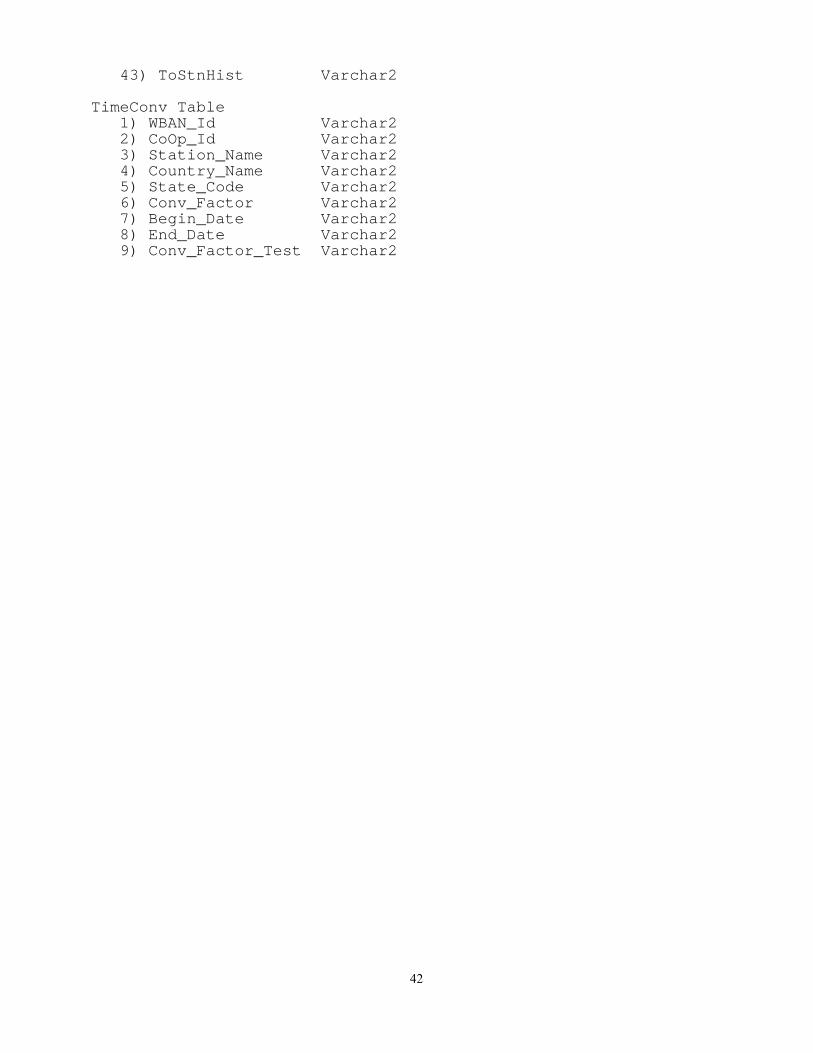
43) ToStnHist Varchar2
TimeConv Table 1) WBAN_Id Varchar2 2) CoOp_Id Varchar2 3) Station_Name Varchar2 4) Country_Name Varchar2 5) State_Code Varchar2 6) Conv_Factor Varchar2 7) Begin_Date Varchar2 8) End_Date Varchar2 9) Conv_Factor_Test Varchar2