Embed Size (px)
Citation preview
THE FAIRNESS OF AFFIRMATIVE ACTION:
AN ORGANISATIONAL JUSTICE PERSPECTIVE
by
MARIËTTE COETZEE
Submitted in partial fulfilment of
the requirements for the degree
PHILOSOPHIAE DOCTOR
(HUMAN RESOURCES MANAGEMENT)
in the
FACULTY OF ECONOMIC AND MANAGEMENT SCIENCES
at the
UNIVERSITY OF PRETORIA
PRETORIA October 2004
UUnniivveerrssiittyy ooff PPrreettoorriiaa eettdd –– CCooeettzzeeee,, MM ((22000055))

i
ACKNOWLEDGEMENTS
I wish to express my sincere appreciation to the many people who assisted me with this study. A special
word of thanks to the following people in particular:
# Prof Leo Vermeulen, my supervisor, for his commitment, guidance, professional approach and
time he spent in helping me to master the statistical aspects of the research. His dedication to
excellent service and gentle way of handling people are indeed a source of inspiration.
# The Centre for Business Management for providing financial support.
# My colleagues for their support and assistance with other work-related activities.
# Moya Joubert for editing my thesis.
! Babs Marais for typing my thesis.
# Dr Willem de Jager at the case bank for his support.
# Employees at the case bank who completed the questionnaire.
# My husband, Ernie, and children, Marié, Johan, and Marcel, for the sacrifices they have had to
make.
UUnniivveerrssiittyy ooff PPrreettoorriiaa eettdd –– CCooeettzzeeee,, MM ((22000055))
ii
TABLE OF CONTENTS
Page
ACKNOWLEDGEMENTS . . . . . . . . . . . . . . . . . . . . . . . . . . . . . . . . . . . . . . . . . . . . . . . . . . . . . . . . . . . i
LIST OF FIGURES . . . . . . . . . . . . . . . . . . . . . . . . . . . . . . . . . . . . . . . . . . . . . . . . . . . . . . . . . . . . . . . viii
LIST OF TABLES . . . . . . . . . . . . . . . . . . . . . . . . . . . . . . . . . . . . . . . . . . . . . . . . . . . . . . . . . . . . . . . . ix
SUMMARY . . . . . . . . . . . . . . . . . . . . . . . . . . . . . . . . . . . . . . . . . . . . . . . . . . . . . . . . . . . . . . . . . . . . . xiii
CHAPTER 1: GENERAL INTRODUCTION
1.1 INTRODUCTION . . . . . . . . . . . . . . . . . . . . . . . . . . . . . . . . . . . . . . . . . . . . . . . . . . . . . . . . . 1.1
1.2 PROBLEM FORMULATION . . . . . . . . . . . . . . . . . . . . . . . . . . . . . . . . . . . . . . . . . . . . . . . . 1.3
1.3 PURPOSE OF THE RESEARCH . . . . . . . . . . . . . . . . . . . . . . . . . . . . . . . . . . . . . . . . . . . . 1.6
1.4 PLAN OF THE RESEARCH . . . . . . . . . . . . . . . . . . . . . . . . . . . . . . . . . . . . . . . . . . . . . . . . 1.6
CHAPTER 2: AFFIRMATIVE ACTION: A THEORETICAL PERSPECTIVE
2.1 INTRODUCTION . . . . . . . . . . . . . . . . . . . . . . . . . . . . . . . . . . . . . . . . . . . . . . . . . . . . . . . . . 2.1
2.2 THE ORIGIN AND DEVELOPMENT OF AFFIRMATIVE ACTION . . . . . . . . . . . . . . . . . . . 2.1
2.3 DEFINING CONCEPTS . . . . . . . . . . . . . . . . . . . . . . . . . . . . . . . . . . . . . . . . . . . . . . . . . . . 2.3
2.4 OBJECTIVES OF AFFIRMATIVE ACTION . . . . . . . . . . . . . . . . . . . . . . . . . . . . . . . . . . . . . 2.7
2.4.1 Black Management Forum’s viewpoints . . . . . . . . . . . . . . . . . . . . . . . . . . . . . . . . . . . . . . . 2.7
2.4.2 Benefits of affirmative action . . . . . . . . . . . . . . . . . . . . . . . . . . . . . . . . . . . . . . . . . . . . . . . . 2.8
2.5 OBSTACLES TO AFFIRMATIVE ACTION SUCCESS . . . . . . . . . . . . . . . . . . . . . . . . . . . . 2.9
2.5.1 Implementation problems . . . . . . . . . . . . . . . . . . . . . . . . . . . . . . . . . . . . . . . . . . . . . . . . . 2.10
2.5.2 Strategic concerns . . . . . . . . . . . . . . . . . . . . . . . . . . . . . . . . . . . . . . . . . . . . . . . . . . . . . . . 2.10
2.5.3 Organisational concerns . . . . . . . . . . . . . . . . . . . . . . . . . . . . . . . . . . . . . . . . . . . . . . . . . . 2.11
2.5.4 The costs of affirmative action . . . . . . . . . . . . . . . . . . . . . . . . . . . . . . . . . . . . . . . . . . . . . . 2.12
2.5.5 Implementation issues . . . . . . . . . . . . . . . . . . . . . . . . . . . . . . . . . . . . . . . . . . . . . . . . . . . . 2.12
2.5.6 Critical success factors . . . . . . . . . . . . . . . . . . . . . . . . . . . . . . . . . . . . . . . . . . . . . . . . . . . 2.14
2.6 JUSTIFICATION FOR AFFIRMATIVE ACTION . . . . . . . . . . . . . . . . . . . . . . . . . . . . . . . . 2.15
2.7 SUMMARY . . . . . . . . . . . . . . . . . . . . . . . . . . . . . . . . . . . . . . . . . . . . . . . . . . . . . . . . . . . . 2.17
CHAPTER 3: AFFIRMATIVE ACTION AT ORGANISATIONAL LEVEL
3.1 INTRODUCTION . . . . . . . . . . . . . . . . . . . . . . . . . . . . . . . . . . . . . . . . . . . . . . . . . . . . . . . . . 3.1
3.2 EQUALITY AND JUSTICE . . . . . . . . . . . . . . . . . . . . . . . . . . . . . . . . . . . . . . . . . . . . . . . . . 3.2
3.3 THE EMPLOYMENT EQUITY ACT 55 OF 1998 . . . . . . . . . . . . . . . . . . . . . . . . . . . . . . . . 3.2
UUnniivveerrssiittyy ooff PPrreettoorriiaa eettdd –– CCooeettzzeeee,, MM ((22000055))
iii
3.3.1 Unfair discrimination . . . . . . . . . . . . . . . . . . . . . . . . . . . . . . . . . . . . . . . . . . . . . . . . . . . . . . 3.3
3.3.2 Affirmative action . . . . . . . . . . . . . . . . . . . . . . . . . . . . . . . . . . . . . . . . . . . . . . . . . . . . . . . . . 3.4
3.4 PROMOTION OF EQUALITY AND THE PREVENTION OF UNFAIR
DISCRIMINATION ACT 4 of 2000 . . . . . . . . . . . . . . . . . . . . . . . . . . . . . . . . . . . . . . . . . . . 3.5
3.5 THE IMPLEMENTATION OF AFFIRMATIVE ACTION . . . . . . . . . . . . . . . . . . . . . . . . . . . . 3.6
3.5.1 A strategic approach to affirmative action . . . . . . . . . . . . . . . . . . . . . . . . . . . . . . . . . . . . . . 3.6
3.6 THE IMPLICATIONS OF AFFIRMATIVE ACTION ON ORGANISATIONAL POLICIES,
PROCEDURES AND PRACTICES . . . . . . . . . . . . . . . . . . . . . . . . . . . . . . . . . . . . . . . . . . . 3.7
3.6.1 Recruitment . . . . . . . . . . . . . . . . . . . . . . . . . . . . . . . . . . . . . . . . . . . . . . . . . . . . . . . . . . . . . 3.7
3.6.2 Selection criteria . . . . . . . . . . . . . . . . . . . . . . . . . . . . . . . . . . . . . . . . . . . . . . . . . . . . . . . . . 3.9
3.6.3 Human resource policy . . . . . . . . . . . . . . . . . . . . . . . . . . . . . . . . . . . . . . . . . . . . . . . . . . . 3.10
3.6.4 Interviews . . . . . . . . . . . . . . . . . . . . . . . . . . . . . . . . . . . . . . . . . . . . . . . . . . . . . . . . . . . . . 3.10
3.6.5 Reference checking (background checks) . . . . . . . . . . . . . . . . . . . . . . . . . . . . . . . . . . . . 3.11
3.6.6 Manpower planning . . . . . . . . . . . . . . . . . . . . . . . . . . . . . . . . . . . . . . . . . . . . . . . . . . . . . . 3.12
3.6.7 Pre-employment testing . . . . . . . . . . . . . . . . . . . . . . . . . . . . . . . . . . . . . . . . . . . . . . . . . . . 3.12
3.6.8 Harassment . . . . . . . . . . . . . . . . . . . . . . . . . . . . . . . . . . . . . . . . . . . . . . . . . . . . . . . . . . . . 3.13
3.6.9 Induction/orientation . . . . . . . . . . . . . . . . . . . . . . . . . . . . . . . . . . . . . . . . . . . . . . . . . . . . . 3.13
3.6.10 Career planning and development . . . . . . . . . . . . . . . . . . . . . . . . . . . . . . . . . . . . . . . . . . 3.14
3.6.11 Communication . . . . . . . . . . . . . . . . . . . . . . . . . . . . . . . . . . . . . . . . . . . . . . . . . . . . . . . . . 3.14
3.6.12 Treatment in the workplace . . . . . . . . . . . . . . . . . . . . . . . . . . . . . . . . . . . . . . . . . . . . . . . . 3.15
3.7 SUMMARY . . . . . . . . . . . . . . . . . . . . . . . . . . . . . . . . . . . . . . . . . . . . . . . . . . . . . . . . . . . . 3.17
CHAPTER 4: ORGANISATIONAL JUSTICE
4.1 INTRODUCTION . . . . . . . . . . . . . . . . . . . . . . . . . . . . . . . . . . . . . . . . . . . . . . . . . . . . . . . . . 4.1
4.2 ORGANISATIONAL JUSTICE . . . . . . . . . . . . . . . . . . . . . . . . . . . . . . . . . . . . . . . . . . . . . . 4.2
4.2.1 Reactive content theories . . . . . . . . . . . . . . . . . . . . . . . . . . . . . . . . . . . . . . . . . . . . . . . . . . 4.3
4.2.2 Proactive content theories . . . . . . . . . . . . . . . . . . . . . . . . . . . . . . . . . . . . . . . . . . . . . . . . . . 4.3
4.2.3 Reactive process theories . . . . . . . . . . . . . . . . . . . . . . . . . . . . . . . . . . . . . . . . . . . . . . . . . . 4.3
4.2.4 Proactive process theories . . . . . . . . . . . . . . . . . . . . . . . . . . . . . . . . . . . . . . . . . . . . . . . . . 4.4
4.3 DISTRIBUTIVE JUSTICE . . . . . . . . . . . . . . . . . . . . . . . . . . . . . . . . . . . . . . . . . . . . . . . . . . 4.5
4.4 PROCEDURAL JUSTICE . . . . . . . . . . . . . . . . . . . . . . . . . . . . . . . . . . . . . . . . . . . . . . . . . . 4.6
4.5 INTERACTIONAL JUSTICE . . . . . . . . . . . . . . . . . . . . . . . . . . . . . . . . . . . . . . . . . . . . . . . . 4.9
4.6 EMPLOYEES’ BEHAVIOUR IN RESPONSE TO INJUSTICE . . . . . . . . . . . . . . . . . . . . . 4.10
4.6.1 Naming . . . . . . . . . . . . . . . . . . . . . . . . . . . . . . . . . . . . . . . . . . . . . . . . . . . . . . . . . . . . . . . 4.10
4.6.2 Blaming . . . . . . . . . . . . . . . . . . . . . . . . . . . . . . . . . . . . . . . . . . . . . . . . . . . . . . . . . . . . . . . 4.11
4.7 ACTING ON INJUSTICE . . . . . . . . . . . . . . . . . . . . . . . . . . . . . . . . . . . . . . . . . . . . . . . . . . 4.12
4.7.1 Factors influencing a person’s need to act on an injustice . . . . . . . . . . . . . . . . . . . . . . . . 4.13
4.7.2 Factors influencing choice of action . . . . . . . . . . . . . . . . . . . . . . . . . . . . . . . . . . . . . . . . . 4.14
UUnniivveerrssiittyy ooff PPrreettoorriiaa eettdd –– CCooeettzzeeee,, MM ((22000055))

iv
4.8 HANDLING EMPLOYEES’ REACTIONS TO INJUSTICES . . . . . . . . . . . . . . . . . . . . . . . 4.16
4.8.1 Eliminate gross injustices . . . . . . . . . . . . . . . . . . . . . . . . . . . . . . . . . . . . . . . . . . . . . . . . . 4.16
4.8.2 Provide accessible and effective mechanisms for responses to injustices . . . . . . . . . . . . 4.16
4.8.3 Allow employee voice . . . . . . . . . . . . . . . . . . . . . . . . . . . . . . . . . . . . . . . . . . . . . . . . . . . . 4.16
4.9 MANAGING AFFIRMATIVE ACTION FAIRLY . . . . . . . . . . . . . . . . . . . . . . . . . . . . . . . . . 4.18
4.9.1 Selection of decision makers . . . . . . . . . . . . . . . . . . . . . . . . . . . . . . . . . . . . . . . . . . . . . . . 4.19
4.9.2 Setting ground rules (criteria) for evaluating rewards . . . . . . . . . . . . . . . . . . . . . . . . . . . . 4.19
4.9.3 Methods for collecting information . . . . . . . . . . . . . . . . . . . . . . . . . . . . . . . . . . . . . . . . . . . 4.19
4.9.4 Procedures for defining the decision process . . . . . . . . . . . . . . . . . . . . . . . . . . . . . . . . . . 4.19
4.9.5 Safeguards against abuse of power . . . . . . . . . . . . . . . . . . . . . . . . . . . . . . . . . . . . . . . . . 4.19
4.9.6 Procedures for appeals . . . . . . . . . . . . . . . . . . . . . . . . . . . . . . . . . . . . . . . . . . . . . . . . . . . 4.20
4.9.7 The availability of change mechanisms . . . . . . . . . . . . . . . . . . . . . . . . . . . . . . . . . . . . . . . 4.20
4.10 SUMMARY . . . . . . . . . . . . . . . . . . . . . . . . . . . . . . . . . . . . . . . . . . . . . . . . . . . . . . . . . . . . 4.20
CHAPTER 5: EMPLOYEE COMMITMENT
5.1 INTRODUCTION . . . . . . . . . . . . . . . . . . . . . . . . . . . . . . . . . . . . . . . . . . . . . . . . . . . . . . . . . 5.1
5.2 DEFINING COMMITMENT . . . . . . . . . . . . . . . . . . . . . . . . . . . . . . . . . . . . . . . . . . . . . . . . . 5.2
5.3 A THREE-COMPONENT CONCEPTUALIZATION OF ORGANISATIONAL
COMMITMENT - MODEL DEVELOPED BY MEYER AND ALLEN . . . . . . . . . . . . . . . . . . 5.4
5.3.1 Affective commitment . . . . . . . . . . . . . . . . . . . . . . . . . . . . . . . . . . . . . . . . . . . . . . . . . . . . . 5.4
5.3.2 Continuance commitment . . . . . . . . . . . . . . . . . . . . . . . . . . . . . . . . . . . . . . . . . . . . . . . . . . 5.5
5.3.3 Normative commitment . . . . . . . . . . . . . . . . . . . . . . . . . . . . . . . . . . . . . . . . . . . . . . . . . . . . 5.5
5.4 CONCEPTUALIZATION OF COMMITMENT - MODEL DEVELOPED
BY O’REILLY AND CHATMAN . . . . . . . . . . . . . . . . . . . . . . . . . . . . . . . . . . . . . . . . . . . . . . 5.5
5.5 COMMITMENT AND WORK BEHAVIOUR . . . . . . . . . . . . . . . . . . . . . . . . . . . . . . . . . . . . . 5.7
5.6 ORGANISATIONAL CITIZENSHIP BEHAVIOUR . . . . . . . . . . . . . . . . . . . . . . . . . . . . . . . . 5.8
5.7 PREDICTORS OF EMPLOYEE COMMITMENT . . . . . . . . . . . . . . . . . . . . . . . . . . . . . . . 5.10
5.7.1 Personal factors . . . . . . . . . . . . . . . . . . . . . . . . . . . . . . . . . . . . . . . . . . . . . . . . . . . . . . . . . 5.11
5.7.2 Situational factors . . . . . . . . . . . . . . . . . . . . . . . . . . . . . . . . . . . . . . . . . . . . . . . . . . . . . . . 5.11
5.7.3 Positional factors . . . . . . . . . . . . . . . . . . . . . . . . . . . . . . . . . . . . . . . . . . . . . . . . . . . . . . . . 5.13
5.8 ORGANISATIONAL CHANGE . . . . . . . . . . . . . . . . . . . . . . . . . . . . . . . . . . . . . . . . . . . . . 5.14
5.9 ORGANISATIONAL ACTIONS THAT ENCOURAGE COMMITMENT . . . . . . . . . . . . . . . 5.14
5.9.1 Drivers of employee commitment . . . . . . . . . . . . . . . . . . . . . . . . . . . . . . . . . . . . . . . . . . . 5.15
5.10 THE RELATIONSHIP BETWEEN JUSTICE PERCEPTIONS AND COMMITMENT . . . . 5.17
5.11 SUMMARY . . . . . . . . . . . . . . . . . . . . . . . . . . . . . . . . . . . . . . . . . . . . . . . . . . . . . . . . . . . . 5.18
UUnniivveerrssiittyy ooff PPrreettoorriiaa eettdd –– CCooeettzzeeee,, MM ((22000055))

v
CHAPTER 6: AN OVERVIEW OF THE BANKING SECTOR
6.1 INTRODUCTION . . . . . . . . . . . . . . . . . . . . . . . . . . . . . . . . . . . . . . . . . . . . . . . . . . . . . . . . . 6.1
6.2 AN OVERVIEW OF THE CASE BANK . . . . . . . . . . . . . . . . . . . . . . . . . . . . . . . . . . . . . . . . 6.2
6.2.1 Learning and development . . . . . . . . . . . . . . . . . . . . . . . . . . . . . . . . . . . . . . . . . . . . . . . . . 6.2
6.2.2 Diversity and employment equity . . . . . . . . . . . . . . . . . . . . . . . . . . . . . . . . . . . . . . . . . . . . . 6.3
6.2.3 Change initiatives . . . . . . . . . . . . . . . . . . . . . . . . . . . . . . . . . . . . . . . . . . . . . . . . . . . . . . . . 6.5
6.3 SUMMARY . . . . . . . . . . . . . . . . . . . . . . . . . . . . . . . . . . . . . . . . . . . . . . . . . . . . . . . . . . . . . 6.6
CHAPTER 7: RESEARCH AND STATISTICAL METHODOLOGY
7.1 INTRODUCTION . . . . . . . . . . . . . . . . . . . . . . . . . . . . . . . . . . . . . . . . . . . . . . . . . . . . . . . . . 7.1
7.2 THE RESEARCH METHOD . . . . . . . . . . . . . . . . . . . . . . . . . . . . . . . . . . . . . . . . . . . . . . . . 7.1
7.2.1 The questionnaire . . . . . . . . . . . . . . . . . . . . . . . . . . . . . . . . . . . . . . . . . . . . . . . . . . . . . . . . 7.2
7.3 THE LAYOUT OF THE QUESTIONNAIRE USED IN THIS STUDY . . . . . . . . . . . . . . . . . . 7.7
7.3.1 Type of questionnaire used . . . . . . . . . . . . . . . . . . . . . . . . . . . . . . . . . . . . . . . . . . . . . . . . . 7.7
7.3.2 Layout of the questionnaire . . . . . . . . . . . . . . . . . . . . . . . . . . . . . . . . . . . . . . . . . . . . . . . . . 7.7
7.3.3 Appearance of the questionnaire . . . . . . . . . . . . . . . . . . . . . . . . . . . . . . . . . . . . . . . . . . . . . 7.8
7.4 PRETESTING OF THE QUESTIONNAIRE . . . . . . . . . . . . . . . . . . . . . . . . . . . . . . . . . . . . 7.8
7.5 DISTRIBUTION OF THE QUESTIONNAIRES . . . . . . . . . . . . . . . . . . . . . . . . . . . . . . . . . . 7.9
7.6 COMPUTERISATION AND CODING OF THE DATA . . . . . . . . . . . . . . . . . . . . . . . . . . . . . 7.9
7.7 POPULATION AND SAMPLING . . . . . . . . . . . . . . . . . . . . . . . . . . . . . . . . . . . . . . . . . . . . . 7.9
7.7.1 Gender . . . . . . . . . . . . . . . . . . . . . . . . . . . . . . . . . . . . . . . . . . . . . . . . . . . . . . . . . . . . . . . . 7.13
7.7.2 Ethnicity . . . . . . . . . . . . . . . . . . . . . . . . . . . . . . . . . . . . . . . . . . . . . . . . . . . . . . . . . . . . . . . 7.13
7.7.3 Age . . . . . . . . . . . . . . . . . . . . . . . . . . . . . . . . . . . . . . . . . . . . . . . . . . . . . . . . . . . . . . . . . . 7.13
7.7.4 Marital status . . . . . . . . . . . . . . . . . . . . . . . . . . . . . . . . . . . . . . . . . . . . . . . . . . . . . . . . . . . 7.14
7.7.5 Years in current position . . . . . . . . . . . . . . . . . . . . . . . . . . . . . . . . . . . . . . . . . . . . . . . . . . 7.14
7.7.6 Years of service at the bank . . . . . . . . . . . . . . . . . . . . . . . . . . . . . . . . . . . . . . . . . . . . . . . 7.14
7.7.7 Staff category . . . . . . . . . . . . . . . . . . . . . . . . . . . . . . . . . . . . . . . . . . . . . . . . . . . . . . . . . . 7.15
7.7.8 Highest qualification . . . . . . . . . . . . . . . . . . . . . . . . . . . . . . . . . . . . . . . . . . . . . . . . . . . . . 7.15
7.7.9 Gross monthly salary . . . . . . . . . . . . . . . . . . . . . . . . . . . . . . . . . . . . . . . . . . . . . . . . . . . . . 7.16
7.7.10 Employment equity appointment . . . . . . . . . . . . . . . . . . . . . . . . . . . . . . . . . . . . . . . . . . . . 7.17
7.8 LEVELS OF MEASUREMENT . . . . . . . . . . . . . . . . . . . . . . . . . . . . . . . . . . . . . . . . . . . . . 7.17
7.9 STATISTICAL METHODS . . . . . . . . . . . . . . . . . . . . . . . . . . . . . . . . . . . . . . . . . . . . . . . . . 7.18
7.10 STATISTICAL ANALYSIS . . . . . . . . . . . . . . . . . . . . . . . . . . . . . . . . . . . . . . . . . . . . . . . . . 7.19
7.11 DESCRIPTIVE STATISTICS . . . . . . . . . . . . . . . . . . . . . . . . . . . . . . . . . . . . . . . . . . . . . . . 7.19
7.11.1 Factor analysis . . . . . . . . . . . . . . . . . . . . . . . . . . . . . . . . . . . . . . . . . . . . . . . . . . . . . . . . . 7.19
7.11.2 Reliability analysis . . . . . . . . . . . . . . . . . . . . . . . . . . . . . . . . . . . . . . . . . . . . . . . . . . . . . . . 7.22
7.11.3 Analysis of item distribution . . . . . . . . . . . . . . . . . . . . . . . . . . . . . . . . . . . . . . . . . . . . . . . . 7.22
UUnniivveerrssiittyy ooff PPrreettoorriiaa eettdd –– CCooeettzzeeee,, MM ((22000055))

vi
7.12 COMPARATIVE STATISTICS . . . . . . . . . . . . . . . . . . . . . . . . . . . . . . . . . . . . . . . . . . . . . 7.23
7.12.1 Students’ t-test . . . . . . . . . . . . . . . . . . . . . . . . . . . . . . . . . . . . . . . . . . . . . . . . . . . . . . . . . . 7.23
7.12.2 One-way analysis of variance . . . . . . . . . . . . . . . . . . . . . . . . . . . . . . . . . . . . . . . . . . . . . . 7.23
7.12.3 N-way univariate analysis of variance . . . . . . . . . . . . . . . . . . . . . . . . . . . . . . . . . . . . . . . . 7.23
7.12.4 Multivariate analysis of variance . . . . . . . . . . . . . . . . . . . . . . . . . . . . . . . . . . . . . . . . . . . . 7.24
7.13 ASSOCIATIONAL STATISTICS . . . . . . . . . . . . . . . . . . . . . . . . . . . . . . . . . . . . . . . . . . . . 7.24
7.13.1 Correlation analysis . . . . . . . . . . . . . . . . . . . . . . . . . . . . . . . . . . . . . . . . . . . . . . . . . . . . . . 7.24
7.13.2 Multiple regression analysis . . . . . . . . . . . . . . . . . . . . . . . . . . . . . . . . . . . . . . . . . . . . . . . 7.25
7.14 ANALYSIS OF COMPLIANCE WITH SPECIFIC ASSUMPTIONS . . . . . . . . . . . . . . . . . . 7.26
7.14.1 Sampling adequacy . . . . . . . . . . . . . . . . . . . . . . . . . . . . . . . . . . . . . . . . . . . . . . . . . . . . . . 7.26
7.14.2 Sphericity . . . . . . . . . . . . . . . . . . . . . . . . . . . . . . . . . . . . . . . . . . . . . . . . . . . . . . . . . . . . . . 7.27
7.14.3 Homogeneity of variance . . . . . . . . . . . . . . . . . . . . . . . . . . . . . . . . . . . . . . . . . . . . . . . . . . 7.27
7.14.4 Equality of covariance . . . . . . . . . . . . . . . . . . . . . . . . . . . . . . . . . . . . . . . . . . . . . . . . . . . . 7.27
7.15 STATISTICAL SIGNIFICANCE . . . . . . . . . . . . . . . . . . . . . . . . . . . . . . . . . . . . . . . . . . . . . 7.27
7.15.1 Practical significance . . . . . . . . . . . . . . . . . . . . . . . . . . . . . . . . . . . . . . . . . . . . . . . . . . . . . 7.28
7.16 SUMMARY . . . . . . . . . . . . . . . . . . . . . . . . . . . . . . . . . . . . . . . . . . . . . . . . . . . . . . . . . . . . 7.31
CHAPTER 8: RESULTS
8.1 INTRODUCTION . . . . . . . . . . . . . . . . . . . . . . . . . . . . . . . . . . . . . . . . . . . . . . . . . . . . . . . . . 8.1
8.2 FACTOR ANALYSIS . . . . . . . . . . . . . . . . . . . . . . . . . . . . . . . . . . . . . . . . . . . . . . . . . . . . . . 8.1
8.2.1 Perceptions of the fairness of affirmative action (section B) . . . . . . . . . . . . . . . . . . . . . . . . 8.1
8.2.2 Treatment of AA employees in the workplace (section C) . . . . . . . . . . . . . . . . . . . . . . . . . 8.5
8.2.3 Commitment (section D) . . . . . . . . . . . . . . . . . . . . . . . . . . . . . . . . . . . . . . . . . . . . . . . . . . . 8.9
8.2.4 Factorial reliability . . . . . . . . . . . . . . . . . . . . . . . . . . . . . . . . . . . . . . . . . . . . . . . . . . . . . . . 8.12
8.3 COMPARATIVE STATISTICS . . . . . . . . . . . . . . . . . . . . . . . . . . . . . . . . . . . . . . . . . . . . . 8.22
8.3.1 Students’ t-test of difference of means . . . . . . . . . . . . . . . . . . . . . . . . . . . . . . . . . . . . . . . 8.22
8.3.2 One-way analysis of variance . . . . . . . . . . . . . . . . . . . . . . . . . . . . . . . . . . . . . . . . . . . . . . 8.31
8.3.3 Multiple analysis of variance (MANOVA) . . . . . . . . . . . . . . . . . . . . . . . . . . . . . . . . . . . . . 8.40
8.4 ASSOCIATIONAL STATISTICS . . . . . . . . . . . . . . . . . . . . . . . . . . . . . . . . . . . . . . . . . . . . 8.52
8.4.1 Correlation . . . . . . . . . . . . . . . . . . . . . . . . . . . . . . . . . . . . . . . . . . . . . . . . . . . . . . . . . . . . . 8.52
8.4.2 Multiple regression . . . . . . . . . . . . . . . . . . . . . . . . . . . . . . . . . . . . . . . . . . . . . . . . . . . . . . 8.55
8.5 SUMMARY . . . . . . . . . . . . . . . . . . . . . . . . . . . . . . . . . . . . . . . . . . . . . . . . . . . . . . . . . . . . 8.60
UUnniivveerrssiittyy ooff PPrreettoorriiaa eettdd –– CCooeettzzeeee,, MM ((22000055))

vii
CHAPTER 9: SUMMARY AND RECOMMENDATIONS
9.1 INTRODUCTION . . . . . . . . . . . . . . . . . . . . . . . . . . . . . . . . . . . . . . . . . . . . . . . . . . . . . . . . . 9.1
9.2 RESEARCH OBJECTIVES . . . . . . . . . . . . . . . . . . . . . . . . . . . . . . . . . . . . . . . . . . . . . . . . . 9.1
9.3 RESEARCH METHODOLOGY . . . . . . . . . . . . . . . . . . . . . . . . . . . . . . . . . . . . . . . . . . . . . . 9.2
9.4 RESEARCH FINDINGS . . . . . . . . . . . . . . . . . . . . . . . . . . . . . . . . . . . . . . . . . . . . . . . . . . . 9.3
9.4.1 Major components of affirmative action fairness . . . . . . . . . . . . . . . . . . . . . . . . . . . . . . . . . 9.3
9.4.2 Major components of the treatment of affirmative action employees . . . . . . . . . . . . . . . . . 9.4
9.4.3 Major components of employee commitment . . . . . . . . . . . . . . . . . . . . . . . . . . . . . . . . . . . 9.5
9.5 DIFFERENCES BETWEEN THE VARIOUS EMPLOYEE GROUPS REGARDING
PERCEPTIONS OF AFFIRMATIVE ACTION FAIRNESS . . . . . . . . . . . . . . . . . . . . . . . . . 9.5
9.6 RELATIONSHIP BETWEEN AFFIRMATIVE ACTION FAIRNESS AND
THE BEHAVIOURAL DOMAINS . . . . . . . . . . . . . . . . . . . . . . . . . . . . . . . . . . . . . . . . . . . . 9.7
9.6.1 How the treatment of affirmative action employees influence
fairness perceptions . . . . . . . . . . . . . . . . . . . . . . . . . . . . . . . . . . . . . . . . . . . . . . . . . . . . . . 9.7
9.6.2 How perceptions about the fairness of affirmative action influence
employees’ commitment . . . . . . . . . . . . . . . . . . . . . . . . . . . . . . . . . . . . . . . . . . . . . . . . . . . 9.7
9.7 LIMITATIONS AND SUGGESTIONS FOR FUTURE RESEARCH . . . . . . . . . . . . . . . . . . 9.8
9.8 MANAGERIAL IMPLICATIONS AND RECOMMENDATIONS . . . . . . . . . . . . . . . . . . . . . . 9.9
9.9 CONCLUDING REMARKS . . . . . . . . . . . . . . . . . . . . . . . . . . . . . . . . . . . . . . . . . . . . . . . . 9.10
APPENDICES
APPENDIX A COVER LETTER
APPENDIX B QUESTIONNAIRE
APPENDIX C RELATIONSHIP BETWEEN AA FAIRNESS AND THE BEHAVIOURAL DOMAINS
BIBLIOGRAPHY
UUnniivveerrssiittyy ooff PPrreettoorriiaa eettdd –– CCooeettzzeeee,, MM ((22000055))
viii
LIST OF FIGURES
Page
CHAPTER 2
Figure 2.1 South African population according to ethnicity . . . . . . . . . . . . . . . . . . . . . . . . . . . . 2.3
Figure 2.2 Total employment profile according to ethnicity . . . . . . . . . . . . . . . . . . . . . . . . . . . . 2.4
CHAPTER 3
Figure 3.1 Employment equity . . . . . . . . . . . . . . . . . . . . . . . . . . . . . . . . . . . . . . . . . . . . . . . . . . 3.3
Figure 3.2 Steps in the implementation of an affirmative action programme . . . . . . . . . . . . . . 3.8
CHAPTER 4
Figure 4.1 Organisational justice . . . . . . . . . . . . . . . . . . . . . . . . . . . . . . . . . . . . . . . . . . . . . . . . 4.5
Figure 4.2 Behavioural responses to dissatisfaction . . . . . . . . . . . . . . . . . . . . . . . . . . . . . . . . 4.14
CHAPTER 5
Figure 5.1 General model of workplace commitment . . . . . . . . . . . . . . . . . . . . . . . . . . . . . . . . 5.6
CHAPTER 6
Figure 6.1 Workplace profile according to ethnic group . . . . . . . . . . . . . . . . . . . . . . . . . . . . . . 6.4
CHAPTER 7
Figure 7.1 The research process . . . . . . . . . . . . . . . . . . . . . . . . . . . . . . . . . . . . . . . . . . . . . . . . 7.1
Figure 7.2 Respondents according to ethnic group . . . . . . . . . . . . . . . . . . . . . . . . . . . . . . . . . 7.13
Figure 7.3 Respondents according to age . . . . . . . . . . . . . . . . . . . . . . . . . . . . . . . . . . . . . . . . 7.14
Figure 7.4 Respondents according to staff category . . . . . . . . . . . . . . . . . . . . . . . . . . . . . . . . 7.15
Figure 7.5 Respondents according to monthly salary . . . . . . . . . . . . . . . . . . . . . . . . . . . . . . . 7.16
CHAPTER 8
Figure 8.1 Scree plot - Factor analysis: affirmative action fairness . . . . . . . . . . . . . . . . . . . . . . 8.3
Figure 8.2 Scree plot - Factor analysis: treatment of AA employees in the workplace . . . . . . . 8.7
Figure 8.3 Scree plot - Factor analysis: commitment . . . . . . . . . . . . . . . . . . . . . . . . . . . . . . . 8.10
Figure 8.4 Mean, standard deviation and distribution of factors for organisational justice . . . 8.19
Figure 8.5 Mean, standard deviation and distribution of factors for treatment of
AA employees in the workplace . . . . . . . . . . . . . . . . . . . . . . . . . . . . . . . . . . . . . . . 8.20
Figure 8.6 Mean, standard deviation and distribution of factors for commitment . . . . . . . . . . 8.21
UUnniivveerrssiittyy ooff PPrreettoorriiaa eettdd –– CCooeettzzeeee,, MM ((22000055))

ix
LIST OF TABLES
Page
CHAPTER 2
Table 2.1 Legal and statutory regulation of the employment relationship . . . . . . . . . . . . . . . . . . 2.2
Table 2.2 Differences between affirmative action and employment equity . . . . . . . . . . . . . . . . . 2.6
CHAPTER 3
Table 3.1 Poor interviews . . . . . . . . . . . . . . . . . . . . . . . . . . . . . . . . . . . . . . . . . . . . . . . . . . . . . 3.11
Table 3.2 Affirmative action principles to be agreed upon . . . . . . . . . . . . . . . . . . . . . . . . . . . . 3.14
Table 3.3 Sources of resistance to change . . . . . . . . . . . . . . . . . . . . . . . . . . . . . . . . . . . . . . . . 3.16
CHAPTER 4
Table 4.1 Research questions related to organisational justice theories . . . . . . . . . . . . . . . . . . 4.3
Table 4.2 Attributes of effective voice systems . . . . . . . . . . . . . . . . . . . . . . . . . . . . . . . . . . . . . 4.17
CHAPTER 5
Table 5.1 Definitions of commitment . . . . . . . . . . . . . . . . . . . . . . . . . . . . . . . . . . . . . . . . . . . . . . 5.2
Table 5.2 Organisational commitment within multidimensional models . . . . . . . . . . . . . . . . . . . 5.3
CHAPTER 6
Table 6.1 Number and categories of employees trained during 2003 . . . . . . . . . . . . . . . . . . . . . 6.2
Table 6.2 Employee statistics . . . . . . . . . . . . . . . . . . . . . . . . . . . . . . . . . . . . . . . . . . . . . . . . . . . 6.3
CHAPTER 7
Table 7.1 The advantages and disadvantages of questionnaires . . . . . . . . . . . . . . . . . . . . . . . . 7.3
Table 7.2 Requirements for the design of a good questionnaire . . . . . . . . . . . . . . . . . . . . . . . . 7.3
Table 7.3 Leedy’s requirements for a good questionnaire . . . . . . . . . . . . . . . . . . . . . . . . . . . . . 7.4
Table 7.4 Guidelines on formulating good questions . . . . . . . . . . . . . . . . . . . . . . . . . . . . . . . . . 7.5
Table 7.5 Layout of the questionnaire . . . . . . . . . . . . . . . . . . . . . . . . . . . . . . . . . . . . . . . . . . . . . 7.7
Table 7.6 Population, sample and response rate of each group . . . . . . . . . . . . . . . . . . . . . . . . 7.10
Table 7.7 Determining the sample size . . . . . . . . . . . . . . . . . . . . . . . . . . . . . . . . . . . . . . . . . . . 7.11
Table 7.8 Biographical data of respondents . . . . . . . . . . . . . . . . . . . . . . . . . . . . . . . . . . . . . . . 7.12
Table 7.9 Educational qualifications . . . . . . . . . . . . . . . . . . . . . . . . . . . . . . . . . . . . . . . . . . . . . 7.16
Table 7.10 Employment equity appointments . . . . . . . . . . . . . . . . . . . . . . . . . . . . . . . . . . . . . . . 7.17
UUnniivveerrssiittyy ooff PPrreettoorriiaa eettdd –– CCooeettzzeeee,, MM ((22000055))

x
CHAPTER 8
Table 8.1 KMO and Bartlett’s test: AA fairness . . . . . . . . . . . . . . . . . . . . . . . . . . . . . . . . . . . . . . 8.2
Table 8.2 Eigenvalues and total variance explained by the factors of
affirmative action fairness . . . . . . . . . . . . . . . . . . . . . . . . . . . . . . . . . . . . . . . . . . . . . . 8.2
Table 8.3 Rotated factor matrix for affirmative action fairness . . . . . . . . . . . . . . . . . . . . . . . . . . 8.3
Table 8.4 KMO and Bartlett’s test: treatment of AA employees . . . . . . . . . . . . . . . . . . . . . . . . . 8.6
Table 8.5 Eigenvalues and total variance explained by the factors of
treatment of AA employees in the workplace . . . . . . . . . . . . . . . . . . . . . . . . . . . . . . . 8.6
Table 8.6 Rotated factor matrix for treatment of AA employees in the workplace . . . . . . . . . . . 8.7
Table 8.7 KMO and Bartlett’s test: commitment . . . . . . . . . . . . . . . . . . . . . . . . . . . . . . . . . . . . . 8.9
Table 8.8 Eigenvalues and total variance explained by the factors of
commitment . . . . . . . . . . . . . . . . . . . . . . . . . . . . . . . . . . . . . . . . . . . . . . . . . . . . . . . . 8.10
Table 8.9 Rotated factor matrix for commitment . . . . . . . . . . . . . . . . . . . . . . . . . . . . . . . . . . . . 8.11
Table 8.10 Reliability analysis - Factor B1 (interactional justice) . . . . . . . . . . . . . . . . . . . . . . . . 8.13
Table 8.11 Reliability analysis - Factor B2 (procedural justice: input) . . . . . . . . . . . . . . . . . . . . . 8.13
Table 8.12 Reliability analysis - Factor B3 (procedural justice: criteria) . . . . . . . . . . . . . . . . . . . 8.14
Table 8.13 Reliability analysis - Factor B4 (distributive justice) . . . . . . . . . . . . . . . . . . . . . . . . . 8.14
Table 8.14 Reliability analysis - Factor C1 (task autonomy) . . . . . . . . . . . . . . . . . . . . . . . . . . . . 8.15
Table 8.15 Reliability analysis - Factor C2 (respect) . . . . . . . . . . . . . . . . . . . . . . . . . . . . . . . . . . 8.15
Table 8.16 Reliability analysis - Factor C3 (responsibility) . . . . . . . . . . . . . . . . . . . . . . . . . . . . . 8.16
Table 8.17 Reliability analysis - Factor C4 (realistic expectations) . . . . . . . . . . . . . . . . . . . . . . . 8.16
Table 8.18 Reliability analysis - Factor D1 (obedience) . . . . . . . . . . . . . . . . . . . . . . . . . . . . . . . 8.17
Table 8.19 Reliability analysis - Factor D2 (job satisfaction) . . . . . . . . . . . . . . . . . . . . . . . . . . . . 8.17
Table 8.20 Reliability analysis - Factor D3 (participation) . . . . . . . . . . . . . . . . . . . . . . . . . . . . . . 8.18
Table 8.21 Reliability analysis - Factor D4 (loyalty) . . . . . . . . . . . . . . . . . . . . . . . . . . . . . . . . . . 8.18
Table 8.22 Students’ t-test: Comparison of mean scores of gender groupings
in respect of the behavioural domains . . . . . . . . . . . . . . . . . . . . . . . . . . . . . . . . . . . 8.25
Table 8.23 Students’ t-test: Comparison of mean scores of ethnic groupings
in respect of the behavioural domains . . . . . . . . . . . . . . . . . . . . . . . . . . . . . . . . . . . 8.26
Table 8.24 Students’ t-test: Comparison of the mean scores of marital status groupings
in respect of the behavioural domains . . . . . . . . . . . . . . . . . . . . . . . . . . . . . . . . . . . 8.27
Table 8.25 Students’ t-test: Comparison of the mean scores of number of years
in current position groupings in respect of the behavioural domains . . . . . . . . . . . . 8.28
Table 8.26 Students’ t-test: Comparison of the mean scores of years’ service
at the bank groupings in respect of the behavioural domains . . . . . . . . . . . . . . . . . . 8.29
Table 8.27 Students’ t-test: Comparison of the mean scores of staff category groupings
in respect of the behavioural domains . . . . . . . . . . . . . . . . . . . . . . . . . . . . . . . . . . . 8.30
Table 8.28 Comparison of mean scores of the three education groups in
respect of the behavioural domains . . . . . . . . . . . . . . . . . . . . . . . . . . . . . . . . . . . . . 8.32
UUnniivveerrssiittyy ooff PPrreettoorriiaa eettdd –– CCooeettzzeeee,, MM ((22000055))
xi
Table 8.29 Tukey’s HSD multiple comparison of education in relation to loyalty . . . . . . . . . . . . 8.34
Table 8.30 Dunnett C’s multiple comparison of education in relation to
participation . . . . . . . . . . . . . . . . . . . . . . . . . . . . . . . . . . . . . . . . . . . . . . . . . . . . . . . . 8.34
Table 8.31 Comparison of the mean scores of the three salary groups in
respect of the behavioural domains . . . . . . . . . . . . . . . . . . . . . . . . . . . . . . . . . . . . . 8.35
Table 8.32 Tukey’s HSD multiple comparison of salary in relation to distributive justice . . . . . . 8.37
Table 8.33 Dunnett C’s multiple comparison of salary in relation to autonomy, respect and
participation . . . . . . . . . . . . . . . . . . . . . . . . . . . . . . . . . . . . . . . . . . . . . . . . . . . . . . . . 8.37
Table 8.34 Comparison of the mean scores of the three EE appointment groups
in respect of the behavioural domains . . . . . . . . . . . . . . . . . . . . . . . . . . . . . . . . . . . 8.38
Table 8.35 Tukey’s HSD multiple comparison of employment equity appointments
in relation to distributive justice, responsibility and expectations . . . . . . . . . . . . . . . 8.40
Table 8.36 Box’s M Test of equality of covariance matrices in respect of
gender and ethnic groups . . . . . . . . . . . . . . . . . . . . . . . . . . . . . . . . . . . . . . . . . . . . . 8.41
Table 8.37 Box’s M Test of equality of covariance matrices in respect of
gender and staff groups . . . . . . . . . . . . . . . . . . . . . . . . . . . . . . . . . . . . . . . . . . . . . . 8.41
Table 8.38 Box’s M Test of equality of covariance matrices in respect of
gender, ethnic and staff groups . . . . . . . . . . . . . . . . . . . . . . . . . . . . . . . . . . . . . . . . . 8.42
Table 8.39 Manova: Behavioural domains by gender and ethnicity . . . . . . . . . . . . . . . . . . . . . . 8.42
Table 8.40 Manova: Behavioural domains by ethnicity, age and salary . . . . . . . . . . . . . . . . . . . 8.43
Table 8.41 Anova: Behavioural domains by ethnicity, age and salary . . . . . . . . . . . . . . . . . . . . 8.44
Table 8.42 Manova: Behavioural domains by gender and staff . . . . . . . . . . . . . . . . . . . . . . . . . 8.46
Table 8.43 Manova: Behavioural domains by age, gender and staff . . . . . . . . . . . . . . . . . . . . . 8.47
Table 8.44 Anova: Behavioural domains by age, gender and staff . . . . . . . . . . . . . . . . . . . . . . . 8.47
Table 8.45 Manova: Behavioural domains by gender, ethnic and staff . . . . . . . . . . . . . . . . . . . 8.49
Table 8.46 Manova: Behavioural domains by ethnicity, staff and age . . . . . . . . . . . . . . . . . . . . 8.51
Table 8.47 Anova: Behavioural domains by ethnicity, staff and age . . . . . . . . . . . . . . . . . . . . . . 8.51
Table 8.48 Correlations between justice and treatment in the workplace . . . . . . . . . . . . . . . . . . 8.53
Table 8.49 Correlations between justice and commitment . . . . . . . . . . . . . . . . . . . . . . . . . . . . . 8.54
Table 8.50 Correlations between treatment of AA employees in the workplace
and commitment . . . . . . . . . . . . . . . . . . . . . . . . . . . . . . . . . . . . . . . . . . . . . . . . . . . . 8.54
Table 8. 51 Multiple regression of treatment of AA employees in the workplace with
interactional justice perceptions . . . . . . . . . . . . . . . . . . . . . . . . . . . . . . . . . . . . . . . . 8.55
Table 8.52 Multiple regression of treatment of AA employees in the workplace with
procedural justice (input) perceptions . . . . . . . . . . . . . . . . . . . . . . . . . . . . . . . . . . . . 8.56
Table 8.53 Multiple regression of treatment of AA employees in the workplace with
procedural justice (criteria) perceptions . . . . . . . . . . . . . . . . . . . . . . . . . . . . . . . . . . 8.56
Table 8.54 Multiple regression of ethnicity and the treatment of AA employees in the
workplace with distributive justice perceptions . . . . . . . . . . . . . . . . . . . . . . . . . . . . . 8.57
UUnniivveerrssiittyy ooff PPrreettoorriiaa eettdd –– CCooeettzzeeee,, MM ((22000055))
xii
Table 8.55 Multiple regression of justice perceptions and treatment of AA employees in the
workplace with obedience . . . . . . . . . . . . . . . . . . . . . . . . . . . . . . . . . . . . . . . . . . . . 8.58
Table 8.56 Multiple regression of justice perceptions and treatment of AA employees in the
workplace with satisfaction . . . . . . . . . . . . . . . . . . . . . . . . . . . . . . . . . . . . . . . . . . . . 8.58
Table 8.57 Multiple regression of staff category, justice perceptions and treatment of AA employees
in the workplace with participation . . . . . . . . . . . . . . . . . . . . . . . . . . . . . . . . . . . . . . 8.59
Table 8.58 Multiple regression of age, staff category, justice perceptions and treatment
of AA employees in the workplace with loyalty . . . . . . . . . . . . . . . . . . . . . . . . . . . . . 8.59
UUnniivveerrssiittyy ooff PPrreettoorriiaa eettdd –– CCooeettzzeeee,, MM ((22000055))
xiii
SUMMARY
THE FAIRNESS OF AFFIRMATIVE ACTION: AN ORGANISATIONAL JUSTICE PERSPECTIVE
BY
MARIËTTE COETZEE
PROMOTOR: Prof Dr L P Vermeulen
DEPARTMENT: Department of Human Resource Management
DEGREE: Philosophiae Doctor (Human Resource Management)
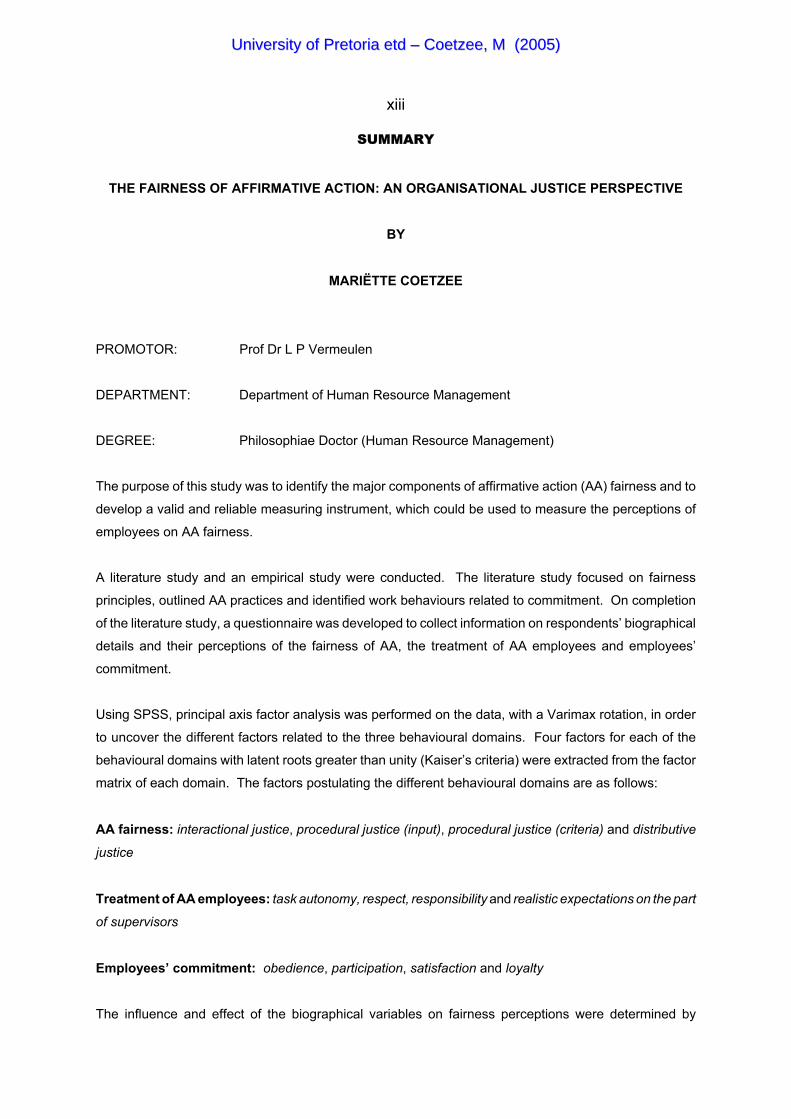
The purpose of this study was to identify the major components of affirmative action (AA) fairness and to
develop a valid and reliable measuring instrument, which could be used to measure the perceptions of
employees on AA fairness.
A literature study and an empirical study were conducted. The literature study focused on fairness
principles, outlined AA practices and identified work behaviours related to commitment. On completion
of the literature study, a questionnaire was developed to collect information on respondents’ biographical
details and their perceptions of the fairness of AA, the treatment of AA employees and employees’
commitment.
Using SPSS, principal axis factor analysis was performed on the data, with a Varimax rotation, in order
to uncover the different factors related to the three behavioural domains. Four factors for each of the
behavioural domains with latent roots greater than unity (Kaiser’s criteria) were extracted from the factor
matrix of each domain. The factors postulating the different behavioural domains are as follows:
AA fairness: interactional justice, procedural justice (input), procedural justice (criteria) and distributive
justice
Treatment of AA employees: task autonomy, respect, responsibility and realistic expectations on the part
of supervisors
Employees’ commitment: obedience, participation, satisfaction and loyalty
The influence and effect of the biographical variables on fairness perceptions were determined by
UUnniivveerrssiittyy ooff PPrreettoorriiaa eettdd –– CCooeettzzeeee,, MM ((22000055))

xiv
comparing the responses of various employee subsets with one another by means of univariate and
multivariate analysis of variance. The results of the t-tests revealed that staff category, marital status and
ethnicity have a statistically significant effect on employees’ perceptions of the distributive justice of AA.
Decisions such as granting AA employees token positions, paying unrealistically high salaries to AA
managers and appointing less-qualified employees, play a key role when managers, married employees
and whites form perceptions of the fairness of AA. Women consider procedural fairness, adhering to rules
and regulations and loyalty to be of paramount importance.
The MANOVAs and associated ANOVAs indicated that ethnicity, staff category and age must be
considered for their significant effect on perceptions of distributive justice, autonomy, respect and loyalty.
Blacks, contrary to whites, believe that AA employees are not treated with respect and are not accorded
autonomy. Older employees and clerical staff tend to be more loyal than their counterparts.
Multiple regression statistics were used to predict how the treatment of AA employees relates to
perceptions of the fairness of AA. The results indicated that the more task autonomy and respect accorded
to employees, the more likely they will perceive decisions about AA to be fair.
This study represents a vital step towards a better understanding of the dimensionality of AA fairness and
should ultimately contribute to more effective management of AA in the workplace.
UUnniivveerrssiittyy ooff PPrreettoorriiaa eettdd –– CCooeettzzeeee,, MM ((22000055))
1.1
Chapter 1
GENERAL INTRODUCTION
1.1 INTRODUCTION
The first democratic and multi-ethnic election on 27 April 1994 in South Africa brought hope to thousands
of South Africans. Through the government’s affirmative action (AA) policy, workers were able to visualise
a more prosperous future. Prior to the implementation of AA, people from previously disadvantaged
groups, in an attempt to uplift themselves from poverty through higher education, were thwarted by
discrimination, prejudice and institutional lag. Those seeking improved economic positions through
employment were circumvented by a tradition of preferential treatment for whites. Despite being qualified
on the basis of skill and competencies, Africans and other groups were forced to bargain in the labour
market at a severe disadvantage. Caught in the web of prejudice and legal discrimination, they found that
their ethnicity was reason enough for those in charge to deny them social and economic opportunities.
When they did manage to secure job offers, they were assigned to menial positions that paid them lower
salaries than those of their white counterparts. These injustices not only led to poverty, but also destroyed
their spirit.
Since the general election in 1994, attempts to make South Africa a more just society have increased, and
topics such as equality and social justice have frequently appeared at the top of all agendas. The
government realised that legislation was necessary to guide organisations in promoting justice in the
workplace, and the Constitution of the Republic of South Africa 108 of 1996 was therefore used as the
primary source of any legislation pertaining to people's fundamental right to equality.
Some of the most important aims of the Constitution include rectifying injustices of the past and
establishing a society based on democratic values, social justice and fundamental human rights (Van Wyk,
2002). The necessity to redress injustices of the past becomes apparent when one considers the social
and economic inequalities that still exist in South Africa, especially those generated by apartheid. Any
attempts to redress inequalities, however, should be based on upholding the values of human dignity,
equality, freedom and social justice in a united, nonracial and nonsexist society in which all may prosper.
If it is not done in this way, discrimination and social and economic inequalities will continue to exist, and
any attempts to create a just society in which all people can live together in peace and harmony will be
doomed to failure.
In an effort to govern the promotion of social justice and eradicate inequalities in the workplace, the
government realised that it had to intervene actively, not only to prevent further discrimination, but also
to purposefully promote the employment and advancement of persons disadvantaged by previous policies.
UUnniivveerrssiittyy ooff PPrreettoorriiaa eettdd –– CCooeettzzeeee,, MM ((22000055))

1.2
Three Acts were promulgated, namely the Employment Equity Act 55 of 1998, the Promotion of Equality
and the Prevention of Unfair Discrimination Act 4 of 2000 and the Preferential Procurement Policy
Framework Act (Employment Equity Report, 2001). The underlying principle for the intervention of the
state was that mere equality of opportunity would not be equitable, because many workers would
commence with a handicap, and that true equality and equity would be achieved only through the
implementation of strong measures against discrimination and the purposeful, planned placement and
development of persons who were denied equal opportunities in the past. AA thus became the vehicle
for democracy in the workplace (Innes, Kentridge & Perold, 1993).
According to Bendix (2001), AA refers to the purposeful and planned placement or development of
competent or potentially competent persons in or to positions from which they were barred in the past, in
an attempt to redress past disadvantages and render the workforce more representative of the population.
Most of the controversies and problems surrounding AA arise not from the principle as such but from the
manner in which AA is implemented. It is effected incorrectly when organisations regard it as a political
imperative with which they have to comply, and not as a business objective which includes having as
effective and competent a workforce as possible. Consequently, persons are appointed in “AA positions”
merely to window-dress or fill quotas, usually without due consideration of their suitability for the position
or the possibility of support and development. Such arbitrary appointments leave other employees
dissatisfied and are unfair to the appointees themselves, since they are placed either in meaningless
positions or cannot handle their tasks, thus confirming the belief that AA appointees are “no good”( Bendix,
2001).
Another problem with AA is that the available pool of previously disadvantaged persons able to fulfil high
level jobs is extremely small. The result is that the development of a small, highly sought-after group of
candidates who are continually “poached” by one organisation from another. Thus only this élite group
advances while the rest of the black African population remains where it was before. Employers should
abandon the practice of looking for “readymade products” and instead develop persons for upward
movement in the organisation. In such instances, AA should be closely linked to the development of
employees’ skills, abilities and competencies (Thomas, 2002). Although the Employment Equity Act
recognises the importance of human resources development, this Act alone cannot handle this task —
hence the promulgation of the Skills Development Act. According to the Employment Equity Report
(2001), a National Skills Development Strategy has been developed and national targets have been
adopted for the beneficiaries of learning programmes:
! 85 percent black
! 54 percent women
! 4% percent people with disabilities
UUnniivveerrssiittyy ooff PPrreettoorriiaa eettdd –– CCooeettzzeeee,, MM ((22000055))

1.3
The most prevalent accusation directed at AA initiatives is that they constitute reverse discrimination.
There is a strongly held belief among the general public that AA regulations compel employers to appoint
underqualified people from designated groups at the expense of qualified white males - a result both unfair
in concept and detrimental to the organisation's competitiveness. AA will become unfair only if previously
disadvantaged people are appointed “at all costs” without granting other people the opportunity to
compete. All candidates have to be afforded the opportunity to compete and to be assessed against
predetermined criteria, but an additional weighting can be placed on AA considerations. This means that
AA candidates are given a slight, but not unreasonable, advantage over the other candidates (Charlton
& Van Niekerk, 1994).
All sorts of advice has been given on how to design and implement AA programmes effectively.
Generally, effectiveness is defined as the proportion of employees from previously disadvantaged groups
that are hired or promoted. However, focusing on numbers only is a limited view of effectiveness. The
perceived fairness of AA practices should also be an key indicator of effectiveness. Social scientists have
long recognised the importance of justice as a basic requirement for the effective functioning of
organisations and the personal satisfaction of the individuals they employ. One of the primary benefits
of organisational justice conceptualisations is that they can be used to explain a wide variety of
organisational behaviours. When practices are perceived to be unfair, they cause frustration, threaten
employees’ self- and social images, and, in some instances, even produce moral outrage (Greenberg,
1990). According to Robinson and Morrison (1995), other adverse effects of violation of employee
perceptions of fairness include lowered trust in management and reduced organisation commitment.
Hence, just as the injustices associated with selection systems (Gilliland, 1993), pay raise decisions
(Folger & Konovsky, 1989), and other organisational phenomena foster job dissatisfaction and voluntary
turnover, the perceived injustices resulting from AA are likely to translate into dislike for a job and prompt
a subordinate to seek alternative employment. Violations of fairness can further result in legal battles,
more negative attitudes towards the organisation, decreased job satisfaction, poorer self-esteem and lower
probability that the AA programme will succeed.
1.2 PROBLEM FORMULATION
South African organisations will continuously be evaluated in terms of how well they meet employment
equity targets. This will ensure that the changing nature of society is reflected in the composition of an
organisation’s workforce. As mentioned earlier, for a programme to be regarded as effective, it needs to
comply with both legal and fairness requirements. Organisations will thus be under increasing pressure
to make use of AA programmes that are technically and morally sound - and can be shown to be so. This
is of particular significance if one considers the fact that employees will be more inclined to challenge
procedures they regard as unfair (Cooper & Robertson, 1995).
UUnniivveerrssiittyy ooff PPrreettoorriiaa eettdd –– CCooeettzzeeee,, MM ((22000055))
1.4
In view of the widespread recognition of the importance of fairness as an issue in organisations, it stands
to reason that theories of justice have been applied to the question of understanding behaviour in
organisations. In an attempt to describe and explain the role of fairness as a consideration in the
workplace, a topic known as organisational justice developed. Organisational justice refers to people’s
perceptions of fairness in organisational settings. People will make fairness judgments by taking into
consideration the actual decision or the procedures used to reach a decision. Organisational justice can
thus be divided into distributive and procedural fairness.
For many years, the study of fairness in organisations was dominated by a distributive justice orientation,
an approach that focused on the fairness of outcomes/decisions. Folger and Cropanzano (1998) defined
distributive justice as the perceived fairness of an outcome or decision. According to Leventhal (1976),
decisions or outcomes are determined by utilising three major justice rules: the equity rule, the needs rule,
and the equality rule. The equity rule focuses on contributions, the needs rule is applied for personal
welfare reasons and the equality rule is used to preserve social harmony. From an AA point of view, the
equality rule should thus be used to make decisions. As this distributive perspective gained dominance,
an independent approach to the study of justice began to develop. Soon studies of reactions to the
procedures used to reach decisions were conducted. Researchers became interested in expanding the
distributive justice orientation to include consideration of the methods, mechanisms and processes used
to determine outcomes - that is, adopting a procedural justice orientation. Further research focused on
people’s feelings about unfair treatment and revealed a third dimension of organisational justice -
interactional justice - people’s sensitivity to the quality of interpersonal treatment they receive during the
enactment of organisational procedures (Greenberg, 1996). Studies cited by Folger and Cropanzano
(1998) showed that conflict, low performance, and poor attitudes tend to characterise insensitively treated
individuals.
Given that the distinction between distributive, procedural and interactional justice has now been
empirically established, the stage is set for researchers to consider how these varieties of justice relate
to various organisational variables such as turnover, commitment, trust and supervisor/subordinate
relationships. According to Folger and Cropanzano (1998), injustice can bring about negative
consequences such as reduced job performance (Greenberg, 1988; Pfeffer & Langton, 1993), less
cooperation with coworkers (Pfeffer & Langton, 1993), reduced quality of work (Cowherd & Levine, 1992),
stress (Zohar, 1995), and theft (Greenberg, 1990). By thus understanding how perceptions of
organisational justice are related to these variables, organisations should attempt to manage employees’
perceptions of fairness and influence their performance.
In South Africa, no other issue has raised so many concerns about justice than AA. For many years AA
has been a battleground for competing values, especially competing concepts of distributive justice. In
the USA, after 20 or more years of AA, the government has finally admitted that the process has failed.
Why? Because AA programmes were not implemented fairly; neither were employees’ perceptions of the
UUnniivveerrssiittyy ooff PPrreettoorriiaa eettdd –– CCooeettzzeeee,, MM ((22000055))

1.5
fairness of the AA programmes managed. As soon as employees regard something as unfair, they tend
to reject it, and any further interventions will be doomed to failure. If South Africa wishes to make a
success of AA, organisations should understand how perceptions of AA influence employees’ attitudes
and behaviour and consequently impact on the success of the organisation. Although significant progress
has been made in restructuring and transforming South African society and its institutions, inequalities and
unfair discrimination remain deeply embedded in social structures, practices and attitudes, undermining
the good intentions of the country’s constitutional democracy (Van Wyk, 2002). A special attempt should
thus be made to eliminate discrimination and manage employees’ resistance to change.
According to Folger and Skarlicki (1999), employees’ negative feelings about or resistance to change can
be overcome by applying fairness principles. Fairness principles provide an opportunity to mitigate some
of the adverse organisational consequences of individuals’ resentment-based resistance to change.
However, an organisation’s obligation to employees entails more than fair treatment with respect to the
salaries and benefits given in exchange for labour (distributive justice), and more than fair treatment
regarding the implementation of policies and procedures that determine those levels of compensation
(procedural justice). In addition, organisations have a moral obligation to treat an employee with sufficient
dignity as a person (interactional justice). Because organisations in globally competitive markets are less
able to offer traditional rewards (lifelong employment, promotions, long-term compensation), one of the
only means they have to induce employees to stay is an environment that communicates that it values
them. If this is so, interactional justice plays a major role in influencing the attitudes and behaviours
employees require for successful performance, even under conditions of adversity and loss, which is often
the case with AA.
The fairness of AA from an organisational justice perspective has not yet been researched in South Africa
and little is known about how perceptions of AA fairness affect employees' behaviour and consequently
the success of organisations. One of the challenges facing organisations is to find a way to implement
AA programmes to gain a competitive advantage without creating negative employee attitudes. This study
will investigate in particular how the perceived fairness of AA influences employees’ commitment. Unless
employees perceive AA initiatives as fair, they will not commit themselves to the common purpose of
maximising their own and one another's success and ultimately accomplish something beyond their
individual achievements.
Several studies on organisational justice have examined the fairness of various organisational practices
such as performance appraisals (Tang & Sarsfield-Baldwin, 1996), promotion decisions (Lemons & Jones,
2001), and pay raise decisions (Folger & Konovsky, 1989). No evidence could however be found that the
fairness of AA has been studied nor has the influence of fairness perceptions of AA on employees’
commitment been researched.
UUnniivveerrssiittyy ooff PPrreettoorriiaa eettdd –– CCooeettzzeeee,, MM ((22000055))

1.6
1.3 PURPOSE OF THE RESEARCH
With due consideration of the above-mentioned problems, the aim of this study is to answer the following
research questions:
(1) What constitutes AA fairness?
(2) How do the various employee groups (ethnicity, gender, staff category, income, etc) differ with
regard to the fairness of AA?
(3) How does the treatment of AA employees influence their perceptions of the fairness of AA?
(4) How do perceptions of the fairness of AA and the treatment of AA employees influence
employees’ commitment?
A comprehensive literature study will be performed to answer the research questions and to reach the
research objectives. The purpose of the literature study is to identify fairness principles, outline AA
practices that could influence employees’ fairness perceptions and identify work behaviours most
commonly performed by committed employees. On completion of the literature study, a measuring
instrument, namely a questionnaire, will be developed. The organisational justice principles as discussed
in the literature study, will be used as a basis to create an item pool measuring employees perceptions
regarding the fairness/unfairness of AA. Existing questionnaires on justice will also be used as a starting
point in developing the questionnaire which will measure employees’ perceptions regarding the fairness
of AA and how it impacts on their commitment.
By keeping the above research questions in mind, the primary objective of the research is to develop a
valid and reliable measuring instrument to identify the major components of AA fairness. The secondary
objectives of this study are to determine:
(1) the relationship between employee demographic characteristics (ethnicity, age, gender, staff
category etc) and perceptions of AA fairness, treatment of AA employees and employee
commitment.
(2) the relationship between the treatment of AA employees and employees’ perceptions with regard
to the fairness of AA
(3) the relationship between employees’ commitment and perceptions about the fairness of AA and
the treatment of AA employees
1.4 PLAN OF THE RESEARCH
This research report comprises nine chapters.
UUnniivveerrssiittyy ooff PPrreettoorriiaa eettdd –– CCooeettzzeeee,, MM ((22000055))
1.7
Chapter 1 addresses issues such as the formulation of the problem and the purpose and plan of the
research study.
Chapter 2 provides a theoretical overview of AA. The concepts “AA” and “employment equity” are clarified
and by means of a schematic representation, the legislative framework for the regulation of the
employment relationship is provided. The challenges facing South Africa are highlighted. The progress
and pitfalls of AA and the contentious issues of quotas and targets, and organisations’ commitment to
social responsibility and AA are briefly discussed. AA issues such as preferential treatment, the
complexity of confronting discrimination, the setting of standards and tokenism are discussed with a view
to indicating how they relate to perceptions of fairness.
Chapter 3 provides an overview of the South African legislation pertaining to the prevention of unfair
discrimination and promotion of equality in the workplace. Since it is not the purpose of this study to
investigate the management of AA as such, chapter 3 focuses on the implications of AA for HR policies,
procedures and practices. Discriminatory practices and guidelines on the implementation of AA
programmes are outlined.
Chapter 4 provides a historical overview of the meaning, scope and nature of organisational justice. The
distributive, procedural and social determinants of justice are discussed with a view to explaining how
employees determine the fairness of events. A special attempt is made to extend theories from the
organisational justice literature to the AA domain in an attempt to promote the understanding of AA
fairness. In particular, the activities in organisations that tend to trigger justice concerns, and the way in
which employees respond to injustices are outlined.
Chapter 5 deals with the various aspects of commitment and the meaning of employee commitment in an
attempt to explain the possible effect of perceptions of AA fairness on employees’ commitment. As
mentioned previously, one of the primary benefits of organisational justice conceptualisations is that they
can be used to explain a wide variety of organisational behaviours. A study of the perceived fairness of
AA will thus serve no purpose unless it can be used to determine how it influences employees’
commitment. This study will specifically investigate the way in which employees' commitment is influenced
when they perceive injustice in AA practices.
Chapter 6 provides an overview of the case bank. Since banks have experienced dramatic changes such
as deregulation over the past years, they are faced with competitive operating environments. This has
compelled banks to adopt a customer services orientation. Competent and committed employees are
needed to render good customer service. The bank used in this study is a leading bank in the
implementation of AA initiatives, and this chapter therefore provides an overview of the bank’s workforce
profile, industrial relations, employment equity and change initiatives.
UUnniivveerrssiittyy ooff PPrreettoorriiaa eettdd –– CCooeettzzeeee,, MM ((22000055))

1.8
Chapter 7 deals with the empirical research. It explains the research methodology and includes issues
such as the design and administration of the questionnaire, population and sampling, and the collection
of data. The representativity of the response rate and the statistical research methodology used are also
discussed.
Chapter 8 focuses on the interpretation and discussion of the research results. The results of factor
analysis, analysis of item bias, reliability, analysis of variance, multiple analysis of variance, correlation
and multiple regression analysis are discussed.
Chapter 9 contains the summary and recommendations of the study. Recommendations for influencing
employees’ perceptions about the fairness of AA will be provided to ensure the commitment of employees
and the achievement of organisational goals. The focus in the discussion of the results will be on
answering the research questions. Only the statistical significant findings with practical implications will
be discussed and implications for management will be provided. The limitations of the study and
suggestions for future research will also be outlined.
UUnniivveerrssiittyy ooff PPrreettoorriiaa eettdd –– CCooeettzzeeee,, MM ((22000055))

2.1
Chapter 2
AFFIRMATIVE ACTION: A THEORETICAL PERSPECTIVE
2.1 INTRODUCTION
When the term "affirmative action" or "black advancement", is used in South Africa, it evokes numerous
reactions from various quarters. Fears are expressed such as the lowering of standards, new kinds of
discrimination, and the general misconception that able whites will have to make way for less able blacks.
These, in turn (it is feared), will lead to the dwindling of the bottom line, the loss of work ethic, and the
ultimate decline of the economy. Although AA is a frightening concept and resembles reverse
discrimination for some people, for others, it has positive connotations.
The term "affirmative action" (AA) is used in many different ways and it is not readily apparent what a
person means when employing the term. It may indeed be that the context in which and the words chosen
to describe whatever the speaker may mean, tell us more about his or her personal view than the actual
meaning of the term. To add to the confusion, many alternative terms are used such as "black
advancement", "transformation", or "restructuring".
In this chapter the meaning of AA, as intended by legislation, will be briefly discussed. An overview of the
origin and development of AA will be provided and the main objectives thereof explained. South Africa
faces many challenges in the successful implementation of AA — hence the need to outline the key issues
and obstacles facing organisations. In order to justify AA and clarify the need for it, the discussion will
indicate how principles of equality and justice are related to the fairness of AA programmes.
2.2 THE ORIGIN AND DEVELOPMENT OF AFFIRMATIVE ACTION
The USA is generally regarded as the country of origin of AA. The concept of AA was first used in the
context of race discrimination and became part of legislation in 1961. The Civil Rights Act of 1964
followed and, as amended in the following year, provided that discrimination on the basis of race, sex,
colour, religion or national origin was illegal (Viljoen, 1997).
In South Africa, AA was a response to identified inadequacies in antidiscrimination legislation. The
question of discrimination was originally addressed in the definition of an Unfair Labour Practice and later
discussed in greater detail with the promulgation of the Employment Equity Act 55 of 1998 which has both
an antidiscrimination leg and an AA leg. Chapter 3 of the Employment Equity Act deals with AA. It obliges
every designated employer to put measures in place to ensure that suitably qualified persons from
designated groups are afforded equal employment opportunities and are equitably represented in all
UUnniivveerrssiittyy ooff PPrreettoorriiaa eettdd –– CCooeettzzeeee,, MM ((22000055))
2.2
occupational categories and levels of the workforce. These measures include the elimination of barriers,
the furthering of diversity, making reasonable accommodation for persons from designated groups, training
and the establishment of numerical targets, but do not include the establishment of an absolute barrier to
the prospective or continued employment of persons who are not from designated groups. The
designated groups include the disabled, women and blacks, with “blacks” being used as a generic term
to include all coloureds, Asians and Africans (Bendix, 2001).
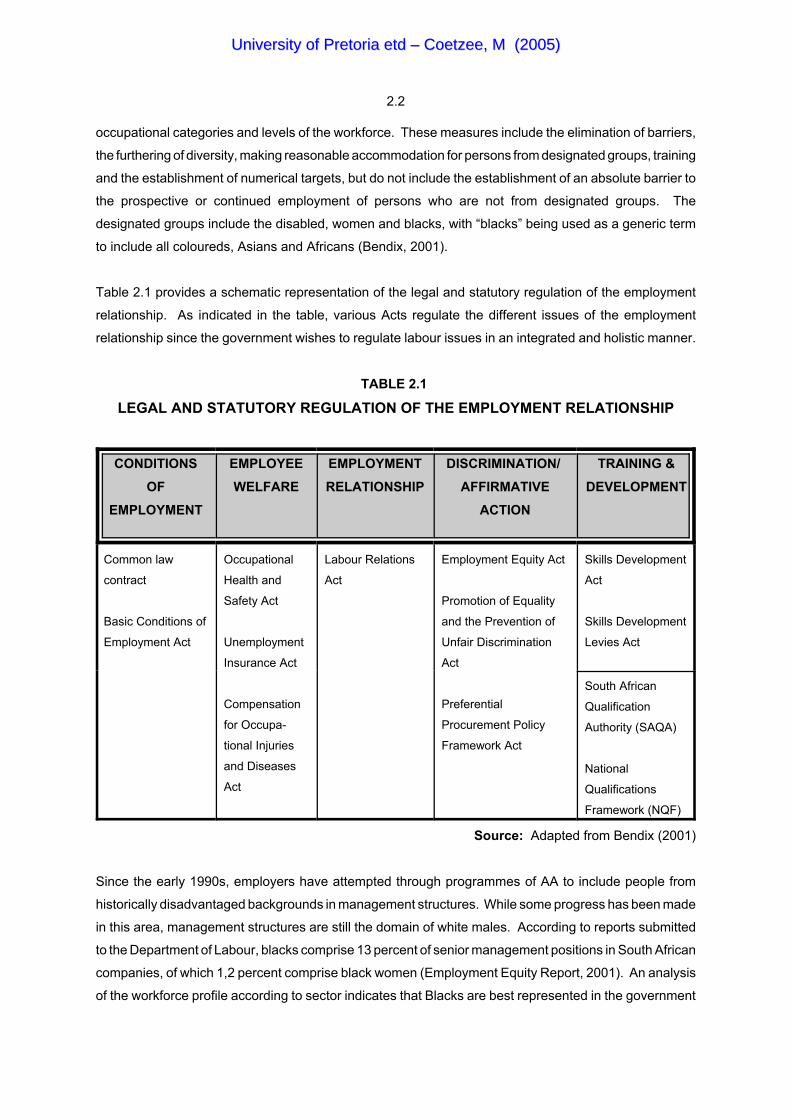
Table 2.1 provides a schematic representation of the legal and statutory regulation of the employment
relationship. As indicated in the table, various Acts regulate the different issues of the employment
relationship since the government wishes to regulate labour issues in an integrated and holistic manner.
TABLE 2.1
LEGAL AND STATUTORY REGULATION OF THE EMPLOYMENT RELATIONSHIP
CONDITIONS
OF
EMPLOYMENT
EMPLOYEE
WELFARE
EMPLOYMENT
RELATIONSHIP
DISCRIMINATION/
AFFIRMATIVE
ACTION
TRAINING &
DEVELOPMENT
Common law
contract
Basic Conditions of
Employment Act
Occupational
Health and
Safety Act
Unemployment
Insurance Act
Compensation
for Occupa-
tional Injuries
and Diseases
Act
Labour Relations
Act
Employment Equity Act
Promotion of Equality
and the Prevention of
Unfair Discrimination
Act
Preferential
Procurement Policy
Framework Act
Skills Development
Act
Skills Development
Levies Act
South African
Qualification
Authority (SAQA)
National
Qualifications
Framework (NQF)
Source: Adapted from Bendix (2001)
Since the early 1990s, employers have attempted through programmes of AA to include people from
historically disadvantaged backgrounds in management structures. While some progress has been made
in this area, management structures are still the domain of white males. According to reports submitted
to the Department of Labour, blacks comprise 13 percent of senior management positions in South African
companies, of which 1,2 percent comprise black women (Employment Equity Report, 2001). An analysis
of the workforce profile according to sector indicates that Blacks are best represented in the government
UUnniivveerrssiittyy ooff PPrreettoorriiaa eettdd –– CCooeettzzeeee,, MM ((22000055))

2.3
sector (86%) and least represented in the academic sector (47%). According to the Department of Labour,
various forms of discrimination, such as the following, still occur in the South African labour market:
! Whites earn a 104 percent wage premium over blacks.
! Men earn wages 43 percent higher than similarly qualified women.
! Black women in the lower educational categories earn a 10 percent lower salary than their white
male counterparts.
From the above statistics it is clear that South Africa still has a long way to go before it can honestly state
that it has redressed the legacies of apartheid in the South African workplace.
2.3 DEFINING CONCEPTS
Organisations in South Africa are increasingly under legislative pressure to overcome past discrimination
in the workplace by providing more employment opportunities for previously disadvantaged group
members, such as blacks, women and minorities. Diversifying the workforce is a key organisational goal
as governments continue to mandate equity in the workplace to ensure that the workforce is representative
of the population. According to the population estimates released for 2002 by the Bureau of Market
Research at Unisa, the total population of South Africa increased by an average 657 532 annually
between 1996 and 2002. Population censuses worldwide are prone to undercount, and the 1996
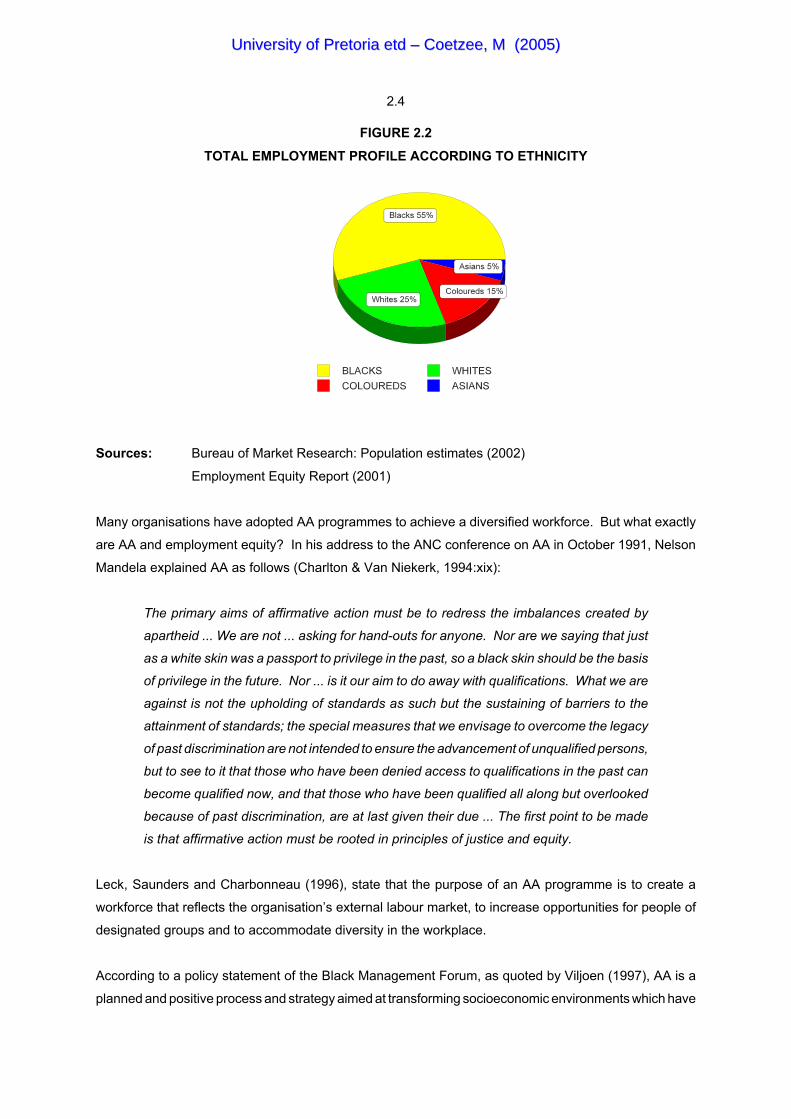
population census in South Africa was no exception. Figure 2.1 provides a schematic representation of
the composition of South Africa’s population according to ethnicity, while figure 2.2 illustrates South
Africa’s total employment profile according to ethnicity. It is clear from the latter figure that South African
organisations still have a long way to go to ensure that the workforce is representative of the population.
For example, the employment of blacks needs to increase by 23 percent in order to be representative of
the population.
FIGURE 2.1
SOUTH AFRICAN POPULATION ACCORDING TO ETHNICITY
UUnniivveerrssiittyy ooff PPrreettoorriiaa eettdd –– CCooeettzzeeee,, MM ((22000055))
2.4
FIGURE 2.2
TOTAL EMPLOYMENT PROFILE ACCORDING TO ETHNICITY
Sources: Bureau of Market Research: Population estimates (2002)
Employment Equity Report (2001)
Many organisations have adopted AA programmes to achieve a diversified workforce. But what exactly
are AA and employment equity? In his address to the ANC conference on AA in October 1991, Nelson
Mandela explained AA as follows (Charlton & Van Niekerk, 1994:xix):
The primary aims of affirmative action must be to redress the imbalances created by
apartheid ... We are not ... asking for hand-outs for anyone. Nor are we saying that just
as a white skin was a passport to privilege in the past, so a black skin should be the basis
of privilege in the future. Nor ... is it our aim to do away with qualifications. What we are
against is not the upholding of standards as such but the sustaining of barriers to the
attainment of standards; the special measures that we envisage to overcome the legacy
of past discrimination are not intended to ensure the advancement of unqualified persons,
but to see to it that those who have been denied access to qualifications in the past can
become qualified now, and that those who have been qualified all along but overlooked
because of past discrimination, are at last given their due ... The first point to be made
is that affirmative action must be rooted in principles of justice and equity.
Leck, Saunders and Charbonneau (1996), state that the purpose of an AA programme is to create a
workforce that reflects the organisation’s external labour market, to increase opportunities for people of
designated groups and to accommodate diversity in the workplace.
According to a policy statement of the Black Management Forum, as quoted by Viljoen (1997), AA is a
planned and positive process and strategy aimed at transforming socioeconomic environments which have
UUnniivveerrssiittyy ooff PPrreettoorriiaa eettdd –– CCooeettzzeeee,, MM ((22000055))

2.5
excluded individuals from disadvantaged groups to enable them to gain access to opportunities, including
opportunities for development, based on their suitability.
Human (1996) defines AA as the process of creating employment equity. Affirmative action, moreover,
is not merely a process of recruiting greater numbers of historically disadvantaged employees: it is part
and parcel of a holistic system of human resource management and development and impacts on all of
the processes, policies and procedures relating to the selection, recruitment, induction, development,
promotion and severance of people.
Bendix (2001:435) provides a detailed definition of AA. According to her, the term "affirmative action"
refers to “the purposeful and planned placement or development of competent or potentially competent
persons in or to positions from which they were debarred in the past, in an attempt to redress past
disadvantages and to render the workforce more representative of the population.” The keywords can be
summarised as follows:
! Purposeful. The purpose of AA should be, firstly, to create a diverse workforce and, secondly,
to redress past disadvantages.
! Planned placement. The appointment of people should be according to a workforce diversity
plan.
! Development. Affirmative action should not be a once-off action, but organisations should create
a working environment conducive to learning and growth.
! Competent or potentially competent. Owing to the inequalities of the past, many people were
denied equal opportunities to acquire competencies or formal qualifications. Organisations should
therefore consider the potential of people to acquire the necessary competencies within a
reasonable time when they make appointments. Nevertheless, organisations are not expected
to appoint incompetent people merely for the sake of AA.
! Positions. Organisations are required to appoint AA employees to all positions, especially senior
positions from which they were excluded in the past.
This brings us to the question: “How is AA related to employment equity?” Wingrove (1993) defines
employment equity as the point reached where AA has eliminated all the disparities between diverse
employees and all employees have been brought to a level at which they can compete equally and are
afforded an equal opportunity to do so. Wright (1994) describes the relationship between employment
equity and AA as the assumption that one lives in a fair world, a world in which the playing field is not
UUnniivveerrssiittyy ooff PPrreettoorriiaa eettdd –– CCooeettzzeeee,, MM ((22000055))

2.6
slanted. In contrast, when speaking of AA, the assumption is that decades or centuries of discrimination
have created a slanted playing field and that measures need to be taken to level this playing field.
According to Luhabe (1993), employment equity provides equal access for all people to participate in the
empowerment process and advance on the basis of merit, ability and potential. Furthermore, it assumes
that people come from a homogeneous background and can therefore compete on an equal basis.
The relationship between AA and employment equity can thus be summarised as follows: Affirmative
action forms part of an employment equity programme and, according to Bendix (2001), is the last step
towards achieving true employment equity. Employment equity will exist when all discrimination barriers
and past imbalances have been eliminated and everyone is able to compete on an equal footing. Hence
the need to make use of fair discriminatory interventions (affirmative action) to achieve employment equity
would no longer exist. Table 2.2 outlines the main elements which differentiate affirmative action and
employment equity from each other.
TABLE 2.2
DIFFERENCES BETWEEN AFFIRMATIVE ACTION AND EMPLOYMENT EQUITY
AFFIRMATIVE ACTION EMPLOYMENT EQUITY
! Preferential treatment when appointing or
promoting
! Merit as a criterion when appointing or
promoting
! Preferential treatment ! Makes no distinction
! Ensures access into an organisation ! Promotes equal access to an organisation
! Has a limited lifespan ! Does not have a limited lifespan since it
forms part of an organisation’s culture
! Refers to equality and needs when making
decisions
! Refers to equity when making decisions
Source: Adapted from Viljoen (1997)
It should be clear that the intent of AA programmes is not to further the interests of a particular group but
to eliminate discrimination. Consequently an AA programme is seen as a temporary intervention designed
to achieve equal employment without lowering standards and without unfairly hindering the career
aspirations or expectations of current organisation members who are competent in their jobs.
Although people have different interpretations of affirmative action, a number of common objectives have
been identified.
UUnniivveerrssiittyy ooff PPrreettoorriiaa eettdd –– CCooeettzzeeee,, MM ((22000055))

2.7
2.4 OBJECTIVES OF AFFIRMATIVE ACTION
South Africa is a land of contrast: First World prosperity rubbing shoulders with Third World poverty;
picturesque landscapes blemished by overcrowded squatter camps; peace and violence; immense wealth
in natural resources contrasting with impoverishment in terms of the development and utilisation of the
potential of people. All of this is characteristic of a society in the throes of change, and can be resolved
through the process of AA. Through AA programmes, inequalities between individuals and groups are
bridged and a win situation develops for individuals, organisations and the country as a whole (Hicks-
Clarke & Iles, 2000).
The mission statements of South African organisations often refer to employment equity and statements
such as “equal employment employer” and “our human resources are our greatest asset” are common.
However, one of the most difficult challenges facing any person in a leadership position is the ability to
translate intention into action. Before an organisation can take any action to implement AA, it has to know
what it wishes to achieve and therefore clear objectives need to be set. In South Africa, the Black
Management Forum plays a prominent role in the implementation of AA and it regards the following as
the primary objectives of AA:
2.4.1 Black Management Forum’s viewpoints
According to the Black Management Forum, as quoted by Viljoen (1997), AA should:
! reverse the prevailing situation of disadvantage of the majority
! represent an affirmation of all the human rights which were historically violated by institutionalised
discrimination
! create opportunities for education, training and development in the workplace which should result
in the demonstrable economic empowerment of those who will benefit from them
! bring about complete transformation of the racist and sexist attitudes and practices that have been
at the core of organisations in the past — it must help to develop a new organisational ethos and
an innovative set of policies and procedures for the empowerment of all staff
! reach certain targets in order to reflect the demographic profile of the South African population at
a given time
It is interesting to note that although the Black Management Forum regards the organisation as the primary
beneficiary of AA, this is not reflected as such in its list of objectives. According to the objectives listed
above, it is the AA candidate who mainly benefits from AA. However, even though they may be indirect,
the benefits of AA do also help the organisation.
UUnniivveerrssiittyy ooff PPrreettoorriiaa eettdd –– CCooeettzzeeee,, MM ((22000055))
2.8
2.4.2 Benefits of affirmative action
According to Charlton and Van Niekerk (1994), AA will benefit the beneficiaries of AA in the following
ways:
! economic empowerment (improved education and the creation of employment opportunities)
! access to resources (transport and social welfare)
! the meeting of basic needs (security, food and housing)
! political rights
! psychological growth (improving quality of life, restoring human dignity, boosting confidence and
promoting a sense of coresponsibility for the country's prosperity)
It cannot be denied that, in the past, the vast majority of the population of South Africa was denied access
to all resources - economic, political, social and psychological. Consequently, proactive change which
constructively redresses the inhumanity of the past in all these spheres of human activity is needed.
However, while this change has a moral perspective, it has also become an economic necessity. The
critical ingredient for success is human competence. The better people are equipped to unleash their
potential and the people around them, the sooner everybody will be able to contribute to the success of
organisations and the country as a whole. Affirmative action, however, serves no purpose if it is based
on handouts such as money, material resources and glamourous jobs instead of empowerment, the
restoration of human dignity and the development and utilisation of people’s skills and abilities. To ignore
the human spirit as part of AA is economic suicide. Indeed, action without the correct attitude will simply
result in short-term change, without long-term growth.
Charlton and Van Niekerk (1994:xxiv) summarise the importance of implementing AA from a psychological
point of view as follows:
What we are saying is that the solution to South Africa’s problems is as much psychological
and attitudinal as it is economic, that the growth of the economy and effectiveness of
redistribution is dependent on long-term affirming action and not short-term affirmative action.
Put differently: if organisations appoint people from disadvantaged groups merely for the sake of meeting
employment equity targets without capitalising on the value they bring to the organisation, such
appointments could, in the long term, lead to increased labour costs, lower profits, retrenchments or even
the closure of businesses.
UUnniivveerrssiittyy ooff PPrreettoorriiaa eettdd –– CCooeettzzeeee,, MM ((22000055))
2.9
2.5 OBSTACLES TO AFFIRMATIVE ACTION SUCCESS
Affirmative action strategies are challenged by the fact that these initiatives occur against the background
of South Africa’s long history of entrenched racism. Changing the way things are done and re-examining
concepts internalised over may years can be a difficult process, strongly resistant to change.
People hold strong views on AA: at the one extreme is a positive view which questions the right white
people had to exclude blacks and women from leadership positions, power and opportunities in the past.
This view stresses the need to remove obstacles to advancement as well as the need for extra support
and resources for people traditionally excluded.
The negative arguments are equally persuasive. Critics of AA ask how anyone who believes in equality
can agree to a policy of special treatment for specific categories of people (reverse discrimination).
Another position questions the economic sense of AA, claiming that it undermines the basic principles of
free enterprise which state that rewards follow from merit and that decisions should be made by applying
the equity rule.
In order to meet the arguments of AA critics, exponents of AA need to show how the methods they choose
could ultimately increase excellence - as opposed to those forms of AA which look good but are
destructive and wasteful in the long run. Similarly, those who are concerned with productivity and
organisational effectiveness should be convinced that social equality brings out the best, and most
sustainable development of a society.
One of the main obstacles in the successful implementation of AA programmes is the underlying sincerity
or fundamental commitment to meaningful change through AA. Accusations of window-dressing are being
flung around in organisations that provide token positions as part of cosmetic change and offer new
appointees shiny offices and impressive titles without concomitant responsibility and accountability. The
implementation of AA at all costs to achieve employment equity may cause a loss in efficiency and reduce
the advantages of AA — hence employers are not expected to appoint or promote people who do not
possess the required qualifications or abilities. However, they are expected to implement programmes
which develop employees' potential and enable them to look for better opportunities. At present, most AA
policies are deemed to be based on a trail by error basis (Van Jaarsveld, 2000).
According to the Employment Equity Report (2001) issued by the Department of Labour, organisations
reported the following as barriers to employment equity:
! recruitment and selection processes
! training and development
! succession and experience planning
UUnniivveerrssiittyy ooff PPrreettoorriiaa eettdd –– CCooeettzzeeee,, MM ((22000055))
2.10
! performance and evaluation systems
! job classification and grading
2.5.1 Implementation problemsVan Jaarsveld (2000) contends that the problems with AA do arise not from the principle as such but from
the manner in which it is implemented. AA is implemented incorrectly when an organisation views
employment equity as a political imperative that has to be complied with, and not as a business objective -
to have as effective and competent a workforce as possible. In such instances, AA leads to the following:
! People are appointed in AA positions to fill quotas or to window-dress without taking into account
their ability or suitability for the position.
! Reverse discrimination occurs.
! An elite group of AA candidates is advanced while the rest of the population stays where they are.
! The“revolving door” syndrome develops. Organisations often appoint a few black faces at the right
levels in the organisation to make the organisation appear politically correct. The AA appointees,
on the other hand, enter the organisation with high expectations and the need to develop and
achieve success. Unfortunately nothing is done about the organisation’s culture and related
systems and the needs of AA appointees are therefore overlooked. This makes the appointees feel
excluded, frustrated and disillusioned and ultimately compels them to seek employment elsewhere.
This situation reinforces management’s belief that blacks and women do not have the ability to cope
with the demands of the corporate world and that AA initiatives have no benefit to offer
organisations. When this happens, the organisation does nothing further to address any
inequalities until another crisis in the form of pressure from trade unions or government compels it
to make AA appointments — and the whole cycle starts again.
2.5.2 Strategic concernsAccording to Thomas (2002), the legislation of AA in South Africa has led to the following strategic
concerns:
! The overregulation of the labour market results in a decrease in overseas investments and
entrepreneurial initiatives.
! Heavy administrative costs relating to compliance with the legislation impact on organisational
growth.
! The shortage of skills in some sectors makes black skills more expensive and unfordable to smaller
organisations, thus providing disincentives for investment and expansion.
! The shifting of employees from some employers to others hinders the creation of new jobs for new
entrants to the labour market.
! The African National Congress sees the future of employment equity in special investments in rural
infrastructures such as roads, schools and water. The government’s Redistribution and
UUnniivveerrssiittyy ooff PPrreettoorriiaa eettdd –– CCooeettzzeeee,, MM ((22000055))

2.11
Development Programme should address these issues, and employment equity in this context
should rather be used with reference to the employment needed on rural construction sites (Van
Jaarsveld, 2000).
In addition to the aforementioned problems, the South African workplace is characterised by adversarial
relationships, a lack of trust and communication between individuals and groups, poor teamwork, the
apparent absence of employee commitment to and motivation to achieve organisational goals, high staff
turnover (especially amongst those from designated groups), industrial conflict and low levels of
productivity, profitability, quality and customer service (Thomas, 2002). A recent South African study has
highlighted that, while black managers may leave organisations for higher salaries and related perks,
issues relating to not fitting into historically established corporate cultures also seem to impact on what
has become derogatorily known as “job hopping” (Thomas, 2000).
2.5.3 Organisational concernsThomas (2002:237-239) regards the following as problems at organisational level with the introduction of
AA strategies in South Africa:
! In an attempt to appear acceptable in terms of race and gender, token appointments of people
lacking the necessary skills have been made. This has led to a decline in service levels and people
being given meaningless jobs.
! There is a prevalence of negative expectations about candidates from designated groups,
heightened scrutiny of them, fears and resentments on the part of those who stand to lose
promotional opportunities and the resultant sabotage of the process, by, say, the withholding of
information and the exclusion of members of designated groups from formal and informal networks
and systems that foster job progress.
! The increase in indirect and opportunity costs as a result of, say, poor hiring decisions (to achieve
employee targets), and the declining morale of white employees.
! The heightening of race classification and “reverse discrimination” will lead to a decrease in
employee loyalty and the lack of retention of skilled employees.
! People from designated groups who still require training and development will have unrealistic
short-term expectations and may expect secured positions and adopt a culture of entitlement.
! Employment equity measures have not been regarded as strategic business issues and accordingly,
there has been a lack of management commitment to this process.
! No business imperative has been identified by management with regard to the competitive
advantage that a diverse workforce can afford.
! Performance management as a means of training and developing people from designated groups
into fully productive employees, has been poor.
UUnniivveerrssiittyy ooff PPrreettoorriiaa eettdd –– CCooeettzzeeee,, MM ((22000055))

2.12
Needless to say, the incorrect implementation of AA programmes can be extremely costly. The highest
cost results from not fully utilising all employees in organisations.
2.5.4 The costs of affirmative actionCox (1993) and Morrison (1992) have noted the economic costs of not fully utilising all employees in
organisations, as evidenced by absenteeism, employee turnover, poor morale, underperformance and
poor customer service. According to Charlton and Van Niekerk (1994), costs incurred in poor
implementation of AA programmes include the following:
! high recruitment costs due to the high turnover of AA candidates
! high salaries paid in order to prevent AA candidates from being head-hunted by other organisations
! indirect costs associated with the dissatisfaction of the current workforce with AA programmes
! legal costs resulting from the need to terminate employment contracts of AA candidates who cannot
cope with the demands of the position
! additional compensation paid for overtime and contract work due to AA employees not being
developed or optimally utilised
2.5.5 Implementation issuesIn order to capitalise on the benefits offered by an AA programme, the following aspects of implementation
warrant ongoing attention:
! The long-term successful redistribution of resources relies on economic growth which, in turn, is
dependent upon AA in order to develop and utilise a country’s human resources and to ensure
political stability (Charlton & Van Niekerk, 1994). The uncompetitive nature of South Africa, its low
growth rate and high level of unemployment are all factors that mitigate against the effective
implementation of AA. The regular strike actions evident in South Africa have also contributed to
a lack of economic growth and high crime rates. In an organisational context, the financial position
of the organisation plays an equally vital role in the success of an AA plan. From a financial point
of view, organisations cannot afford to appoint incompetent people for window-dressing purposes.
Not only will this affect the productivity of the organisation negatively, but will also contribute to
unnecessarily high labour costs.
! To a certain extent, South Africa appears to have learned that a multiplicity of legislation dealing
with employment equity is confusing and unlikely to be adhered to, because of the gaps and
loopholes that tend to exist when separate Acts govern different beneficiaries or areas of practice.
In an organisational context the AA policy should consist of well-defined goals and be simple to
understand.
UUnniivveerrssiittyy ooff PPrreettoorriiaa eettdd –– CCooeettzzeeee,, MM ((22000055))
2.13
! The South African government did apparently realise the importance of engaging in an active and
consultative process with organised business and labour in formulating legislation and policy
governing such legislation. While consensus has not prevailed in all aspects of the legislation, this
consultative process did achieve greater support for the implementation of the legislation than would
otherwise have occurred. In an organisational context attempts are made to involve the
representatives of all interested parties in the implementation of an employment equity plan.
! A cause for concern has arisen in South Africa where jobs are subtly reserved, in some instances,
by African managers for “friends in the struggle against apartheid” and where business has
capitalised upon the recruitment of blacks who were trained abroad during the apartheid era. It is
common practice in South African organisations to recruit blacks into senior positions in order to
secure government or parastatal contracts. Structures need to be set up that will ensure that AA
does not simply benefit an elite group or result in the practice of tokenism. Organisations have to
ensure that policies and structures are in place to prevent the occurrence of tokenism and
favouritism.
! Numerical target setting is essential because it is the single best predictor of the subsequent
employment of members from designated groups. The South African Department of Labour has
legislated that negotiated targets between management and employees are set between one and
five years. With regard to numerical target setting, the employment equity plan has to achieve the
equitable representation of suitably qualified persons from designated groups within each
occupational category and level in the work force.
! Studies have shown that AA must necessarily be embarked upon as a holistic process. There must
be a focus beyond numbers to issues relating to training and development, mentoring and coaching.
One of the challenges facing South African organisations is the retention of AA candidates. In order
to retain their services, organisations should make special provision for career advancement,
accelerated training and development, flexible compensation structures and sound labour relations.
With regard to training and development, the aim of the Skills Development Act 97 of 1998 and
Skills Development Levies Act 9 of 1999 is to coordinate industrial training in a more structured and
purposeful manner.
! It is evident that the success of AA depends on the commitment of top management. While
legislation can provide a foundation to prevent the occurrence of overt discrimination, the law, per
se, without enforced compliance, is not sufficient to remove discrimination. However, compliance
is one thing; actual effective utilisation of those appointed through AA strategies is quite another.
It is surprising how few committed efforts to managing diversity and AA have been made. Many
organisations pay lip-service to the need for employment equity and managing diversity, yet few
appear to have incorporated these kinds of objectives into either their strategic planning process
or reward systems (Human, 1996).
UUnniivveerrssiittyy ooff PPrreettoorriiaa eettdd –– CCooeettzzeeee,, MM ((22000055))

2.14
2.5.6 Critical success factorsAccording to Human (1996), the implementation of AA will be successful if the following critical success
factors are in place:
2.5.6.1 Employee development as a strategic issue
Employee development as a strategic issue refers to the extent to which people development and
particularly people from designated groups are regarded as key strategic issues for the organisation. In
this regard, AA should be seen as increasing the pool of talent available for development. Development
must not be viewed simply in terms of providing education and training for the disadvantaged en masse.
Managers should be trained in people management skills, identifying training and development needs and
managing employees’ careers. As such managers will be evaluated and rewarded in terms of their ability
to develop subordinates. The development of employees, however, is not only management’s
responsibility, but employees should realise that they are also responsible for their own development.
2.5.6.2 Staffing
This refers to the way in which people are matched to jobs. It involves a critical analysis of current
selection and recruitment procedures, criteria for entry into jobs, selection instruments and organisational
culture. Such an analysis should lead to attempts to overcome unfairness and obstacles, to remove glass
ceilings and to eradicate both tokenism and resistance.
2.5.6.3 The role of organisational culture in the development of people
Organisational culture refers to the importance attached to the development of people and the norms,
values and beliefs that reinforce or discourage people development in general and the advancement of
the historically disadvantaged in particular. According to Ivancevich and Matteson (2002), an
organisational culture that supports people development is characterised by the following:
! positive expectations of individuals and their competence
! open, honest and constructive feedback on performance
! evaluation of performance based on results achieved in terms of short- and long-term objectives
2.5.6.4 The role of the human resource function
The role of the human resource function is to support line management in the appointment and retention
of employees. In order to provide effective support, an audit of the organisation in terms of workforce
composition, policies and procedures and the perceptions of all levels of employees needs to be
conducted regularly. The development of a workforce profile is crucial before any appointment, promotion
or development decisions can be made.
2.5.6.5 Management commitment and support
Organisations should develop strategies for dealing with AA and diversity issues. These strategies should
be developed in consultation with trade unions and nonunionised employees. A committee composed of
UUnniivveerrssiittyy ooff PPrreettoorriiaa eettdd –– CCooeettzzeeee,, MM ((22000055))
2.15
employer, employee and trade union representatives should continuously monitor, evaluate and refine the
AA strategy. In order to gain support for AA interventions, management need to communicate their AA
policies clearly and honestly indicating how diversity factors are factored into staffing and employee
development decisions.
South African organisations are compelled to comply with the provisions of the Employment Equity Act.
According to Thomas (2002), the three key issues on which organisations should focus in its attempt to
comply with Employment Equity targets are: (1) sound monitoring of progress towards employment equity;
(2) proactive measures to ensure that the majority of previously disadvantaged groups benefit from the
legislation, and (3) the introduction of holistic human resource practices that complement target setting.
2.6 JUSTIFICATION FOR AFFIRMATIVE ACTION
Justifying AA without reference to justice and equality is impossible. As mentioned earlier, justice consists
of distributive and procedural components. Distributive justice refers to the perceived fairness of the
outcomes or allocations that an individual receives. In an organisational setting, a job offer or a promotion
will resemble the outcome or decision. Procedural justice refers to fairness issues concerning the
methods, mechanisms, and processes used to determine outcomes (Cropanzano, 1993). In an
organisational context it refers to the methods or processes used to make a selection decision or to decide
who should be promoted. Equality refers to the principle of similar treatment irrespective of background
or ethnicity. But this in itself poses a problem because people are not the same, and treating them as the
same actually promotes inequality. True equality will exist only if it is not seen as a removal of social
barriers but a process of balancing in which differences in all social, cultural and ethnic surroundings are
taken into account.
In order to understand why AA can be viewed as fair, it is essential to determine how AA is related to
justice and equality. Inevitably, a certain amount of tension will prevail between the antidiscriminatory and
AA legs of employment equity. Anti-discrimination measures protect and promote equality by stating
clearly that no discrimination may take place with regard to ethnicity, gender, and disability, whereas the
AA measures allow for unequal treatment that is deemed to be fair discrimination (Van Wyk, 2002).
Affirmative action is intended to restore diversity in society and the workplace where previous
discrimination practices excluded it — hence its association with social justice and fair balances. In South
Africa, AA is described as a “tool of justice” which could rectify past discrimination practices whilst
contributing to the demand for equality. One should accept that, even if the discrimination created by AA
may not be entirely justifiable, it should in some ways be morally excusable, if one takes past
discrimination into consideration. In order to justify AA, it is necessary to elaborate on the concepts of
social justice and equality.
UUnniivveerrssiittyy ooff PPrreettoorriiaa eettdd –– CCooeettzzeeee,, MM ((22000055))

2.16
According to the utilitarian perspective on justice, justice distinguishes between the rights of the individual
and of society. Utilitarian justice recognises an individual’s right to equal treatment by what should be the
best for society, while so-called “common-sense” justice demands from society a correction of previous
discrimination practices (Rosenfeld, 1991). Affirmative action does not intentionally exclude a certain
group of people, and the unintended exclusion (discrimination) should therefore be perceived as an
undesirable side-effect. To obtain justifiable AA programmes, preference should be given to deserving
individuals, thus balancing the gains of the individual with those of society. Affirmative action, however,
can only equal justice if it is applied in favour of people who have actually been deprived of opportunities.
This means that the application of AA programmes can result in the discrimination of impoverished white
workers because of the denial of employment in favour of people from designated groups. A society which
agrees that past discrimination needs to be addressed should acknowledge that AA based on fairness
may be the best solution available. The fairness of AA has a moral conception which is embodied in the
human character and social life. The acceptance of this kind of fairness would demand a society which
accepts a new conception of justice necessary to regulate the structures of life. The justification for AA
should thus be seen in this new way of thinking (Van Jaarsveld, 2000).
As mentioned earlier, a goal of AA programmes is to put individuals on an equal footing in order to make
employment competition fair and just. This can only be achieved if similar treatment is translated into
equal treatment and takes diversity into account. It should be accepted that all AA programmes cannot
result in absolute fair equality. Individual differences in talents and skills will have an influence.
Affirmative action does not proclaim to bring forth absolute equality. What it does profess is to address
the effects of discrimination through remedial policies. The question regarding how AA can have equality
as its goal when in practice it is discriminating against white workers, is thus largely answered by the
above explanation of social justice. Although future inequalities may be inevitable, the notion of fairness,
reciprocity and justice should be accepted as being part of social reality.
Society has been adamant that inequality should be addressed and the victims of discrimination afforded
an opportunity to catch up with the rest of society. But how long will it take previously disadvantaged
people to catch up? In order to keep the justification for AA fair, it is believed that the practice should not
exist indefinitely. One of the purposes of AA programmes is to provide members of previously
disadvantaged groups with opportunities for advancement, even if this entails elements of discrimination.
Neither organisations nor a country, however, can afford to engage in social and community upliftment
programmes for an indefinite period of time. At some stage the beneficiaries of AA programmes should
be held accountable for their own development and advancement. When this stage is reached,
preferential treatment should become something of the past since everybody will then have been placed
on an equal footing. The primary problem with AA interventions in the USA is its duration of more than
30 years. Let us hope that South Africa does not make the same mistake. By combining training with
appointments, AA programmes may achieve equality within a reasonable period of time (Van Jaarsveld,
2000). Blacks who are already denouncing AA as favouritism and white workers who are rejecting it as
reverse discrimination have shown that time may not be on the policy’s side.
UUnniivveerrssiittyy ooff PPrreettoorriiaa eettdd –– CCooeettzzeeee,, MM ((22000055))

2.17
2.7 SUMMARY
It may be fair to suggest that AA has yet to make its mark in South Africa. Various opinions exist on the
desirability, fairness and future of AA. In South Africa the main beneficiaries of AA are perceived to be
black middle class and professional women of all ages. Affirmative action programmes should, however,
have advantages for all concerned if clear goals are set. Whether goals, timetables or quotas should be
used to create employment equity is a matter of opinion. Because quotas may result in the hiring of
unqualified people and timetables may be designed without proper consideration, it is suggested that goals
should be used to establish employment equity. According to Van Jaarsveld (2000), progress towards
the implementation of AA programmes has been made but there is still a discrepancy between the
representation of black people at management levels. In the middle-management positions, the number
of blacks being employed in South Africa has increased from 32 to 45 percent.
South African organisations are compelled to comply with the provisions of the Employment Equity Act.
Perhaps lessons from other countries could help South Africa to overcome the major obstacles in the
implementation of AA. The macroeconomic issues are more complex and need government's attention
to ensure that employment equity and the diversity that it creates in organisations work towards the
competitiveness of the country and that racial and ethnic divisiveness is not created. At operational level,
the challenge is to identify sound business reasons for the diversity created by strategies to achieve
employment equity. This demands creative vision and the will on the part of management to fully tap into
the potential of all employees in the workforce.
Although employment equity is still a relatively new policy in South Africa, the government does seem to
be looking at the negative comments directed at its programmes. Because there are more than enough
grounds to question the skills of appointed black workers, the government has recognised the importance
of training programmes and passed legislation such as the Skills Development Act 97 of 1998 and Skills
Development Levies Act 9 of 1999.
In this chapter the meaning of AA, as intended by legislation, was discussed. The origin of AA and
employment equity, the primary objectives of AA and the obstacles to achieving employment equity were
briefly outlined. This was followed by a discussion of the purposes of AA and the obstacles hindering the
effective implementation of AA programmes and the justification for AA in terms of justice and equality.
In an attempt to understand how AA is related to organisational justice and fairness perceptions, the next
chapter will briefly refer to the management of AA and focus in particular on how it should be implemented
at organisational level if employees are to perceive it as fair.
UUnniivveerrssiittyy ooff PPrreettoorriiaa eettdd –– CCooeettzzeeee,, MM ((22000055))

3.1
Chapter 3
AFFIRMATIVE ACTION AT ORGANISATIONAL LEVEL
3.1 INTRODUCTION
Although an awareness of the need for employment equity constitutes the foundation of an AA
programme, it does not guarantee success. Action should be taken to ensure that AA programmes are
implemented in a purposeful and planned manner. However, this is not an easy task since a frequent
reversion to the security of old habits is unavoidable and a step-by-step guide on the implementation and
management of AA programmes does not exist.
In organisations which are not proactive, change or the awareness of the need for change usually arises
from trigger incidents or circumstances. These incidents may be internal in the form of a decline in morale
and productivity, employee dissatisfaction, union interference and budgetary constraints. Alternatively,
external factors such as a change in legislation, a shift in employee demographics and increased global
competition may serve as triggers for change. The Employment Equity Act, for example, has obliged
organisations to take a new look at employment practices. The selection criteria and methods used to
make appointment decisions are two of the most important factors that had to be revised for AA purposes.
As such, these two factors were also responsible for most of the concerns raised about the fairness of AA.
Affirmative action programmes should be managed from a legal and a moral perspective. From a legal
point of view, they should meet all the requirements of Employment Equity Act 55 of 1998 and the
Promotion of Equality and the Prevention of Unfair Discrimination Act 4 of 2000. From a moral point of
view, such programmes should be managed in such a way that employees perceive AA to be fair. This
chapter will briefly discuss these two Acts and the steps in the implementation of the AA programme. The
implications of AA for various human resource policies, procedures and practices will also be outlined.
The discussion will focus in particular on how HR policies, procedures and practices should be adjusted
for AA purposes.
3.2 EQUALITY AND JUSTICE
In an attempt to promote social justice and eradicate inequalities, the government has promulgated two
Acts, namely the Employment Equity Act 55 of 1998 and the Promotion of Equality and the Prevention of
Unfair Discrimination Act 4 of 2000. These two Acts are briefly discussed in the sections that follow.
The source of all legal norms can be traced back to the Constitution of the Republic of South Africa 108
of 1996 which guarantees the fundamental right to equality. In the preamble to the Constitution, some of
the aims of the Constitution are formulated as follows:
UUnniivveerrssiittyy ooff PPrreettoorriiaa eettdd –– CCooeettzzeeee,, MM ((22000055))

3.2
! Heal the divisions of the past and establish a society based on democratic values, social justice
and fundamental human rights;
! Lay the foundations for a democratic and open society in which government is based on the will
of the people and every citizen is equally protected by law;
As mentioned earlier, there will inevitably be a tension between the aims of formal equality (the prohibition
of unfair discrimination) and substantive equality (affirmative action). Section 9 of the Constitution clarifies
this somewhat by making it clear that deviations from formal equality will be allowed, by means of AA as
a form of fair discrimination.
3.3 THE EMPLOYMENT EQUITY ACT 55 OF 1998
The Employment Equity Act was signed by the President on 12 October 1998. Some of the aims of the
Act are to
! promote the constitutional right of equality and the exercise of true democracy;
! eliminate unfair discrimination in employment;
! ensure the implementation of employment equity to redress the effects of discrimination;
The Act provides for two main pillars in its legislated structure to achieve employment equity, namely:
(1) the prevention and prohibition of unfair discrimination
(2) the implementation of affirmative action measures
Chapter II of the Act prohibits unfair discrimination, while Chapter III prescribes affirmative measures
which designated employers must take to promote employment equity in respect of Africans, women and
persons with disabilities. Suffice to say that nonbeneficiaries of affirmative measures will rely on chapter
II as the basis of their challenge of affirmative measures, while employers will rely on Chapter III to defend
their AA policies and practices.
Figure 3.1 provides a schematic representation of employment equity and illustrates how the two main
pillars are interrelated.
UUnniivveerrssiittyy ooff PPrreettoorriiaa eettdd –– CCooeettzzeeee,, MM ((22000055))

3.3
FIGURE 3.1: EMPLOYMENT EQUITY
EMPLOYMENT EQUITY ACT
– –
UNFAIR DISCRIMINATION AFFIRMATIVE ACTION
– –
No discrimination on the basis of• race• gender• sex• pregnancy• marital status• family responsibility• ethnic or social origin• colour• sexual orientation• age• disability• religion• HIV status• conscience• belief• political opinion• culture, language or birth
Positive measures to increaserepresentativity of previouslyunder-represented groups Supported by
SKILLSDEVELOPMENTACT
–
Removal ofbarriers toemployment andmobility
Supportofdiversity
– –
EMPLOYMENT EQUITY PLAN
Source: Adapted from Bendix (2001)
3.3.1 Unfair discrimination
The Act obliges all employers to promote equal opportunity by eliminating discrimination in all employment
policies and practices. It further prohibits discrimination on any arbitrary grounds including, but not limited
to, race, gender, pregnancy, marital status, family responsibility, ethnic or social origin, colour, sexual
orientation, age, disability, religion, HIV status, political opinion, culture, language, and so forth. The Act
provides that measures to promote previously disadvantaged groups will not be regarded as constituting
unfair discrimination; nor will differentiation based on the requirements of a particular job.
UUnniivveerrssiittyy ooff PPrreettoorriiaa eettdd –– CCooeettzzeeee,, MM ((22000055))
3.4
Where discrimination is concerned, applicants for a position are also regarded as employees. The
significance of this is that any person applying for a position may question both the short-listing of
candidates and the actual selection decision (Bendix, 2001).
3.3.2 Affirmative action
In terms of the Act, AA measures are designed to ensure that suitably qualified people from designated
groups have equal employment opportunities and are equitably represented in all occupational categories
and levels in the workforce of a designated employer. Affirmative action measures implemented by a
designated employer must therefore include:
! measures to identify and eliminate employment barriers, including unfair discrimination, which
adversely affect people from designated groups
The thrust of the Employment Equity Plan is to identify and correct the under-representation of designated
groups. According to the Act, as quoted by Swanepoel, Erasmus, Van Wyk and Schenk (2000), all
designated employers have to staff their organisations by implementing the following steps:
! consult with employees about the equity process
! conduct an analysis of the workforce
! prepare an employment equity plan
! prepare and submit an equity plan report to the Director-General on progress
! submit a statement on income differentials to the Employment Conditions Commission
(1) Consultation. The Act stipulates that the employer has to consult with a representative employee body
about the demographic analysis of the workforce, on the preparation and implementation of the
Employment Equity Plan and the report to be submitted.
(2) Analysis of the workforce. The employer needs to collect information on and conduct an analysis of all
employment practices and procedures as well as the work environment in order to identify barriers to
the employment or continued employment of designated groups. In addition, the employers must
establish a demographic profile of the workforce in each employment category or level in order to
determine the degree of under-representation of designated groups.
(iii)The Employment Equity Plan. The Employment Equity Plan must include the following:
! affirmative action targets
! measures to identify and eliminate employment barriers
! measures designated to promote workforce diversity
UUnniivveerrssiittyy ooff PPrreettoorriiaa eettdd –– CCooeettzzeeee,, MM ((22000055))
3.5
! measures to accommodate persons from designated groups to ensure that they enjoy equal
opportunities and are equitably represented in all occupational categories and groups
! measures to retain and develop people from designated groups and to implement measures in
terms of the Skills Development Act
! the objectives for each year of the plan
! a timetable showing how objectives are to be achieved
! the duration of the plan
! procedures for implementing and monitoring the plan
! internal disputes, procedures relating to discrimination and AA
(4) Submission of reports. All organisations employing more than 50 people or exceeding the established
turnover threshold have to report on their employment equity plans to the Director-General. Once a
report has been submitted it becomes a public document and employers are thus obliged to make
copies of the plan available to employees for consultation and discussion.
(5) Income differentials. When an employer submits his or her equity report, he or she must also submit
a report to the Employment Conditions Commission outlining the remuneration and benefits received
in each occupational category and level of the workforce. Where the income statement reflects
disproportionate income differentials, employers must take steps to progressively reduce the
differences.
3.4 PROMOTION OF EQUALITY AND THE PREVENTION OF UNFAIR DISCRIMINATION
ACT 4 of 2000
The two main reasons for the promulgation of the above-mentioned Act were to expand the scope of the
Employment Equity Act so that it covers social institutions other than employers, and to place a general
duty on all people to promote equality.
In the preamble to the Promotion of Equality and the Prevention of Unfair Discrimination 4 of 2000, as
quoted by Van Wyk (2002:42-44), the following, inter alia, is stated:
! The consolidation of democracy in our country requires the eradication of social and economic
inequalities, especially those that are systemic in nature, which were generated in our history by
colonialism, apartheid and patriarchy, and which brought pain and suffering to the great majority
of our people;
! Although significant progress has been made in restructuring and transforming our society and its
institutions, systemic inequalities and unfair discrimination remain deeply embedded in social
structures, practices and attitudes, undermining the aspirations of our constitutional democracy;
UUnniivveerrssiittyy ooff PPrreettoorriiaa eettdd –– CCooeettzzeeee,, MM ((22000055))

3.6
! The basis for progressively redressing these conditions lies in the Constitution which, amongst
others, upholds the values of human dignity, equality, freedom and social justice in a united, non-
racial and non-sexist society where all may flourish;
! This Act endeavours to facilitate the transition to a democratic society, united in its diversity,
marked by human relations that are caring and compassionate, and guided by the principles of
equality, fairness, equity, social progress, justice, human dignity and freedom.
As mentioned earlier, antidiscrimination laws are not enough to prevent unfair discrimination and ensure
the successful implementation of AA measures. Although they do remove legal barriers to employment,
they do not eradicate the historical inequalities which are still prevalent. Neither can the law in itself
remove nonlegal or societal barriers arising from people's attitudes — for this a concerted human resource
management effort is needed. Human resource managers should thus treat employment equity as an
HRM priority and strategic business issue.
3.5 THE IMPLEMENTATION OF AFFIRMATIVE ACTION
South African organisations are facing the challenge of developing and implementing AA programmes that
will achieve the joint goals of employment equity and wealth creation. It is clear that in many African
countries, measures to redistribute wealth and impose organisational control have been implemented with
scant regard for economic growth. The consequences of such an approach have been disastrous for the
national economies of these countries and have resulted in the impoverishment of all. A common theme
in the experiences of numerous countries is that the long-term successful redistribution of resources is
dependent upon economic growth which, in turn, is reliant upon AA in order to develop and utilise a
country’s human resources and ensure political stability. It should thus be clear that the systematic and
strategic management of AA is of crucial importance for the wealth of the individual, the organisation and
the country.
3.5.1 A strategic approach to affirmative action
The strategic business plan serves as a map for gaining and/or retaining an organisation’s competitive
advantage and should therefore be used as a starting point for the implementation of any other
interventions such as AA. Any strategic plan must incorporate an assessment of where one is at present
in relation to where one needs to be. The difference between “where am I?” and “where do I need to be?”
indicates a deviation and should be addressed by means of a strategy comprising of achievable,
intermediate goals that are measurable and attached to time schedules and review dates. The AA
strategy should thus be an integral part of the overall business and human resources strategy of the
organisation. Figure 3.2 outlines the steps in the development and implementation of an AA programme.
Since it is not the purpose of this study to investigate the management of AA, the steps in developing and
implementing an AA programme will not be discussed any further. The discussion will focus instead on
UUnniivveerrssiittyy ooff PPrreettoorriiaa eettdd –– CCooeettzzeeee,, MM ((22000055))
3.7
the implications of AA for organisational policies, procedures and practices. These implications largely
determine employees' perceptions of AA and what they regard as fair.
3.6 THE IMPLICATIONS OF AFFIRMATIVE ACTION FOR ORGANISATIONAL POLICIES,
PROCEDURES AND PRACTICES
The strict prohibition on discrimination places an obligation on employers to review all policies, procedures
and practices to ensure that they do not contain or involve any form of discrimination or unjustifiable
differentiation. The practices and procedures most influenced by AA are briefly discussed in the sections
below.
3.6.1 Recruitment
Smart human resource professionals are always mindful of ways to minimise their organisation’s liability
for employment-related claims. Although the Employment Equity Act is silent on the issue of recruitment,
employers should ensure that they reach all possible candidates and that word-of-mouth recruiting
(employee referrals) should be discouraged except when it is aimed at head-hunting for AA candidates.
Through employee referrals, information about new jobs is restricted to the friends and relatives of the
incumbent employee. At this, whites occupy the majority of higher-level positions and Africans are
therefore less likely than other groups to obtain information about vacant managerial positions. Bendix
(2001) states that the active canvassing of candidates is not unacceptable but warns against “poaching”
from other organisations because this merely sustains the élitism of the already employed. It is preferable
to approach persons who may not yet be filling a position at a particular level but who display the potential
to grow into the job. The recruitment of Africans is problematic because they are less likely than other
groups to belong to social networks linking them to jobs. This is especially true of Africans living in socially
isolated low-income neighbourhoods. Hiring through professional associations also places Africans at a
disadvantage (Ward, 2000). A practice that is becoming increasingly popular is that of online recruitment.
Although online recruitment has tremendous growth opportunities and offers various benefits, at this stage
it is not well suited to a country such as South Africa because of the large number of people without
access to the Internet (Ramchurran, 2001).
UUnniivveerrssiittyy ooff PPrreettoorriiaa eettdd –– CCooeettzzeeee,, MM ((22000055))

3.8
FIGURE 3.2STEPS IN THE IMPLEMENTATION OF AN AFFIRMATIVE ACTION PROGRAMME
BUSINESS PLAN
• Vision, mission and business strategies• Strategic business priorities and issues
–
HUMAN RESOURCE PLAN
• HR strategy and workforce plan• Identifying competencies underpinning success• Gap between supply of and demand for human competencies
–
AA AWARENESS CREATION
• Obtaining top management commitment
–
AA AUDIT
Where the organisation is in relation to affirmative action• Assessment of workforce composition, attitudes and perceptions • Review of HR policies and procedures
–
AA STRATEGY FORMULATION
Where the organisation wants to be in terms of• formulating targets, objectives • communication strategy• policy statement • AA support person• AA advisory committee• specific roles and responsibilities of all employees• recruitment, selection, development, reward and culture change interventions
–
AA STRATEGY IMPLEMENTATION
• Sensitising workshops • Training and development
–
EVALUATION
Source: Adapted from Swanepoel et al (2000)
UUnniivveerrssiittyy ooff PPrreettoorriiaa eettdd –– CCooeettzzeeee,, MM ((22000055))

3.9
3.6.2 Selection criteria
Prior to the promulgation of the Labour Relations Act of 1995, job applicants had no or little recourse in
cases where they suspected that their lack of success in obtaining a particular position was the result of
unfair discrimination on the part of decisionmakers. Thus those to whom the selection of applicants had
been entrusted were basically not accountable for their decisions. In these circumstances the possibility
of undesirable practices such as nepotism, discrimination and victimisation is self-evident (Bendix, 2001).
To guard against discrimination in selection, it is necessary for organisations to carefully review the short-
listing, interviewing and assessment procedures of their organisations. These processes should not be
left to a single individual but rather allow a representative panel to make the decision.
Although employment equity targets play a major role in selection decisions, the appointment of qualified
applicants plays an equally important role. Although concerted efforts should be made to change the
demographics at work, especially at higher level jobs, organisations should not concentrate only on such
appointments. As mentioned previously, it is detrimental to the success of AA in general when
organisations display their “political correctness” by appointing AA candidates at all cost. Although AA
candidates should be given a slight advantage, other selection criteria which focus on suitability, should
also be used in a selection decision.
Selection criteria can be established only if the key performance areas and competencies required for the
position have been identified. Obviously the criteria should not in themselves be discriminatory. This
happens when criteria such as qualifications which are not truly necessary to ensure competence are
added as a means of excluding certain groups. Ward (2000) cautions against the use of criteria such as
prior work experience, membership in professional associations, criminal and service records, vocational
training and dependability in arriving at work regularly and on time. These criteria create barriers for black
job applicants and do not afford them an equal chance to demonstrate their competencies and abilities
(Ward, 2000). Once valid and fair criteria have been established and assessment techniques developed,
it is necessary to attach a weighting to each criterion. This is where AA candidates can be given an edge,
by adding membership of a previously disadvantaged group as a criterion and applying a special,
proportionate weighting to this. Should the demographics have proved that particular groups are less
represented in the organisation or job category, the weighting allocated to, say, black females could be
heavier than that assigned to white females. A study of the hiring practices in the electronics industry in
Los Angeles was conducted in 2002. The aim of the study was to determine whether hiring officials hired
or felt pressured to hire underqualified Africans instead of overqualified white males to comply with the
hiring goals of AA guidelines. Without exception, the hiring officials reported that they hired the most
qualified applicant for every position regardless of racial background (Ward, 2000). It would be interesting
to conduct a similar study in South Africa.
UUnniivveerrssiittyy ooff PPrreettoorriiaa eettdd –– CCooeettzzeeee,, MM ((22000055))

3.10
3.6.3 Human resource policy
According to Barrier (1999), organisations should ensure that all their hiring procedures and policies are
in line with the AA policy and employment equity plan. He suggests that organisations start with an
effective application form that both collects information and provides information to applicants. According
to Bland and Stalcup (1999), the instructions and disclaimers of application forms play a vital role in
discrimination lawsuits.
3.6.3.1 Instructions on application forms
When employers include a statement that any application containing unrequested information will be
automatically rejected, this will prevent applicants from claiming that they were rejected for unlawful
reasons. For example, applicants may state on an application form that they are union organisers, even
though the application does not request such information. If they are not hired, they might sue the
employer, claiming they were discriminated against because the employer knew that they were union
organisers. Inclusion of a statement that applications with extraneous information will automatically be
rejected provides employers with a legitimate, nondiscriminatory basis for rejecting such applicants. Bible
(1998), on the other hand, states that the law does not prohibit certain questions in applications and
anyone is therefore free to ask anything he or she wants to. According to him, the problem is not what is
asked, but what is answered and what use an employer makes of the information provided.
Although employers are not legally required to do so, they may want to include an equal opportunity
statement in the instructional section of the application. This informs the applicant that the employer is
adhering to the principles of equal employment opportunity and that the applicant’s signature on the
application form indicates the applicant’s acknowledgment of the policy.
3.6.3.2 Disclaimers on application forms
The final section of most application forms consists of certifications, disclaimers and other notices to
applicants. In this section, the applicant is often required to certify the accuracy of the information
provided. This certification should further warn applicants that false statements or omissions on the
application form could result in a refusal to hire or in a discharge if untruths are discovered after hiring.
3.6.4 Interviews
The interviews or other forms of assessment should be structured in terms of the criteria according to
which the candidate will be evaluated and should be the same for all persons being assessed. A study
examining the link between the hiring process and company image, identified 17 variables that resulted
in the interview being perceived as poor (Tarzian, 2002). Table 3.1 below lists the top five variables cited
for poor interviews.
UUnniivveerrssiittyy ooff PPrreettoorriiaa eettdd –– CCooeettzzeeee,, MM ((22000055))
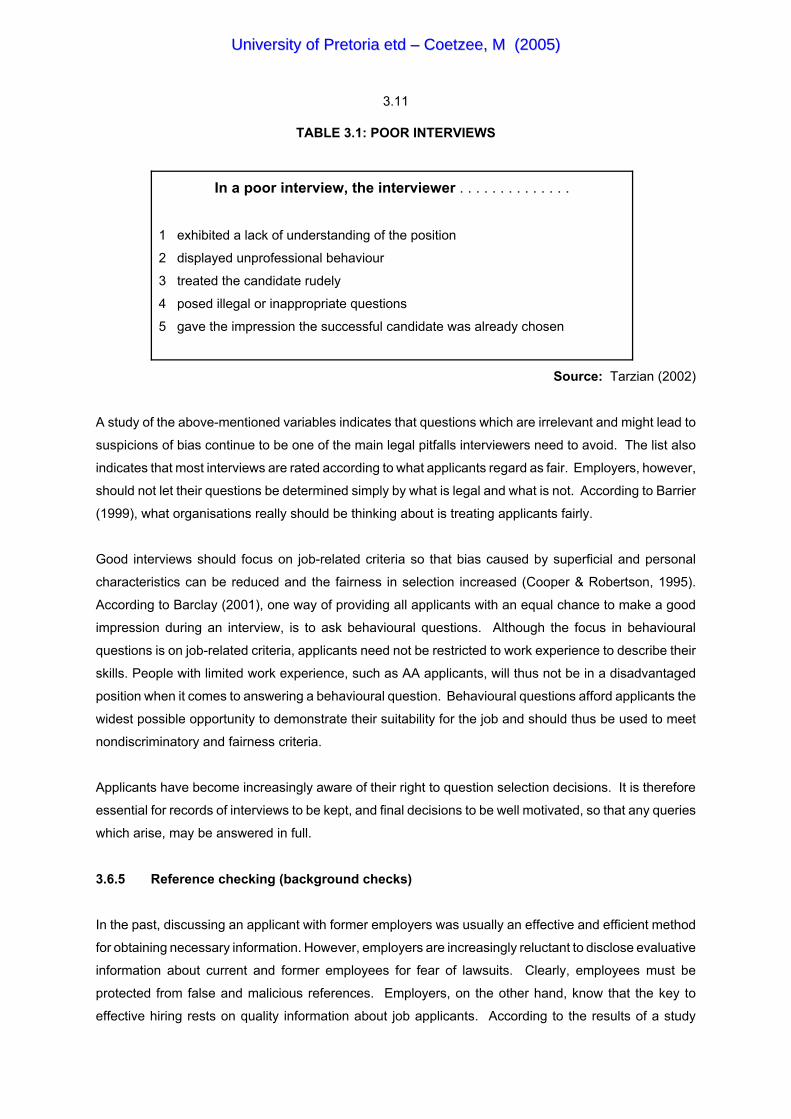
3.11
TABLE 3.1: POOR INTERVIEWS
In a poor interview, the interviewer . . . . . . . . . . . . . .
1 exhibited a lack of understanding of the position
2 displayed unprofessional behaviour
3 treated the candidate rudely
4 posed illegal or inappropriate questions
5 gave the impression the successful candidate was already chosen
Source: Tarzian (2002)
A study of the above-mentioned variables indicates that questions which are irrelevant and might lead to
suspicions of bias continue to be one of the main legal pitfalls interviewers need to avoid. The list also
indicates that most interviews are rated according to what applicants regard as fair. Employers, however,
should not let their questions be determined simply by what is legal and what is not. According to Barrier
(1999), what organisations really should be thinking about is treating applicants fairly.
Good interviews should focus on job-related criteria so that bias caused by superficial and personal
characteristics can be reduced and the fairness in selection increased (Cooper & Robertson, 1995).
According to Barclay (2001), one way of providing all applicants with an equal chance to make a good
impression during an interview, is to ask behavioural questions. Although the focus in behavioural
questions is on job-related criteria, applicants need not be restricted to work experience to describe their
skills. People with limited work experience, such as AA applicants, will thus not be in a disadvantaged
position when it comes to answering a behavioural question. Behavioural questions afford applicants the
widest possible opportunity to demonstrate their suitability for the job and should thus be used to meet
nondiscriminatory and fairness criteria.
Applicants have become increasingly aware of their right to question selection decisions. It is therefore
essential for records of interviews to be kept, and final decisions to be well motivated, so that any queries
which arise, may be answered in full.
3.6.5 Reference checking (background checks)
In the past, discussing an applicant with former employers was usually an effective and efficient method
for obtaining necessary information. However, employers are increasingly reluctant to disclose evaluative
information about current and former employees for fear of lawsuits. Clearly, employees must be
protected from false and malicious references. Employers, on the other hand, know that the key to
effective hiring rests on quality information about job applicants. According to the results of a study
UUnniivveerrssiittyy ooff PPrreettoorriiaa eettdd –– CCooeettzzeeee,, MM ((22000055))
3.12
conducted in a Chicago employment testing company, 41 percent of college graduates have made at least
one false statement in order to obtain a job (Barrier, 1999). It is interesting to note that the MBA degree
was the one qualification most frequently fabricated (Arnesen & Fleenor, 1998).
With regard to nondiscriminatory practices, background checking should be done consistently and
referents should be asked the same questions about all the applicants. According to Howie and Shapero
(2002), employers should not obtain arrest records when making a background check because this tends
to have a discriminatory effect on people from previously disadvantaged groups, and is furthermore
seldom related to the job that the applicant is seeking. Although employers have a difficult task deciding
which convictions are job related, it can be safely assumed that convictions for crimes of dishonesty are
nearly always job related.
Another reason why organisations need to conduct reference checks is to avoid being charged with
“negligent hiring”. Organisations should therefore be able to prove that they have engaged in their best
efforts to learn what they could about an applicant.
In order to avoid any lawsuits with regard to reference checking, organisations should have a policy on
reference checking in place. The policy should identify the people responsible for conducting it, the type
of questions to be asked or answered, and the people who may respond to a reference check (Barrier,
1999).
3.6.6 Human resource planning
Another factor that plays a prominent role in the appointment of people is the organisation's human
resource manpower plan. This plan is the starting point of the implementation of the equity plan and it
therefore needs to be consulted with each appointment. Whenever a position is vacant the equity plan
is consulted and the workforce profile in that job category studied, in conjunction with the workforce profile
of the organisation as a whole. It may then be decided to advertise that preference will be given to a
person from a previously disadvantaged group for appointment to this position or even to head-hunt such
person. However, the inherent requirements of the job remain central to the selection procedure and
capable candidates cannot be excluded simply because they are not from a designated group.
3.6.7 Pre-employment testing
As mentioned earlier, any form of assessment should be structured and job related. Medical testing is
permissible only in certain conditions. According to the Act, it will be allowed only if permitted or required
by law, if justifiable in the light of medical facts, employment conditions, social policy, the fair distribution
of employee benefits or the inherent requirements of the job. An issue that has been under the spotlight
is the HIV status of applicants. Employers may not use an applicant’s HIV status as a selection criterion.
According to a report in the Mail and Guardian (Johannesburg) of 17 April 2002, 30 percent of South
UUnniivveerrssiittyy ooff PPrreettoorriiaa eettdd –– CCooeettzzeeee,, MM ((22000055))

3.13
Africa’s workforce will be HIV positive in 2005. If employers had to appoint applicants according to their
HIV status, the applicant pool would shrink by 30 percent and aggravate the situation with regard to the
shortage of skills experienced.
According to the Employment Equity Act, as quoted by Tinarelli (2000), psychological testing and other
similar assessments are prohibited unless they have been scientifically shown to be valid and reliable, can
be applied fairly to all employees and are not biased against any person or group. The purpose of this
provision is to ensure that tests are reliable, valid, free of cultural bias, do not rely for success on a
privileged educational or social background and that the language used is understood by all test subjects.
According to the results of research done on applicants’ attitudes and reactions to different selection tests,
applicants were more in favour of tests with business-related content (job sample tests) than with paper-
and-pencil tests. Personality, honesty and drug tests were the least popular (Schmitt & Chan,1999). The
law does not specify the type of tests to be administered but only the requirements they should meet.
However, from a justice point of view, the applicants' perceptions of the fairness of employment tests
should be taken into consideration because this may influence their commitment once appointed.
3.6.8 Harassment
Harassment is defined as any special attention to or treatment of an individual on the grounds of his or
her physical attributes. Essentially, harassment is any form of behaviour whether verbal, physical or by
gesture to which a person on reasonable grounds, might object. The most common form of harassment
in organisations is of a sexual nature but the differential treatment of employees based on their ethnicity,
gender or age is also a common problem.
According to the Employment Equity Act, employers who are made aware of a transgression of any
provision of the Act and fail to act upon it, will be deemed to have committed that transgression. It is
therefore essential to develop a harassment policy and procedure to ensure that all complaints raised in
this regard are effectively and fairly handled.
3.6.9 Induction/orientation
All newly appointed employees, and not only AA appointees, should be properly integrated by way of an
induction programme. However, in the case of AA employees, there may be circumstances which dictate
that their integration be monitored. Although these appointees should not be treated differently, an attempt
should be made to remove any unnecessary obstacles to their integration.
UUnniivveerrssiittyy ooff PPrreettoorriiaa eettdd –– CCooeettzzeeee,, MM ((22000055))

3.14
3.6.10 Career planning and development
One facet of human resource planning is succession planning and career development. If properly
performed, it offers an ideal route for developing previously disadvantaged persons from both inside and
outside the organisation to fill more important positions in the future. The significance of developing the
skills, competencies and potential of employees is emphasised by the initiatives in terms of the Skills
Development Act 97 of 1998. Education and training are the only guarantee of the success of AA
initiatives and of increased economic prosperity. South Africa cannot function without effective human
resources, and continue to draw such resources from a limited pool of educated and trained employees.
According to the World Competitiveness Yearbook 2002, South Africa is rated 39th out of 49 countries in
terms of the effective use of human resources. This is understandable if one considers the fact that
companies used to spend one percent or less of their income on training.
3.6.11 Communication
The new Labour Relations Act determines that AA should be subject to joint decision making by
management and the workplace forum. An AA strategy is a change strategy and, as such, should be
developed like any other change policy - that is, in collaboration with all stakeholders in the organisation.
This may prove to be a slow process, since different groupings will strive to protect their own interests,
which may be in conflict with AA objectives. Thus extensive information and a sharing of values and
perceptions is necessary at this stage. As indicated in table 3.2, Bendix (2001) identified a number of
principles on which all stakeholders should reach agreement.
TABLE 3.2: AFFIRMATIVE ACTION PRINCIPLES TO BE AGREED UPON
• Their understanding of AA
• The AA objectives to be adopted by the organisation
• Broad time frames for the achievement of objectives
• The manner in which candidates are to be canvassed and selected
• The development of employees
• The integration of appointees into the organisation
• Monitoring and performance appraisal systems applicable to all employees
• Support systems for employees who underperform
• The possibility that some candidates may have to be dismissed, and the
procedures to be adopted in such cases
• Sensitisation of other employees to AA initiatives
Source: Adapted from Bendix (2001)
UUnniivveerrssiittyy ooff PPrreettoorriiaa eettdd –– CCooeettzzeeee,, MM ((22000055))

3.15
Once a policy and a strategy have been agreed upon, they should be shared with every employee in the
organisation. Affirmative action initiatives which are implemented without proper consultation cause
distrust and fear, leading either to disregard of the initiative or, at worst, to constant sabotage. Existing
employees need to be given all the relevant information and to receive the necessary assurances about
their own job security. Numerous workshops, sensitisation sessions and interactions may be necessary
at this stage.
Charlton and Van Niekerk (1994) regard the following as the most important information to be conveyed
to existing employees:
• the AA policy statement, its strategy and its rationale
• policies, procedures, roles and responsibilities, evaluation and reward criteria
• what training will take place
• when AA objectives will be expected to be achieved
• educating people concerning the why, what and how of AA
3.6.12 Treatment in the workplace
Thus far the impact of AA has been viewed from a legal perspective. However, this may be one of the
reasons why it has not been that successful in South Africa. Organisations ensure that they comply with
employment equity legislation but often neglect to heed the “soft issues” of AA - the way AA employees
are treated in the workplace. No legislation can regulate the humanity of a work relationship.
Despite employers’ attempts to comply with employment equity requirements, it often happens that
supervisors and line management undermine the success of employment equity initiatives through their
prejudicial treatment of AA employees. In a subtle way, supervisors can treat subordinates unfairly by
giving them jobs that
! are insignificant or too difficult
! do not allow them to use a variety of skills and competencies
! deny them the opportunity to use their initiative, discretion or judgment
! do not provide them with feedback on their performance
! do not allow them to determine their own work pace and work methods
! do not provide them with responsibility or accountability
The “work for me” instead of “work with me” approach is thus applied. If organisations wish to make a
success of AA, they have to take a closer look at the way AA employees are treated in the workplace.
One way of showing respect and appreciation is by involving employees and keeping them informed about
changes and issues that concern them.
UUnniivveerrssiittyy ooff PPrreettoorriiaa eettdd –– CCooeettzzeeee,, MM ((22000055))
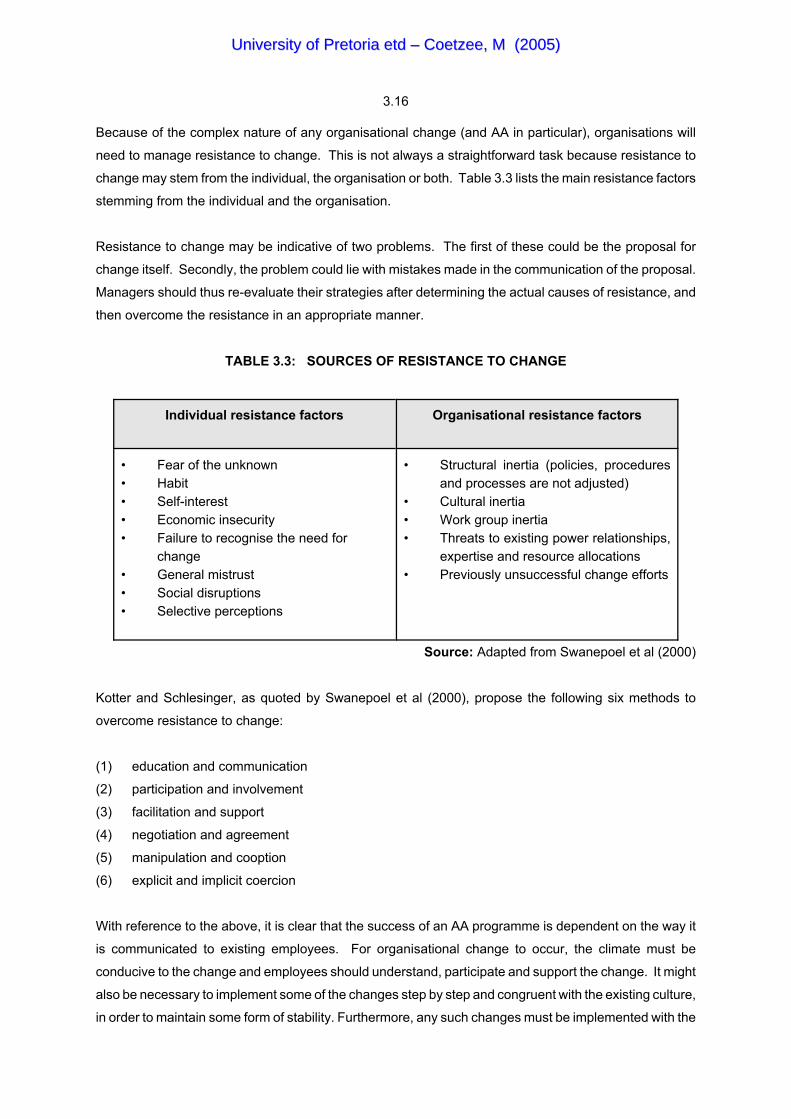
3.16
Because of the complex nature of any organisational change (and AA in particular), organisations will
need to manage resistance to change. This is not always a straightforward task because resistance to
change may stem from the individual, the organisation or both. Table 3.3 lists the main resistance factors
stemming from the individual and the organisation.
Resistance to change may be indicative of two problems. The first of these could be the proposal for
change itself. Secondly, the problem could lie with mistakes made in the communication of the proposal.
Managers should thus re-evaluate their strategies after determining the actual causes of resistance, and
then overcome the resistance in an appropriate manner.
TABLE 3.3: SOURCES OF RESISTANCE TO CHANGE
Individual resistance factors Organisational resistance factors
• Fear of the unknown• Habit• Self-interest• Economic insecurity• Failure to recognise the need for
change• General mistrust• Social disruptions• Selective perceptions
• Structural inertia (policies, proceduresand processes are not adjusted)
• Cultural inertia• Work group inertia• Threats to existing power relationships,
expertise and resource allocations• Previously unsuccessful change efforts
Source: Adapted from Swanepoel et al (2000)
Kotter and Schlesinger, as quoted by Swanepoel et al (2000), propose the following six methods to
overcome resistance to change:
(1) education and communication
(2) participation and involvement
(3) facilitation and support
(4) negotiation and agreement
(5) manipulation and cooption
(6) explicit and implicit coercion
With reference to the above, it is clear that the success of an AA programme is dependent on the way it
is communicated to existing employees. For organisational change to occur, the climate must be
conducive to the change and employees should understand, participate and support the change. It might
also be necessary to implement some of the changes step by step and congruent with the existing culture,
in order to maintain some form of stability. Furthermore, any such changes must be implemented with the
UUnniivveerrssiittyy ooff PPrreettoorriiaa eettdd –– CCooeettzzeeee,, MM ((22000055))
3.17
utmost care and sensitivity. Managers need to balance the opposite ends of the continuum concerned
with how to implement change and yet not demoralise their loyal workforce (stability). Only after an
organisation has the assurance of general understanding and acceptance should it go ahead and develop
its equity plan.
3.7 SUMMARY
Although South Africa’s economy can be regarded as rich and robust, the distribution of wealth is poor.
South Africa has a huge problem in the distribution of jobs and income among its ethnic/racial groups.
Recognising the dismal state of the distribution of employment and income, the government has, by
means of legislation, attempted to redress inequalities of the past. The two primary pieces of legislation
governing the promotion of social justice and eradicating inequalities are the Employment Equity Act 55
of 1998 and the Promotion of Equality and the Prevention of Unfair Discrimination Act 4 of 2000. Although
both these Acts address unfair discrimination and AA issues, the latter has a wider scope by covering
social institutions other than employers and placing a duty on all people to promote equality.
If organisations are to reap the fruits of such longer-term spin-offs, AA will have to become an integral part
of everyday human resource management practices in organisations. This will require the adaptation of
virtually all human resource management practice areas to accommodate the AA challenge. Not only
should employers eliminate all forms of unfair discrimination, but also implement AA measures to achieve
employment equity targets. Human resource practitioners should therefore review all HR policies,
procedures and practices to ensure that they do not contain or involve any form of unfair discrimination
or unjustifiable differentiation. However, complying with legislation is not the only issue employers need
to focus on. They also need to be concerned about the spirit of the law within which they operate.
Treating employees fairly will thus also have to be considered when reviewing policies, procedures and
practices.
This chapter focused on the implications of AA on HR policies, procedures and processes — hence the
discussion of the Employment Equity Act and the Promotion of Equality and the Prevention of Unfair
Discrimination Act. The steps in the development and implementation of an AA programme were briefly
outlined. Achieving the goals of employment equity does not depend only on whether AA programmes
comply with legal requirements but also on whether they meet fairness requirements.
The next chapter focuses on fairness from an organisational justice perspective, following which, theories
from the organisational justice literature will be extended to the AA domain with a view to advancing the
understanding of AA fairness.
UUnniivveerrssiittyy ooff PPrreettoorriiaa eettdd –– CCooeettzzeeee,, MM ((22000055))

4.1
Chapter 4
ORGANISATIONAL JUSTICE
4.1 INTRODUCTION
There is a compelling need for innovative approaches to the solution of many problems involving human
relationships in today’s work environment. Although the technical competence of employees is essential,
it is not a sufficient condition for success. Human resource managers must also attend to the personal
needs and concerns of the people they are managing. Managers are increasingly recognising the
importance of human social interaction as a basic requirement for the effective functioning of
organisations. People are social beings and organisations therefore have to create settings in which
employees are able to interact socially. One concept which is fundamental to human social interaction
is justice. Whether it is a promotion decision, the assignment of tasks, the allocations of rewards or just
about any other type of social exchange, matters of fairness are bound to arise. Employees’ perceptions
of fairness in organisational settings, also known as organisational justice, influence their attitudes and
behaviour and consequently their performance and the organisation’s success. That is why research on
organisational justice is so vital.
In view of the widespread recognition of the importance of fairness as an issue in organisations, it is now
necessary to apply theories of social and interpersonal justice to understanding behaviour in organisations.
The earliest theories of social justice were mainly derived to test principles of justice in general social
interaction, not organisations in particular. In recent years many human resource interventions have been
re-examined in light of organisational justice such as performance evaluation (Greenberg, 1987; Folger,
1984; Cropanzano, 1993), drug testing (Cropanzano, 1993) and pay satisfaction (Folger & Konovsky,
1989). Researching the fairness of human resource interventions does not, however, indicate how the
organisation is influenced — hence the need to consider how these varieties of justice relate to various
organisational variables such as trust in management, job satisfaction, supervisor/subordinate
relationships and employee commitment. In South Africa, which is renowned for its low productivity, it will
be worthwhile to determine how the perceived fairness of AA influences employees’ commitment and
ultimately productivity. The relationship between employees’ perceptions of AA fairness and their
commitment will therefore be discussed in chapter 5.
This chapter provides an overview of the meaning, scope and nature of organisational justice. The
components of organisational justice are discussed in order to explain how employees judge the fairness
of AA decisions, policies and procedures.
UUnniivveerrssiittyy ooff PPrreettoorriiaa eettdd –– CCooeettzzeeee,, MM ((22000055))
4.2
4.2 ORGANISATIONAL JUSTICE
Fairness is of central interest to modern managers concerned about providing equal employment
opportunities, fair labour practices and paying a fair day’s pay for a fair day’s work. Just as referees
should ensure that all participants have a fair chance to compete, managers are responsible for the fair
treatment of employees. The differing perspectives, interests and goals of managers and subordinates,
however, makes it difficult to determine what exactly employees regard as fair treatment. The
multidimensionality of fairness is evident when one considers how people disagree about the definition
of fairness. The different answers to questions about fairness depend on whether the focus is on
outcomes, procedures or motives. A further complicating element is the possible interaction of a concern
for justice with other motives in social situations (eg self-esteem, interpersonal attraction) (Folger, 1984).
An attempt to describe and explain the role of fairness in the workplace is known as organisational justice.
Organisational justice refers to the decisions organisations make, the procedures they use in making
decisions and the interpersonal treatment employees receive.
The research on organisational justice, dating back to the 1960s, was originally conducted to test
propositions about the distribution of payment and other work-related rewards. Since then concerns about
fairness have been expressed in such organisational domains as conflict resolution, personnel selection,
labour disputes and wage negotiation, to mentioned but a few. This resulted in the emergence of a variety
of different approaches to justice. In order to clarify conceptual interrelationships, track trends in
organisational research and identify needed areas of research and conceptual development, Greenberg
(1996) categorised various conceptualisations of organisational justice around a taxonomy. This
taxonomy was derived by combining two conceptually independent dimensions: a reactive-proactive
dimension and a process-content dimension.
(1) Reactive-proactive dimension. A reactive theory of justice focuses on people’s attempts either to
escape from or avoid perceived unfair states. By contrast, proactive theories focus on behaviours
designed to promote justice.
(2) Process-content dimension. A process approach to justice focuses on the way in which various
outcomes are determined. Such orientations concentrate on the fairness of the methods and
procedures used to make and implement organisational decisions. In contrast, content
approaches are concerned with the fairness of the resulting decision or outcome.
By combining the two dimensions in various ways, Greenberg developed a taxonomy of four theories.
Table 4.1 summarises the research questions related to each type of theory.
UUnniivveerrssiittyy ooff PPrreettoorriiaa eettdd –– CCooeettzzeeee,, MM ((22000055))

4.3
TABLE 4.1
RESEARCH QUESTIONS RELATED TO ORGANISATIONAL JUSTICE THEORIES
TYPE OF THEORY RESEARCH QUESTION
Reactive content
Proactive content
Reactive process
Proactive process
How do workers react to inequitable payments?
How do workers attempt to create fair payments?
How do workers react to unfair policies or procedures?
How do workers attempt to create fair policies or procedures?
Source: Greenberg (1996)
4.2.1 Reactive content theories
Reactive content theories focus on how individuals respond to unfair decisions. These theories state
explicitly that people will respond to unfair relationships by displaying certain negative emotions such as
resentment, anger, dissatisfaction, disappointment and unhappiness (Folger, 1984). In an attempt to
redress the experienced inequity, employees will seek restitution, engage in retaliatory behaviour or
restore psychological equity by justifying the injustice or leaving the organisation.
4.2.2 Proactive content theoriesIn contrast to reactive content theories, which focus on how people respond to unfair decisions, proactive
content theories focus on how people attempt to create fair decisions. According to Leventhal’s justice
judgment model, individuals attempt to make fair allocation decisions by applying several possible
allocation rules to the situations they confront (Leventhal, 1980). For example, in situations where
harmony between groups members is important, a supervisor will probably allocate rewards by following
the equality norm, that is, dividing rewards equally. Lerner’s (1982) justice motive theory recognises that
justice is the pre-eminent concern of human beings, and concurs that people allocate rewards according
to circumstances. According to him, people make use of four principles when making allocation decisions,
namely (1) competition — allocations based on the outcome of performance; (2) parity — equal
allocations; (3) equity - allocations based on contributions; and (4) Marxian justice — allocations based
on needs.
4.2.3 Reactive process theoriesThese theories focus on how people react to unfair procedures, policies and processes used in making
a decision. According to Thibaut and Walker (1978), the amount of control people have over decisions
and processes influences their perceptions of fairness. Two types of control exist. Process control refers
to the degree of control people have over the procedures or information used to make a decision.
Decision control refers to the degree of control people have over directly determining the outcomes.
Research has found that procedures offering process control are perceived to be fairer and enhance the
acceptance of even unfavourable decisions (Greenberg, 1987).
UUnniivveerrssiittyy ooff PPrreettoorriiaa eettdd –– CCooeettzzeeee,, MM ((22000055))
4.4
4.2.4 Proactive process theoriesThe proactive theories focus on allocation procedures and seek to determine what procedures people will
use to achieve justice. The allocation preference theory proposes that people hold expectancies that
certain procedures will be differentially instrumental in meeting their goals. For procedures to be regarded
as instrumental in attaining justice, they need to meet the following requirements:
! Allow opportunities to select the decision maker.
! Follow consistent rules.
! Make use of accurate information.
! Identify the structure of decision-making power.
! Employ safeguards against bias.
! Allow for appeals to be heard.
! Provide opportunities for correcting procedures.
! Meet moral and ethical standards.
Trends in organisational justice research indicate that interest in reactive and content theories has waned.
This means that two shifts have occurred — a shift from reactive to proactive theories and a shift from
content to process theories. In the next section the meaning of the concepts “content” and “process”, and
the way employees use them as a basis for judging fairness, will be discussed.
Judgments about fairness are made by means of a fairly simple, straightforward process. According to
Sheppard, Lewicki and Minton (1992), judging the justice of a decision, action or procedure requires
evaluating it against two principles, namely balance and correctness.
(1) Balance. The first principle of justice requires a judgment of balance. Comparisons of balance
are made when a person compares the reward he or she receives with that received by someone
else, while comparing the value of their inputs. Greenberg (1987) refers to this form of justice as
distributive justice.
(2) Correctness. Correctness is the second principle of justice. Correctness refers to the “rightness”
of the decision and encompasses elements of consistency, accuracy, clarity, and procedural
thoroughness (Sheppard et al, 1992). As long as procedures are clear and consistently applied,
employees will perceive them to be fair. Folger and Greenberg (1985) refer to this form of justice
as procedural justice.
The perceived justice of some decision or action is thus made by deciding whether the decision or action
appears to be distributively and procedurally fair.
Related to the concepts of balance and correctness, theorists have distinguished between
conceptualisations of justice that focus on content — the fairness of the outcome or decision (distributive
UUnniivveerrssiittyy ooff PPrreettoorriiaa eettdd –– CCooeettzzeeee,, MM ((22000055))
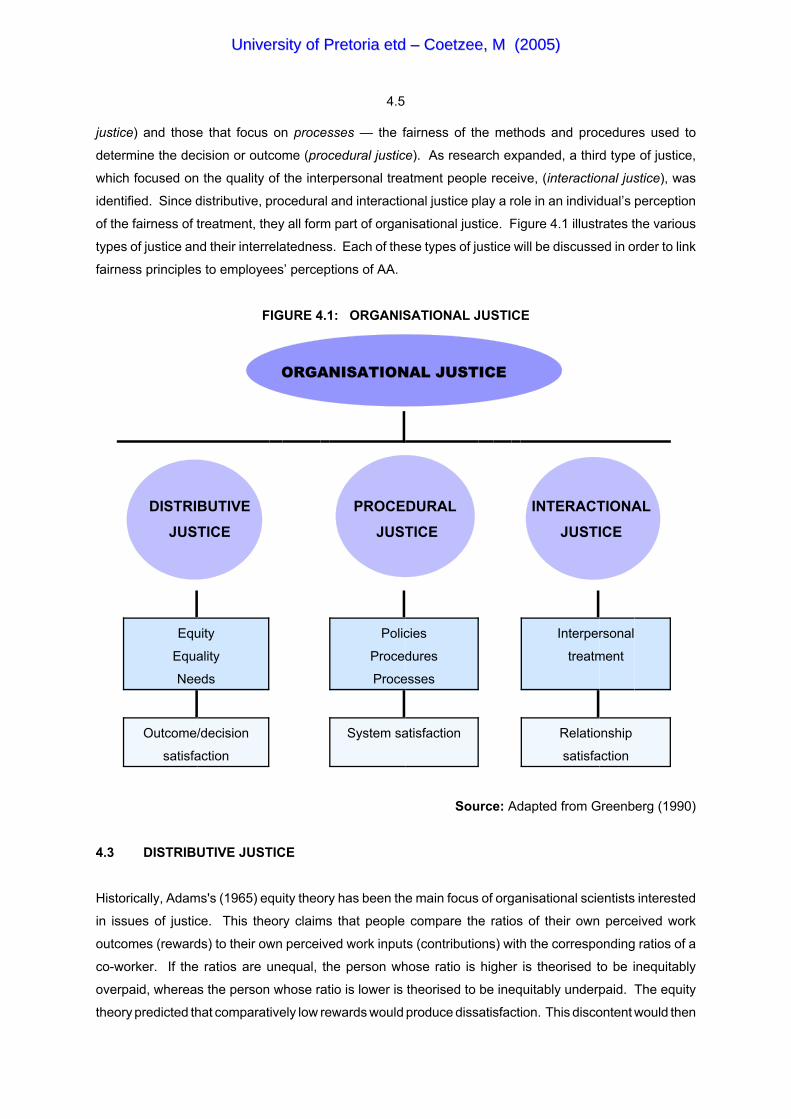
4.5
justice) and those that focus on processes — the fairness of the methods and procedures used to
determine the decision or outcome (procedural justice). As research expanded, a third type of justice,
which focused on the quality of the interpersonal treatment people receive, (interactional justice), was
identified. Since distributive, procedural and interactional justice play a role in an individual’s perception
of the fairness of treatment, they all form part of organisational justice. Figure 4.1 illustrates the various
types of justice and their interrelatedness. Each of these types of justice will be discussed in order to link
fairness principles to employees’ perceptions of AA.
FIGURE 4.1: ORGANISATIONAL JUSTICE
ORGANISATIONAL JUSTICE
DISTRIBUTIVE
JUSTICE
PROCEDURAL
JUSTICE
INTERACTIONAL
JUSTICE
Equity
Equality
Needs
Policies
Procedures
Processes
Interpersonal
treatment
Outcome/decision
satisfaction
System satisfaction Relationship
satisfaction
Source: Adapted from Greenberg (1990)
4.3 DISTRIBUTIVE JUSTICE
Historically, Adams's (1965) equity theory has been the main focus of organisational scientists interested
in issues of justice. This theory claims that people compare the ratios of their own perceived work
outcomes (rewards) to their own perceived work inputs (contributions) with the corresponding ratios of a
co-worker. If the ratios are unequal, the person whose ratio is higher is theorised to be inequitably
overpaid, whereas the person whose ratio is lower is theorised to be inequitably underpaid. The equity
theory predicted that comparatively low rewards would produce dissatisfaction. This discontent would then
UUnniivveerrssiittyy ooff PPrreettoorriiaa eettdd –– CCooeettzzeeee,, MM ((22000055))
4.6
motivate individuals to take action that reduces the discrepancy between their ratio and that of their
coworker. According to Adams (1965), an over-reward situation will result in a person experiencing guilt,
shame or remorse. These emotions are also negative and should therefore motivate the individual to
reduce the imbalance (Cropanzano, 1993). Various studies have been conducted to determine how
employees behave when they perceive an injustice. With enabling legislation such as the Employment
Equity Act 55 of 1998 and the Promotion of Equality and the Prevention of Unfair Discrimination Act 4 of
2000, managers should pay close attention to justice violations in the workplace since these may give rise
to employees’ lawsuits which, if successful, could bring about various remedies. Injustices, however, can
also generate negative consequences that are less direct. Various studies have examined the influence
of fair treatment of employees on organisational variables such as job satisfaction (Bateman & Organ,
1983), trust in and loyalty to the leader (Deluga, 1994), organisational citizenship behaviour (Morrison,
1994) and employee theft (Greenberg, 1990). The fair and equal treatment of employees will increase
job satisfaction, improve relationships between supervisors and employees, encourage organisational
citizenship behaviour and reduce cases of employee theft, thus also benefiting the organisation.
According to Leventhal (1976), people use three major justice rules to determine outcome justice: the
contributions rule (equity rule), the needs rule, and the equality rule. The purpose of outcomes or
decisions based on the equity rule is to achieve productivity and a high level of performance. The equality
rule is used when the goal is to preserve social harmony, while the needs rule is applied when the
objective is to foster personal welfare. As far as AA is concerned, decisions are often made by applying
the equality rule.
One source of frustration with the equity theory in explaining organisational justice was its lack of
specificity regarding the reactions that would occur when inequity was experienced. Organisational
scientists thus began to raise questions about justice in various organisational settings, something which
was not adequately addressed by prevailing theories of justice. Specifically, questions on how pay plans
were administered and what grievance resolution practices were followed in organisations, prompted
concerns about fairness that were more process oriented. The focus thus shifted to how decisions were
made as opposed to what those decisions were.
4.4 PROCEDURAL JUSTICE
Outcomes or decisions (distributive justice) are not the only relevant issue to an individual — the way one
is treated is equally important. According to Skarlicki and Latham (1996), as quoted by Ivancevich and
Matteson (2002), procedural justice refers to the extent to which fair procedures and processes are in
place and adhered to and to which individuals see their leaders as being fair and sincere and logical or
rational in what they do. Folger and Cropanzano (1998:26) define procedural justice as the “fairness
issues concerning the methods, mechanisms, and processes used to determine outcomes”.
UUnniivveerrssiittyy ooff PPrreettoorriiaa eettdd –– CCooeettzzeeee,, MM ((22000055))
4.7
In 1975, Thibaut and Walker conducted research into employees’ reactions to the dispute resolution
process. This led to the development of their theory of procedural justice. According to these authors,
employees judge the fairness of procedures according to two types of control: the amount of control they
have over the procedures used to make a decision (referred to as process control) and the amount of
control they have over influencing the decision (referred to as decision control). People want procedures
that allow them to feel that they have participated in developing a decision that will affect them. Being able
to voice their opinions thus affords them the opportunity to influence others’ decisions. Further research
revealed that procedures that provided employees with opportunities to influence a decision were
perceived as fairer than procedures that denied process control.
Related to the study on control over processes and decisions, Lind and Tyler (1988) developed the self-
interest and the group-value models of procedural justice. The self-interest model suggests that people
seek decision control because they are concerned with maximising their own outcomes. However, when
individuals have to cooperate with others in groups to achieve outcomes, the group-value model comes
into play, and the focus shifts from decision control to process control. Procedures are then regarded as
more important in attaining fair or favourable outcomes. The group-value model explains the value-
expressive effects of process control. Group identity and group procedures are two elements that govern
the functioning of groups. People consider procedures that allow them to express their opinions (voice)
to be fair, for they can participate in group processes as valuable group members. Even if “voice” does
not produce a favourable outcome, it enhances perceived procedural justice because its value-expressive
function confirms the values of group participation and group membership status.
In further research, Tyler and Lind (1992) developed a relational model of authority in groups. According
to the authors three relational concerns with the authority affect procedural justice judgments: trust,
neutrality and standing. Trustworthiness can be measured by rating the manager’s fairness and ethicality.
If the manager behaves fairly and considers the needs and views of the individual, then he can be trusted.
Trust involves beliefs about the manager’s intentions. Neutrality can be judged in terms of the person’s
unbiased decision making in the use of facts. Standing refers to status recognition that is indicated to
people by a manager who treats them with dignity, politeness and respect for their rights. By looking at
the procedures a manager uses, individuals can judge whether they will be treated fairly with regard to the
manager’s relational concerns of trust, neutrality and standing.
Related to Thibaut and Walker’s research on the importance of process and decision control for fairness
perceptions, Leventhal, Karuza and Fry (1980) identified seven components of procedures that lead to
justice attainment:
(1) the selection of decision makers
(2) setting ground rules (criteria) for evaluating rewards
(3) methods for collecting information
(4) procedures for defining the decision process
UUnniivveerrssiittyy ooff PPrreettoorriiaa eettdd –– CCooeettzzeeee,, MM ((22000055))

4.8
(5) safeguards against abuse of power
(6) procedures for appeals
(7) the availability of change mechanisms (to change a unfair decision)
According to these authors, the fairness of procedures is evaluated by applying six justice rules.
Procedures are regarded as fair to the extent that they
(1) suppress bias
(2) create consistent allocations
(3) rely on accurate information
(4) are correctable
(5) represent the concerns of all recipients
(6) are based on moral and ethical standards
Thus far, the discussion has focused on the attributes of a fair procedure. Very little has been said about
the positive impact procedural justice has on employees’ behaviour. According to Skarlicki and Foyger
(1997) as quoted by Ivancevich and Matteson (2002), the positive consequences of procedural justice
include
! organisational commitment
! intent to stay with the organisation
! organisational citizenship
! trust in supervisor
! satisfaction with decisions made
! work effort
! performance
As indicated by the above list, employee commitment is a direct consequence of fair treatment — hence
the discussion of the impact of procedural justice and perceptions of the fairness of AA on employees’
commitment in chapter 5.
As research has extended the original conceptualisations of procedural justice, it has become clear that
perceptions of procedural justice are influenced by factors that go beyond the formal procedures used to
resolve disputes or allocate rewards. In particular, it has been demonstrated that judgments of procedural
justice are influenced by two important factors: the interpersonal treatment people receive from decision
makers and the adequacy with which formal decision making procedures are explained (Bies & Moag,
1986). These justice appraisals based on the quality of interpersonal treatment are known as interactional
justice.
UUnniivveerrssiittyy ooff PPrreettoorriiaa eettdd –– CCooeettzzeeee,, MM ((22000055))

4.9
4.5 INTERACTIONAL JUSTICE
Theorists on organisational behaviour have not yet reached consensus on whether interactional justice
forms part of procedural justice or whether it should be regarded as a third type of justice. Bies and Moag
(1986) state that interactional justice denotes individuals’ concerns about the quality of the interpersonal
treatment they receive during the enactment of organisational procedures. Folger and Cropanzano (1998)
consider a decision-making process to consist of both the formal structural component represented by
Leventhal’s six justice rules, and the informal interactions between the decision makers and the recipients
that represent interactional justice. They therefore believe that interactional justice should form part of
procedural justice. Bies and Moag (1986), however, maintain that interactional justice can be
distinguished from procedural justice because procedures refer to the structural quality of the decision
process, whereas interactional justice refers to a social exchange between two participants. Nevertheless,
for the purposes of this study, interactional justice will be regarded as a third type of justice.
Bies and Moag (1986:44) identified the term "interactional justice" which refers to people’s sensitivity to
“the quality of interpersonal treatment they receive during the enactment of organisational procedures” and
pinpointed the following four attributes of interpersonally fair procedures:
(1) truthfulness
(2) respect
(3) propriety of questions
(4) justification
The first three attributes deal with the nature of the communication while it is occurring. The last one
(justification) has to do with removing any discontent following an unfair procedure. Each of these
attributes will now be briefly discussed.
(1) Truthfulness. Truthfulness consists of two components: deception and candidness. Employees
do not like being deceived and expect to be treated in a forthright manner. Organisations should
therefore provide them with realistic and accurate information.
(2) Respect. Individuals expect to be treated politely and respectfully. This means that insults or
discourteous behaviour should be avoided at all cost.
(3) Propriety of questions. The propriety of questions refers to two components. Firstly, questions
should not be considered improper by their very nature, and secondly, they should not involve
prejudicial statements.
(4) Justification. Justification comes into play following negative outcomes or unfair treatment. It may
be possible to rectify an injustice with an adequate justification. According to Bies and Shapiro
UUnniivveerrssiittyy ooff PPrreettoorriiaa eettdd –– CCooeettzzeeee,, MM ((22000055))

4.10
(1988), a sense of anger over injustice can be reduced or eliminated by providing the unfairly
treated individual with a social account such as an explanation or apology. People expect events
that affect them to be explained. If they do not receive an explanation, they doubt whether they
have been treated in accordance with a socially rooted expectation for fair processes in human
interaction (Weaver, 2001). Respect and concern constitute informal social goods, and failing to
receive them is seen as a violation of justice expectations.
Although some researchers have stopped separating procedural and interactional justice, the general
perspective is that organisations should see justice in a broader social context. Both formal procedures
and the social side of organisational justice are important in predicting work outcomes and understanding
organisational behaviour.
4.6 EMPLOYEES’ BEHAVIOUR IN RESPONSE TO INJUSTICE
The experience of injustice is hurtful to individuals and harmful to organisations. Few benefit from
unfairness, although many are harmed. In the face of this, organisations should reduce injustice by
studying employees’ responses to injustices and prepare written guidelines, procedures and policies to
make decisions and engender fairness. This section discusses employees’ behaviour when they
experience injustice and provides guidelines on what organisations can do to improve the perceived
fairness of practices.
Several years ago, Felstiner, Abel and Sarat, as quoted by Sheppard et al (1992) described the sequence
of activities followed by people when they perceive an injustice as the “naming and blaming” process.
4.6.1 NamingNaming refers to the initial identification of a fair or unfair outcome, procedure or system. Suffice to say
that if something has not been identified as unfair, then no action will be taken, even if extreme injustice
exists. Employees deem an action, procedure or system to be unfair only if their attention is drawn to it.
One means of perpetrating an injustice with impunity therefore is either to hide it or direct employees’
attention away from it. For example, organisations may maintain strict secrecy about certain matters in
order to protect policies from public scrutiny that might stimulate accusations of perceived injustice
regarding such things as pay systems, budget allocations or AA appointments.
The degree of perceived injustice is of vital importance in determining how someone will respond to the
injustice. Perceived injustice is often determined by assessing the degree of perceived discrepancy from
the rule being applied. According to Folger (1984), the degree of perceived injustice is at least partially
determined by our ability to envision alternatives to the unjust condition. If no alternatives exist,
employees will more readily accept the unjust condition. One way of limiting employees’ sense of injustice
would therefore include keeping them ignorant of alternatives. Many action groups in organisations have
built their “businesses” around their ability to help others identify and label perceived injustices such as
UUnniivveerrssiittyy ooff PPrreettoorriiaa eettdd –– CCooeettzzeeee,, MM ((22000055))
4.11
discrimination, abuse, exploitation or unfair treatment. Once identified, these groups also help to transform
the perceived injustice into a grievance, by clearly attributing blame.
4.6.2 BlamingAlthough people try to resolve problems without knowing their cause, they usually attempt to determine
what or who is to blame for the injustice, so that they can focus their effort on the agent of the problem.
The process of allocating blame progresses from determining cause to determining responsibility to
determining blame. Without knowing who or what caused injustice, people cannot decide blame.
Injustices can be attributed to any one of three distinct entities: the person, procedure or system. An
outcome may be considered unfair because an unfair decision was made. Similarly, the procedure
determining the outcome or the system may have been unfair. In real life, it is often not clear which
component is truly responsible for the injustice. According to Crosby (1984), people initially tend not to
blame systems, and are unlikely to blame systems for two reasons: individuals do not have sufficient
information to question that system and most individuals do not wish to question the system.
A second complication of attributing blame concerns the data people use to form a judgment. The primary
problem is to determine whether individuals or their environment are most to blame. In the context of
judgments about injustices, established criteria exist for evaluating the fairness of a procedure and a
system. First, information about the individual (intelligence, rationality and consistency) is used to make
judgments about the probability that the individual’s environment is to blame. Second, information about
the environment is used to determine whether the individual is to blame. When an injustice occurs and
the procedures and system seem to be fair, logic suggests that the actor who produced the injustice is to
blame.
Another complicating factor in attributing blame is that people have extremely strong, prior beliefs about
the likely sources of injustice. These prior beliefs vary as a function of social class, cultural background,
socioeconomic status and individual personality. If, for example, black employees believe that the
organisation is not committed to their development and progression, they might not continue with their
studies because they do not expect good results to be equitably rewarded.
Finally, sometimes it is not possible to attribute blame, because no real injustice has occurred. In such
instances, predicting the individual’s allocation of blame is difficult, since there are no clear indicators of
blame. The more difficult it is to attribute blame, the more hostile, alienated, and disaffected an individual
may become. According to Sheppard et al (1992), the above-mentioned principles in attributing blame
hold the following implications for the organisation:
! The causes of injustice at any level may be diagnostic of potential injustice at other levels.
! If a procedure is fair then a person is likely to receive the blame.
! People will continue to blame that element to which they usually attribute blame.
UUnniivveerrssiittyy ooff PPrreettoorriiaa eettdd –– CCooeettzzeeee,, MM ((22000055))

4.12
! Although blame for injustice can be widely shared, it rarely is. We tend to concentrate blame on
a single, favourite source.
! People tend not to blame systems, and if they do, this will happen only after explanations of
“people” and “procedures” have been proven to be inadequate.
Having determined the target of blame, a person must make one more decision: how much responsibility
and blame to attribute to the target. According to Sheppard et al (1992), people base their judgment on
three criteria: (1) Was the perceived injustice intentional? (2) Could the injustice and its consequences
have been controlled? and (3) Did the person provide any excuse or justification for his of her actions?
According to Bies (1987), excuses and mitigating circumstances can be used to pre-empt blame for unjust
acts. People can provide explanations for potentially unfair behaviour or procedures before they occur,
and thus mitigate others’ responses to the injustice. According to Sheppard et al (1992), common
explanations used by organisations to soften the impact of an injustice include the following:
! “We didn’t really have any choice.”
! “You would have made the same decision had you been in my shoes.”
! “The policy on AA appointments is very prescriptive.”
! “The system wasn’t designed to handle problems like this.”
! “If we look at this problem from (a different) perspective, the decision is completely reasonable.”
In lieu of an excuse, organisations can also provide an apology to justify injustices. An apology plays a
similar role to an excuse, but assumes a different form. An apology involves the acceptance of blame,
the acknowledgement of wrongdoing, and the implication that the behavioural or procedural elements that
caused the problem will not occur again. In other words, there is no need for a person to take action to
fix the injustice since the agent recognises the wrongdoing, has learned from it, and will make sure that
it will never occur again.
4.7 ACTING ON INJUSTICE
Having decided that someone or something is to blame for an injustice, a person must next decide what,
if anything, to do about it. A number of factors influence the degree to which someone feels a need to act
on an injustice.
4.7.1 Factors influencing a person's need to act on an injustice
The two most important factors include the impact of the injustice on the perceiver; and the level of
concern for limiting future injustice.
UUnniivveerrssiittyy ooff PPrreettoorriiaa eettdd –– CCooeettzzeeee,, MM ((22000055))

4.13
4.7.1.1 The impact of the injustice
The need to punish the cause of an injustice is a direct function of both the perceived magnitude of the
injustice itself, and the degree to which one holds a particular person responsible for creating the injustice.
The perceived magnitude of injustice is a function of the level of discrepancy from the relevant standards
of fairness held for behaviour in that situation, and the level of discrepancy from the best envisioned
alternative to the current situation. If, for example, a manager uses his or her influence to ensure that a
family member receives a promotion while other employees are not informed about the vacancy or
afforded the opportunity to apply, unfairly treated employees will act on the injustice because:
! a gross injustice has occurred (magnitude of injustice)
! the manager can be held responsible for the injustice (person responsible)
! there was a clear deviation from procedures (discrepancy from standards)
4.7.1.2 Limiting future injustice
The second factor driving the need to respond is a function of the perceived probability that the injustice
will persist into the future if left unattended. However, the decision to respond also depends on the
probability that a person will be able to bring about changes. There is no value in responding to injustices
where there is no likelihood of perpetuation. People have different reasons for responding to injustices.
Some are more retributive in their responses, while others are more focused on deterrence and adopt “an
eye for an eye” approach.
Individuals can pursue a number of alternative courses of action to deal with injustice. According to
Sheppard et al (1992), employees generally deal with injustices in one of four ways. Firstly, they live with
the injustice and continue as if nothing has happened. Secondly, they can change their behaviour to
remove the injustice — for example, they can work less hard if their efforts are not equitably rewarded.
Thirdly, they can rationalise the injustice by renaming, removing or redefining it. Lastly, employees can
decide to resign or request a transfer in order to avoid confronting continued injustice.
Rusbult, Zembrodt and Gunn (1982) proposed a two-dimensional model of behavioural responses to
dissatisfaction. According to them, behaviours can be located along a dimension of positive (constructive)
to negative (destructive), and active to passive. Based on these two dimensions, four quadrants of
behaviour, as illustrated in figure 4.2, are identified.
UUnniivveerrssiittyy ooff PPrreettoorriiaa eettdd –– CCooeettzzeeee,, MM ((22000055))
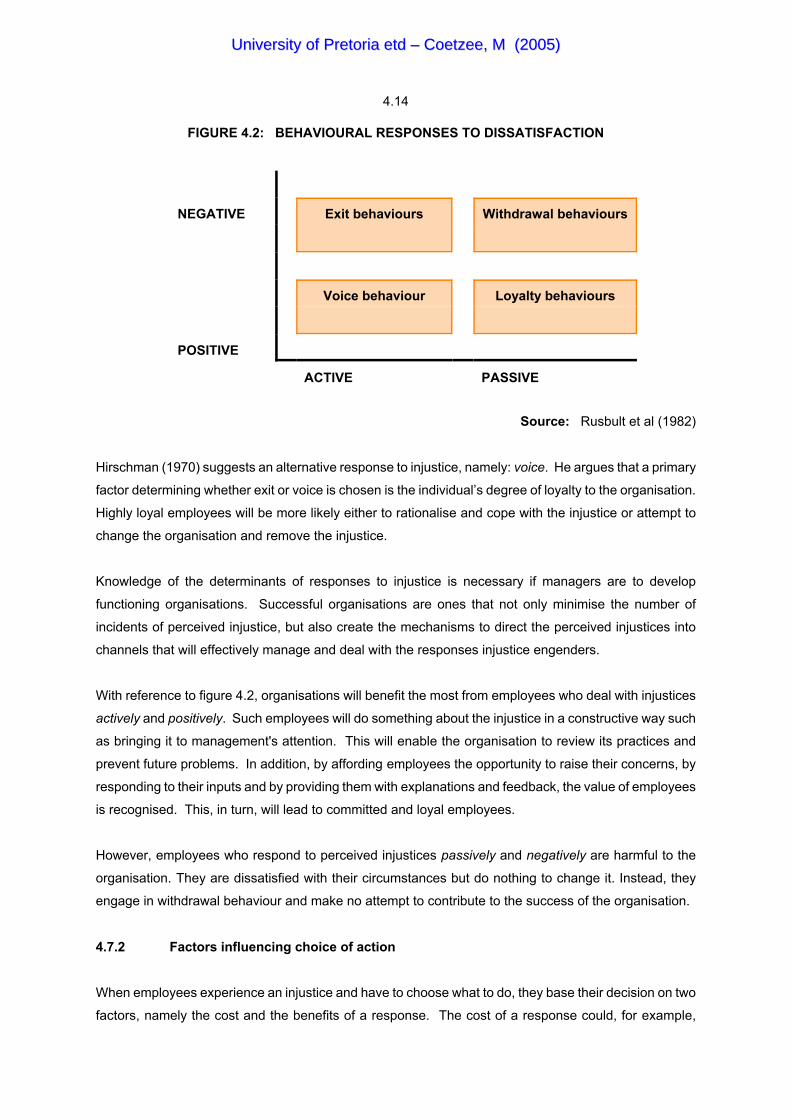
4.14
FIGURE 4.2: BEHAVIOURAL RESPONSES TO DISSATISFACTION
NEGATIVE Exit behaviours Withdrawal behaviours
Voice behaviour Loyalty behaviours
POSITIVE
ACTIVE PASSIVE
Source: Rusbult et al (1982)
Hirschman (1970) suggests an alternative response to injustice, namely: voice. He argues that a primary
factor determining whether exit or voice is chosen is the individual’s degree of loyalty to the organisation.
Highly loyal employees will be more likely either to rationalise and cope with the injustice or attempt to
change the organisation and remove the injustice.
Knowledge of the determinants of responses to injustice is necessary if managers are to develop
functioning organisations. Successful organisations are ones that not only minimise the number of
incidents of perceived injustice, but also create the mechanisms to direct the perceived injustices into
channels that will effectively manage and deal with the responses injustice engenders.
With reference to figure 4.2, organisations will benefit the most from employees who deal with injustices
actively and positively. Such employees will do something about the injustice in a constructive way such
as bringing it to management's attention. This will enable the organisation to review its practices and
prevent future problems. In addition, by affording employees the opportunity to raise their concerns, by
responding to their inputs and by providing them with explanations and feedback, the value of employees
is recognised. This, in turn, will lead to committed and loyal employees.
However, employees who respond to perceived injustices passively and negatively are harmful to the
organisation. They are dissatisfied with their circumstances but do nothing to change it. Instead, they
engage in withdrawal behaviour and make no attempt to contribute to the success of the organisation.
4.7.2 Factors influencing choice of action
When employees experience an injustice and have to choose what to do, they base their decision on two
factors, namely the cost and the benefits of a response. The cost of a response could, for example,
UUnniivveerrssiittyy ooff PPrreettoorriiaa eettdd –– CCooeettzzeeee,, MM ((22000055))

4.15
include the creation of conflict, victimisation, resentment, retaliation, loss of reputation, emotional costs
of action, lost opportunities, a sense of failure, strained interpersonal relationships, and so forth. The
benefits of a response could include the system, procedures and practices being reviewed or a decision
being reversed. Obviously an employee will choose the alternative that maximises the value of the action.
Part of determining the benefits of a response involves calculating the impact of a response and the
probability that it can be successfully completed. According to Sheppard et al (1992), several aspects of
the individual and the situation have an influence on the probable success of each course of action.
These include the following:
! the degree to which an employee feels that he or she has control over the factors necessary to
take effective action
! the degree to which an employee believes his or her personality and values are consistent with
a particular course of action
! the degree to which a clear route for action is available and visible
! the degree to which others agree with and support the employee’s opinion about the existence
of an injustice and how to proceed
4.7.2.1 Level of perceived control
The degree to which one will actively respond is related to the level to which one feels one has any control
over the cause of the injustice. Perceived lack of control comes from three main sources. First, it is
related to one’s general sense of perceived efficacy. Some people feel that they can effect change, or get
things done, more than others. Second, perceived control is related to real and perceived power. If a
person thinks he or she does not have the resources, information, status or support necessary to influence
the cause of an injustice, he or she will not act to rectify the injustice. Third, perceived control is related
to the degree to which a person feels he or she understands the cause of the injustice.
4.7.2.2 The predisposition of the unfairly treated individual
The likelihood of actively responding to an injustice is also affected by the qualities of the unfairly treated
person. People who feel they are generally competent are more likely to act than those who feel they are
incompetent. Individual differences in the tendency to approach or avoid a situation also influence a
person’s degree of active coping behaviour. People who have an approach orientation actively strive to
cope with their problem, while those with an avoidance orientation tend to rationalise the problem away
and deny it, and denigrate themselves. Furthermore, past feelings of injustice can accumulate to influence
current action. People who have experienced persistent injustice from a particular source will be more
likely to act on that injustice.
UUnniivveerrssiittyy ooff PPrreettoorriiaa eettdd –– CCooeettzzeeee,, MM ((22000055))
4.16
4.7.2.3 Clear route for action
One reason for a person not acting on an injustice is that there is no obvious way to respond. Take, for
example, the increasing number of complaints and grievances lodged during the past few years.
Grievance procedures provide employees with information and the means to address any injustices, and
they are therefore more likely to act on an injustice.
4.7.2.4 Shared perceptions with others
As indicated earlier, because perceptions of justice are not an objective reality but a social judgment,
people are likely to seek confirmation of their opinions before deciding on a course of action. When a
person discovers that others disagree with his or her opinion, he or she will become less certain about the
judgment and less likely to act on it.
4.8 HANDLING EMPLOYEES’ REACTIONS TO INJUSTICES
Employees who experience an injustice tend to act irrationally and emotionally when no avenue exists for
reducing the injustice, when the chosen action has not fully solved the injustice, when the feelings from
the existing injustice are managed without taking the future into consideration and when the unfairly
treated employee is too angry to react rationally. These situations suggest that an organisation can do
a number of things to channel reactions to injustice into forms that are less emotion driven, and thus easier
for the organisation to handle. Organisations should consider the following options to manage employees’
feelings about perceived injustices:
4.8.1 Eliminate gross injustices
First, organisations should avoid engaging in gross injustices. Although it is impossible to eliminate all
forms of injustice and there are too many criteria for determining justice, injustices that do exist should be
reasonable in scale.
4.8.2 Provide accessible and effective mechanisms for responses to injustices
Providing a controlled, accessible, responsive, nonretributive means of allowing employees to vent their
ill-will and receive some reasonable response from the organisation can serve to avoid more harmful,
emotional responses and reduce the perceived need for further action. One of the mechanisms that
organisations can use to assure procedural fairness is to afford employees the opportunity to be heard
in the organisation. This opportunity to express feelings and opinions is known as voice.
4.8.3 Allow employee voice
According to Sheppard et al (1992), voice serves two critical roles in assuring procedural fairness: a
preventive and a remedial role. Preventive voice is the process whereby organisations create mechanisms
UUnniivveerrssiittyy ooff PPrreettoorriiaa eettdd –– CCooeettzzeeee,, MM ((22000055))
4.17
that permit employees to express their views about policies, procedures or key decisions in organisational
governance and management. By providing opportunities for input by those influenced by a decision,
organisations will likely be seen as more fair in the first instance. Remedial voice mechanisms afford
individuals the opportunity to express concerns about a decision that has already been made. This form
of voice consists of efforts by employees to question organisational practices, for the purposes of gaining
more information about them, challenging them or attempting to change them.
Remedial voice serves a number of key functions. Its primary function is to reduce the level of
dissatisfaction and distress in the employee experiencing an injustice. It also provides diagnostic
feedback to the organisation by indicating that some policy or practice is not working. It thus serves to
alert the organisation to the fact that some employees find a policy or practice unfair. By identifying and
notifying management of injustices, it enables the organisation to correct or make changes as necessary.
Voice does not, however, assure that such changes or corrections will be made. Lastly, voice creates the
opportunity for a new level of knowledge and understanding about the areas in which problems may be
encountered in the future. This information enables the manager to design and implement future policies
and practices so that justice concerns will not be raised.
The fair treatment of employees is important for three reasons: (1) to improve performance effectiveness,
(2) to enhance the sense of organisational commitment, and (3) to sustain individual dignity and
humaneness. Closely related to these reasons are the functions of voice systems which include:
! assuring employees’ fair treatment
! providing a context in which unfair treatment can be appealed
! improving the organisation's effectiveness
! sustaining employee loyalty and commitment
The first two functions meet the dignity and humaneness goal, the third meets the performance
effectiveness goal, and the last meets the commitment goal. One can thus conclude that a voice system
has a direct influence on the perceived fairness of an organisation. However, for a voice system to
function effectively it has to meet certain criteria. Without going into too much detail, the attributes of an
effective voice system, as identified by Sheppard et al (1992), are listed in table 4.2.
UUnniivveerrssiittyy ooff PPrreettoorriiaa eettdd –– CCooeettzzeeee,, MM ((22000055))

4.18
TABLE 4.2: ATTRIBUTES OF EFFECTIVE VOICE SYSTEMS
DESIGNSimple proceduresBroad applicationVested authorityGood diagnostic system
RESPONSIVENESSTimelyTangible resultsManagement commitmentConsidered inputs
CORRECTNESSAdministered wellProvides follow-upSolve problems in an unbiased, thoroughand effective manner
ACCESSIBILITYEasy to useWell advertised
NON-PUNITIVENESSAnonymity, NonretributiveConfidentiality
Source: Sheppard et al (1992)
The purpose of organisational voice systems is to channel organisational dissatisfaction into acceptable
forms and to respond to that dissatisfaction. Viewed from the individual perspective, they provide
mechanisms for hearing employee concerns and complaints. Viewed from the organisational perspective,
they serve as vehicles for stimulating feedback and commentary while maintaining control over the
challenges and threats to management or even to the organisation’s existence.
In understanding what organisational justice entails, an attempt should be made to apply fairness
principles to the AA domain. In the next section the fairness of AA will be evaluated against
organisational justice criteria.
4.9 MANAGING AFFIRMATIVE ACTION FAIRLY
In order to determine the fairness of AA, one needs to understand the meaning of the concepts of fairness
and affirmative action. As defined in chapter 2, AA refers to the creation of a workforce that is
representative of the population. In order to achieve this, organisations need to make use of fair
discriminatory interventions to appoint, promote or develop employees from previously disadvantaged
groups. Justice refers to the fairness of a decision, the procedure used in making that decision and the
interpersonal treatment an employee receives during the enactment of these procedures.
If a decision to appoint or promote an AA candidate is made in accordance with the provisions of the
Employment Equity Act 55 of 1998, there is not much an organisation can do about the perceived fairness
of it. There are, however, various ways in which such a decision can be made — hence the need for
organisations to ensure that the procedures, policies and processes they use in making appointment or
promotion decisions are procedurally fair and viewed as such by employees.
Several principles of procedural justice are cited in the literature. The following list summarises the
principles of fairness referred to in seven recent articles on procedural justice (De Witt, 1998; Gopinatha
UUnniivveerrssiittyy ooff PPrreettoorriiaa eettdd –– CCooeettzzeeee,, MM ((22000055))

4.19
& Becker, 2000; Harris, 2000; Konovsky, 2000; Saxby, Tat, Johansen, 2000; Simerson, L’Heureux,
Beckstein, ZiaMian, Dembowski & Freshman, 2000; Tang & Sarfield-Baldwin, 1996; Tata, 2000):
! Provide advance notice of intent or decisions.
! Provide accurate information and adequate feedback.
! Support two-way communication.
! Explain and justify decisions.
! Allow employees to influence the decision.
! Consider the interests, views and concerns of all recipients.
! Permit appeal, review, reconsideration and correction.
! Treat employees with dignity, respect and sensitivity.
! Apply administrative procedures consistently.
The primary principles of procedural justice, as identified by Leventhal et al. (1980) and which are similar
to the principles listed above are briefly discussed below.
4.9.1 Selection of decision makersAny decisions that need to be made about the AA policy, appointment of applicants, determination of
appointment and promotional criteria, budget, grievances lodged, and so forth, should be made by a panel
of members. Of even greater importance is the composition of the panel. Panel members should be
representative of all interest groups and consist of men and women from all ethnic groups. This will
prevent unfair discrimination and afford all employees equal opportunities.
4.9.2 Setting ground rules (criteria) for evaluating rewardsClear guidelines and criteria should be referred to when making decisions. If the AA policy regulates the
issue at hand, the policy should be adhered to and applied consistently to all candidates.
4.9.3 Methods for collecting informationThe methods for collecting information as well as the type of information collected should be the same for
all candidates. If a decision needs to be made about who to promote in a department, the performance
appraisal report cannot be referred to for one candidate but a personal interview conducted with the
supervisor for another. Using the same procedures for collecting information and obtaining the same type
of information for all candidates will reduce the possibility of prejudice and bias influencing the final
decision.
4.9.4 Procedures for defining the decision processProcedures that outline the decision process and are followed consistently will protect employers against
accusations of favouritism and nepotism. Affirmative action candidates, for example, will have to go
through each step in the selection process and be evaluated according to the same selection criteria used
UUnniivveerrssiittyy ooff PPrreettoorriiaa eettdd –– CCooeettzzeeee,, MM ((22000055))
4.20
for other applicants. Preferential treatment with regard to a procedure will be regarded as a gross
injustice.
4.9.5 Safeguards against abuse of powerAlthough the Employment Equity Act prohibits any form of discrimination, subtle forms of discrimination
still occur in organisations. This is usually the case when employees come up against the power of
managers. In order to protect employees against the abuse of power, mechanisms should be in place to
afford them the opportunity to voice their concerns. The most common known mechanisms available in
organisations include the following:
! committees that allow employee input
! senior management visits, during which employees can meet with senior officials and openly ask
questions about organisation strategy, policies or raise concerns about unfair treatment
! grievance procedures
! open-door policies
! suggestion boxes
4.9.6 Procedures for appealsUnresolved disputes and dissatisfaction create tension and lead to behaviour such as withdrawal,
resignations and other destructive actions such as sabotage and retaliation. The organisation should thus
provide a mechanism through which employees can channel their dissatisfaction and receive feedback.
The grievance procedure is an example of such a mechanism.
4.9.7 The availability of change mechanismsThis component refers to the reversibility of a decision. Employees will regard a procedure as fair if they
have the assurance that the procedure makes provision for injustices to be rectified.
Perceptions of procedural fairness are, however, also influenced by factors that go beyond the formal
procedures used to make decisions. The interpersonal treatment employees receive from decision makers
also influences their perceptions about the fairness of AA.
Take, for example, the situation in which employees attend an interview in the hope of receiving a
promotion. Management decide to promote an AA candidate despite the fact that some of the other
employees have more work experience. The rejected employees discover afterwards that the decision
to promote the AA candidate was made long before the interviews took place and they were conducted
merely for formality purposes. From an interactional justice point of view, the interpersonal treatment the
rejected employees received was, to say the least, pathetic. For procedures to be viewed as
interpersonally fair, managers should be truthful to employees, treat them with respect and justify their
decision. If the rejected employees were informed about the priority of an AA appointment, were shown
UUnniivveerrssiittyy ooff PPrreettoorriiaa eettdd –– CCooeettzzeeee,, MM ((22000055))

4.21
respect by not giving them false expectations or inviting them to an interview under false intentions and
were provided with an explanation for not being promoted, they would have perceived their treatment as
fair and more easily have accepted the decision.
4.10 SUMMARY
There is clear evidence that people care about justice. Organisations thus have to pursue it, as measured
by reality as well as by perceptions. Unfortunately, the conclusion that it is better to be behaviourally just
is too simple. In pursuing principles of distributive justice, it is not possible to achieve all criteria
simultaneously. The base criteria of equity, equality and need are incompatible. Thus, organisations are
left with a superordinate problem: how to achieve balance between the three principles of distributive
justice. One possibility is to determine which of the goals is most important to a given situation.
Regarding procedural justice, organisations have to ensure that the procedures, processes and policies
they use in making decisions are fair. Employees judge the fairness of procedures according to two types
of control they have, namely the amount of control they have over the procedures used to make a decision
and the amount of control they have over influencing the decision. Procedures are regarded as fair to the
extent that they suppress bias, create consistent allocations, rely on accurate information, are correctable,
represent the concerns of all recipients, and are based on moral and ethical standards.
A third type of justice, namely interactional justice, refers to the interpersonal treatment employees receive
during the enactment of organisational procedures. Procedures are seen as interpersonally fair when they
make provision for truthfulness, allow for the respectful treatment of employees, eliminate the chances of
improper questions being asked and provide reasons or explanations for perceived injustices.
Employees can respond in various ways to a perceived injustice. They can live with it, change their
behaviour to remove the injustice, rationalise it or leave (resign from) the organisation. The experience
of injustice is harmful to individuals and organisations — hence the need for organisations to eliminate
injustices, provide accessible and effective mechanisms for responses to injustices and allow employees
to voice their concerns.
In this chapter the meaning of organisational justice was discussed with a view to explaining how
employees make fairness judgments. The discussion extended theories from the organisational justice
literature to the AA domain in order to advance the understanding of AA fairness. Employees’ reactions
to injustices and the way organisations should deal with perceptions of injustices were also highlighted.
The next chapter deals with employee commitment and the possible influence perceptions of AA fairness
have on employees’ commitment.
UUnniivveerrssiittyy ooff PPrreettoorriiaa eettdd –– CCooeettzzeeee,, MM ((22000055))

5.1
Chapter 5
EMPLOYEE COMMITMENT
5.1 INTRODUCTION
No organisation in today’s competitive world can perform at peak levels unless each employee is
committed to the organisation's objectives and works as an effective team member. It is no longer good
enough to have employees who come to work faithfully everyday and do their jobs independently.
Employees now have to think like entrepreneurs while working in teams, and have to prove their worth.
However, they also want to be part of a successful organisation which provides a good income and the
opportunity for development and secure employment.
In the past, organisations secured the loyalty of their employees by guaranteeing job security. However,
many organisations have responded to competitive pressures by downsizing, restructuring and
transformation and thus created a less secure organisational climate. A growing number of employees
therefore feel that they are victims of broken promises. One of the challenges facing modern organisations
involves maintaining employee commitment in the current business environment. This organisations can
achieve by developing a new “work contract”. In today’s workplace, employees face more ambiguity in
their daily activities and decreased job security (Bergmann, Lester, De Meuse & Grahn, 2000). With no
assurance of continued employment, workers have now raised their expectations in other areas. For
instance, employees expect employers to demonstrate their commitment in terms of pleasant working
conditions, access to training and development, provision of a safe working environment and a balance
between work and employees’ commitments outside the workplace.
Organisations are faced with ever-increasing competition and as they prepare for new challenges, one
of the key components of survival is maintaining and upgrading the organisation’s ability to use human
resources effectively and efficiently. According to Katz (1964), employee behaviour essential for
organisational effectiveness includes employees (1) entering and remaining with the organisation, (2)
carrying out specific role requirements, and (3) engaging in innovative and spontaneous activity that goes
beyond role prescriptions. The appointment of good workers is thus critical, but of even greater
significance is the organisation’s ability to create a committed workforce. Hence the need for managers
to understand the concept of commitment - what it is, how it operates, and most importantly, which
behaviours are displayed by employees committed to the organisation.
The importance of employee commitment is quite evident if one considers prior research into the
relationship between commitment and job satisfaction (Bateman & Organ, 1983), workplace justice
UUnniivveerrssiittyy ooff PPrreettoorriiaa eettdd –– CCooeettzzeeee,, MM ((22000055))
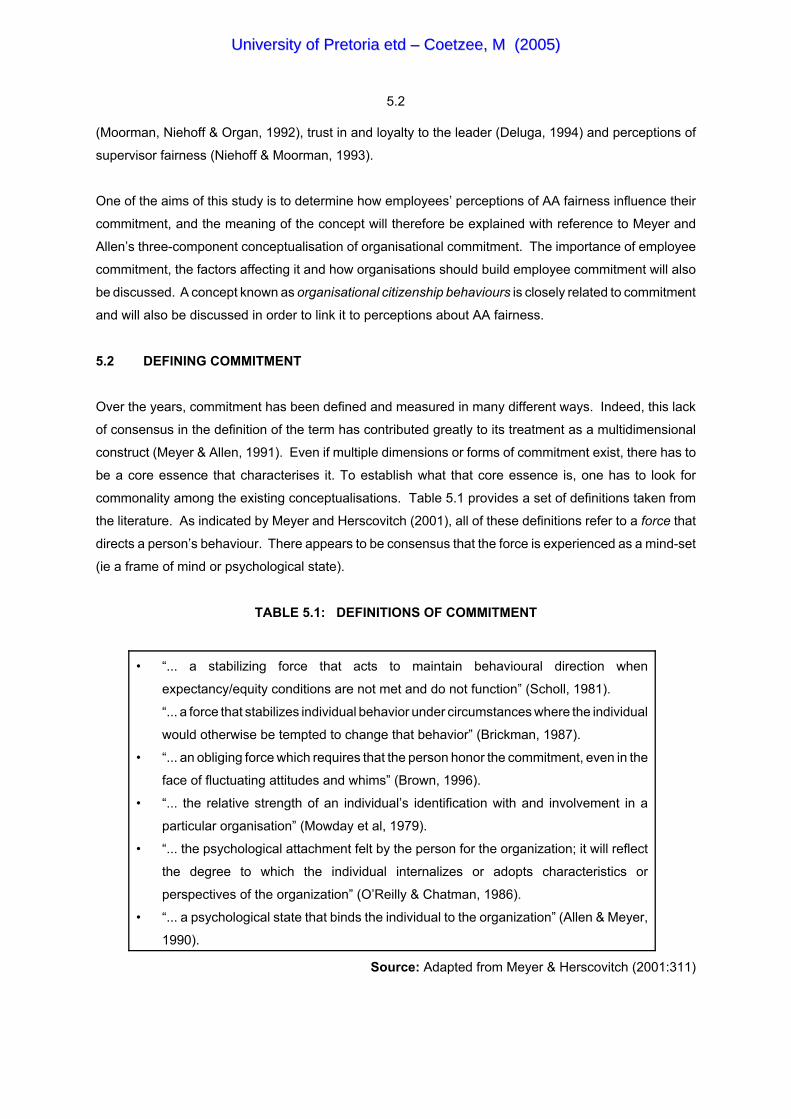
5.2
(Moorman, Niehoff & Organ, 1992), trust in and loyalty to the leader (Deluga, 1994) and perceptions of
supervisor fairness (Niehoff & Moorman, 1993).
One of the aims of this study is to determine how employees’ perceptions of AA fairness influence their
commitment, and the meaning of the concept will therefore be explained with reference to Meyer and
Allen’s three-component conceptualisation of organisational commitment. The importance of employee
commitment, the factors affecting it and how organisations should build employee commitment will also
be discussed. A concept known as organisational citizenship behaviours is closely related to commitment
and will also be discussed in order to link it to perceptions about AA fairness.
5.2 DEFINING COMMITMENT
Over the years, commitment has been defined and measured in many different ways. Indeed, this lack
of consensus in the definition of the term has contributed greatly to its treatment as a multidimensional
construct (Meyer & Allen, 1991). Even if multiple dimensions or forms of commitment exist, there has to
be a core essence that characterises it. To establish what that core essence is, one has to look for
commonality among the existing conceptualisations. Table 5.1 provides a set of definitions taken from
the literature. As indicated by Meyer and Herscovitch (2001), all of these definitions refer to a force that
directs a person’s behaviour. There appears to be consensus that the force is experienced as a mind-set
(ie a frame of mind or psychological state).
TABLE 5.1: DEFINITIONS OF COMMITMENT
• “... a stabilizing force that acts to maintain behavioural direction when
expectancy/equity conditions are not met and do not function” (Scholl, 1981).
“... a force that stabilizes individual behavior under circumstances where the individual
would otherwise be tempted to change that behavior” (Brickman, 1987).
• “... an obliging force which requires that the person honor the commitment, even in the
face of fluctuating attitudes and whims” (Brown, 1996).
• “... the relative strength of an individual’s identification with and involvement in a
particular organisation” (Mowday et al, 1979).
• “... the psychological attachment felt by the person for the organization; it will reflect
the degree to which the individual internalizes or adopts characteristics or
perspectives of the organization” (O’Reilly & Chatman, 1986).
• “... a psychological state that binds the individual to the organization” (Allen & Meyer,
1990).
Source: Adapted from Meyer & Herscovitch (2001:311)
UUnniivveerrssiittyy ooff PPrreettoorriiaa eettdd –– CCooeettzzeeee,, MM ((22000055))
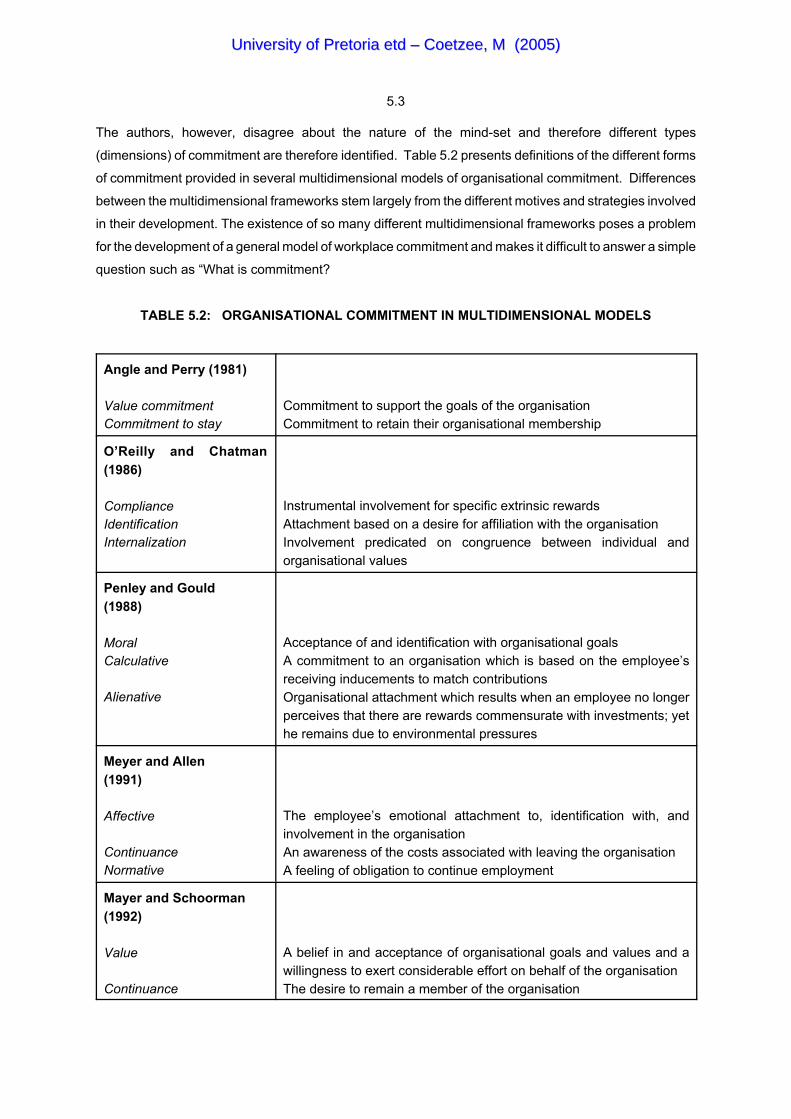
5.3
The authors, however, disagree about the nature of the mind-set and therefore different types
(dimensions) of commitment are therefore identified. Table 5.2 presents definitions of the different forms
of commitment provided in several multidimensional models of organisational commitment. Differences
between the multidimensional frameworks stem largely from the different motives and strategies involved
in their development. The existence of so many different multidimensional frameworks poses a problem
for the development of a general model of workplace commitment and makes it difficult to answer a simple
question such as “What is commitment?
TABLE 5.2: ORGANISATIONAL COMMITMENT IN MULTIDIMENSIONAL MODELS
Angle and Perry (1981)
Value commitmentCommitment to stay
Commitment to support the goals of the organisationCommitment to retain their organisational membership
O’Reilly and Chatman(1986)
ComplianceIdentificationInternalization
Instrumental involvement for specific extrinsic rewardsAttachment based on a desire for affiliation with the organisationInvolvement predicated on congruence between individual andorganisational values
Penley and Gould(1988)
MoralCalculative
Alienative
Acceptance of and identification with organisational goalsA commitment to an organisation which is based on the employee’sreceiving inducements to match contributionsOrganisational attachment which results when an employee no longerperceives that there are rewards commensurate with investments; yethe remains due to environmental pressures
Meyer and Allen(1991)
Affective
ContinuanceNormative
The employee’s emotional attachment to, identification with, andinvolvement in the organisationAn awareness of the costs associated with leaving the organisationA feeling of obligation to continue employment
Mayer and Schoorman(1992)
Value
Continuance
A belief in and acceptance of organisational goals and values and awillingness to exert considerable effort on behalf of the organisationThe desire to remain a member of the organisation
UUnniivveerrssiittyy ooff PPrreettoorriiaa eettdd –– CCooeettzzeeee,, MM ((22000055))

TABLE 5.2 (continued) 5.4
Jaros et al (1993)
Affective
Continuance
Moral
The degree to which an individual is psychologically attached to anorganisation through feelings such as loyalty, affection, warmth,belongingness, pleasure, etc.The degree to which an individual experiences a sense of being lockedin place because of the high costs of leavingThe degree to which an individual is psychologically attached to anorganisation through internalization of its goals, values and missions
Source: Adapted from Meyer & Herscovitch (2001:320)
Since it is not the purpose of this study to examine the dimensionality of commitment, only those models
that have generated the most research and which best explain commitment in terms of organisational
behaviour — the models developed by Meyer and Allen, and O’Reilly and Chatman — will be discussed.
5.3 A THREE-COMPONENT CONCEPTUALISATION OF ORGANISATIONAL COMMITMENT:
MODEL DEVELOPED BY MEYER AND ALLEN
According to Meyer and Allen (1991), organisational commitment reflects at least three general themes:
affective attachment to the organisation, the perceived costs associated with leaving it and the obligation
to remain with it. These three approaches are referred to as affective, continuance and normative
commitment. Common to these three approaches is the view that commitment is a psychological state that
characterises the employee’s relationship with the organisation and has implications for the decision to
continue membership of it. These psychological states also have different implications for work-relevant
behaviour.
5.3.1 Affective commitment
Affective commitment refers to the employee’s emotional attachment to, identification with, and
involvement in the organisation. Employees with a strong affective commitment continue employment with
the organisation because they want to. According to Mowday (1982), the antecedents of affective
commitment generally fall into four categories: (1) personal characteristics, (2) structural characteristics
(organisational), (3) job-related characteristics, and (4) work experiences. Although various research
studies have been conducted to link demographic characteristics such as age, tenure, gender and
education to commitment, the relations were neither strong nor consistent, the reason being too many
variables such as job status, work rewards and work values moderating the relationship. Relatively few
studies have examined the relationship between organisational characteristics and commitment.
However, research has proved that affective commitment is related to decentralisation of decision making
and formalisation of policy and procedures. In contrast to personal and organisational characteristics, a
considerable amount of research has been conducted into the relationship between work experience
UUnniivveerrssiittyy ooff PPrreettoorriiaa eettdd –– CCooeettzzeeee,, MM ((22000055))

5.5
variables and affective commitment. Work experience variables that have been found to correlate with
affective commitment include equity in reward distribution (Rhodes & Steers, 1981), role clarity and
freedom from conflict (Glisson & Durick, 1988), supervisor consideration (Glisson & Durick, 1988), fairness
of performance-based rewards and job challenge (Meyer & Allen, 1987), opportunity for advancement
(O’Reilly & Caldwell, 1980) and participation in decision making (Rhodes & Steers, 1981). Research to
date suggests that work experiences play the largest role in employees’ decisions to remain with an
organisation.
5.3.2 Continuance commitment
Continuance commitment refers to an awareness of the costs associated with leaving the organisation.
The potential costs of leaving an organisation include the threat of wasting the time and effort spent
acquiring nontransferable skills, losing attractive benefits, giving up seniority-based privileges, or having
to uproot family and disrupt personal relationships. Apart from the costs involved in leaving the
organisation, continuance commitment will also develop as a function of a lack of alternative employment
opportunities. Employees whose primary link to the organisation is based on continuance commitment
remain because they need to.
5.3.3 Normative commitment
Normative commitment reflects a feeling of obligation to continue employment. Employees with a high
level of normative commitment feel that they ought to remain with the organisation. Wiener (1982)
suggests that the feeling of obligation to remain with an organisation may result from the internalisation
of normative pressures exerted on an individual prior to entry into the organisation (family or cultural
orientation), or following entry (organisational orientation). However, normative commitment may also
develop when an organisation provides the employee with “rewards in advance” (eg paying college
tuition), or incurs significant costs in providing employment (eg head-hunting fees or the costs associated
with job training). Recognition of these investments causes employees to feel an obligation to reciprocate
by committing themselves to the organisation until the debt has been repaid (Scholl, 1981).
5.4 CONCEPTUALISATION OF COMMITMENT: MODEL DEVELOPED BY O’REILLY AND
CHATMAN
O’Reilly and Chatman (1986) developed their multidimensional framework on basis of the assumption that
commitment represents an attitude towards the organisation. According to these authors, commitment
takes on three distinct forms, which they labelled compliance, identification and internalisation.
UUnniivveerrssiittyy ooff PPrreettoorriiaa eettdd –– CCooeettzzeeee,, MM ((22000055))

5.6
Compliance occurs when attitudes, and corresponding behaviours are adopted in order to gain specific
rewards. Identification occurs when an individual accepts influence to establish or maintain a satisfying
relationship. Finally, internalisation occurs when influence is accepted because the attitudes and
behaviours one is being encouraged to adopt are congruent with existing values. Employees thus become
committed to organisations with which they share values. Figure 5.1 provides a schematic representation
of a general model of workplace commitment.
FIGURE 5.1: GENERAL MODEL OF WORKPLACE COMMITMENT
COMMITMENT
– – –
AFFECTIVE CONTINUANCE NORMATIVE
DESIRE COST OBLIGATION
– – –BASES
´ Identity relevance´ Shared values´ Personal involvement
BASES´ Investments´ Lack of alternatives
BASES´ Internalization of norms´ Psychological contract´ Benefits & reciprocity norm
EMPLOYEE BEHAVIOUR
Source: Adapted from Meyer & Herscovitch (2001:320)
UUnniivveerrssiittyy ooff PPrreettoorriiaa eettdd –– CCooeettzzeeee,, MM ((22000055))

5.7
In conclusion, employee commitment is defined as an individual’s identification with and involvement in
a particular organisation. It is characterised by a strong belief in and acceptance of the organisation’s
goals and values, a willingness to exert considerable effort on its behalf, and a strong desire to maintain
membership of it.
5.5 COMMITMENT AND WORK BEHAVIOUR
The meaning of employee commitment can best be explained by employing the social exchange theory.
The social exchange theory is grounded in an economic model of human behaviour whereby interactional
processes between individuals are motivated by a desire to maximise rewards and minimise losses. The
basic premise of social exchange theory is that relationships providing more rewards than costs will yield
enduring mutual trust and attraction (Blau, 1964). Furthermore, these social transactions incorporate both
material benefits and psychological rewards including status, loyalty and approval. For example, in the
workplace, the supervisor provides a subordinate with support and monetary rewards while in exchange,
the subordinate contributes personal devotions and expertise.
The most widely studied behavioural correlate of commitment has been turnover in the organisation.
However, this focus on turnover may be shortsighted. Organisational effectiveness depends on more than
simply maintaining a stable workforce; employees must perform assigned duties dependably and be willing
to engage in activities that go beyond role requirements (Organ, 1988). It thus seems reasonable to
assume that employee willingness to contribute to organisational effectiveness will be influenced by the
nature of the commitment they experience. Employees who want to belong to the organisation (affective
commitment) might be more likely than those who need to belong (continuance commitment) or feel
obliged to belong (normative commitment) to make an effort on behalf of the organisation. It is interesting
to note that, of the studies that have reported positive correlations between commitment and performance,
most have used measures of affective commitment. It is possible that an obligation to remain will carry
with it an obligation to contribute, in which case normative commitment would also correlate positively with
effort and performance. Continuance commitment is perhaps least likely to correlate positively with
performance. Employees whose tenure in the organisation is based primarily on need may see little
reason to do more than is required to maintain their membership of the organisation.
Organisations need employees who are willing to go beyond the call of duty and engage in extra-role
behaviours. For this reason, research continued to examine the link between the three components of
commitment and a multidimensional measure of work behaviour. Allen and Smith (1987) and Meyer and
Allen (1984) found that measures of work behaviour correlated positively with measures of affective and
normative commitment but not with continuance commitment. Research by Randall, Fedor and
Longenecker (1990) revealed that affective commitment contributed significantly to the prediction of
concern for quality, sacrifice orientation and willingness to share knowledge. Normative commitment
contributed only to the prediction of sacrifice orientation, and continuance commitment did not add
UUnniivveerrssiittyy ooff PPrreettoorriiaa eettdd –– CCooeettzzeeee,, MM ((22000055))

5.8
significantly to the prediction of any of these behaviours. These findings thus provide support for the
proposition that the three components of commitment have different implications for work-related
behaviour other than turnover.
A term closely related to commitment is organisational citizenship. According to Graham (1991), it can
be conceptualised as a global concept that includes all positive organisationally relevant behaviours of
individual organisation members. It thus includes traditional in-role job performance behaviours,
organisationally functional extra-role behaviours and political behaviours, such as full and responsible
organisational participation, that have typically been omitted previous studies of citizenship. In order to
understand how employees’ perceptions and attitudes affect their commitment, and hence their work
behaviour, it is necessary to take a brief look at the precise meaning of organisational citizenship
behaviour.
5.6 ORGANISATIONAL CITIZENSHIP BEHAVIOUR
Work behaviour that is in some way beyond the reach of traditional measures of job performance but holds
out the promise of long-term organisational success is receiving increasing attention as the challenge of
global competition highlights the importance or organisational innovation, flexibility, productive and
responsiveness to changing external conditions. The terms that are generally used to describe such
behaviour include organisational citizenship behaviour (Graham, 1991) and extra-role behaviour (Van
Dyne & Cummings, 1990). According to Organ (1988), as quoted by Becker and Randall (1994),
organisational citizenship behaviour represents individual behaviour that is discretionary, not directly or
explicitly recognised by the formal reward system, and promotes the effective functioning of the
organisation. He further states that it can be conceptualised as a subtle dimension of job performance
composed of extra-role behaviours. Organisational citizenship behaviours are vital for productivity because
organisations cannot forecast through stated job descriptions the entire spectrum of subordinate
behaviours needed for achieving goals. An organisation's success is thus dependent on employees’
willingness to do more than what their official job descriptions outline.
A common theme of these conceptualisations is an attempt to identify work behaviour that contributes to
organisational effectiveness, but which is often not used to assess job performance. This means that job
performance is assessed by referring to in-role behaviour, whereas organisational citizenship behaviour
refers to both in-role and extra-role behaviour. A critical difference between these two kinds of behaviour
is the extent to which others reward the behaviour and impose sanctions if it is absent. Both in-role and
extra-role behaviours may be intrinsically rewarding. However, the former is more likely to be linked to
extrinsic rewards and sanctions (Morrison, 1994).
UUnniivveerrssiittyy ooff PPrreettoorriiaa eettdd –– CCooeettzzeeee,, MM ((22000055))
5.9
It is well recognised that organisations reap significant benefits from having employees who are willing to
go above and beyond the required role behaviour. There may be situations, however, in which it is
desirable to have employees conceptualise their jobs broadly so that they engage in certain
organisationally functional behaviours without feeling that they are doing something extra. For example,
when employees’ helping others is critical to getting a job done effectively, it might be problematic if
supervisors have to depend on employees’ willingness to engage in extra-role behaviour. In such
situations, managers might want to encourage employees to see helping others as in-role in order to
ensure more consistent performance. It might be valuable therefore for managers to understand the
subtle social and psychological factors that influence employees’ perceptions of their job responsibilities.
According to Morrison (1994), an important management function may be to reduce the perception “that’s
not my job” with respect to activities that are critical but not formally enforced. However, this is no easy
task since employees and their managers have different ideas on defining various behaviours as in-role
or extra-role, and consequently how broadly they define the employees’ job responsibilities. Morrison
(1994), states that one determinant of how broadly employees define their jobs is affective commitment.
High affective commitment means that an employee perceives his or her employment as being based on
a relational exchange. He or she will thus tend to define his or her job obligations in a broad and flexible
manner, indicating high perceived job breadth. This viewpoint is quite different from what is traditionally
regarded as organisational citizenship behaviour and commitment relationship. Instead of believing that
commitment leads employees to exceed their job requirements, Morrison (1994) proposes that
commitment changes the way in which employees define job requirements. Extra-role behaviour is more
likely to be seen as in-role behaviour and part of one’s job.
According to Inkeles (1969), as quoted by Van Dyne and Graham (1994), the organisational citizenship
behaviour construct consists of three categories, namely (1) obedience, (2) loyalty, and (3) participation.
Obedience involves respect for orderly structures and processes. It reflects employees’ acceptance of
the necessity for and desirability of rational rules and regulations governing organisational structure, job
descriptions and personnel policies. Loyalty includes serving the interests of the community as a whole
and the values it embodies. In an organisation, loyalty is identification with and allegiance to an
organisation’s leaders and the organisation as a whole, transcending the interests of individuals, work
groups and departments. It also includes defending the organisation against threats, contributing to its
good reputation, and cooperating with others to serve the interests of the whole. Participation entails
active and responsible involvement in community self-governance and keeping oneself well informed
about issues affecting the community as well as exchanging information and ideas with other people. In
an organisational context, it refers to interest in organisational affairs and taking responsibility for
organisational governance. It also includes attending nonobligatory meetings, sharing informed opinions
and new ideas with others and being willing to combat groupthink.
UUnniivveerrssiittyy ooff PPrreettoorriiaa eettdd –– CCooeettzzeeee,, MM ((22000055))

5.10
When an employee engages in obedience, loyalty and participation activities as outlined above, he or she
displays commitment to the organisation. Not only does such a person do more than what is expected
of him or her, but does not expect to be rewarded for it.
The relationship between commitment and organisational citizenship behaviour can best be explained by
stating that organisational citizenship behaviours are displayed by employees to demonstrate their level
of commitment to the organisation. Commitment should thus be seen as a certain state of mind which
leads to the display of certain behaviours. A number of researchers have investigated the concept of
employee commitment, the definition being that it is an individual's belief in and acceptance of the goals
and values of an organisation, a willingness to work hard on its behalf, and a strong desire to remain in
it (Leong, Furnham & Cooper,1996; Levy & Williams, 1998; Mayer & Schoorman, 1998). According to
Moorman (1991), organisational citizenship behaviour is defined as work-related behaviours that are
discretionary, not related to the formal organisational reward system, and promote the effective functioning
of the organisation (Organ, 1988). The above definitions of commitment and organisational citizenship
behaviour, both refer to internal forces driving work-related behaviour that contributes to the success of
the organisation. For the purposes of this study, commitment, more specifically affective commitment, and
organisational citizenship behaviour will be regarded as one and the same thing.
Because organisational citizenship behaviours include such a wide variety of behaviours, Podsakoff and
MacKenzie (1989) grouped them into the following five categories:
(1) altruism: the extent to which an employee is prepared to help co-workers with their workload and
work-related problems
(2) courtesy: the extent to which an employee helps to prevent others’ problems by advance
consultation, information and respect for others’ needs
(3) sportsmanship: a willingness to accept minor frustrations and inconveniences without fuss or
complaint
(4) conscientiousness: the extent to which an employee obeys organisational rules, regulations and
procedures
(5) civic virtue: responsible and constructive involvement and participation in issues confronting the
group and organisation
The extent to which these behaviours are displayed will thus indicate the degree of an employee's
commitment. The next section will briefly discuss the factors that influence employees’ commitment and
thus behaviour.
UUnniivveerrssiittyy ooff PPrreettoorriiaa eettdd –– CCooeettzzeeee,, MM ((22000055))
5.11
5.7 PREDICTORS OF EMPLOYEE COMMITMENT BEHAVIOUR
The workplace is changing dramatically and demands for the highest quality of product and service are
increasing. To remain competitive in the face of these pressures, employee commitment is crucial. The
benefits of having the best trained workers using the most advanced technology can be nullified by
employees who do not want to use their energy and skills for the benefit of the organisation. Without
employee commitment, there can be no improvement in any area of business activity. Employees will
simply treat their work as a "9-to-5" job without any burning desire to accomplish any more than is
necessary to remain employed. It does not take many uncommitted employees to prevent a business from
prospering and thereby ceding a huge advantage to its competitors.
In many organisations there is a growing gap between the expectations of employers and what they are
prepared to do. There are a number of reasons for this erosion of employee commitment, the most
common one being a failure on the part of management in some or other way. To succeed in the face of
increasing competition, organisations need improved productivity at all levels. This requires commitment
on the part of all employees which can only be achieved through better management practices. Poor
supervision and failure on the part of managers and supervisors to create a committed workforce can lead
to the loss of valued employees. According to Madigan and Dorrell (2000), 41 percent of employees feel
that their organisation is not developing effective managers and supervisors.
Van Dyne and Graham (1994) contend that various personal, situational and positional factors can affect
the commitment of employees and consequently their attitudes and behaviour. The discussion below
briefly highlights the principal personal, situational and positional factors that influence employees’
commitment.
5.7.1 Personal factors
A great deal of research has sought to determine whether certain types of employees are more likely to
be committed to their employer. According to the results, some employees may simply be more
predisposed to engage in citizenship behaviours than others. In particular, employees who are highly
conscientious, outgoing (extroverted) and generally have a positive outlook on life (optimistic) are often
more inclined to be more committed. Employees who are team oriented and tend to place the goals and
concerns of the group above their own, typically also engage in more citizenship behaviours. Likewise,
employees who are empathetic and value helping others (altruistic) may also be more inclined to display
citizenship behaviours at work. Finally, certain employees tend to define their jobs more broadly than
others. Thus for these employees, engaging in citizenship behaviours is simply seen as an integral aspect
of their jobs (Bolino & Turnley, 2003).
UUnniivveerrssiittyy ooff PPrreettoorriiaa eettdd –– CCooeettzzeeee,, MM ((22000055))
5.12
5.7.2 Situational factors
5.7.2.1 Workplace values
Shared values are a critical component of any covenantal relationship. Values that are noncontroversial
(eg quality, innovation, cooperation and participation) are easy to share and can forge close relationships.
If employees believe that their organisation values quality products, they will engage in behaviours that
will contribute to high quality. If employees are convinced that their organisation values participation, they
will be more likely to feel as though their participation will make a difference. Consequently, they will be
more willing to seek solutions and make suggestions to contribute to the organisation's success.
5.7.2.2 Subordinate-supervisor interpersonal relationship
As mentioned previously, the social exchange theory employs an interactionist approach to workplace
relationships where subordinates and supervisors engage in mutually beneficial transactions. Social
exchange implies an informal contract between an employee and the organisation, and because the
supervisor largely represents the organisation to the employee, trust in the supervisor is seen as pivotal
to leader effectiveness and work unit productivity. Moreover, the supervisor’s behaviour is fundamental
in determining the level of interpersonal trust in a work unit. Supervisor behaviours include sharing
appropriate information, allowing mutuality of influence, recognising and rewarding good performance and
not abusing the vulnerability of others. Butler (1991) identified 11 supervisor behaviours as facilitating
interpersonal trust, namely supervisor availability, competence, consistency, discreetness, fairness,
integrity, loyalty, openness, promise fulfilment, receptivity and overall trust. The extent to which the
supervisor displays these behaviours will thus largely determine subordinates' commitment level. It is
interesting to note that only the perceptions of interactional fairness influence actual citizenship
behaviours, although distributive, formal procedural, and interactional justice are related to organisational
citizenship behaviours. According to Moorman (Williams, Pitre & Zainuba, 2002), personal fair treatment
by supervisors conveys more fairness information to employees than a more general assessment of the
fairness of overall procedures. Perceived interactional fairness demonstrates to employees that the
supervisor considers them valuable and important as individuals, whereas perceived formal procedural
fairness focuses on the organisation as a whole. Fair procedures may be in place, but the practice of
fairness by supervisors demonstrates that justice actually occurs.
5.7.2.3 Job characteristics
To the extent that a job is structured to provide regular feedback and autonomy as well as a sense of task
completion, employees can monitor their own behaviour and gain an increased sense of personal control
(Greenberger & Strasser, 1986). Personal control is an individual’s belief that he or she can effect a
change in a desired direction. According to Lawler (1992), an increase in perceived control strengthens
emotional bonds with an organisation. A heightened sense of personal control thus has positive
consequences for employee attitudes and behaviours at work.
UUnniivveerrssiittyy ooff PPrreettoorriiaa eettdd –– CCooeettzzeeee,, MM ((22000055))

5.13
Research has shown that employees engage in higher levels of citizenship behaviour when they have the
opportunity to work on intrinsically satisfying tasks. However, citizenship levels (commitment) are likely
to be markedly lower when employees are given repetitive, highly routinised tasks to complete. In
addition, bureaucratic rules and procedures that overly constrain workers may serve to inhibit acts of
citizenship (Bolino & Turnley, 2003).
Motivating job characteristics such as meaningful work, autonomy and feedback maximise the possibility
for internal motivation. According to Jernigan, Beggs and Kohut (2002), satisfaction with autonomy
(perceived independence), status (sense of importance) and policies (satisfaction with organisational
demands) are all significant predictors of commitment. Thus, specific characteristics of a job can increase
an employee’s sense of felt responsibility, and subsequently, the sense of attachment to the organisation.
Understanding how one’s job contributes to interdependent outcomes enhances feelings of
embeddedness and accountability. Similarly, awareness of outcomes (feedback) can lead to a strong
feeling of mutual responsibility. A job that allows a high degree of autonomy and the absence of close
supervision suggests a situation characterised by trust. Hence the freedom associated with autonomy and
low monitoring is balanced by the reciprocal response of responsibility and commitment.
5.7.2.4 Organisational support
There is a significant association between employee commitment and the extent to which employees
believe their organisation has their interests at heart. Organisations that are able to provide work-life
benefits and other types of employee support are likely to elicit citizenship behaviour. According to
research results, employees were more willing to go beyond the call of duty when they worked for
organisations that offered support which enabled them to balance their work and family responsibilities
more easily, assisted them through difficult times, provide them with benefits they could not afford, and
helped their children do things they would otherwise not have been able to do (bursaries) (Bolino &
Turnley, 2003).
5.7.3 Positional factors
5.7.3.1 Organisational tenure
Various researchers have studied the relationship between job tenure and employees’ relationships with
organisations. The studies have shown that employees who have been with their employing organisations
for a long time are more likely to have embedded relationships and strong organisational ties (Rousseau
& Parks, 1993). Meyer, Allen and Gellatly (1990) supported this research finding and proved that
continuance commitment (the costs of leaving the organisation) had a positive effect on the affective
commitment of employees.
UUnniivveerrssiittyy ooff PPrreettoorriiaa eettdd –– CCooeettzzeeee,, MM ((22000055))

5.14
5.7.3.2 Hierarchical job level
Studies have consistently found socioeconomic status to be the single strongest predictor of commitment
because high status tends to increase both the motivation and ability to be actively involved. In
organisations, employees at high job levels generally have higher levels of organisational commitment
than those at low levels. This is because positions of power allow people to influence organisational
decision making, indicate high status, recognise formal authority and possibly competence, and show that
the organisation recognises their competence and values their contributions. Employees in high level jobs
have more freedom and choices in their behaviour on the job, and these choices enhance their sense of
control and thus lead to increased affective commitment to the organisation.
Managers are often not in a position to influence employees’ commitment because they do not have
control over employees’ positional or personal situations. A manager can, however, manage the work
situation in such a way that employee commitment is enhanced.
5.8 ORGANISATIONAL CHANGE
Organisations tend to be extremely good at planning and orchestrating the technical and structural aspects
of change, but poor at guiding and supporting the human side - the personal reorientation associated with
change. This is one of the reasons why AA is met with distrust and resistance.
According to Smither (1994), five typical barriers to change associated with various sources include the
following: disruption of personal relationships, perceived threat to status, preference for the status quo,
economic factors and problems associated with organisation development specialists. Similarly,
techniques to help overcome these barriers have been discussed at length (Smither, 1994, Leck,
Saunders & Charbonneau, 1996), and include involving managers and employees in the change process,
the use of informal leaders, the use of organisation development specialists and the creation of a new
vision for the workplace. What these techniques all have in common is that they either rely for their
success on employee commitment, or are aimed at maintaining commitment per se. Many of the
techniques applied to ensure continued employee commitment in the face of change do not address the
fundamental nature of problems concerning employee commitment. For example, increased employee
involvement in the change process may increase understanding and lessen uncertainty, but if employees’
personally held values do not concur with the new value system in the organisation, then such approaches
will do little or nothing to restore internalised commitment. Similarly, the use of informal leaders and
methods aimed at convincing employees of the need for change should address the core issue of ensuring
value congruence between employees and the organisation. However, such techniques may be
successful where change affects the level of work practices, but does not disturb underlying organisational
values. In such instances, to ensure continued commitment, logic and understanding of the need for
change are required. However, when the change occurs at the level of values, more fundamental
approaches are required. The aim of these must be the re-establishment of internalised commitment, not
UUnniivveerrssiittyy ooff PPrreettoorriiaa eettdd –– CCooeettzzeeee,, MM ((22000055))
5.15
its continuance. It remains distinctly possible that some employees will find that the mismatch between
their own personal values and the new organisational values is an unbridgeable gap. For such employees,
future commitment will be based on compliance and identification, which have their own implications for
future employee performance. One can therefore argue that the role of employee commitment in the
management of AA is a central one, both from the perspective of consolidating AA and from that of the
likely future success of ongoing change programmes.
5.9 ORGANISATIONAL ACTIONS THAT ENCOURAGE COMMITMENT
In business, as in personal relationships, commitment is a two-way street. If employers want committed
employees, they need to be committed employers. Committed employees do better work than
uncommitted ones and organisations with committed workers do better financially than organisations with
uncommitted ones. Yet, fewer than half the employees in today’s workforce feel committed to their
employer (Bragg, 2002).
Employers need to determine what is responsible for this disparity. According to employees, employers
do not value loyalty and are willing to sacrifice workers to maintain the financial bottom line. Employees
point to decades of downsizing, rightsizing and re-engineering as evidence that employers treat them as
expendable commodities when times get tough (Bragg, 2002). While organisations still want their workers
to be productive, to be proud of their organisations and to remain with them for a reasonable period of
time, they need to acknowledge that employees also have needs — both as workers and individuals. The
relationship between employers and employees has evolved significantly, but unfortunately organisation
practices have not kept pace with the changing needs of employees.
A study by Aon Consulting in Canada in 2000, which looked at the effectiveness of various organisational
practices in building employee commitment, identified five key areas, namely (1) safety and security, (2)
rewards, (3) affiliation, (4) growth and (5) work/life harmony (Madigan & Dorrell, 2000). According to the
results of the study, 60 percent of employees reported that their co-workers improved their skills to make
a better contribution to the organisation. Furthermore, 78 percent were satisfied with the training provided
on the job. One of the major areas that needed attention, however, was work/life harmony. While over
70 percent of the employees felt their organisation had demonstrated an increased effort over the past
year to support its employees’ needs in this area, few workers reported that they were actually receiving
help in child- and elder care — the two areas most often cited as being essential to work/life balance.
While a great deal of attention has been focused on the concept of work/life harmony and employers
generally recognise its importance, they need to review and adjust all practices in such a way that they
accommodate their employees' personal needs. Employers will benefit by doing so, considering the fact
that 29 percent of employees rank work/life harmony as being either the most or second-most important
factor in taking a job (Madigan & Dorrell, 2000).
UUnniivveerrssiittyy ooff PPrreettoorriiaa eettdd –– CCooeettzzeeee,, MM ((22000055))

5.16
5.9.1 Drivers of employee commitment
Bragg (2002) identified the following three drivers as the key factors influencing an employee’s
commitment.
5.9.1.1 Fairness
Fairness implies the elimination of one’s feelings, prejudices and desires to achieve a proper balance
between conflicting interests. The problem with fairness is that it is subjective. Again, perception is reality.
To create a perception of fairness, employers should pay competitive wages, create and administer
policies that are unbiased, offer competitive benefits, provide timely, accurate and useful performance
appraisals, promote the most qualified employees and develop employees by providing opportunities for
growth. Affording employees the opportunity to voice their concerns, play a vital role in ensuring
interactional justice. Various research studies (Bies & Shapiro, 1988; Shapiro, 1991; Shapiro, Buttner &
Barry, 1994) demonstrated that an unfavourable outcome, such as not receiving a promotion because of
AA measures, is better received by a receiver when he or she is treated in an interpersonally fair manner
such as being given an explanation for a decision. In such instances, although the employee might feel
that the decision is not distributively fair, he or she will remain committed to the organisation because he
or she was treated with respect and fairly.
5.9.1.2 Trust
To nurture commitment, employers must create an environment of trust. If employers wish to develop and
maintain trust, they should do what they say they will do, be consistent, maintain confidences, be a role
model of behaviour, encourage employee involvement, allow people to make decisions that affect their
work, allow people to make mistakes without fear or ridicule, learn from mistakes and not crucify
scapegoats, explain reasons for major decisions and act on employee suggestions.
It is interesting to note that research by Mathieu and Zajac (1990), concluded that the link between
commitment and performance was largely nonexistent and commitment to supervisors was more strongly
linked to performance than commitment to organisations. One implication of these results is that human
resource professionals concerned with employee performance should focus their efforts on commitment
to supervisors rather than commitment to organisations. Supervisors play a crucial role in the perceptions
employees form about the organisation's supportiveness and the extent to which it can be trusted to look
after their interests. Lanphear (2001) concurs with the important role supervisors and managers play in
building employee commitment. According to the author, high-quality managers are one of the principal
factors in retaining high-quality employees — hence the need for organisations to ensure that they select,
train, evaluate and reward managers for trustworthy behaviour. Effective managers inspire loyalty, trust
and admiration.
UUnniivveerrssiittyy ooff PPrreettoorriiaa eettdd –– CCooeettzzeeee,, MM ((22000055))

5.17
5.9.1.3 Concern for employees
Employees should be regarded as people, not factors of production. Employers should provide job
security as far as possible, train and develop employees, be flexible to accommodate employee issues,
be open and honest and allow employees to have a life outside work. According to Madigan and Dorrell
(2000), 15 percent of employees feel that their organisation performs below expectation in providing a safe
and secure workplace. This could be attributed to the fact that organisations have emerged from an era
of tremendous change in the work world and an economic downturn, which has evidently left many
employees feeling uncertain about the stability of their jobs. Another disappointing fact is that 34 percent
of employees believe that their organisation does not demonstrate the importance of retaining employees
and only 48 percent would recommend their organisation as a place to work (Madigan & Dorrell, 2000).
In a survey of over 7 500 US workers, Watson Wyatt International found that human resource practices
and trust in management had the strongest impact on building commitment (Whitener, 2001).
Whitener (2001) conducted a research exploring the relationships between human resource practices and
organisational commitment. The results indicated that human resource practices affect the relationship
between perceived organisational support and organisational commitment. By relying on the social
exchange theory, the study has shown that employees’ commitment to the organisation derives from their
perceptions of the employers’ commitment to and support of them. Recognising this tendency to personify
the organisation, researchers predicted that positive, beneficial actions directed at employees by the
organisation contribute to the establishment of high-quality exchange relationships which create
obligations for employees to reciprocate in positive, beneficial ways. Employees interpret organisational
actions such as human resource practices and the trustworthiness of management as being indicative of
the personified organisation’s commitment to them. They reciprocate their perceptions accordingly in their
own commitment to the organisation.
Human resource practices can be classified as “control” or “commitment” practices (Wood & De Menezes,
1998). The aim of control approaches is to increase efficiency, reduce direct labour costs, rely on strict
work rules and procedures, and base rewards on outputs (Arthur, 1994). Rules, sanctions, rewards and
monitoring thus regulate employee behaviour. In contrast, commitment approaches aim to increase
effectiveness and productivity and rely on conditions that encourage employees to identify with the
organisation's goals and work hard to accomplish such goals. The practices that represent a high
commitment strategy include selective staffing, developmental appraisal, competitive and equitable
compensation, and comprehensive training and development activities (MacDuffie, 1995; Snell & Dean,
1992).
Overall, today’s employees have a strong sense of self-worth — they recognise their value, and want their
employers to as well. In the years ahead, businesses will discover that their greatest returns will be
earned by making strategic investments in their human capital. Organisations that listen to their
employees and build a committed workforce will have a distinct competitive advantage.
UUnniivveerrssiittyy ooff PPrreettoorriiaa eettdd –– CCooeettzzeeee,, MM ((22000055))

5.18
5.10 THE RELATIONSHIP BETWEEN JUSTICE PERCEPTIONS AND COMMITMENT
The concern for fairness is reinforced by the presence of a fairness heuristic at work in persons’ cognitions
regarding their relationships to organisations. People need to make decisions about the extent to which
they will constrain their own interests for the sake of the organisation’s interests and welfare. Exhaustive
consideration of all relevant information is impossible in the contexts of real-world relationships between
individuals and organisations. Thus, people inevitably rely on judgmental heuristics to determine whether
to entrust their interests and identity to the organisation and align their goals and behaviour with the
organisation. Among the factors affecting this decision, fairness concerns appear to function pre-
eminently. Fairness suggests to people that their membership of the organisation is valued and that the
organisation respects them, thereby making commitment to the organisation a viable way of maintaining
one’s identity and fulfilling one’s interests. Fair treatment indicates to people that they are being respected
as ends in themselves, and not merely as a means to achieving the ends set by others. Fairness
judgments are formed quickly, easily become entrenched, and constitute a key heuristic basis on which
decisions are made about an individual’s cooperation with and support for an organisation, a basis more
powerful, for example, than economic concerns (Van den Bos, Lind & Wilke, 2001).
According to a study conducted by Moorman (1991), which examined the relationship between
perceptions of fairness and commitment, it is interesting to note that interactional justice was the only
source of justice found to relate to commitment. One possible reason for this is that distributive and
procedural justice referred to the organisation as a whole while interactional justice focuses on the degree
to which the behaviour of the supervisor enacted the formal procedures in a fair manner. Employees’
impressions of the fairness of their interactions with their supervisors communicated more information to
them about trust and equity than the presence or absence of fair procedures. The actions of the
supervisor are probably the most effective and compelling communicator of an employee’s value. Folger
and Konovsky (1989) also reported that procedural justice better predicted organisational commitment and
trust in supervision than distributive justice. The main implication of these studies is that supervisors can
directly influence employees’ commitment. The perception of fairness that originated from interactional
justice was based on whether the supervisor correctly used the procedures that were designed to promote
fairness correctly and on the nature of the supervisor’s behaviour while enacting those procedures. If
managers thus want to increase employee commitment, they should work to increase the fairness of their
interactions with employees.
5.11 SUMMARY
Commitment has been defined and measured in many different ways and is regarded as a
multidimensional construct. The model developed by Meyer and Allen (1991) is one of the most widely
used models and explains commitment the best in terms of organisational behaviour. According to these
researchers, organisational commitment can be classified into affective commitment (emotional
UUnniivveerrssiittyy ooff PPrreettoorriiaa eettdd –– CCooeettzzeeee,, MM ((22000055))

5.19
attachment), continuance commitment (costs associated with leaving the organisation) and normative
commitment (moral obligation to remain with the organisation). Research indicates that employees who
are willing to exceed their job requirements are committed to the organisation in an affective way most of
the time. Such employees also engage in organisational citizenship behaviour such as obedience, loyalty
and participation.
Although employee commitment can be approached from a number of perspectives, the psychological
attachment of employees is a central theme in the various approaches to commitment. According to
O’Reilly and Chatman (1986), an employee’s psychological attachment to the organisation is based on
identification, internalisation and compliance. Attempts to enhance employee commitment should thus
focus on having employees who can identify with the organisation, internalise its values and comply with
requirements.
Various personal, situational and positional factors affect the commitment and hence the work behaviour
of employees of which supervisor-subordinate relationships and the characteristics of the job are the
principal factors.
According to Bragg (2002), employee commitment is dependent on three drivers, namely (1) fairness, (2)
trust, and (3) concern for employees. If employers wish to build commitment, they should create an
environment of fairness, trust, care and concern by acting consistently in ways that employees perceive
as fair, trusting and caring.
In this chapter the meaning of commitment was explained by discussing the various approaches to
commitment. Since Meyer and Allen’s (1991) three-component conceptualisation of organisational
commitment is one of the most widely accepted conceptualisations of commitment, it was covered in
detail. The importance of employee commitment, the factors affecting commitment, the way in which
organisations should build employee commitment and the relationship between justice and commitment
were also discussed.
The discussion on AA, organisational justice and employee commitment concludes the theoretical part
of the study. Since this study examines the treatment of AA employees and the influence perceptions of
AA fairness have on their commitment in the bank, the next chapter will provide a brief overview of the
bank. Thereafter the research and statistical methodology used to conduct the research will be dealt with.
UUnniivveerrssiittyy ooff PPrreettoorriiaa eettdd –– CCooeettzzeeee,, MM ((22000055))

6.1
Chapter 6
AN OVERVIEW OF THE CASE BANK
6.1 INTRODUCTION
The banking sector has experience dramatic change over the past two decades. Following the sweeping
deregulation of banks, they were faced with new and competitive operating environments, and as a
consequence endeavoured both to increase operating efficiencies and develop new income streams
through various structural and strategic change initiatives.
Implicit in such dramatic change is the relatively new orientation by banks towards marketing and the
adoption of a customer service orientation. Since all banks operate under the same legislation, it is
believed that employees are the source of differentiation and competitive advantage. Customer
satisfaction, service quality perceptions, and customers’ decisions to remain loyal or to switch to another
bank are significantly influenced by bank employees' attitudes and behaviour. Employees contribute to
service excellence by delivering on the promises of the bank, by creating a favourable image for the bank,
by going beyond the call of duty for customers, by promoting the bank’s products and services and, in
general, by rendering better service than the bank's competition.
However, employees will only provide good customer service if they are treated fairly. Fairness of job
supervision, pay and promotion rules and supervisor administration of these rules are key predictors of
employees’ prosocial behaviour and commitment (Bettencourt & Brown, 1997).
Despite their importance, employees continue to be viewed and treated as disposable resources. A few
banks, however, are beginning to realise that an emphasis upon customer satisfaction is incongruent with
this outdated view of employees. Good service providers emphasise the fairness of their relationship with
their employees as a prerequisite for customer satisfaction. Employees thus need to be treated with
respect and dignity while promoting fairness in their compensation, rules and interactions.
It is in this context, that this study examines the perceived fairness of AA, the treatment of AA employees
in the workplace and the impact of fairness perceptions on employees’ commitment in the banking
industry. The implementation and management of AA in the bank are used as the organisational context
in which the effects of the perceived fairness of AA measures on employee commitment are tested.
UUnniivveerrssiittyy ooff PPrreettoorriiaa eettdd –– CCooeettzzeeee,, MM ((22000055))

6.2
6.2 AN OVERVIEW OF THE CASE BANK
The bank is a leading banking institution in South Africa and realised a R1,8 billion profit for the year to
31 March 2003. The bank’s dedication to being a partner in South Africa’s prosperity, by being the leading
financial services group serving all stakeholders, is clear when one considers all its achievements. The
bank was rated “Bank of the year in South Africa 2001" by Britain’s The Banker Magazine and according
to the Financial Mail and Deloitte & Touche Human Capital Corporation, it is ranked the seventh best
company to work for in South Africa.
The bank has made a concerted effort to improve its operations with regard to training and development,
diversity and employment equity and change initiatives.
6.2.1 Learning and development
In its continuing quest to be globally competitive, the bank has adopted a learning and development
philosophy which includes a strategy of sourcing from and partnering with external service providers. The
learning and development department has made further contributions towards the meaningful realisation
of the aims of South African education, training and development legislation by registering the first
learnership in the banking sector. It is clear that the bank regards human capital development as a
cornerstone of the bank’s people management strategy if one considers the fact that the bank was able
to claim R24,7 million from the banking sector’s education and training authority, Bankseta, for the 2003
financial year. Table 6.1 indicates the number and categories of employees who attended training courses
during 2003.
TABLE 6.1: NUMBER AND CATEGORIES OF EMPLOYEES TRAINED DURING 2003
BLACKS WHITES
Male Female Male Female
MANAGEMENT 52 22 603 317
PROFESSIONALS/TECHNICIANS 231 271 1 134 1 631
CLERICAL STAFF 2 543 6 012 1 698 9 596
SERVICE WORKERS AND OTHER 158 1 141 517 816
TOTAL 2 984 7 446 3 952 12 360
The average training cost per employee per year amounts to R2 600-00.
UUnniivveerrssiittyy ooff PPrreettoorriiaa eettdd –– CCooeettzzeeee,, MM ((22000055))

6.3
6.2.2 Diversity and employment equity
The bank’s affirmative action approach revolves around employment equity (EE), empowering employees,
managing diversity and understanding differences. In achieving its desired position in terms of EE, the
bank has established employment equity forums on a business unit level to ensure optimal consultation
and the involvement of people at all levels.
The role of these forums is to act as an advisory board to business units in terms of compliance with the
EE Act and to support and monitor the implementation of the EE plan in the bank. The forums also advise
on the management and retention of employees in designated groups. Senior management are penalised
if employment equity targets are not met.
The number of employees who have attended diversity workshops has increased considerably over the
past year, from 1 517 in 2002 to 4 975 in 2003. In enhancing diversity in the bank, emphasis has been
placed on affording employees from designated groups opportunities to attend several special
programmes. The bank endeavours to have the designated groups adequately represented at all levels
in the bank to mirror its customer base. Table 6.2 represents the employee statistics of the bank for 2002
and 2003.
TABLE 6.2: EMPLOYEE STATISTICS
2003 2002
TOTAL NUMBER OF EMPLOYEES 29 714 32 323
GENDERMale
Female
10 160 (34%)
19 554 (66%)
10 832 (34%)
21 491 (66%)
NONMANAGEMENT LEVEL SPLIT BY GENDERMale
Female
5 921 (25%)
17 667 (75%)
6 572 (25%)
19 772 (75%)
MANAGEMENT LEVEL SPLIT BY GENDERMale
Female
4 239 (69%)
1 887 (31%)
4 260 (71%)
1 719 (29%)
ETHNIC GROUPSAfrican, coloured and Asian
White
11180 (38%)
18 534 (62%)
11 252 (35%)
21 071 (65%)
UUnniivveerrssiittyy ooff PPrreettoorriiaa eettdd –– CCooeettzzeeee,, MM ((22000055))

TABLE 6.2 (continued) 6.4
2003 2002
MANAGEMENT SPLIT BY ETHNIC GROUPAfrican, coloured and Asian
White
824 (14%)
5 302 (86%)
607 (10%)
5 372 (90%)
AGEUnder 25 years
26 - 35 years
36 - 45 years
46 - 55 years
Over 55 years
16,3%
38,1%
26,1%
15,5%
4,00%
17,8%
37,3%
25,4%
15,4%
4,10%
AVERAGE REMUNERATION PER EMPLOYEE R9 681 R8 830
Figure 6.1 provides a graphical representation of the composition of the bank’s workforce in terms of
ethnicity as at 31 March 2002 and 31 March 2003.
FIGURE 6.1: WORKFORCE PROFILE ACCORDING TO ETHNIC GROUP
2003 2002
UUnniivveerrssiittyy ooff PPrreettoorriiaa eettdd –– CCooeettzzeeee,, MM ((22000055))
6.5
As indicated in figure 6.1 and table 6.2, the bank still has a long way to go in achieving employment equity.
The bank’s employment equity target is set at 45,6 percent for 2004. Taking into consideration the fact
that the bank managed to increase the employment of blacks by only 3 percent the previous year,
increasing the employment of blacks from 38 percent to 45,6 percent in 2004 poses quite a challenge.
Of greater concern is the inequity in managerial positions. As indicated in table 6.2, whites occupy 86
percent of the top management positions.
6.2.3 Change initiatives
The change initiatives that have taken place in the bank, are typical of those being experienced by many
organisations in the industry, and include changes to (1) structures and processes, and (2) to strategies
and staffing.
6.2.3.1 Structures and processes
In an attempt to become less bureaucratic and to move decision making closer to the customer, the
branch network has been divided into geographically distinct operating areas. Within these, much of the
decision making formerly reserved for head office has been delegated to senior managers. Typically such
decisions were lending related, but developing management information systems enabled area by area
comparison in a range of matters, including costs and product sales. The new structure and circulated
information therefore also had the effect of introducing inter-area competition.
The various change initiatives also resulted in the centralisation of much branch outlet administration,
further changing the role of the branch. In essence, the various changes are resulting in the role of the
branch slowly evolving into that of a sales outlet.
The structural and process changes in the bank can thus be summarised as follows:
! the movement of decision making closer to the customer
! the development of revised reporting lines, with the separation of the sales and costs functions
! the separation of retail and corporate business to facilitate specialisation
6.2.3.2 Strategies and staffing
In an attempt to become more efficient and effective, major cost reduction and sales development
strategies were simultaneously introduced. A dedicated bank-wide, sales division was created at head
office level to coordinate training and liaise closely with the marketing department in terms of new product
development and implementation strategy.
UUnniivveerrssiittyy ooff PPrreettoorriiaa eettdd –– CCooeettzzeeee,, MM ((22000055))
6.6
New human resource policies have been introduced alongside these changes. The principal strategic and
staffing changes in recent years include
! the formulation of a mission statement
! an increase in competition monitoring
! regular intakes of school leavers and people from previously disadvantaged groups
! the development of training courses to develop key skills and competencies
The extent of the change that has occurred in the bank is such that it has profound implications for both
values and working practices in it. Since values and working practices are the cornerstones on which
organisational commitment is founded, an understanding of the impact of the perceived fairness of AA on
commitment levels in the bank is essential for its success.
6.3 SUMMARY
This chapter provided an overview of the most profound changes banks are experiencing. One of the
challenges facing organisations today is meeting employment equity targets. In order to determine the
bank’s status with regard to employment equity, employee statistics were provided. Although the bank
has developed and implemented change initiatives to deal with employment equity and AA issues,
employee statistics show that it still has a long way to go.
This concludes the discussion on AA, organisational justice and employee behaviour. The next chapter
deals with the research and statistical methodology.
UUnniivveerrssiittyy ooff PPrreettoorriiaa eettdd –– CCooeettzzeeee,, MM ((22000055))

7.1
Chapter 7
RESEARCH AND STATISTICAL METHODOLOGY
7.1 INTRODUCTION
The previous chapters provided a theoretical discussion of affirmative action, organisational justice and
employee commitment. This chapter deals with the methods and instruments used to conduct the
empirical research for the study, as well as the statistical methodology. The topics to be addressed include
the design, layout and administration of the questionnaire, the collection of data, the population, the
sampling method, the response rate, statistical methods, descriptive-, comparative-, and associational
statistics, statistical significance and practical significance (effect size).
7.2 THE RESEARCH METHOD
According to Steyn, Smit, Du Toit and Strasheim (2003), a research project is a specific research
investigation — a study that completes or is planned to follow stages in the research process. Figure 7.1
below depicts a research project and strategy.
FIGURE 7.1: THE RESEARCH PROCESS
! FORMULATION OFRESEARCH QUESTIONS
ANALYSIS OF DATAAND CONCLUSIONS
EMPIRICAL STUDY(Data collection)
EDITING AND CODING OFDATA
Source: Adapted from Steyn et al (2003)
Different methods for the collection of primary data such as surveys, experiments, or observations are
available for research (Diamantopoulos & Schlegelmilch, 1997). The type of data required will largely
determine the most appropriate method to be used. In this study, the researcher decided to use the survey
method.
UUnniivveerrssiittyy ooff PPrreettoorriiaa eettdd –– CCooeettzzeeee,, MM ((22000055))

7.2
The survey method is used for descriptive reporting and makes use of a questionnaire to identify individual
differences and perceptions that cannot be observed. By means of the questionnaire, respondents
provide information on their current and previous behaviour, attitudes and perceptions.
7.2.1 The questionnaire
A questionnaire is a document comprising a set of questions, which is sent to a large number of
respondents with a view to obtaining their input and opinions on the topic of the research study.
Researchers can use either structured or unstructured questionnaires. A structured questionnaire provides
different options for each question, and the respondent is simply required to select and mark the applicable
answer (Babbie, 1998). Unstructured questionnaires require far more cooperation on the part of the
respondents since they are required to answer the questions in their own words. The use of unstructured
questionnaires in a mail survey significantly reduces cooperation without providing much helpful
information (Sudman & Blair, 1998). Since mail surveys tend to have the lowest response rates of all
survey methods (Welman & Kruger, 1999) — it is not uncommon for them have a response rate of 10
percent — it is imperative to excersise caution in choosing questionnaires (Aaker, Kumar & Day,1995).
Table 7.1 outlines the advantages and disadvantages of the questionnaire as a data collection method.
In this research, the main reasons why the questionnaire was used as the method for collecting primary
data, included the following:
! It is a relatively cheap method.
! It is relatively easy to distribute and collect questionnaires when respondents are from a single
organisation, as was the case in this study.
! The majority of respondents have a type of “pen-and-pencil” job in which they could complete the
questionnaire during office hours.
7.2.1.1 Requirements for a good questionnaire
If a researcher succeeds in designing a good questionnaire, many of the shortcomings of a questionnaire
can be overcome. An effective questionnaire must, however meet certain requirements. Table 7.2 lists
a number of requirements for the design of a satisfactory questionnaire (Sudman & Blair, 1998).
UUnniivveerrssiittyy ooff PPrreettoorriiaa eettdd –– CCooeettzzeeee,, MM ((22000055))

7.3
TABLE 7.1: THE ADVANTAGES AND DISADVANTAGES OF QUESTIONNAIRES
ADVANTAGES DISADVANTAGES
! Relatively cheap method! Saves time - a lot of information can be
collected within a short period of time! Greater possibility of anonymity! Standardised questions simplify the
coding of data! The answering of questions can be kept
impersonal
! Possibility of a low response rate! Researcher has low control over the
conditions under which thequestionnaire is completed
! The explanation and clarification ofconcepts are not possible
! Anonymity complicates the following upof questionnaires
! It can only be used for short surveyswith mainly closed questions
Source: Adapted from Welman & Kruger (1999)
TABLE 7.2: REQUIREMENTS FOR THE DESIGN OF A GOOD QUESTIONNAIRE
! Use a booklet formatA booklet format is desirable because (1) it prevents pages from being lost, (2) it makes it easier tohandle, (3) a double-page format can be used, and (4) it looks more professional.
! Identify the questionnaireQuestionnaires need a date, the title of the study, and the name of the person conducting the survey.
! Do not crowd the questionsSelf-administered questionnaires should not be crowded because crowding makes the questionnaireappear more difficult.
! Use a large, clear printQuestionnaires can be made user-friendly by making use of a large and clear print. Too small printmakes the questionnaire appear difficult and as a result discourages respondents to complete it.
! Provide instructions for the completion of the questionnaireThe ease with which a questionnaire can be completed plays a big role in a respondent’s decision tocomplete the questionnaire. Specific instructions should appear on the questionnaire and be placedin the most useful location possible. Instructions should be easy to distinguish and therefore bold print,capital letters or italics can be used.
! Do not split questions across pagesRespondents find it confusing if a question is split over two pages, especially in respect of responsecategories for a closed question.
! Precode all closed questionsPrecoding allows the respondent to simply circle the right answer.
! End the questionnaire in a proper wayRespondents should be thanked for their participation.
Source: Sudman & Blair (1998)
UUnniivveerrssiittyy ooff PPrreettoorriiaa eettdd –– CCooeettzzeeee,, MM ((22000055))

7.4
Although Leedy (1996) outlines general requirements for a good questionnaire, he emphasises the
important role that questions play. Table 7.3 summarises the requirements which Leedy regards as
essential to a good questionnaire.
TABLE 7.3: LEEDY’S REQUIREMENTS FOR A GOOD QUESTIONNAIRE
! Instructions must be clear and unambiguous.
! A cover letter must accompany the questionnaire and clearly state for what purposes the
information is needed.
! Questions must be clear, understandable and objective.
! The questionnaire must be as short as possible.
! A logical flow of questions and sections must exist.
! The questionnaire must be directly related to the research problem.
Source: Leedy (1996)
7.2.1.2 The design of a questionnaire
The design of a questionnaire plays a crucial role in the success of the research. Saunders, Lewis and
Thornhill (1997) regard the following as the principal steps in the design of a questionnaire:
! Determine information goals and identify the population.
! Decide which questions need to be asked.
! Identify the respondents’ frame of reference.
! Formulate the questions.
! Pretest the questionnaire.
! Revise the questionnaire.
! Compile the final questionnaire.
The first step in the design of a questionnaire involves the translation of the research objectives into
information goals for the formulation of specific questions. Once the list of questions has been finalised,
it should cover all information goals and research objectives.
7.2.1.3 Creating an item pool (questions)
Once the scope and range of the content have been identified, the actual task of creating questions (items)
can begin. No existing data-analytic technique can remedy serious deficiencies in an item pool. The
creation of the initial pool of questions is thus a crucial stage in questionnaire development. The
fundamental goal at this stage is to systematically sample all content that is potentially relevant to the topic
under study. Two key implications of this principle are that the initial pool of questions (1) should be
broader and more comprehensive than one’s own theoretical view of the topic being researched, and (2)
should include content that will ultimately be shown to be tangential or even unrelated to the research
UUnniivveerrssiittyy ooff PPrreettoorriiaa eettdd –– CCooeettzzeeee,, MM ((22000055))
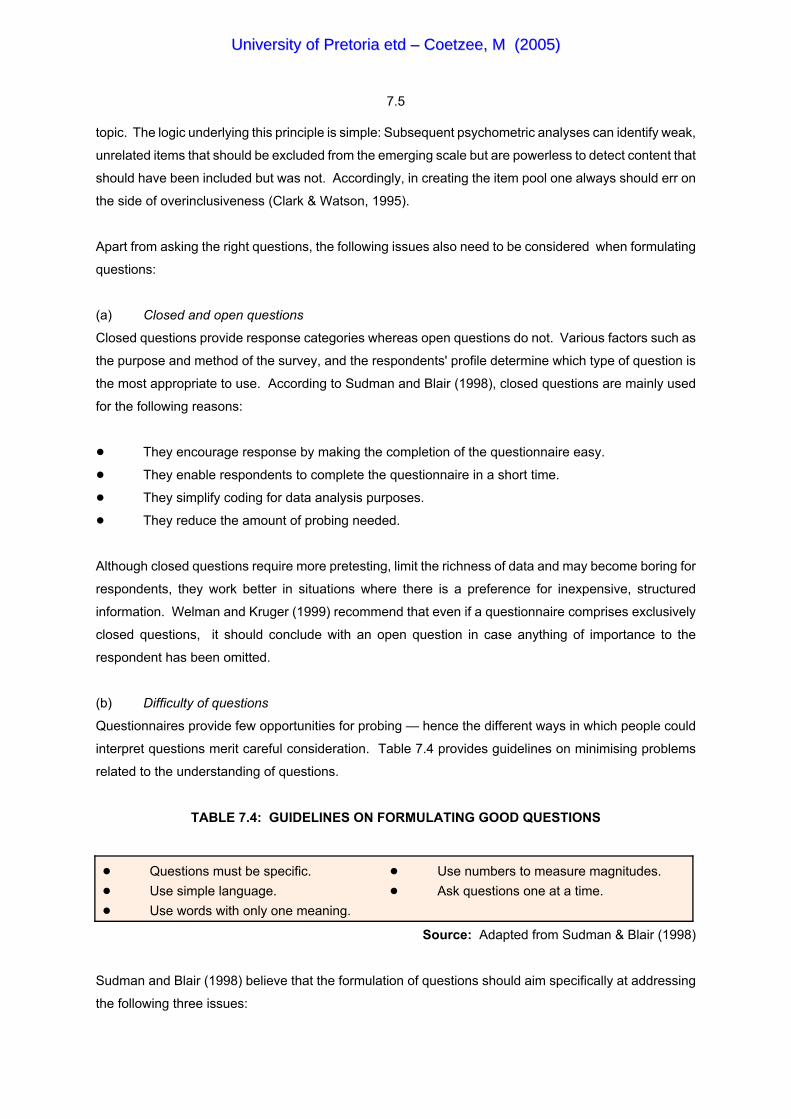
7.5
topic. The logic underlying this principle is simple: Subsequent psychometric analyses can identify weak,
unrelated items that should be excluded from the emerging scale but are powerless to detect content that
should have been included but was not. Accordingly, in creating the item pool one always should err on
the side of overinclusiveness (Clark & Watson, 1995).
Apart from asking the right questions, the following issues also need to be considered when formulating
questions:
(a) Closed and open questions
Closed questions provide response categories whereas open questions do not. Various factors such as
the purpose and method of the survey, and the respondents' profile determine which type of question is
the most appropriate to use. According to Sudman and Blair (1998), closed questions are mainly used
for the following reasons:
! They encourage response by making the completion of the questionnaire easy.
! They enable respondents to complete the questionnaire in a short time.
! They simplify coding for data analysis purposes.
! They reduce the amount of probing needed.
Although closed questions require more pretesting, limit the richness of data and may become boring for
respondents, they work better in situations where there is a preference for inexpensive, structured
information. Welman and Kruger (1999) recommend that even if a questionnaire comprises exclusively
closed questions, it should conclude with an open question in case anything of importance to the
respondent has been omitted.
(b) Difficulty of questions
Questionnaires provide few opportunities for probing — hence the different ways in which people could
interpret questions merit careful consideration. Table 7.4 provides guidelines on minimising problems
related to the understanding of questions.
TABLE 7.4: GUIDELINES ON FORMULATING GOOD QUESTIONS
! Questions must be specific. ! Use numbers to measure magnitudes.! Use simple language. ! Ask questions one at a time.! Use words with only one meaning.
Source: Adapted from Sudman & Blair (1998)
Sudman and Blair (1998) believe that the formulation of questions should aim specifically at addressing
the following three issues:
UUnniivveerrssiittyy ooff PPrreettoorriiaa eettdd –– CCooeettzzeeee,, MM ((22000055))

7.6
(1) Do the respondents understand the words in the question?
(2) Do all the respondents interpret the question in the same way?
(3) Do the respondents interpret the question in the way it is intended?
(c) Scaling of questions
Scaling is a process of creating a continuum on which objects are located according to the number of the
measured characteristics they possess ( Aaker et al, 1995). The Likert scale is presently the most popular
type of scale used for this purpose. This scale consists of a collection of statements about the attitudinal
object. For each statement, respondents have to indicate the degree to which they agree or disagree with
its content on, say, a four-point scale (Welman & Kruger, 1999). The number of response categories that
can be used for closed questions depends on the method of administration. By making use of an even
number of response categories, the central tendency effect can be eliminated. According to Welman and
Kruger (1999), the error of central tendency can further be eliminated by avoiding statements which reflect
extreme positions (eg “I would never discriminate against a person from a previously disadvantaged
group”).
Possible answers were coded with numerical values and represented indefinite quantities, such as the
extent to which employees agreed with the statements. According to Schepers (1991), the equal interval
quality of a scale is lost if more than two points are anchored. It is therefore better to use an intensity
response scale in which only the two extreme categories are labelled. An example of the scale used in
this study is as follows:
6-point scale
Strongly disagree Strongly agree
1 2 3 4 5 6
(d) Ordering of questions
Sudman and Blair (1998) regard the ordering of questions as important for three main reasons: (1) the
order effects must be considered; (2) a logical flow for the questionnaire must be developed and (3) a
rapport must be established with the respondents.
Questions should be arranged in a sequence that minimises order effects. An order effect occurs when
the answer to a particular question is influenced by the context of previous questions. In order to create
a logical flow of questions, the questions must be divided into sections, each with a specific purpose in
mind. To elicit a favourable response for the completion of the questionnaire, the questionnaire must start
with easy, nonthreatening questions for which there are no wrong answers. By establishing a rapport with
respondents, one can obtain better cooperation.
UUnniivveerrssiittyy ooff PPrreettoorriiaa eettdd –– CCooeettzzeeee,, MM ((22000055))

7.7
With the aforementioned as background, the next section will discuss the design of the questionnaire used
for the empirical research.
7.3 THE LAYOUT OF THE QUESTIONNAIRE USED IN THIS STUDY
7.3.1 Type of questionnaire used
It was decided to use a structured questionnaire for this study (see appendix B). A structured
questionnaire provides alternatives to each question, and the respondent simply needs to select and mark
the applicable answer.
For financial reasons, the cover letter (see appendix A) and the questionnaire (see appendix B) were
drawn up in English only.
7.3.2 Layout of the questionnaire
Survey questionnaires are normally used to obtain the following types of information from respondents:
biographical particulars (age, gender, ethnicity, and so on), typical behaviour, opinions and beliefs, and
attitudes. For this study, the questionnaire was therefore developed for collecting information on
employees’ biographical details, their perceptions and attitudes towards AA fairness, their perceptions on
the treatment of employees from designated groups in the workplace and their commitment. The
questionnaire used in this study consisted mainly of closed questions because such questions are usually
self-explanatory and can be answered with ease in a short period of time (see appendix B). The layout
of the questionnaire is provided in table 7.5.
TABLE 7.5: LAYOUT OF THE QUESTIONNAIRE
SECTION TOPIC OF SECTION NO OF QUESTIONS
A Personal particulars (biographical data) 13
B Perceptions on the fairness of AA 40
C Treatment of AA employees in the workplace 26
D Commitment 37
Total number of questions 116
Section A consisted of questions related to the respondents’ personal particulars and merely required the
respondents to make an “x” in the appropriate block. These questions referred to respondents’ gender,
ethnicity, age, marital status, job position, number of years of service in current position, number of years
UUnniivveerrssiittyy ooff PPrreettoorriiaa eettdd –– CCooeettzzeeee,, MM ((22000055))
7.8
of service at the bank, staff category, highest educational level, monthly gross salary, and whether the
appointment was on the basis of affirmative action.
The questions contained in section B of the questionnaire were related to the respondents’ perceptions
of what influences the fairness of affirmative action, and consisted of six-point Likert-type items with
anchors ranging from 1 = “not at all" to 6 = “to a great extent”.
Section C consisted of questions about the treatment of affirmative action employees in the workplace.
For the measurement of affirmative action employees’ treatment in the workplace, new items as well as
existing items from questionnaires used in previous research, were used. The literature study provided
the basis for the development of new items.
Section D consisted of questions about employees’ work behaviour. The purpose of these questions was
to determine their commitment level. As in the case of section C, new items as well as existing items from
questionnaires used in previous research, were used.
7.3.3 Appearance of the questionnaire
The physical layout of the questionnaire plays a vital role in a respondent’s decision whether or not to
complete it. Aaker et al (1995) regard the quality of the paper, the clarity of reproduction and the
appearance of crowding as important factors. For this study the questionnaire was printed on good quality
green paper and bound in booklet format. Ample space was allowed between the questions as well as
between the sections. Clear instructions on how to complete the questionnaire were also provided.
Time constraints also have a direct influence on respondents’ willingness to complete the questionnaire.
If the questions are too difficult or too time-consuming to complete, the respondents tend not to complete
the questionnaire. Although this questionnaire consisted of 116 questions — which is a fairly large
number of questions — the questions were formulated in a simple way which made it relatively easy for
the respondents. Approximately 30 minutes were needed to complete the questionnaire for this study.
7.4 PRETESTING OF THE QUESTIONNAIRE
The purpose of pretesting is to ensure that the questionnaire meets the researcher’s expectations in terms
of the information that will be obtained from it. Questionnaire pretesting is one way of identifying and
eliminating those questions that could pose problems. Only after all the deficiencies have been corrected,
can the final questionnaire be compiled and distributed. The best way to test a questionnaire is to have
as many people as possible look at it.
Because a pretest is a pilot run, the respondents should be reasonably representative of the sample
population (Aaker et al, 1995). In this study, a formal pretest was not done but inputs were obtained from
UUnniivveerrssiittyy ooff PPrreettoorriiaa eettdd –– CCooeettzzeeee,, MM ((22000055))

7.9
human resource experts, trade union officials and employees from different ethnic groups and genders.
The assistance of a statistician was also obtained. Once the inputs had been received, the final
questionnaire was compiled and distributed.
7.5 DISTRIBUTION OF THE QUESTIONNAIRES
The next step involved the distribution of questionnaires to the employees selected. A cover letter
explaining the purpose of the questionnaire and signed by the bank’s human resource manager,
accompanied each questionnaire. Appendix A provides an example of the cover letter.
Since the bank’s employees work in branches all over the country, a detailed address list had to be
obtained. Thereafter an envelope had to be addressed to each individual employee. The fact that the
bank could not provide any assistance in terms of distributing the questionnaires via a centralised internal
posted service, complicated the distribution of questionnaires and made it extremely time-consuming and
expensive.
7.6 COMPUTERISATION AND CODING OF THE DATA
Data obtained from the questionnaires must undergo preliminary preparation before they can be analysed.
Data preparation includes (1) data editing, (2) coding, and (3) statistical adjustment of the data (Aaker et
al, 1995).
Upon receipt of the questionnaires, each questionnaire was edited to identify omissions, ambiguities and
errors in the responses. Questionnaires that were completed in such a way that the results could be
distorted were discarded. Illegible or missing answers were coded as “missing”. This simplified the data
analysis, but did not distort any interpretations of the data.
Coding the closed questions was fairly straightforward because the questionnaire made provision for
response values and a column which were used for variable identification. Once the response values had
been entered into a computer, a program, the Statistical Package for the Social Sciences (SPSS), was
employed to generate diagnostic information.
7.7 POPULATION AND SAMPLING
The populations that interest human behavioural scientists are often so large that, from a practical point
of view, it is simply impossible to conduct research on all of them. Consequently, researchers have to
obtain data from a sample of the population.
UUnniivveerrssiittyy ooff PPrreettoorriiaa eettdd –– CCooeettzzeeee,, MM ((22000055))

7.10
The sample consisted of employees from a leading bank in South Africa. To obtain the sample, a letter
requesting a list of all permanent employees, categorised according to ethnicity, gender and job category,
was sent to the human resource manager at the bank.
A disproportionate, stratified sampling method was used. Stratified sampling involves separating the
population into subgroups called “strata”, and then randomly drawing a sample from each stratum
(subgroup). In this study the subgroups were determined according to ethnicity, gender and staff category.
With regard to ethnicity, employees from other population groups (blacks, coloureds and Asians) were
treated as a single component of ethnicity. Regarding staff category, employees from top management,
middle management and supervisory level were treated as a single component. Once this process had
been completed, a list of employees was drawn from each group. Table 7.6 provides a representation of
the grouping of employees, the population and sample size of each employee group as well as the
response and response rate.
TABLE 7.6: POPULATION, SAMPLE AND RESPONSE RATE OF EACH GROUP
POPULATION SAMPLE RESPONSE RESPONSERATE
ETHNICITYBlacksWhites
12 007 (40%)17 681 (60%) 100%
6881 032
128221
18,6%21,4%
GENDERMenWomen
10 088 (34%)19 600 (66%) 100%
5851 135
120229
20,5% 20,2%
STAFF CATEGORYTop management Middle managementSupervisory level
253 5 975 2 502
29% 498
168
33,7%
Clerical staff 20 958 71% 100% 1 222 181 14,8%
TOTAL 29 688 1 720 349 20,3%
The general principles that need to be considered in determining the desirable sample size include
! the size of the population
! the variance (heterogeneity) of the variable being measured
! the homogeneity of each stratum
! the anticipated response rate
The size of the sample was mainly determined by the extent to which important cross-classifications had
to be made. The need to compare the different employee strata (eg white, female, supervisors) with
various perceptions of affirmative action fairness, necessitated the use of a larger sample size than
normally required. According to Stoker (1981), the size of the sample should be in proportion to /N with
UUnniivveerrssiittyy ooff PPrreettoorriiaa eettdd –– CCooeettzzeeee,, MM ((22000055))
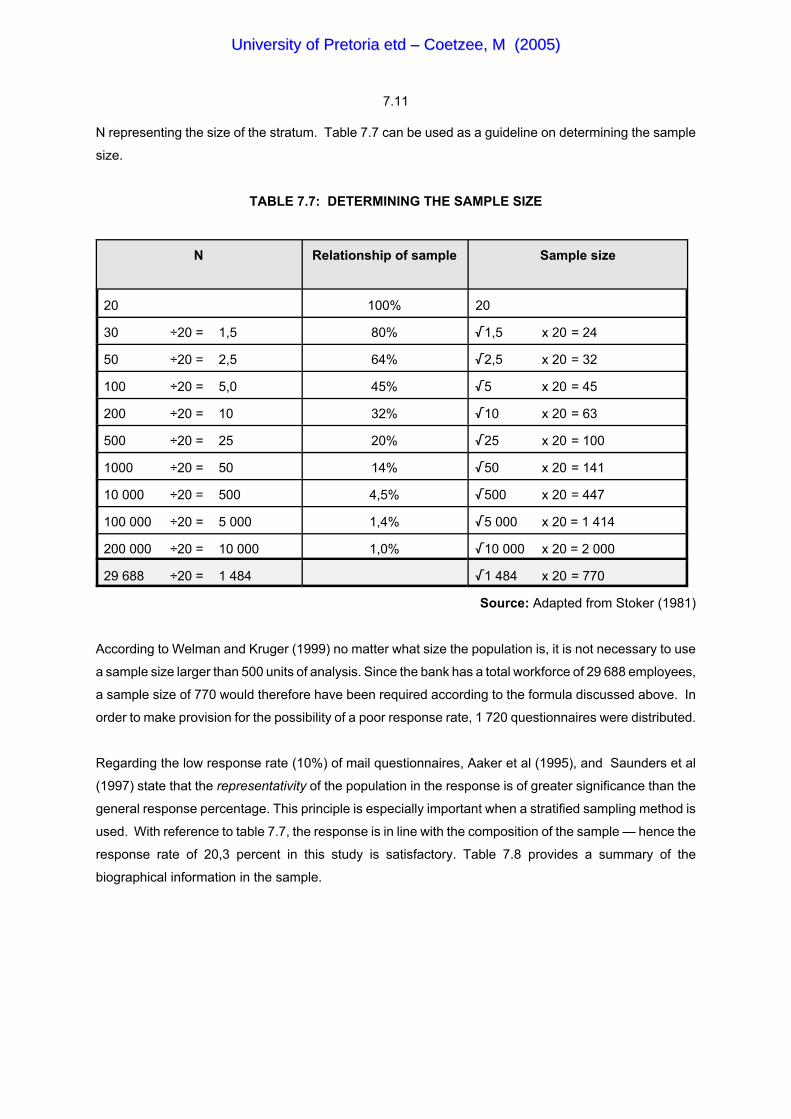
7.11
N representing the size of the stratum. Table 7.7 can be used as a guideline on determining the sample
size.
TABLE 7.7: DETERMINING THE SAMPLE SIZE
N Relationship of sample Sample size
20 100% 20
30 ÷20 = 1,5 80% /1,5 x 20 = 24
50 ÷20 = 2,5 64% /2,5 x 20 = 32
100 ÷20 = 5,0 45% /5 x 20 = 45
200 ÷20 = 10 32% /10 x 20 = 63
500 ÷20 = 25 20% /25 x 20 = 100
1000 ÷20 = 50 14% /50 x 20 = 141
10 000 ÷20 = 500 4,5% /500 x 20 = 447
100 000 ÷20 = 5 000 1,4% /5 000 x 20 = 1 414
200 000 ÷20 = 10 000 1,0% /10 000 x 20 = 2 000
29 688 ÷20 = 1 484 /1 484 x 20 = 770
Source: Adapted from Stoker (1981)
According to Welman and Kruger (1999) no matter what size the population is, it is not necessary to use
a sample size larger than 500 units of analysis. Since the bank has a total workforce of 29 688 employees,
a sample size of 770 would therefore have been required according to the formula discussed above. In
order to make provision for the possibility of a poor response rate, 1 720 questionnaires were distributed.
Regarding the low response rate (10%) of mail questionnaires, Aaker et al (1995), and Saunders et al
(1997) state that the representativity of the population in the response is of greater significance than the
general response percentage. This principle is especially important when a stratified sampling method is
used. With reference to table 7.7, the response is in line with the composition of the sample — hence the
response rate of 20,3 percent in this study is satisfactory. Table 7.8 provides a summary of the
biographical information in the sample.
UUnniivveerrssiittyy ooff PPrreettoorriiaa eettdd –– CCooeettzzeeee,, MM ((22000055))

7.12
TABLE 7.8: BIOGRAPHICAL DATA OF RESPONDENTS
VARIABLE FREQUENCY PERCENT AVERAGE
GENDERMaleFemale
120229
34,4%65,6%
ETHNICITYBlack, coloured & AsianWhites
49 + 57 + 22 = 128221
37,0%63,0%
MARITAL STATUSSingleMarried
132216
37,8%61,9 % (missing = 1)
AGE19 - 32 years33 - 46 years47 - 62 years
135135 73
39,3%39,3%21,4%
37 years
YEARS IN CURRENT POSITION1 - 2 years> 3 years
159184
46,4%53,6% (missing = 6)
4,49 years
YEARS' SERVICE AT BANK1 - 7 years8 - 39 years
182163
52,0%46,0% (missing = 4)
10,35 years
STAFF CATEGORYTop/middle management &supervisorsClerical staff
13 + 98 + 57 = 168181
48,0%52,0%
HIGHEST QUALIFICATIONGrade 12 and lowerCertificate/DiplomaDegree
171110 75
49,0%31,5%18,7% (missing = 3)
3,11(certificate ordiploma)
MONTHLY GROSS SALARYR5 000 or lessR5 001 - R15 000R15 001 and more
159112 70
45,6%32,1%20,0% (missing = 8)
2,41R8 830 pm
EE APPOINTMENTYesNoNot sure
44226 75
12,6%64,8%21,5% (missing = 4)
(N = 349)
UUnniivveerrssiittyy ooff PPrreettoorriiaa eettdd –– CCooeettzzeeee,, MM ((22000055))


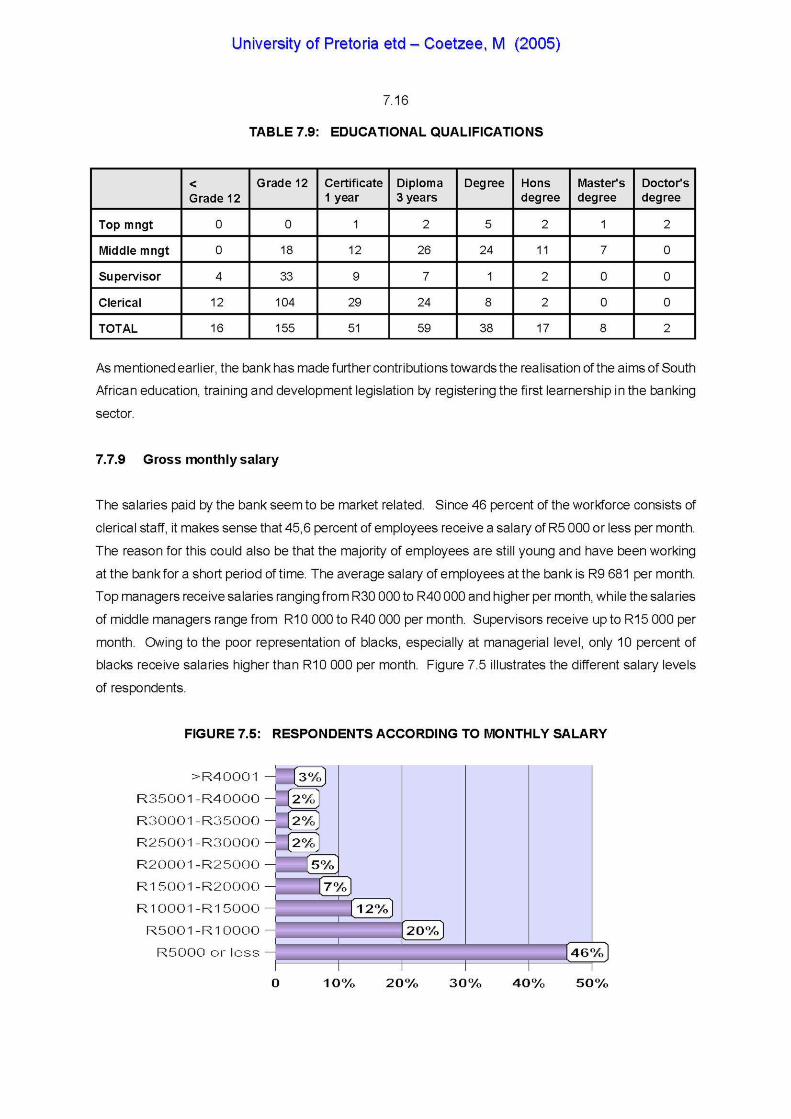
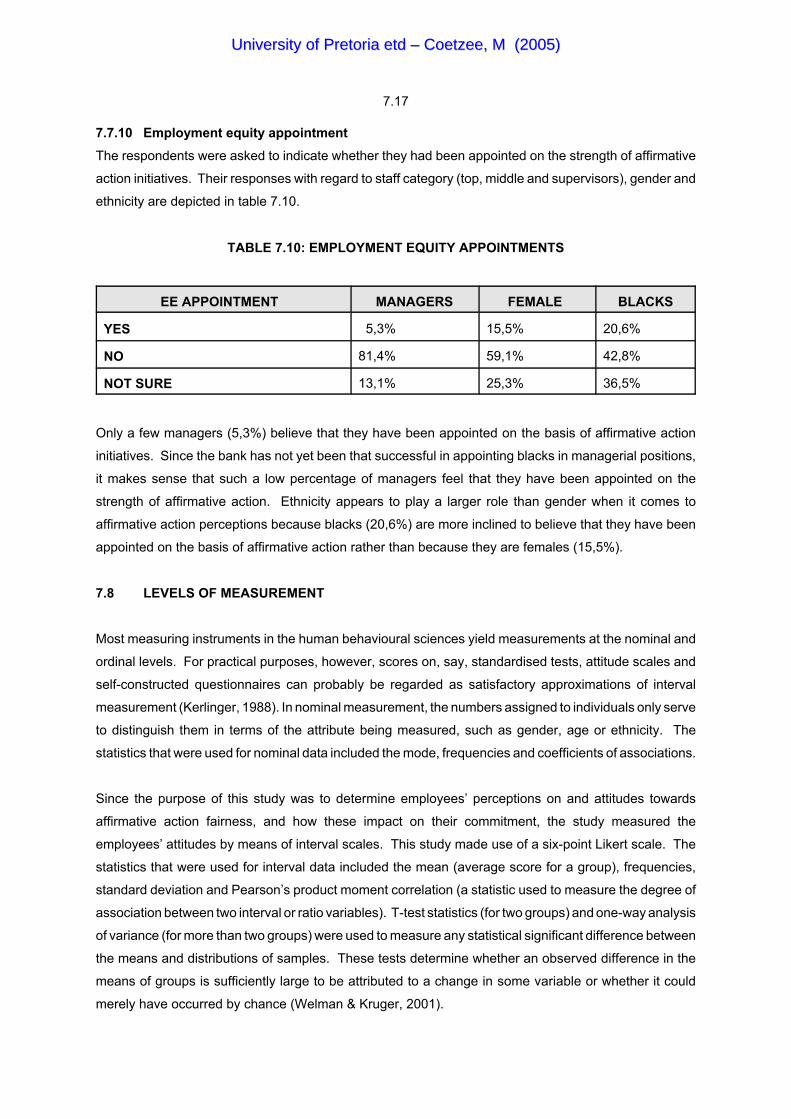
7.17
7.7.10 Employment equity appointmentThe respondents were asked to indicate whether they had been appointed on the strength of affirmative
action initiatives. Their responses with regard to staff category (top, middle and supervisors), gender and
ethnicity are depicted in table 7.10.
TABLE 7.10: EMPLOYMENT EQUITY APPOINTMENTS
EE APPOINTMENT MANAGERS FEMALE BLACKS
YES 5,3% 15,5% 20,6%
NO 81,4% 59,1% 42,8%
NOT SURE 13,1% 25,3% 36,5%
Only a few managers (5,3%) believe that they have been appointed on the basis of affirmative action
initiatives. Since the bank has not yet been that successful in appointing blacks in managerial positions,
it makes sense that such a low percentage of managers feel that they have been appointed on the
strength of affirmative action. Ethnicity appears to play a larger role than gender when it comes to
affirmative action perceptions because blacks (20,6%) are more inclined to believe that they have been
appointed on the basis of affirmative action rather than because they are females (15,5%).
7.8 LEVELS OF MEASUREMENT
Most measuring instruments in the human behavioural sciences yield measurements at the nominal and
ordinal levels. For practical purposes, however, scores on, say, standardised tests, attitude scales and
self-constructed questionnaires can probably be regarded as satisfactory approximations of interval
measurement (Kerlinger, 1988). In nominal measurement, the numbers assigned to individuals only serve
to distinguish them in terms of the attribute being measured, such as gender, age or ethnicity. The
statistics that were used for nominal data included the mode, frequencies and coefficients of associations.
Since the purpose of this study was to determine employees’ perceptions on and attitudes towards
affirmative action fairness, and how these impact on their commitment, the study measured the
employees’ attitudes by means of interval scales. This study made use of a six-point Likert scale. The
statistics that were used for interval data included the mean (average score for a group), frequencies,
standard deviation and Pearson’s product moment correlation (a statistic used to measure the degree of
association between two interval or ratio variables). T-test statistics (for two groups) and one-way analysis
of variance (for more than two groups) were used to measure any statistical significant difference between
the means and distributions of samples. These tests determine whether an observed difference in the
means of groups is sufficiently large to be attributed to a change in some variable or whether it could
merely have occurred by chance (Welman & Kruger, 2001).
UUnniivveerrssiittyy ooff PPrreettoorriiaa eettdd –– CCooeettzzeeee,, MM ((22000055))

7.18
Most studies have treated organisational justice as a dependent variable, measuring the perceptions of
organisational justice of some situation. One of the better uses of a measure of organisational justice
would be to compare and distinguish between perceptions of fairness and related concepts, such as the
treatment of affirmative action employees and employee commitment. Here perceptions of affirmative
action fairness would act as a dependent variable and the treatment of affirmative action employees as
the independent variables. In instances where the biographical factors of employees were used to
determine their effect on the perceptions of and attitude towards affirmative action fairness, the
biographical factors became the independent variables and the perceptions and attitudes of employees
regarding affirmative action fairness and the treatment of affirmative action employees, the dependent
variables. The research, for example, could indicate that women (independent variable) are more
concerned about being treated with respect (dependent variable) than men.
7.9 STATISTICAL METHODS
Various factors have to be considered before an appropriate statistical method for data interpretation can
be selected. In this research, the sample size and the number of variables that needed to be analysed
simultaneously, were the determining factors. To address these issues properly, a number of statistical
techniques were used as the basis for the interpretation of the data. These included univariate and
multivariate data analysis, correlations and factor analysis. Issues such as means and standard deviations,
as well as the level of statistical significance, were also considered. However, before the data could be
interpreted, it was necessary to consider the question of parametric versus nonparametric statistics.
One of the issues that is often raised in survey research is whether the statistical technique used for the
interpretation of the data, is the most suitable. Two types of statistics, namely parametric and
nonparametric are available for research. According to Kerlinger (1988), a parametric statistical test
depends on a number of assumptions about the population from which the samples used in the test are
drawn. The best-known assumption is that the population scores are normally distributed, the variances
of the groups are equal and the dependent variable is approximate interval scale (Morgan & Griego, 1998).
A nonparametric or distribution-free statistical test depends on no assumptions about the form of the
sample population or the values of the population parameters.
There is huge controversy about the use of the two types of statistics. Gardner (1975) has no objection
to the use of parametric statistics, whereas Bradley (1972) advocates nonparametric methods — both
viewpoints are compelling and valid. However, in the light of Kerlinger’s (1988) remarks that the best
advice is to use parametric statistics as well as the analysis of variance routinely but to keep a sharp eye
on the data for gross departures from normality, the researcher decided to adopt this approach in this
study.
UUnniivveerrssiittyy ooff PPrreettoorriiaa eettdd –– CCooeettzzeeee,, MM ((22000055))
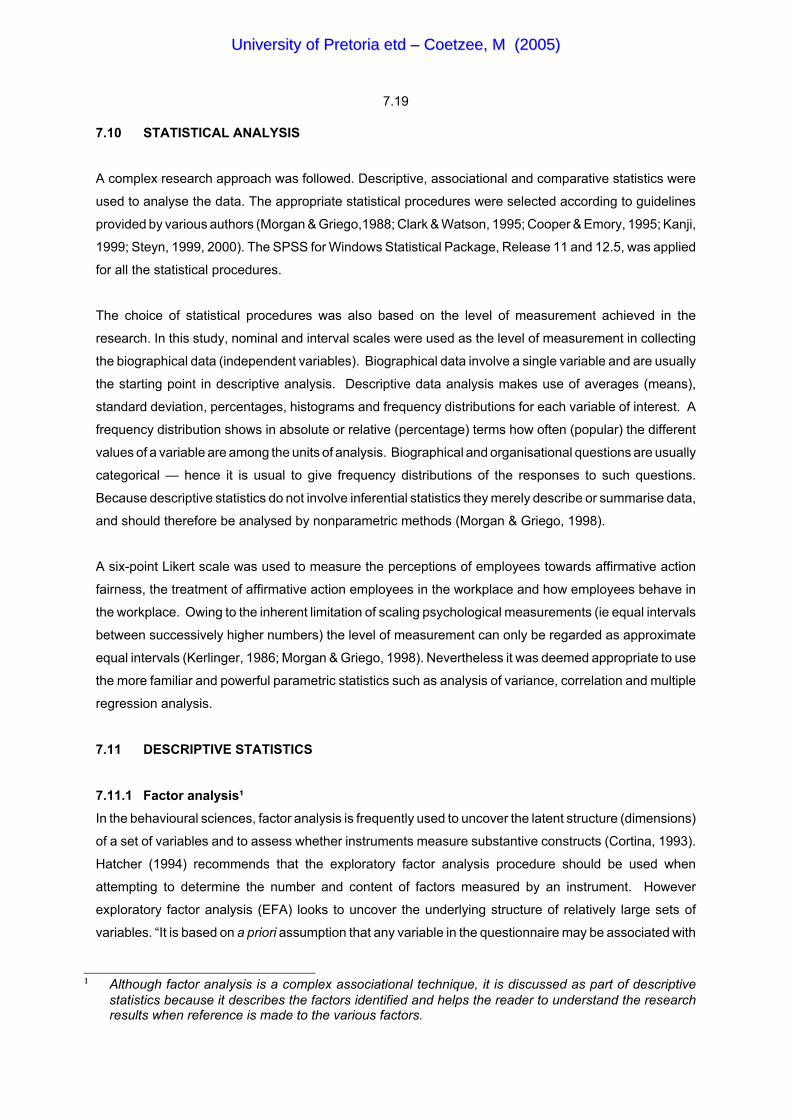
7.19
_____________________________¹ Although factor analysis is a complex associational technique, it is discussed as part of descriptive
statistics because it describes the factors identified and helps the reader to understand the researchresults when reference is made to the various factors.
7.10 STATISTICAL ANALYSIS
A complex research approach was followed. Descriptive, associational and comparative statistics were
used to analyse the data. The appropriate statistical procedures were selected according to guidelines
provided by various authors (Morgan & Griego,1988; Clark & Watson, 1995; Cooper & Emory, 1995; Kanji,
1999; Steyn, 1999, 2000). The SPSS for Windows Statistical Package, Release 11 and 12.5, was applied
for all the statistical procedures.
The choice of statistical procedures was also based on the level of measurement achieved in the
research. In this study, nominal and interval scales were used as the level of measurement in collecting
the biographical data (independent variables). Biographical data involve a single variable and are usually
the starting point in descriptive analysis. Descriptive data analysis makes use of averages (means),
standard deviation, percentages, histograms and frequency distributions for each variable of interest. A
frequency distribution shows in absolute or relative (percentage) terms how often (popular) the different
values of a variable are among the units of analysis. Biographical and organisational questions are usually
categorical — hence it is usual to give frequency distributions of the responses to such questions.
Because descriptive statistics do not involve inferential statistics they merely describe or summarise data,
and should therefore be analysed by nonparametric methods (Morgan & Griego, 1998).
A six-point Likert scale was used to measure the perceptions of employees towards affirmative action
fairness, the treatment of affirmative action employees in the workplace and how employees behave in
the workplace. Owing to the inherent limitation of scaling psychological measurements (ie equal intervals
between successively higher numbers) the level of measurement can only be regarded as approximate
equal intervals (Kerlinger, 1986; Morgan & Griego, 1998). Nevertheless it was deemed appropriate to use
the more familiar and powerful parametric statistics such as analysis of variance, correlation and multiple
regression analysis.
7.11 DESCRIPTIVE STATISTICS
7.11.1 Factor analysis¹In the behavioural sciences, factor analysis is frequently used to uncover the latent structure (dimensions)
of a set of variables and to assess whether instruments measure substantive constructs (Cortina, 1993).
Hatcher (1994) recommends that the exploratory factor analysis procedure should be used when
attempting to determine the number and content of factors measured by an instrument. However
exploratory factor analysis (EFA) looks to uncover the underlying structure of relatively large sets of
variables. “It is based on a priori assumption that any variable in the questionnaire may be associated with
UUnniivveerrssiittyy ooff PPrreettoorriiaa eettdd –– CCooeettzzeeee,, MM ((22000055))
7.20
any factor. There is no prior theory and one uses factor loadings to intuit the factor structure of the data"
(www2.chass.ncsu.edu. 2002:2).
As mentioned previously, there are primarily two methods of extracting the factors from a set of data:
principal components analysis or principal factor analysis. The method chosen will matter more to the
extent that the sample is small, the variables are few, and/or the communality estimates of the variables
differ. Principal components analysis is the more common method and seeks the set of factors which can
account for all the common and unique variance in a set of variables. Principal factor analysis seeks the
least number of factors which can account for the common variance (correlation) of a set of variables and
thus do not consider unique variances. Principal factor analysis thus accounts for the covariation among
variables whereas principal components analysis accounts for the total variance of variables.
In the present study, a principal factor analysis was done for each of the sections, namely: (1) the
employees' perceptions of the fairness of affirmative action, (2) the treatment of AA employees in the
workplace, and (3) behaviour in the workplace. The statistical software package SPSS for Windows was
used for the majority of statistical procedures.
The steps followed in the factor analysis were as follows:
7.11.1.1 Computing of a matrix of correlations between the items
7.11.1.2 Subjecting the correlation matrix to a factor analysis
7.11.1.3 Deciding on the number of factors (dimensions) to be extracted
In the present study, the eigenvalues were plotted against the factor numbers and Catell’s so-called “scree
test” was performed which involved studying the slope of the plotted eigenvalues (Kimm & Mueller, 1978).
The eigenvalue for a given factor measures the variance in all the variables which is accounted for by that
factor. If a factor has a low eigenvalue, then it is contributing little to the explanation of variances in the
variables and may be ignored. For the purposes of this study, all factors with eigenvalues lower than one
were ignored. An inspection of the eigenvalues usually reveals a drop since the first factor provides the
largest eigenvalue and thereafter the eigenvalues drop until they become insignificant (lower than one).
The point at which the graph levels off indicates the number of factors to be extracted.
7.11.1.4 Extracting an x-number of factors
Criteria for determining the number of factors include the following:
! Kaiser criterion. Dropping all factors with eigenvalues under 1.
! Scree plot. The Cattell scree test plots the factors as the X axis and the corresponding eigenvalues
as the Y axis. As one moves to the right, the eigenvalues drop. When the drop ceases and the
UUnniivveerrssiittyy ooff PPrreettoorriiaa eettdd –– CCooeettzzeeee,, MM ((22000055))
7.21
curve makes an elbow towards a less steep decline, Cattell’s scree test recommends dropping all
further factors after the one starting the elbow.
! Variance explained criteria. Some researchers simply use the rule of keeping enough factors to
account for 90 percent (sometimes 80 percent) of the variation.
! Comprehensibility. Although not a strictly mathematical criterion, many researchers limit the number
of factors to those whose dimension of meaning is readily comprehensible. Often this is the first two
or three. This study made use of the Kaiser criterion, scree plot test and comprehensibility of factors
to determine the number of factors to be extracted.
7.11.1.5 Rotating the factor solution to a more interpretable solution
Rotation serves to make the output more understandable and is usually necessary to facilitate the
interpretation of factors. The sum of eigenvalues is not affected by rotation, but rotation will alter the
eigenvalues of particular factors and will change the factor loadings. Since multiple rotations may explain
the same variance but may have different factor loadings, and since factor loadings are used to intuit the
meaning of factors, different meanings may be ascribed to the factors, depending on the rotation — a
problem some cite as a drawback to factor analysis. The Varimax rotation is orthogonal, which means
that the factors remain uncorrelated throughout the rotation process. In this study, the Varimax rotation
was used because it is the most common rotation option and yields results which make it as easy as
possible to identify each variable with a single factor (Morgan & Griego, 1998).
The Varimax rotation results in a factor matrix and the values in the matrix are called factor loadings. By
studying all those items that have high loadings on a particular factor, and asking oneself what the
common nature of these items is, one might be able to infer the nature of the factor. The challenge is to
give such a factor a theoretical name that describes it as a dimension or factor. All significant factor
loadings are typically used in the interpretation process, but variables with higher loadings influence to a
greater extent the name selected to represent a factor.
This study considered as significant all factor loadings higher than or equal to 0,40. This cut-off point of
0.40 is largely arbitrary and cannot be applied mechanically. The researcher should also use judgement
based on theoretical considerations. It may happen, for instance, that an item shows a high loading on
two or more factors, in which case the researcher must decide to which factor the item should belong. The
exclusion of relevant variables and the inclusion of irrelevant variables in the correlation matrix being
factored will affect, often substantially, the factors which are uncovered. Knowing the factorial structure
in advance helps one to select the variables to be included and yields the best analysis of factors.
However, this is not simply a matter of including all relevant variables or deleting variables arbitrarily in
order to have a “cleaner” factorial solution, because this will result in erroneous conclusions about the
factor structure (Kim & Mueller, 1978). In order to determine which variables to keep, this study
UUnniivveerrssiittyy ooff PPrreettoorriiaa eettdd –– CCooeettzzeeee,, MM ((22000055))

7.22
considered the factor loadings, the cross-loading of items on more than one factor, and the reliability and
importance of a variable according to the theory.
7.11.2 Reliability analysis
The internal consistency reliability test is of particular importance because it measures the degree to which
all the items in a measurement/test measure the same attribute. Internal consistency thus implies a high
degree of generalisability across the items within the test. Cronbach’s alpha is the most common estimate
of internal consistency of items in a scale.
The Cronbach alpha coefficient and inter-item correlation coefficients are used to assess the internal
consistency of the measuring instrument (Clark & Watson, 1995). Coefficient alpha reflects important
information on the proportion of error variance contained in a scale. Owing to the multiplicity of the items
measuring the factors, the Cronbach coefficient alpha is often considered to be the most suitable since
it has the most utility of multi-item scales at the internal level of measurement (Cooper & Emory, 1995).
In addition to estimating internal consistency from the average correlation, the formula for alpha also takes
into account the number of items according to the theory that the more items there are, the more reliable
a scale will be. The widely accepted social science cutoff is that alpha should be 0.70 or higher for a set
of items to be considered a scale. That 0.70 is as low as one may wish to go is reflected in the fact that
when alpha is 0.70, the standard error of measurement will be over half (0.55) a standard deviation
(Morgan & Griego, 1998). Alpha is a sound measure of error variance, and can be used to confirm the
unidimensionality of a scale, or to measure the strength of a dimension once the existence of a single
factor has been determined (Cortina, 1993)
The internal consistency coefficient, cronbach alpha, was computed for each of the factors identified, and
is discussed in the next chapter.
7.11.3 Analysis of item distribution
Descriptive statistics (eg means, standard deviations, skewness and kurtosis) were used to analyse the
distribution of the values of each item included in the different factors. Measures of location (mean),
spread (standard deviation), and shape (skewness and kurtosis) were calculated. According to Cooper
and Schindler (2003), the mean and standard deviation are called dimensional measures (in other words,
expressed in the same units as the measured quantities). By contrast, skewness (sk) and kurtosis (ku)
are regarded as nondimensional measures. Skewness is an index that characterises only the shape of
the distribution. When sk is approximately 0, a distribution approaches symmetry . Kurtosis is a measure
of a distribution’s “peakness/flatness”. According to Cooper and Schindler (2003), there are three different
types of kurtosis:
UUnniivveerrssiittyy ooff PPrreettoorriiaa eettdd –– CCooeettzzeeee,, MM ((22000055))

7.23
• peaked or leptokurtic distributions — scores cluster heavily in the centre (a positive ku value)
• flat or platykurtic distributions — evenly distributed scores and facts flatter than a normal distribution
(a negative ku value)
• intermediate or mesokurtic distributions — neither too peaked nor too flat (a ku value close to 0)
As with skewness, the larger the absolute value of the index, the more extreme the characteristic of the
index will be.
7.12 COMPARATIVE STATISTICS
7.12.1 Students’ t-testComparative statistics test for differences between groups by making use of analysis of variance. Basic
difference questions involve one independent and one dependent variable and use t-tests of ANOVA. The
t-test is appropriate when one has an independent variable with two categories and a continuous
dependent, and wishes to test the difference between the means of the various categories of the
independent variable. In this study, Students’ t-test was used to compare the mean scores for the
dependent variables between two categories within six different biographical variables.
7.12.2 One-way analysis of varianceOne-way analysis of variance (ANOVA) is used to uncover the main and interaction effects of categorical
independent variables on an interval dependent variable and is used when there is a single interval
dependent and one independent variable with three or more categories. The key statistic in ANOVA is
the F-test of difference of group means, testing if the means of the groups formed by values of the
independent variable are different enough not to have occured by chance. If the group means do not differ
significantly then one can infer that the independent variable(s) did not have an effect on the dependent
variable (www2.chass.ncsu.edu/garson/anova.htm). ANOVA assumes that the dependent variable is an
approximate interval scale, normally distributed in the population, and the variances of the groups are
equal. If the assumptions are not markedly violated, one should make use of parametric one-way ANOVA.
In this study, one-way ANOVA was used to determine the effect of education, salary and employment
equity appointments on organisational justice and the other behavioural domains since all of these
variables had three categories.
7.12.3 N-way univariate analysis of varianceThe SPSS program help function provides the following description for n-way univariate analysis of
variance:
The General Linear Model (GLM) univariate procedure provides regression analysis and
analysis of variance for one dependent variable by one or more factors and/or variables. The
factor variables divide the population into groups. Using the General Linear Model procedure,
UUnniivveerrssiittyy ooff PPrreettoorriiaa eettdd –– CCooeettzzeeee,, MM ((22000055))
7.24
it is possible to test the effects of other variables on the means of various groupings of a single
dependent variable. The interactions between factors as well as the effects of individual factors
can be investigated.
In addition, after an overall F-test has shown significance between factors (groups), post hoc tests to
evaluate differences between specific means can be applied. Estimated marginal means can be calculated
to predict mean values for the cells in the model.
7.12.4 Multivariate analysis of varianceMultiple analysis of variance (MANOVA) is used to determine the main and interaction effects of
categorical variables on multiple dependent interval variables. MANOVA, like ANOVA, makes use of one
or more categorical independents as factor variables, but unlike ANOVA, there is more than one
dependent variable. ANOVA tests the differences in the means of the interval dependent for various
categories of the independent(s), while MANOVA tests the differences in the centroid (vector) of means
of the multiple interval dependents, for various categories of the independent(s). Researchers may also
perform intended comparison or post hoc comparisons in order to determine which values of a factor
contribute most to the explanation of dependents (www2.chass.ncsu.edu).
According to the SPSS program help function, the GLM multivariate procedure provides analysis of
variance for multiple dependent variables by means of one or more factor variables or covariates. The
factor variables divide the population into groups. Using this general linear model procedure, it is possible
to test the null hypotheses about the effects of factor variables on the means of various groupings of a joint
distribution of dependent variables. Both interactions between factors and the effects of individual factors
can thus be investigated. In addition, the effects of covariates and covariate interactions with factors can
be included. After an overall F-test has shown significance, post hoc tests are used to evaluate
differences between specific means. The post hoc multiple comparison tests are performed separately
for each dependent variable.
7.13 ASSOCIATIONAL STATISTICS
7.13.1 Correlation analysisRelationships or associations also play a vital role in data analysis. Whenever it is necessary to determine
the relationship between two variables and, if there is one, the nature and strength thereof, measures of
associations or correlation analysis must be employed. Correlation analysis is not only directed at
discovering whether a relationship exists between two variables, but also analyses the direction and
magnitude of the relationship (Diamantopoulos & Schlegelmilch, 1997).
Correlations estimate the extent to which changes in one variable are associated with changes in the other
and are indicated by the correlation coefficient (r). Correlation coefficients can range from +1.00 to -1.00.
A correlation of +1.00 indicates a perfect positive relationship, a correlation of 0.00 indicates no
UUnniivveerrssiittyy ooff PPrreettoorriiaa eettdd –– CCooeettzzeeee,, MM ((22000055))
7.25
relationship, and a correlation of -1.00 indicates a perfect negative relationship (Welman & Kruger, 1999).
The magnitude of the relationship refers to the significance level of the relationship between two variables.
The significance level is used to indicate the maximum risk one is willing to take in rejecting a true null
hypothesis. Hence a significance level should always be associated with the probability of making a
mistake. Thus when one selects the 5 percent significance level (p#0,05) to conduct a hypothesis test,
one is in fact saying that one will conduct the test in such a way that one will only reject the null hypothesis
when in fact it is true — 5 times out of 100. Therefore, if the result of a test is such that the value obtained
has a probability of occurrence of less than or equal to the specified significance level, then the test result
is significant (http://www2.chass.ncsu.edu/garson/pa765/signif.thm). The level of significance used in this
study is discussed in more detail later in this chapter.
According to Diamantopoulos and Schlegelmilch (1997), the fact that two variables are related does not
prove causality. Since the influence of other variables cannot always be isolated in determining
relationships, causal inferences on the basis of correlation results cannot be drawn. All that an association
measure expresses is the degree of covariation between two variables. Since association refers to the
strength of a relationship, high levels of association between independent variables may lead to
misinterpretation of results and research inferences.
7.13.2 Multiple regression analysis
Multiple regression is a statistical technique that allows the researcher to predict the score on one variable
on the basis of scores on several other variables. Many researchers use the term “independent variables”
to identify those variables they think will influence some other so-called “dependent variable”. Independent
variables are known as predictor variables and dependent variables as criterion variables.
If two variables are correlated, then knowing the score on one variable enables the researcher to predict
the score on the other. The stronger the correlation, the closer the scores will fall to the regression line
and therefore the more accurate the prediction will be. Multiple regression is simply an extension of this
principle, where one variable is predicted on the basis of several others. In both ANOVA and multiple
regression, the researcher seeks to determine what accounts for the variance in the scores observed. In
ANOVA, he or she tries to determine how much of the variance is accounted for by the manipulation of
the independent variables. In multiple regression the researcher does not directly manipulate the
independent variables but instead, simply measures the naturally occurring levels of the variables to see
if this helps to predict the score on the dependent variable.
When performing a multiple regression analysis, attention should be focused on the beta value. This
value is a measure of how strongly each independent variable (predictor variable) influences the
dependent variable (criterion variable). The beta is measured in units of standard deviation — thus the
higher the beta value, the greater the impact of the predictor variable on the criterion variable will be.
UUnniivveerrssiittyy ooff PPrreettoorriiaa eettdd –– CCooeettzzeeee,, MM ((22000055))

7.26
Multiple correlation (R) is a measure of the correlation between the observed value and the predicted
value of the criterion variable. The R Square (R²) indicates the proportion of the variance in the criterion
variable which is accounted for by the model. In essence, this is a measure of how well a prediction of
the criterion variable can be made by knowing the predictor variables. However, R² tends to somewhat
over-estimate the success of the model, and the adjusted R² value therefore gives the most useful
measure of the success of the model.
When choosing a predictor variable, one should make sure that it correlates with the criterion variable, but
not strongly with the other predictor variables. The term "multicollinearity" is used to describe the situation
in which a high correlation is detected between two or more predictor variables. Such high correlations
cause problems when trying to draw inferences about the relative contribution of each predictor variable
to the success of the model. There are different ways to assess the relative contribution of each predictor
variable. In the “simultaneous” method (enter method), the researcher specifies the set of predictor
variables that make up the model. In the stepwise method, each predictor variable is entered in sequence
and its value assessed. If adding the variable contributes to the model then it is retained, but all other
variables in the model are then retested to see if they are still contributing to the success of the model.
If they no longer contribute significantly they are removed. This method should thus ensure that the
researcher ends up with the smallest possible set of predictor variables included in the model.
In this study, the researcher decided to use the “stepwise” multiple regression method because it results
in the most parsimonious model. This could be particularly important to determine the minimum number
of variables needed to measure and predict the criterion variable.
7.14 ANALYSIS OF COMPLIANCE WITH SPECIFIC ASSUMPTIONS
7.14.1 Sampling adequacyThe Kaiser-Meyer-Olkin test was conducted to establish whether the item intercorrelation would comply
with the criterion of sample adequacy set for factor analysis. Kaiser-Meyer-Olkin statistics are based on
partial correlation and the anti-image correlation of items. Linked to the anti-image correlation matrix is
the measure of sampling adequacy (MSA). The scores of MSA can range from zero to one, but the overall
score must be higher than 0.70 if the data are likely to factor well (Morgan & Griego, 1998). Hair,
Anderson, Tatham and Black (1998) propose the following guidelines in interpreting the Kaiser-Meyer-
Olkin’s sampling adequacy:
Outstanding : MSA > 0.90 - 1
Metorius : MSA > 0.80 – 89
Middling : MSA > 0.70 – 79
Mediocre : MSA > 0.60 – 69
Miserable : MSA > 0.50 – 59
Unacceptable : MSA < 0.50
UUnniivveerrssiittyy ooff PPrreettoorriiaa eettdd –– CCooeettzzeeee,, MM ((22000055))
7.27
If the KMO score is less than 0.50 there is no systematic covariation in the data and the variables are
essentially independent (bmj.bmjjournals.com/cgi, 13/03/2004).
7.14.2 SphericitySphericity means that data are uncorrelated. Factor analysis, however, assumes that each of the variables
in a set of variables are associated with one another. Moderate significant intercorrelations between items
are required to uncover the latent structure of a set of variables. Bartlett's test of sphericity measures the
absence of correlations between variables. Bartlett's statistics test whether a correlation matrix is an
identity matrix — that is, that the items are unrelated. A high Chi-square value with a low p value (p<0.001)
indicates a significant relationship between the items, which indicates that the data are suitable for factor
analysis (Morgan & Griego, 1998).
7.14.3 Homogeneity of varianceANOVA assumes equal variances across groups or samples. Levene’s test of homogeneity of variance
can be used to verify the assumption that the variances of groups are equal. Levene’s test statistic is
designed to test for equality of variance across groups against the alternative that variances are unequal
for at least two groups. If Levene’s F is statistically significant (p<0.05), then variances are significantly
different and the assumption of equal variances is violated (Morgan & Griego, 1998).
7.14.4 Equality of covarianceThe assumption for a multivariate approach is that the vector of the dependent variables follows a
multivariate normal distribution, and the variance-covariance matrix is equal across the cells formed by
the between–subject effects (SPSS help function).
The Box's M test tests MANOVA’s assumption of homoskedasticity using the F distribution. If p(M)<0,05,
the covariance is significantly different and the assumption of equality of covariance is violated
(www2.chass.ncsu.edu, 2002).
7.15 STATISTICAL SIGNIFICANCE
Conventionally, most researchers use the levels 0.05 and 0.01 as levels of significance for statistical tests
performed. These levels are quite severe and are used when the purpose is to limit the risk of incorrectly
rejecting the null hypotheses, or concluding a significant result erroneously. Such errors are referred to
as type-I errors. In the medical sciences, where an error could have severe consequences, such errors
must be kept low. Often, however (eg in the human sciences), the consequences of a type-I error are not
that severe and researchers are merely concerned with missing a significant result, known as a type-II
error.
UUnniivveerrssiittyy ooff PPrreettoorriiaa eettdd –– CCooeettzzeeee,, MM ((22000055))
7.28
7.15.1 Practical significance
The reason for making use of samples is that they enable one to study the properties of a population within
the limitations of time and money. In such cases the statistical significance tests are used to show that
the results are significant. The p-value is a criterion of this, giving the probability that the obtained value
or larger could be obtained under the assumption that the null hypothesis (eg no difference between the
means) is true. A small p-value (eg smaller than 0.05) is considered as sufficient evidence that the result
is statistically significant. However, statistical significance does not necessarily imply that the result is
important in practice because these tests have a tendency to yield small p-values (indicating significance)
as the size of the data sets increases.
Most researchers are compelled to consider the results they obtain as a subpopulation of the target
population owing to the weak response of the planned random sample. These data should then be
considered as small populations for which statistical inferences and p-values are not relevant. Statistical
inference draws conclusions about the population from which a random sample was drawn, using the
descriptive measures that have been calculated. Instead of only reporting descriptive statistics in these
cases, effect sizes can be determined. Practical significance can be understood as a large enough
difference to have an effect in practice.
7.15.1.1 Practical significance of differences between means
The following formula was used to determine the practical significance of differences (d) when t-tests were
used (Steyn, 1999):
where
MeanA = mean of the first group
MeanB = mean of the second group
SDMAX = highest standard deviation of the two groups
The following formula was used to determine the practical significance of the means of more than two
groups (Steyn, 1999):
where
MeanA = mean of the first group
MeanB = mean of the second group
Root MSE = root mean square error
UUnniivveerrssiittyy ooff PPrreettoorriiaa eettdd –– CCooeettzzeeee,, MM ((22000055))
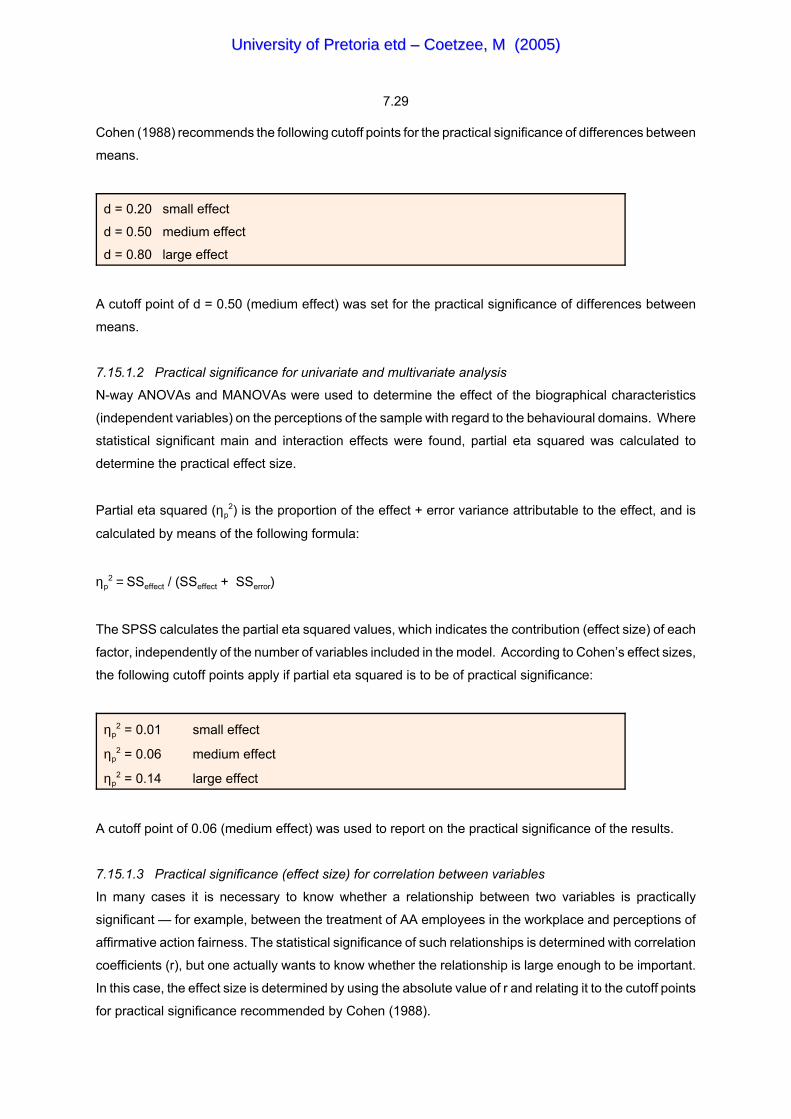
7.29
Cohen (1988) recommends the following cutoff points for the practical significance of differences between
means.
d = 0.20 small effect
d = 0.50 medium effect
d = 0.80 large effect
A cutoff point of d = 0.50 (medium effect) was set for the practical significance of differences between
means.
7.15.1.2 Practical significance for univariate and multivariate analysis
N-way ANOVAs and MANOVAs were used to determine the effect of the biographical characteristics
(independent variables) on the perceptions of the sample with regard to the behavioural domains. Where
statistical significant main and interaction effects were found, partial eta squared was calculated to
determine the practical effect size.
Partial eta squared (ηp2) is the proportion of the effect + error variance attributable to the effect, and is
calculated by means of the following formula:
ηp2 = SSeffect / (SSeffect + SSerror)
The SPSS calculates the partial eta squared values, which indicates the contribution (effect size) of each
factor, independently of the number of variables included in the model. According to Cohen’s effect sizes,
the following cutoff points apply if partial eta squared is to be of practical significance:
ηp2 = 0.01 small effect
ηp2 = 0.06 medium effect
ηp2 = 0.14 large effect
A cutoff point of 0.06 (medium effect) was used to report on the practical significance of the results.
7.15.1.3 Practical significance (effect size) for correlation between variables
In many cases it is necessary to know whether a relationship between two variables is practically
significant — for example, between the treatment of AA employees in the workplace and perceptions of
affirmative action fairness. The statistical significance of such relationships is determined with correlation
coefficients (r), but one actually wants to know whether the relationship is large enough to be important.
In this case, the effect size is determined by using the absolute value of r and relating it to the cutoff points
for practical significance recommended by Cohen (1988).
UUnniivveerrssiittyy ooff PPrreettoorriiaa eettdd –– CCooeettzzeeee,, MM ((22000055))
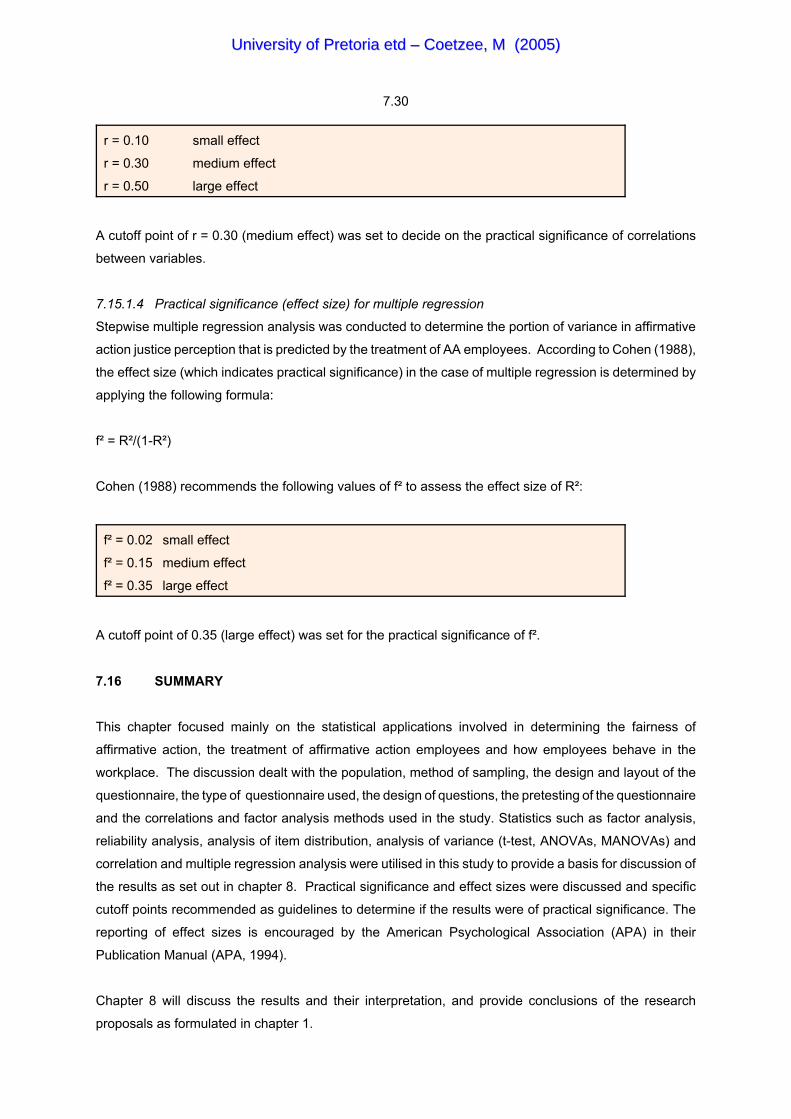
7.30
r = 0.10 small effect
r = 0.30 medium effect
r = 0.50 large effect
A cutoff point of r = 0.30 (medium effect) was set to decide on the practical significance of correlations
between variables.
7.15.1.4 Practical significance (effect size) for multiple regression
Stepwise multiple regression analysis was conducted to determine the portion of variance in affirmative
action justice perception that is predicted by the treatment of AA employees. According to Cohen (1988),
the effect size (which indicates practical significance) in the case of multiple regression is determined by
applying the following formula:
f² = R²/(1-R²)
Cohen (1988) recommends the following values of f² to assess the effect size of R²:
f² = 0.02 small effect
f² = 0.15 medium effect
f² = 0.35 large effect
A cutoff point of 0.35 (large effect) was set for the practical significance of f².
7.16 SUMMARY
This chapter focused mainly on the statistical applications involved in determining the fairness of
affirmative action, the treatment of affirmative action employees and how employees behave in the
workplace. The discussion dealt with the population, method of sampling, the design and layout of the
questionnaire, the type of questionnaire used, the design of questions, the pretesting of the questionnaire
and the correlations and factor analysis methods used in the study. Statistics such as factor analysis,
reliability analysis, analysis of item distribution, analysis of variance (t-test, ANOVAs, MANOVAs) and
correlation and multiple regression analysis were utilised in this study to provide a basis for discussion of
the results as set out in chapter 8. Practical significance and effect sizes were discussed and specific
cutoff points recommended as guidelines to determine if the results were of practical significance. The
reporting of effect sizes is encouraged by the American Psychological Association (APA) in their
Publication Manual (APA, 1994).
Chapter 8 will discuss the results and their interpretation, and provide conclusions of the research
proposals as formulated in chapter 1.
UUnniivveerrssiittyy ooff PPrreettoorriiaa eettdd –– CCooeettzzeeee,, MM ((22000055))
8.1
Chapter 8
RESULTS
8.1 INTRODUCTION
The previous chapter provided a theoretical discussion of the research and statistical methodology. This
chapter focuses on the interpretation and discussion of the research results. Factor analysis, reliability
and item analysis, analysis of variance (ANOVA) and multiple analysis of variance (MANOVA), correlation
and multiple regression analysis are all reported and interpreted.
8.2 FACTOR ANALYSIS
As mentioned previously, the statistical technique particularly appropriate to determine the dimensional
nature of a number of variables is factor analysis. It is a procedure that groups items on the basis of
correlations. The main aim of factor analysis is to describe a larger number of variables by means of a
smaller set of composite variables. This statistical technique is excellent for the investigation of the
underlying structure of a questionnaire. Those items that refer to or share the same dimension, should
correlate with one another and factor analysis uses this to uncover composite variables. These composite
variables are also known as “factors” and aid the substantive interpretation of data.
In the present study a principal factor analysis with varimax rotation was done for each of the sections.
The purpose was to identify the latent variables underlying AA fairness, treatment of AA employees in the
workplace and the commitment of employees.
The factor analysis of sections B, C and D of the questionnaire will now be discussed. The tables and
figures below illustrate the eigenvalues, scree plots and rotated factor matrices for each of the sections.
8.2.1 Perceptions of the fairness of affirmative action (section B)
In the first round of exploratory factor analysis, the 40 items of AA fairness were intercorrelated and rotated
to form a simple structure by means of the varimax rotation. In order to determine which variables to
keep, the factor loadings, the cross-loading of items on more than one factor, the reliability and importance
of a variable were taken into consideration before deleting certain items. After deleting 11 items, another
factor analysis was done. Based on Kaiser’s criterion, four factors were postulated (see table 8.2). As
indicated in table 8.1, the Kaiser-Meyer-Olkin (KMO) test for measuring sampling adequacy and Bartlett’s
test of sphericity display satisfactory results. The KMO value (0.933) is greater than 0.7 which means the
data set is likely to factor well. Bartlett’s test rejects the hypothesis (at p<0.001) that the correlation matrix
UUnniivveerrssiittyy ooff PPrreettoorriiaa eettdd –– CCooeettzzeeee,, MM ((22000055))

8.2
is an identity matrix, without significant correlations between variables. Both diagnostic tests confirm that
the data are suitable for factor analysis.
TABLE 8.1: KMO MEASURE AND BARTLETT'S TEST: AA FAIRNESS
Kaiser-Meyer-Olkin Measure of Sampling Adequacy 0.933 Bartlett's Test of Sphericity Approx Chi-Square 5374.294 df 406 Sig 0.000
TABLE 8.2: EIGENVALUES AND TOTAL VARIANCE EXPLAINED BY THE FACTORS OF AFFIRMATIVE ACTION FAIRNESS
Factor
Initial
Eigenvalues
Total
% of
Variance
Cumulative %
Rotation Sums of
Squared Loadings
Total
% of
Variance
Cumulative %
1 10.904 37.601 37.601 4.423 15.253 15.253 2 3.287 11.335 48.937 3.680 12.691 27.944 3 1.214 4.187 53.123 3.664 12.635 40.579 4 1.161 4.003 57.126 2.905 10.016 50.595 5 0.909 3.134 60.260 6 0.868 2.992 63.252 7 0.837 2.885 66.137 8 0.790 2.724 68.861 9 0.737 2.540 71.402 10 0.677 2.334 73.735 11 0.628 2.165 75.900 12 0.597 2.057 77.958 13 0.559 1.927 79.885 14 0.527 1.819 81.704 15 0.514 1.774 83.477 16 0.502 1.729 85.207 17 0.473 1.630 86.836 18 0.454 1.566 88.402 19 0.426 1.470 89.872 20 0.399 1.376 91.247 21 0.375 1.293 92.540 22 0.353 1.218 93.758 23 0.347 1.197 94.955 24 0.290 1.001 95.955 25 0.279 0.962 96.917 26 0.269 0.927 97.844 27 0.240 0.827 98.671 28 0.197 0.680 99.351 29 0.188 0.649 100.000
UUnniivveerrssiittyy ooff PPrreettoorriiaa eettdd –– CCooeettzzeeee,, MM ((22000055))

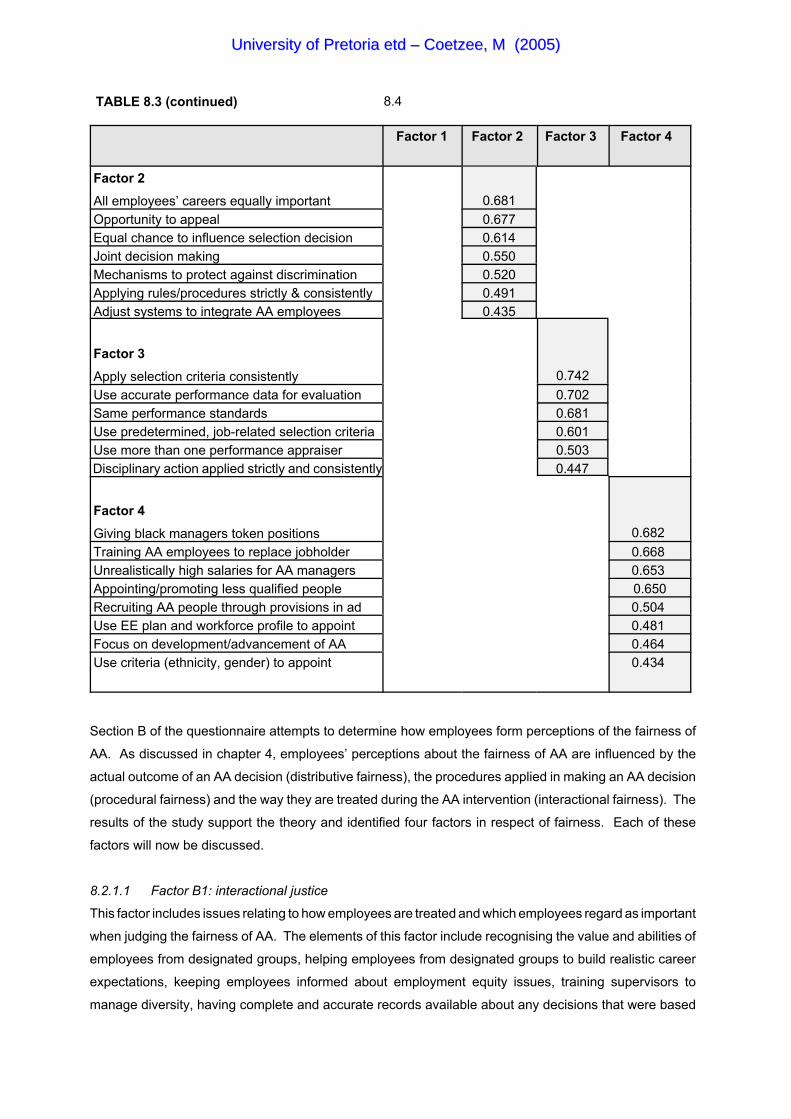
TABLE 8.3 (continued) 8.4
Factor 1 Factor 2 Factor 3 Factor 4
Factor 2 All employees’ careers equally important 0.681 Opportunity to appeal 0.677 Equal chance to influence selection decision 0.614 Joint decision making 0.550 Mechanisms to protect against discrimination 0.520 Applying rules/procedures strictly & consistently 0.491 Adjust systems to integrate AA employees 0.435
Factor 3 Apply selection criteria consistently 0.742 Use accurate performance data for evaluation 0.702 Same performance standards 0.681 Use predetermined, job-related selection criteria 0.601 Use more than one performance appraiser 0.503 Disciplinary action applied strictly and consistently 0.447
Factor 4 Giving black managers token positions 0.682 Training AA employees to replace jobholder 0.668 Unrealistically high salaries for AA managers 0.653 Appointing/promoting less qualified people 0.650 Recruiting AA people through provisions in ad 0.504 Use EE plan and workforce profile to appoint 0.481 Focus on development/advancement of AA 0.464 Use criteria (ethnicity, gender) to appoint 0.434
Section B of the questionnaire attempts to determine how employees form perceptions of the fairness of
AA. As discussed in chapter 4, employees’ perceptions about the fairness of AA are influenced by the
actual outcome of an AA decision (distributive fairness), the procedures applied in making an AA decision
(procedural fairness) and the way they are treated during the AA intervention (interactional fairness). The
results of the study support the theory and identified four factors in respect of fairness. Each of these
factors will now be discussed.
8.2.1.1 Factor B1: interactional justice
This factor includes issues relating to how employees are treated and which employees regard as important
when judging the fairness of AA. The elements of this factor include recognising the value and abilities of
employees from designated groups, helping employees from designated groups to build realistic career
expectations, keeping employees informed about employment equity issues, training supervisors to
manage diversity, having complete and accurate records available about any decisions that were based
UUnniivveerrssiittyy ooff PPrreettoorriiaa eettdd –– CCooeettzzeeee,, MM ((22000055))
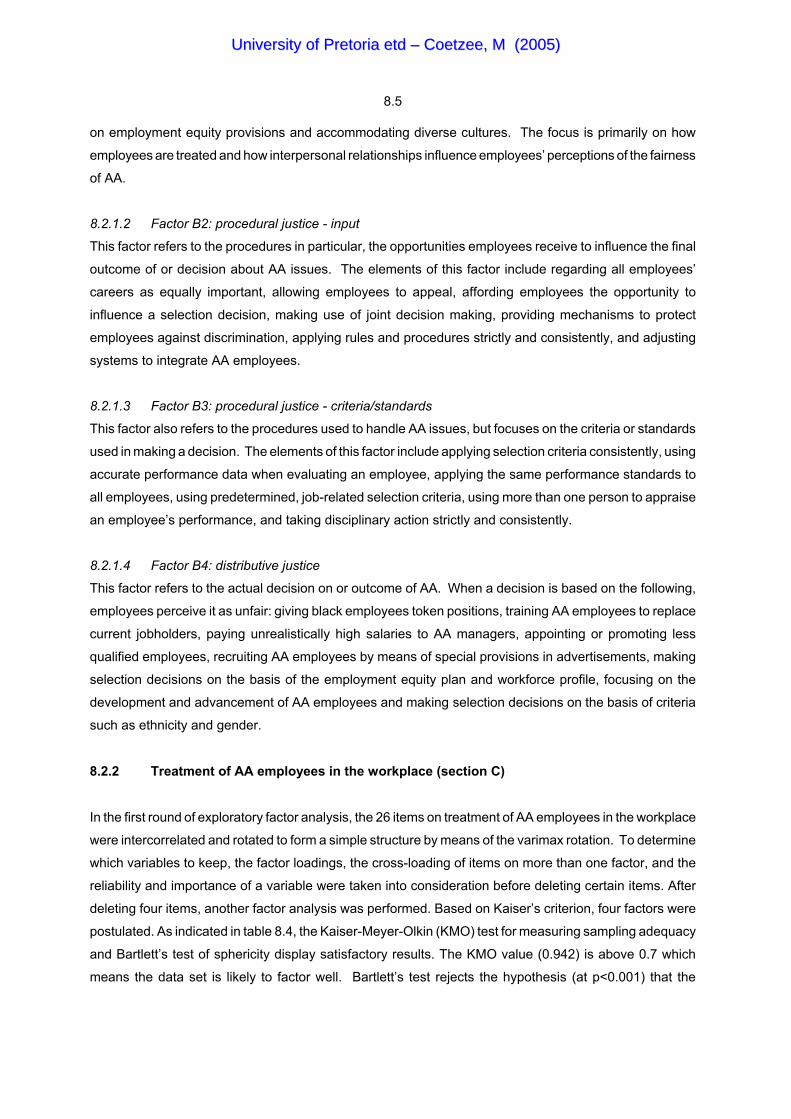
8.5
on employment equity provisions and accommodating diverse cultures. The focus is primarily on how
employees are treated and how interpersonal relationships influence employees’ perceptions of the fairness
of AA.
8.2.1.2 Factor B2: procedural justice - input
This factor refers to the procedures in particular, the opportunities employees receive to influence the final
outcome of or decision about AA issues. The elements of this factor include regarding all employees’
careers as equally important, allowing employees to appeal, affording employees the opportunity to
influence a selection decision, making use of joint decision making, providing mechanisms to protect
employees against discrimination, applying rules and procedures strictly and consistently, and adjusting
systems to integrate AA employees.
8.2.1.3 Factor B3: procedural justice - criteria/standards
This factor also refers to the procedures used to handle AA issues, but focuses on the criteria or standards
used in making a decision. The elements of this factor include applying selection criteria consistently, using
accurate performance data when evaluating an employee, applying the same performance standards to
all employees, using predetermined, job-related selection criteria, using more than one person to appraise
an employee’s performance, and taking disciplinary action strictly and consistently.
8.2.1.4 Factor B4: distributive justice
This factor refers to the actual decision on or outcome of AA. When a decision is based on the following,
employees perceive it as unfair: giving black employees token positions, training AA employees to replace
current jobholders, paying unrealistically high salaries to AA managers, appointing or promoting less
qualified employees, recruiting AA employees by means of special provisions in advertisements, making
selection decisions on the basis of the employment equity plan and workforce profile, focusing on the
development and advancement of AA employees and making selection decisions on the basis of criteria
such as ethnicity and gender.
8.2.2 Treatment of AA employees in the workplace (section C)
In the first round of exploratory factor analysis, the 26 items on treatment of AA employees in the workplace
were intercorrelated and rotated to form a simple structure by means of the varimax rotation. To determine
which variables to keep, the factor loadings, the cross-loading of items on more than one factor, and the
reliability and importance of a variable were taken into consideration before deleting certain items. After
deleting four items, another factor analysis was performed. Based on Kaiser’s criterion, four factors were
postulated. As indicated in table 8.4, the Kaiser-Meyer-Olkin (KMO) test for measuring sampling adequacy
and Bartlett’s test of sphericity display satisfactory results. The KMO value (0.942) is above 0.7 which
means the data set is likely to factor well. Bartlett’s test rejects the hypothesis (at p<0.001) that the
UUnniivveerrssiittyy ooff PPrreettoorriiaa eettdd –– CCooeettzzeeee,, MM ((22000055))

8.6
correlation matrix is an identity matrix, without significant correlations between variables. Both diagnostic
tests confirm that the data are suitable for factor analysis.
TABLE 8.4: KMO MEASURE AND BARTLETT’S TEST: TREATMENT OF AA EMPLOYEES
Kaiser-Meyer-Olkin Measure of Sampling Adequacy. 0.942 Bartlett's Test of Sphericity Approx. Chi-Square 5457.667 df 231 Sig. 0.000
TABLE 8.5: EIGENVALUES AND TOTAL VARIANCE EXPLAINED BY THE FACTORS OF
TREATMENT OF AA EMPLOYEES IN THE WORKPLACE
Factor
Initial
Eigenvalues
Total
% of
Variance
Cumulative
%
Rotation Sums of
Squared Loadings
Total
% of
Variance
Cumulative
%
1 11.197 50.894 50.894 4.107 18.667 18.667 2 1.578 7.171 58.065 3.793 17.239 35.906 3 1.284 5.837 63.902 3.000 13.638 49.544 4 1.009 4.584 68.487 2.742 12.462 62.006 5 0.742 3.374 71.861 6 0.666 3.029 74.890 7 0.636 2.891 77.781 8 0.568 2.581 80.362 9 0.533 2.425 82.787 10 0.460 2.089 84.876 11 0.425 1.930 86.806 12 0.376 1.709 88.516 13 0.369 1.677 90.192 14 0.334 1.519 91.711 15 0.315 1.432 93.143 16 0.296 1.346 94.490 17 0.265 1.202 95.692 18 0.257 1.168 96.860 19 0.206 0.936 97.796 20 0.190 0.862 98.658 21 0.157 0.716 99.374 22 0.138 0.626 100.000
According to the eigenvalues in table 8.4, four factors have eigenvalues greater than 1.0, which is a
common criterion for a factor to be useful. The scree plot (see fig 8.2) below supports a four-factor solution.
UUnniivveerrssiittyy ooff PPrreettoorriiaa eettdd –– CCooeettzzeeee,, MM ((22000055))

TABLE 8.6 (continued) 8.8
Factor 1 Factor 2 Factor 3 Factor 4
Factor 3 Responsible for assignments and projects 0.861 Responsible for equipment and facilities 0.719 Responsible for initiating assignments and projects 0.664 Responsible for budgets and expenditures 0.595
Factor 4 Expected to meet realistic performance standards 0.721 Expected to meet realistic workloads 0.583 Held accountable for their decisions 0.567 Personally responsible for work performed 0.558
Section C of the questionnaire attempts to determine how AA employees are treated in the workplace. As
discussed in chapter 5, employees are most concerned about being treated fairly and with respect, to work
in an environment of trust and to have supervisors who are concerned about their well-being. The results
of the study support the theory and identified four factors relating to how AA employees are treated in the
workplace. Each of these factors will now be discussed.
8.2.2.1 Factor C1: Task autonomy
This factor refers to the level of autonomy employees from designated groups have in the workplace. The
elements of this factor include the significance, importance and difficulty of jobs performed by AA
employees, the opportunity they have to use their initiative and judgment, the extent to which the job allows
them to use a variety of skills and competencies, whether they receive feedback on performance, the level
of cooperation required to perform a task, the extent to which tasks are defined, and whether they are
allowed to determine their own work pace and the order in which tasks need to be completed.
8.2.2.2 Factor C2: Respect
This factor refers to the way employees from designated groups are treated in the workplace, and in
particular how they are treated as human beings. According to this factor, employees feel that they are
treated with respect when they are treated with dignity, listened to when they make suggestions, free to
discuss problems with co-workers, recognised for work done well, regarded as contributors to the success
of the department and their cultural differences taken into consideration at social events.
8.2.2.3 Factor C3: Responsibility
This factor refers to the responsibility with which employees from designated groups wish to be entrusted.
Employees from designated groups want to accept responsibility for important tasks such as specific
UUnniivveerrssiittyy ooff PPrreettoorriiaa eettdd –– CCooeettzzeeee,, MM ((22000055))
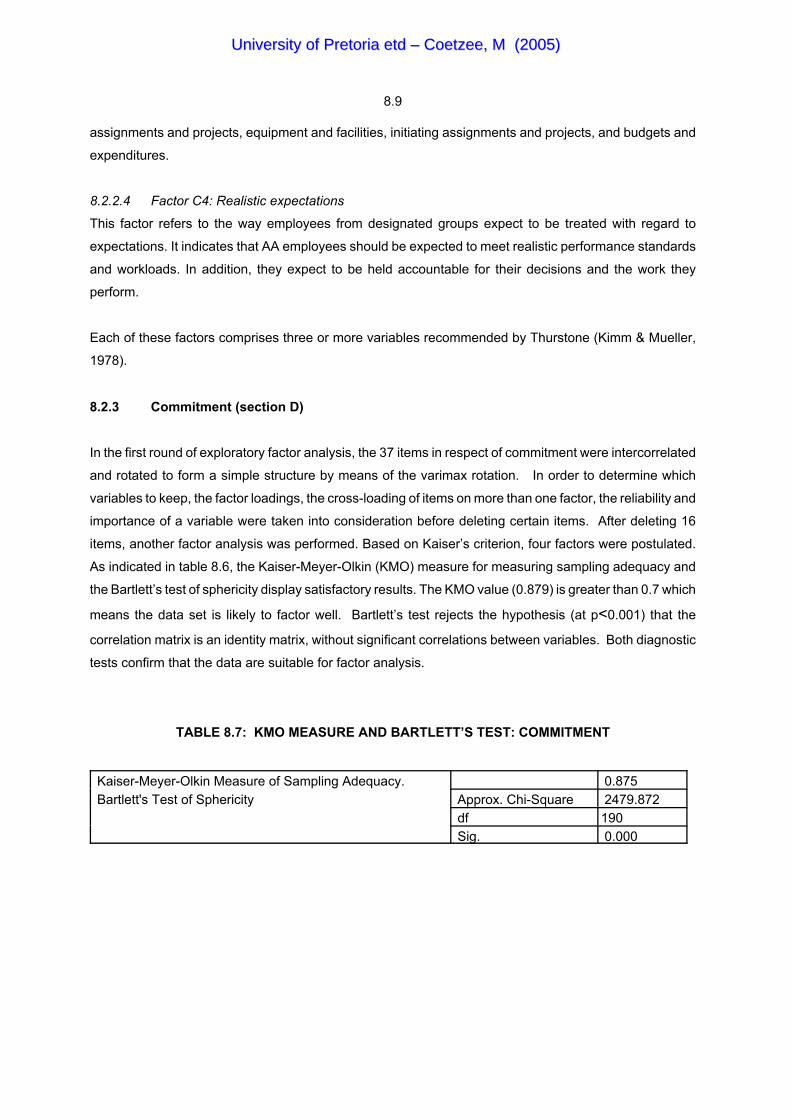
8.9
assignments and projects, equipment and facilities, initiating assignments and projects, and budgets and
expenditures.
8.2.2.4 Factor C4: Realistic expectations
This factor refers to the way employees from designated groups expect to be treated with regard to
expectations. It indicates that AA employees should be expected to meet realistic performance standards
and workloads. In addition, they expect to be held accountable for their decisions and the work they
perform.
Each of these factors comprises three or more variables recommended by Thurstone (Kimm & Mueller,
1978).
8.2.3 Commitment (section D)
In the first round of exploratory factor analysis, the 37 items in respect of commitment were intercorrelated
and rotated to form a simple structure by means of the varimax rotation. In order to determine which
variables to keep, the factor loadings, the cross-loading of items on more than one factor, the reliability and
importance of a variable were taken into consideration before deleting certain items. After deleting 16
items, another factor analysis was performed. Based on Kaiser’s criterion, four factors were postulated.
As indicated in table 8.6, the Kaiser-Meyer-Olkin (KMO) measure for measuring sampling adequacy and
the Bartlett’s test of sphericity display satisfactory results. The KMO value (0.879) is greater than 0.7 which
means the data set is likely to factor well. Bartlett’s test rejects the hypothesis (at p<0.001) that the
correlation matrix is an identity matrix, without significant correlations between variables. Both diagnostic
tests confirm that the data are suitable for factor analysis.
TABLE 8.7: KMO MEASURE AND BARTLETT’S TEST: COMMITMENT
Kaiser-Meyer-Olkin Measure of Sampling Adequacy. 0.875 Bartlett's Test of Sphericity Approx. Chi-Square 2479.872 df 190 Sig. 0.000
UUnniivveerrssiittyy ooff PPrreettoorriiaa eettdd –– CCooeettzzeeee,, MM ((22000055))

8.10
TABLE 8.8: EIGENVALUES AND TOTAL VARIANCE EXPLAINED BY THE FACTORS OF
COMMITMENT
Factor Initial
Eigenvalues
Total
% of
Variance
Cumulative
%
Rotation Sums of
Squared Loadings
Total
% of
Variance
Cumulative %
1 6.120 30.601 30.601 3.606 18.032 18.032 2 2.308 11.539 42.140 1.871 9.353 27.384 3 1.441 7.207 49.347 1.811 9.055 36.439 4 1.144 5.718 55.065 1.658 8.290 44.729 5 0.927 4.634 59.699 6 0.862 4.311 64.010 7 0.802 4.008 68.018 8 0.756 3.778 71.796 9 0.711 3.553 75.349 10 0.681 3.406 78.755 11 0.619 3.093 81.848 12 0.564 2.820 84.668 13 0.530 2.649 87.317 14 0.482 2.408 89.725 15 0.460 2.298 92.023 16 0.382 1.911 93.934 17 0.344 1.720 95.654 18 0.330 1.648 97.302 19 0.312 1.558 98.860 20 0.228 1.140 100.000
According to the eigenvalues in table 8.7, four factors have eigenvalues greater than 1.0, which is a
common criterion for a factor to be useful. The scree plot (fig 8.3) below supports this solution.
UUnniivveerrssiittyy ooff PPrreettoorriiaa eettdd –– CCooeettzzeeee,, MM ((22000055))


TABLE 8.9 (continued) 8.12
Factor 1 Factor 2 Factor 3 Factor 4
Factor 2 Enjoys job 0.793 Pleasant work environment 0.618 Sense of personal satisfaction - good work 0.579
Factor 3 Shares ideas for new projects/improvements 0.663 Makes suggestions to improve operations 0.645 Attends and participates in bank meetings 0.562
Factor 4 Not resigning -obligation to remain 0.736 Not resigning - like my job 0.666 Seldom think about resigning 0.504 Not resigning - costs too high 0.413
Section D of the questionnaire attempts to determine employees’ commitment by means of their behaviour
in the workplace. As discussed in chapter 5, the behaviour of employees can be grouped into five
categories: altruism, courtesy, sportsmanship, conscientiousness and civic virtue. Inkeles (1969) identifies
three categories of work behaviour, namely obedience, loyalty and participation. The results of the study
support the theory, and identified four factors relating to how employees behave in the workplace. Each
of these factors will now be discussed.
8.2.3.1 Factor D1: Obedience (conscientiousness)
This factor refers to the way employees adhere to rules and procedures and behave according to group
norms. The elements of this factor include treating bank property with care, obeying bank rules and
regulations, being concerned about the bank’s image, keeping the workplace clean and tidy, being punctual
and not taking unnecessary long breaks, helping others with heavy workloads, staying informed about the
bank, preventing problems with colleagues, and having valid reasons for staying away from work.
8.2.3.2 Factor D2: Job satisfaction
This factor refers to employees’ satisfaction with their jobs. According to this factor, employees are
satisfied with their jobs when they enjoy working, have a pleasant work environment and experience a
sense of personal satisfaction when they perform well.
UUnniivveerrssiittyy ooff PPrreettoorriiaa eettdd –– CCooeettzzeeee,, MM ((22000055))

8.13
8.2.3.3 Factor D3: Participation (civic virtue)
An important aspect of employees’ commitment is the extent to which they participate and are involved in
work-related issues. The elements of this factor include the opportunity employees are afforded to share
ideas or make suggestions on new projects or changes, and whether they attend and participate in bank
meetings.
8.2.3.4 Factor D4: Loyalty
Loyalty plays a vital part of employees’ commitment and is often measured by their attitudes toward
remaining with the organisation. According to this factor there are various reasons why employees will not
resign. The first is because they feel they have an obligation not to resign. The second is because they
like their jobs, and lastly, they cannot afford to resign because the costs are too high. Resigning would, in
such instances, mean losing accumulated leave days and retirement contributions.
Each of these factors consists of three or more variables which are recommended by Thurstone (Kimm &
Mueller, 1978).
8.2.4 Factorial reliability
The internal consistency coefficient, Cronbach alpha (Lemke & Wiersma, 1976), was computed for each
of the factors identified. The means, variance, standard deviation, skewness and kurtosis for the total
sample regarding the identified factors and the Cronbach alpha values are provided in tables 8.10 to 8.21.
UUnniivveerrssiittyy ooff PPrreettoorriiaa eettdd –– CCooeettzzeeee,, MM ((22000055))
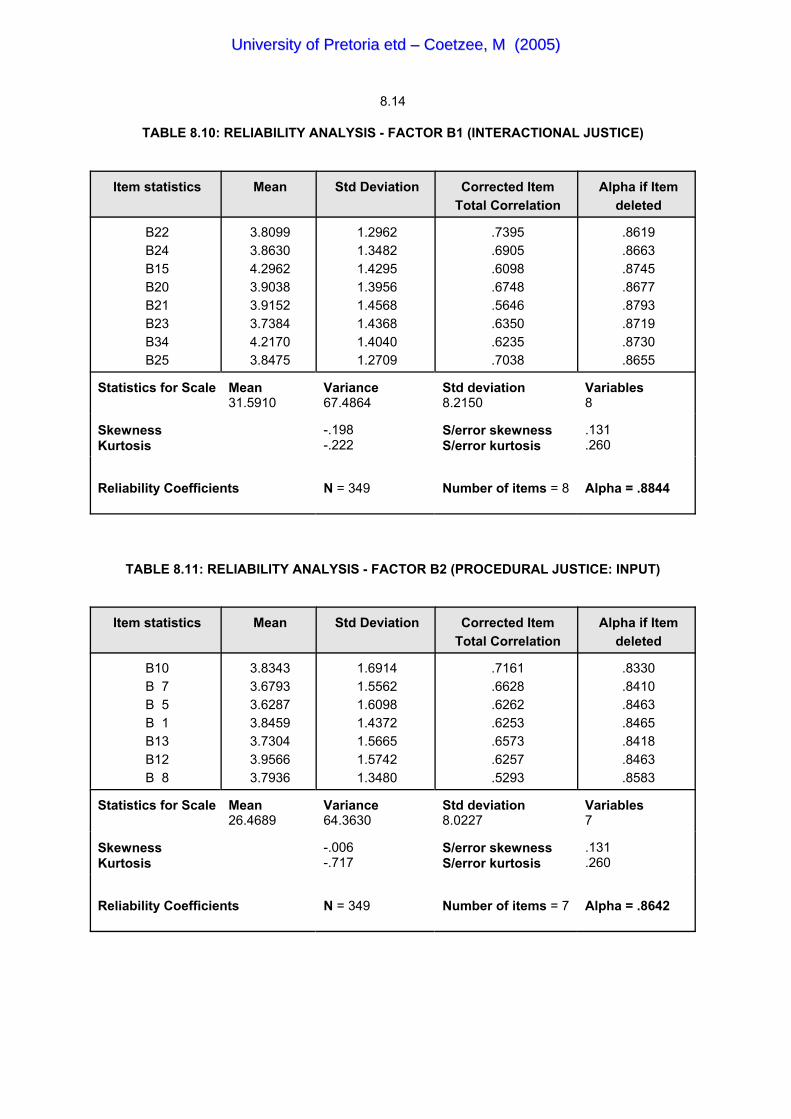
8.14
TABLE 8.10: RELIABILITY ANALYSIS - FACTOR B1 (INTERACTIONAL JUSTICE)
Item statistics Mean Std Deviation Corrected ItemTotal Correlation
Alpha if Itemdeleted
B22B24B15B20B21B23B34B25
3.80993.86304.29623.90383.91523.73844.21703.8475
1.29621.34821.42951.39561.45681.43681.40401.2709
.7395
.6905
.6098
.6748
.5646
.6350
.6235
.7038
.8619
.8663
.8745
.8677
.8793
.8719
.8730
.8655
Statistics for Scale Mean31.5910
Variance67.4864
Std deviation8.2150
Variables8
SkewnessKurtosis
-.198-.222
S/error skewnessS/error kurtosis
.131
.260
Reliability Coefficients N = 349 Number of items = 8 Alpha = .8844
TABLE 8.11: RELIABILITY ANALYSIS - FACTOR B2 (PROCEDURAL JUSTICE: INPUT)
Item statistics Mean Std Deviation Corrected ItemTotal Correlation
Alpha if Itemdeleted
B10B 7B 5B 1B13B12B 8
3.83433.67933.62873.84593.73043.95663.7936
1.69141.55621.60981.43721.56651.57421.3480
.7161
.6628
.6262
.6253
.6573
.6257
.5293
.8330
.8410
.8463
.8465
.8418
.8463
.8583
Statistics for Scale Mean26.4689
Variance64.3630
Std deviation8.0227
Variables7
SkewnessKurtosis
-.006-.717
S/error skewnessS/error kurtosis
.131
.260
Reliability Coefficients N = 349 Number of items = 7 Alpha = .8642
UUnniivveerrssiittyy ooff PPrreettoorriiaa eettdd –– CCooeettzzeeee,, MM ((22000055))
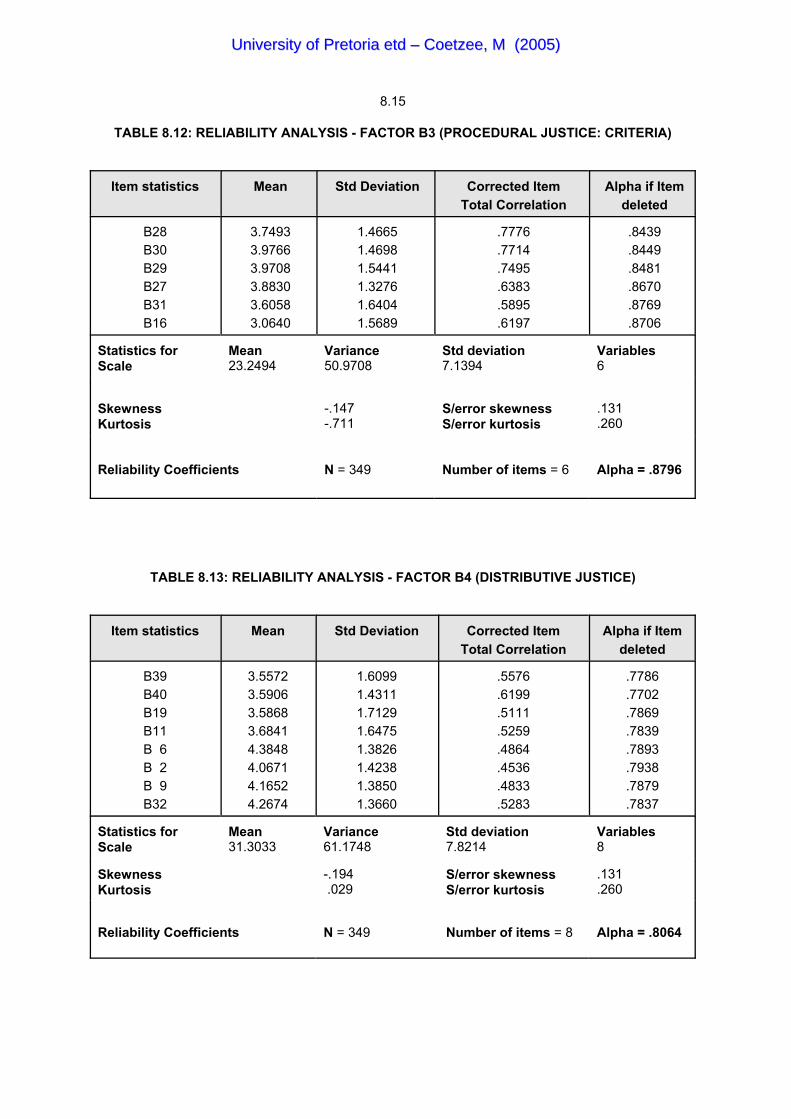
8.15
TABLE 8.12: RELIABILITY ANALYSIS - FACTOR B3 (PROCEDURAL JUSTICE: CRITERIA)
Item statistics Mean Std Deviation Corrected ItemTotal Correlation
Alpha if Itemdeleted
B28B30B29B27B31B16
3.74933.97663.97083.88303.60583.0640
1.46651.46981.54411.32761.64041.5689
.7776
.7714
.7495
.6383
.5895
.6197
.8439
.8449
.8481
.8670
.8769
.8706
Statistics forScale
Mean23.2494
Variance50.9708
Std deviation7.1394
Variables6
SkewnessKurtosis
-.147-.711
S/error skewnessS/error kurtosis
.131
.260
Reliability Coefficients N = 349 Number of items = 6 Alpha = .8796
TABLE 8.13: RELIABILITY ANALYSIS - FACTOR B4 (DISTRIBUTIVE JUSTICE)
Item statistics Mean Std Deviation Corrected ItemTotal Correlation
Alpha if Itemdeleted
B39B40B19B11B 6B 2B 9B32
3.55723.59063.58683.68414.38484.06714.16524.2674
1.60991.43111.71291.64751.38261.42381.38501.3660
.5576
.6199
.5111
.5259
.4864
.4536
.4833
.5283
.7786
.7702
.7869
.7839
.7893
.7938
.7879
.7837
Statistics forScale
Mean31.3033
Variance61.1748
Std deviation7.8214
Variables8
SkewnessKurtosis
-.194 .029
S/error skewnessS/error kurtosis
.131
.260
Reliability Coefficients N = 349 Number of items = 8 Alpha = .8064
UUnniivveerrssiittyy ooff PPrreettoorriiaa eettdd –– CCooeettzzeeee,, MM ((22000055))
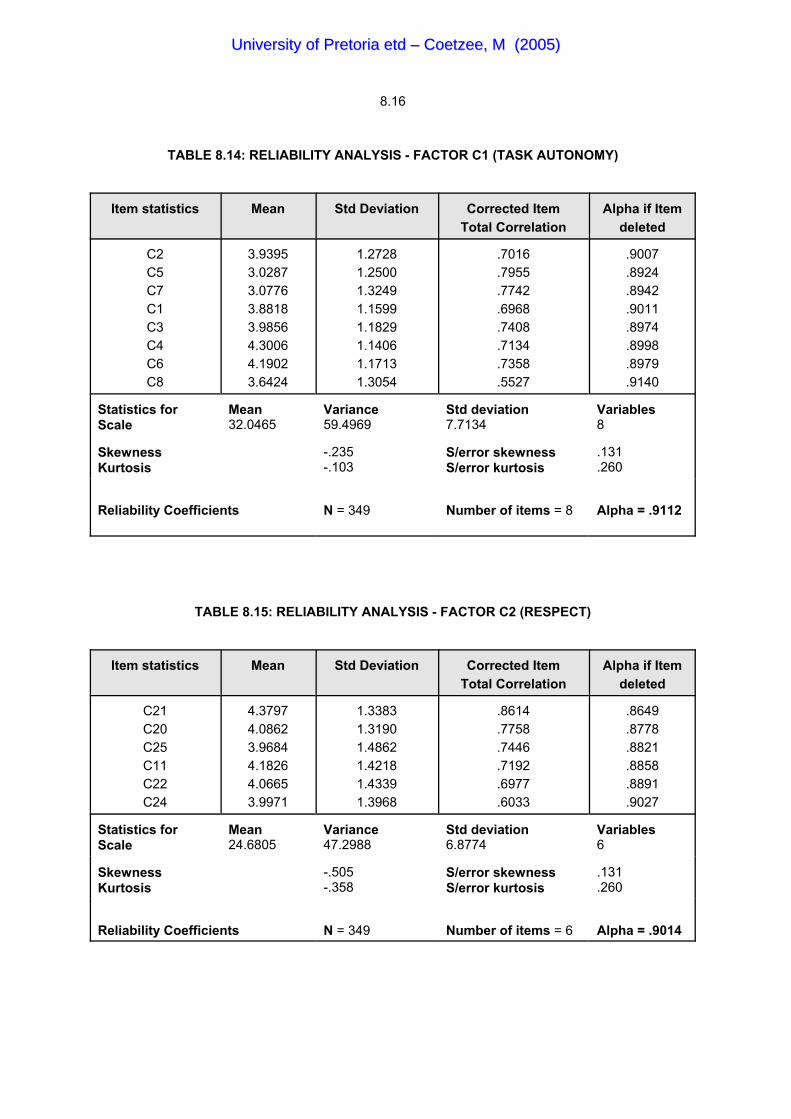
8.16
TABLE 8.14: RELIABILITY ANALYSIS - FACTOR C1 (TASK AUTONOMY)
Item statistics Mean Std Deviation Corrected ItemTotal Correlation
Alpha if Itemdeleted
C2C5C7C1C3C4C6C8
3.93953.02873.07763.88183.98564.30064.19023.6424
1.27281.25001.32491.15991.18291.14061.17131.3054
.7016
.7955
.7742
.6968
.7408
.7134
.7358
.5527
.9007
.8924
.8942
.9011
.8974
.8998
.8979
.9140
Statistics forScale
Mean32.0465
Variance59.4969
Std deviation7.7134
Variables8
SkewnessKurtosis
-.235-.103
S/error skewnessS/error kurtosis
.131
.260
Reliability Coefficients N = 349 Number of items = 8 Alpha = .9112
TABLE 8.15: RELIABILITY ANALYSIS - FACTOR C2 (RESPECT)
Item statistics Mean Std Deviation Corrected ItemTotal Correlation
Alpha if Itemdeleted
C21C20C25C11C22C24
4.37974.08623.96844.18264.06653.9971
1.33831.31901.48621.42181.43391.3968
.8614
.7758
.7446
.7192
.6977
.6033
.8649
.8778
.8821
.8858
.8891
.9027
Statistics forScale
Mean24.6805
Variance47.2988
Std deviation6.8774
Variables6
SkewnessKurtosis
-.505-.358
S/error skewnessS/error kurtosis
.131
.260
Reliability Coefficients N = 349 Number of items = 6 Alpha = .9014
UUnniivveerrssiittyy ooff PPrreettoorriiaa eettdd –– CCooeettzzeeee,, MM ((22000055))

8.17
TABLE 8.16: RELIABILITY ANALYSIS - FACTOR C3 (RESPONSIBILITY)
Item statistics Mean Std Deviation Corrected ItemTotal Correlation
Alpha if Itemdeleted
C15C16C17C18
3.56073.24783.67153.7098
1.32091.43111.28711.3664
.7206
.6578
.8015
.7111
.8322
.8593
.8011
.8359
Statistics forScale
Mean14.1898
Variance20.9942
Std deviation4.5819
Variables4
SkewnessKurtosis
.039-.423
S/error skewnessS/error kurtosis
.131
.260
Reliability Coefficients N = 349 Number of items = 4 Alpha = .8687
TABLE 8.17: RELIABILITY ANALYSIS - FACTOR C4 (REALISTIC EXPECTATIONS)
Item statistics Mean Std Deviation Corrected ItemTotal Correlation
Alpha if Itemdeleted
C13C14C 9C10
4.12644.24354.22614.2219
1.29591.21241.21101.2433
.7058
.7566
.6740
.6244
.8025
.7810
.8159
.8366
Statistics forScale
Mean16.8179
Variance16.9983
Std deviation4.1229
Variables4
SkewnessKurtosis
-.214-.657
S/error skewnessS/error kurtosis
.131
.260
Reliability Coefficients N = 349 Number of items = 6 Alpha = .8500
UUnniivveerrssiittyy ooff PPrreettoorriiaa eettdd –– CCooeettzzeeee,, MM ((22000055))

8.18
TABLE 8.18: RELIABILITY ANALYSIS - FACTOR D1 (OBEDIENCE)
Item statistics Mean Std Deviation Corrected ItemTotal Correlation
Alpha if Itemdeleted
D 6D 2D 5D 9D 4D 3D 1D 8D11D13
5.50725.35825.27305.30755.32665.27794.85394.96855.71765.2845
0.68490.78090.93010.83060.89821.04500.99071.08360.65720.8724
.7160
.6160
.6440
.5360
.5400
.4910
.4880
.5510
.3860
.4470
.8130
.8180
.8140
.8250
.8240
.8310
.8300
.8240
.8370
.8320
Statistics forScale
Mean52.8748
Variance32.2510
Std deviation5.6789
Variables10
SkewnessKurtosis
-.9751.143
S/error skewnessS/error kurtosis
.131
.260
Reliability Coefficients N = 349 Number of items = 10 Alpha = .8400
TABLE 8.19: RELIABILITY ANALYSIS - FACTOR D2 (JOB SATISFACTION)
Item statistics Mean Std Deviation Corrected ItemTotal Correlation
Alpha if Itemdeleted
D25D26D27
4.68014.49575.2882
1.21471.29400.9902
.6787
.6170
.5033
.5725
.6543
.7733
Statistics forScale
Mean14.4640
Variance8.3753
Std deviation2.8940
Variables3
SkewnessKurtosis
-.873-.885
S/error skewnessS/error kurtosis
.131
.260
Reliability Coefficients N = 349 Number of items = 3 Alpha = .7602
UUnniivveerrssiittyy ooff PPrreettoorriiaa eettdd –– CCooeettzzeeee,, MM ((22000055))

8.19
TABLE 8.20: RELIABILITY ANALYSIS - FACTOR D3 (PARTICIPATION)
Item statistics Mean Std Deviation Corrected ItemTotal Correlation
Alpha if Itemdeleted
D17D10D 7
4.47834.85105.0948
1.19151.09371.0879
.5550
.6457
.4888
.6598
.5500
.7304
Statistics forScale
Mean14.4241
Variance7.4635
Std deviation2.7319
Variables3
SkewnessKurtosis
-.853-.858
S/error skewnessS/error kurtosis
.131
.260
Reliability Coefficients N = 349 Number of items = 3 Alpha = .7364
TABLE 8.21: RELIABILITY ANALYSIS - FACTOR D4 (LOYALTY)
Item statistics Mean Std Deviation Corrected ItemTotal Correlation
Alpha if Itemdeleted
D29D31D15D30
3.41214.10343.87363.1676
1.54441.49551.61031.5890
.5960
.6030
.4910
.2950
.5730
.5710
.6400
.7550
Statistics forScale
Mean14.5567
Variance20.6320
Std deviation4.5423
Variables4
SkewnessKurtosis
-.151-.297
S/error skewnessS/error kurtosis
.131
.260
Reliability Coefficients N = 349 Number of items = 4 Alpha = .7040
As indicated in tables 8.10 to 8.21, the reliability of the factors, as measured by alpha, are all above 0.70
and none of the items, if deleted, increases the internal consistency of items in a factor. It thus proves that
an item belongs to a particular factor.
Before the factors can be used in other statistical analysis, it is also necessary to examine statistics such
as the mean, variance, skewness, kurtosis and standard deviations. Figure 8.4 provides the descriptive
statistics of the factors discussed above.
UUnniivveerrssiittyy ooff PPrreettoorriiaa eettdd –– CCooeettzzeeee,, MM ((22000055))

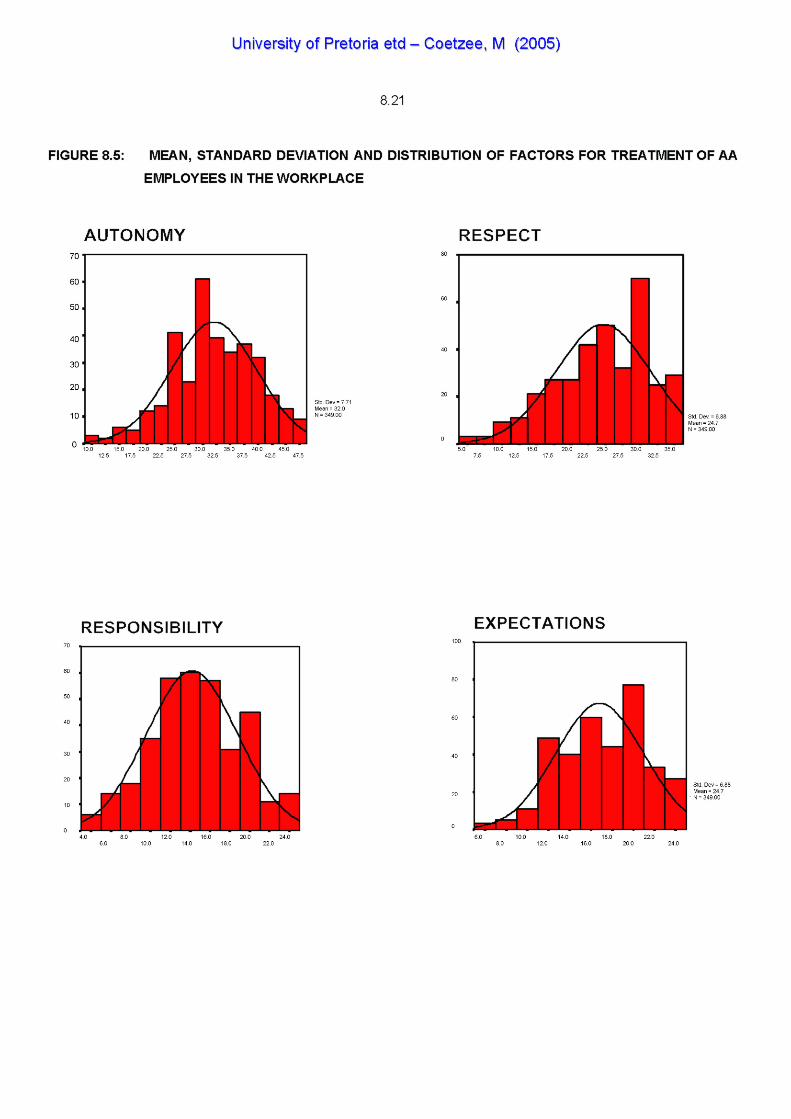

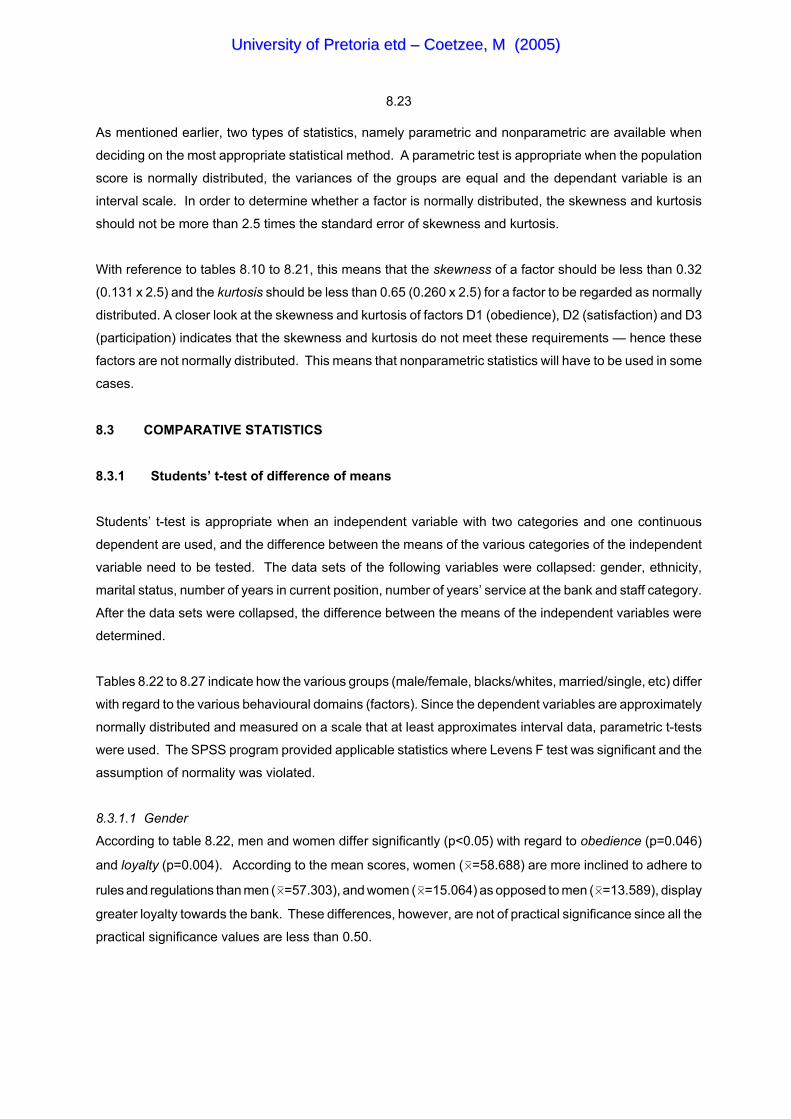
8.23
As mentioned earlier, two types of statistics, namely parametric and nonparametric are available when
deciding on the most appropriate statistical method. A parametric test is appropriate when the population
score is normally distributed, the variances of the groups are equal and the dependant variable is an
interval scale. In order to determine whether a factor is normally distributed, the skewness and kurtosis
should not be more than 2.5 times the standard error of skewness and kurtosis.
With reference to tables 8.10 to 8.21, this means that the skewness of a factor should be less than 0.32
(0.131 x 2.5) and the kurtosis should be less than 0.65 (0.260 x 2.5) for a factor to be regarded as normally
distributed. A closer look at the skewness and kurtosis of factors D1 (obedience), D2 (satisfaction) and D3
(participation) indicates that the skewness and kurtosis do not meet these requirements — hence these
factors are not normally distributed. This means that nonparametric statistics will have to be used in some
cases.
8.3 COMPARATIVE STATISTICS
8.3.1 Students’ t-test of difference of means
Students’ t-test is appropriate when an independent variable with two categories and one continuous
dependent are used, and the difference between the means of the various categories of the independent
variable need to be tested. The data sets of the following variables were collapsed: gender, ethnicity,
marital status, number of years in current position, number of years’ service at the bank and staff category.
After the data sets were collapsed, the difference between the means of the independent variables were
determined.
Tables 8.22 to 8.27 indicate how the various groups (male/female, blacks/whites, married/single, etc) differ
with regard to the various behavioural domains (factors). Since the dependent variables are approximately
normally distributed and measured on a scale that at least approximates interval data, parametric t-tests
were used. The SPSS program provided applicable statistics where Levens F test was significant and the
assumption of normality was violated.
8.3.1.1 Gender
According to table 8.22, men and women differ significantly (p<0.05) with regard to obedience (p=0.046)
and loyalty (p=0.004). According to the mean scores, women (0=58.688) are more inclined to adhere to
rules and regulations than men (0=57.303), and women (0=15.064) as opposed to men (0=13.589), display
greater loyalty towards the bank. These differences, however, are not of practical significance since all the
practical significance values are less than 0.50.
UUnniivveerrssiittyy ooff PPrreettoorriiaa eettdd –– CCooeettzzeeee,, MM ((22000055))

8.24
8.3.1.2 Ethnicity
According to table 8.23, there are statistical significant differences (p<0.001) between blacks’ and whites’,
perceptions of organisational justice; how employees from designated groups are treated in the workplace;
and how employees behave in the workplace. The only two factors on which blacks and whites do not
differ are work satisfaction (p=0.083) and loyalty (p=0.131). As indicated, it is also important to consider
the practical significance of a difference. The differences between blacks and whites are of practical
significance only with regard to distributive justice (d=0.93), autonomy (d=0.60) and respect (d=0.54). With
regard to distributive justice, the mean scores indicate that the actual decisions taken on AA issues strongly
influence whites’ perceptions (0=33.755) about the fairness of AA. Blacks (0=27.069), on the other hand,
are less concerned about most of the decisions taken on AA when forming a perception of the fairness of
AA. A possible explanation could be that most AA decisions favour blacks and they are therefore unlikely
to question the fairness of a decision.
Regarding treatment in the workplace, blacks, unlike whites, believe that they receive little autonomy
(0=28.962) and respect (0=22.118). However, blacks and whites seem to be equally satisfied and loyal.
This is surprising if one considers the fact that blacks believe that they are treated with little respect and
are given little responsibility.
8.3.1.3 Marital status
According to table 8.24, married and single employees differ significantly (p<0.001) with regard to
distributive justice (p=0.003), work satisfaction (p=0.002) and participation (p=0.007). These differences,
however, are not of practical significance since all the practical significance values are less than 0.50.
According to the mean scores, married employees (0=32.251) regard distributive justice issues as vital to
the fairness of AA. Married employees are also more satisfied (0=14.869) and participative (0=14.738)
than single employees.
8.3.1.4 Number of years in current position
According to table 8.25, employees with more than two years of service in a specific position differ
significantly from employees with less than two years of service with regard to loyalty. The two-tailed
significance value (p=0.019) is less than 0.05 which indicates that this difference is statistically significant.
Although the mean scores indicate that employees with more years of service (0=15.093) tend to be slightly
more loyal, the effect size (d = 0.31) of the difference between employees with one to two years of service
and employees with more than two years is so small that it is negligible.
8.3.1.5 Years service at the bank
Table 8.26 indicates that significant differences (p<0.05) exist between employees with seven or more
years of service and employees with less than seven years’ service. There are statistically significant
differences between these two groups of employees with regard to distributive justice (p=0.000), how AA
employees are treated with regard to autonomy (p=0.004) and respect (p=0.001), and their behaviour in
UUnniivveerrssiittyy ooff PPrreettoorriiaa eettdd –– CCooeettzzeeee,, MM ((22000055))

8.25
terms of satisfaction (p=0.006), participation (p=0.027) and loyalty (p=0.028). However the practical
significance of these differences is small (d<0.50), and one can therefore conclude that the number of
years’ service has only a minor effect on the perceptions of the fairness of AA, treatment of AA employees
in the workplace and commitment. According to the mean scores, although these are not conclusive,
employees with more than seven years of service (0=33.041) seem to regard distributive justice issues as
critical to the fairness of AA. They also believe that employees from designated groups do receive
autonomy (0=33.205) and are treated with respect (0=25.849) in the workplace. Regarding commitment,
employees with more than seven years of service tend to be more participative (0=14.744) and loyal
(0=15.093). Since there is a significant association (eta = 0.498) between years of service at the bank and
ethnicity, it is possible that ethnicity rather than the number of years of service determines perceptions of
AA fairness and the treatment of AA employees.
8.3.1.6 Staff category
According to table 8.27, there are significant differences (p<0.05) between management and clerical staff
in respect of distributive justice (p=0.000), autonomy (p=0.005), respect (p=0.004) and participation
(p=0.000).
As far as the practical significance of differences between management and clerical staff is concerned, it
is only with regard to distributive justice (d>0.50) that the difference is of any practical importance. AA
decisions such as giving AA employees token positions, paying unrealistically high salaries to AA
managers, appointing less qualified employees, focusing on the development and advancement of AA
employees, and making selection decisions based on criteria such as ethnicity and gender play a prominent
role in forming perceptions about the fairness of AA. According to the mean scores, management view
distributive justice (0=33.442), the criteria used when dealing with AA issues (0=24.173) and the way
people are treated (0=32.541) as vital considerations when forming perceptions about the fairness of AA.
In contrast to the opinion of clerical staff, management believe that employees from designated groups are
given autonomy (0=33.233) and treated with respect (0=25.757). Management appear to be more satisfied
(0=14.799) and participative (0=14.985) than clerical staff.
UUnniivveerrssiittyy ooff PPrreettoorriiaa eettdd –– CCooeettzzeeee,, MM ((22000055))

8.26
TABLE 8.22: STUDENTS’ T-TEST: COMPARISON OF MEAN SCORES OF GENDER GROUPINGS IN RESPECT OF THE BEHAVIOURAL DOMAINS
Behavioural domain Gender N Mean Std deviation Levene's Test for
Equality of Variances
t df Sig. (2-
tailed)
p
Practical
significance
dF Sig
B. INTERACTIONAL JUSTICE Male 120 30.946 8.316 0.279 0.598 -1.062 347 0.289 Female 229 31.929 8.160 -1.055 237.761 0.292B. PROCEDURAL JUSTICE Male 120 25.773 7.802 0.083 0.774 -1.174 347 0.241(Input) Female 229 26.834 8.129 -1.189 250.584 0.235B. PROCEDURAL JUSTICE Male 120 23.088 7.023 0.234 0.629 -0.306 347 0.760(Criteria) Female 229 23.334 7.213 -0.309 247.451 0.758B. DISTRIBUTIVE JUSTICE Male 120 31.427 8.600 4.581 0.033* 0.213 347 0.832 Female 229 31.239 7.400 0.203 212.544 0.839C. AUTONOMY Male 120 32.414 7.377 1.760 0.185 0.643 347 0.520 Female 229 31.854 7.893 0.657 256.423 0.512C. RESPECT Male 120 24.512 6.614 1.732 0.189 -0.332 347 0.740 Female 229 24.769 7.024 -0.338 254.762 0.735C. RESPONSIBILITY Male 120 14.388 4.251 2.925 0.088 0.585 347 0.559 Female 229 14.086 4.752 0.605 266.241 0.546C. REALISTIC EXPECTATIONS Male 120 16.737 4.218 0.093 0.760 -0.264 347 0.792 Female 229 16.860 4.081 -0.261 234.867 0.794D. OBEDIENCE Male 120 57.303 6.267 0.174 0.677 -1.999 347 0.046 0.22 Female 229 58.688 6.088 -1.981 235.710 0.049D. SATISFACTION Male 120 14.204 2.901 0.047 0.829 -1.216 347 0.225 Female 229 14.600 2.888 -1.215 240.791 0.226D. PARTICIPATION Male 120 14.783 2.488 2.137 0.145 1.784 347 0.075 Female 229 14.236 2.839 1.859 270.971 0.064D. LOYALTY Male 120 13.589 4.080 1.910 0.168 -2.912 347 0.004 0.31 Female 229 15.064 4.696 -3.042 272.917 0.003
* Unequal variance
U Un ni iv ve er rs si it ty y o of f P Pr re et to or ri ia a e et td d – – C C
o oe et tz ze ee e, , M M ( (2 20 00 05 5) )

8.27
TABLE 8.23: STUDENTS’ T-EST: COMPARISON OF THE MEAN SCORES OF ETHNIC GROUPINGS IN RESPECT OF THE BEHAVIOURAL DOMAINS
Behavioural domain Ethnic
group
N Mean Std
Deviation
Levene's Test for
Equality of Variances
t df Sig. (2-
tailed)
p
Practical
significance
d F Sig.
B. INTERACTIONAL JUSTICE Black 128 29.950 9.564 15.113 0.000* -2.870 347 0.004 White 221 32.542 7.175 -2.663 210.389 0.008 0.27B. PROCEDURAL JUSTICE Black 128 25.345 8.208 0.001 0.971 -2.000 347 0.046 0.21(Input) White 221 27.120 7.859 -1.977 255.987 0.049B. PROCEDURAL JUSTICE Black 128 21.787 7.215 0.031 0.861 -2.945 347 0.003 0.32(Criteria) White 221 24.097 6.972 -2.918 257.958 0.004B. DISTRIBUTIVE JUSTICE Black 128 27.070 7.094 0.316 0.574 -8.436 347 0.000 0.93 White 221 33.755 7.159 -8.457 267.335 0.000C. AUTONOMY Black 128 28.962 8.018 3.278 0.071 -5.961 347 0.000 0.60 White 221 33.833 6.947 -5.739 235.719 0.000C. RESPECT Black 128 22.118 7.442 11.642 0.001* -5.517 347 0.000 White 221 26.165 6.068 -5.227 224.418 0.000 0.54C. RESPONSIBILITY Black 128 13.462 4.506 0.381 0.538 -2.270 347 0.024 0.25 White 221 14.611 4.583 -2.281 269.052 0.023C. EXPECTATIONS Black 128 16.053 4.343 2.939 0.087 -2.662 347 0.008 0.28 White 221 17.261 3.932 -2.592 244.411 0.010D. OBEDIENCE Black 128 57.132 6.438 0.631 0.428 -2.505 347 0.013 0.26 White 221 58.837 5.944 -2.452 248.423 0.015D. SATISFACTION Black 128 14.092 3.232 4.197 0.041* -1.833 347 0.068 White 221 14.679 2.663 -1.742 226.349 0.083D. PARTICIPATION Black 128 13.665 2.903 3.015 0.083 -4.039 347 0.000 0.41 White 221 14.864 2.532 -3.895 237.011 0.000D. LOYALTY Black 128 14.074 4.752 1.797 0.181 -1.514 347 0.131 White 221 14.836 4.403 -1.484 249.113 0.139
* Unequal variance
U Un ni iv ve er rs si it ty y o of f P Pr re et to or ri ia a e et td d – – C C
o oe et tz ze ee e, , M M ( (2 20 00 05 5) )

8.28
TABLE 8.24: STUDENTS’ T-TEST: COMPARISON OF THE MEAN SCORES OF MARITAL STATUS GROUPINGS IN RESPECT OF THE
BEHAVIOURAL DOMAINS
Behavioural domain Marital
status
N Mean Std deviation Levene's Test for
Equality of Variances
t df Sig. (2-
tailed)
p
Practical
significance
dF Sig
B. INTERACTIONAL JUSTICE Single 132 31.067 8.774 1.992 0.159 -0.953 346 0.341 Married 216 31.933 7.870 -0.928 254.065 0.354B. PROCEDURAL JUSTICE Single 132 26.400 8.318 0.873 0.351 -0.088 346 0.930(Input) Married 216 26.477 7.858 -0.086 264.852 0.931B. PROCEDURAL JUSTICE Single 132 22.657 7.357 0.521 0.471 -1.166 346 0.245(Criteria) Married 216 23.576 6.994 -1.151 266.178 0.251B. DISTRIBUTIVE JUSTICE Single 132 29.725 7.762 0.222 0.638 -2.953 346 0.003 0.33 Married 216 32.251 7.734 -2.950 276.226 0.003C. AUTONOMY Single 132 31.261 8.548 5.969 0.015* -1.421 346 0.156 Married 216 32.467 7.102 -1.359 238.931 0.175C. RESPECT Single 132 24.087 7.145 1.068 0.302 -1.226 346 0.221 Married 216 25.019 6.707 -1.208 263.511 0.228C. RESPONSIBILITY Single 132 14.132 4.557 0.109 0.741 -0.194 346 0.846 Married 216 14.231 4.617 -0.195 279.797 0.846C. REALISTIC EXPECTATIONS Single 132 16.995 4.188 0.001 0.975 0.615 346 0.539 Married 216 16.714 4.098 0.612 272.323 0.541D. OBEDIENCE Single 132 57.742 5.944 0.003 0.956 -1.090 346 0.276 Married 216 58.486 6.321 -1.106 290.183 0.269D. SATISFACTION Single 132 13.804 3.289 7.065 0.008* -3.375 346 0.001 Married 216 14.869 2.556 -3.179 226.673 0.002 0.32D. PARTICIPATION Single 132 13.898 2.985 3.987 0.047* -2.809 346 0.005 Married 216 14.738 2.524 -2.698 242.267 0.007 0.28D. LOYALTY Single 132 14.321 4.820 2.399 0.122 -0.788 346 0.431 Married 216 14.717 4.373 -0.770 256.423 0.442
* Unequal variance
U Un ni iv ve er rs si it ty y o of f P Pr re et to or ri ia a e et td d – – C C
o oe et tz ze ee e, , M M ( (2 20 00 05 5) )

8.29
TABLE 8.25: STUDENTS’ T-TEST: COMPARISON OF THE MEAN SCORES OF NUMBER OF YEARS IN CURRENT POSITION GROUPINGS IN
RESPECT OF THE BEHAVIOURAL DOMAINS
Behavioural domain Years in
current
position
N Mean Std deviation Levene's Test t df Sig. (2-tailed)
p
Practical
significance
dF Sig.
B. INTERACTIONAL JUSTICE 1-2 years 159 31.551 9.059 9.513 0.002* -0.004 341 0.997 3-66 years 184 31.555 7.397 -0.004 305.079 0.997B. PROCEDURAL JUSTICE 1-2 years 159 27.066 8.014 0.112 0.739 1.537 341 0.125(Input) 3-66 years 184 25.738 7.948 1.536 333.027 0.126B. PROCEDURAL JUSTICE 1-2 years 159 23.566 7.450 1.015 0.314 0.899 341 0.369(Criteria) 3-66 years 184 22.871 6.875 0.893 324.414 0.372B. DISTRIBUTIVE JUSTICE 1-2 years 159 30.924 8.165 0.545 0.461 -0.897 341 0.370 3-66 years 184 31.688 7.603 -0.893 325.625 0.373C. AUTONOMY 1-2 years 159 31.825 7.799 0.069 0.794 -0.213 341 0.832 3-66 years 184 32.001 7.499 -0.212 329.643 0.832C. RESPECT 1-2 years 159 24.243 7.357 5.681 0.018* -1.021 341 0.308 3-66 years 184 25.005 6.458 -1.012 317.085 0.312C. RESPONSIBILITY 1-2 years 159 13.802 4.573 0.059 0.808 -1.356 341 0.176 3-66 years 184 14.471 4.541 -1.355 333.132 0.176C. REALISTIC EXPECTATIONS 1-2 years 159 16.582 4.073 0.126 0.723 -0.877 341 0.381 3-66 years 184 16.973 4.154 -0.879 335.608 0.380D. OBEDIENCE 1-2 years 159 57.890 5.723 0.573 0.450 -0.758 341 0.449 3-66 years 184 58.399 6.586 -0.766 340.988 0.444D. SATISFACTION 1-2 years 159 14.229 3.059 2.155 0.143 -1.232 341 0.219 3-66 years 184 14.617 2.761 -1.223 321.313 0.222D. PARTICIPATION 1-2 years 159 14.371 2.586 0.730 0.393 -0.273 341 0.785 3-66 years 184 14.451 2.782 -0.274 339.161 0.784D. LOYALTY 1-2 years 159 13.905 4.568 0.076 0.783 -2.352 341 0.019 0.25 3-66 years 184 15.057 4.484 -2.349 331.934 0.019
* Unequal variance
U Un ni iv ve er rs si it ty y o of f P Pr re et to or ri ia a e et td d – – C C
o oe et tz ze ee e, , M M ( (2 20 00 05 5) )

8.30
TABLE 8.26: STUDENTS’ T-TEST: COMPARISON OF THE MEAN SCORES OF YEARS’ SERVICE AT THE BANK GROUPINGS IN RESPECT OF
THE BEHAVIOURAL DOMAINS
Behavioural domain Years service N Mean Std. Deviation Levene's Test for
Equality of Variances
t df Sig. (2-
tailed)
p
Practical
significance
d F Sig.
B. INTERACTIONAL JUSTICE 1-7 years 173 31.011 8.824 4.588 0.033* -1.273 343 0.204 8-39 years 172 32.140 7.603 -1.274 336.217 0.204B. PROCEDURAL JUSTICE 1-7 years 173 26.360 8.225 0.164 0.686 -0.138 343 0.890(Input) 8-39 years 172 26.479 7.900 -0.138 342.593 0.890B. PROCEDURAL JUSTICE 1-7 years 173 22.692 7.232 0.023 0.879 -1.370 343 0.172(Criteria) 8-39 years 172 23.746 7.054 -1.370 342.876 0.172B. DISTRIBUTIVE JUSTICE 1-7 years 173 29.599 7.932 0.005 0.945 -4.167 343 0.000 0.43 8-39 years 172 33.041 7.398 -4.168 341.607 0.000C. AUTONOMY 1-7 years 173 30.809 7.714 0.556 0.456 -2.914 343 0.004 0.31 8-39 years 172 33.205 7.556 -2.914 342.924 0.004C. RESPECT 1-7 years 173 23.402 7.201 4.803 0.029* -3.345 343 0.001 8-39 years 172 25.849 6.360 -3.347 338.298 0.001 0.34C. RESPONSIBILITY 1-7 years 173 13.746 4.615 0.030 0.862 -1.955 343 0.051 8-39 years 172 14.705 4.496 -1.955 342.859 0.051C. REALISTIC EXPECTATIONS 1-7 years 173 16.448 4.265 2.836 0.093 -1.731 343 0.084 8-39 years 172 17.215 3.960 -1.732 341.410 0.084D. OBEDIENCE 1-7 years 173 57.763 5.907 0.029 0.864 -1.326 343 0.186 8-39 years 172 58.645 6.448 -1.325 340.047 0.186D. SATISFACTION 1-7 years 173 14.032 3.013 2.417 0.121 -2.741 343 0.006 0.1 8-39 years 172 14.880 2.730 -2.742 340.088 0.006D. PARTICIPATION 1-7 years 173 14.093 2.824 1.164 0.281 -2.220 343 0.027 0.23 8-39 years 172 14.744 2.619 -2.220 341.353 0.027D. LOYALTY 1-7 years 173 14.019 4.502 0.102 0.750 -2.201 343 0.028 0.24 8-39 years 172 15.093 4.562 -2.201 342.876 0.028
* Unequal variance
U Un ni iv ve er rs si it ty y o of f P Pr re et to or ri ia a e et td d – – C C
o oe et tz ze ee e, , M M ( (2 20 00 05 5) )

8.31
TABLE 8.27: STUDENTS’ T-TEST: COMPARISON OF THE MEAN SCORES OF STAFF CATEGORY GROUPINGS IN RESPECT OF THE
BEHAVIOURAL DOMAINS
Behavioural domain Staff category N Mean Std deviation Levene's Test for
Equality of Variances
t df Sig. (2-
tailed)
p
Practical
significance
dF Sig
B. INTERACTIONAL JUSTICE Management 168 32.541 7.495 4.061 0 .045* 2.092 347 0.037 Clerical 181 30.709 8.759 2.104 344.761 0.036 0.21B. PROCEDURAL JUSTICE Management 168 26.914 7.585 1.226 0.269 0.998 347 0.319(Input) Clerical 181 26.056 8.408 1.002 346.723 0.317B. PROCEDURAL JUSTICE Management 168 24.173 6.945 0.038 0.846 2.344 347 0.020 0.25(Criteria) Clerical 181 22.392 7.229 2.347 346.583 0.019B. DISTRIBUTIVE JUSTICE Management 168 33.442 7.490 0.321 0.571 5.094 347 0.000 0.54 Clerical 181 29.319 7.615 5.097 345.826 0.000C. AUTONOMY Management 168 33.233 6.701 9.759 0.002* 2.795 347 0.005 Clerical 181 30.945 8.416 2.819 339.258 0.005 0.27C. RESPECT Management 168 25.757 5.858 18.242 0.000* 2.846 347 0.005 Clerical 181 23.681 7.584 2.873 336.094 0.004 0.27C. RESPONSIBILITY Management 168 14.645 4.273 1.381 0.241 1.794 347 0.074 Clerical 181 13.767 4.825 1.802 346.251 0.072C. REALISTIC EXPECTATIONS Management 168 16.793 3.997 1.327 0.250 -0.108 347 0.914 Clerical 181 16.841 4.248 -0.108 346.934 0.914D. OBEDIENCE Management 168 58.460 5.630 4.449 0.036* 0.722 347 0.471 Clerical 181 57.982 6.650 0.727 344.150 0.468D. SATISFACTION Management 168 14.799 2.402 15.015 0.000* 2.090 347 0.037 Clerical 181 14.154 3.262 2.114 330.247 0.035 0.2D. PARTICIPATION Management 168 14.985 2.351 10.650 0.001* 3.765 347 0.000 Clerical 181 13.904 2.955 3.796 339.193 0.000 0.37D. LOYALTY Management 168 14.171 4.241 3.208 0.074 -1.532 347 0.126 Clerical 181 14.915 4.789 -1.539 346.253 0.125
* Unequal variance
U Un ni iv ve er rs si it ty y o of f P Pr re et to or ri ia a e et td d – – C C
o oe et tz ze ee e, , M M ( (2 20 00 05 5) )

8.32
8.3.2 One-way analysis of variance
In this study, one-way ANOVA was used for education, salary and employment equity appointments since
all of these variables had three categories. Tables 8.28 to 8.35 indicate how the various categories of the
independent variables (education level, salary and EE appointments) differ with regard to the various
factors.
In order to determine an appropriate post hoc test, the overall significance (F-value) and the assumption
of equality of variances were investigated. Whenever the overall F-value was significant (F<0.05) a post
hoc test was performed. Where Levene’s tests of homogeneity of variance confirmed that the assumption
of equality of variance was met (p>0.05), Tukey’s post hoc multiple comparison technique was used to
determine the statistical difference between groups. Dunnett C’s-test was employed in cases where these
conditions were not met (p<0.05).
8.3.2.1 Education
The respondents were categorised according to three categories of education level, namely grade 12 and
lower, certificate/diploma and degree. Tables 8.28 to 8.30 provide the group means, Levene’s test of
homogeneity of variance and the significance of the variances and the overall F-values. The results of the
post hoc tests are also provided.
8.3.2.2 Salary
The respondents were categorised according to three categories of salary, level namely R5 000 or less,
R5 001 - R15 000, and more than R15 000. Tables 8.31 to 8.33 provide the group means, Levene’s test
of homogeneity of variance and the significance of the variances and the overall F-values. The results of
the post hoc tests are also provided.
8.3.2.3 Employment equity appointment
The responses of respondents regarding whether they had been appointed by means of AA were
categorised into three categories, namely yes, no, and not sure. The number of respondents who
answered “yes” was 44, while the number of respondents who answered “no” was 226. Of the respondents,
75 were “not sure” whether they had been appointed by means of AA. In order to make meaningful
comparisons it was decided to use a harmonic mean sample size of 44 respondents for each of these
categories. The SPSS program was used to select 44 cases by means of random sampling. Tables 8.34
to 8.35 indicate the group means, Levene’s test of homogeneity of variance and the significance of the
variances and the overall F-values. The results of the post hoc test are also provided.
UUnniivveerrssiittyy ooff PPrreettoorriiaa eettdd –– CCooeettzzeeee,, MM ((22000055))

8.33
TABLE 8.28: COMPARISON OF MEAN SCORES OF THE THREE EDUCATION GROUPS IN RESPECT OF THE BEHAVIOURAL DOMAINS
Behavioural domain Education level N Mean Std. Deviation Levene’s Test Anova F Significance
p(F)F Sig
B. INTERACTIONAL JUSTICE Grade12 & lower 171 32.038 8.265 0.024 0.976 0.564 0.569 Cert/Diploma 110 31.065 8.279
Degree 65 31.157 8.067 Total 346 31.563 8.223B. PROCEDURAL JUSTICE Grade12 & lower 171 27.019 7.932 1.535 0.217 0.923 0.398(Input) Cert/Diploma 110 26.098 8.481
Degree 65 25.574 7.473 Total 346 26.455 8.027B. PROCEDURAL JUSTICE Grade12 & lower 171 23.184 6.918 1.536 0.217 0.089 0.915(Criteria) Cert/Diploma 110 23.415 7.565 Degree 65 22.951 7.088 Total 346 23.213 7.142B. DISTRIBUTIVE JUSTICE Grade12 & lower 171 30.756 7.577 2.092 0.125 1.483 0.228 Cert/Diploma 110 31.290 7.677 Degree 65 32.724 8.763 Total 346 31.295 7.854C. AUTONOMY Grade12 & lower 171 32.044 8.036 1.294 0.275 0.327 0.722 Cert/Diploma 110 31.588 7.728 Degree 65 32.554 6.789 Total 346 31.995 7.704C. RESPECT Grade12 & lower 171 24.625 7.064 0.994 0.371 0.404 0.668 Cert/Diploma 110 25.020 6.984 Degree 65 24.052 6.279 Total 346 24.643 6.887
U Un ni iv ve er rs si it ty y o of f P Pr re et to or ri ia a e et td d – – C C
o oe et tz ze ee e, , M M ( (2 20 00 05 5) )
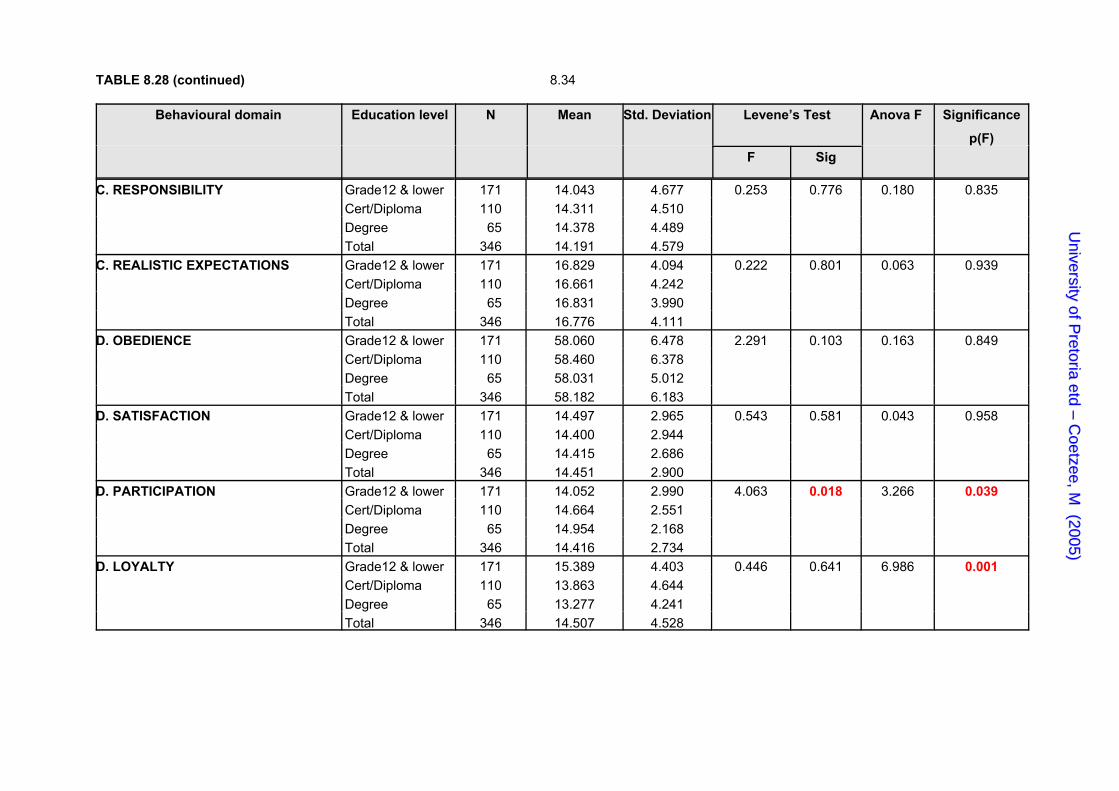
TABLE 8.28 (continued) 8.34
Behavioural domain Education level N Mean Std. Deviation Levene’s Test Anova F Significance
p(F)F Sig
C. RESPONSIBILITY Grade12 & lower 171 14.043 4.677 0.253 0.776 0.180 0.835 Cert/Diploma 110 14.311 4.510
Degree 65 14.378 4.489 Total 346 14.191 4.579C. REALISTIC EXPECTATIONS Grade12 & lower 171 16.829 4.094 0.222 0.801 0.063 0.939 Cert/Diploma 110 16.661 4.242 Degree 65 16.831 3.990 Total 346 16.776 4.111D. OBEDIENCE Grade12 & lower 171 58.060 6.478 2.291 0.103 0.163 0.849 Cert/Diploma 110 58.460 6.378 Degree 65 58.031 5.012 Total 346 58.182 6.183D. SATISFACTION Grade12 & lower 171 14.497 2.965 0.543 0.581 0.043 0.958 Cert/Diploma 110 14.400 2.944 Degree 65 14.415 2.686 Total 346 14.451 2.900D. PARTICIPATION Grade12 & lower 171 14.052 2.990 4.063 0.018 3.266 0.039 Cert/Diploma 110 14.664 2.551 Degree 65 14.954 2.168 Total 346 14.416 2.734D. LOYALTY Grade12 & lower 171 15.389 4.403 0.446 0.641 6.986 0.001 Cert/Diploma 110 13.863 4.644 Degree 65 13.277 4.241 Total 346 14.507 4.528
U Un ni iv ve er rs si it ty y o of f P Pr re et to or ri ia a e et td d – – C C
o oe et tz ze ee e, , M M ( (2 20 00 05 5) )

8.35
In this study, because “loyalty” had an equal variance, Tukey’s test was used. Levene’s test indicated that
the F-value for ”participation” was significant (<0.05). Hence because its variance was unequal, a Dunnett
C’s was used. Since the group sizes were unequal, the harmonic mean of the group sizes (98.933) was
used.
TABLE 8.29: TUKEY’S HSD MULTIPLE COMPARISON OF EDUCATION IN RELATION TO
LOYALTY
(I) EDUCATION (J) EDUCATION Mean Difference
(I-J)
Std. Error Sig Practical
significance Grade12 & lower Cert/Diploma 1.526* 0.544 0.015 0.34 Degree 2.113* 0.650 0.004 0.47 Cert/Diploma Grade12 & lower -1.526* 0.544 0.015 Degree 0.587 0.696 0.678 Degree Grade12 & lower -2.112* 0.649 0.004 Cert/Diploma -0.587 0.696 0.678
The mean difference is significant at the 0.05 level.
According to table 8.29, there is a significant difference in the mean loyalty scores between employees with
grade 12 or lower (0=15.389) and employees with a degree (0=13.277). As indicated in table 7.8, mostly
management and whites have degrees. One should thus be cautious about concluding that education
influences an employee’s loyalty instead of considering the impact of staff category on an employee’s
loyalty.
TABLE 8.30: DUNNETT C’S MULTIPLE COMPARISON OF EDUCATION IN RELATION TO
PARTICIPATION
(I) EDUCATION (J) EDUCATION Mean difference
(I-J)
Std error Sig Practical
significance
Grade12 & lower Cert/DiplomaDegree
-0.612-0.902*
0.3340.353
0.1850.050
0.230.33
Cert/Diploma Grade 12 & lowerDegree
0.612-0.290
0.3340.363
0.1850.793
0.230.11
Degree Grade 12 & lowerCert/Diploma
0.902*0.290
0.3530.363
0.0500.793
0.330.11
Table 8.30 indicates statistically significant differences (p<0.05) in the mean participation scores between
employees with different educational qualifications. Although employees with degrees seem to be more
participative, the practical significance of effect size is small (d = 0.33).
UUnniivveerrssiittyy ooff PPrreettoorriiaa eettdd –– CCooeettzzeeee,, MM ((22000055))

TABLE 8.31 (continued) 8.36
TABLE 8.31: COMPARISON OF THE MEAN SCORES OF THE THREE SALARY GROUPS IN RESPECT OF THE BEHAVIOURAL DOMAINS
Behavioural domain Salary N Mean Std. Deviation Levene’s Test Anova F Significance
p(F)F Sig B. INTERACTIONAL JUSTICE R5 000 & less 159 31.026 8.786 2.634 0.073 0.973 0.379 R5 001-R15 000 112 32.437 8.047 R15 001 & more 70 31.725 7.106 Total 341 31.633 8.225 B. PROCEDURAL JUSTICE R5 000 & less 159 26.334 8.325 0.154 0.858 0.491 0.612 (Input) R5 001-R15 000 112 27.101 7.872 R15 001 & more 70 25.985 7.608 Total 341 26.514 8.023 B. PROCEDURAL JUSTICE R5 000 & less 159 22.685 7.207 0.101 0.990 1.161 0.315 (Criteria) R5 001-R15 000 112 23.741 6.897 R15 001 & more 70 23.998 7.032 Total 341 23.302 7.074 B. DISTRIBUTIVE JUSTICE R5 000 & less 159 29.607 7.753 0.221 0.802 9.168 0.000 R5 001-R15 000 112 31.743 7.311 R15 001 & more 70 34.220 7.956 Total 341 31.256 7.835 C. AUTONOMY R5 000 & less 159 31.126 8.576 8.139 0.000 3.620 0.028 R5 001-R15 000 112 31.983 7.379 R15 001 & more 70 34.071 5.412 Total 341 32.012 7.690 C. RESPECT R5 000 & less 159 23.872 7.566 7.642 0.001 3.075 0.048 R5 001-R15 000 112 24.950 6.361 R15 001 & more 70 26.263 5.683 Total 341 24.717 6.871
C. RESPONSIBILITY R5000 & less 159 14.133 4.934 1.979 0.140 1.902 0.151
U Un ni iv ve er rs si it ty y o of f P Pr re et to or ri ia a e et td d – – C C
o oe et tz ze ee e, , M M ( (2 20 00 05 5) )
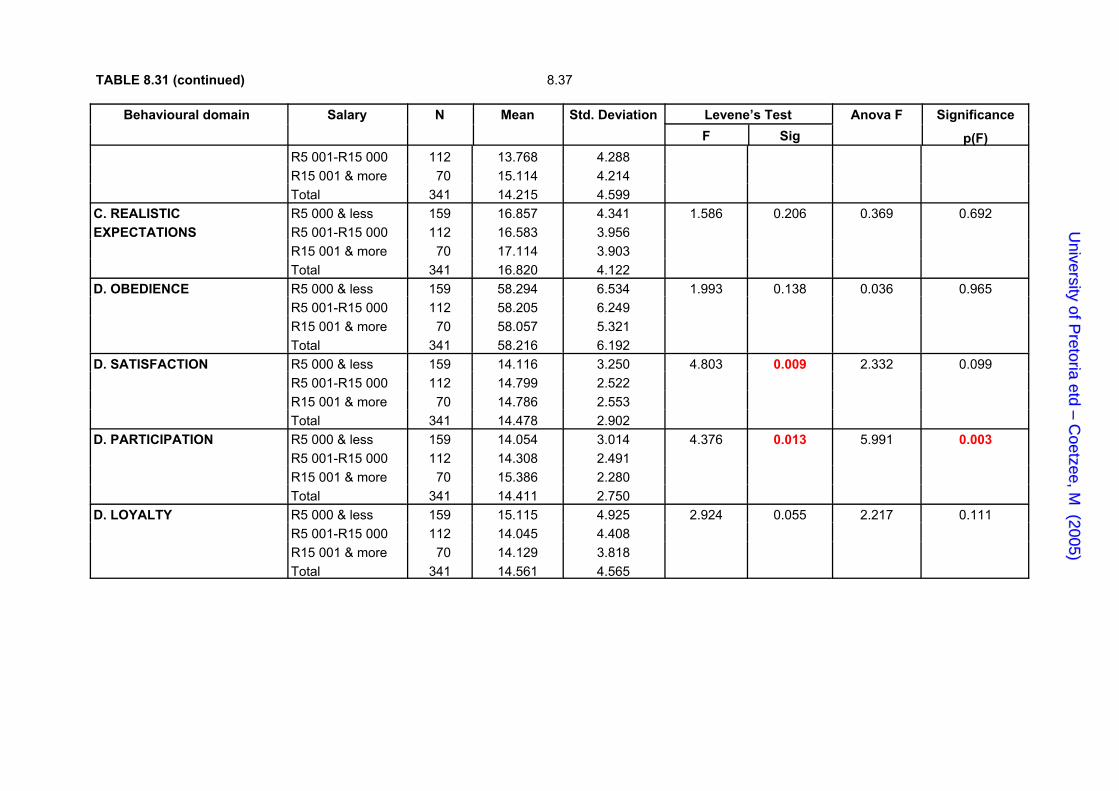
TABLE 8.31 (continued) 8.37
Behavioural domain Salary N Mean Std. Deviation Levene’s Test Anova F Significance
p(F)F Sig R5 001-R15 000 112 13.768 4.288 R15 001 & more 70 15.114 4.214 Total 341 14.215 4.599 C. REALISTIC R5 000 & less 159 16.857 4.341 1.586 0.206 0.369 0.692 EXPECTATIONS R5 001-R15 000 112 16.583 3.956 R15 001 & more 70 17.114 3.903 Total 341 16.820 4.122 D. OBEDIENCE R5 000 & less 159 58.294 6.534 1.993 0.138 0.036 0.965 R5 001-R15 000 112 58.205 6.249 R15 001 & more 70 58.057 5.321 Total 341 58.216 6.192 D. SATISFACTION R5 000 & less 159 14.116 3.250 4.803 0.009 2.332 0.099 R5 001-R15 000 112 14.799 2.522 R15 001 & more 70 14.786 2.553 Total 341 14.478 2.902 D. PARTICIPATION R5 000 & less 159 14.054 3.014 4.376 0.013 5.991 0.003 R5 001-R15 000 112 14.308 2.491 R15 001 & more 70 15.386 2.280 Total 341 14.411 2.750 D. LOYALTY R5 000 & less 159 15.115 4.925 2.924 0.055 2.217 0.111 R5 001-R15 000 112 14.045 4.408 R15 001 & more 70 14.129 3.818 Total 341 14.561 4.565
U Un ni iv ve er rs si it ty y o of f P Pr re et to or ri ia a e et td d – – C C
o oe et tz ze ee e, , M M ( (2 20 00 05 5) )

8.38
TABLE 8.32: TUKEY’S HSD MULTIPLE COMPARISON OF SALARY IN RELATION
TO DISTRIBUTIVE JUSTICE
(I) SALARY (J) SALARY Mean Difference
(I-J)
Std. Error Sig Practical
significance R5 000 & less R5 001-R15 000 -2.136 0.944 0.063 0.28 R15 001 & more -4.613* 1.098 0.000 0.60 R5 001-R15 000 R5 000 & less 2.136 0.944 0.063 0.28 R15 001 & more -2.477 1.166 0.087 R15 001 & more R5 000 & less 4.613* 1.098 0.000 0.60 R5 001-R15 000 2.477 1.166 0.087
* The mean difference is significant at the 0.05 level.
According to table 8.32, there is a significant difference (p<0.001) in the mean scores relating to distributive
justice between employees earning R5 000 or less per month and employees earning R15 001 and more per
month. The mean scores of employees earning low salaries (0=29.607) indicate that distributive justice strongly
influences their perceptions of the fairness of AA. They are therefore most concerned about decisions affecting
their financial position. Decisions on appointments, promotions, career advancement and training thus have
a direct influence on their perceptions of the fairness of AA.
TABLE 8.33: DUNNETT C’S MULTIPLE COMPARISON OF SALARY IN RELATION TO AUTONOMY,
RESPECT AND PARTICIPATION
Dependent
Variable
(I) SALARY (J) SALARY Mean
Difference
(I-J)
Std. Error Sig Practical
significance
AUTONOMY R5 000 & less R15 001 & more -2.945* 1.095 0.014 0.39 R5 001-R15 000 R15 001 & more -2.088 1.163 0.123 RESPECT R5 000 & less R15 001 & more -2.390* 0.980 0.027 0.35 R5 001-R15 000 R15 001 & more -1.312 1.041 0.325 PARTICIPATION R5 000 & less R15 001 & more -1.332* 0.389 0.001 0.49 R5 001-R15 000 R15 001 & more -1.078* 0.413 0.020 0.40
* The mean difference is significant at the 0.05 level.
There are significant differences (p<0.05) between the various income groups with regard to autonomy
(p=0.014), respect (p=0.027) and participation (p=0.001). Employees earning R5 000-00 or less believe that
AA employees do not have autonomy or are treated with respect in the workplace. Contrary to this belief,
employees earning R15 000-00 or more believe that AA employees do have autonomy and are treated with
respect. Since income level correlates highly with staff category and ethnicity, one should guard against
concluding that income level influences autonomy, respect and participation without taking into consideration
the influence of variables such as staff category and ethnicity. Employees earning R15 000-00 or more appear
to be more participative than employees earning less than R15 000-00. Once again, variables such as staff
category (management) or ethnicity (whites) could account for the difference in participation.
UUnniivveerrssiittyy ooff PPrreettoorriiaa eettdd –– CCooeettzzeeee,, MM ((22000055))

8.39
TABLE 8.34: COMPARISON OF THE MEAN SCORES OF THE THREE EE APPOINTMENT GROUPS IN RESPECT OF THE BEHAVIOURAL DOMAINS
Behavioural domain EEAppointment N Mean Std.
DeviationLevene’s Test Anova F Significance
p(F)F SigB. INTERACTIONAL JUSTICE Yes 44 33.697 8.732 1.951 0.146 1.597 0.206
No 44 31.178 6.257 Not sure 44 31.021 8.423
B. PROCEDURAL JUSTICE(Input)
Yes 44 28.963 8.356 2.421 0.093 2.633 0.076 No 44 25.834 7.376 Not sure 44 25.804 6.401
B. PROCEDURAL JUSTICE(Criteria)
Yes 44 23.869 7.059 0.378 0.686 0.442 0.644 No 44 22.590 5.988 Not sure 44 23.011 6.427
B. DISTRIBUTIVE JUSTICE Yes 44 31.897 7.675 1.299 0.276 3.344 0.038 No 44 32.575 7.372 Not sure 44 28.902 6.132
C. AUTONOMY Yes 44 32.977 8.485 1.055 0.351 1.381 0.255 No 44 32.345 6.949 Not sure 44 30.302 8.165
C. RESPECT Yes 44 25.298 7.719 0.800 0.452 1.388 0.253 No 44 25.205 6.472 Not sure 44 23.054 7.197
C. RESPONSIBILITY Yes 44 15.929 4.752 1.111 0.332 4.555 0.012 No 44 13.996 3.779 Not sure 44 13.114 4.819
C. REALISTIC EXPECTATIONS Yes 44 17.774 3.990 0.358 0.777 3.777 0.025 No 44 16.636 4.232 Not sure 44 15.301 4.443
D. OBEDIENCE Yes 44 58.260 5.562 0.822 0.442 0.761 0.469 No 44 58.818 5.521 Not sure 44 57.264 6.792
U Un ni iv ve er rs si it ty y o of f P Pr re et to or ri ia a e et td d – – C C
o oe et tz ze ee e, , M M ( (2 20 00 05 5) )

TABLE 8.34 (continued) 8.40
Behavioural domain EEAppointment N Mean Std.
DeviationLevene’s Test Anova F Significance
p(F)F SigD. SATISFACTION Yes 44 15.296 2.922 0.869 0.422 2.858 0.061
No 44 14.568 2.510 Not sure 44 13.799 3.319
D. PARTICIPATION Yes 44 14.397 2.805 0.120 0.887 0.218 0.805 No 44 14.375 2.672 Not sure 44 14.056 2.651
D. LOYALTY Yes 44 15.822 5.318 0.853 0.429 1.747 0.178 No 44 14.636 4.177 Not sure 44 13.938 4.773
U Un ni iv ve er rs si it ty y o of f P Pr re et to or ri ia a e et td d – – C C
o oe et tz ze ee e, , M M ( (2 20 00 05 5) )

8.41
TABLE 8.35: TUKEY’S HSD MULTIPLE COMPARISON OF EMPLOYMENT EQUITY
APPOINTMENTS IN RELATION TO DISTRIBUTIVE JUSTICE, RESPONSIBILITY AND EXPECTATIONS
Dependent Variable
(I) EE
appointed
(J) EE
appointed
Mean
Difference
(I-J)
Std.
Error
Sig. Practical
significance
B. DISTRIBUTIVE
JUSTICE
Yes No -0.678 1.512 0.895 Not sure 2.996 1.512 0.121
No Yes 0.678 1.512 0.895 Not sure 3.674* 1.512 0.040 0.51
Not sure Yes -2.996 1.512 0.121 No -3.674* 1.512 0.040 0.51
C. RESPONSIBILITY Yes No 1.933 0.954 0.110 Not sure 2.815* 0.954 0.010 0.63
No Yes -1.933 0.954 0.110 Not sure 0.882 0.954 0.626
Not sure Yes -2.815* 0.954 0.010 0.63 No -0.882 0.954 0.626
C. EXPECTATIONS Yes No 1.138 0.901 0.419 Not sure 2.474* 0.901 0.020 0.59
No Yes -1.138 0.901 0.419 Not sure 1.336 0.901 0.303
Not sure Yes -2.474* 0.901 0.020 0.59 No -1.336 0.901 0.303
* The mean difference is significant at the .05 level.
There are significant differences between AA employees and employees who have not been appointed on the
basis of AA with regard to perceptions of distributive justice, the responsibility accorded to AA employees and
how realistic managers’ expectations are of AA employees’ performance. For future research, it would be
worthwhile to investigate the role EE appointment plays. Since the size of each subset in the sample was only
44, it could not be regarded as being representative of the population.
8.3.3 Multiple analysis of variance (MANOVA)
As mentioned in the previous chapter, multiple analyses of variance (MANOVA) is utilised to determine the main
and interactional effects of partially independent categorical variables on multiple dependent variables.
MANOVA is thus a complex statistic similar to ANOVA but with multiple dependent variables analysed together.
MANOVA provides a multivariate F-value based on a linear combination of dependent variables, as well as
univariate F-values, for each separate dependent variable. The dependent variables should be related
conceptually correlated with one another at a low to moderate level. If they are too highly correlated one runs
the risk of multicollinearity. If they are uncorrelated there is usually no reason to analyse them together.
UUnniivveerrssiittyy ooff PPrreettoorriiaa eettdd –– CCooeettzzeeee,, MM ((22000055))

8.42
The GLM procedure of SPSS (http://search.marsfind.com/ufts.html) was used to analyse the differences in the
vectors of means between groups in respect of ethnicity, gender, staff category and age in the 12 behavioural
domains. Several analyses were performed to investigate the following scenarios:
(1) As factors gender and ethnic groups, and as covariates, age, years in current position and at the bank,
educational qualification and gross salary.
(2) As factors gender and staff groups, and as covariates, age, years in current position and at the bank,
educational qualification and gross salary.
(3) As factors gender, ethnic and staff groups, and as covariates, age, years in current position and at the
bank, educational qualification and gross salary.
As a first step it was necessary to perform the Box’s M test. This test for homogeneity of variance-covariance
matrices indicates that the observed covariance matrices of the dependent variables are equal across the groups
and that the assumption of equality has not been violated. Whenever the F-values are significant, the
assumption of normality is violated. In such a case nonparametric tests should be used and the GLM procedure
should be performed on rank data. In general this was found to be the case in the current study.
(http://www.med.monash.edu.au/psych/research/rda/Nonparametric%20MANOVA.htm)
As indicated in tables 8.36 to 8.38, all the covariance matrices of the dependent variables are significant and
thus unequal. The Box’s M test results for the above scenarios are as follows:
TABLE 8.36: BOX’S M TEST OF EQUALITY OF COVARIANCE MATRICES IN RESPECT OF GENDER
AND ETHNIC GROUPS
Box M 388.214F 1.521df1 234df2 68710.158Sig. 0,000
TABLE 8.37: BOX’S M TEST OF EQUALITY OF COVARIANCE MATRICES IN RESPECT OF GENDER
AND STAFF GROUPS
Box M 374.606F 1.462df1 234df2 57234.025Sig. 0,000
UUnniivveerrssiittyy ooff PPrreettoorriiaa eettdd –– CCooeettzzeeee,, MM ((22000055))

8.43
TABLE 8.38: BOX’S M TEST OF EQUALITY OF COVARIANCE MATRICES IN RESPECT OF GENDER,
ETHNIC AND STAFF GROUPS
Box M 511.97F 1.463df1 312df2 48100.194Sig. 0,000
Multivariate tests were performed as the next stage in the analyses of rank data.
8.3.3.1 MANOVA: behavioural domains by gender and ethnicity
The factors included gender and ethnicity groups and the covariates were age, years in current position
and bank, educational qualification and gross salary
TABLE 8.39: MANOVA: BEHAVIOURAL DOMAINS BY GENDER AND ETHNICITY
EFFECT
VALUE F
SIG
<0.05 PARTIAL ETA
SQUAREDIntercept Pillai's Trace 0.201 6.457 0.000 0.201
Wilks' Lambda 0.799 6.457 0.000 0.201 Hotelling's Trace 0.252 6.457 0.000 0.201 Roy's Largest Root 0.252 6.457 0.000 0.201
Age Pillai's Trace 0.075 2.093 0.017 0.075 Wilks' Lambda 0.925 2.093 0.017 0.075 Hotelling's Trace 0.082 2.093 0.017 0.075 Roy's Largest Root 0.082 2.093 0.017 0.075
Years in current position Pillai's Trace 0.027 0.718 0.734 0.027 Wilks' Lambda 0.973 0.718 0.734 0.027 Hotelling's Trace 0.028 0.718 0.734 0.027 Roy's Largest Root 0.028 0.718 0.734 0.027
Years of service at bank Pillai's Trace 0.013 0.350 0.979 0.013 Wilks' Lambda 0.987 0.350 0.979 0.013 Hotelling's Trace 0.014 0.350 0.979 0.013 Roy's Largest Root 0.014 0.350 0.979 0.013
Education Pillai's Trace 0.049 1.324 0.203 0.049 Wilks' Lambda 0.951 1.324 0.203 0.049 Hotelling's Trace 0.052 1.324 0.203 0.049 Roy's Largest Root 0.052 1.324 0.203 0.049
Salary Pillai's Trace 0.066 1.805 0.047 0.066 Wilks' Lambda 0.934 1.805 0.047 0.066 Hotelling's Trace 0.070 1.805 0.047 0.066 Roy's Largest Root 0.070 1.805 0.047 0.066
UUnniivveerrssiittyy ooff PPrreettoorriiaa eettdd –– CCooeettzzeeee,, MM ((22000055))
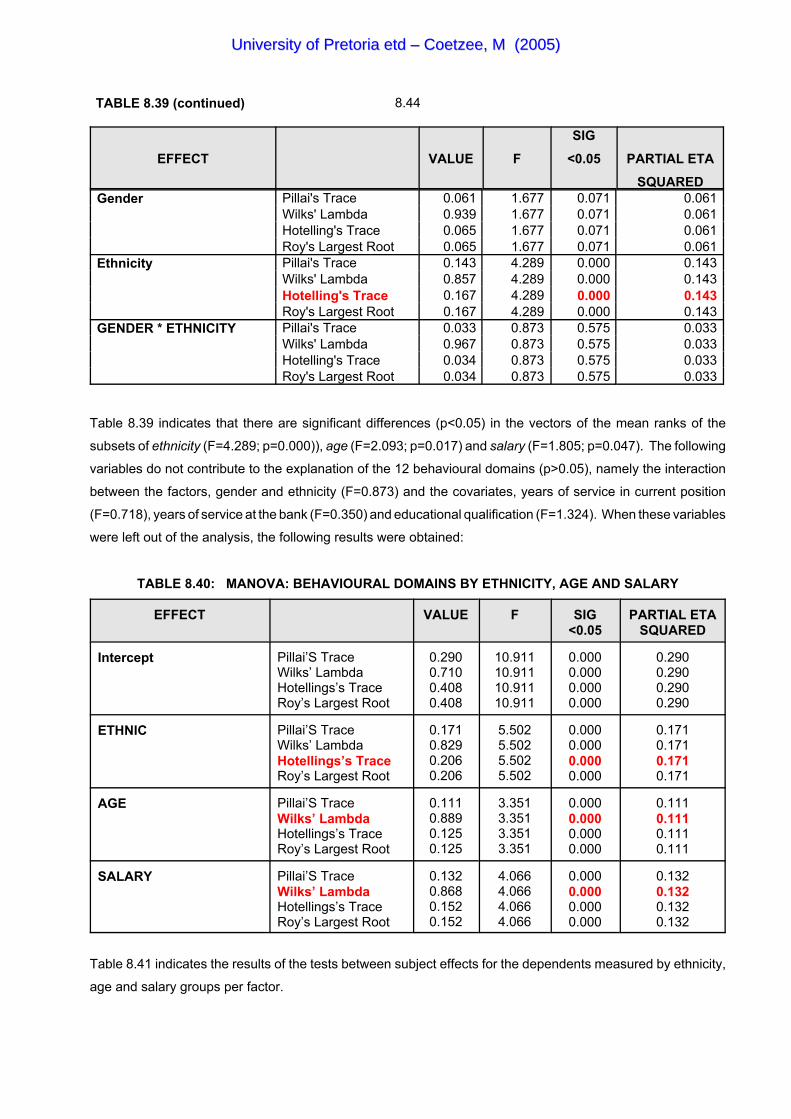
TABLE 8.39 (continued) 8.44
EFFECT
VALUE F
SIG
<0.05 PARTIAL ETA
SQUAREDGender Pillai's Trace 0.061 1.677 0.071 0.061
Wilks' Lambda 0.939 1.677 0.071 0.061 Hotelling's Trace 0.065 1.677 0.071 0.061 Roy's Largest Root 0.065 1.677 0.071 0.061
Ethnicity Pillai's Trace 0.143 4.289 0.000 0.143 Wilks' Lambda 0.857 4.289 0.000 0.143 Hotelling's Trace 0.167 4.289 0.000 0.143 Roy's Largest Root 0.167 4.289 0.000 0.143
GENDER * ETHNICITY Pillai's Trace 0.033 0.873 0.575 0.033 Wilks' Lambda 0.967 0.873 0.575 0.033 Hotelling's Trace 0.034 0.873 0.575 0.033 Roy's Largest Root 0.034 0.873 0.575 0.033
Table 8.39 indicates that there are significant differences (p<0.05) in the vectors of the mean ranks of the
subsets of ethnicity (F=4.289; p=0.000)), age (F=2.093; p=0.017) and salary (F=1.805; p=0.047). The following
variables do not contribute to the explanation of the 12 behavioural domains (p>0.05), namely the interaction
between the factors, gender and ethnicity (F=0.873) and the covariates, years of service in current position
(F=0.718), years of service at the bank (F=0.350) and educational qualification (F=1.324). When these variables
were left out of the analysis, the following results were obtained:
TABLE 8.40: MANOVA: BEHAVIOURAL DOMAINS BY ETHNICITY, AGE AND SALARY
EFFECT VALUE F SIG<0.05
PARTIAL ETASQUARED
Intercept Pillai’S TraceWilks’ LambdaHotellings’s TraceRoy’s Largest Root
0.2900.7100.4080.408
10.91110.91110.91110.911
0.0000.0000.0000.000
0.2900.2900.2900.290
ETHNIC Pillai’S TraceWilks’ LambdaHotellings’s TraceRoy’s Largest Root
0.1710.8290.2060.206
5.5025.5025.5025.502
0.0000.0000.0000.000
0.1710.1710.1710.171
AGE Pillai’S TraceWilks’ LambdaHotellings’s TraceRoy’s Largest Root
0.1110.8890.1250.125
3.3513.3513.3513.351
0.0000.0000.0000.000
0.1110.1110.1110.111
SALARY Pillai’S TraceWilks’ LambdaHotellings’s TraceRoy’s Largest Root
0.1320.8680.1520.152
4.0664.0664.0664.066
0.0000.0000.0000.000
0.1320.1320.1320.132
Table 8.41 indicates the results of the tests between subject effects for the dependents measured by ethnicity,
age and salary groups per factor.
UUnniivveerrssiittyy ooff PPrreettoorriiaa eettdd –– CCooeettzzeeee,, MM ((22000055))

8.45
TABLE 8.41: ANOVA: BEHAVIOURAL DOMAINS BY ETHNICITY, AGE AND SALARY
SOURCE DEPENDENT VARIABLE FSIG
<0.01PARTIAL ETA
SQUARED
CORRECTEDMODEL
RANK of B. INTERACTIONAL JUSTICE 2.301 0.077 0.020RANK of B. PROCEDURAL JUSTICE (Input) 0.972 0.406 0.009RANK of B. PROCEDURAL JUSTICE (Criteria) 3.431 0.017 0.030RANK of B. DISTRIBUTIVE JUSTICE 25.149 0.000 0.185RANK of C. AUTONOMY 11.639 0.000 0.095RANK of C. RESPECT 8.504 0.000 0.071RANK of C. RESPONSIBILITY 3.874 0.010 0.034RANK of C. REALISTIC EXPECTATIONS 1.837 0.140 0.016RANK of D. OBEDIENCE 4.528 0.004 0.039RANK of D. SATISFACTION 5.660 0.001 0.049RANK of D. PARTICIPATION 6.919 0.000 0.059RANK of D. LOYALTY 9.803 0.000 0.081
INTERCEPT
RANK of B. INTERACTIONAL JUSTICE 52.422 0.000 0.136RANK of B. PROCEDURAL JUSTICE (Input) 58.305 0.000 0.149RANK of B. PROCEDURAL JUSTICE (Criteria) 54.683 0.000 0.141RANK of B. DISTRIBUTIVE JUSTICE 35.972 0.000 0.098RANK of C. AUTONOMY 67.032 0.000 0.168RANK of C. RESPECT 46.942 0.000 0.124RANK of C. RESPONSIBILITY 62.128 0.000 0.158RANK of C. REALISTIC EXPECTATIONS 67.098 0.000 0.168RANK of D. OBEDIENCE 45.478 0.000 0.120RANK of D. SATISFACTION 20.431 0.000 0.058RANK of D. PARTICIPATION 46.371 0.000 0.123RANK of D. LOYALTY 18.877 0.000 0.054
ETHNICITY
RANK of B. INTERACTIONAL 3.123 0.078 0.009RANK of B. PROCEDURAL JUSTICE (Input) 1.904 0.169 0.006RANK of B. PROCEDURAL JUSTICE (Criteria) 4.073 0.044 0.012RANK of B. DISTRIBUTIVE JUSTICE 38.580 0.000 0.104RANK of C. AUTONOMY 25.441 0.000 0.071RANK of C. RESPECT 15.430 0.000 0.044RANK of C. RESPONSIBILITY 3.101 0.079 0.009RANK of C. REALISTIC EXPECTATIONS 4.141 0.043 0.012RANK of D. OBEDIENCE 5.539 0.019 0.016RANK of D. SATISFACTION 0.013 0.911 00.00RANK of D. PARTICIPATION 7.253 0.010 0.021RANK of D. LOYALTY 0.463 0.497 0.001
UUnniivveerrssiittyy ooff PPrreettoorriiaa eettdd –– CCooeettzzeeee,, MM ((22000055))
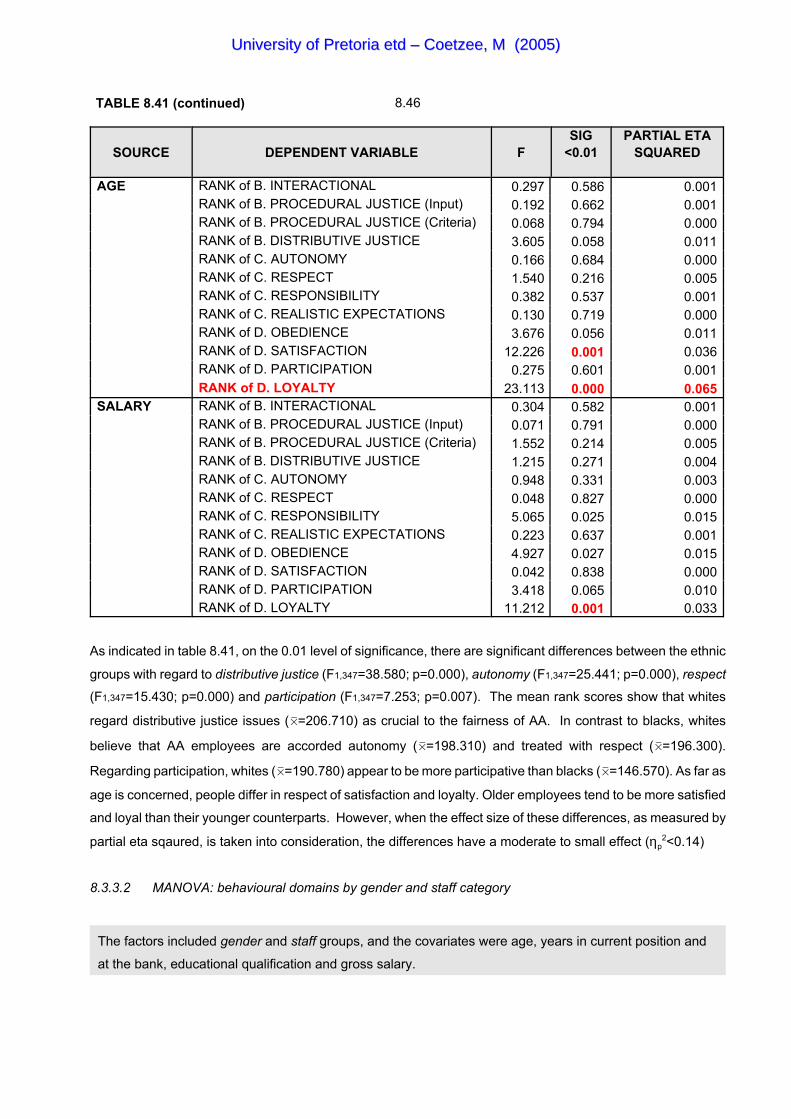
TABLE 8.41 (continued) 8.46
SOURCE DEPENDENT VARIABLE FSIG
<0.01PARTIAL ETA
SQUARED
AGE
RANK of B. INTERACTIONAL 0.297 0.586 0.001RANK of B. PROCEDURAL JUSTICE (Input) 0.192 0.662 0.001RANK of B. PROCEDURAL JUSTICE (Criteria) 0.068 0.794 0.000RANK of B. DISTRIBUTIVE JUSTICE 3.605 0.058 0.011RANK of C. AUTONOMY 0.166 0.684 0.000RANK of C. RESPECT 1.540 0.216 0.005RANK of C. RESPONSIBILITY 0.382 0.537 0.001RANK of C. REALISTIC EXPECTATIONS 0.130 0.719 0.000RANK of D. OBEDIENCE 3.676 0.056 0.011RANK of D. SATISFACTION 12.226 0.001 0.036RANK of D. PARTICIPATION 0.275 0.601 0.001RANK of D. LOYALTY 23.113 0.000 0.065
SALARY
RANK of B. INTERACTIONAL 0.304 0.582 0.001RANK of B. PROCEDURAL JUSTICE (Input) 0.071 0.791 0.000RANK of B. PROCEDURAL JUSTICE (Criteria) 1.552 0.214 0.005RANK of B. DISTRIBUTIVE JUSTICE 1.215 0.271 0.004RANK of C. AUTONOMY 0.948 0.331 0.003RANK of C. RESPECT 0.048 0.827 0.000RANK of C. RESPONSIBILITY 5.065 0.025 0.015RANK of C. REALISTIC EXPECTATIONS 0.223 0.637 0.001RANK of D. OBEDIENCE 4.927 0.027 0.015RANK of D. SATISFACTION 0.042 0.838 0.000RANK of D. PARTICIPATION 3.418 0.065 0.010RANK of D. LOYALTY 11.212 0.001 0.033
As indicated in table 8.41, on the 0.01 level of significance, there are significant differences between the ethnic
groups with regard to distributive justice (F1,347=38.580; p=0.000), autonomy (F1,347=25.441; p=0.000), respect
(F1,347=15.430; p=0.000) and participation (F1,347=7.253; p=0.007). The mean rank scores show that whites
regard distributive justice issues (0=206.710) as crucial to the fairness of AA. In contrast to blacks, whites
believe that AA employees are accorded autonomy (0=198.310) and treated with respect (0=196.300).
Regarding participation, whites (0=190.780) appear to be more participative than blacks (0=146.570). As far as
age is concerned, people differ in respect of satisfaction and loyalty. Older employees tend to be more satisfied
and loyal than their younger counterparts. However, when the effect size of these differences, as measured by
partial eta sqaured, is taken into consideration, the differences have a moderate to small effect (ηp2<0.14)
8.3.3.2 MANOVA: behavioural domains by gender and staff category
The factors included gender and staff groups, and the covariates were age, years in current position and
at the bank, educational qualification and gross salary.
UUnniivveerrssiittyy ooff PPrreettoorriiaa eettdd –– CCooeettzzeeee,, MM ((22000055))

8.47
TABLE 8.42: MANOVA: BEHAVIOURAL DOMAINS BY GENDER AND STAFF
EFFECT
VALUE F SIG
<0.05
PARTIAL ETA
SQUAREDIntercept Pillai's Trace 0.168 5.174 0.000 0.168
Wilks' Lambda 0.832 5.174 0.000 0.168 Hotelling's Trace 0.202 5.174 0.000 0.168 Roy's Largest Root 0.202 5.174 0.000 0.168
Age Pillai's Trace 0.077 2.132 0.015 0.077 Wilks' Lambda 0.923 2.132 0.015 0.077 Hotelling's Trace 0.083 2.132 0.015 0.077 Roy's Largest Root 0.083 2.132 0.015 0.077
Years in current position Pillai's Trace 0.025 0.668 0.782 0.025 Wilks' Lambda 0.975 0.668 0.782 0.025 Hotelling's Trace 0.026 0.668 0.782 0.025 Roy's Largest Root 0.026 0.668 0.782 0.025
Years of service at bank Pillai's Trace 0.023 0.594 0.847 0.023 Wilks' Lambda 0.977 0.594 0.847 0.023 Hotelling's Trace 0.023 0.594 0.847 0.023 Roy's Largest Root 0.023 0.594 0.847 0.023
Education Pillai's Trace 0.043 1.146 0.322 0.043 Wilks' Lambda 0.957 1.146 0.322 0.043 Hotelling's Trace 0.045 1.146 0.322 0.043 Roy's Largest Root 0.045 1.146 0.322 0.043
Salary Pillai's Trace 0.049 1.312 0.210 0.049 Wilks' Lambda 0.951 1.312 0.210 0.049 Hotelling's Trace 0.051 1.312 0.210 0.049 Roy's Largest Root 0.051 1.312 0.210 0.049
Gender Pillai's Trace 0.054 1.454 0.140 0.054 Wilks' Lambda 0.946 1.454 0.140 0.054 Hotelling's Trace 0.057 1.454 0.140 0.054 Roy's Largest Root 0.057 1.454 0.140 0.054
Staff Pillai's Trace 0.061 1.669 0.073 0.061 Wilks' Lambda 0.939 1.669 0.073 0.061 Hotelling's Trace 0.065 1.669 0.073 0.061 Roy's Largest Root 0.065 1.669 0.073 0.061
GENDER * STAFF Pillai's Trace 0.019 0.501 0.913 0.019 Wilks' Lambda 0.981 0.501 0.913 0.019 Hotelling's Trace 0.020 0.501 0.913 0.019 Roy's Largest Root 0.020 0.501 0.913 0.019
With reference to table 8.42, the following variables do no affect the behavioural domains: years of service in
current position (p=0.782), years of service at the bank (p=0.847), educational qualification (p=0.322), salary
(p=0.210) and gender * staff (p=0.913).
Table 8.43 indicates the results of multivariate tests that have excluded the above variables, except for gender.
UUnniivveerrssiittyy ooff PPrreettoorriiaa eettdd –– CCooeettzzeeee,, MM ((22000055))
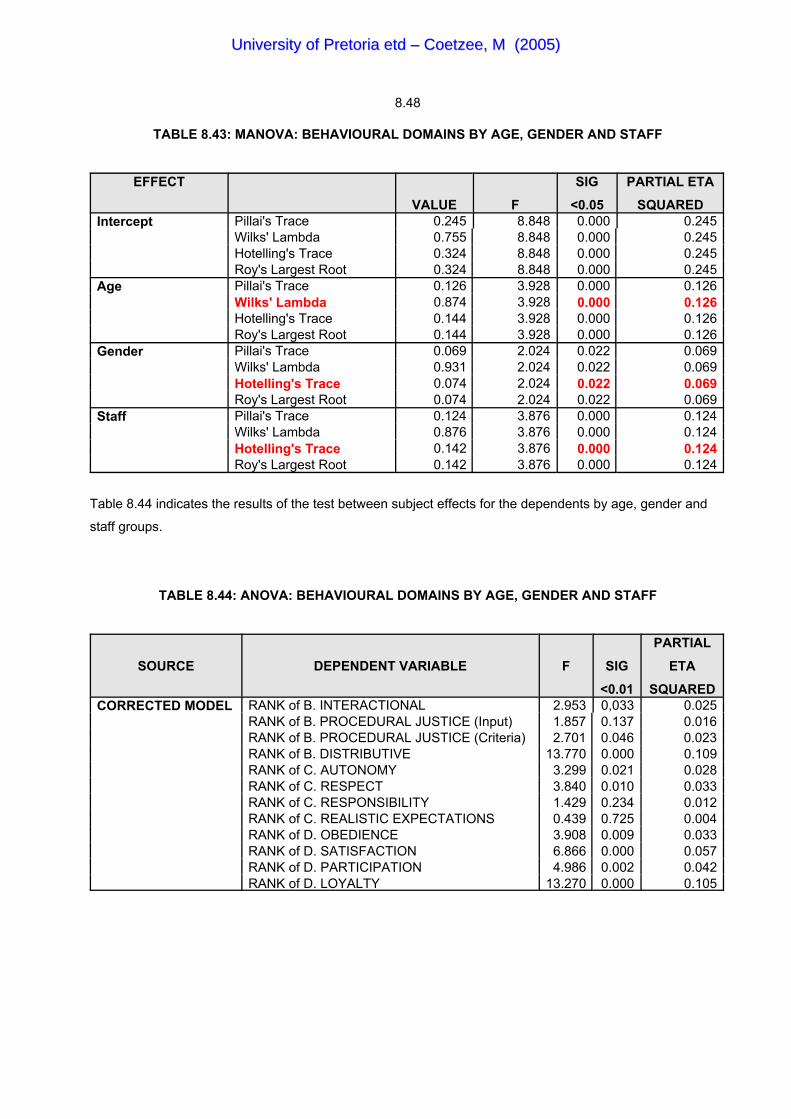
8.48
TABLE 8.43: MANOVA: BEHAVIOURAL DOMAINS BY AGE, GENDER AND STAFF
EFFECT
VALUE F
SIG
<0.05
PARTIAL ETA
SQUAREDIntercept Pillai's Trace 0.245 8.848 0.000 0.245
Wilks' Lambda 0.755 8.848 0.000 0.245 Hotelling's Trace 0.324 8.848 0.000 0.245 Roy's Largest Root 0.324 8.848 0.000 0.245
Age Pillai's Trace 0.126 3.928 0.000 0.126 Wilks' Lambda 0.874 3.928 0.000 0.126 Hotelling's Trace 0.144 3.928 0.000 0.126 Roy's Largest Root 0.144 3.928 0.000 0.126
Gender Pillai's Trace 0.069 2.024 0.022 0.069 Wilks' Lambda 0.931 2.024 0.022 0.069 Hotelling's Trace 0.074 2.024 0.022 0.069 Roy's Largest Root 0.074 2.024 0.022 0.069
Staff Pillai's Trace 0.124 3.876 0.000 0.124 Wilks' Lambda 0.876 3.876 0.000 0.124 Hotelling's Trace 0.142 3.876 0.000 0.124 Roy's Largest Root 0.142 3.876 0.000 0.124
Table 8.44 indicates the results of the test between subject effects for the dependents by age, gender and
staff groups.
TABLE 8.44: ANOVA: BEHAVIOURAL DOMAINS BY AGE, GENDER AND STAFF
SOURCE DEPENDENT VARIABLE F SIG
<0.01
PARTIAL
ETA
SQUAREDCORRECTED MODEL
RANK of B. INTERACTIONAL 2.953 0,033 0.025RANK of B. PROCEDURAL JUSTICE (Input) 1.857 0.137 0.016RANK of B. PROCEDURAL JUSTICE (Criteria) 2.701 0.046 0.023RANK of B. DISTRIBUTIVE 13.770 0.000 0.109RANK of C. AUTONOMY 3.299 0.021 0.028RANK of C. RESPECT 3.840 0.010 0.033RANK of C. RESPONSIBILITY 1.429 0.234 0.012RANK of C. REALISTIC EXPECTATIONS 0.439 0.725 0.004RANK of D. OBEDIENCE 3.908 0.009 0.033RANK of D. SATISFACTION 6.866 0.000 0.057RANK of D. PARTICIPATION 4.986 0.002 0.042RANK of D. LOYALTY 13.270 0.000 0.105
UUnniivveerrssiittyy ooff PPrreettoorriiaa eettdd –– CCooeettzzeeee,, MM ((22000055))
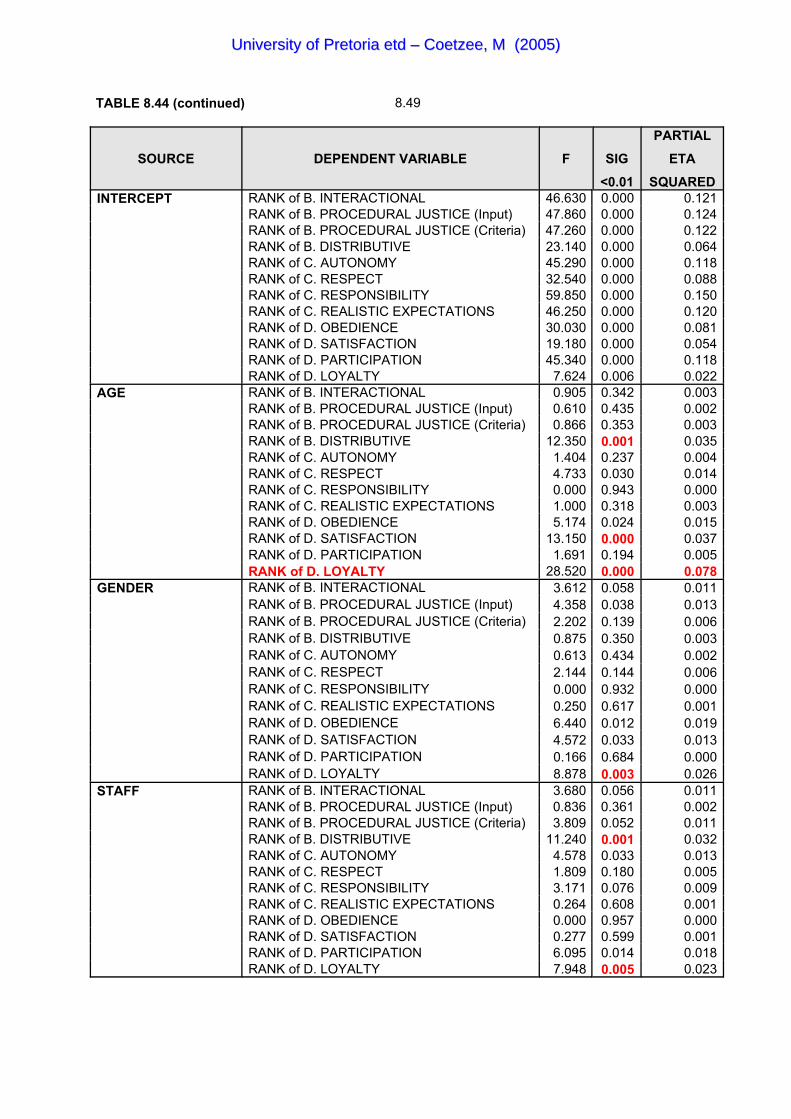
TABLE 8.44 (continued) 8.49
SOURCE DEPENDENT VARIABLE F SIG
<0.01
PARTIAL
ETA
SQUAREDINTERCEPT
RANK of B. INTERACTIONAL 46.630 0.000 0.121RANK of B. PROCEDURAL JUSTICE (Input) 47.860 0.000 0.124RANK of B. PROCEDURAL JUSTICE (Criteria) 47.260 0.000 0.122RANK of B. DISTRIBUTIVE 23.140 0.000 0.064RANK of C. AUTONOMY 45.290 0.000 0.118RANK of C. RESPECT 32.540 0.000 0.088RANK of C. RESPONSIBILITY 59.850 0.000 0.150RANK of C. REALISTIC EXPECTATIONS 46.250 0.000 0.120RANK of D. OBEDIENCE 30.030 0.000 0.081RANK of D. SATISFACTION 19.180 0.000 0.054RANK of D. PARTICIPATION 45.340 0.000 0.118RANK of D. LOYALTY 7.624 0.006 0.022
AGE
RANK of B. INTERACTIONAL 0.905 0.342 0.003RANK of B. PROCEDURAL JUSTICE (Input) 0.610 0.435 0.002RANK of B. PROCEDURAL JUSTICE (Criteria) 0.866 0.353 0.003RANK of B. DISTRIBUTIVE 12.350 0.001 0.035RANK of C. AUTONOMY 1.404 0.237 0.004RANK of C. RESPECT 4.733 0.030 0.014RANK of C. RESPONSIBILITY 0.000 0.943 0.000RANK of C. REALISTIC EXPECTATIONS 1.000 0.318 0.003RANK of D. OBEDIENCE 5.174 0.024 0.015RANK of D. SATISFACTION 13.150 0.000 0.037RANK of D. PARTICIPATION 1.691 0.194 0.005RANK of D. LOYALTY 28.520 0.000 0.078
GENDER
RANK of B. INTERACTIONAL 3.612 0.058 0.011RANK of B. PROCEDURAL JUSTICE (Input) 4.358 0.038 0.013RANK of B. PROCEDURAL JUSTICE (Criteria) 2.202 0.139 0.006RANK of B. DISTRIBUTIVE 0.875 0.350 0.003RANK of C. AUTONOMY 0.613 0.434 0.002RANK of C. RESPECT 2.144 0.144 0.006RANK of C. RESPONSIBILITY 0.000 0.932 0.000RANK of C. REALISTIC EXPECTATIONS 0.250 0.617 0.001RANK of D. OBEDIENCE 6.440 0.012 0.019RANK of D. SATISFACTION 4.572 0.033 0.013RANK of D. PARTICIPATION 0.166 0.684 0.000RANK of D. LOYALTY 8.878 0.003 0.026
STAFF
RANK of B. INTERACTIONAL 3.680 0.056 0.011RANK of B. PROCEDURAL JUSTICE (Input) 0.836 0.361 0.002RANK of B. PROCEDURAL JUSTICE (Criteria) 3.809 0.052 0.011RANK of B. DISTRIBUTIVE 11.240 0.001 0.032RANK of C. AUTONOMY 4.578 0.033 0.013RANK of C. RESPECT 1.809 0.180 0.005RANK of C. RESPONSIBILITY 3.171 0.076 0.009RANK of C. REALISTIC EXPECTATIONS 0.264 0.608 0.001RANK of D. OBEDIENCE 0.000 0.957 0.000RANK of D. SATISFACTION 0.277 0.599 0.001RANK of D. PARTICIPATION 6.095 0.014 0.018RANK of D. LOYALTY 7.948 0.005 0.023
UUnniivveerrssiittyy ooff PPrreettoorriiaa eettdd –– CCooeettzzeeee,, MM ((22000055))
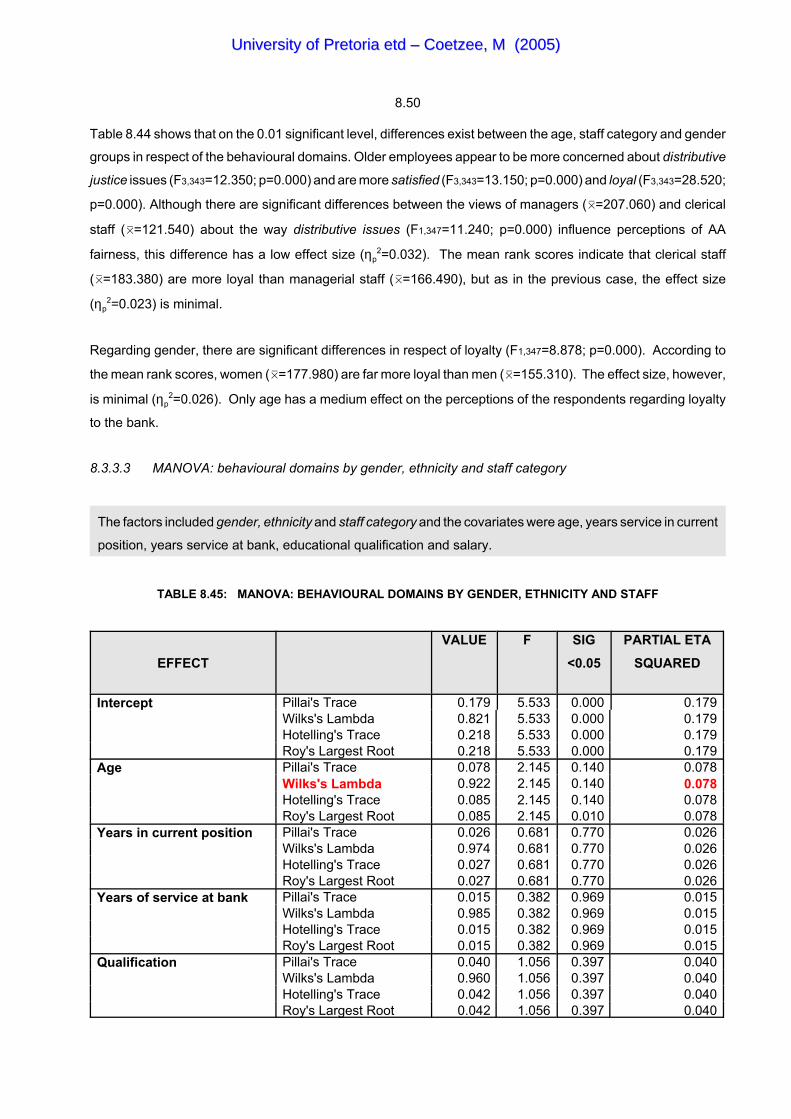
8.50
Table 8.44 shows that on the 0.01 significant level, differences exist between the age, staff category and gender
groups in respect of the behavioural domains. Older employees appear to be more concerned about distributive
justice issues (F3,343=12.350; p=0.000) and are more satisfied (F3,343=13.150; p=0.000) and loyal (F3,343=28.520;
p=0.000). Although there are significant differences between the views of managers (0=207.060) and clerical
staff (0=121.540) about the way distributive issues (F1,347=11.240; p=0.000) influence perceptions of AA
fairness, this difference has a low effect size (ηp2=0.032). The mean rank scores indicate that clerical staff
(0=183.380) are more loyal than managerial staff (0=166.490), but as in the previous case, the effect size
(ηp2=0.023) is minimal.
Regarding gender, there are significant differences in respect of loyalty (F1,347=8.878; p=0.000). According to
the mean rank scores, women (0=177.980) are far more loyal than men (0=155.310). The effect size, however,
is minimal (ηp2=0.026). Only age has a medium effect on the perceptions of the respondents regarding loyalty
to the bank.
8.3.3.3 MANOVA: behavioural domains by gender, ethnicity and staff category
The factors included gender, ethnicity and staff category and the covariates were age, years service in current
position, years service at bank, educational qualification and salary.
TABLE 8.45: MANOVA: BEHAVIOURAL DOMAINS BY GENDER, ETHNICITY AND STAFF
EFFECT
VALUE F SIG
<0.05
PARTIAL ETA
SQUARED
Intercept Pillai's Trace 0.179 5.533 0.000 0.179 Wilks's Lambda 0.821 5.533 0.000 0.179 Hotelling's Trace 0.218 5.533 0.000 0.179 Roy's Largest Root 0.218 5.533 0.000 0.179
Age Pillai's Trace 0.078 2.145 0.140 0.078 Wilks's Lambda 0.922 2.145 0.140 0.078 Hotelling's Trace 0.085 2.145 0.140 0.078 Roy's Largest Root 0.085 2.145 0.010 0.078
Years in current position Pillai's Trace 0.026 0.681 0.770 0.026 Wilks's Lambda 0.974 0.681 0.770 0.026 Hotelling's Trace 0.027 0.681 0.770 0.026 Roy's Largest Root 0.027 0.681 0.770 0.026
Years of service at bank Pillai's Trace 0.015 0.382 0.969 0.015 Wilks's Lambda 0.985 0.382 0.969 0.015 Hotelling's Trace 0.015 0.382 0.969 0.015 Roy's Largest Root 0.015 0.382 0.969 0.015
Qualification Pillai's Trace 0.040 1.056 0.397 0.040 Wilks's Lambda 0.960 1.056 0.397 0.040 Hotelling's Trace 0.042 1.056 0.397 0.040 Roy's Largest Root 0.042 1.056 0.397 0.040
UUnniivveerrssiittyy ooff PPrreettoorriiaa eettdd –– CCooeettzzeeee,, MM ((22000055))

TABLE 8.45 (continued) 8.51
EFFECT
VALUE F SIG
<0.05
PARTIAL ETA
SQUARED
Salary Pillai's Trace 0.050 1.324 0.204 0.050 Wilks's Lambda 0.950 1.324 0.204 0.050 Hotelling's Trace 0.052 1.324 0.204 0.050 Roy's Largest Root 0.052 1.324 0.204 0.050
Ethnicity Pillai's Trace 0.121 3.483 0.000 0.121 Wilks's Lambda 0.879 3.483 0.000 0.121 Hotelling's Trace 0.137 3.483 0.000 0.121 Roy's Largest Root 0.137 3.483 0.000 0.121
Staff Pillai's Trace 0.062 1.663 0.070 0.062 Wilks's Lambda 0.938 1.663 0.070 0.062 Hotelling's Trace 0.066 1.663 0.070 0.062 Roy's Largest Root 0.066 1.663 0.070 0.062
Gender Pillai's Trace 0.046 1.220 0.268 0.046 Wilks's Lambda 0.954 1.220 0.268 0.046 Hotelling's Trace 0.048 1.220 0.268 0.046 Roy's Largest Root 0.048 1.220 0.268 0.046
ETHNICITY * STAFF Pillai's Trace 0.048 1.283 0.227 0.048 Wilks's Lambda 0.952 1.283 0.227 0.048 Hotelling's Trace 0.051 1.283 0.227 0.048 Roy's Largest Root 0.051 1.283 0.227 0.048
ETHNICITY * GENDER Pillai's Trace 0.042 1.121 0.342 0.042 Wilks's Lambda 0.958 1.121 0.342 0.042 Hotelling's Trace 0.044 1.121 0.342 0.042 Roy's Largest Root 0.044 1.121 0.342 0.042
STAFF * GENDER Pillai's Trace 0.023 0.601 0.841 0.023 Wilks's Lambda 0.977 0.601 0.841 0.023 Hotelling's Trace 0.024 0.601 0.841 0.023 Roy's Largest Root 0.024 0.601 0.841 0.023
ETHNICITY * STAFF *GENDER
Pillai's Trace 0.028 0.725 0.727 0.028 Wilks's Lambda 0.972 0.725 0.727 0.028 Hotelling's Trace 0.029 0.725 0.727 0.028 Roy's Largest Root 0.029 0.725 0.727 0.028
Based on the results of the multivariate tests, the following variables do not affect the behavioural domains:
number of years of service in current position (p=0.770), years of service at bank (p=0.969), educational
qualification (p=0.397), salary (p=0.204), gender (p=0.268), as well as the following interactions: ethnicity *
gender (p=0.342), staff * gender (p=0.841), and ethnicity * staff * gender (p=0.727). With the exception of staff,
the variables which do not affect the behavioural domains were deleted and the following multivariate results
obtained:
UUnniivveerrssiittyy ooff PPrreettoorriiaa eettdd –– CCooeettzzeeee,, MM ((22000055))
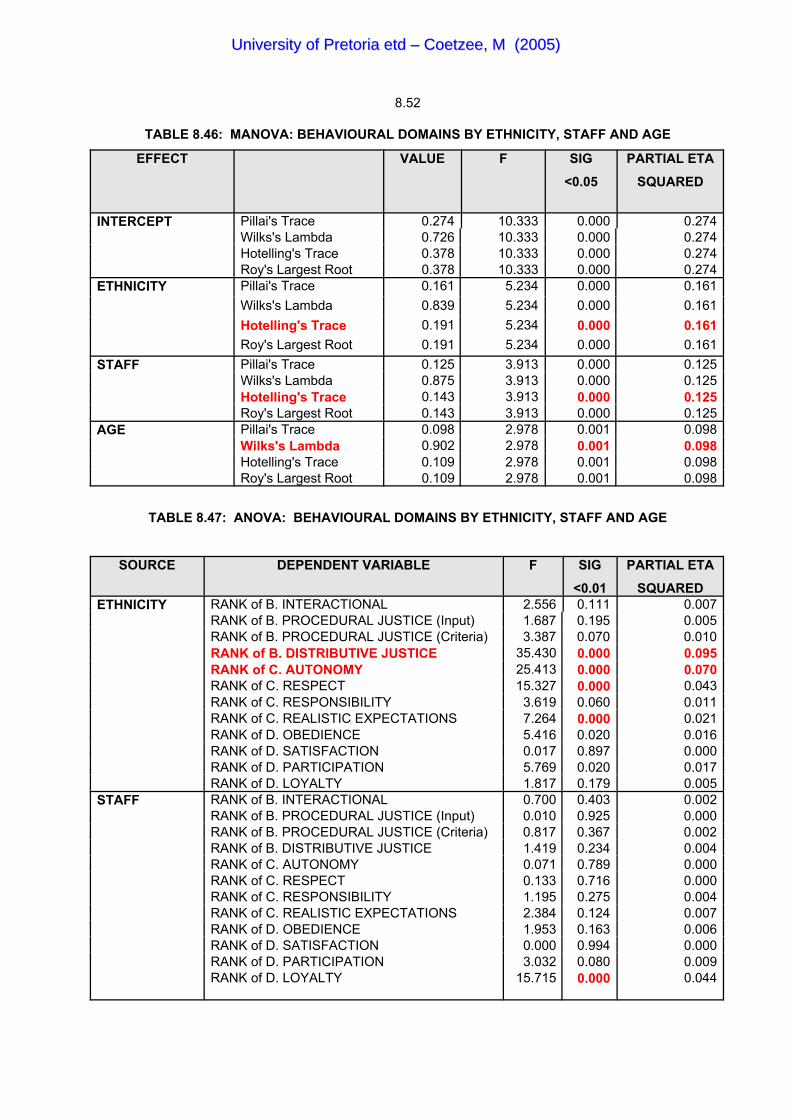
8.52
TABLE 8.46: MANOVA: BEHAVIOURAL DOMAINS BY ETHNICITY, STAFF AND AGE
EFFECT VALUE F SIG
<0.05
PARTIAL ETA
SQUARED
INTERCEPT Pillai's Trace 0.274 10.333 0.000 0.274 Wilks's Lambda 0.726 10.333 0.000 0.274 Hotelling's Trace 0.378 10.333 0.000 0.274 Roy's Largest Root 0.378 10.333 0.000 0.274
ETHNICITY Pillai's Trace 0.161 5.234 0.000 0.161 Wilks's Lambda 0.839 5.234 0.000 0.161 Hotelling's Trace 0.191 5.234 0.000 0.161 Roy's Largest Root 0.191 5.234 0.000 0.161
STAFF Pillai's Trace 0.125 3.913 0.000 0.125 Wilks's Lambda 0.875 3.913 0.000 0.125 Hotelling's Trace 0.143 3.913 0.000 0.125 Roy's Largest Root 0.143 3.913 0.000 0.125
AGE Pillai's Trace 0.098 2.978 0.001 0.098 Wilks's Lambda 0.902 2.978 0.001 0.098 Hotelling's Trace 0.109 2.978 0.001 0.098 Roy's Largest Root 0.109 2.978 0.001 0.098
TABLE 8.47: ANOVA: BEHAVIOURAL DOMAINS BY ETHNICITY, STAFF AND AGE
SOURCE DEPENDENT VARIABLE F SIG
<0.01
PARTIAL ETA
SQUAREDETHNICITY
RANK of B. INTERACTIONAL 2.556 0.111 0.007RANK of B. PROCEDURAL JUSTICE (Input) 1.687 0.195 0.005RANK of B. PROCEDURAL JUSTICE (Criteria) 3.387 0.070 0.010RANK of B. DISTRIBUTIVE JUSTICE 35.430 0.000 0.095RANK of C. AUTONOMY 25.413 0.000 0.070RANK of C. RESPECT 15.327 0.000 0.043RANK of C. RESPONSIBILITY 3.619 0.060 0.011RANK of C. REALISTIC EXPECTATIONS 7.264 0.000 0.021RANK of D. OBEDIENCE 5.416 0.020 0.016RANK of D. SATISFACTION 0.017 0.897 0.000RANK of D. PARTICIPATION 5.769 0.020 0.017RANK of D. LOYALTY 1.817 0.179 0.005
STAFF
RANK of B. INTERACTIONAL 0.700 0.403 0.002RANK of B. PROCEDURAL JUSTICE (Input) 0.010 0.925 0.000RANK of B. PROCEDURAL JUSTICE (Criteria) 0.817 0.367 0.002RANK of B. DISTRIBUTIVE JUSTICE 1.419 0.234 0.004RANK of C. AUTONOMY 0.071 0.789 0.000RANK of C. RESPECT 0.133 0.716 0.000RANK of C. RESPONSIBILITY 1.195 0.275 0.004RANK of C. REALISTIC EXPECTATIONS 2.384 0.124 0.007RANK of D. OBEDIENCE 1.953 0.163 0.006RANK of D. SATISFACTION 0.000 0.994 0.000RANK of D. PARTICIPATION 3.032 0.080 0.009RANK of D. LOYALTY 15.715 0.000 0.044
UUnniivveerrssiittyy ooff PPrreettoorriiaa eettdd –– CCooeettzzeeee,, MM ((22000055))
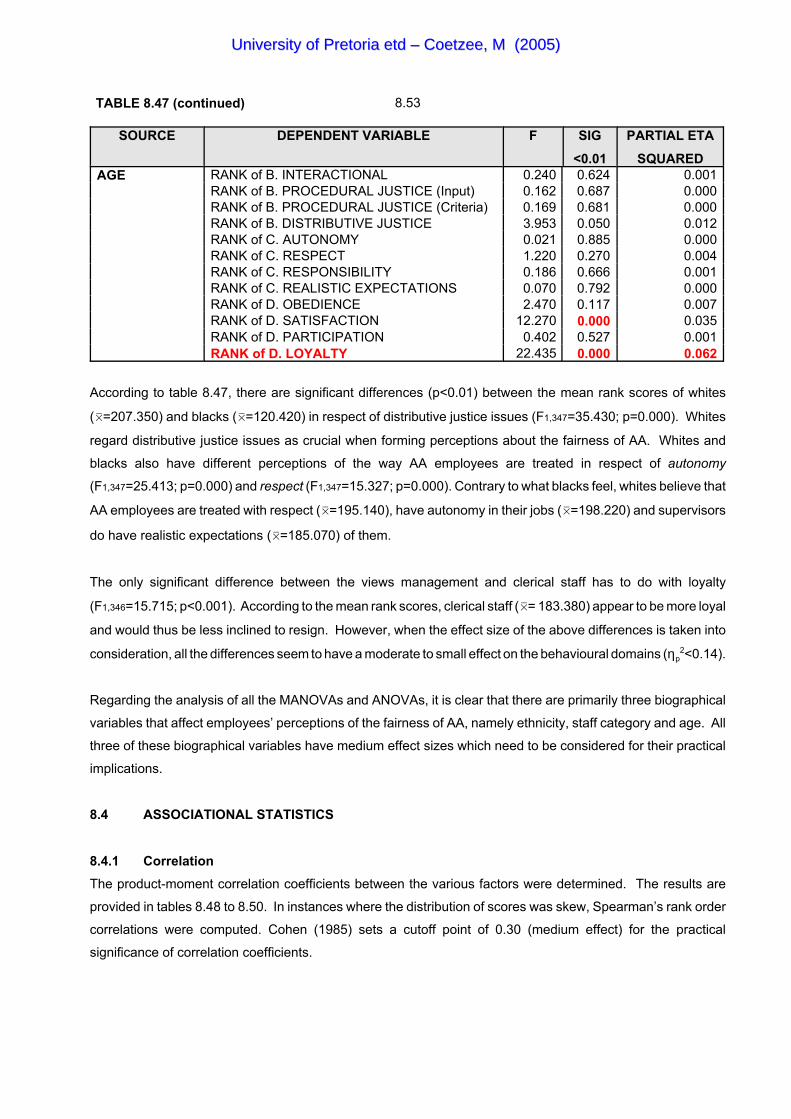
TABLE 8.47 (continued) 8.53
SOURCE DEPENDENT VARIABLE F SIG
<0.01
PARTIAL ETA
SQUAREDAGE
RANK of B. INTERACTIONAL 0.240 0.624 0.001RANK of B. PROCEDURAL JUSTICE (Input) 0.162 0.687 0.000RANK of B. PROCEDURAL JUSTICE (Criteria) 0.169 0.681 0.000RANK of B. DISTRIBUTIVE JUSTICE 3.953 0.050 0.012RANK of C. AUTONOMY 0.021 0.885 0.000RANK of C. RESPECT 1.220 0.270 0.004RANK of C. RESPONSIBILITY 0.186 0.666 0.001RANK of C. REALISTIC EXPECTATIONS 0.070 0.792 0.000RANK of D. OBEDIENCE 2.470 0.117 0.007RANK of D. SATISFACTION 12.270 0.000 0.035RANK of D. PARTICIPATION 0.402 0.527 0.001RANK of D. LOYALTY 22.435 0.000 0.062
According to table 8.47, there are significant differences (p<0.01) between the mean rank scores of whites
(0=207.350) and blacks (0=120.420) in respect of distributive justice issues (F1,347=35.430; p=0.000). Whites
regard distributive justice issues as crucial when forming perceptions about the fairness of AA. Whites and
blacks also have different perceptions of the way AA employees are treated in respect of autonomy
(F1,347=25.413; p=0.000) and respect (F1,347=15.327; p=0.000). Contrary to what blacks feel, whites believe that
AA employees are treated with respect (0=195.140), have autonomy in their jobs (0=198.220) and supervisors
do have realistic expectations (0=185.070) of them.
The only significant difference between the views management and clerical staff has to do with loyalty
(F1,346=15.715; p<0.001). According to the mean rank scores, clerical staff (0= 183.380) appear to be more loyal
and would thus be less inclined to resign. However, when the effect size of the above differences is taken into
consideration, all the differences seem to have a moderate to small effect on the behavioural domains (ηp2<0.14).
Regarding the analysis of all the MANOVAs and ANOVAs, it is clear that there are primarily three biographical
variables that affect employees’ perceptions of the fairness of AA, namely ethnicity, staff category and age. All
three of these biographical variables have medium effect sizes which need to be considered for their practical
implications.
8.4 ASSOCIATIONAL STATISTICS
8.4.1 CorrelationThe product-moment correlation coefficients between the various factors were determined. The results are
provided in tables 8.48 to 8.50. In instances where the distribution of scores was skew, Spearman’s rank order
correlations were computed. Cohen (1985) sets a cutoff point of 0.30 (medium effect) for the practical
significance of correlation coefficients.
UUnniivveerrssiittyy ooff PPrreettoorriiaa eettdd –– CCooeettzzeeee,, MM ((22000055))
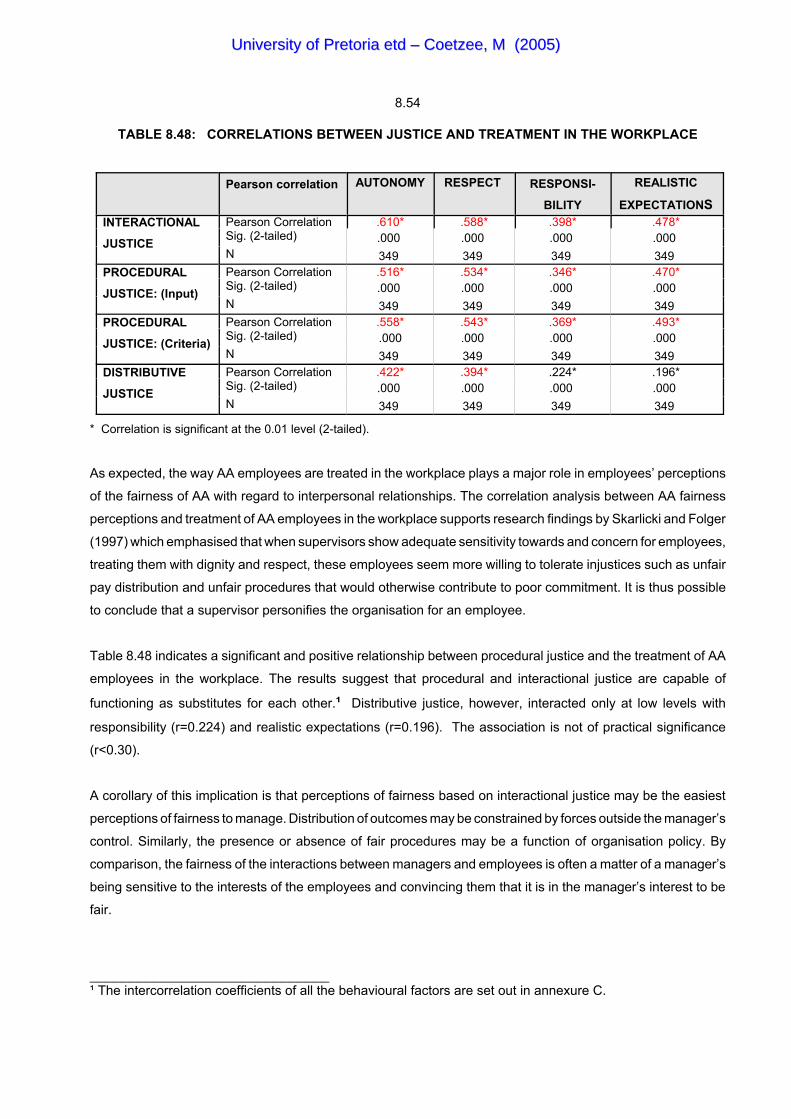
8.54
______________________________¹ The intercorrelation coefficients of all the behavioural factors are set out in annexure C.
TABLE 8.48: CORRELATIONS BETWEEN JUSTICE AND TREATMENT IN THE WORKPLACE
Pearson correlation AUTONOMY RESPECT RESPONSI-
BILITY
REALISTIC
EXPECTATIONSINTERACTIONAL
JUSTICE
Pearson Correlation .610* .588* .398* .478*Sig. (2-tailed) .000 .000 .000 .000 N 349 349 349 349
PROCEDURAL
JUSTICE: (Input)
Pearson Correlation .516* .534* .346* .470* Sig. (2-tailed) .000 .000 .000 .000 N 349 349 349 349
PROCEDURAL
JUSTICE: (Criteria)
Pearson Correlation .558* .543* .369* .493*Sig. (2-tailed) .000 .000 .000 .000 N 349 349 349 349
DISTRIBUTIVE
JUSTICE
Pearson Correlation .422* .394* .224* .196* Sig. (2-tailed) .000 .000 .000 .000 N 349 349 349 349
* Correlation is significant at the 0.01 level (2-tailed).
As expected, the way AA employees are treated in the workplace plays a major role in employees’ perceptions
of the fairness of AA with regard to interpersonal relationships. The correlation analysis between AA fairness
perceptions and treatment of AA employees in the workplace supports research findings by Skarlicki and Folger
(1997) which emphasised that when supervisors show adequate sensitivity towards and concern for employees,
treating them with dignity and respect, these employees seem more willing to tolerate injustices such as unfair
pay distribution and unfair procedures that would otherwise contribute to poor commitment. It is thus possible
to conclude that a supervisor personifies the organisation for an employee.
Table 8.48 indicates a significant and positive relationship between procedural justice and the treatment of AA
employees in the workplace. The results suggest that procedural and interactional justice are capable of
functioning as substitutes for each other.¹ Distributive justice, however, interacted only at low levels with
responsibility (r=0.224) and realistic expectations (r=0.196). The association is not of practical significance
(r<0.30).
A corollary of this implication is that perceptions of fairness based on interactional justice may be the easiest
perceptions of fairness to manage. Distribution of outcomes may be constrained by forces outside the manager’s
control. Similarly, the presence or absence of fair procedures may be a function of organisation policy. By
comparison, the fairness of the interactions between managers and employees is often a matter of a manager’s
being sensitive to the interests of the employees and convincing them that it is in the manager’s interest to be
fair.
UUnniivveerrssiittyy ooff PPrreettoorriiaa eettdd –– CCooeettzzeeee,, MM ((22000055))
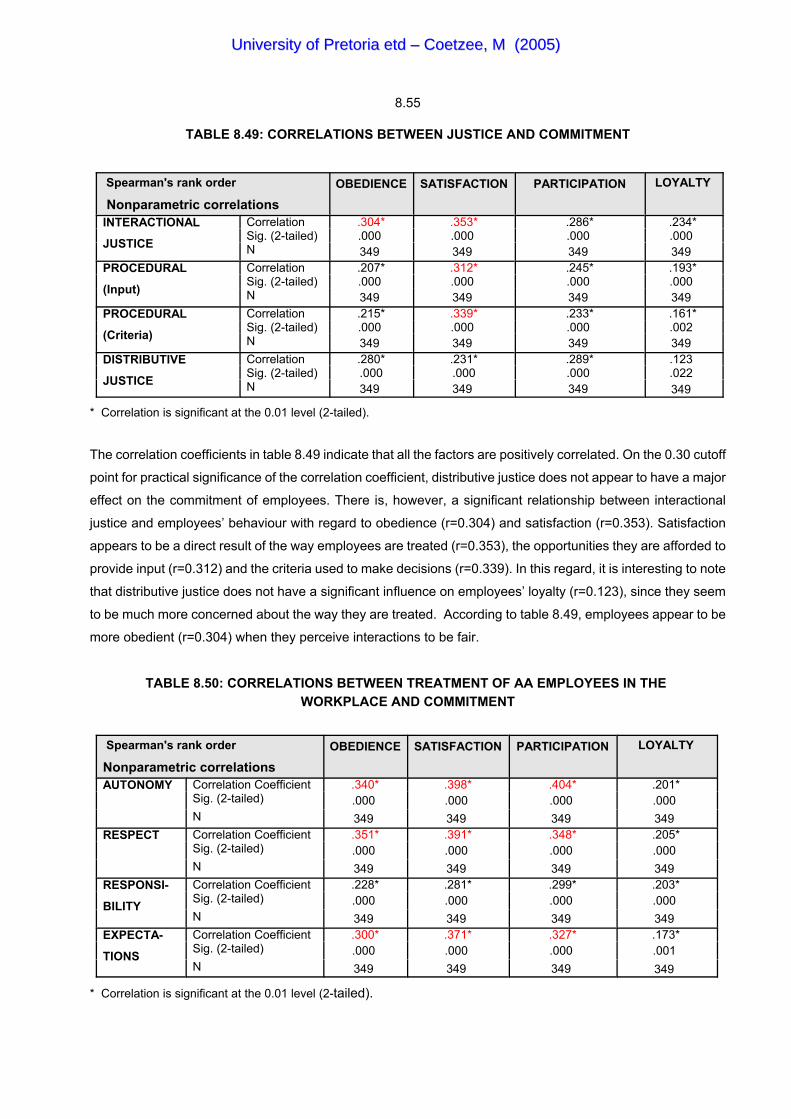
8.55
TABLE 8.49: CORRELATIONS BETWEEN JUSTICE AND COMMITMENT
Spearman's rank order
Nonparametric correlations
OBEDIENCE SATISFACTION PARTICIPATION LOYALTY
INTERACTIONAL
JUSTICE
Correlation .304* .353* .286* .234* Sig. (2-tailed) .000 .000 .000 .000 N 349 349 349 349
PROCEDURAL
(Input)
Correlation .207* .312* .245* .193* Sig. (2-tailed) .000 .000 .000 .000 N 349 349 349 349
PROCEDURAL
(Criteria)
Correlation .215* .339* .233* .161* Sig. (2-tailed) .000 .000 .000 .002 N 349 349 349 349
DISTRIBUTIVE
JUSTICE
Correlation .280* .231* .289* .123 Sig. (2-tailed) .000 .000 .000 .022 N 349 349 349 349
* Correlation is significant at the 0.01 level (2-tailed).
The correlation coefficients in table 8.49 indicate that all the factors are positively correlated. On the 0.30 cutoff
point for practical significance of the correlation coefficient, distributive justice does not appear to have a major
effect on the commitment of employees. There is, however, a significant relationship between interactional
justice and employees’ behaviour with regard to obedience (r=0.304) and satisfaction (r=0.353). Satisfaction
appears to be a direct result of the way employees are treated (r=0.353), the opportunities they are afforded to
provide input (r=0.312) and the criteria used to make decisions (r=0.339). In this regard, it is interesting to note
that distributive justice does not have a significant influence on employees’ loyalty (r=0.123), since they seem
to be much more concerned about the way they are treated. According to table 8.49, employees appear to be
more obedient (r=0.304) when they perceive interactions to be fair.
TABLE 8.50: CORRELATIONS BETWEEN TREATMENT OF AA EMPLOYEES IN THE WORKPLACE AND COMMITMENT
Spearman's rank order
Nonparametric correlationsOBEDIENCE SATISFACTION PARTICIPATION LOYALTY
AUTONOMY Correlation Coefficient .340* .398* .404* .201* Sig. (2-tailed) .000 .000 .000 .000 N 349 349 349 349
RESPECT Correlation Coefficient .351* .391* .348* .205* Sig. (2-tailed) .000 .000 .000 .000 N 349 349 349 349
RESPONSI-
BILITY
Correlation Coefficient .228* .281* .299* .203* Sig. (2-tailed) .000 .000 .000 .000 N 349 349 349 349
EXPECTA-
TIONS
Correlation Coefficient .300* .371* .327* .173* Sig. (2-tailed) .000 .000 .000 .001 N 349 349 349 349
* Correlation is significant at the 0.01 level (2-tailed).
UUnniivveerrssiittyy ooff PPrreettoorriiaa eettdd –– CCooeettzzeeee,, MM ((22000055))

8.56
The correlation coefficients in table 8.50 indicate that there is a positive and significant relationship (r>0.30)
between the treatment of AA employees and commitment. According to this table, the autonomy AA employees
have, plays a major role in their commitment when it comes to obedience (r=0.340), satisfaction (r=0.398) and
participation (r=0.404). There is also a positive and significant relationship (r>0.30) between respect shown and
obedience (r=0.351), satisfaction (r=0.391) and participation (r=0.348). AA employees appear to be more
satisfied (r=0.371), obedient (r=0.300) and participative (r=0.327) when the employer has realistic expectations
of them.
8.4.2 Multiple regressionThe scores in respect of the treatment of AA employees in the workplace were used to predict employees’
perceptions about the fairness of AA. Organisational justice consists of four dimensions, namely interactional
justice, procedural justice:criteria, procedural justice:input and distributive justice. Each of these forms of justice
was used as a dependent (criterion) variable and the factors relating to treatment in the workplace as
independent (predictor) variables. The results and conclusions of these multiple regression models are as
follows:
8.4.2.1 Multiple regression of treatment of AA employees in the workplace with interactional justice
perceptions
TABLE 8.51: MULTIPLE REGRESSION OF TREATMENT OF AA EMPLOYEES IN THE WORKPLACE
WITH INTERACTIONAL JUSTICE PERCEPTIONS
Regression model: interactional justice R = 0.638 R² = 0.408 f² = 0.69* df = 2.346
Predictor variables R R² F Beta p % Variance
(Constant) 9.784
Autonomy 0.610 0.372 205.360 0.411 <0.001 37.2
Respect 0.638 0.408 119.029 0.351 <0.001 3.6
* Practical significance: f²$0.35 (large effect)
As indicated by the value of multiple correlation, there is a significant relationship (p<0.001) between the
independent variables autonomy and respect and the dependent variable, interactional justice. The more
autonomy employees have and respect they are shown, the more likely they are to perceive AA as interactionally
fair. Autonomy explains 37.2 percent of the variance in the perceptions of interactional justice whereas respect
explains 3.6 percent of the variance. It is interesting to note that perceptions of the interactional fairness of AA
are not influenced by ethnicity or staff category. The multiple correlation of 0.64 is practically significant (f² =
0.69) (large effect). Table 8.51 shows that autonomy and respect for AA employees are the best predictors of
interactional justice perceptions.
UUnniivveerrssiittyy ooff PPrreettoorriiaa eettdd –– CCooeettzzeeee,, MM ((22000055))
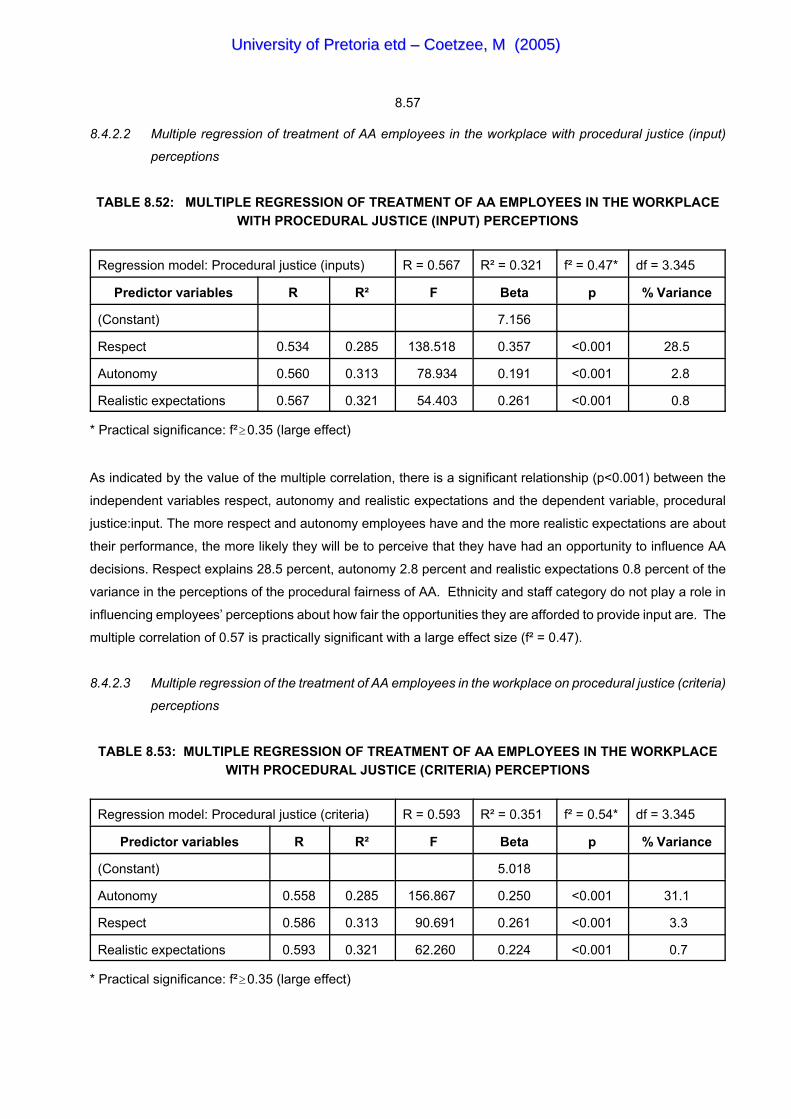
8.57
8.4.2.2 Multiple regression of treatment of AA employees in the workplace with procedural justice (input)
perceptions
TABLE 8.52: MULTIPLE REGRESSION OF TREATMENT OF AA EMPLOYEES IN THE WORKPLACEWITH PROCEDURAL JUSTICE (INPUT) PERCEPTIONS
Regression model: Procedural justice (inputs) R = 0.567 R² = 0.321 f² = 0.47* df = 3.345
Predictor variables R R² F Beta p % Variance
(Constant) 7.156
Respect 0.534 0.285 138.518 0.357 <0.001 28.5
Autonomy 0.560 0.313 78.934 0.191 <0.001 2.8
Realistic expectations 0.567 0.321 54.403 0.261 <0.001 0.8
* Practical significance: f²$0.35 (large effect)
As indicated by the value of the multiple correlation, there is a significant relationship (p<0.001) between the
independent variables respect, autonomy and realistic expectations and the dependent variable, procedural
justice:input. The more respect and autonomy employees have and the more realistic expectations are about
their performance, the more likely they will be to perceive that they have had an opportunity to influence AA
decisions. Respect explains 28.5 percent, autonomy 2.8 percent and realistic expectations 0.8 percent of the
variance in the perceptions of the procedural fairness of AA. Ethnicity and staff category do not play a role in
influencing employees’ perceptions about how fair the opportunities they are afforded to provide input are. The
multiple correlation of 0.57 is practically significant with a large effect size (f² = 0.47).
8.4.2.3 Multiple regression of the treatment of AA employees in the workplace on procedural justice (criteria)
perceptions
TABLE 8.53: MULTIPLE REGRESSION OF TREATMENT OF AA EMPLOYEES IN THE WORKPLACEWITH PROCEDURAL JUSTICE (CRITERIA) PERCEPTIONS
Regression model: Procedural justice (criteria) R = 0.593 R² = 0.351 f² = 0.54* df = 3.345
Predictor variables R R² F Beta p % Variance
(Constant) 5.018
Autonomy 0.558 0.285 156.867 0.250 <0.001 31.1
Respect 0.586 0.313 90.691 0.261 <0.001 3.3
Realistic expectations 0.593 0.321 62.260 0.224 <0.001 0.7
* Practical significance: f²$0.35 (large effect)
UUnniivveerrssiittyy ooff PPrreettoorriiaa eettdd –– CCooeettzzeeee,, MM ((22000055))

8.58
There is a significant multiple correlation (p<0.001) between the independent variables autonomy, respect and
realistic expectations and the dependent variable, procedural justice:criteria. The more autonomy and respect
employees have, and the more realistic expectations about their performance are, the more likely they are to
perceive the criteria used in making AA decisions to be fair. Autonomy explains 31.1 percent, respect 3.3 percent
and realistic expectations 0.7 percent of the variance in the perceptions of the fairness of the criteria used to
make AA decisions. Ethnicity and staff category, however, do not influence employees’ perceptions of the
fairness of the criteria used. The multiple correlation of 0.59 is practically significant (f² = 0.54) (large effect).
8.4.2.4 Multiple regression of ethnicity and the treatment of AA employees in the workplace with distributive
justice perceptions
TABLE 8.54: MULTIPLE REGRESSION OF ETHNICITY AND THE TREATMENT OF AA EMPLOYEES INTHE WORKPLACE WITH DISTRIBUTIVE JUSTICE PERCEPTIONS
Regression model: distributive justice R = 0.547 R² = 0.299 f² = 0.43* df = 4.344
Predictor variables R R² F Beta p % Variance
(Constant) 18.783
Autonomy 0.442 0.178 75.086 0.371 <0.001 17.8
Ethnicity 0.517 0.267 62.950 4.543 <0.001 8.9
Realistic expectations 0.330 0.284 45.709 -0.454 <0.001 1.8
Respect 0.547 0.299 36.662 0.218 <0.001 1.4
* Practical significance: f²$0.35 (large effect)
Ethnicity was coded as a dummy variable. Binary codes 1 and 0 were used where whites were coded as 1 and
blacks as 0, 1 presenting the omitted reference group. A significant beta coefficient for any included group
means that the group is significantly different from the reference group. There is a significant multiple correlation
(p<0.001) between the independent variables of autonomy, ethnicity, realistic expectations and respect and the
dependent variable, distributive justice. According to the regression model, it would seem that the more
autonomy employees have, the more likely they will be to perceive AA decisions as fair. Autonomy explains 17.8
percent and the other variables 12.1 percent of the variance in employees’ perceptions of the fairness of AA
decisions. The results indicate that ethnicity does play a prominent role when employees form perceptions of
the fairness of AA. This makes sense because blacks are more likely to perceive decisions taken about AA to
be fair compared with whites. The multiple correlation of 0.55 of the regression model is practically significant
with a large effect size (f² = 0.43)
Attempts were also made to determine how justice perceptions and treatment of AA employees relate to
employees’ commitment. The factors pertaining organisational justice and treatment of AA employees in the
workplace were correlated with commitment. The results and conclusions of these multiple regression models
are as follows:
UUnniivveerrssiittyy ooff PPrreettoorriiaa eettdd –– CCooeettzzeeee,, MM ((22000055))

8.59
8.3.2.5 Multiple regression of justice perceptions and treatment in the workplace with obedience
TABLE 8.55: MULTIPLE REGRESSION OF JUSTICE PERCEPTIONS AND TREATMENT OF AAEMPLOYEES IN THE WORKPLACE WITH OBEDIENCE
Regression model: Obedience R = 0.378 R² = 0.143 f² = 0.17* df = 3.345
Predictor variables R R² F Beta p % Variance
(Constant) 46.663
Autonomy 0.339 0.115 44.990 0.165 <0.001 11.5
Distributive justice 0.364 0.133 26.470 0.103 <0.001 1.8
Interactional justice 0.378 0.143 19.150 0.096 <0.001 1.0
* Practical significance: f²<0.35; f²$0.15 (medium effect)
There is a significant multiple correlation (p<0.001) between the independent variables autonomy, distributive
and interactional justice and the dependent variable, obedience. The autonomy employees are accorded, and
how fair they perceive AA decisions to be, including how well they are treated in the workplace, have a positive
relationship with their willingness to obey rules and regulations. Autonomy explains 11.5 percent, distributive
justice 1.8 percent and interactional justice 1.0 percent of the variance in employees’ obedience levels.
Employees’ preparedness to adhere to rules and conform to group norms are thus a direct result of the way they
are treated in terms of the type of jobs they are assigned, the opportunity afforded to apply their skills and
competencies and to determine their own work pace and methods. Obedience is also influenced by the outcome
of AA decisions (distributive fairness). It is worthwhile noting that obedience is not influenced by ethnicity or staff
category. The multiple correlation of 0.38 is practically significant (f² = 0.17) (medium effect).
8.4.2.6 Multiple regression of justice perceptions and treatment in the workplace with satisfaction
TABLE 8.56: MULTIPLE REGRESSION OF JUSTICE PERCEPTIONS AND TREATMENT OF AAEMPLOYEES IN THE WORKPLACE WITH SATISFACTION
Regression model: satisfaction R = 0.447 R² = 0.200 f² = 0.25* df = 2.346
Predictor variables R R² F Beta p % Variance
(Constant) 8.686
Autonomy 0.422 0.178 75.309 0.116 <0.001 17.8
Interactional justice 0.447 0.200 43.163 0.065 <0.001 2.1
* Practical significance: f²<0.35; f²$0.15 (medium effect)
UUnniivveerrssiittyy ooff PPrreettoorriiaa eettdd –– CCooeettzzeeee,, MM ((22000055))
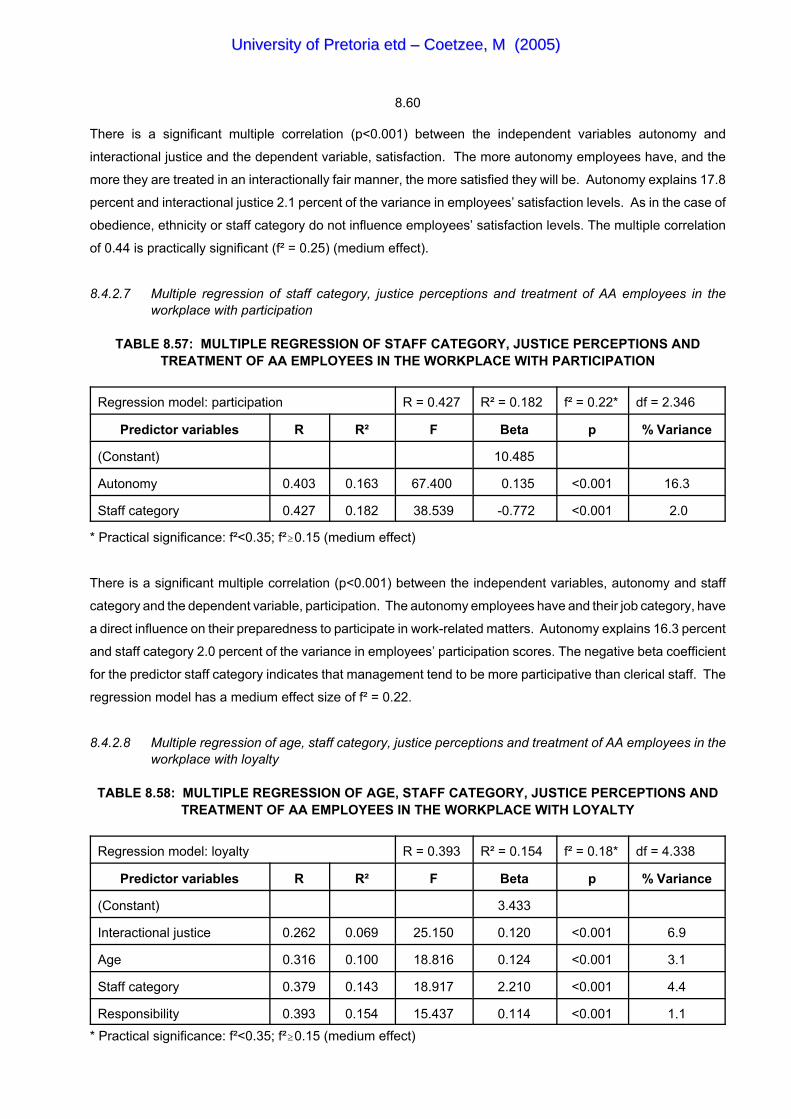
8.60
There is a significant multiple correlation (p<0.001) between the independent variables autonomy and
interactional justice and the dependent variable, satisfaction. The more autonomy employees have, and the
more they are treated in an interactionally fair manner, the more satisfied they will be. Autonomy explains 17.8
percent and interactional justice 2.1 percent of the variance in employees’ satisfaction levels. As in the case of
obedience, ethnicity or staff category do not influence employees’ satisfaction levels. The multiple correlation
of 0.44 is practically significant (f² = 0.25) (medium effect).
8.4.2.7 Multiple regression of staff category, justice perceptions and treatment of AA employees in theworkplace with participation
TABLE 8.57: MULTIPLE REGRESSION OF STAFF CATEGORY, JUSTICE PERCEPTIONS ANDTREATMENT OF AA EMPLOYEES IN THE WORKPLACE WITH PARTICIPATION
Regression model: participation R = 0.427 R² = 0.182 f² = 0.22* df = 2.346
Predictor variables R R² F Beta p % Variance
(Constant) 10.485
Autonomy 0.403 0.163 67.400 0.135 <0.001 16.3
Staff category 0.427 0.182 38.539 -0.772 <0.001 2.0
* Practical significance: f²<0.35; f²$0.15 (medium effect)
There is a significant multiple correlation (p<0.001) between the independent variables, autonomy and staff
category and the dependent variable, participation. The autonomy employees have and their job category, have
a direct influence on their preparedness to participate in work-related matters. Autonomy explains 16.3 percent
and staff category 2.0 percent of the variance in employees’ participation scores. The negative beta coefficient
for the predictor staff category indicates that management tend to be more participative than clerical staff. The
regression model has a medium effect size of f² = 0.22.
8.4.2.8 Multiple regression of age, staff category, justice perceptions and treatment of AA employees in theworkplace with loyalty
TABLE 8.58: MULTIPLE REGRESSION OF AGE, STAFF CATEGORY, JUSTICE PERCEPTIONS ANDTREATMENT OF AA EMPLOYEES IN THE WORKPLACE WITH LOYALTY
Regression model: loyalty R = 0.393 R² = 0.154 f² = 0.18* df = 4.338
Predictor variables R R² F Beta p % Variance
(Constant) 3.433
Interactional justice 0.262 0.069 25.150 0.120 <0.001 6.9
Age 0.316 0.100 18.816 0.124 <0.001 3.1
Staff category 0.379 0.143 18.917 2.210 <0.001 4.4
Responsibility 0.393 0.154 15.437 0.114 <0.001 1.1
* Practical significance: f²<0.35; f²$0.15 (medium effect)
UUnniivveerrssiittyy ooff PPrreettoorriiaa eettdd –– CCooeettzzeeee,, MM ((22000055))
8.61
There is a significant multiple correlation (p<0.001) between the independent variables, interactional justice, age,
staff category, responsibility and the dependent variable, loyalty. If employees are treated respectfully and
humanely this has a direct influence on their loyalty towards the organisation. The job level of an employee also
influences his or her loyalty. The positive beta coefficient (2.210) for the predictor staff category indicates that
clerical staff appear to be more loyal than managerial staff. The loyalty of staff is also influenced by the fairness
of AA decisions. Interactional justice explains 6.9 percent, age 3.1 percent, staff category 4.4 percent and
responsibility 1.1 percent of the variance in employees’ loyalty levels. The multiple correlation of 0.39 is
practically significant (f² = 0.18) (medium effect).
8.5 SUMMARY
This chapter dealt with the results of the survey. Using a factor analysis, four factors relating to organisational
justice were identified, namely interactional, procedural:input, procedural:criteria and distributive justice. The
four factors that were identified with regard to treatment of AA employees in the workplace included task
autonomy, respect, responsibility and realistic expectations. The four factors identified for commitment included
obedience, job satisfaction, participation and loyalty.
On completion of the factor analysis, the reliability of the various factors was analysed. The reliability of the
factors, as measured by Cronbach alpha, was all above 0.70.
Statistical tests such as Students’ t-test of difference of means, one-way analysis of variance, multiple analysis
of variance and multiple regression analysis were used to investigate the relationship between the various
behavioural domains and employee groupings.
This concludes the analysis of the statistical tests performed. The next chapter summarises the principal
findings and makes recommendations for future research.
UUnniivveerrssiittyy ooff PPrreettoorriiaa eettdd –– CCooeettzzeeee,, MM ((22000055))
9.1
Chapter 9
SUMMARY AND RECOMMENDATIONS
9.1 INTRODUCTION
South African organisations are under immense pressure to comply with legislation on employment equity
provisions. However, as discussed in chapter 2, it is not only a matter of meeting employment equity targets -
attention needs to be focused on the question of how to implement employment equity. This includes the
questions of fairness. Fairness principles provide an opportunity to mitigate some of the adverse organisational
consequences stemming from individuals’ resentment-based resistance to change. An organisation’s obligation
to employees entails far more than fair treatment with regard to the salaries and benefits given in exchange for
labour (distributive justice) and with respect to the implementation of policies and procedures that determine
those levels of compensation (procedural justice). In addition, organisations are morally obliged to treat their
employees with sufficient dignity as humans (interactional justice). As organisations in globally competitive
markets are less able to offer traditional rewards (lifelong employment, promotions, long-term compensation),
one of the only means at their disposal to induce employees to stay is to foster an environment that
communicates that it values the employees. In such instances, interactional justice plays a major role in
influencing employees’ attitudes and the behaviours required for successful performance, even under conditions
of adversity and loss, which is often the case with AA.
The fairness of AA, from an organisational justice perspective, has not yet been researched in South Africa and
little is known about how perceptions of AA fairness affect employees’ commitment, and hence the success of
organisations. One of the challenges facing organisations is to find a way of implementing AA programmes
without creating negative employee attitudes.
This chapter provides an overview and a summary of the principal findings of the study and also outlines topics
for future research. The focus in the discussion of the results will be on answering the research questions. To
avoid overinterpretation of the research results, only the statistically significant findings with practical implications
will be discussed.
9.2 RESEARCH OBJECTIVES
The primary purpose of this study was to identify the major components (factors) of AA fairness and to develop
a measuring instrument (questionnaire) which could be used to measure the perceived fairness of AA. The
factor analysis extracted four factors related to AA fairness, namely interactional justice, procedural justice(input),
procedural justice(criteria) and distributive justice.
UUnniivveerrssiittyy ooff PPrreettoorriiaa eettdd –– CCooeettzzeeee,, MM ((22000055))

9.2
Perceptions of the fairness of AA are also influenced by the way AA employees are treated. Using factor
analysis, four factors relating to the treatment of AA employees were identified: task autonomy, respect,
responsibility and realistic expectations on the part of supervisors.
Another aim of the study was to determine how perceptions of the fairness of AA influence employees’
commitment. With regard to employees’ commitment, the factor analysis yielded four factors: obedience,
participation, satisfaction and loyalty.
In an attempt to determine what biographical factors influence employees’ perceptions of the fairness of AA, the
various employee groups (ethnicity, gender, staff category, age etc.) were compared with one another.
Finally, the study attempted to determine the relationship between organisational justice, the treatment of AA
employees and employees’ commitment.
9.3 RESEARCH METHODOLOGY
In order to meet the research objectives, a literature and empirical study were conducted. The literature study
focused on fairness principles, outlined AA practices that influence employees’ perceptions of fairness and
identified work behaviours associated with employees’ commitment.
On completion of the literature study, a measuring instrument, namely a questionnaire, was developed. The
purpose of the questionnaire was to collect information on respondents’ biographical details, their perceptions
of and attitudes toward AA fairness, their perceptions of the treatment of AA employees and their commitment.
By means of a disproportionate, stratified sampling method, a list of all permanent employees, categorised
according to ethnicity, gender and staff category was obtained from the case bank. Table 9.1 provides a
schematic representation of the grouping of respondents, the population and sample size of each group as well
as the response rate.
With reference to table 9.1, the response is in line with the composition of the population - hence the response
rate of 20,3 percent in this study is satisfactory.
UUnniivveerrssiittyy ooff PPrreettoorriiaa eettdd –– CCooeettzzeeee,, MM ((22000055))

9.3
TABLE 9.1: POPULATION, SAMPLE AND RESPONSE RATE OF EACH EMPLOYEE GROUP
POPULATION SAMPLE RESPONSE
RESPONSERATE
ETHNICITYBlacksWhites
12 007 (40%)17 681 (60%) 100%
6881032
128221
18,6%21,4%
GENDERMenWomen
10 088 (34%)19 600 (66%) 100%
5851135
120229
20,5% 20,2%
STAFF CATEGORYTop management Middle managementSupervisory level
253 5 975 2 502
29% 498
168
33,7%
Clerical staff 20 958 71% 100% 1222 181 14,8%
TOTAL 29 688 1720 349 20,3%
9.4 RESEARCH FINDINGS
In this study, a principal factor analysis with varimax rotation was performed for each of the sections. The
purpose was to identify the latent variables underlying AA fairness, treatment of AA employees in the workplace
and the commitment of employees.
9.4.1 Major components of affirmative action fairness
Consistent with the findings of previous research on organisational justice, the factor analysis identified the
following four factors:
Interactional justice. This factor refers to the manner in which employees are treated. As far as AA is concerned,
this means that employees want to be recognised and regarded as capable and competent workers. Information
on career prospects and employment equity policies should also be communicated to them. Employees value
any efforts made to accommodate their cultural needs.
Procedural justice(input). This factor refers to the procedures, and in particular, the opportunity employees are
afforded to influence any decisions made about AA. Issues such as allowing all employees to apply for positions
or appeal against decisions, making use of joint decision making, providing mechanisms to protect employees
against discrimination, applying rules and procedures consistently and adjusting systems to integrate AA
employees successfully, largely determine how fair procedures seem to be.
UUnniivveerrssiittyy ooff PPrreettoorriiaa eettdd –– CCooeettzzeeee,, MM ((22000055))

9.4
Procedural justice(criteria). This factor refers to the criteria or standards used when implementing AA. Actions
such as applying selection criteria consistently, using accurate performance data when evaluating an employee,
applying the same performance standards to all employees, using job-related selection criteria and taking
disciplinary action strictly and consistently, play a major role in influencing employees’ perceptions of the
procedural fairness of AA.
Distributive justice. This factor refers to the actual decision taken about AA. Decisions such as granting black
employees token positions, training AA employees to replace current job incumbents, paying unrealistically high
salaries, appointing less qualified employees for EE reasons, focusing on the development and advancement
of AA employees and basing selection decisions on criteria such as ethnicity and gender, influence employees’
perceptions of the distributive fairness of AA decisions.
9.4.2 Major components of the treatment of affirmative action employees
According to the results of the factor analysis, the treatment of AA employees can be grouped into the following
four factors:
Task autonomy. This factor refers to the level of task autonomy employees from designated groups are granted
in the workplace. The elements of this factor include the significance, importance and difficulty of the jobs
assigned to AA employees, the opportunities they are afforded to use their initiative and judgment, the extent
to which the job allows them to use a variety of skills and competencies, whether or not they receive feedback
on their performance, the level of cooperation required to perform a task, the extent to which tasks are defined,
and whether or not they are allowed to determine their own work pace and methods.
Respect. According to this factor, employees are treated with respect when they feel that they are treated with
dignity, are listened to when they make suggestions, are free to discuss problems with co-workers, are
recognised for work well done, are regarded as contributors to the department’s success and their cultural
differences are taken into consideration at social events.
Responsibility. This factor refers to the responsibility assigned to employees from designated groups. These
employees should be allowed to accept responsibility for important tasks such as specific assignments and
projects, working with equipment and facilities, initiating assignments and projects, and budgets and
expenditures.
Realistic expectations. According to this factor, supervisors should have realistic expectations about AA
employees’ performance standards and workloads. In addition, AA employees should be held accountable for
their decisions and performance.
UUnniivveerrssiittyy ooff PPrreettoorriiaa eettdd –– CCooeettzzeeee,, MM ((22000055))
9.5
9.4.3 Major components of employee commitment
The factor analysis identified the following four factors in terms of how committed employees behave at work:
Obedience. This factor refers to employees’ adherence to rules and procedures and behaviour according to
group norms. The elements of this factor include treating bank property with care, obeying bank rules and
regulations, being concerned about the bank’s image, keeping the workplace clean and tidy, being punctual and
not taking unnecessarily long breaks, helping others with heavy work loads, staying informed about the bank,
preventing problems with colleagues, and having valid reasons for staying away from work.
Job satisfaction. This factor refers to employees’ satisfaction with their jobs. According to this factor, employees
are satisfied when they enjoy doing their job, have a pleasant work environment and have a sense of personal
satisfaction when they perform well.
Participation. An important aspect of employees’ commitment is the extent to which they participate and are
involved in work-related issues. This factor includes the opportunity employees have to share ideas or make
suggestions on new projects or changes, and whether or not they attend and participate in bank meetings.
Loyalty. Loyalty is a vital part of employees’ commitment, and is often measured by employees’ attitudes
towards remaining with the organisation. According to this factor, there are various reasons why employees do
not resign. The first is that they feel they have an obligation not to resign; secondly they like their jobs; and lastly
they cannot afford to resign because the costs are too high.
9.5 DIFFERENCES BETWEEN THE VARIOUS EMPLOYEE GROUPS REGARDING PERCEPTIONS
OF AFFIRMATIVE ACTION FAIRNESS
In order to determine what biographical factors influence employees’ perceptions of the fairness of AA, the
means of the various employee groups were compared. The biographical factors which played a key role are
discussed below.
(1) Gender
Men and women differ significantly with regard to obedience and loyalty. Women are more willing to adhere to
rules and regulations and display greater loyalty towards the bank.
(2) Ethnicity
There are statistically significant differences between blacks and whites with regard to perceptions of distributive
justice, the treatment of AA employees regarding respect and task autonomy and how participative employees
are. Distributive justice issues play a vital role in whites’ formation of perceptions of the fairness of AA. Contrary
UUnniivveerrssiittyy ooff PPrreettoorriiaa eettdd –– CCooeettzzeeee,, MM ((22000055))

9.6
to what blacks feel, whites believe that AA employees are treated with respect and are accorded autonomy.
Whites appear to be more participative than blacks.
(3) Marital status
Married and single employees differ significantly when it comes to distributive justice, work satisfaction and
participation. Married employees regard distributive justice issues as critical to the fairness of AA. Married
employees also seem to be more satisfied and participative than their single counterparts.
(4) Number of years’ service at the bank
There are significant differences between employees with seven or more years of service and employees with
less than seven years of service. Employees with seven or more years of service seem to be extremely
concerned about distributive justice issues when forming perceptions of the fairness of AA and appear to be
more participative and loyal than employees with less than seven years of service. Furthermore, they believe
that AA employees do have autonomy and are treated with respect.
(5) Staff category
There are significant differences between management and clerical staff in respect of distributive justice,
autonomy, respect and participation.
As far as the practical significance of differences between management and clerical staff are concerned, it is only
with regard to distributive justice that the difference is of any practical importance. AA decisions such as giving
AA employees token positions, paying unrealistically high salaries to AA managers, appointing less qualified
employees, focusing on the development and advancement of AA employees, and making selection decisions
based on criteria such as ethnicity and gender play a big role when forming perceptions about the fairness of
AA. Management views distributive justice as integral to forming perceptions of the fairness of AA. In contrast
to the opinion of clerical staff, management believe that employees from designated groups are granted
autonomy and are treated with respect. Management appears to be more satisfied and participative than clerical
staff.
(6) Salary
Respondents were categorised according to three categories of salary level, namely R5000 or less, R5001 to
R15 000, and more than R15000. There is a significant difference relating to distributive justice between
employees earning R5000 or less per month and those earning R15001 and more per month. Distributive justice
is crucial to employees earning low salaries because it has a direct bearing on their financial position. Decisions
about appointments, promotions, career advancement and training thus play a major role when employees form
perceptions of the fairness of AA.
The MANOVAs and associated ANOVAs indicated that only ethnicity, age and job category had a significant
effect on the differences between the groups’ perceptions of the fairness of AA.
UUnniivveerrssiittyy ooff PPrreettoorriiaa eettdd –– CCooeettzzeeee,, MM ((22000055))
9.7
9.6 RELATIONSHIP BETWEEN AFFIRMATIVE ACTION FAIRNESS AND THE BEHAVIOURAL
DOMAINS
9.6.1 How the treatment of affirmative action employees influence perceptions of fairness
Multiple regression statistics were used to predict how the treatment of AA employees influences employees’
perceptions of the fairness of AA. There is a significant positive relationship between perceptions of AA fairness
and the treatment of AA employees. The results indicated that the more task autonomy and respect accorded
to employees, the more likely they will be to perceive decisions about AA to be fair.
Distributive justice, which has a low correlation with interactional and procedural justice, is not significantly
related to the treatment of employees. This means that employees might be willing to tolerate injustices such
as the promotion of an AA candidate as long as the decision was taken in a procedurally and interactionally fair
manner.
It was interesting to note that ethnicity does not feature when it comes to perceptions of the procedural and
interactional fairness of AA. It does, however, play a role in distributive justice perceptions. This means that
whites regard certain decisions such as the appointment and promotion, allocation of tasks, and opportunities
provided for growth and development of AA employees as an integral part of forming perceptions of the fairness
of AA.
9.6.2 How perceptions of the fairness of affirmative action influence employees’ commitment
This study also aimed to determine whether or not perceptions of the fairness of affirmative action influence
employees’ commitment regarding obedience, satisfaction, participation and loyalty.
(1) Obedience
Employees’ willingness to adhere to rules and conform to group norms (obedience) are a direct result of the way
they are treated in terms of task autonomy (type and significance of jobs assigned), fairness of decisions taken
(salary increases, promotions, etc and the way they are treated (being recognised, informed about
developments, guided and accommodated in the workplace). Obedience, however, is not influenced by ethnicity
or staff category.
(2) Satisfaction
The satisfaction level of employees is strongly influenced by the amount of task autonomy they have and how
fairly they are treated.
UUnniivveerrssiittyy ooff PPrreettoorriiaa eettdd –– CCooeettzzeeee,, MM ((22000055))

9.8
(3) Participation
Employees’ willingness to participate in work-related activities is directly related to the amount of task autonomy
they have and their job level. Management tend to participate more than clerical staff. Ethnicity does not
influence employees’ participation levels - hence there is no difference between whites’ and blacks’ participation
levels.
(4) Loyalty
Employees’ loyalty is directly related to the way they are treated, their job level, the responsibilities assigned to
them and the perceived fairness of decisions taken. The more employees are treated in a humane and
respectful manner, the more likely they are to remain loyal to the organisation.
9.7 LIMITATIONS AND SUGGESTIONS FOR FUTURE RESEARCH
Overall, the results suggest that the measures of distributive, procedural and interactional justice are sufficiently
reliable and valid to capture the perceived fairness of AA programmes. However, elements that influence overall
perceptions of fairness may depend on the type of organisation, leadership style, etc, and support Greenberg’s
(1987) concerns about the context sensitivity of justice perceptions. Researchers should thus endeavour to
select measures that incorporate elements that are relevant to specific contexts, and support the need for
caution in generalising the results of AA fairness research across organisational contexts. Not limiting the
sample to a single organisation could solve some of the problems related to the context sensitivity of perceptions
of AA fairness.
One limitation in this study arises from the use of such a comprehensive questionnaire. The questionnaire
consisted of 116 questions and took approximately 30 minutes to complete. This could have influenced
respondents’ willingness to complete it.
Another limitation concerns the interpretation of section B of the questionnaire. Respondents were asked to
indicate how much certain actions influenced their perceptions of the fairness of AA. Some of the answers
provided by respondents gave the impression that they had evaluated the statements according to how AA
fairness was dealt with at the bank.
The commitment behaviours that were investigated represent a subset of the many types of behaviours found
in organisations. Perceived injustices produce a range of responses including psychological distress, sabotage,
withdrawal and theft (Greenberg, 1987) - hence the need for future research to explore contextual moderators
in order to improve the prediction of employees’ responses to perceived justice/injustice.
Although items from other questionnaires were used to compile this questionnaire, the researcher feels that
better items could have been selected. This may explain why the distribution of scores of the factors for
UUnniivveerrssiittyy ooff PPrreettoorriiaa eettdd –– CCooeettzzeeee,, MM ((22000055))

9.9
commitment was not normal and did not yield significant results. This is also reflected in the low practical
significance values (effect sizes) of the multiple regression models.
9.8 MANAGERIAL IMPLICATIONS AND RECOMMENDATIONS
With reference to the differences between the various employee groups regarding perceptions of AA fairness,
there are only two biographical factors that influence employees’ perceptions: ethnicity and age. Whites and
older people base their perceptions of the fairness of AA on distributive justice issues. If management thus wish
to promote sound labour relations, the following human resource practices should be avoided:
! allocating token positions to black managers
! training AA employees to replace existing employees
! paying unrealistically high salaries to AA managers
! appointing or promoting less qualified people
Since management are compelled to meet employment equity targets, it is virtually impossible to avoid the above
mentioned practices. Although management might be aware of the issues that create negative perceptions, they
face conditions that constrain their ability to put the viewpoints of employees first. What management could do,
however, is to implement these practices in a procedurally and interactionally fair manner. Any AA decision
should thus be taken in the following ways:
! Acknowledge the value, capabilities and competencies of AA employees by assigning meaningful and
significant jobs to them.
! Recognise the value of other employees by appointing and promoting AA employees who are capable
of doing their share of the work.
! Inform employees about employment equity targets so that they understand why preference should
be given to AA employees.
! Provide all employees with an equal chance of applying for positions and make no preliminary
selection decision on the basis of the ethnicity of the applicant.
! Apply rules and procedures consistently so that all employees, irrespective of ethnicity, receive the
same treatment.
! Use the same selection or performance standards for all employees irrespective of their ethnicity, age
or gender.
! Use more than one performance appraiser so that employees feel that they are treated fairly and that
prejudice does not influence the evaluation.
! Make use of a management style that facilitates joint decision making.
UUnniivveerrssiittyy ooff PPrreettoorriiaa eettdd –– CCooeettzzeeee,, MM ((22000055))

9.10
Since age and ethnicity are correlated (older employees are mainly white employees because of the employment
practices followed in previous years), it is possible that it is not so much age but ethnicity that influences
employees’ perceptions of the fairness of AA.
It is interesting to note that gender does not play a significant role when it comes to forming perceptions of the
fairness of AA. Men and women feel more or less the same when issues such as token positions, training AA
employees to replace other employees, paying unrealistic salaries and appointing less qualified people are
considered.
With reference to the treatment of AA employees in the workplace, there are significant differences between
the ethnic groups in respect of task autonomy and respect. Whites believe that blacks do have autonomy and
are treated with respect. Blacks, on the other hand, do not see it in the same way. According to the results of
the study, the way employees are treated has a major impact on their commitment (work behaviour). Employees
who have autonomy and are treated with respect are more obedient, satisfied and participative. Since whites
and blacks have different views on how they believe AA employees are treated, management should determine,
by means of a survey, what employees regard as autonomy and respect.
From a management point of view, supervisors should provide AA employees with significant, stimulating and
challenging tasks, allow them to use their own judgment and initiative, enable them to apply a variety of skills
and competencies, provide them with feedback on performance and outline expectations clearly. Participation
and involvement should be encouraged by noting suggestions made by AA employees and giving recognition
for work well done.
Because there are various factors that could influence an employee’s decision to remain with an organisation
(ie unemployment conditions), staff category is only partially responsible for employees’ loyalty. Management
should, however, keep the motivational value of promotions in mind when trying to retain the services of core
personnel.
9.9 CONCLUDING REMARKS
The findings of this study support those of other researchers (Gopinatha & Becker, 2000; Harris, 2000;
Konovsky, 2000; Saxby et al, 2000; Simerson et al, 2000; Tata, 2000) who suggest that the treatment of
employees, rather than rewards or the perceived fairness of the organisational system, may be more important
in the manifestation of organisationally desirable behaviours. If management apply procedures and treat
employees fairly they will directly influence employees’ commitment. If management wish to create an work
atmosphere that elicits commitment, they must strive to improve the perceived fairness of their interactions with
subordinates.
UUnniivveerrssiittyy ooff PPrreettoorriiaa eettdd –– CCooeettzzeeee,, MM ((22000055))
9.11
Many managers face conditions that may constrain their ability to reward employees equitably. Budgets and
other monetary restrictions are often outside managerial control. Similarly, the formal procedures in an
organisation may be beyond a manager’s influence. However, the sensitivity with which a manager treats his
or her subordinates and the ability to demonstrate fair intentions is relatively controllable by managers.
Managers who wish to build a committed workforce need to realise that employees will be committed only if they
believe that they themselves are being treated fairly. A key antecedent to performance and commitment appear
to be employees’ perceptions of fair treatment, an aspect of employee interaction completely under the control
of most managers. Organisations should thus focus on improving the perceived fairness of managerial
behaviours. Managers should receive training on the importance of being consistent, unbiased, truthful, and
respectful in assigning jobs, conducting evaluations, and administering rewards and punishment.
This study represents a vital step towards a better understanding of the dimensionality of AA fairness.
Examining the relationships between perceptions of fairness, the treatment of AA employees and employee
commitment should ultimately contribute to more effective management of AA in the workplace.
UUnniivveerrssiittyy ooff PPrreettoorriiaa eettdd –– CCooeettzzeeee,, MM ((22000055))

10.1
APPENDICES
UUnniivveerrssiittyy ooff PPrreettoorriiaa eettdd –– CCooeettzzeeee,, MM ((22000055))
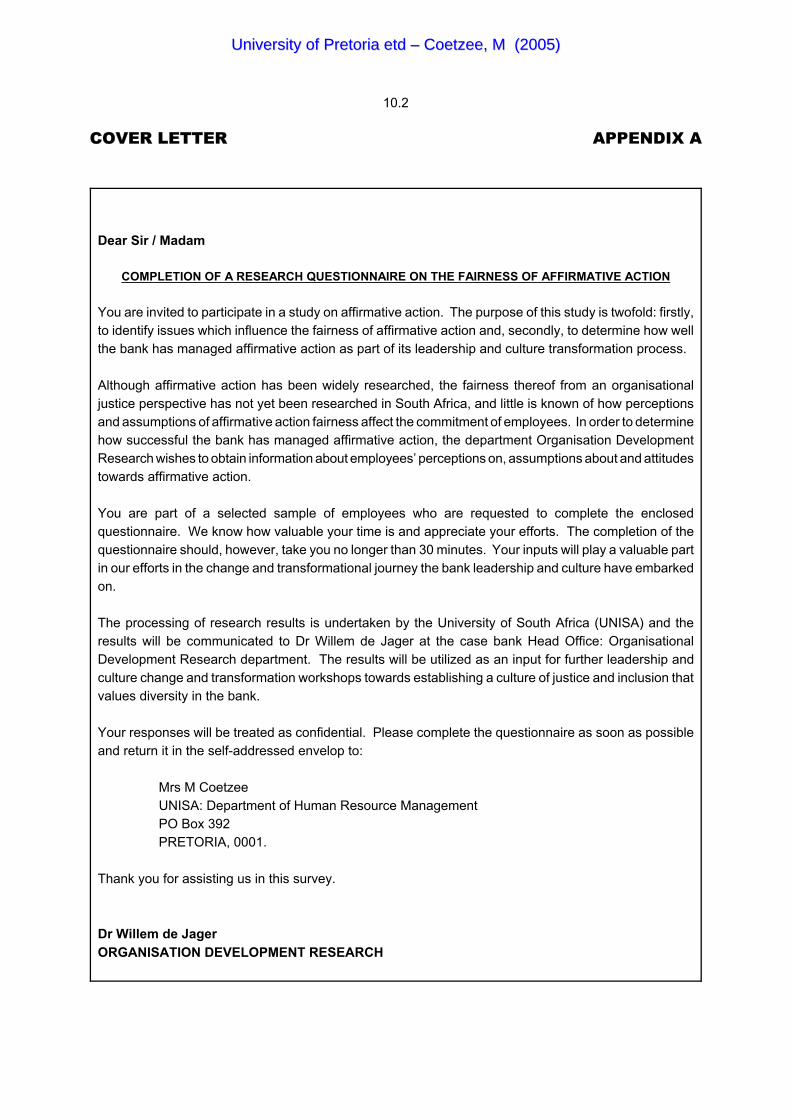
10.2
COVER LETTER APPENDIX A
Dear Sir / Madam
COMPLETION OF A RESEARCH QUESTIONNAIRE ON THE FAIRNESS OF AFFIRMATIVE ACTION
You are invited to participate in a study on affirmative action. The purpose of this study is twofold: firstly,to identify issues which influence the fairness of affirmative action and, secondly, to determine how wellthe bank has managed affirmative action as part of its leadership and culture transformation process.
Although affirmative action has been widely researched, the fairness thereof from an organisationaljustice perspective has not yet been researched in South Africa, and little is known of how perceptionsand assumptions of affirmative action fairness affect the commitment of employees. In order to determinehow successful the bank has managed affirmative action, the department Organisation DevelopmentResearch wishes to obtain information about employees’ perceptions on, assumptions about and attitudestowards affirmative action.
You are part of a selected sample of employees who are requested to complete the enclosedquestionnaire. We know how valuable your time is and appreciate your efforts. The completion of thequestionnaire should, however, take you no longer than 30 minutes. Your inputs will play a valuable partin our efforts in the change and transformational journey the bank leadership and culture have embarkedon.
The processing of research results is undertaken by the University of South Africa (UNISA) and theresults will be communicated to Dr Willem de Jager at the case bank Head Office: OrganisationalDevelopment Research department. The results will be utilized as an input for further leadership andculture change and transformation workshops towards establishing a culture of justice and inclusion thatvalues diversity in the bank.
Your responses will be treated as confidential. Please complete the questionnaire as soon as possibleand return it in the self-addressed envelop to:
Mrs M Coetzee UNISA: Department of Human Resource ManagementPO Box 392 PRETORIA, 0001.
Thank you for assisting us in this survey.
Dr Willem de JagerORGANISATION DEVELOPMENT RESEARCH
UUnniivveerrssiittyy ooff PPrreettoorriiaa eettdd –– CCooeettzzeeee,, MM ((22000055))
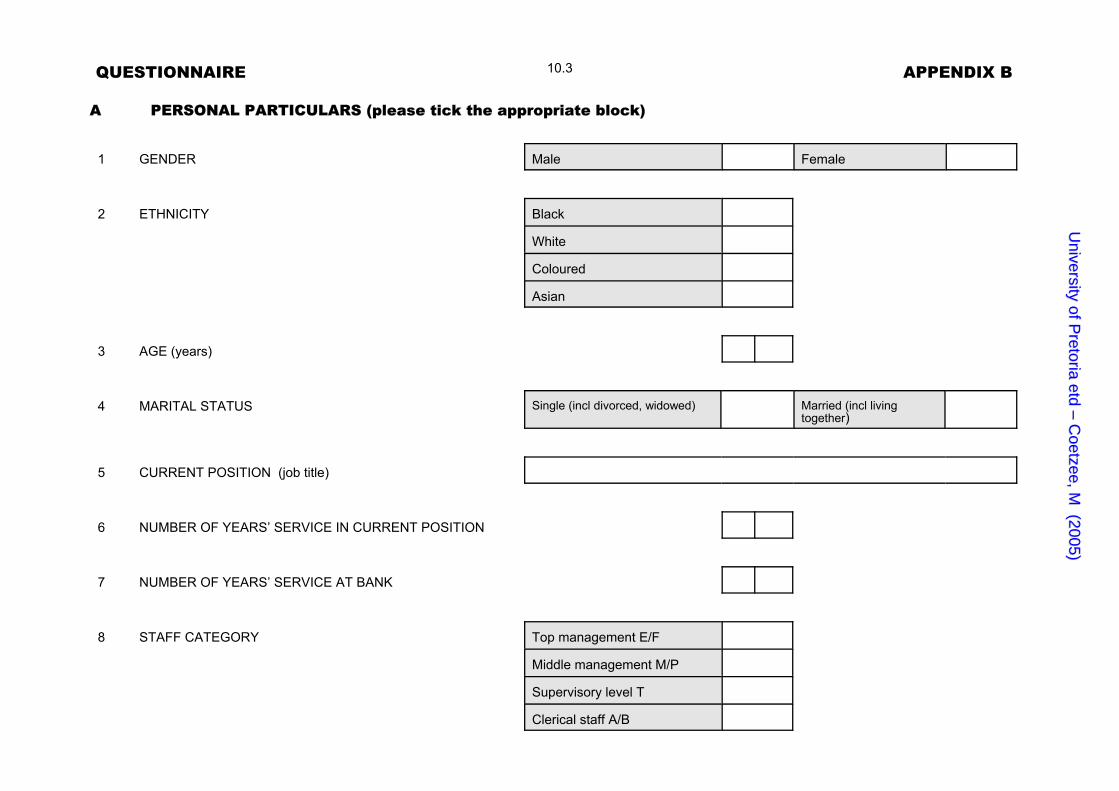
QUESTIONNAIRE APPENDIX B10.3
A PERSONAL PARTICULARS (please tick the appropriate block)
1 GENDER Male Female
2 ETHNICITY Black
White
Coloured
Asian
3 AGE (years)
4 MARITAL STATUS Single (incl divorced, widowed) Married (incl livingtogether)
5 CURRENT POSITION (job title)
6 NUMBER OF YEARS’ SERVICE IN CURRENT POSITION
7 NUMBER OF YEARS’ SERVICE AT BANK
8 STAFF CATEGORY Top management E/F
Middle management M/P
Supervisory level T
Clerical staff A/B
U Un ni iv ve er rs si it ty y o of f P Pr re et to or ri ia a e et td d – – C C
o oe et tz ze ee e, , M M ( (2 20 00 05 5) )

10.4
9 HIGHEST EDUCATIONAL QUALIFICATION Lower than grade 12 Degree
Grade 12 Honours degree
Certificate (1 year) Master’s degree
Diploma (3 years) Doctor’s degree
10 MONTHLY GROSS SALARY (benefits excluded) 5 000 or less 25 001 - 30 000
5 001 - 10 000 30 001 - 35 000
10 001 - 15 000 35 001 - 40 000
15 001 - 20 000 More than 40 000
20 001 - 25 000
11 HAVE YOU BEEN APPOINTED TO YOUR CURRENTPOSITION BY MEANS OF EMPLOYMENT EQUITY?
Yes No Not sure
Answer the following questions about your supervisor:
12 ETHNICITY OF SUPERVISOR Black White Coloured Asian
13 GENDER OF SUPERVISOR Male Female
U Un ni iv ve er rs si it ty y o of f P Pr re et to or ri ia a e et td d – – C C
o oe et tz ze ee e, , M M ( (2 20 00 05 5) )
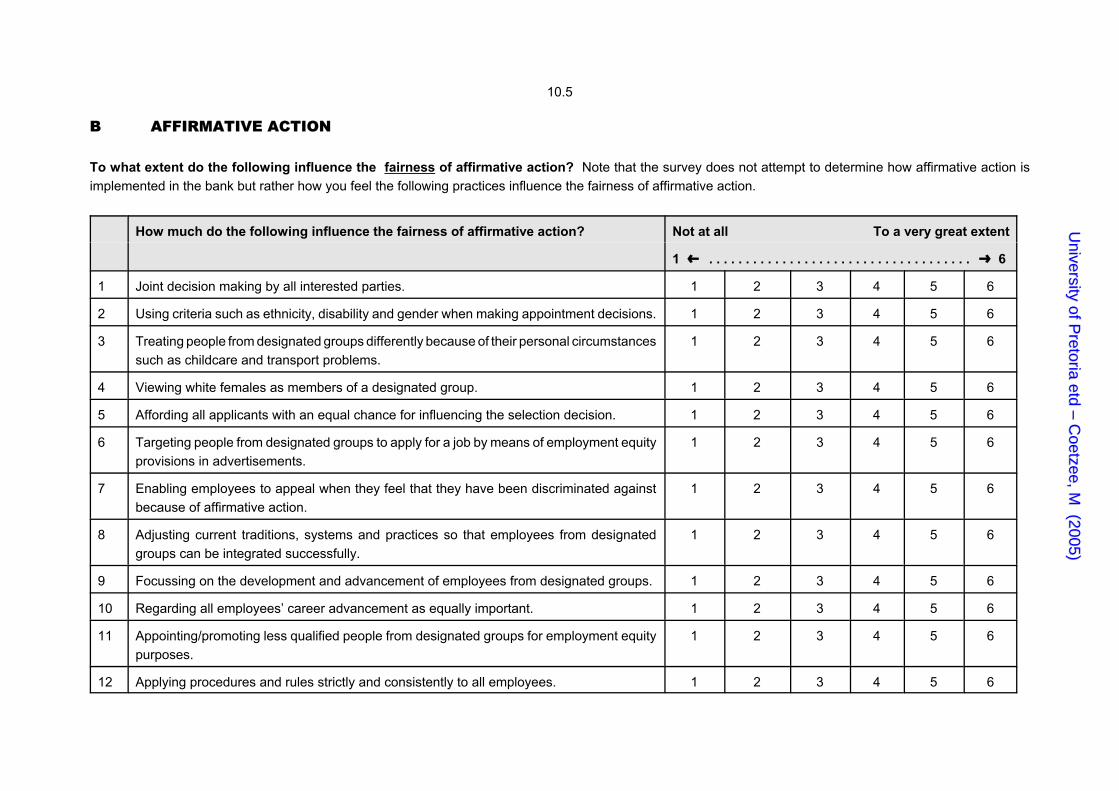
10.5
B AFFIRMATIVE ACTION
To what extent do the following influence the fairness of affirmative action? Note that the survey does not attempt to determine how affirmative action isimplemented in the bank but rather how you feel the following practices influence the fairness of affirmative action.
How much do the following influence the fairness of affirmative action? Not at all To a very great extent
1 » . . . . . . . . . . . . . . . . . . . . . . . . . . . . . . . . . . . . º 6
1 Joint decision making by all interested parties. 1 2 3 4 5 6
2 Using criteria such as ethnicity, disability and gender when making appointment decisions. 1 2 3 4 5 6
3 Treating people from designated groups differently because of their personal circumstancessuch as childcare and transport problems.
1 2 3 4 5 6
4 Viewing white females as members of a designated group. 1 2 3 4 5 6
5 Affording all applicants with an equal chance for influencing the selection decision. 1 2 3 4 5 6
6 Targeting people from designated groups to apply for a job by means of employment equityprovisions in advertisements.
1 2 3 4 5 6
7 Enabling employees to appeal when they feel that they have been discriminated againstbecause of affirmative action.
1 2 3 4 5 6
8 Adjusting current traditions, systems and practices so that employees from designatedgroups can be integrated successfully.
1 2 3 4 5 6
9 Focussing on the development and advancement of employees from designated groups. 1 2 3 4 5 6
10 Regarding all employees’ career advancement as equally important. 1 2 3 4 5 6
11 Appointing/promoting less qualified people from designated groups for employment equitypurposes.
1 2 3 4 5 6
12 Applying procedures and rules strictly and consistently to all employees. 1 2 3 4 5 6
U Un ni iv ve er rs si it ty y o of f P Pr re et to or ri ia a e et td d – – C C
o oe et tz ze ee e, , M M ( (2 20 00 05 5) )
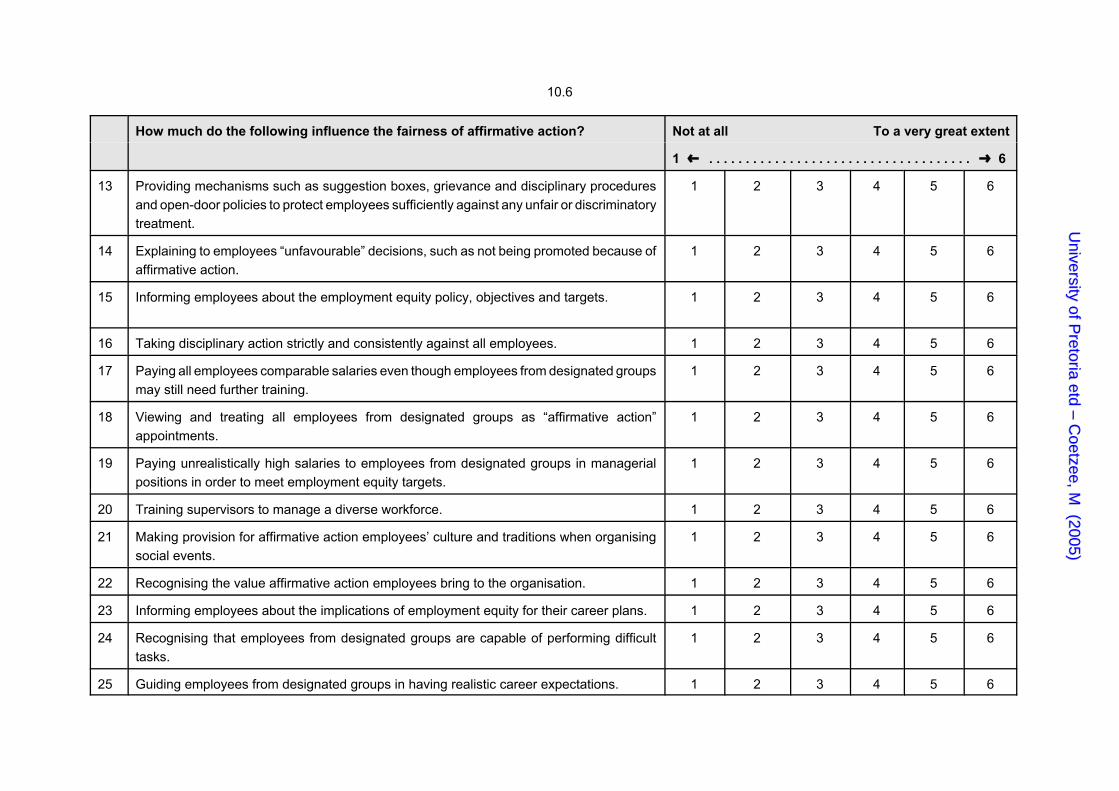
10.6
How much do the following influence the fairness of affirmative action? Not at all To a very great extent
1 » . . . . . . . . . . . . . . . . . . . . . . . . . . . . . . . . . . . . º 6
13 Providing mechanisms such as suggestion boxes, grievance and disciplinary proceduresand open-door policies to protect employees sufficiently against any unfair or discriminatorytreatment.
1 2 3 4 5 6
14 Explaining to employees “unfavourable” decisions, such as not being promoted because ofaffirmative action.
1 2 3 4 5 6
15 Informing employees about the employment equity policy, objectives and targets. 1 2 3 4 5 6
16 Taking disciplinary action strictly and consistently against all employees. 1 2 3 4 5 6
17 Paying all employees comparable salaries even though employees from designated groupsmay still need further training.
1 2 3 4 5 6
18 Viewing and treating all employees from designated groups as “affirmative action”appointments.
1 2 3 4 5 6
19 Paying unrealistically high salaries to employees from designated groups in managerialpositions in order to meet employment equity targets.
1 2 3 4 5 6
20 Training supervisors to manage a diverse workforce. 1 2 3 4 5 6
21 Making provision for affirmative action employees’ culture and traditions when organisingsocial events.
1 2 3 4 5 6
22 Recognising the value affirmative action employees bring to the organisation. 1 2 3 4 5 6
23 Informing employees about the implications of employment equity for their career plans. 1 2 3 4 5 6
24 Recognising that employees from designated groups are capable of performing difficulttasks.
1 2 3 4 5 6
25 Guiding employees from designated groups in having realistic career expectations. 1 2 3 4 5 6
U Un ni iv ve er rs si it ty y o of f P Pr re et to or ri ia a e et td d – – C C
o oe et tz ze ee e, , M M ( (2 20 00 05 5) )

10.7
How much do the following influence the fairness of affirmative action? Not at all To a very great extent
1 » . . . . . . . . . . . . . . . . . . . . . . . . . . . . . . . . . . . . º 6
26 Employing more employees on a contract basis because of employment equity legislation. 1 2 3 4 5 6
27 Using predetermined, job-related selection criteria when making selection decisions. 1 2 3 4 5 6
28 Applying selection criteria consistently to all applicants. 1 2 3 4 5 6
29 Using the same performance standards for all employees. 1 2 3 4 5 6
30 Making use of accurate performance data when evaluating employees’ performance. 1 2 3 4 5 6
31 Making use of more than one appraiser when evaluating an employee’s performance. 1 2 3 4 5 6
32 Referring to the employment equity plan and the profile of the current workforce whenappointing personnel.
1 2 3 4 5 6
33 Focussing on the needs of employees from designated groups when compiling training anddevelopment programmes.
1 2 3 4 5 6
34 Having accurate and complete records available in respect of appointments, promotions,transfers, performance appraisals, disciplinary hearings etc.
1 2 3 4 5 6
35 Management expressing regret when an individual cannot be promoted on account ofaffirmative action.
1 2 3 4 5 6
36 Management being prepared to admit when affirmative action played a role in making adecision.
1 2 3 4 5 6
37 Providing feedback and comments without referring to any affirmative action issue. 1 2 3 4 5 6
38 Providing employee benefits that meet the needs of a diverse workforce. 1 2 3 4 5 6
39 Giving black managers token positions. 1 2 3 4 5 6
40 Training employees from a designated group to replace current job incumbents. 1 2 3 4 5 6
U Un ni iv ve er rs si it ty y o of f P Pr re et to or ri ia a e et td d – – C C
o oe et tz ze ee e, , M M ( (2 20 00 05 5) )
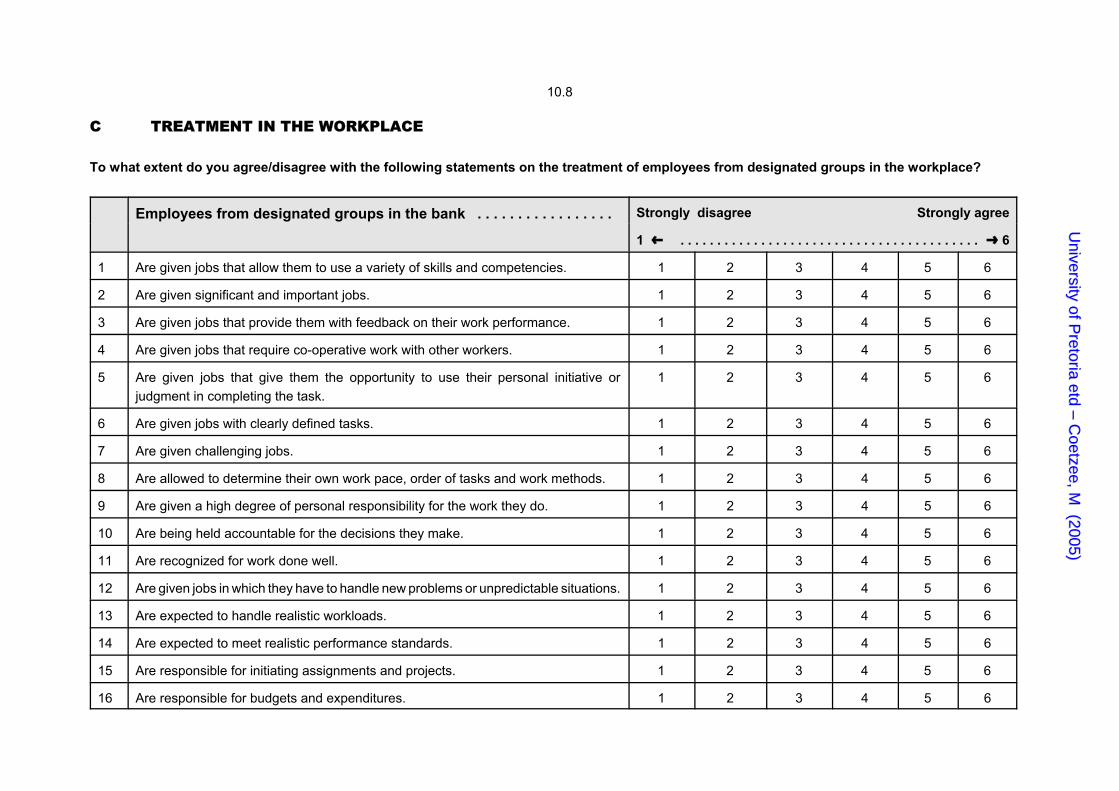
10.8
C TREATMENT IN THE WORKPLACE
To what extent do you agree/disagree with the following statements on the treatment of employees from designated groups in the workplace?
Employees from designated groups in the bank . . . . . . . . . . . . . . . . . Strongly disagree Strongly agree
1 » . . . . . . . . . . . . . . . . . . . . . . . . . . . . . . . . . . . . . . . . . º 6
1 Are given jobs that allow them to use a variety of skills and competencies. 1 2 3 4 5 6
2 Are given significant and important jobs. 1 2 3 4 5 6
3 Are given jobs that provide them with feedback on their work performance. 1 2 3 4 5 6
4 Are given jobs that require co-operative work with other workers. 1 2 3 4 5 6
5 Are given jobs that give them the opportunity to use their personal initiative orjudgment in completing the task.
1 2 3 4 5 6
6 Are given jobs with clearly defined tasks. 1 2 3 4 5 6
7 Are given challenging jobs. 1 2 3 4 5 6
8 Are allowed to determine their own work pace, order of tasks and work methods. 1 2 3 4 5 6
9 Are given a high degree of personal responsibility for the work they do. 1 2 3 4 5 6
10 Are being held accountable for the decisions they make. 1 2 3 4 5 6
11 Are recognized for work done well. 1 2 3 4 5 6
12 Are given jobs in which they have to handle new problems or unpredictable situations. 1 2 3 4 5 6
13 Are expected to handle realistic workloads. 1 2 3 4 5 6
14 Are expected to meet realistic performance standards. 1 2 3 4 5 6
15 Are responsible for initiating assignments and projects. 1 2 3 4 5 6
16 Are responsible for budgets and expenditures. 1 2 3 4 5 6
U Un ni iv ve er rs si it ty y o of f P Pr re et to or ri ia a e et td d – – C C
o oe et tz ze ee e, , M M ( (2 20 00 05 5) )

10.9
Employees from designated groups in the bank . . . . . . . . . . . . . . . . . Strongly disagree Strongly agree
1 » . . . . . . . . . . . . . . . . . . . . . . . . . . . . . . . . . . . . . . . . . º 6
17 Are responsible for carrying out assignments and projects. 1 2 3 4 5 6
18 Are responsible for equipment and facilities. 1 2 3 4 5 6
19 Are required to refer all decisions to their supervisors for approval. 1 2 3 4 5 6
20 Are being listened to when they make suggestions. 1 2 3 4 5 6
21 Are treated with respect and dignity. 1 2 3 4 5 6
22 Are not seen as an employment equity initiative only, but people who can make acontribution to the success of the organisation.
1 2 3 4 5 6
23 Are provided with adequate office equipment. 1 2 3 4 5 6
24 Are at ease when attending social events because such events do take culturaldifferences into consideration.
1 2 3 4 5 6
25 Feel free to discuss personal and/or work related problems with co-workers andsupervisors.
1 2 3 4 5 6
26 (Women) are able to compete with men on an equal footing despite having to attendto family responsibilities. (unable to travel or work overtime)
1 2 3 4 5 6
U Un ni iv ve er rs si it ty y o of f P Pr re et to or ri ia a e et td d – – C C
o oe et tz ze ee e, , M M ( (2 20 00 05 5) )
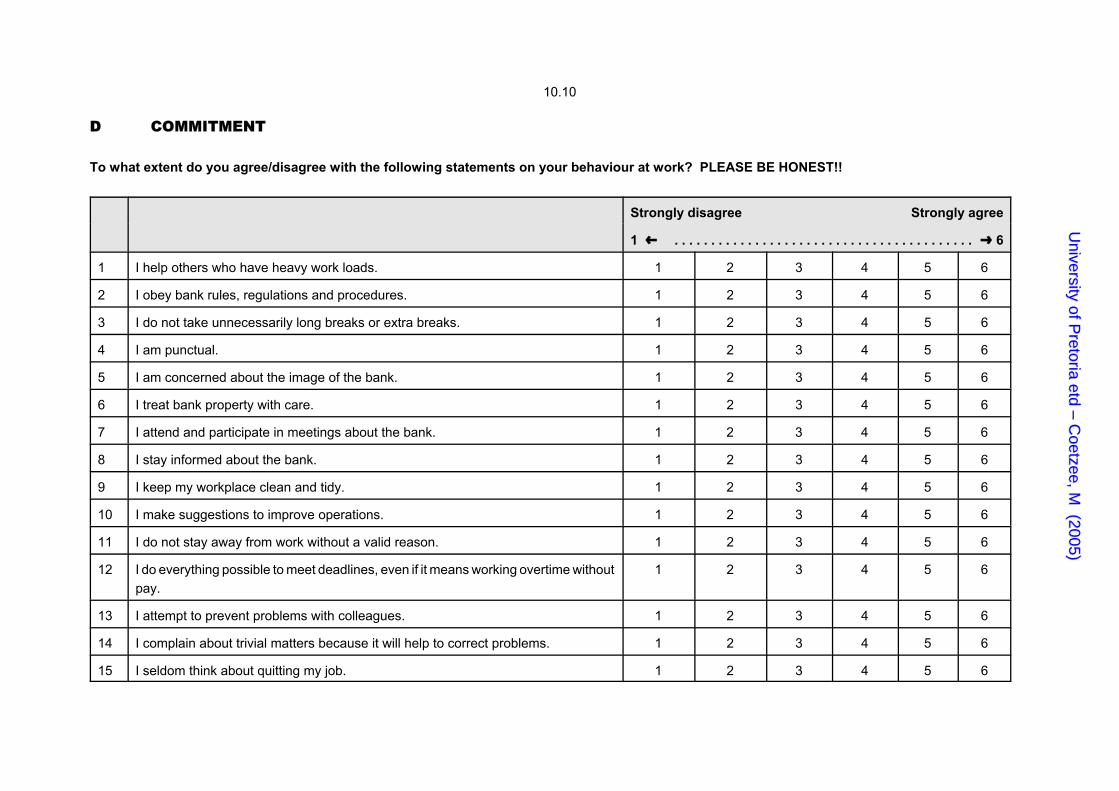
10.10
D COMMITMENT
To what extent do you agree/disagree with the following statements on your behaviour at work? PLEASE BE HONEST!!
Strongly disagree Strongly agree
1 » . . . . . . . . . . . . . . . . . . . . . . . . . . . . . . . . . . . . . . . . . º 6
1 I help others who have heavy work loads. 1 2 3 4 5 6
2 I obey bank rules, regulations and procedures. 1 2 3 4 5 6
3 I do not take unnecessarily long breaks or extra breaks. 1 2 3 4 5 6
4 I am punctual. 1 2 3 4 5 6
5 I am concerned about the image of the bank. 1 2 3 4 5 6
6 I treat bank property with care. 1 2 3 4 5 6
7 I attend and participate in meetings about the bank. 1 2 3 4 5 6
8 I stay informed about the bank. 1 2 3 4 5 6
9 I keep my workplace clean and tidy. 1 2 3 4 5 6
10 I make suggestions to improve operations. 1 2 3 4 5 6
11 I do not stay away from work without a valid reason. 1 2 3 4 5 6
12 I do everything possible to meet deadlines, even if it means working overtime withoutpay.
1 2 3 4 5 6
13 I attempt to prevent problems with colleagues. 1 2 3 4 5 6
14 I complain about trivial matters because it will help to correct problems. 1 2 3 4 5 6
15 I seldom think about quitting my job. 1 2 3 4 5 6
U Un ni iv ve er rs si it ty y o of f P Pr re et to or ri ia a e et td d – – C C
o oe et tz ze ee e, , M M ( (2 20 00 05 5) )

10.11
Strongly disagree Strongly agree
1 » . . . . . . . . . . . . . . . . . . . . . . . . . . . . . . . . . . . . . . . . . º 6
16 I only attend work-related meetings if required. 1 2 3 4 5 6
17 I share ideas for new projects or improvements widely. 1 2 3 4 5 6
18 I perform extra duties and responsibilities only if they enhance my career prospects. 1 2 3 4 5 6
19 I complete tasks beyond what is required. 1 2 3 4 5 6
20 I mind my own business and do not interfere with others’ dishonesty andwrongdoing.
1 2 3 4 5 6
21 I express my opinions honestly even if others differ from me. 1 2 3 4 5 6
22 I show up for work early so that I can get things ready. 1 2 3 4 5 6
23 I use bank property (printer, telephone, fax) for personal use. 1 2 3 4 5 6
24 I do not mind working for a different company as long as the type of work is similar. 1 2 3 4 5 6
25 I enjoy my job. 1 2 3 4 5 6
26 I find my work environment pleasant. 1 2 3 4 5 6
27 I feel a sense of personal satisfaction when I do my job well. 1 2 3 4 5 6
28 I regard my job as a eight-to-five job which enables me to make a living. 1 2 3 4 5 6
29 I will not resign because the bank has done a lot for me and I feel obliged to continueemployment with it.
1 2 3 4 5 6
30 I cannot resign because the costs associated with leaving the bank are too high (egretirement, medical and leave benefits).
1 2 3 4 5 6
31 I will not resign because I like my job and enjoy working for the bank. 1 2 3 4 5 6
32 I make the most of learning opportunities provided to me by the bank. 1 2 3 4 5 6
U Un ni iv ve er rs si it ty y o of f P Pr re et to or ri ia a e et td d – – C C
o oe et tz ze ee e, , M M ( (2 20 00 05 5) )

10.12
Strongly disagree Strongly agree
1 » . . . . . . . . . . . . . . . . . . . . . . . . . . . . . . . . . . . . . . . . . º 6
33 I doubt whether hard work will lead to a promotion because of employment equityrequirements.
1 2 3 4 5 6
34 I stay with the bank mainly because of the scarcity of alternative employmentopportunities.
1 2 3 4 5 6
35 I attend social functions regularly. 1 2 3 4 5 6
36 I will consider a job offer from another company only if it is considerably better thanmy current job.
1 2 3 4 5 6
37 I regard my colleagues as friends. 1 2 3 4 5 6
THANK YOU FOR COMPLETING THE QUESTIONNAIRE
U Un ni iv ve er rs si it ty y o of f P Pr re et to or ri ia a e et td d – – C C
o oe et tz ze ee e, , M M ( (2 20 00 05 5) )

RELATIONSHIP BETWEEN AA FAIRNESS AND THE BEHAVIOURAL DOMAINS APPENDIX C
BINTERAC B.P.INPU B.P.CRIT B.DISTRI C.OUTONO C.RSPECT C.RSPONS C.EXPECT D.OBEDIE D.SATISF D.PARTIC D.LOYALBINTERAC Pearson (r) 1.000 0.732 0.739 0.364 0.610 0.588 0.398 0.478 0.301 0.373 0.297 0.257
Sig. (2-tailed) . 0.000 0.000 0.000 0.000 0.000 0.000 0.000 0.000 0.000 0.000 0.000
B.P.INPUT Pearson (r) 0.732 1.000 0.726 0.221 0.516 0.534 0.346 0.470 0.218 0.329 0.253 0.226 Sig. (2-tailed) 0.000 . 0.000 0.000 0.000 0.000 0.000 0.000 0.000 0.000 0.000 0.000
B.P.CRIT Pearson (r) 0.739 0.726 1.000 0.202 0.558 0.543 0.369 0.493 0.216 0.338 0.229 0.169 Sig. (2-tailed) 0.000 0.000 . 0.000 0.000 0.000 0.000 0.000 0.000 0.000 0.000 0.002
B.DISTRI Pearson (r) 0.364 0.221 0.202 1.000 0.422 0.394 0.224 0.196 0.264 0.240 0.243 0.163 Sig. (2-tailed) 0.000 0.000 0.000 . 0.000 0.000 0.000 0.000 0.000 0.000 0.000 0.002
C.OUTONO Pearson (r) 0.610 0.516 0.558 0.422 1.000 0.764 0.580 0.737 0.339 0.422 0.403 0.214 Sig. (2-tailed) 0.000 0.000 0.000 0.000 . 0.000 0.000 0.000 0.000 0.000 0.000 0.000
C.RSPECT Pearson (r) 0.588 0.534 0.543 0.394 0.764 1.000 0.588 0.656 0.311 0.386 0.310 0.205 Sig. (2-tailed) 0.000 0.000 0.000 0.000 0.000 . 0.000 0.000 0.000 0.000 0.000 0.000
C.RSPONS Pearson (r) 0.398 0.346 0.369 0.224 0.580 0.588 1.000 0.585 0.238 0.259 0.295 0.185 Sig. (2-tailed) 0.000 0.000 0.000 0.000 0.000 0.000 . 0.000 0.000 0.000 0.000 0.001
C.EXPECT Pearson (r) 0.478 0.470 0.493 0.196 0.737 0.656 0.585 1.000 0.286 0.368 0.333 0.182 Sig. (2-tailed) 0.000 0.000 0.000 0.000 0.000 0.000 0.000 . 0.000 0.000 0.000 0.001
D.OBEDIE Pearson (r) 0.301 0.218 0.216 0.264 0.339 0.311 0.238 0.286 1.000 0.376 0.596 0.276 Sig. (2-tailed) 0.000 0.000 0.000 0.000 0.000 0.000 0.000 0.000 . 0.000 0.000 0.000
D.SATISF Pearson (r) 0.373 0.329 0.338 0.240 0.422 0.386 0.259 0.368 0.376 1.000 0.396 0.461 Sig. (2-tailed) 0.000 0.000 0.000 0.000 0.000 0.000 0.000 0.000 0.000 . 0.000 0.000
D.PARTIC Pearson (r) 0.297 0.253 0.229 0.243 0.403 0.310 0.295 0.333 0.596 0.396 1.000 0.219 Sig. (2-tailed) 0.000 0.000 0.000 0.000 0.000 0.000 0.000 0.000 0.000 0.000 . 0.000
D.LOYAL Pearson (r) 0.257 0.226 0.169 0.163 0.214 0.205 0.185 0.182 0.276 0.461 0.219 1.000 Sig. (2-tailed) 0.000 0.000 0.002 0.002 0.000 0.000 0.001 0.001 0.000 0.000 0.000 .
Correlation is significant at the 0.01 level (2-tailed). N = 349.
U Un ni iv ve er rs si it ty y o of f P Pr re et to or ri ia a e et td d – – C C
o oe et tz ze ee e, , M M ( (2 20 00 05 5) )
BIBLIOGRAPHY
Aaker, DA, Kumar, V & Day, GS. 1995. Marketing research. 5th edition. New York: John Wiley.
Adams, JS. 1965. Inequity in social exchange. In L Berkowitz (Ed), Advances in experimental social
psychology. New York: Academic Press.
Aids in 2005. 2002. Daily Mail & Guardian. 17 April.
Allen, NJ & Smith, J. 1987. An investigation of extra-role behaviours within organizations. Paper
presented at the annual meeting of the Canadian Psychological Association, Vancouver, British Columbia.
American Psychological Association. 1994. Publication Manual of the American Psychological
Association. 4th edition. Washington.
Arnesen, DW & Fleenor, CP. 1998. Name, rank, and serial number? The dilemma of reference checks.
Business Horizons, 41(4):71-79.
Arthur, JB. 1994. Effects of human resource systems on manufacturing performance and turnover.
Academy of Management Journal, 37:670-687.
Babbie, ER. 1998. The practice of social research. 8th edition. Belmont, California: Wadsworth.
Barclay, JM. 2001. Improving selection interviews with structure: organisations’ use of “behavioural”
interviews. Personnel Review, 28(1/2):134-151.
Barrier, M. 1999. Hire without fear. Nation’s Business, 87(5):16-23.
Bateman, TS & Organ, DW. 1983. Job satisfaction and the good soldier: the relationship between affect
and employee citizenship. Academy of Management Journal, 26:587-595.
Becker, TE & Randall, DM. 1994. Validation of a measure of organizational citizenship behavior against
an objective behavioral criterion. Educational and Psychological Measurement, 54(1):160-168.
Bendix, S. 2001. Industrial relations in South Africa. 4th edition. Lansdowne: Juta.
Bergmann, TJ, Lester, SW, De Meuse, KP & Grahn, JL. 2000. Integrating the three domains of employee
commitment: an exploratory study. Journal of Applied Business Research, 16(4):15-27.
UUnniivveerrssiittyy ooff PPrreettoorriiaa eettdd –– CCooeettzzeeee,, MM ((22000055))
Bettencourt, LA & Brown, SW. 1997. Contact employees: relationships among workplace fairness, job
satisfaction and prosocial service behaviors. Journal of Retailing, 73(1):39-62.
Bible, J. 1998. Discrimination in job applications and interviews. Supervision, 59(11):9-12.
Bies, RJ. 1987. The predicament of injustice: the management of moral outrage. In LL Cummings & BM
Staw (Eds.), Research in organizational behavior. 9:43-55. Greenwich, CT: JAI Press.
Bies, RJ & Moag, JS. 1986. Interactional justice: communication criteria for fairness. In B Sheppard (Ed.),
Research on negotiation in organizations. 1:43-55.
Bies, RJ & Shapiro, DL. 1988. Voice and justification: their influence on procedural fairness judgments.
Academy of Management Journal, 31:676-685.
Black Management Forum. 1993. Affirmative action blueprint. Johannesburg: Black Management Forum.
Bland, TS & Stalcup, SS. 1999. Accurate applications. Security Management, 43(6):38-40.
Blau, PM. 1964. Exchange and power in social life. New York: Wiley.
Bolino, MC & Turnley, WH. 2003. Going the extra mile: cultivating and managing employee citizenship
behavior. Academy of Management Executive, 17(3):60-72.
Bragg, T. 2002. Improve employee commitment. Industrial Management, 44(4):18-21.
Bradley, J. 1972. Nonparametric statistics. In R Kirk (Ed.), Statistical issues: a reader for the behavioural
sciences. Monterey, California: Brooks/Cole.
Bureau of Market Research. 2002. Population estimates for 2002. Pretoria: University of South Africa.
Butler, JK. 1991. Toward understanding and measuring conditions of trust: evolution of a conditions of
trust inventory. Journal of Management, 17:643-663.
Charlton, GD & Van Niekerk, N. 1994. Affirming action - beyond 1994: laying the foundation for
comprehensive and effective affirmative action. Kenwyn: Juta.
Clark, LA & Watson, D. 1995. Constructing validity: basic issues in objective scale development.
Psychological Assessment, 7 (3):309-319.
Cooper, D & Robertson, IT. 1995. The psychology of personnel selection. London: Routledge.
UUnniivveerrssiittyy ooff PPrreettoorriiaa eettdd –– CCooeettzzeeee,, MM ((22000055))

Cooper, DR & Emory, CW. 1995. Business research methods. 5th edition. Chicago: McGraw-Hill Irwin.
Cooper, DR & Schindler, PS. 2003. Business research methods. 8th edition. New York: McGraw-Hill
Irwin.
Cortina, JM. 1993. What is coefficient Alpha? An examination of theory and applications. Journal of
Applied Psychology, 78:98-104.
Cowherd, DM & Levine, DI. 1992. Product quality and pay equity between lower-level employees and top
management: an investigation of distributive justice theory. Administrative Science Quarterly, (37):302-
320.
Cox, TH. 1993. Cultural diversity in organizations: theory, research and practice, San Francisco,
California: Berrett-Koehler.
Cropanzano, R. 1993. Justice in the workplace: approaching fairness in human resource management.
New Jersey: Lawrence Erlbaum Associates.
Crosby, F. 1984. Relative deprivation in organizational settings. In BM Staw & LL Cummings (Eds.),
Research in organizational behavior. 5th edition. New York: McGraw-Hill.
Deluga, RJ. 1994. Supervision trust building, leader-member exchange and organizational citizenship
behaviour. Journal of Occupational and Organizational Psychology, 67(4):315-327.
De Witt, R. 1998. The influence of eligibility on employees’ reactions to voluntary workforce reduction.
Journal of Management. 1-19 September: http://www.findarticles.com.
Diamantopoulos, A & Schlegelmilch, BB. 1997. Taking the fear out of data analysis: a step-by-step
approach. London: The Dryden Press.
Employment Equity Report. 2001. Pretoria: Department of Labour.
Folger, R. 1984. The sense of injustice: social psychological perspectives. New York: Plenum Press.
Folger, R & Cropanzano, R 1998. Organizational justice and human resource management. Thousand
Oaks, California: SAGE.
Folger, R & Greenberg, J. 1985. Procedural justice: an interpretative analysis of personnel systems.
Research in Personnel and Human Resource Management, (3):141-183.
UUnniivveerrssiittyy ooff PPrreettoorriiaa eettdd –– CCooeettzzeeee,, MM ((22000055))

Folger, R & Konovsky, MA. 1989. Effects of procedural and distributive justice on reactIons to pay raise
decisions. Academy of Management Journal, 32(1):115-130.
Folger, R & Skarlicki, D. 1999. Unfairness and resistance to change: hardship as mistreatment. Journal
of Organizational Change Management, 12(1):35-50.
Gardner, P. 1975. Scales and statistics. Journal of Review of Educational Research, (45):43-57.
Gilliland, SW. 1993. The perceived fairness of selection systems: an organizational justice perspective.
Academy of Management Review, (18):694-734.
Glisson, C & Durick, M. 1988. Predictors of job satisfaction and organizational commitment in human
service organizations. Administrative Science Quarterly, 33:61-81.
Gopinatha, C & Becker, TE. 2000. Communication, procedural justice and employee attitudes:
relationships under conditions of divestiture. Journal of Management, 26(1):63-84.
Graham, JW. 1991. An essay on organizational citizenship behavior. Employee Responsibilities and
Rights Journal, 4:249-270.
Greenberg, J. 1987. A taxonomy of organizational justice theories. Academy of Management Review,
(12):9-22.
Greenberg, J. 1988. Equity and workplace status: A field experiment. Journal of Applied Psychology,
73:606-613.
Greenberg, J. 1990. Organizational justice: yesterday, today, and tomorrow. Journal of Management,
16(2):399-432.
Greenberg, J. 1996. The quest for justice on the job: essays and experiments. London: SAGE.
Greenberger, DB & Strasser, S. 1986. Development and application of a model of personal control in
organizations. Academy of Management Review, 11:164-177.
Hair, JF, Anderson, RE, Tatham, RL & Black, WC. 1998. Multivariate data analysis. New Jersey:Prentice-
Hall International.
Harris, L. 2000. Procedural justice and perceptions of fairness in selection practice. International Journal
of Selection and Assessment, 8(3):148-157.
UUnniivveerrssiittyy ooff PPrreettoorriiaa eettdd –– CCooeettzzeeee,, MM ((22000055))

Hatcher, L. 1994. A step by step approach to using the SAS system for factor analysis and structural
equation modeling. Cary NC: SAS Institute.
Hicks-Clarke, D & Iles, P. 2000. Climate for diversity and its effects on career and organisational attitudes
and perceptions. Personnel Review, 29(3):324-345.
Hirschman, AO. 1970. Exit, voice and loyalty: responses to decline in firms, organizations, and states.
Cambridge: Harvard University Press.
Howie, RM & Shapero, LA. 2002. Pre-employment criminal background checks: why employers should
look before they leap. Employee Relations Law Journal, 28(1):63-78.
Human, L. 1996. Managing workforce diversity: a critique and example from South Africa. International
Journal of Manpower, 17(4/5):46-64.
Inkeles, A. 1969. Participant citizenship in six developing countries. American Political Science Review,
63:1120-1141.
Innes, D, Kentridge, M & Perold, H. 1993. Reversing discrimination: affirmative action in the workplace.
Cape Town: Oxford University Press.
Ivancevich, JM & Matteson, MT. 2002. Organizational behavior and management. 6th edition. New York:
McGraw-Hill.
Jernigan, IE, Beggs, JM & Kohut, GF. 2002. Dimensions of work satisfaction as predictors of commitment
type. Journal of Managerial Psychology, 17(7):564-579.
Kanji, GK. 1999. Statistical test. London:SAGE.
Katz, D. 1964. The motivational basis of organizational behavior. Behavioral Science, 9:131-133.
Kerlinger, FN. 1988. Foundations of behavioral research. 3rd edition. New York: Holt, Rinehart & Winston.
Kimm, J & Mueller, CW. 1978. Factor analysis: statistical methods and practical issues. California, SAGE.
Konovsky, MA. 2000. Understanding procedural justice and its impact on business organizations. Journal
of Management, 26(3):489-512.
UUnniivveerrssiittyy ooff PPrreettoorriiaa eettdd –– CCooeettzzeeee,, MM ((22000055))

Lanphear, S. 2001. Commitment boosts employee staying power. Credit Union Executive Newsletter,
27(36):3-5.
Lawler, EJ. 1992. Affective attachments to nested groups: A choice-process theory. American
Sociological Review, 57:327-339.
Leck, JD, Saunders, DM & Charbonneau, M. 1996. Employment equity programs: an organizational
justice perspective. Journal of Organizational Behavior, (17):79-89.
Leedy, PD. 1996. Practical research: planning and design. 6th edition. New York: Macmillan.
Lemons, MA & Jones, CA. 2001. Procedural justice in promotion decisions: using perceptions of fairness
to build employee commitment. Journal of Managerial Psychology, 16(4):268-281.
Leong, CS, Furnham, A & Cooper, CL. 1996. The moderating effect of organizational commitment on the
occupational stress outcome relationship. Human Relations, 49(10):1345-1365.
Lemke, E & Wiersma, W. 1976. Principles of psychological measurement. Chicago: Rand MCNally
College.
Lerner, MJ. 1982. The justice motive in human relations and the economic model of man: a radical
analysis of facts and fictions. In V Derlega & J Grezlak (Eds.), Cooperation and helping behavior: theories
and research. New York: Academic Press.
Leventhal, GS. 1976. Fairness in social relationships. In Thibaut, JW., Spence, JT & Carson, RC.
Morristown (Eds.), Contemporary topics in social psychology. N J: General Learning Press.
Leventhal, GS. 1980. What should be done with equity theory? In KJ Gergen, MS Greenberg & RH Willis
(Eds.), Social exchange: advances in theory and research. New York: Plenum.
Leventhal, GS, Karuza, J & Fry, WR. 1980. Beyond fairness: a theory of allocation preferences. Justice
and social interaction. New York: Springer-Verlag.
Levy, PE & Williams, R. 1998. The role of perceived system knowledge in predicting appraisal reactions,
job satisfaction and organizational commitment. Journal of Organizational Behavior, 19(1):33-65.
Lind, EA & Tyler, TR. 1988. The social psychology of procedural justice. New York: Plenum.
Luhabe, W. 1993. Affirmative action: creating the reality. People Dynamics , 11(8):25-28.
UUnniivveerrssiittyy ooff PPrreettoorriiaa eettdd –– CCooeettzzeeee,, MM ((22000055))

MacDuffie, JP. 1995. Human resource bundles and manufacturing performance: organizational logic and
flexible production systems in the world auto industry. Industrial and Labor Relations Review, 48:197-221.
Madigan, MD & Dorrell, K. 2000. Commitment@work. Benefits Canada, 24(9):71-73.
Mathieu, JE & Zajac, DM. 1990. A review of meta-analysis of the antecedents, correlates and
consequences of organizational commitment. Psychological Bulletin, 108(2):171-194.
Mayer, RC & Schoorman, D. 1998. Differentiating antecedents of organizational commitment: a test of
March and Simon’s model. Journal of Organizational Behavior, 19(1):15-28.
Meyer, JP & Allen, NJ. 1984. Testing the “side-bet” theory of organizational commitment: some
methodological considerations. Journal of Applied Psychology, 69:372-378.
Meyer, JP & Allen, NJ. 1987. A longitudinal analysis of the early development and consequences of
organizational commitment. Canadian Journal of Behavioural Science, 19:199-215.
Meyer, JP & Allen. NJ. 1991. A three-component conceptualization of organizational commitment. Human
Resource Management Review, 1:61-89.
Meyer, JP, Allen, NJ & Gellatly, IR. 1990. Affective and continuance commitment to the organization:
evaluation of measures and analysis of concurrent and time-lagged relations. Journal of Applied
Psychology, 75:710-720.
Meyer, JP & Herscovitch, L. 2001. Commitment in the workplace: toward a general model. Human
Resource Management Review, 11:299-326.
Moorman, RH. 1991. Relationship between organizational justice and organizational citizenship behaviors:
do fairness perceptions influence employee citizenship? Journal of Applied Psychology, 76(6):845-855.
Moorman, RH, Niehoff, BP & Organ, DW. 1992. Treating employees fairly and organizational citizenship
behavior: sorting out the effects of job satisfaction, organizational commitment, and procedural justice.
Paper presented at the annual meeting of the Academy of Management, Las Vegas, NV.
Morgan, AG & Griego, OV. 1998. Easy use and interpretation of SPSS for Windows: answering research
questions with statistics. London: Lawrence Erlbaum Associates.
UUnniivveerrssiittyy ooff PPrreettoorriiaa eettdd –– CCooeettzzeeee,, MM ((22000055))

Morrison, AM. 1992. The new leaders: guidelines on leadership diversity in America. San Francisco:
Jossey-Bass.
Morrison, EW. 1994. Role definitions and organizational citizenship behavior: the importance of the
employee’s perspective. Academy of Management Journal, 37(6):1543-1568.
Niehoff, BP & Moorman, RH. 1993. Justice as a mediator of the relationship between methods of
monitoring and organizational citizenship behavior. Academy of Management Journal, 36:527-556.
O’Reilly, CA. & Chatman, J. 1986. Organizational commitment and psychological attachment: the effects
of compliance, identification and internalisation on prosocial behavior. Journal of Applied Psychology,
71(3):492-499.
O’Reilly, CA. & Caldwell, DF. 1980. Job choice: the impact of intrinsic and extrinsic factors on subsequent
satisfaction and commitment. Journal of Applied Psychology, 65:559-565.
Organ, DW. 1988. Organizational citizenship behavior: the “good soldier” syndrome. Lexington, MA:
Lexington.
Organ, DW. 1990. The motivational basis of organizational citizenship behavior. Research in
organizational behavior, 12:43-72.
Pfeffer, J & Langton, N. 1993. The effects of wage dispersion on satisfaction, productivity, and working
collaboratively: evidence from college and university faculty. Administrative Science Quarterly, 38(3):382-
407.
Podsakoff, PM & MacKenzie, SB. 1989. A second generation measure of organizational citizenship
behavior. Working Paper, Indiana University.
Ramchurran, B. 2001. Online recruitment: the future is here. HR Future, 1(1):16, 22-23, 50-52.
Randall, DM, Fedor, DB & Longenecker, CO. 1990. The behavioral expression of organizational
commitment. Journal of Vocational Behavior, 36:210-224.
Rhodes, SR & Steers, RM. 1981. Conventional vs worker-owned organizations. Human Relations, 12:
1013-1035.
Robinson, SL & Morrison, EW. 1995. Psychological contracts and OCB: the effect of unfulfilled obligations
on civic virtue behavior. Journal of Organizational Behavior, 16:289-298.
UUnniivveerrssiittyy ooff PPrreettoorriiaa eettdd –– CCooeettzzeeee,, MM ((22000055))

Rosenfeld, M. 1991. Affirmative action and justice: a philosophical and constitutional inquiry. London:
Yale University Press.
Rousseau, DM & Parks, JM. 1993. The contracts of individuals and organizations. Research in
Organizational Behavior, 15:1-43.
Rusbult, CE, Zembrodt, IM & Gunn, LK. 1982. Exit, voice, loyalty, and neglect: responses to
dissatisfaction in romantic involvements. Journal of Personality and Social Psychology, 43:1230-1242.
Saunders, MNK, Lewis, P & Thornhill, A. 1997. Research methods for business students. London:
Pitman.
Saxby, CL., Tat, PK. & Johansen, JT. 2000. Measuring consumer perceptions of procedural justice in a
complaint context. Journal of Consumer Affairs, 34(2):204-216.
Schepers, JM. 1992. Toetskonstruksie: teorie en praktyk. Johannesburg Randse Afrikaanse Universiteit.
Schmitt, N & Chan, D. 1999. The status of research on applicant reactions to selection tests and its
implications for managers. International Journal of Management Reviews, 1(1):45-63.
Scholl, RW. 1981. Differentiating commitment from expectancy as a motivating force. Academy of
Management Review, 6:589-599.
Shapiro, DL. 1991. The effects of explanations on negative reactions to deceit. Administrative Science
Quarterly, 36:614-630.
Shapiro, DL, Buttner, EH & Barry, B. 1994. Explanations for rejection decisions: what factors enhance
their perceived adequacy and moderate their enhancement of justice perceptions? Organizational Behavior
and Human Decision Processes, 58:346-368.
Sheppard, BH, Lewicki, RJ & Minton, JW. 1992. Organizational justice: the search for fairness in the
workplace. New York: Lexington Books.
Simerson, G, L’Heureux, T, Beckstein, B, ZiaMian, M, Dembowski, J & Freshman, M. 2000. What
principles are used to judge the fairness of retrenchment actions? Journal of Business and Psychology,
14(3):443-458.
Skarlicki, DP & Folger, R. 1997. Retaliation for perceived unfair treatment: examining the roles of
procedural and interactional justice. Journal of Applied Psychology, 82(3):434-443.
UUnniivveerrssiittyy ooff PPrreettoorriiaa eettdd –– CCooeettzzeeee,, MM ((22000055))

Skarlicki, D & Latham, G. 1996. Increasing citizenship behavior within a labor union: a test of
organizational justice theory. Journal of Applied Psychology, 81(2):161-169.
Smither, RD. 1994. The psychology of work and human performance. New York:HarperCollins.
Snell, S & Dean, J. 1992. Integrated manufacturing and human resource management: a human capital
perspective. Academy of Management Journal, 35:467-504.
SPSS. http://search.marsfind.com/ufts.html.
Statistical Analysis Software User’s guide. 1990. Statistics. Version 5. Cary, NC: SAS Institute.
Steyn, HS. 1999. Praktiese betekenisvolheid: die gebruik van effekgroottes. Wetenskaplike bydraes -
Reeks B: Natuurwetenskappe Nr. 117. Potchefstroom: PU vir CHO.
Steyn, HS. 2000. Practical significance of the difference in means. SA Journal of Industrial Psychology,
26(3):1-3.
Steyn, AGW, Smit, CF, Du Toit, SHC & Strasheim, C. 2003. Modern statistics in practice. Pretoria: Van
Schaik.
Stoker, DJ. 1981. Steekproefneming in die praktyk. Pretoria: Van Schaik.
Sudman, S & Blair, E. 1998. Marketing Research: a problem-solving approach. New York:
Irwin/McGraw-Hill.
Swanepoel, B, Erasmus, BJ, Van Wyk, M & Schenk, H. 2000. South African human resource
management: theory and practice. 2nd edition. Cape Town: Juta.
Tang, TL & Sarsfield-Baldwin, LJ. 1996. Distributive and procedural justice as related to satisfaction and
commitment. SAM Advanced Management Journal, 61(3):25-37.
Tarzian, W. 2002. Linking the hiring process to brand management. Strategic HR Review, 1(3):22-26.
Tata, J. 2000. Influence of role and gender on the use of distributive versus procedural justice principles.
Journal of Psychology, 134(3):261-269.
Thibaut, J & Walker, L. 1978. A theory of procedure. California Law Review, 66:541-666.
Thomas, A. 2000. A piano of discord: reasons for job mobility among black managers. Unpublished
paper, University of the Witwatersrand, Johannesburg.
UUnniivveerrssiittyy ooff PPrreettoorriiaa eettdd –– CCooeettzzeeee,, MM ((22000055))
Thomas, A. 2002. Employment equity in South Africa: lessons from the global school. International
Journal of Manpower, 23(3):237-255.
Tinarelli, S. 2000. Employers guide to the Employment Equity Act. Goodwood: Van Schaik.
Tyler, TR & Lind, EA. 1992. A relational model of authority in groups. Advances in Experimental Social
Psychology, 25:115-191.
Van den Bos, K, Lind, EA & Wilke, HAM. 2001. The psychology of procedural and distributive justice
viewed from the perspective of fairness heuristic theory. In R Cropanzano (Ed.), Justice in the workplace:
from theory to practice (vol 2). Mahwah, NJ: Lawrence Erlbaum Associates.
Van Dyne, L & Cummings, LL. 1990. Extra-role behaviors: in pursuit of construct and definitional clarity.
Paper presented at the annual meeting of the Academy of Management, San Francisco.
Van Dyne, L & Graham, JW. 1994. Organizational citizenship behavior: construct redefinition,
measurement, and validation. Academy of Management Journal, 37(4):765-803.
Van Jaarsveld, IL. 2000. Affirmative action: a comparison between South Africa and the United States.
Managerial Law, 42(6):1-48.
Van Wyk, MW. 2002. Conceptions of equality and social justice: a philosophical overview with reference
to South Africa. Southern African Business Review, 6(2):42-51.
Viljoen, MR. 1997. An affirmative action audit for affirmative change - a management perspective.
Unpublished M Com dissertation. University of Pretoria, Pretoria.
Ward, T. 2000. Mitigating barriers to black employment through affirmative action regulations: a case
study. Review of Black Political Economy, 27(3)(electronic copy).
Weaver, GR. 2001. The role of human resources in ethics/compliance management: a fairness
perspective. Human Resource Management Review, 11(1/2):113-135.
Welman, JC & Kruger, SJ. 1999. Research methodology for the business and administrative sciences.
Halfway House: International Thomson.
Welman, JC & Kruger, SJ. 2001. Research methodology for the business and administrative sciences.
Oxford: Oxford University Press.
UUnniivveerrssiittyy ooff PPrreettoorriiaa eettdd –– CCooeettzzeeee,, MM ((22000055))
Whitener, EM. 2001. Do high commitment human resource practices affect employee commitment? A
cross-level analysis using hierarchical linear modeling. Journal of Management, 27(5):515-535.
Wiener, Y. 1982. Commitment in organizations: a normative view. Academy of Management Review,
7:418-428.
Williams, S, Pitre, R & Zainuba, M. 2002. Justice and organizational citizenship behavior intentions: fair
rewards versus fair treatment. Journal of Social Psychology, 142(1):33-45.
Wingrove, T. 1993. Affirmative action: a “how to guide” for managers. Randburg: Knowledge Resources.
Wood, S & De Menezes, L. 1998. High commitment management in the UK: evidence from the Workplace
Industrial Relations Survey and Employers’ Manpower and Skills Practices Survey. Human Relations,
51:485-515.
Wright, SL. 1994. Attitudes to affirmative action and the perceived impact of affirmative action
programmes in the South African business environment: a comparative study based on race and gender.
Unpublished M Com dissertation. Rhodes University, Grahamstown.
Zohar, D. 1995. The justice perspective of job stress. Journal of Organizational Behavior, 16(4):487-495.
UUnniivveerrssiittyy ooff PPrreettoorriiaa eettdd –– CCooeettzzeeee,, MM ((22000055))