Embed Size (px)
Citation preview
Authors: Jerald Greenberg Title: The Social Side of Fairness: Interpersonal and Informational Classes of Organisational Justice Central point of research in the article is: “What constitutes the fair treatment of people in organisations?” Some of the studies of fairness in the organisation include: DISTRIBUTIVE JUSTICE ORIENTATION → an approach that focuses on outcomes: both how allocators distributed them, and how recipients reacted to those allocations. Expanding the distributive justice orientation means including considerations of the process by which outcomes are determined → PROCEDURAL JUSTICE ORIENTATION.
however, he existing theories and researches have tended to focus on the mechanisms by which distributive and procedural justice are accomplished; they focus on matters of how fairness may be structured, neglecting another important source of fairness perceptions – the social determinants of fairness. This means that the quality of interpersonal treatment one receives constitutes another source of perceived fairness.
Conceptual Confusion Regarding the Status of Social Aspects of Justice INTERACTIONAL JUSTICE – people’s sensitivity to the quality of interpersonal treatment they receive during the enactment of organisational procedures (→ distinct from PROCEDURAL JUSTICE in the sense that it represents the enactment rather than the development of procedures). There is a debate over recognising the two concepts as separate – interactional justice can be understood as an interpersonal aspect of procedural justice. However, recently it seems that the concept of separating the two is gaining more attention → interpersonal justice is an intermediary between procedures and outcome distributions. A taxonomy is proposed to highlight the distinction between the structural and social determinants of justice by placing them in each of the two established types of justice: distributive and procedural. The taxonomy is formed with two independent dimensions: category of justice (procedural/distributive), and focal determinants (structural/social). DISTRIBUTIVE JUSTICE refers to the perceived fairness of outcome distributions. PROCEDURAL JUSTICE refers to the fairness of the procedures used to determine these outcomes. STRUCTURAL DETERMINANTS – justice is sought by focusing on the environmental context within which interaction occurs. SOCIAL DETERINANTS of justice – focus on the treatment of individuals. Justice Classes (1) SYSTEMIC JUSTICE – refers to a variety of procedural justice that is accomplished via structural means
(for example, structuring the dispute-resolution context such that disputants are given control over the process by which resolution is sought, OR the rules that evaluate the fairness of allocation).
(2) CONFIGURAL JUSTICE – refers to a variety of distributive justice that is accomplished via structural means (for example, ways of structuring the context of reward allocations such that certain distributive patterns result).
(3) INFORMATIONAL JUSTICE – social determinants of procedural justice. It may be sought by providing knowledge about procedures that demonstrate regard for people’s concerns (for example, people receiving negative outcomes such as a rejected proposal or denied job were more likely to accept those results as fair when they received a reasonable explanation regarding the procedure used than when no such justification was provided). For explanations to be perceived as fair, however, they must also be recognised as genuine in intent and based on sound reasoning.
(4) INTERPERSONAL JUSTICE - social aspects of distributive justice. It can be sought by showing concern for individuals regarding the distributive outcomes they received. Thus, it focuses on the consequences of those outcomes directly, and not on the knowledge of the procedures leading to outcomes (=informational justice). Apologies as a tactic for enhancing interpersonal justice – because they involve expressions of remorse, apologies help harmdoers distance themselves from the negative effects of their actions (an effective means of reducing expressions of anger).
CONCLUSION: The social determinants of justice are involved in BOTH procedural justice and distributive justice. The above taxonomy distinguishes between those social determinants of justice that deal with procedures (informational justice), and those that deal with outcomes (interpersonal justice). Research on the Organisational Impact of Social Determinants of Justice (1) EMPLOYEE THEFT
Two studies: field experiment and a laboratory study that examined the extent to which the social determinants of justice mitigated theft reactions to underpayment inequity.
a) Participants in the first study were employees of three different manufacturing plants owned by the same company (look at the other Greenberg’s article!) As a response to a cash flow crisis, the company had decided to reduce the pay of all workers in two of the three plants by 15% for a period of 10 weeks. The manner in which the pay cut was explained to the workers in those two plants was manipulated. Employees at one plant were provided with a great deal of information about the need for the cut-offs, and they were also presented with repeated expressions of remorse over the negative outcomes. Employees in the low social justice condition were given only minimal information and the basis for the cut-off decision was not described. Employees in the third plant constituted a control group. The data was collected: 10 weeks before the pay cuts, 10 weeks during, and 10 weeks after normal pay was reinstated. Results: - employees who received low levels of information presented in an insensitive manner had a 8% theft rate
(base rate was 3%) - employees who received high levels of information presented in a highly sensitive manner had a theft rate
slightly over 4% - employees in the control group had a rate of 3% (base rate-unchanged). Moreover, whereas over 25% of the workers in the low social justice condition resigned in response to the pay cut, only about 2% did so in the high social justice condition.
b) Laboratory setting – undergraduates were promised an established fair pay rate, $5 per hour, to perform a task. After performing the task a random half of the participants were told they would be paid the promised $5, whereas the remaining participants were told they would be paid only $3. Information justice was manipulated by varying the quality of the information used as the basis for establishing this rate of pay. The interpersonal justice was also manipulated-these remarks varied in terms of the degree of caring and sensitivity shown to the participant with respect to their pay rate. The experimenter then placed the money (a handful of beals) on a nearby desk, giving the impression that he was unaware of the exact amount of money he put on the table. He left the undergrads to take the amount they were supposed to be paid. Results: whereas no appreciable theft occurred among subjects who were equitably paid, the amount of theft was considerable among those who were underpaid. However, theft was reduced when levels of informational justice were high rather than low, and when levels of interpersonal justice were high rather than low.
(2) ACCEPTANCE OF A CORPORATE SMOKING BAN
Will the introduction of social justice variables enhance worker’s acceptance of a corporate smoking ban? Separate groups of employees were presented with different degree of information, and with different levels of social sensitivity. Results: among heavy smokers, the introduction of high levels of informational justice and interpersonal justice effectively raised the acceptance rate of the smoking ban to levels approaching those of light smokers and non-smokers. The non-smokers were affected when it came to recognising the fairness of the procedure the company used to introduce the smoking ban.
(3) MINIMISING NEGATIVE RESPONSES TO LAYOFFS - the less advance notice that was given, the more the participants favoured governmental regulation,
especially when the financial effects of layoffs were great - a significantly lower level of organisational commitment was expressed by survivors who believed that the
layoff victims were treated in a socially unfair manner, especially when they believed that the effects of the layoffs were particularly severe.
Authors: Holmstrom, B. & Roberts, J. Title: Boundaries of the Firm Revisited After a brief overview of the underlying theoretical principles of both transaction cost economics and property-rights theories the authors continue by arguing that neither offer a satisfactory account of a large variety of observed practices. These theories offer explanations of the boundaries of the firm based on ideas of ex-post bargaining and hold-up, and are quite distinct in their empirical predictions. The authors discuss a number of examples where the boundaries of the firm seem to be determined by factors other than the need to protect investments, and where other mechanisms than the allocation of asset ownership are used to provide investment incentives. These examples indicate the need to enrich the theory of firm boundaries. Theoretical Background A brief overview of the transaction cost and property rights theories is given with the aim to highlight distinctions between the detailed logic of the two theories. Although there are points of similarity, specifically that contractual incompleteness necessitates ex post bargaining, causing potential problems for efficiency, the two theories differ which results in quite different empirical predictions. Transaction Cost Economics (Williamson) The theory is premised on the idea one can identify key dimensions of individual transactions such that, when described in terms of these dimensions, every transaction can be mapped into a most efficient institutional arrangement. There are three transaction characteristics that are critical: frequency, uncertainty, and most especially, asset specificity (as measured by the foregone economic benefits of discontinuing a relationship). Each characteristic is claimed to be positively related to the adoption of internal governance. However, it is important to single out a few distinguishing features of Williamson's three-factor paradigm:
1. It makes no reference to the direct costs of up-front, ex ante investments (for example, there is no differentiation between a case where a specialized asset costs $10 million and one in which the asset costs $100 million, provided that the assets in both cases are worth the same amount more inside the relationship than outside it). This is consistent with the assumption that the carrying out of such investments is fully contractible and hence poses no incentive problems.
2. The implicit measure of asset specificity is the aggregate level of quasi-rents created by the investment. With two parties, a buyer B and a seller S asset specificity and aggregate quasi-rents are measured as V - VB - VS where V is the capitalized value of the jointly controlled assets in a continued relationship and VB and VS are the go-alone values of the individually controlled assets in case B and S separate.
3. Taking the transaction as the unit of analysis runs into problems considering the costs of bureaucracy and hierarchy more generally, because these costs relate not to one single transaction, but to the whole collection of transactions that the hierarchy covers.
4. Market trade is by default assumed to be superior to within-organization trade unless levels of uncertainty, frequency and asset specificity are high enough to pull the transaction out of the market. Therefore, in transaction cost economics, the functioning market is as much a black box as is the firm in neoclassical microeconomic theory.
Property Rights Approach (Grossman & Hart)
According to the theory, decisions about asset ownership, and hence firm boundaries, are important because control over assets gives the owner bargaining power when unforeseen or uncovered contingencies force parties to negotiate how their relationship should be continued. Assets become bargaining levers that influence the terms of new agreements and hence the future payoffs from
investing in the relationship. In contrast to transaction cost economics, the standard property rights models assume that all bargaining, including any that occurs after investments are made, is efficient. Thus, everything turns on how ownership affects initial investments, but it is essential that these investments are non-contractible. Once the investment is made, ex post bargaining determines the allocation of the returns from the investments. This bargaining is assumed to give each party, that is, the buyer B or the seller S, what it could have obtained on its own, VB or Vs, plus a share of the surplus created by cooperation. Specifically, payoffs to the parties take the form Pi = Vi + 1/2 (V- Vi - Vj), i,j = B,S, where as before V is the capitalized value of cooperation. Ownership influences the separation payoffs VB and VS since the owner of a particular asset gets to deny the other party the use of it if cooperation is not achieved. Ownership does not influence V, since all assets are in use when the parties cooperate. Some considerations that follow from the model:
1. As investment by the buyer B becomes more important (for generating surplus V) relative to investments by the seller S, B should be given more assets. B should be given those assets that make VB most sensitive to B's investment.
2. If an asset has no influence on B's investment it should be owned by S. 3. Joint ownership (meaning that both parties have the right to veto the use of the asset) is never
optimal. However, it is important to keep in mind that these implications are easy to overturn by slight changes in assumptions. For instance, joint ownership may be desirable when investments improve non-human assets. Third-party control can be desirable if parties would otherwise invest too much in improving their outside opportunities to strengthen their bargaining positions, etc. Comparison with Transaction cost: there is no uncertainty, frequency plays no role, and the level of asset specificity has no influence on the allocation of ownership. Limitations: firms are poorly defined in property rights models and it is not clear how one actually should interpret the identities of B and S. Investment Incentives Are Not Provided by Ownership Alone Although much time is spent on building in the contracts protections against hold-ups, the existence of these contracts itself is the evidence that hold-up problems do not get resolved solely by integration of buyer and seller into a single party-the firm. On the contrary, there is a trend today toward disintegration, outsourcing, contracting out, and dealing through the market rather than bringing everything under the umbrella of the organisation. This trend has seen the emergence of alternative, often ingenious solutions to hold-up problems. Japanese Subcontracting The practice of relations between Japanese manufactures and their suppliers feature long-term, close relations with a limited number of independent suppliers that seem to mix elements of market and hierarchy. Apparently, these long-term relations substitute for ownership in protecting specific assets. Example of the automobile industry: Since the investment in design is highly specific and probably cannot be protected fully by contracts, according to the hold up logic external suppliers will not make such relationship-specific investments, for fear that they will be held up by buyers after their investments are in place. In stark contrast, it is normal practice for Japanese auto firms to rely on their suppliers to do the actual design of the products supplied. The same pattern can be found in the development and ownership of specific assets. While in the U.S. those are owned by the manufacturer, but used by the external supplier in its own factory, in Japan, these specific investments are made by the supplier, who retains ownership of those assets.
Conclusion: The Japanese pattern is directly at odds with transaction cost theory. In Japanese practice, explicit contracting is not used to overcome the incentive problems involved in outsourced design and ownership of specific assets. In fact, the contracts between the Japanese automakers and their suppliers are short and remarkably imprecise, essentially committing the parties only to work together to resolve difficulties as they emerge. So how come the system works so well?
1. The key to making this system work is obviously the long-term, repeated nature of the interaction - the expectation is that the firms will continue to do business together indefinitely (the logic of repeated games)
2. The auto companies carefully monitor supplier behavior including cost reductions, quality levels and improvements, general cooperativeness, and so on-and frequent redesigns allow them to punish and reward performance on an on-going basis.
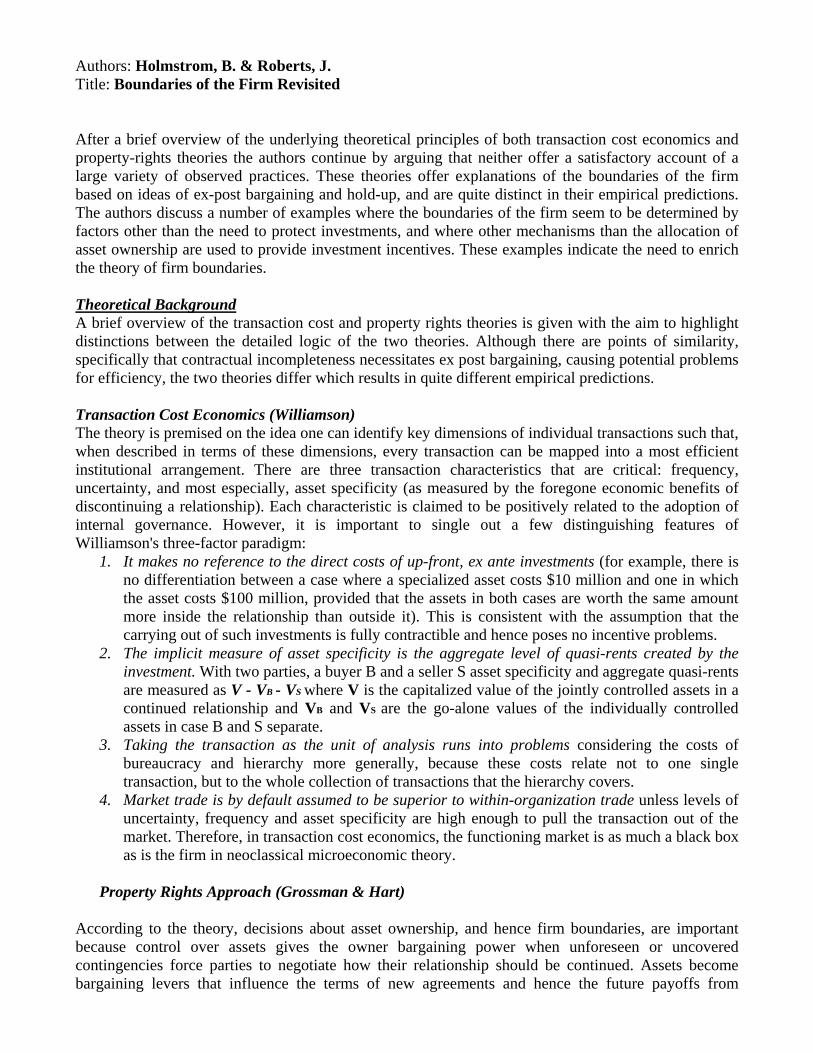
3. “Two-supplier system”:
Small number of suppliers
Reduced costs of monitoring
Increased freuency of transacting
Strenghten the force of reputation
The rents generated not shared too widely
4. Rich information sharing (schedules of productions plans, details of technology, operations and
costs) - potential information asymmetries are reduced, which presumably facilitates both performance evaluation and the pricing negotiations.
5. Supplier associations control the automaker’s exploitation of their power. If the auto company exploits its power over one, all will know and its reputation will be damaged generally. This raises the cost of misbehavior.
Mini Mills, Exclusive Contracting and Inside Contracting Although traditionally mini-mills had integrated backwards, Nucor decided to outsource its entire procurement of steel scrap to one company, DJJ. Although total dependence would seem to carry significant hold-up risks, the two firms had been successfully cooperating for more than a decade. Despite certain contractual supports, there is still room for opportunism. One reason why the partnership has been working so well may be the high degree of mutual dependence: Nucor's share of DJJ's scrap business is estimated to be over 50 percent. Airline Alliances Coordinating flight schedules to take advantage of economies of scope requires the parties to resolve an intricate set of issues. In spite of recent disputes, KLM and Northwest deepened their commitment to their North Atlantic alliance by agreeing to eliminate, over a period of years, all duplicate support operations in the United States and Europe. Reasons that prevent them from integrating might be: regulations limiting foreign ownership, potential government antitrust objections, tax considerations, difficulty of merging, etc. Contractual Assets and Network Influence In the real world, control over assets includes also “contractual assets”. These are contracts that allocate decision rights much like ownership; for instance, exclusive dealing contracts such as Nucor's, or licensing agreements of various kinds. They place firms at the center of a network of relationships, rather than as owners of a clearly defined set of capital assets. BSkyB is an example of a highly successful organization that has created its wealth, not by owning physical assets, but by crafting ingenious contracts that have given it influence over an effective network of media players. The stock
market value of Microsoft is very little attributable to its ownership of physical assets. Instead, by leveraging its control over software standards, using an extensive network of contracts and agreements that are informal as well as formal, has gained enormous influence in the computer industry and beyond. Firm Boundaries are Responsive to More than Investment Incentives there are many alternatives to integration when one tries to solve hold-up problems and that ownership may be responsive to problems other than underinvestment in specific assets. Resolving Agency Problems Issue 1: should a firm employ its sales force directly, or should it use outside sales agents? An employee sales force is used when individual performance is difficult to measure and when non-selling activities (like giving customer support or gathering information about customers' needs) are important to the firm; otherwise, outside companies are used. Holmstrom and Milgrom: “Multi-task agency” model - sales people carry out three tasks: making current sales, cultivating long-term customer satisfaction, and gathering and relaying information on customer needs. Because performance in non-selling activities is arguably hard to measure, it may be best to provide balanced, necessarily lower-powered incentives for all three activities. Issue 2: Multi-unit retail businesses. Types of agreements (ownership patterns): - traditional franchising (a manufacturer contracts with another party to sell its products in a
dedicated facility) - “business concept” franchising (the franchiser provides a brand name and usually other services
like advertising, formulae and recipes, etc, but the physical assets and production are owned and managed by the franchisee)
- franchisers sometimes own and operate some of the outlets themselves - businesses organized with a single company owning all the multiple outlets and hiring the outlet
managers as employees. It is not clear how the specificity of the assets in the above examples differs in such a way that transactions cost arguments would lead to the observed pattern. Indeed, the assets involved are often not very specific at all. Therefore, asset specificity and non-contractibility do not explain the ownership patterns in these cases. Market Monitoring Ownership also influences agency costs through changes in the incentives for monitoring and the possibilities for performance contracting. For this reason, stock-related payment schemes tend to be superior incentive instruments. This factor becomes more important as firms are forced to delegate more decision authority to sub-units and lower-level employees. Knowledge Transfers and Common Assets Arrow argues that information transmission between upstream and downstream firms may be facilitated by vertical integration. However, as can be seen in the cases of Nucor and Japanese subcontracting, this type of information transfer may work well even without vertical integration. However, knowledge transfers are a very common driver of mergers and acquisitions and of horizontal expansion of firms generally, particularly at times when new technologies are developing or when learning about new markets, technologies or management systems is taking place. CONCLUSION: of the significant organizational change that seems to be taking place, only a small part can be easily understood in terms of traditional transaction cost theory in which hold-up problems are resolved by integration. Many of the hybrid organizations that are emerging are characterized by high degrees of uncertainty, frequency and asset specificity, yet they do not lead to integration.

“Bringing the Market Inside” by T.W. Malone (Lecture 1) The article starts by looking at an example of internal market at BP. BP sought to reduce its greenhouse gas emissions. Instead of allocating targets to business units, which would lead to bargaining and inefficiency for some plants that would have to spent huge amounts of money to be compliant, they decided to allocate “permits” for emissions to business units and then business units could trade among one another based upon their different abilities and desires to reduce gas emissions. The article looks at several internal market selling mechanisms and their strengths and weaknesses. 1. Internal selling: known as transfer pricing. Where one part of a company sells, products or services, often in large volumes, to other parts of a company (e.g. IT services or components). Managers often negotiate conditions for the transfers and substantial politics and bureaucratic distortions are involved. Another example could be internal freelancers that may receive a regular paycheck but they have to continuously sell their services within the company and justify their salary in terms of adding value. Venture-capital funded companies usually function like this as well. People move frequently from job to job based on their contacts and personal networks. At HP this used to be similar, but now they have formalized the process a bit more. The system (also called a quasimarket) works as follows: I) anyone in a division could propose a project to their senior managers II) The board then acted as a venture capitalist and funded the projects it found most promising III) The approved projects were then posted on the network and project managers could identify members who expressed interest through the network. Using this system people found projects that suited them and project managers found people with the right capabilities and got continual feedback about what projects people found promising. 2. Trading ideas: this involves exchanging information within a company. For example, at HP they allowed sales personnel to sell and buy predictions of future sales. If you thought sales would fall within a certain range you could buy futures contracts for this prediction. If indeed they did fall in this range you would earn $1 per share. In such a market people are motivated to trade on what they actually think (i.e. because money is involved) rather than based on political ideas or to please your boss’ performance targets. It has proven remarkably accurate in predicting sales. It has been used to predict the outcomes of presidential elections in the US. 3. Allocating assets: the processes to do so are often very hierarchical and waste a lot of money, time, and talent. At Intel they are devising a trading system in which chip manufacturers and sales personnel bid with future contracts for selling and buying chips (i.e. they seek to maximize their own profits). Again in this way we can achieve efficiency as each party uses private information about demand and costs, etc. to formulate a well-informed bid. So prices would be formed based on different information sets.
Advantages of internal markets at Intel to allocate manufacturing capacity: 1. Everybody can see the whole picture- with an internal market; prices for all products in all future time periods are visible to all. 2. Helps a company respond to change- salespeople, planners and plant managers can immediately start trading with the new information. People have an incentive to start trading as soon as possible to gain an advantage. 3. Internal prices can individualize service- an internal market allows sales personnel to immediately calculate how much it would cost to accelerate an order (e.g. it might be important to keep a customer happy in order to ensure future sales from that customer (i.e. those future sales make up for the loss today)). 4. Internal traders can help keep the market efficient- if a product manager predicts too high demand traders can speculate on selling capacity today at a high price but buying it back at a low price in the future. This keeps the market efficient. 5. Internal profits can be linked to real compensation- compensate those people that make a profit on their trades. This allows managers to shed light on people’s skills. The closer the internal market comes to using real money, the more efficient. However, this puts risk on the employee. Disadvantages: 1. In some situations agreements that are good overall are not made because for one of the parties it is not to their own interest, but often the internal market is combined with incentives so that overall corporate goals are still met. 2. More decentralized power can become a problem when a company is shifting strategically (e.g. downsizing or moving into a new business), because it is sometimes hard for people to unite a lot of details into a single vision. Here you might prefer leadership to creativity and independence. 3. It is sometimes harder to control risk and quality and economies of scale in an internal market. 4. Implementing such a system involves large organizational structural changes, changes in incentive systems, and information systems and most important a change in organizational culture. Internal markets can bring inside a company the efficiency, flexibility and motivation of a free market. People buy and sell based on their self-interest and the overall result is a reallocation of resources to the places where they are most valuable.
Established Theories of the Firm Hart, 1995 Neoclassical Theory of the Firm View of the firm in technological terms, a single firm is represented by a production function. Selfless Manager chooses inputs at minimal cost and (optimal) output level to maximise profit at price p*. As output increases, variable costs increase, but fixed costs do not. Beyond a certain point further expansion becomes difficult, hence a U-shaped cost curve. Theory weaknesses:
- ignores incentive problems, the firm is considered as a perfectly efficient ‘black box’, unrealistic
- the theory has nothing to say about the internal organisation of the form (hierarchical structure, delegation of decisions, distribution of authority)
- the theory does not identify the boundaries of the firm. Neoclassical theory is consistent with there being one huge big firm in the world and with each subdivision of each current firm being a separate firm
Principal-Agent Theory Principal-Agent Theory specificly addresses the second issue from above; incentive problems within the firm. If the principal could observe and verify effort (contractible), then the principal would pay w* as long as the agent exerts effort e* (w=a+ße). If effort is not observable this contract is not feasible. In designing a contract under these circumstances the parties face the classic trade-off between optimal incentives and optimal risk sharing: high-powered: fixed component a is low, variable ß is high (piece rate) high incentive for agent but also high risk, or low-powered: high fixed component a, low variable ß low incentive to put in high effort, high security Weakness:
- Theory does not explain the boundaries of the firm - Theory does not differentiate between subdivision and interfirm trade; consistent
with there being one huge big firm in the world, BUT asymmetries might be lower within firms & cost/profit sharing easier, but PA theory does not explain why. (Satisfactory to assume that the informational structure chanfes directly as a result of a merger)
Transaction cost theory “Cost of using the market.” Writing a good contract is costly (Coase, 1937 & Williamson, 1975). Agency theory ascribes all contracting cost to the cost of observing variables. If a variable is observable by both parties, then the theory assumes that it can be contracted costlessly. But this is not the same as supposing that it is costly to write a contract. Contracts are incomplete (legal disputes are a symptom), only perfect information would avoid contractual renegotiations. Contracting costs/ limitations:
- in a complex and uncertain world it is difficult for people to think very far ahead., and plan for all contingencies
- even then, it is difficult to negotiate about these plans and to find a common language to describe states of the world.
- even then, it is difficult to write down plans in such a way that, in the event of a dispute, a court could figure out what these plans mean.
An incomplete contract will be revised and/ or renegotiated as the future unfolds. Renegotiation imposes several costs:
- parties may engage in a great deal of haggling, which is inefficient since it consumes time and wastes resources.
- Asymmetric information may lead to inefficient outcomes. - Incomplete contracts may deter relationship specific investments that would be
efficient. Given each party’s fear that the other party will ‘hold it up’ at the renegotiation stage, the parties are likely to make non-specific investment: Hold-up problem.
It is often suggested that haggling and hold-up behaviour are reduced in a single firm. However, the precise mechanism by which this happens, are usually not spelled out. In a zero-transaction-cost world organisation form does not matter, i.e. that non-integration and integration are equally efficient. The Property Rights Approach (PRT) All previous theories do not explain what changes when two firms merge, the PRT tries to address this question. There are several possible situations: Non-integration: M1 (Manager) owns a1 (asset) and M2 owns a2 Type 1 integration: M1 owns a1 and a2 (vertical backward integration, where M2 supplies M1, (M2 = Fisher, M1 = GM), human assets do not change ownership) Type 2 integration: M2 owns a1 and a2 (vertical forward integration)
- highly complementary assets should be should be under common ownership. - Independent assets should be owned separately. - Increasing returns to scale should lead to the formation of large firms, since under
increasing returns to scale one large asset is more productive than two assests og half size.
Optimal integration type depends on the circumstances. PTR is the most suitable to explain a U-shaped AC curve.
MN404 Testing For Offsetting Behaviour and Adverse Recruitment Among Drivers of Airbag-Equipped Vehicles By David W. Harless and George E. Hoffer Concepts Offsetting Behaviour Can be thought of as moral hazard or hidden action. Here the airbag acts as an ‘insurance’ against the loss incurred from an accident in the view of the drivers. Thus, the existence of an airbag causes potential changes in the action whereby the thought of being insured results in drivers driving more aggressively and simultaneously altering the probability of the accident from occurring. Adverse Recruitment Can be thought of as adverse selection or hidden knowledge. Here, drivers who are at greater risk of an accident are more likely to self-insure by choosing airbag-equipped vehicles. It may also be useful to have the following points in mind;
- One can think of adverse recruitment as a process that involves around bad drivers only. Whereas under offsetting behaviour, the focus should be placed on ‘good drivers’ whom becomes a more aggressive driver as a result of having an airbag fitted vehicles.
- Often enough, adverse recruitment is viewed as a process that takes place before offsetting behaviour.
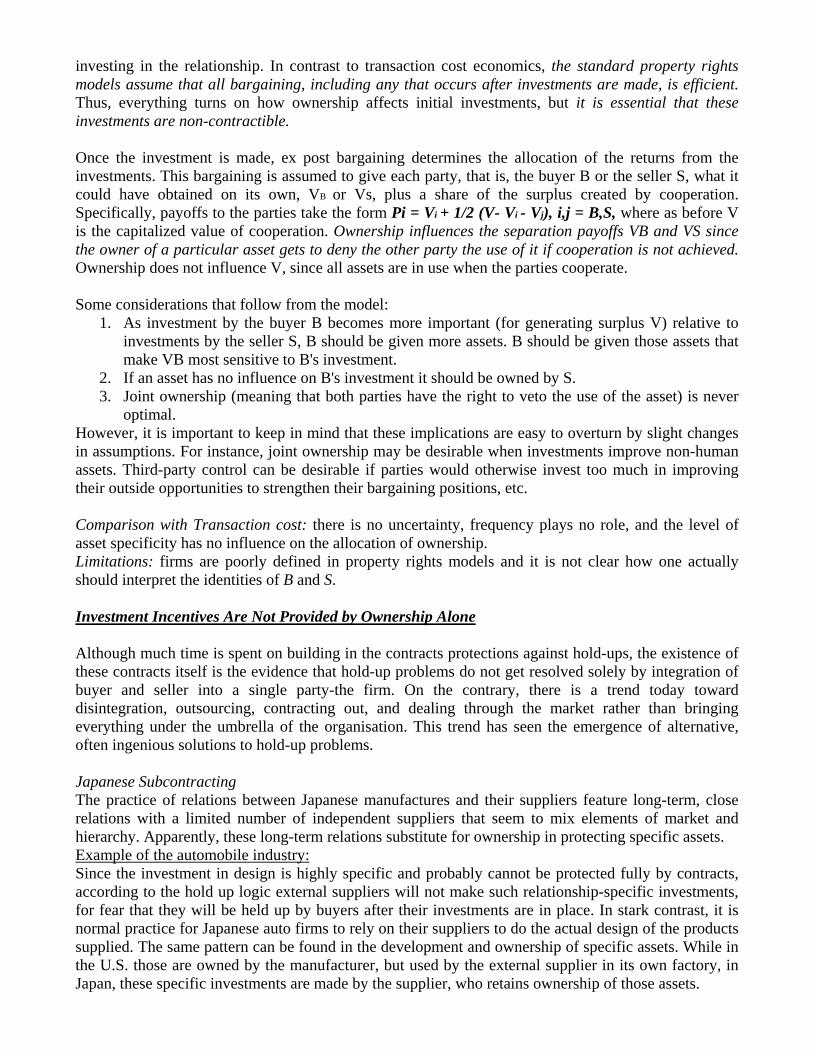
Advantageous Recruitment A contrary to adverse recruitment, advantageous recruitment assumes that greater self-protection activity (purchasing an airbag fitted vehicle) is undertaken by more cautious individuals who are also more likely to purchase insurance. This in conjunction with adverse recruitment, it implies that the decision to purchase an airbag fitted vehicle is not always made by those who are bad drivers. Good and cautious drivers are just as likely to purchase the vehicle under this assumption. Theme The authors identified two concepts of offsetting behaviour and adverse recruitment as a centre of attention in their experiment regarding behaviours among drivers of airbag-equipped vehicles. The theoretical existence of the two effects was therefore tested in reality under the hypothesis that ‘Drivers of airbag-equipped vehicles were more likely to be at fault in fatal accident’. Experiment Should the hypothesis be correct then the finding can be explained by offsetting behaviour and/or adverse recruitment. The test for the two effects after airbag adoption were conducted using the database containing information on fatal accidents including information on drivers’ previous records and drivers’ action that contributed to the occurrence. In addition, another test was conducted in relation to personal injury claims for newly airbag-equipped vehicles to observe whether the rise in the index after airbag adoption may be attributable to further offsetting behaviour.
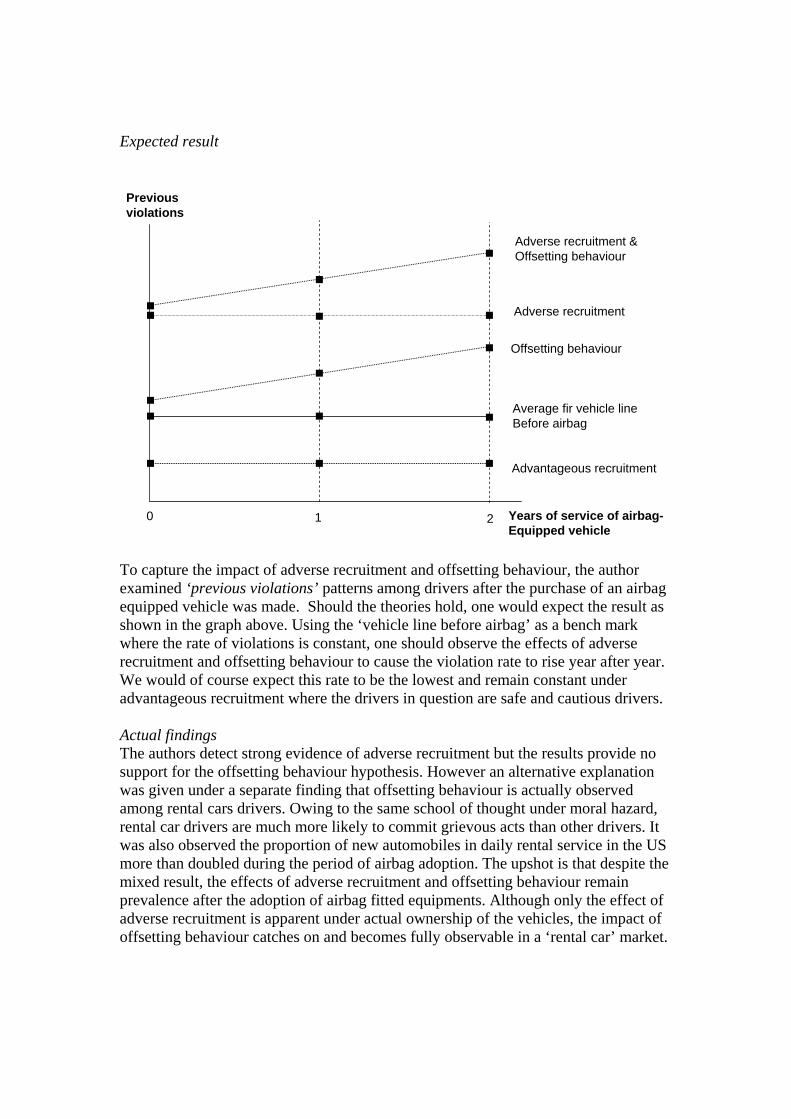
Expected result
0 1 2
Previousviolations
Adverse recruitment &Offsetting behaviour
Adverse recruitment
Offsetting behaviour
Average fir vehicle lineBefore airbag
Advantageous recruitment
Years of service of airbag-Equipped vehicle
To capture the impact of adverse recruitment and offsetting behaviour, the author examined ‘previous violations’ patterns among drivers after the purchase of an airbag equipped vehicle was made. Should the theories hold, one would expect the result as shown in the graph above. Using the ‘vehicle line before airbag’ as a bench mark where the rate of violations is constant, one should observe the effects of adverse recruitment and offsetting behaviour to cause the violation rate to rise year after year. We would of course expect this rate to be the lowest and remain constant under advantageous recruitment where the drivers in question are safe and cautious drivers. Actual findings The authors detect strong evidence of adverse recruitment but the results provide no support for the offsetting behaviour hypothesis. However an alternative explanation was given under a separate finding that offsetting behaviour is actually observed among rental cars drivers. Owing to the same school of thought under moral hazard, rental car drivers are much more likely to commit grievous acts than other drivers. It was also observed the proportion of new automobiles in daily rental service in the US more than doubled during the period of airbag adoption. The upshot is that despite the mixed result, the effects of adverse recruitment and offsetting behaviour remain prevalence after the adoption of airbag fitted equipments. Although only the effect of adverse recruitment is apparent under actual ownership of the vehicles, the impact of offsetting behaviour catches on and becomes fully observable in a ‘rental car’ market.
The Market for ‘Lemons’: Quality Uncertainty and the
Market Mechanism
George A. Akerlof
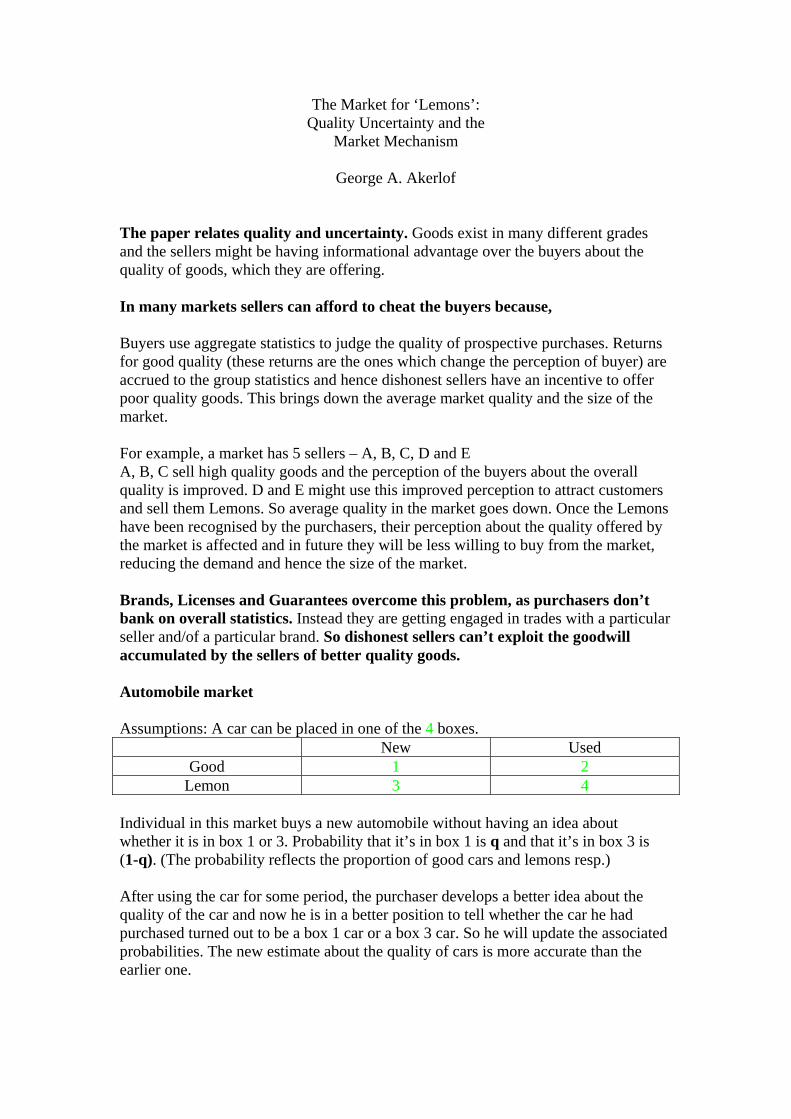
The paper relates quality and uncertainty. Goods exist in many different grades and the sellers might be having informational advantage over the buyers about the quality of goods, which they are offering. In many markets sellers can afford to cheat the buyers because, Buyers use aggregate statistics to judge the quality of prospective purchases. Returns for good quality (these returns are the ones which change the perception of buyer) are accrued to the group statistics and hence dishonest sellers have an incentive to offer poor quality goods. This brings down the average market quality and the size of the market. For example, a market has 5 sellers – A, B, C, D and E A, B, C sell high quality goods and the perception of the buyers about the overall quality is improved. D and E might use this improved perception to attract customers and sell them Lemons. So average quality in the market goes down. Once the Lemons have been recognised by the purchasers, their perception about the quality offered by the market is affected and in future they will be less willing to buy from the market, reducing the demand and hence the size of the market. Brands, Licenses and Guarantees overcome this problem, as purchasers don’t bank on overall statistics. Instead they are getting engaged in trades with a particular seller and/of a particular brand. So dishonest sellers can’t exploit the goodwill accumulated by the sellers of better quality goods. Automobile market Assumptions: A car can be placed in one of the 4 boxes. New Used
Good 1 2 Lemon 3 4
Individual in this market buys a new automobile without having an idea about whether it is in box 1 or 3. Probability that it’s in box 1 is q and that it’s in box 3 is (1-q). (The probability reflects the proportion of good cars and lemons resp.) After using the car for some period, the purchaser develops a better idea about the quality of the car and now he is in a better position to tell whether the car he had purchased turned out to be a box 1 car or a box 3 car. So he will update the associated probabilities. The new estimate about the quality of cars is more accurate than the earlier one.
Now if the owner of such a car decides to sell the car in the used car market, then he knows more about the quality of the car as compared to the buyer and hence an information asymmetry is developed. Since the buyer doesn’t know which used car is good and which is lemon (i.e. whether it belongs to box 2 or 4), the lemons and good ones all sell at the same price. So the price of box 2 and box 4 car is the same (as is the case with box 1 and 3 cars.) Therefore we have new cars being sold at a specific price irrespective of their quality and used ones being sold at another price, again irrespective of their quality. But these two prices can’t be the same. In fact common sense dictates that used cars will sell at a lower price. Because, If both classes – used and new – had the same price then following scenario would arise. Mr. A goes to the market and buys a new car with q being the probability that it’s good and (1-q) being the probability that it’s bad. After some days he realises that it’s a bad car i.e. a lemon. He updates the probabilities. Now p is the prob. that car is good (p<q) and (1-p) is the probability that the car is bad with (1-p)>(1-q). Mr. A will go back to the market and sell this lemon used car at the same price as that of a new car and buy another new car for himself hoping that it would turn out to be a good one. He has incentive to do this because probability that the newly purchased car will be a good one is q which is higher than the probability that his current car will turn out to be a good one, as q>p. One more argument, Good car owner is locked in because why would he sell his good car (here the phrase ‘good car’ refers to a car with a higher probability of being good as buyer had a nice experience with it after the purchase) and buy a new car from the market, which has more probability of being a lemon…simply because the car owner had no experience with it. ….and the used car market is dominated by lemons. Bad cars drive out the new ones …something similar to Gresham’s law. Gresham’s law - "Bad money drives out good money." Sir Thomas Gresham (1519-79) English merchant and financier. Law from observation that actual coins in circulation varied considerably from the standard of weight and finesse. Good coins were more valuable for foreign trade where money passed by weight and disappeared where bad coins predominated. Bad coins were the ones, which were cut, tampered, spoilt by the public. Their circulation increased in the domestic markets, as they couldn’t be traded on foreign market because of strict regulations for quality, weight and finesse. So good ones went for foreign trade and bad ones prevailed in the domestic market.
The problem of bad quality good driving out good quality goods may be more pathological in a market where continuous spectrum of good quality exists. Bad quality goods will drive out slightly bad quality goods will drive out average quality goods will drive out better quality goods will drive out best quality goods up to such an extent that finally the market is destroyed. Note: The algebra in the sections B. Asymmetrical Information and C. Symmetrical Information needs to be read completely and step-by-step to understand the conclusions drawn at the end of the sections. Summarising the calculation would sacrifice clarity. These calculations run through one and half page of the Orange book. I would explain the same if required when we discuss the summaries. Examples of interlinkages between quality and uncertainty:
A. Insurance – people above the age of 65 have great difficulty in buying the medical insurance. Why not to insure them by charging higher premiums to match the risks? Because, looking at the high levels of premium, only those would opt for the insurance who are more confident about falling ill (an apparent paradox, isn’t it?). Old people who are relatively healthy would decide to stay out of the scheme because of the costs involved. A scenario illustrating the problem of ‘adverse selection.’
Result – average medical condition of applicants deteriorates as the premium levels increase. (There is a problem of information asymmetry as well. Though the insurance companies ask for health check ups prior to giving the policy, the applicant knows about the confidence levels regarding his/her own health. The applicant less confident about his/her future health would be eager to go for insurance, burdening the company with increased risk.)
B. The employment of minorities:
Empoyers are reluctant to recruit candidates from socially depressed classes, minorities; because the race may serve as a good statistic about applicant’s social background, quality of schooling and general job capabilities.
Good quality schooling can serve as substitute for this statistic. The grades of the students can give a better indication about their quality. The unreliability of slum schools decreases the economic possibilities for their students. An employer may decide not to hire any person belonging to this group, as it is hard to distinguish between good job qualifications and the bad ones.
Additional information apart from the information about the race should be used and applicants shouldn’t be judges as per the chracteristic of the group to which they belong in order to incentivise for training.
C. The cost of dishonesty:
As seen in the case of automobile market, lemons tend to drive out the better quality goods. Similarly dishonest dealings tend to drive out good dealings out of the market. The cost of dishonesty lies not only in the amount by which the buyer is cheated but also in the cost incurred by driving legitimate business out of existence. Quality variation is more in underdeveloped markets, which ask for a detailed scrutiny of goods provided. For instance in India 85% of export goods is placed under some kind of quality control procedure. Identifying the quality of goods is a challenging task and the people who are adept at doing this are the successful merchants. In production these skills are equally important to identify the quality of inputs and to certify the quality of outputs. This is one of the reasons why the merchants may logically become the first entrepreneurs. Still Entrepreneurship is scarce resource because, firstly pay-off to trade is great for would be entrepreneurs and hence they are diverted from production. Secondly, the amount of entrepreneurial time per unit output is greater, the greater the quality variations.
D. Credit markets in underdeveloped countries:
In India, major fraction of industrial enterprise is controlled by managing agencies. The managing agencies are dominated by castes. This prevails because communal ties can be exploited to ensure honest dealings. In the loan system operating in rural India, landlords charge exorbitant interest rates to peasants because the peasants wouldn’t be granted loans by banks and credit unions because of lack of sound credit history and credibility. Landlords being an integral part of the society can keep a close eye on the borrower and tend to enforce their contracts via easy means.
Counteracting institutions: Brands, licenses, product guarantees reduce the uncertainty regarding the quality of goods. Since they form identifiable and traceable channels the consumer is given an opportunity to retaliate if something goes wrong i.e the consumer can curtail future purchases if current or past purchases fail to deliver up to the customer’s expectations. An example: American hotel chains (mainly located on/near the interurban highways) are preferred by the non-local drivers and travellers as they do provide better hamburgers than average local restaurants. Locals prefer to go to specific restaurants within the town as they have adequate information about all of them. But outsiders travelling on highways tend to opt for chain restaurants to cope with information asymmetry and to reduce uncertainty in quality.

Conclusion: Informal and unwritten guarantees are preconditions for trade and production. They proliferate trust. Where these guarantees are indefinite business will suffer. Difficulty of distinguishing good quality from bad is inherent in the business world. This may explain many economic institutions in the world and forms an important facet of uncertainty.
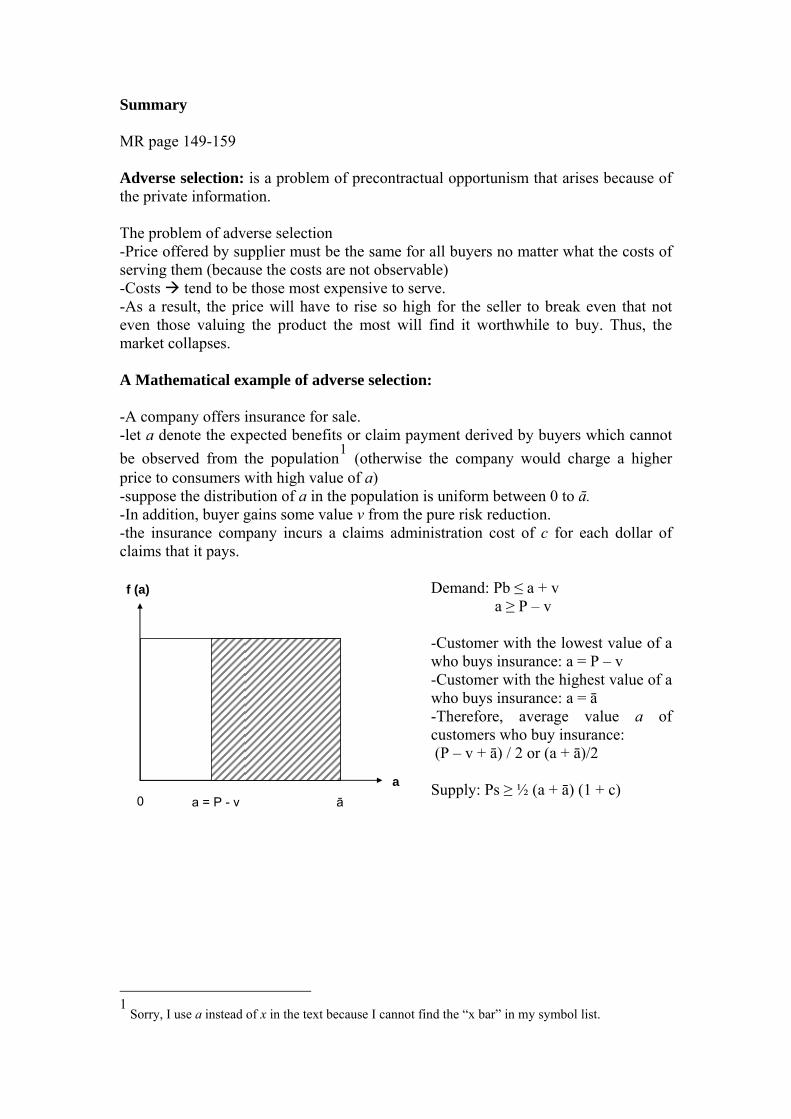
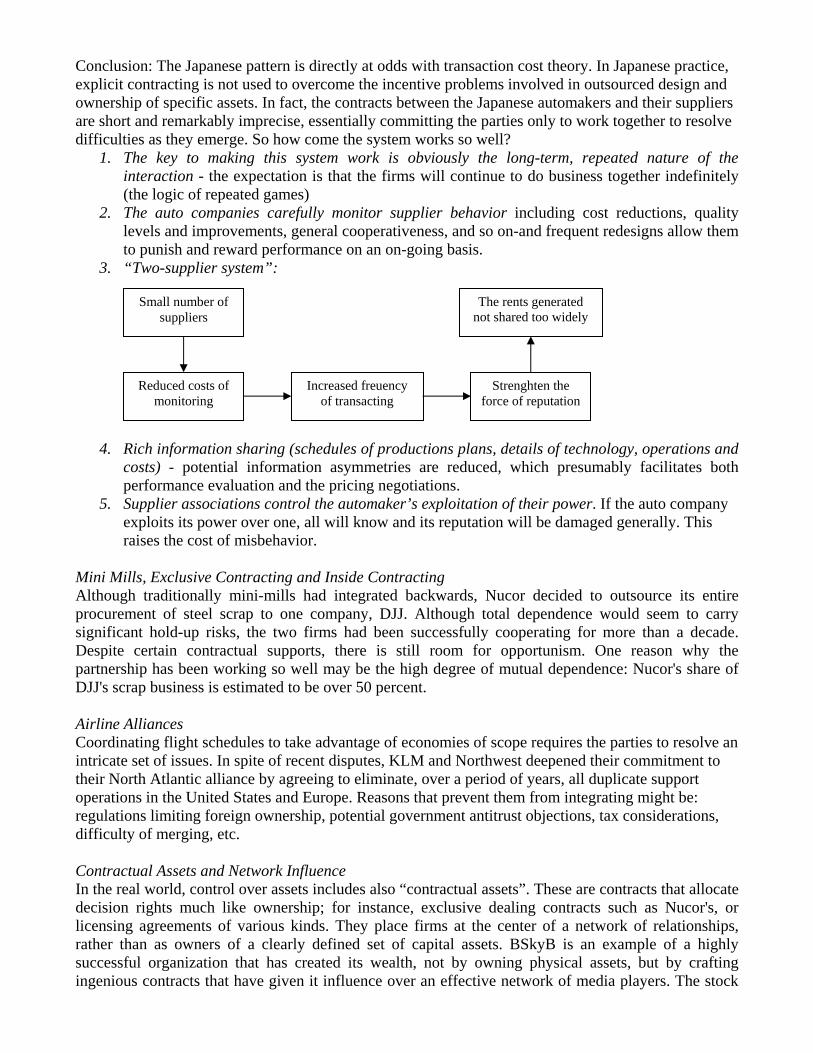
Summary MR page 149-159 Adverse selection: is a problem of precontractual opportunism that arises because of the private information. The problem of adverse selection -Price offered by supplier must be the same for all buyers no matter what the costs of serving them (because the costs are not observable) -Costs tend to be those most expensive to serve. -As a result, the price will have to rise so high for the seller to break even that not even those valuing the product the most will find it worthwhile to buy. Thus, the market collapses. A Mathematical example of adverse selection: -A company offers insurance for sale. -let a denote the expected benefits or claim payment derived by buyers which cannot be observed from the population1 (otherwise the company would charge a higher price to consumers with high value of a) -suppose the distribution of a in the population is uniform between 0 to ā. -In addition, buyer gains some value v from the pure risk reduction. -the insurance company incurs a claims administration cost of c for each dollar of claims that it pays.
Demand: Pb ≤ a + v f (a)
a0 āa = P - v
a ≥ P – v -Customer with the lowest value of a who buys insurance: a = P – v -Customer with the highest value of a who buys insurance: a = ā -Therefore, average value a of customers who buy insurance: (P – v + ā) / 2 or (a + ā)/2 Supply: Ps ≥ ½ (a + ā) (1 + c)
1
Sorry, I use a instead of x in the text because I cannot find the “x bar” in my symbol list.
Pb (a) = a + v
0 ā
v
Pb (a)
½ ā (1+c)
ā (1+c)
v + ā
Ps (a)
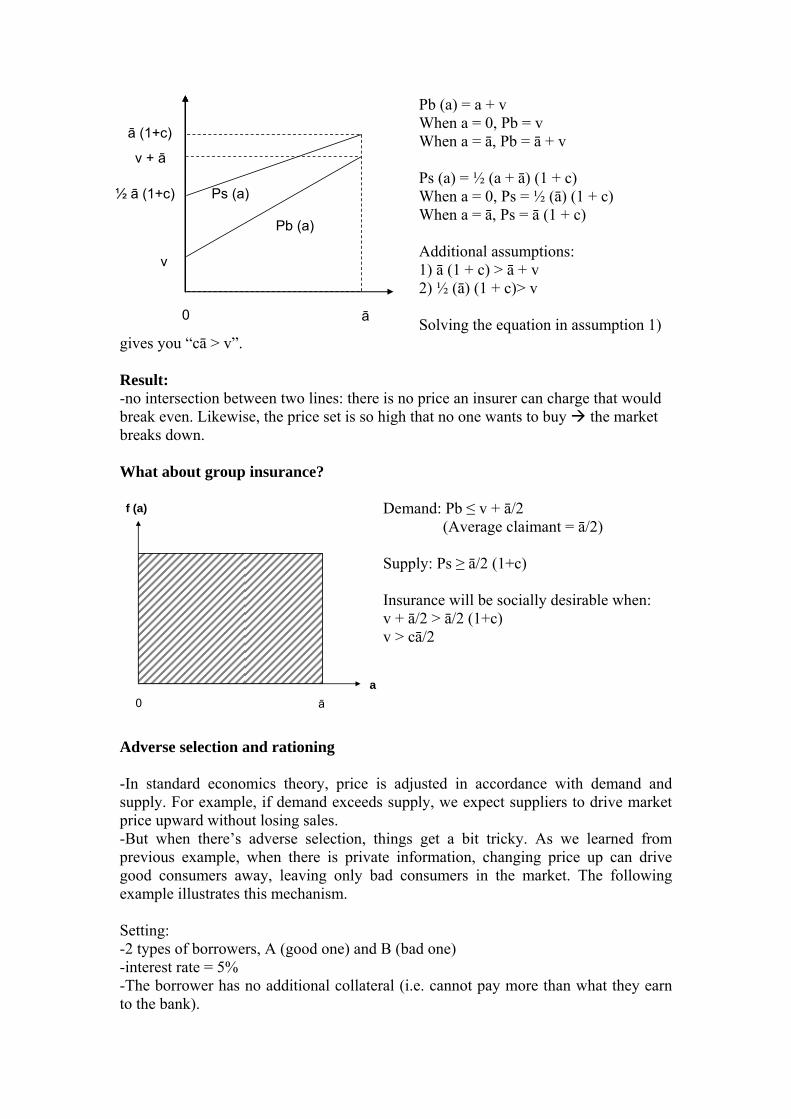
When a = 0, Pb = v When a = ā, Pb = ā + v Ps (a) = ½ (a + ā) (1 + c) When a = 0, Ps = ½ (ā) (1 + c) When a = ā, Ps = ā (1 + c) Additional assumptions: 1) ā (1 + c) > ā + v 2) ½ (ā) (1 + c)> v Solving the equation in assumption 1)
gives you “cā > v”. Result: -no intersection between two lines: there is no price an insurer can charge that would break even. Likewise, the price set is so high that no one wants to buy the market breaks down. What about group insurance?
Demand: Pb ≤ v + ā/2 f (a)
a0 ā
(Average claimant = ā/2) Supply: Ps ≥ ā/2 (1+c) Insurance will be socially desirable when: v + ā/2 > ā/2 (1+c) v > cā/2
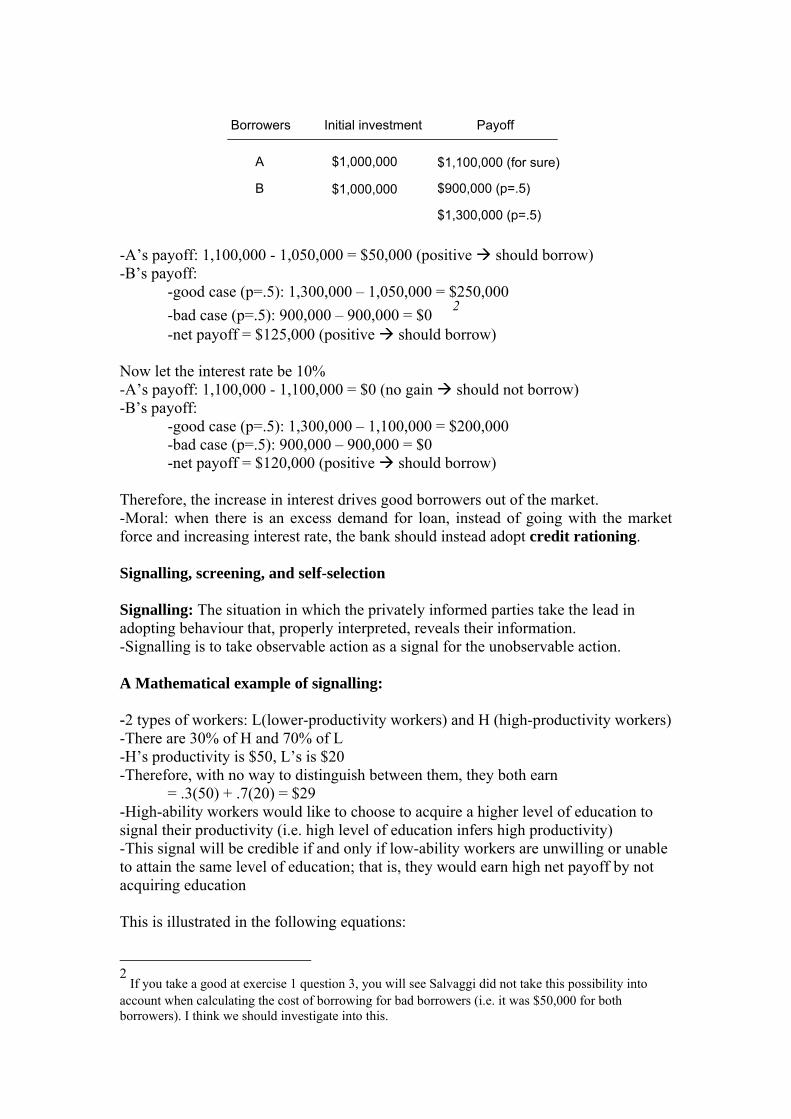
Adverse selection and rationing -In standard economics theory, price is adjusted in accordance with demand and supply. For example, if demand exceeds supply, we expect suppliers to drive market price upward without losing sales. -But when there’s adverse selection, things get a bit tricky. As we learned from previous example, when there is private information, changing price up can drive good consumers away, leaving only bad consumers in the market. The following example illustrates this mechanism. Setting: -2 types of borrowers, A (good one) and B (bad one) -interest rate = 5% -The borrower has no additional collateral (i.e. cannot pay more than what they earn to the bank).
A
Borrowers
B
Initial investment
$1,000,000
$1,000,000
Payoff
$1,100,000 (for sure)
$900,000 (p=.5)
$1,300,000 (p=.5) -A’s payoff: 1,100,000 - 1,050,000 = $50,000 (positive should borrow) -B’s payoff: -good case (p=.5): 1,300,000 – 1,050,000 = $250,000 -bad case (p=.5): 900,000 – 900,000 = $0 2
-net payoff = $125,000 (positive should borrow) Now let the interest rate be 10% -A’s payoff: 1,100,000 - 1,100,000 = $0 (no gain should not borrow) -B’s payoff: -good case (p=.5): 1,300,000 – 1,100,000 = $200,000 -bad case (p=.5): 900,000 – 900,000 = $0 -net payoff = $120,000 (positive should borrow) Therefore, the increase in interest drives good borrowers out of the market. -Moral: when there is an excess demand for loan, instead of going with the market force and increasing interest rate, the bank should instead adopt credit rationing. Signalling, screening, and self-selection Signalling: The situation in which the privately informed parties take the lead in adopting behaviour that, properly interpreted, reveals their information. -Signalling is to take observable action as a signal for the unobservable action. A Mathematical example of signalling: -2 types of workers: L(lower-productivity workers) and H (high-productivity workers) -There are 30% of H and 70% of L -H’s productivity is $50, L’s is $20 -Therefore, with no way to distinguish between them, they both earn = .3(50) + .7(20) = $29 -High-ability workers would like to choose to acquire a higher level of education to signal their productivity (i.e. high level of education infers high productivity) -This signal will be credible if and only if low-ability workers are unwilling or unable to attain the same level of education; that is, they would earn high net payoff by not acquiring education This is illustrated in the following equations: 2
If you take a good at exercise 1 question 3, you will see Salvaggi did not take this possibility into account when calculating the cost of borrowing for bad borrowers (i.e. it was $50,000 for both borrowers). I think we should investigate into this.
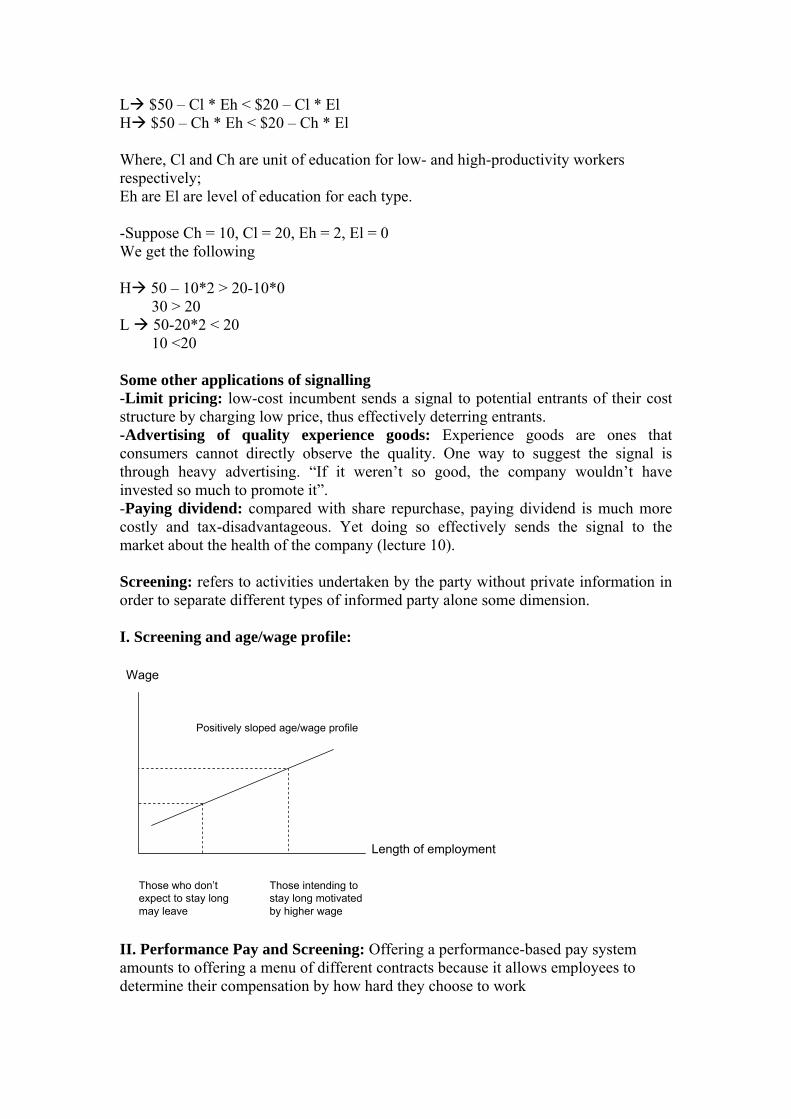
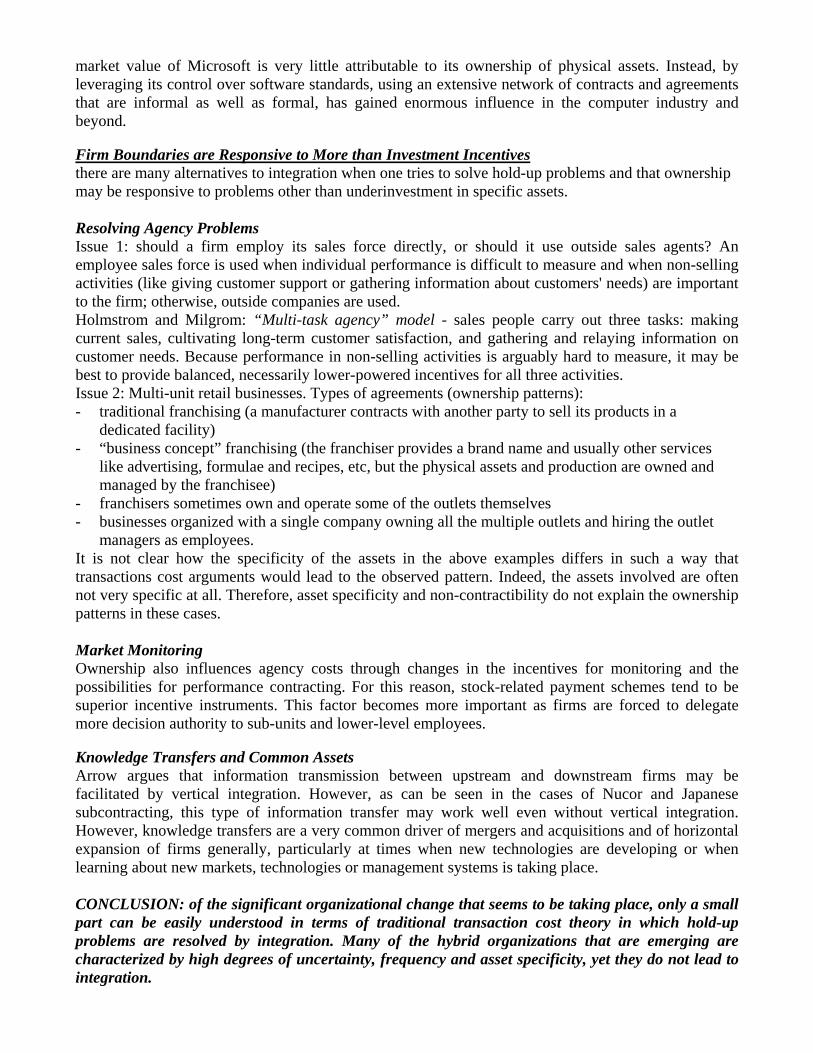
L $50 – Cl * Eh < $20 – Cl * El H $50 – Ch * Eh < $20 – Ch * El Where, Cl and Ch are unit of education for low- and high-productivity workers respectively; Eh are El are level of education for each type. -Suppose Ch = 10, Cl = 20, Eh = 2, El = 0 We get the following H 50 – 10*2 > 20-10*0 30 > 20 L 50-20*2 < 20 10 <20 Some other applications of signalling -Limit pricing: low-cost incumbent sends a signal to potential entrants of their cost structure by charging low price, thus effectively deterring entrants. -Advertising of quality experience goods: Experience goods are ones that consumers cannot directly observe the quality. One way to suggest the signal is through heavy advertising. “If it weren’t so good, the company wouldn’t have invested so much to promote it”. -Paying dividend: compared with share repurchase, paying dividend is much more costly and tax-disadvantageous. Yet doing so effectively sends the signal to the market about the health of the company (lecture 10). Screening: refers to activities undertaken by the party without private information in order to separate different types of informed party alone some dimension. I. Screening and age/wage profile:
Positively sloped age/wage profile
Length of employment
Wage
Those who don’t expect to stay long may leave
Those intending to stay long motivated by higher wage
II. Performance Pay and Screening: Offering a performance-based pay system amounts to offering a menu of different contracts because it allows employees to determine their compensation by how hard they choose to work

III: Menus of contracts and efficiency: 3 examples i. Setting different prices for a product line: e.g. mobile phones the low price
on the basic model will attract its kind of customers ii. Menu of contracts to salespeople:
-Large base salary + low % of commission for lazy/low-productivity workers -Small base salary + High % of commissions for hard-working/high-ability workers
iii. Insurance contracts different policies are designed for different risk classes of buyers

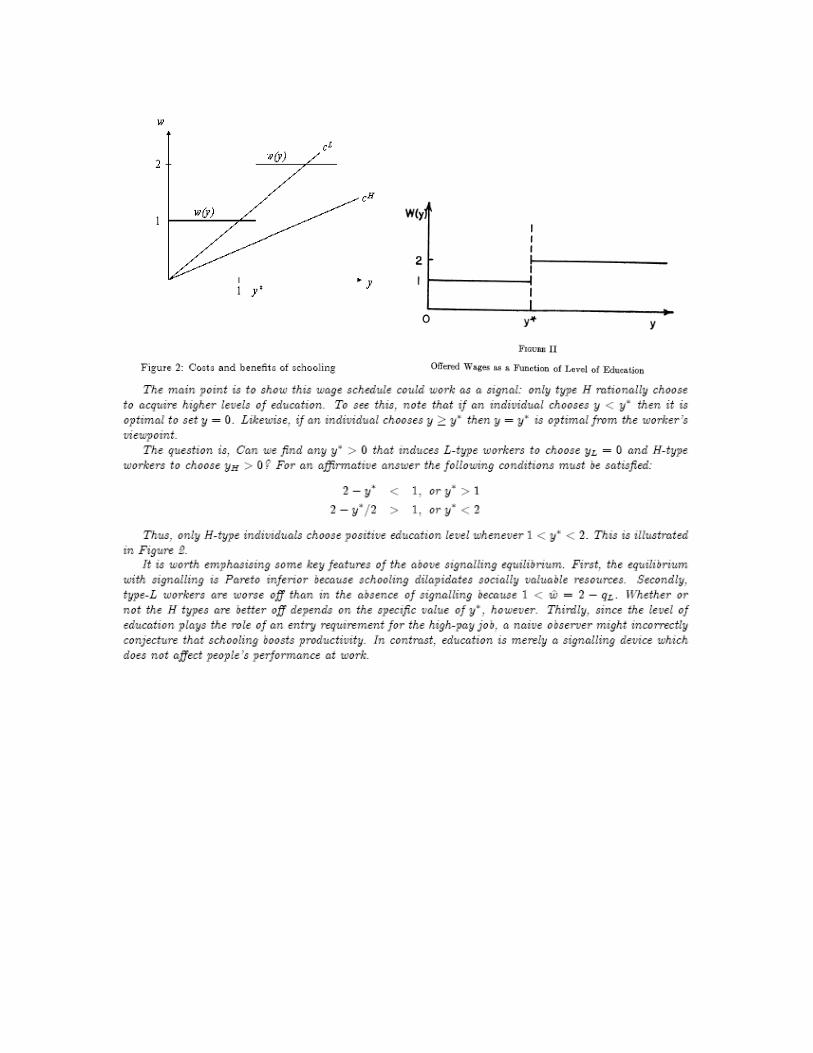
Job Market Signalling Michael Spence, 1973, Week 2, Lecture This essay is about the job market, in which signalling takes place and in which the primary signalers are relatively numerous and in the market sufficiently infrequently that they are not expected to (and therefore do not) invest in acquiring signalling reputations. In most job markets the employer is not sure of the productive capabilities of an individual at the time he hires him. Nor will this information necessarily become available to the employer immediately after hiring. The job may take time to learn. Often specific training is required. Hiring is an investment decision, almost like purchasing a lottery. Of the plethora of observable data (race, age, sex, education) which determine the value of the lottery, the employer is buying, some are fixed (e.g. race, sex, henceforth: indices) and some are alterable (e.g. education henceforth: signal). After hiring an individual the employer will find out the individual’s true productive capabilities and hence signals and indices function like parameters in shifting conditional probability distributions that define an employer’s beliefs. Applicants can’t influence their indices, but select the signals (here: education) so as to maximise the difference between offered wages and signalling costs (education is costly). Assumption: A signal will not effectively distinguish one application from another, unless the costs of signalling are negatively correlated with productive capability. (Signalling costs: up, Productivity: low signalling is cheaper for high productivity workers. ‘Self-selection’ constraint)
Example from the lecture:
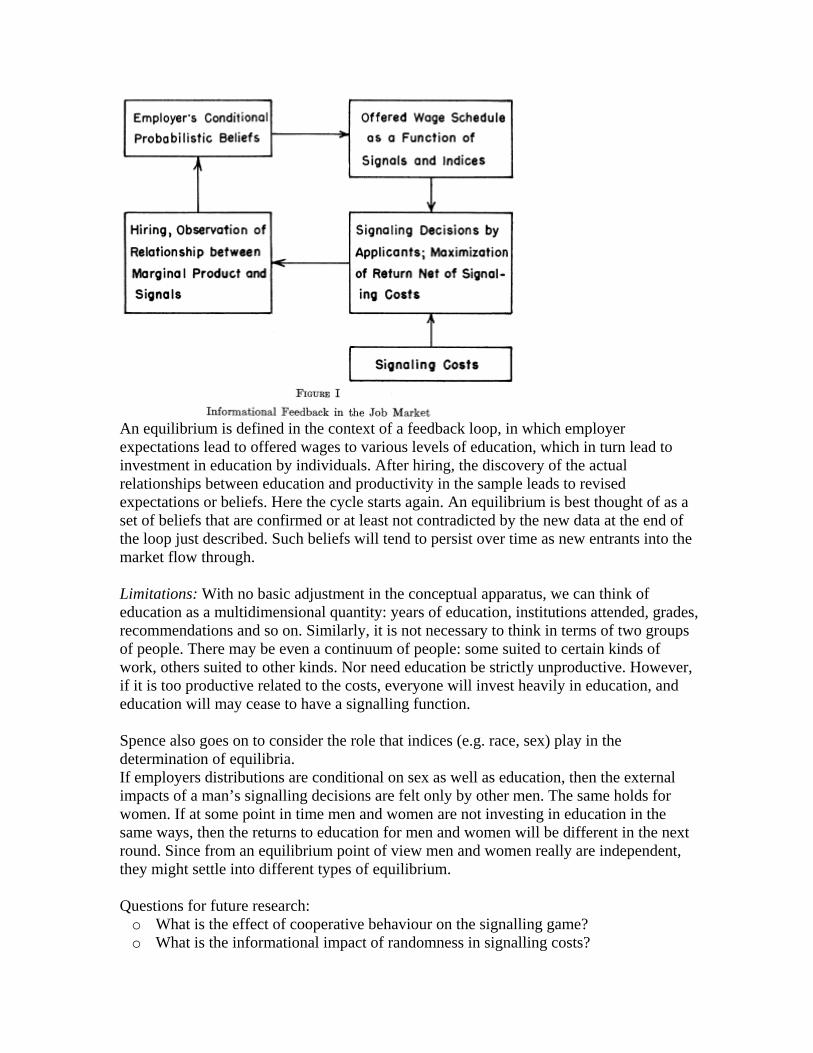
An equilibrium is defined in the context of a feedback loop, in which employer expectations lead to offered wages to various levels of education, which in turn lead to investment in education by individuals. After hiring, the discovery of the actual relationships between education and productivity in the sample leads to revised expectations or beliefs. Here the cycle starts again. An equilibrium is best thought of as a set of beliefs that are confirmed or at least not contradicted by the new data at the end of the loop just described. Such beliefs will tend to persist over time as new entrants into the market flow through. Limitations: With no basic adjustment in the conceptual apparatus, we can think of education as a multidimensional quantity: years of education, institutions attended, grades, recommendations and so on. Similarly, it is not necessary to think in terms of two groups of people. There may be even a continuum of people: some suited to certain kinds of work, others suited to other kinds. Nor need education be strictly unproductive. However, if it is too productive related to the costs, everyone will invest heavily in education, and education will may cease to have a signalling function. Spence also goes on to consider the role that indices (e.g. race, sex) play in the determination of equilibria. If employers distributions are conditional on sex as well as education, then the external impacts of a man’s signalling decisions are felt only by other men. The same holds for women. If at some point in time men and women are not investing in education in the same ways, then the returns to education for men and women will be different in the next round. Since from an equilibrium point of view men and women really are independent, they might settle into different types of equilibrium. Questions for future research:
o What is the effect of cooperative behaviour on the signalling game? o What is the informational impact of randomness in signalling costs?

o What is the effect of signalling costs that differ systematically with indices? o How general are the properties of the examples considered here? o In a multiple-market setting, does the indeterminateness of the equilibrium remain? o Do signalling equilibria exist in general? o What kinds of discriminatory mechanisms are implicit in, or interact with, the
informational structure of the market, and what policies are effective or ineffective in dealing with them?
Lent Term 2006 MN426 Design and Management of Organisations 2.33
Empirical evidence on team compensation 3/9
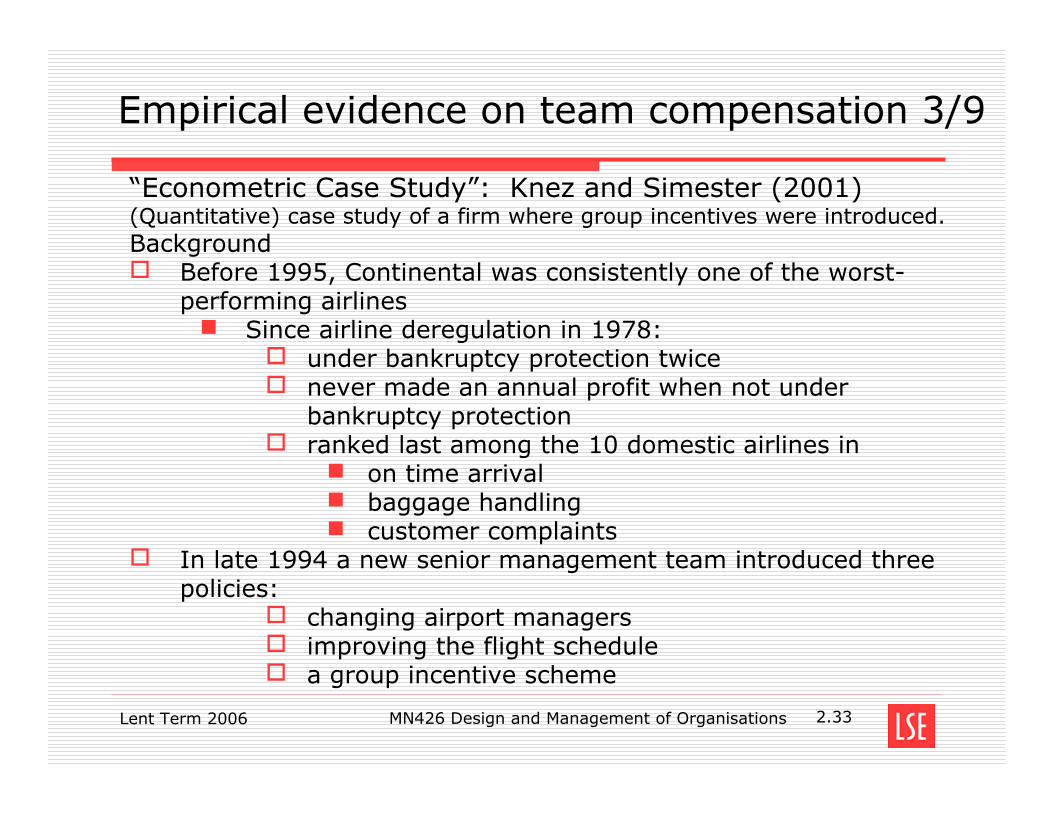
“Econometric Case Study”: Knez and Simester (2001)(Quantitative) case study of a firm where group incentives were introduced.Background
Before 1995, Continental was consistently one of the worst-performing airlines
Since airline deregulation in 1978:under bankruptcy protection twicenever made an annual profit when not under bankruptcy protectionranked last among the 10 domestic airlines in
on time arrivalbaggage handlingcustomer complaints
In late 1994 a new senior management team introduced three policies:
changing airport managersimproving the flight schedulea group incentive scheme
Lent Term 2006 MN426 Design and Management of Organisations 2.34
Empirical evidence on team compensation 4/9
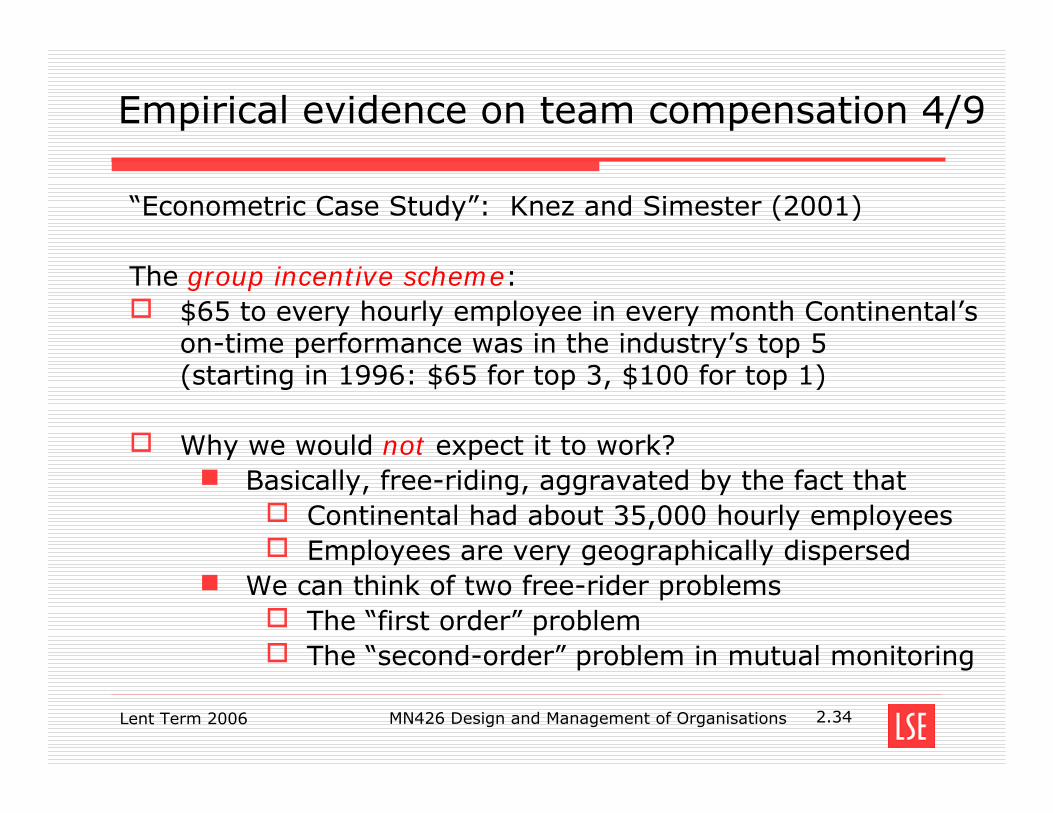
“Econometric Case Study”: Knez and Simester (2001)
The group incentive scheme:$65 to every hourly employee in every month Continental’s on-time performance was in the industry’s top 5(starting in 1996: $65 for top 3, $100 for top 1)
Why we would not expect it to work?Basically, free-riding, aggravated by the fact that
Continental had about 35,000 hourly employeesEmployees are very geographically dispersed
We can think of two free-rider problemsThe “first order” problemThe “second-order” problem in mutual monitoring
Lent Term 2006 MN426 Design and Management of Organisations 2.35
Empirical evidence on team compensation 5/9
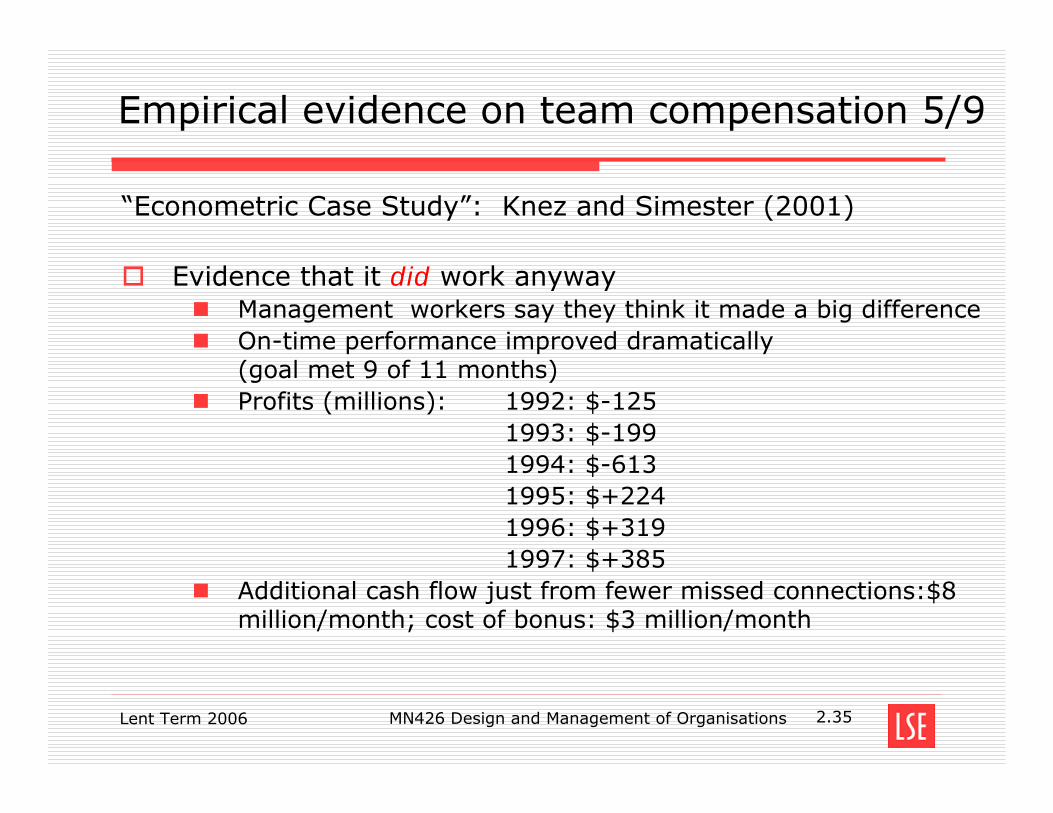
“Econometric Case Study”: Knez and Simester (2001)
Evidence that it did work anywayManagement workers say they think it made a big differenceOn-time performance improved dramatically (goal met 9 of 11 months)Profits (millions): 1992: $-125
1993: $-1991994: $-6131995: $+2241996: $+3191997: $+385
Additional cash flow just from fewer missed connections:$8 million/month; cost of bonus: $3 million/month
Lent Term 2006 MN426 Design and Management of Organisations 2.36
Empirical evidence on team compensation 6/9
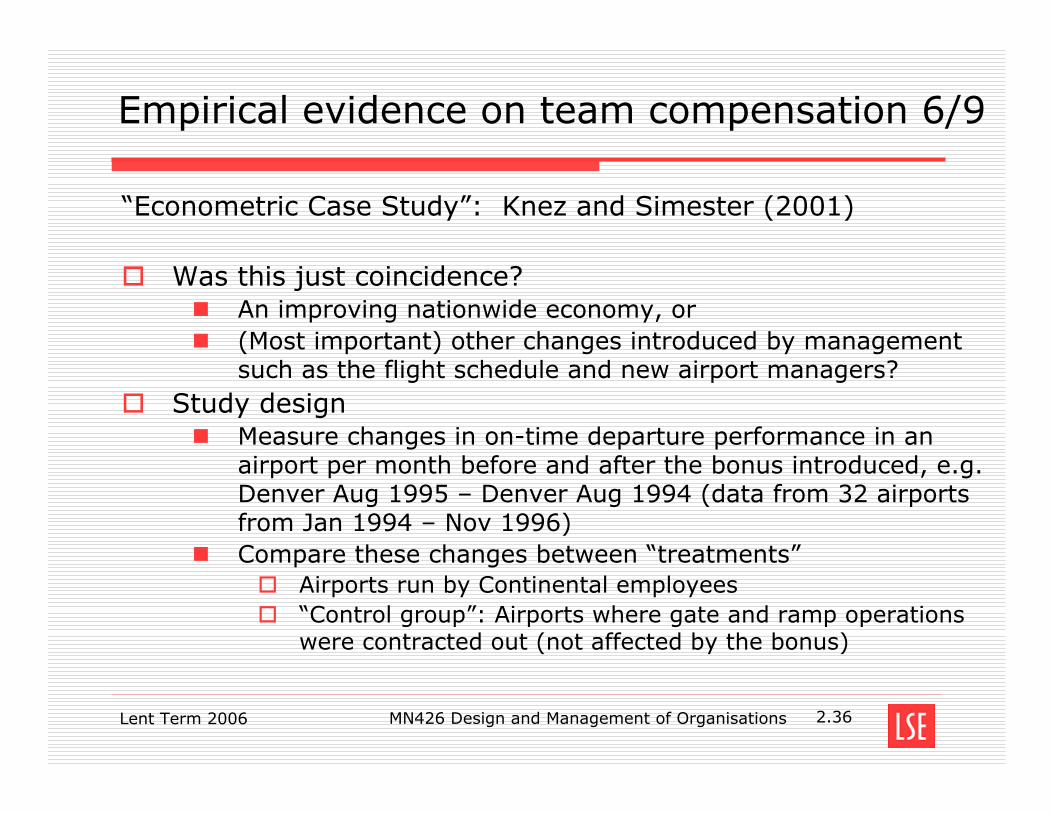
“Econometric Case Study”: Knez and Simester (2001)
Was this just coincidence?An improving nationwide economy, or (Most important) other changes introduced by management such as the flight schedule and new airport managers?
Study designMeasure changes in on-time departure performance in an airport per month before and after the bonus introduced, e.g. Denver Aug 1995 – Denver Aug 1994 (data from 32 airports from Jan 1994 – Nov 1996)Compare these changes between “treatments”
Airports run by Continental employees“Control group”: Airports where gate and ramp operations were contracted out (not affected by the bonus)
Lent Term 2006 MN426 Design and Management of Organisations 2.37
Empirical evidence on team compensation 7/9
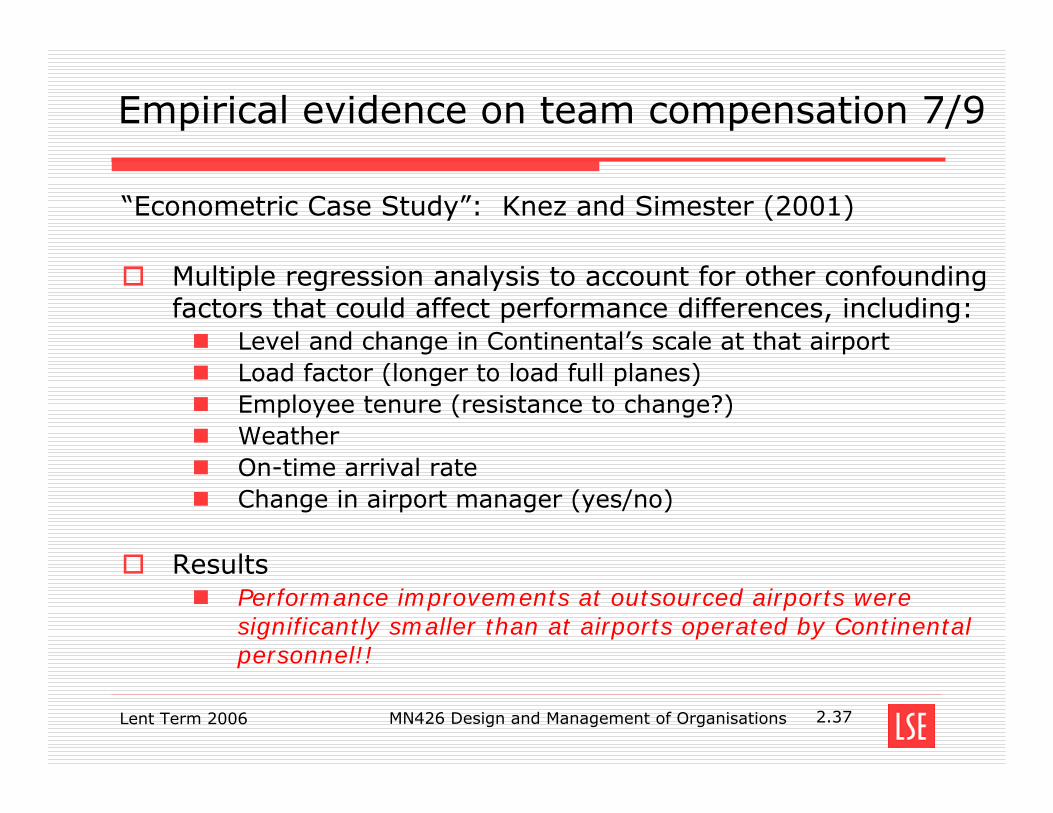
“Econometric Case Study”: Knez and Simester (2001)
Multiple regression analysis to account for other confounding factors that could affect performance differences, including:
Level and change in Continental’s scale at that airportLoad factor (longer to load full planes)Employee tenure (resistance to change?)Weather On-time arrival rateChange in airport manager (yes/no)
ResultsPerformance improvements at outsourced airports were significantly smaller than at airports operated by Continental personnel!!
Lent Term 2006 MN426 Design and Management of Organisations 2.38
Empirical evidence on team compensation 8/9
“Econometric Case Study”: Knez and Simester (2001)
Why did it work?Employees did monitor each other and exerted peer pressure when co-workers’ performance jeopardized reaching the goal. Examples:
Employees started own performance review meetingsEmployees contacted colleagues who called in sick, offering “assistance”Employees chastised others for leaving their stations or loading bags slowlyEmployees helped others improve, if this did not work reported others to supervisors
Lent Term 2006 MN426 Design and Management of Organisations 2.39
Empirical evidence on team compensation 9/9
“Econometric Case Study”: Knez and Simester (2001)
Why was this in individual worker’s interest?Within airports teams are small, jobs standardized, and worker’s know each others’ jobs.Across airports teams are highly interdependent (because flight delays create a “domino effect”). This greatly magnifies the effects of underperformance by one particular airport: any individual airport’s performance could significantly affect the whole firm’s performance.When the scheme was introduced, airport teams may have confused the effects of a better flight schedule with higher effort by other airport teams, and felt pressure to “measure up”. (helped solve the “coordination problem”; remember class experiment last week)
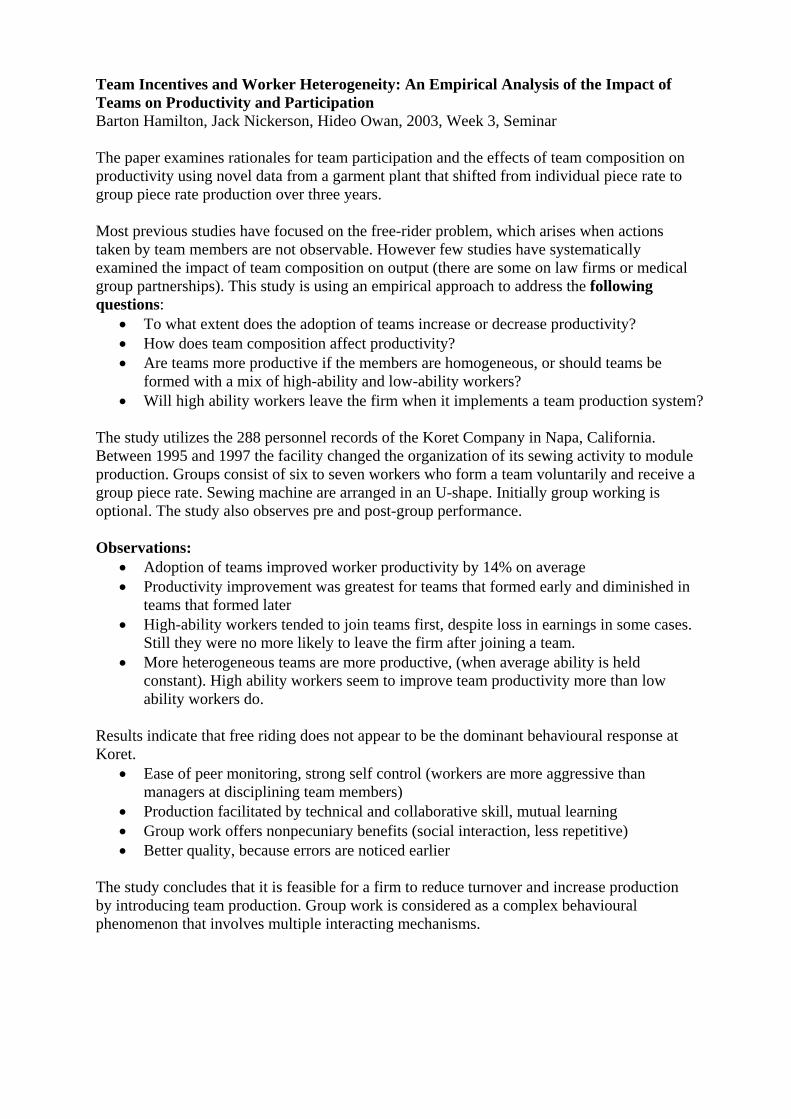
Team Incentives and Worker Heterogeneity: An Empirical Analysis of the Impact of Teams on Productivity and Participation Barton Hamilton, Jack Nickerson, Hideo Owan, 2003, Week 3, Seminar The paper examines rationales for team participation and the effects of team composition on productivity using novel data from a garment plant that shifted from individual piece rate to group piece rate production over three years. Most previous studies have focused on the free-rider problem, which arises when actions taken by team members are not observable. However few studies have systematically examined the impact of team composition on output (there are some on law firms or medical group partnerships). This study is using an empirical approach to address the following questions:
• To what extent does the adoption of teams increase or decrease productivity? • How does team composition affect productivity? • Are teams more productive if the members are homogeneous, or should teams be
formed with a mix of high-ability and low-ability workers? • Will high ability workers leave the firm when it implements a team production system?
The study utilizes the 288 personnel records of the Koret Company in Napa, California. Between 1995 and 1997 the facility changed the organization of its sewing activity to module production. Groups consist of six to seven workers who form a team voluntarily and receive a group piece rate. Sewing machine are arranged in an U-shape. Initially group working is optional. The study also observes pre and post-group performance. Observations:
• Adoption of teams improved worker productivity by 14% on average • Productivity improvement was greatest for teams that formed early and diminished in
teams that formed later • High-ability workers tended to join teams first, despite loss in earnings in some cases.
Still they were no more likely to leave the firm after joining a team. • More heterogeneous teams are more productive, (when average ability is held
constant). High ability workers seem to improve team productivity more than low ability workers do.
Results indicate that free riding does not appear to be the dominant behavioural response at Koret.
• Ease of peer monitoring, strong self control (workers are more aggressive than managers at disciplining team members)
• Production facilitated by technical and collaborative skill, mutual learning • Group work offers nonpecuniary benefits (social interaction, less repetitive) • Better quality, because errors are noticed earlier
The study concludes that it is feasible for a firm to reduce turnover and increase production by introducing team production. Group work is considered as a complex behavioural phenomenon that involves multiple interacting mechanisms.
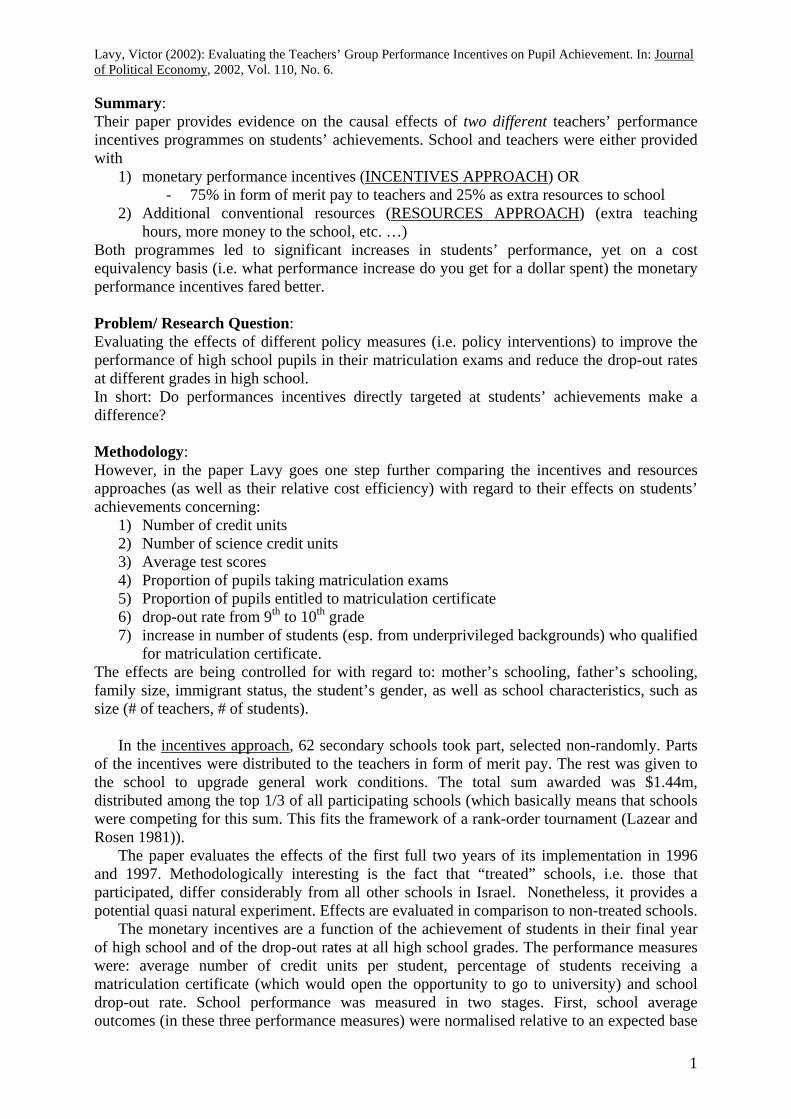
Lavy, Victor (2002): Evaluating the Teachers’ Group Performance Incentives on Pupil Achievement. In: Journal of Political Economy, 2002, Vol. 110, No. 6.
Summary: Their paper provides evidence on the causal effects of two different teachers’ performance incentives programmes on students’ achievements. School and teachers were either provided with
1) monetary performance incentives (INCENTIVES APPROACH) OR - 75% in form of merit pay to teachers and 25% as extra resources to school
2) Additional conventional resources (RESOURCES APPROACH) (extra teaching hours, more money to the school, etc. …)
Both programmes led to significant increases in students’ performance, yet on a cost equivalency basis (i.e. what performance increase do you get for a dollar spent) the monetary performance incentives fared better. Problem/ Research Question: Evaluating the effects of different policy measures (i.e. policy interventions) to improve the performance of high school pupils in their matriculation exams and reduce the drop-out rates at different grades in high school. In short: Do performances incentives directly targeted at students’ achievements make a difference? Methodology: However, in the paper Lavy goes one step further comparing the incentives and resources approaches (as well as their relative cost efficiency) with regard to their effects on students’ achievements concerning:
1) Number of credit units 2) Number of science credit units 3) Average test scores 4) Proportion of pupils taking matriculation exams 5) Proportion of pupils entitled to matriculation certificate 6) drop-out rate from 9th to 10th grade 7) increase in number of students (esp. from underprivileged backgrounds) who qualified
for matriculation certificate. The effects are being controlled for with regard to: mother’s schooling, father’s schooling, family size, immigrant status, the student’s gender, as well as school characteristics, such as size (# of teachers, # of students).
In the incentives approach, 62 secondary schools took part, selected non-randomly. Parts of the incentives were distributed to the teachers in form of merit pay. The rest was given to the school to upgrade general work conditions. The total sum awarded was $1.44m, distributed among the top 1/3 of all participating schools (which basically means that schools were competing for this sum. This fits the framework of a rank-order tournament (Lazear and Rosen 1981)).
The paper evaluates the effects of the first full two years of its implementation in 1996 and 1997. Methodologically interesting is the fact that “treated” schools, i.e. those that participated, differ considerably from all other schools in Israel. Nonetheless, it provides a potential quasi natural experiment. Effects are evaluated in comparison to non-treated schools.
The monetary incentives are a function of the achievement of students in their final year of high school and of the drop-out rates at all high school grades. The performance measures were: average number of credit units per student, percentage of students receiving a matriculation certificate (which would open the opportunity to go to university) and school drop-out rate. School performance was measured in two stages. First, school average outcomes (in these three performance measures) were normalised relative to an expected base
1

Lavy, Victor (2002): Evaluating the Teachers’ Group Performance Incentives on Pupil Achievement. In: Journal of Political Economy, 2002, Vol. 110, No. 6.
predicted from regressions that controlled for the socio-economic background of the student body. In the second stage, schools were ranked each year according to their improvement (absolute value added between years t and t-1). According to these ranks the awards were distributed among the top 1/3 schools (in terms of relative performance improvement). 75% of incentives went to teachers as salary bonuses between $1000 and $250 per year (for average and mean incomes of teachers of $20.000 and $30.000 respectively). Thus the bonuses are relatively small (as a percentage of yearly income).
Lavy describes this programme as a group incentive scheme, where the combined performance of a group determines the total incentive payment, which is divided among individuals regardless of individual performance. (Theory would predict that teachers free-ride a lot, especially since they cannot monitor each other. Teachers are in their respective class-rooms on their own. Nobody knows what they are doing. It also has something of a target-based scheme, as teachers would only get something if the school came in in the top third.)
In the resources approach, 22 (selected out of 75) schools are investigated over the course of 3 years (that the Israeli Ministry of Education conducted this programme). Schools were endowed with additional resources (teaching time, on-the-job school staff training) to improve students’ performance. These additional resources were worth about 2.5 full time teachers/ school (= 3% of the mean number of teachers per school in Israel). The schools were given complete control over the additional resources and how to shape the distribution of these additional resources. They used the resources to add teaching time, spilt classes, pay more attention to weaker students. Effects are evaluated in comparison to non-treated schools (that were not selected, i.e. 53 other schools). Total annual costs were $1.2m.
Both treatments included religious and secular schools.
Incentives: 37 secular Hebrew, 18 religious Hebrew and 7 Arab schools. Resources: 13 secular Hebrew, 4 religious Hebrew and 5 Arab schools.
Results: Both programmes lead to significant gains in the achievement measures of high school pupils: The incentives approach had some effect in the first year of implementation and significant gains in the 2nd year. Effects are significantly positive on all dimensions, except for the proportion of students who earned matriculation certificates. Teachers’ incentives mainly affected weak students. Intervention led to a relatively large increase in the rates of students who achieved the matriculation certificate among students from a poor socioeconomic background. Dropout rates were reduced as well. “Winning schools” The resources approach led to also to a significant improvement in student performance. However, the regressions tell us that the effects in the first year are minor (only statistically significant for credit units and average scores). For the second and third year of the programme, the effects are statistically significant for all measures except for the proportion of students who earned the matriculation diploma. Yet, the resources approach had not effect on drop-out rates!! Cost equivalency: In general, the cost per school in the resource programme was more than double ($51.600 vs. $23.300) than in the incentives approach, which is partly due to the fact that the incentives programme affected almost three times the number of schools. However, comparing the two, the gap in cost cannot be outweighed by the resource approach being considerably more effective. “[T]he resources program had, on average a (50-70 percent) higher effect on outcomes than the incentives program, but it had a lower effect on three other outcomes it cost more than twice as much Therefore, per marginal dollar spent, the teachers’ incentives intervention seems to be much more cost effective.” (p. 1314) => In terms of cost equivalency, the incentives approach is more cost effective.
2
Lavy, Victor (2002): Evaluating the Teachers’ Group Performance Incentives on Pupil Achievement. In: Journal of Political Economy, 2002, Vol. 110, No. 6.
Lavy sees importance in the fact that “the power of incentives observed elsewhere in the economy is also evident in schools, even in the case of relatively low performance bonuses.” (p. 1316). (Possible) Caveats:
• The programmes were mainly implemented in small communities (since there the expected effects were expected to be largest), thus one should “be cautious in extrapolating the results to other environments” (p. 1315).
• Lavy does not study any effects on non-measurable activities of teachers (developing creativity, etc. cf. multi-tasking models, esp. the respective chapters in Milgrom/ Roberts (1992) and Roberts (2004))
• What will happen, once the incentives are removed? Linkages to (other) topics (of the course):
• Performance Pay - (esp.: Multi-Tasking)
• Public Policy - autonomy of administrative units
• Rank-order tournaments (in the case of the incentives approach: only the top 1/3-performers were awarded the money bonuses), which leveraged the resources used compared to the effects achieved, since all schools tried hard to improve their results. This effort remains unmeasured in this study.
• Group incentive schemes - Free-riding
• Natural experiment - (esp. selection strategies)
3
Gibbons (1998): Incentives in Organizations Abstract In this paper, the author summarizes four new strands in agency theory that help him think about incentives in real organizations. As a point of departure, the author begins with a quick sketch of the classic agency model. He then discusses static models of objective performance measurement that sharpen Kerr's argument; repeated-game models of subjective performance assessments; incentives for skill development rather than simply for effort; and incentive contracts between versus within organizations. The author concludes by suggesting two avenues for further progress in agency theory: better integration with organizational economics, as launched by Coase (1937) and reinvigorated by Williamson (1975, 1985), and cross-pollination with other fields that study organizations, including industrial relations, organizational sociology, and social psychology. Objective:
- summarize four new strands in agency theory that help to think about incentives in real organizations
- provide a sketch of the classic agency model to then discuss:
(1) Static models of objective performance measurement; (2) Repeated-game models of subjective performance assessments; (3) Incentives for skill development rather than simply for effort; (4) Incentive contracts between versus within organizations.
The Classic Agency Model: Incentives vs. Insurance
- not nearly as central as it was once deemed!
The key idea of the model is that the agent is risk-averse. A higher bonus rate b thus creates stronger incentives but also imposes more risk on the agent. The extreme case, b = 0, offers the agent full insurance but creates no incentives; the other extreme, b = 1, gives the agent full title to the output y, but offers no insurance at all. Objective Performance Measurement
- y cannot be measured easily, because it reflects everything the principal cares about except for wages
o y = agent’s total contribution to firm value includes mentoring, team production etc.
- assumption: no contract based on y can be enforced in court ( incomplete contracts)
- alternative performance measures (# of units produced, quality etc.) - here, creating incentives can be very tricky (if not impossible)
o sometimes, weak incentives can be more efficient than strong, dysfunctional incentives
o sabotage: it is no use creating strong incentives for the wrong actions o may induce an agent to only focus on the action which contributes more the
overall firm value as the two actions compete for the agent’s attention - use multiple incentive instruments
o E.g.: pharma-industry – need to generate immediately useful output and invest in fundamental knowledge
Use internal capital market to reward the former and promotion policies for the latter
Lessons Learned:
(1) objective performance measure typically cannot be used to create ideal incentives (2) efficient bonus rates are consequently often small (3) on multi-task settings, it is often helpful to use multiple instruments to provide a
balanced package of incentives (direct cash payments, promotion etc.) Subjective Performance Assessment
- repeated-game models of “relational” incentive contracts, i.e., agreements enforced by parties for their reputations, as opposed to formal contracts enforced by a court
o e.g., in each period of ongoing employment relationship, a worker chooses an unobservable action that influences that worker’s total contribution to firm value
too complex to be verified by an outsider however: can often be assessed subjectively by superiors “observable but not verifiable”
Example:
- a worker’s total contribution to firm value is either High (y = H) or Low (y = L) - higher levels of the worker’s action increase the probability that the High contribution
occurs - a compensation package could consist of a base salary s and a relational-contract
bonus B meant to be paid if High contribution is achieved o in an ongoing relationship, the firm’s concern for its reputation may induce it
to honor its relational contract o trigger strategies: parties begin by cooperating and the continue to
cooperate unless one side defects, in which case they refuse to cooperate forever after
- the firm will pay the bonus if the present value of increased future profits from paying it exceeds the cost of paying the bonus today
- some firms use formal and combinational contracts in combination o can reduce distortions in the agent’s incentives and reduce the firm’s
temptation to renege a promised bonus o can also reduce the size of the relational-contract bonus
Skill Acquisition
- incentives for skill acquisitions are tricky because the firm must evaluate a worker’s potential contribution to future firm value, rather than the realized contribution of work to date
- promotion rules rather than formal or relational incentive contracts o rewards based on subjective performance assessments
Example 1:
- y = the firm’s assessment of the worker’s potential contribution to future firm value, based on previous performance
- suppose the worker’s capital contribution is x if the worker does not invest in firm-specific human capital and x + v if he does invest
o to make such an investment, the worker must give up some leisure time, denoted by the opportunity cost c
- supposed the value of the investment to the firm exceeds the cost of the investment to the worker; that is, v > c
- a contract could specify that the firm will pay a high wage if the worker achieves y = x + v, and a low wage otherwise
o if the difference between the wages exceed the worker’s opportunity cost, then he has an incentive to invest
o a firm will only want to induce such investment if it receives a productivity increase
o most also make both parties willing to participate (i.e., must exceed the worker’s best alternative opportunity and the high wage)
Example 2:
- a firm has two jobs, an easy one and a hard one - investment in skills improves productivity in both jobs, but more in the hard job - suppose that:
o an untrained worker is more productive in the easy job o a trained worker is more productive in the hard job o training is efficient b/c the productivity difference between a trained worker in
the hard job and an untrained worker in the easy job exceeds the opportunity cost of training
- a worker who believes that investing in skills will yield promotion will invest if the difference between the high and low wages exceeds the opportunity cost of training
- the firm will choose to promote a trained worker if doing so is more profitable than leaving him in the easy job; that is, the difference for a trained worker between the two jobs exceeds the wage difference between the two jobs
- these two conditions may be incompatible “Up-or-stay” vs. “Up-or-out”
- an “up-or-stay” promotion rule creates a tension between needing a large enough wage gap to induce the worker to invest and keeping the wage-gap small enough that the firm is willing to promote the worker after the worker has invested
- in an “up-or-out” rule, a firm must either pa the worker a high wage or fire the worker
o can induce workers to invest in specific capital o May be a very costly rule
Firing workers means losing specific capital and giving workers less incentives to invest in the first place
Incentive Contracts between versus within Firms
- address the problems of the boundaries of the firm (Coase-Williamson Theory) - derive the optimal incentive contract under both integration and non-integration and
then compare the social surplus produced by each - asset-ownership model
Example:
- agent can either be an employee or an independent contractor o employee is paid on measured performance (w = s + bp) o contractor receives the wage and change in the assets value (w + v) o the optimal bonus rate b is lower for the employee b/c he is not distracted
by incentives to invest in the asset Another example:
- Repeated game - Each period, an upstream party uses an asset to produce a good that could be used
in a downstream party’s production process o Ownership of the asset = ownership of the good o If the upstream party is independent, the good could be sold to a different
downstream party o If not, the existing downstream party already owns the good

o If the upstream party is independent, 2 new conditions could arise: Threat to sell it to another party limits the original downstream party’s
ability to renege on a promised bonus However, also creates an incentive for the upstream party to produce a
good, high quality product to improve its bargaining position Conclusion:
- two avenues for further progress in agency theory: (1) better integration with organizational economics (2) cross-pollination with other fields that study organization, including industrial
relations, organizational sociology, and social psychology
Lazear (2000): Performance Pay and Productivity Synopsis What happens when a firm switches from paying hourly wages to paying piece rates? The theory developed in this article predicts that average productivity rises, that the firm will attract a more able work force and that the variance in output across individuals at the firm will rise as well. The theory is tested with a new (unique) data set from Safelite Glass Corporation, a large autoglass company that changed compensation structures between 1994 and 1995. All theoretical predictions are borne out. In the firm examined, the productivity effects are extremely large, amounting to anywhere from about 20% to 36% of output, depending on what is held constant. About half of the worker-specific increase in productivity is passed on to workers in the form of higher wages. Safelite Glass Corporation
• 1994/5: new management changes the compensation method for its workforce, moving them from hourly wages to piece-rate pay
• The effects, which are documented by examining the behavior of about 3,000 different workers over a 19-month period, are dramatic and completely in line with economic theory
• The theory is backed by the following empirical results o A switch to piece-rate pay has a significant effect on average levels of output
per worker. This is in the range of a 44% gain o The gain can be split into two components
½ the increase results from the average worker producing more because of incentive effects
Some of the increase can be attributed to the fact, that under a piece-rate scheme, the most productive workers can be hired (the workers who would never have applied for the job under a standard wage system)
o The firm shares the gains in productivity with its workforce ( ~ 10% increase in pay as a result of the switch)
o Increased variance in output. More ambitious workers have less incentive to differentiate themselves when hourly wages are paid than when piece-rate pay is used
Modeling Choice of Pay Scheme: Hourly Wages Versus Piece Rates
- when a firm institutes an hourly wage schedule, it usually couples the payment
with some minimum level of output that is acceptable - this level may exceed the level of output that workers voluntarily choose under a
piece rate - furthermore, this level may be so high that only the most able workers can make the
cut o hourly wages that are coupled with some minimum standard could be called
performance pay because an output-based performance standard must be met to retain employment
- when piece rates are instituted, more heterogeneity might be tolerated, resulting in lower average levels of output
For any pair of required output and wage, there is a group of workers who will accept the job. The utility a worker of a certain ability can get at another firm that does not necessarily pay workers of all types the same amount is given refers to the wage and effort levels on the best alternative job for a certain worker. Higher-ability workers are likely to find that the
hourly job is not as attractive as an alternative that demands more, but pays more, even if the less able workers would find such a job onerous. Thus, there may exist an upper cutoff. At Safelite, the piece-rate plan paid W (a guarantee coupled with the minimum standard ) to anyone who would have earned less than W under the piece rate, but paid the piece rate to all of those whose compensation by the piece-rate formula would have exceeded W. Propositions on which this is based:
(1) Effort does not decrease as a result of a switch from hourly to piece-rates, as long as there is some ability type for which output rises, average effort increases
a. Condition 1: if a worker with ability A chooses to work at an effort level in the piece-rate range, then any other worker with ability greater than A also chooses to work at an effort level in the piece-rate range
b. Condition 2: if a worker with ability A chooses to work at an effort level in the wage-guarantee range, then any worker with ability less than A also chooses to work at an effort level in the wage-guarantee range
(2) A sufficient condition for the average ability of the workforce to be non-decreasing, and more generally, to rise after the switch is that some workers choose to work enough to be in the piece-rate range
a. Average ability rises because the ability of the lowest-quality worker does not change as a result of the switch, but the ability of the highest-ability worker rises
(3) A sufficient condition for the range of worker ability and output to rise after the switch is that some workers choose to work enough to be in the piece-rate range
Data
- hourly wage until 01/1994 - under the new scheme
o $20/unit installed with a guarantee of $11/hour - Units-per-worker-per-day is the average number of units per eight-hour period
installed by the given worker during the given month Propositions 1, 2, and 3 which state that both mean and variance in output rise when switching from hourly wages to piece rates, are borne out by the simple statistics. Moreover, there is a good indication that profitability went up significantly with the switch. The per-unit cost is considerably lower under the piece-rate scheme than it used to be with hourly wages. Other Effects
- Sorting o It would not be surprising to see a worker increase productivity dramatically
during the first few months on a job; o Those who are no making it get fired or quit early (separation)
- Fixed Effects o Person-specific effects play an important role in the interpretation of results
- Pay and Profitability o The firm often passes along some of the benefits of the gain in productivity to
its existing workforce - Quality
o One defect of paying piece-rates is that quality may suffer o One possible solution: have the worker who slogged repair the damage at his
own expense. Because re-dos are costly to the worker, he will try to get it right the first time around
NOTE: Piecework is not always profitable: Managerial and professional jobs may not be suitable for piecework schemes! Conclusion Productivity effects associated with the switch from hourly wages to piece rate are quite large. Theory implies that a switch should bring about an increase in average levels of output and its variance. However, the author shows that these predictions are borne out; the theory does not imply that profits must rise. Market equilibrium is characterized by firms that choose a variety of compensation methods. Firms choose the compensation scheme by comparing the costs and benefits of each scheme. The benefit is a productivity gain. Costs may be associated with measurement difficulties, undesirable risk transfers, or quality declines. The minimum level of ability does not change, but more able workers, who shunned the firm under hourly wages, are attracted by piece-rates. As a result of incentive effects, average output per worker rises.
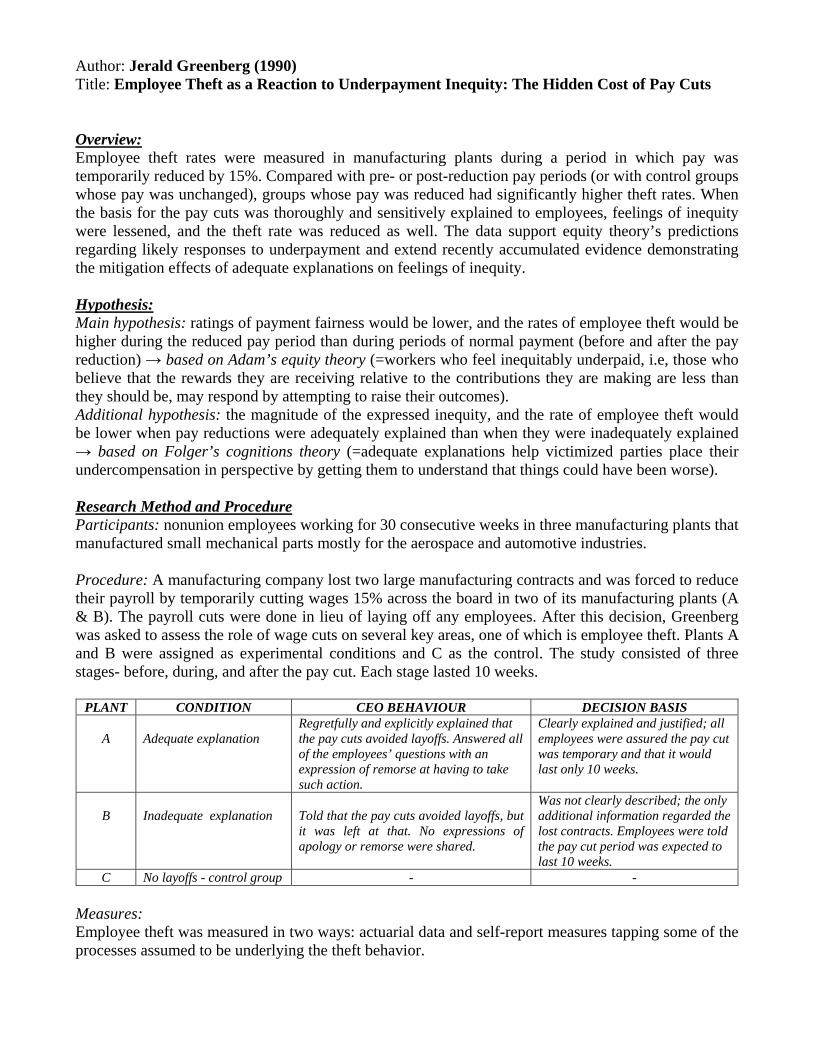
Author: Jerald Greenberg (1990) Title: Employee Theft as a Reaction to Underpayment Inequity: The Hidden Cost of Pay Cuts Overview: Employee theft rates were measured in manufacturing plants during a period in which pay was temporarily reduced by 15%. Compared with pre- or post-reduction pay periods (or with control groups whose pay was unchanged), groups whose pay was reduced had significantly higher theft rates. When the basis for the pay cuts was thoroughly and sensitively explained to employees, feelings of inequity were lessened, and the theft rate was reduced as well. The data support equity theory’s predictions regarding likely responses to underpayment and extend recently accumulated evidence demonstrating the mitigation effects of adequate explanations on feelings of inequity. Hypothesis: Main hypothesis: ratings of payment fairness would be lower, and the rates of employee theft would be higher during the reduced pay period than during periods of normal payment (before and after the pay reduction) → based on Adam’s equity theory (=workers who feel inequitably underpaid, i.e, those who believe that the rewards they are receiving relative to the contributions they are making are less than they should be, may respond by attempting to raise their outcomes). Additional hypothesis: the magnitude of the expressed inequity, and the rate of employee theft would be lower when pay reductions were adequately explained than when they were inadequately explained → based on Folger’s cognitions theory (=adequate explanations help victimized parties place their undercompensation in perspective by getting them to understand that things could have been worse). Research Method and Procedure Participants: nonunion employees working for 30 consecutive weeks in three manufacturing plants that manufactured small mechanical parts mostly for the aerospace and automotive industries. Procedure: A manufacturing company lost two large manufacturing contracts and was forced to reduce their payroll by temporarily cutting wages 15% across the board in two of its manufacturing plants (A & B). The payroll cuts were done in lieu of laying off any employees. After this decision, Greenberg was asked to assess the role of wage cuts on several key areas, one of which is employee theft. Plants A and B were assigned as experimental conditions and C as the control. The study consisted of three stages- before, during, and after the pay cut. Each stage lasted 10 weeks.
PLANT CONDITION CEO BEHAVIOUR DECISION BASIS
A Adequate explanation
Regretfully and explicitly explained that the pay cuts avoided layoffs. Answered all of the employees’ questions with an expression of remorse at having to take such action.
Clearly explained and justified; all employees were assured the pay cut was temporary and that it would last only 10 weeks.
B
Inadequate explanation
Told that the pay cuts avoided layoffs, but it was left at that. No expressions of apology or remorse were shared.
Was not clearly described; the only additional information regarded the lost contracts. Employees were told the pay cut period was expected to last 10 weeks.
C No layoffs - control group - - Measures: Employee theft was measured in two ways: actuarial data and self-report measures tapping some of the processes assumed to be underlying the theft behavior.
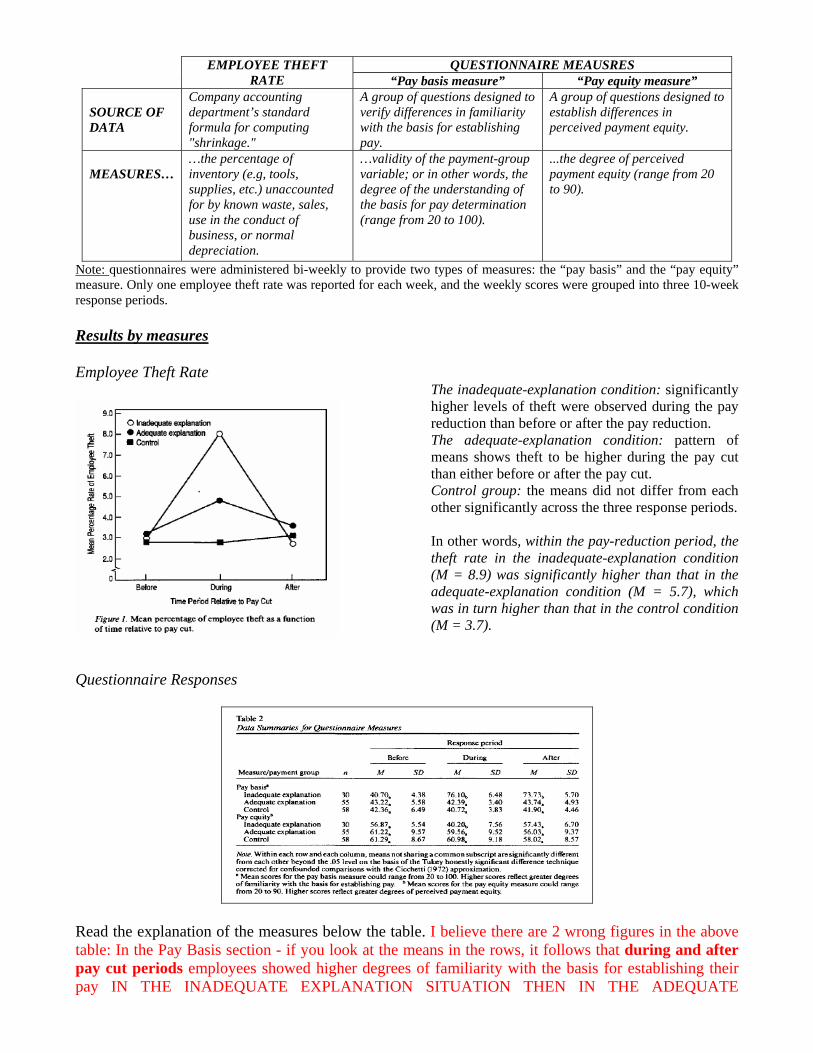
QUESTIONNAIRE MEAUSRES
EMPLOYEE THEFT RATE “Pay basis measure” “Pay equity measure”
SOURCE OF DATA
Company accounting department’s standard formula for computing "shrinkage."
A group of questions designed to verify differences in familiarity with the basis for establishing pay.
A group of questions designed to establish differences in perceived payment equity.
MEASURES…
…the percentage of inventory (e.g, tools, supplies, etc.) unaccounted for by known waste, sales, use in the conduct of business, or normal depreciation.
…validity of the payment-group variable; or in other words, the degree of the understanding of the basis for pay determination (range from 20 to 100).
...the degree of perceived payment equity (range from 20 to 90).
Note: questionnaires were administered bi-weekly to provide two types of measures: the “pay basis” and the “pay equity” measure. Only one employee theft rate was reported for each week, and the weekly scores were grouped into three 10-week response periods. Results by measures Employee Theft Rate
The inadequate-explanation condition: significantly higher levels of theft were observed during the pay reduction than before or after the pay reduction. The adequate-explanation condition: pattern of means shows theft to be higher during the pay cut than either before or after the pay cut. Control group: the means did not differ from each other significantly across the three response periods. In other words, within the pay-reduction period, the theft rate in the inadequate-explanation condition (M = 8.9) was significantly higher than that in the adequate-explanation condition (M = 5.7), which was in turn higher than that in the control condition (M = 3.7).
Questionnaire Responses
Read the explanation of the measures below the table. I believe there are 2 wrong figures in the above table: In the Pay Basis section - if you look at the means in the rows, it follows that during and after pay cut periods employees showed higher degrees of familiarity with the basis for establishing their pay IN THE INADEQUATE EXPLANATION SITUATION THEN IN THE ADEQUATE
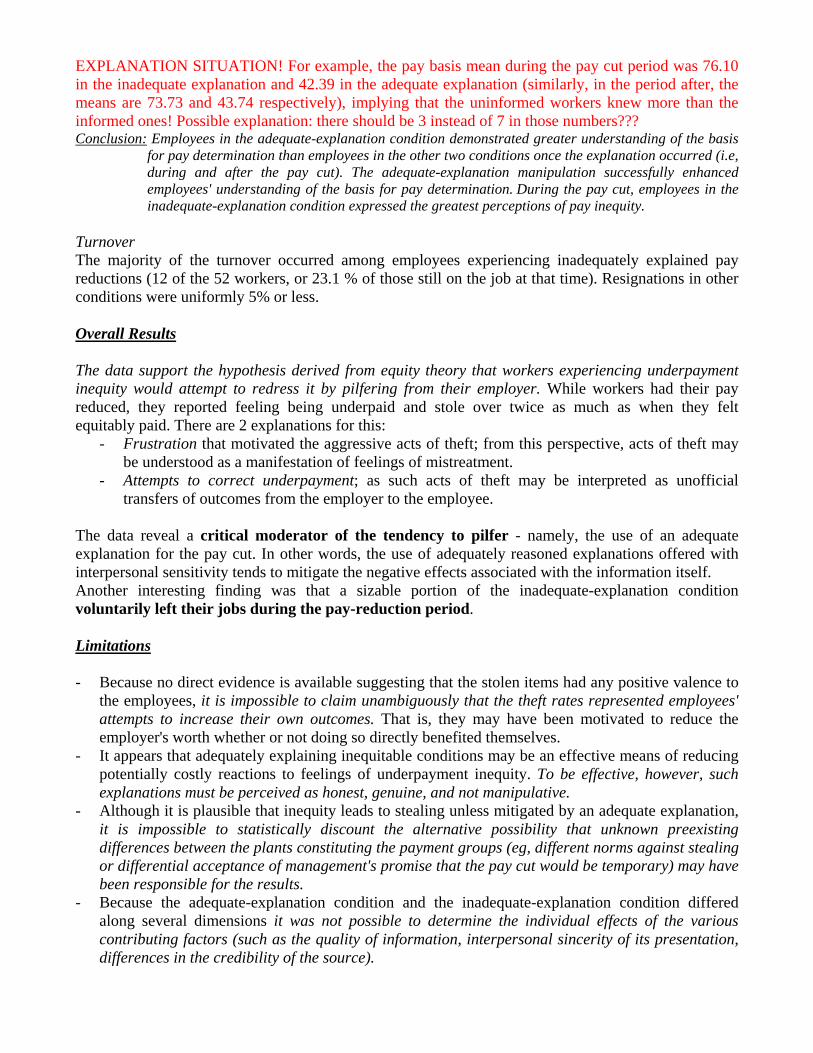
EXPLANATION SITUATION! For example, the pay basis mean during the pay cut period was 76.10 in the inadequate explanation and 42.39 in the adequate explanation (similarly, in the period after, the means are 73.73 and 43.74 respectively), implying that the uninformed workers knew more than the informed ones! Possible explanation: there should be 3 instead of 7 in those numbers??? Conclusion: Employees in the adequate-explanation condition demonstrated greater understanding of the basis
for pay determination than employees in the other two conditions once the explanation occurred (i.e, during and after the pay cut). The adequate-explanation manipulation successfully enhanced employees' understanding of the basis for pay determination. During the pay cut, employees in the inadequate-explanation condition expressed the greatest perceptions of pay inequity.
Turnover The majority of the turnover occurred among employees experiencing inadequately explained pay reductions (12 of the 52 workers, or 23.1 % of those still on the job at that time). Resignations in other conditions were uniformly 5% or less. Overall Results The data support the hypothesis derived from equity theory that workers experiencing underpayment inequity would attempt to redress it by pilfering from their employer. While workers had their pay reduced, they reported feeling being underpaid and stole over twice as much as when they felt equitably paid. There are 2 explanations for this:
- Frustration that motivated the aggressive acts of theft; from this perspective, acts of theft may be understood as a manifestation of feelings of mistreatment.
- Attempts to correct underpayment; as such acts of theft may be interpreted as unofficial transfers of outcomes from the employer to the employee.
The data reveal a critical moderator of the tendency to pilfer - namely, the use of an adequate explanation for the pay cut. In other words, the use of adequately reasoned explanations offered with interpersonal sensitivity tends to mitigate the negative effects associated with the information itself. Another interesting finding was that a sizable portion of the inadequate-explanation condition voluntarily left their jobs during the pay-reduction period. Limitations - Because no direct evidence is available suggesting that the stolen items had any positive valence to
the employees, it is impossible to claim unambiguously that the theft rates represented employees' attempts to increase their own outcomes. That is, they may have been motivated to reduce the employer's worth whether or not doing so directly benefited themselves.
- It appears that adequately explaining inequitable conditions may be an effective means of reducing potentially costly reactions to feelings of underpayment inequity. To be effective, however, such explanations must be perceived as honest, genuine, and not manipulative.
- Although it is plausible that inequity leads to stealing unless mitigated by an adequate explanation, it is impossible to statistically discount the alternative possibility that unknown preexisting differences between the plants constituting the payment groups (eg, different norms against stealing or differential acceptance of management's promise that the pay cut would be temporary) may have been responsible for the results.
- Because the adequate-explanation condition and the inadequate-explanation condition differed along several dimensions it was not possible to determine the individual effects of the various contributing factors (such as the quality of information, interpersonal sincerity of its presentation, differences in the credibility of the source).
Jeff Rosenberger 11/16/01
Author (yr): Jerald Greenberg (1990) Title: Employee theft as a reaction to underpayment inequity: the hidden
cost of pay cuts
Journal: Journal of Applied Psychology v. 75 no. 5 (561-568) Overview: Employee theft rates were measured in manufacturing plants during a period in which pay was temporarily reduced by 15%. Compared with pre- or post-reduction pay periods (or with control groups whose pay was unchanged), groups whose pay was reduced had significantly higher theft rates. When the basis for the pay cuts was thoroughly and sensitively explained to employees, feelings of inequity were lessened, and the theft rate was reduced as well. The data support equity theory’s predictions regarding likely responses to underpayment and extend recently accumulated evidence demonstrating the mitigation effects of adequate explanations on feelings of inequity. Main Points: Research Question/Hypothesis: Hypothesizes that the magnitude of the expressed inequity- and the rate of employee theft- would be lower when pay reductions were adequately explained than when they were inadequately explained. Research Procedure: A manufacturing company lost two large manufacturing contracts and was forced to reduce their payroll by temporarily cutting wages 15% across the board in two of its manufacturing plants (A & B). The payroll cuts were done in lieu of laying off any employees. After this decision, Greenberg was asked to assess the role of wage cuts on several key areas, one of which is employee theft. Plants A and B were assigned as experimental conditions and C as the control. The study consisted of three stages- before, during, and after the pay cut. Each stage lasted 10 weeks. Plant A was the adequate explanation condition, where the CEO regretfully and explicitly explained that the pay cuts avoided layoffs. Plant B was the inadequate explanation condition, where employees were told that the pay cuts avoided layoffs, but it was left at that. Plant C had no layoffs. Data and Methods: Employee theft was measured in two ways: actuarial data and self-report measures tapping some of the processes assumed to be underlying the theft behavior. Analyses of theft rates were based on a 3 X 3 mixed design ANOVA. Results: The data support the hypothesis derived from equity theory that workers experiencing underpayment inequity would attempt to redress it by pilfering from their employer. While workers had their pay reduced, they reported feeling being underpaid and stole over twice as much as when they felt equitably paid. There are 2 explanations for this: frustration and attempts to correct underpayment. The data reveal a critical moderator of the tendency to pilfer- namely, the use of an adequate explanation for the pay cut. Another interesting finding was that a sizable portion of the inadequate-explanation condition voluntarily left their jobs during the pay-reduction period. In fact, a much larger proportion resigned than did so in any other condition.
Chapter 5 (pp149-159): Bounded Rationality and Private Information Key terms: bounded rationality, opportunism, asset specificity One main problem of economic organisation and management is motivation problem, which arises when individuals have their own private interests that are not necessarily aligned with interests of others. Coordination problem is to determine how things should be done, who should do what e.g. who should make decisions which what information. Motivation problem is to make sure individuals involved in the process are willing to do their parts in the whole undertaking. In other words, it is to motivate individuals (who are self-interest) to coordinate in the group/team. To draw a link among different individuals’ interests, a contract1 may be used to modify individual behaviours in ways that are mutually beneficial. In short, we have to motivate to coordinate through the use of contract but complete contracts don’t exist there is a motivation problem. Complete contract—one that specifies precisely what each party is to do and what will be the distribution of costs and benefits for every possible contingency, so that each party finds it optimal to abide by its terms. Note that complete contract perfectly solves the motivation problem. By the same token, we have motivation problems in the reality because complete contracts cannot be practically realised. Components of complete contract:
1) Each party must be able to accurately determine all the contingencies. 2) They must be able to determine and agree on the course of action for each
contingency as well as the accompanying payment. 3) They must be willing to abide by its terms. This implies that no one desires to
renegotiate the terms and each can independently determine if the terms are being met.
In practice, perfect contract is not feasible; it is fraught with limited foresights, imprecise language, costs of laying out the plan. This is bounded rationality, which in brief means all contingencies are not fully accounted for. Since all situations are not planned for, parties must adapt, which gives rise to a possibility of opportunism. Fear of opportunism may deter parties from replying on one another as much as they would have wanted do (moving away from efficiency). This is termed as imperfect commitment (i.e. perfect commitment cannot be attained due to the fear of opportunism) “Complete contracts” not feasible due to “bounded rationality” chance for “opportunistic behaviours” fear of this “imperfect commitment”
1
This is an economic term that refers to a compact or covenant among people. It need not have legal power. As a result, a contract is then just an agreement which participants will comply if only they find it advantageous (individually and mutually) to do so.
There is also a problem of private information. Most common situations in which private information can potentially interfere with the possibility of reaching value-maximising agreement are:
1. Adverse selection: information asymmetry private information (e.g. sellers of lemon know more than buyers) possible opportunism buyers sceptical
inefficiency resulting from adverse selection 2. Moral hazard: after transaction cannot tell whether the agreements have
been honoured (private information) possible opportunism inefficiency resulting from moral hazard.
Contractual responses to bounded rationality
1. Spot market contracts: inflexible contracts with blanket provisions that are to apply broadly. Spot contracts are suitable for simple transactions that are quickly concluded e.g. buying a pen.
2. Relational contracts: contracts that settles for an agreement that frames the relationship. That is, the parties do not necessarily agree on detailed plans of action, but on the objectives. E.g. Two companies collaborate on a research work that will ultimately benefit both of them.
3. Implicit contracts: Contracts that contain the component of shared expectations that parties have concerning the relationship. E.g. corporate culture—in 3M, you feel the vibrancy of innovation and creativity everywhere although it may not have been stated as a mandatory qualification in the employment contract.
How contractual incompleteness can harm you
1. Commitment and reneging: Commitment can effectively influence other’s expectations about your behaviour and thereby behaviour they adapt. Commitment obviously can potentially bring a great deal of benefit to the committed party
In the context of contractual incompleteness, there may be some problems. Specifically, you may renege because what should be done in various circumstances is left unstated or ambiguous and open to different interpretations. You can perhaps claim that you have done according to what was agreed upon (you have taken advantage of the ambiguity). Obviously, when this can happen, your commitment may not have much value in the first place. For instance, the other party may fear of reneging, so they do not adapt their action as much as they were supposed to.
2. Ex post renegotiation (ex post haggling): The second commitment
problem is that it may be advantageous for both parties to renegotiate the contract ex post because what was efficient then may not be efficient now. If they anticipate this, they may not be able to craft the contract that incentivises optimal behaviour now.
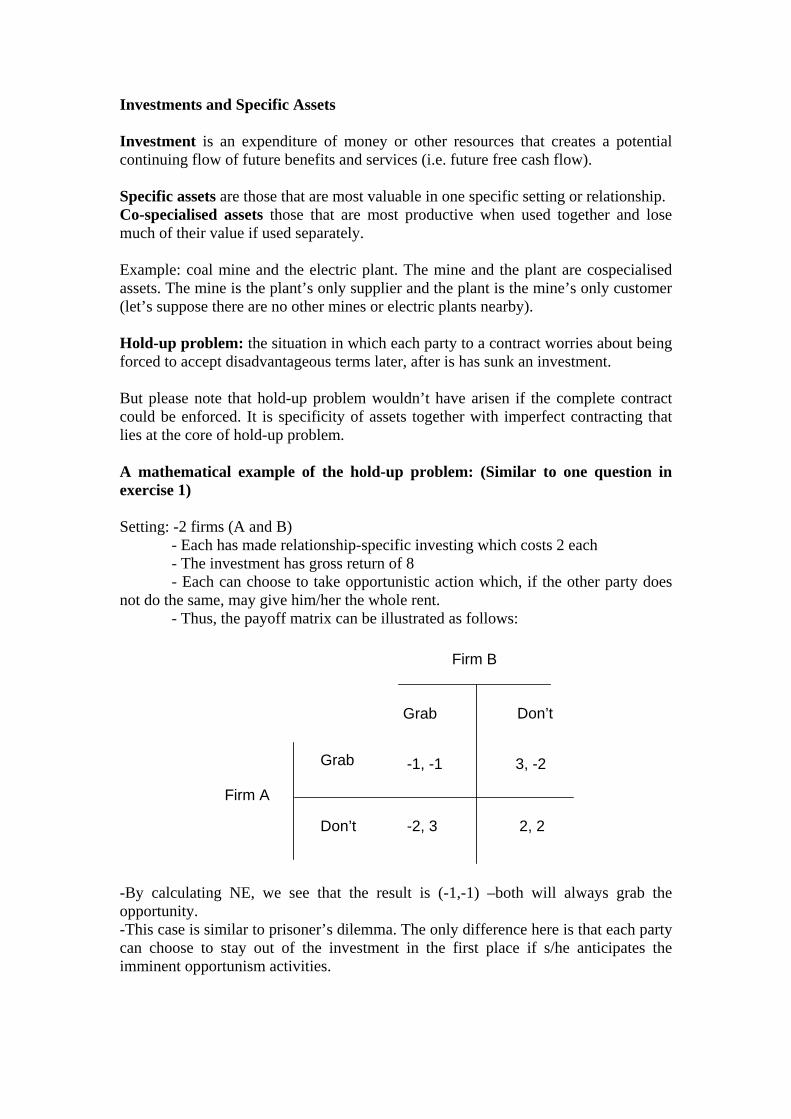
Investments and Specific Assets Investment is an expenditure of money or other resources that creates a potential continuing flow of future benefits and services (i.e. future free cash flow). Specific assets are those that are most valuable in one specific setting or relationship. Co-specialised assets those that are most productive when used together and lose much of their value if used separately. Example: coal mine and the electric plant. The mine and the plant are cospecialised assets. The mine is the plant’s only supplier and the plant is the mine’s only customer (let’s suppose there are no other mines or electric plants nearby). Hold-up problem: the situation in which each party to a contract worries about being forced to accept disadvantageous terms later, after is has sunk an investment. But please note that hold-up problem wouldn’t have arisen if the complete contract could be enforced. It is specificity of assets together with imperfect contracting that lies at the core of hold-up problem. A mathematical example of the hold-up problem: (Similar to one question in exercise 1) Setting: -2 firms (A and B) - Each has made relationship-specific investing which costs 2 each - The investment has gross return of 8 - Each can choose to take opportunistic action which, if the other party does not do the same, may give him/her the whole rent. - Thus, the payoff matrix can be illustrated as follows:
Firm A
Firm B
Grab Don’t
Grab
Don’t
-1, -1 3, -2
-2, 3 2, 2
-By calculating NE, we see that the result is (-1,-1) –both will always grab the opportunity. -This case is similar to prisoner’s dilemma. The only difference here is that each party can choose to stay out of the investment in the first place if s/he anticipates the imminent opportunism activities.
Possible solutions to contractual incompleteness
1. Relational & implicit contracts 2. vertical integration 3. Commitment—e.g. Cortes burned the ships when invading Mexico. I think
the situation for commitment over here is different from the one mentioned earlier. That is, this commitment of yours (Cortes) limits the flexibility of the other party (his soldiers). Please let me know if you have different view.
4. Reputations: the concern of getting bad reputation that reduces future possibilities for profitable transactions can limit reneging.
The value of reputation depends on the following three ingredients: -The frequency of similar transactions in the future. -The horizon over which similar transactions are expected to occur -The profitability of each transaction
The Other Side of the Trade-off: The Impact of Risk on Executive Compensation Aggarwal & Samwick (1999)
MN 404: Class 6
- This empirical work provides strong confirmation of the principal-agent model, which predicts that the executive’s pay-performance sensitivity is decreasing in the variance of the firm’s performance. But relative performance evaluation model is weakly evidenced.
Data: - The test used a large sample of top executives at 1500 of the largest publicly
traded corporations in the US. The stock returns were used to calculate the measure of variance of firm performance and its covariance with industry.
- Flow of compensation (the resources that shareholders of firm paid directly to
executive instead of keeping for themselves) comprises of short-term and long-term components. Short-term compensation salary, bonus, and other annual payments. Long-term compensation payout for long-term incentives plan, the value of stock option granted, etc.
Results: - Using the variation of stock price across firms to test whether executives at
riskier firms have lower pay-performance sensitivities, it was found that the executive’s pay-performance sensitivity is decreasing in the variance of the firm’s performance. Executives in firms with more volatile stock prices will have less performance-base compensation. These finding support P-A model.
- The authors found that the variance of firm’s stock returns is an important
variable in pay-performance regressions and that omitting it leads to downward-biased estimates of the pay-performance sensitivity.
- Note that CEOs have pay-performance sensitivities (about 3 times) higher than
those of other executives.
- This paper also tested for relative performance evaluation of executives against the performance of other firms, and found little support for the “relative performance evaluation model”. (From the relative performance evaluation model, other things equal, an executive will receive lower compensation if executives of rival firms deliver higher returns to their shareholders.) This paper argues that strategic interaction between managers at rival firms in an industry will limit the use of relative performance evaluation.
- All in all, these findings suggests that the executive compensation contracts in
corporate the benefits of risk sharing but do not incorporate the potential informational advantages of relative performance evaluation.
The Prince and The Pauper? CEO pay in the united States and the united Kingdom Conyon and Murphy
Aim CEO pay levels in the UK are far behind in the UK as compared to the CEO’s in the US. The purpose of this article is to provide a comprehensive comparison of pay practice policies in the 2 countries. Following are the reasons why executive pay in the UK and US were compared:
1. Only countries that require detailed disclosure of compensation schemes for individual top executives.
2. Share a common language and have similar capital markets and underlying economies.
3. Employ similar corporate governance cultures. Results
1. Expected pay levels, after controlling for company size and industry, are significantly higher in the US as compared to the UK.
2. Although base salaries are only modestly higher in the US, the driving force
behind the US premium is the prevalence and magnitude of share option grants.
3. Link between CEO wealth and shareholder wealth is much stronger in the US than in the UK.
4. CEO’s in the US hold more shares of stock, stock options and at least as many
LTIP (Long Term Investment Plans) shares as compared to their counterparts in the UK.
5. The pay performance sensitivity is substantially higher in the US than the UK, for
every size and industry group.
6. Indirect relation between cash compensation and stock-price performance is more strongly positive in the US as compared to the UK. US CEO’s have more incentive to improve shareholders wealth.
Possible explanations for the above results
1. Agency theoretic discussion: Traditional principal-agent model highlights the trade off between risk and incentives. Increasing pay performance sensitivity imposes more risk on CEO’s, who demand higher compensation to be compensated for the additional risk.
2. Taxes: Corporate and personal tax regimes affect the optimal structure of
executive compensation contracts (Miller and Scholes, 1982). The UK rules allow deductions for cash compensations but not for exercised options, while US rules allow deductions for exercised options but limit deductions for cash compensation.
3. The Rise (US) and Fall (UK) of stock options: While importance of share
options has been embraced in the US (Hall and Liebman, 1998, and Murphy, 1999), the UK companies have rejected the share option plans in favor of performance share plans such as LTIP’s (Main. 1999). The robust stock market has also contributed to the growing demand for option compensation in the US. The S&P Index, which is a measure of US stock market performance, increased by 300% in the 1990’s; the UK FTSE Index increased by only 150% in the same period.
4. Culture: The US has historically been more tolerant of income inequality,
especially if it is driven by effort, talent or entrepreneurial risk taking. The controversy over CEO pay in the US has led to tighter links between executive pay and performance, thus increasing wage inequality in the robust US stock market. In the UK, the same controversy has led to statutory and non-statutory policies that discourage share option grants, thus lessening the pay performance link.
Financial policy, internal control, and performance - Sealed Air Corporation’s leveraged special dividend Wruck, 1992, Week 9 This paper analyses the role financial policy decisions play in establishing effective internal control. The study is developed through an analysis of sealed air corporation’s leveraged special dividend, a transaction that increased the company’s debt nine-fold to pay shareholders a huge cash dividend. Managers at Sealed Air (SA) used the leveraged dividend as a tool to disrupt the status quo and promote internal change. Question: Effective internal motivated change seems rare. Are organisations capable of forcing timely internal change upon themselves, and if so how? Experiment: Shortly after the close of trading on April 27, 1989, Sealed Air Corporation issued a press release announcing a one-time special dividend of $40 per share. With 8.245 million shares of stock outstanding, the total cash payout amounted to $329.8 million, or 87% of the total market value of the firm’s common stock at $45.875 per share. SA had never paid out a dividend larger than 18 cents per share previously. With insufficient funds on hand to finance the special dividend, the company borrowed a total of $306.7 million. A number of other firms paid leveraged special dividends in an attempt to thwart hostile takeovers. SA however, was not the target of a takeover attempt prior to its special dividend. Historically, SA (producing packaging material) was protected from competition by patents and could afford inefficient production. Management neglected manufacturing and focused on sales and marketing. By the mid-1980s, management began planning for the product market competition they would encounter when valuable patents expired. Management decided to launch an initiative to improve manufacturing efficiency throughout the company (‘World Class Manufacturing’, WCM). Employees’ initial response was enthusiastic, but soon faded given that the company’s high profitability led to complacency, and therefore was a barrier to improvement. Management saw no investment opportunity constituting a productive use of free cash flows as defined by Jensen (1986): cash in excess of that required to fund all positive net present value projects. Porter (1990) finds that problems similar to SA’s are common among successful organisations: “Successful companies tend to develop a bias for predictability and stability; they work on defending what they have. Change is tempered by the fear that there is much to lose. The organisation at all levels filters out information that would suggest new approaches, modifications departures from the norm,…innovation ceases; the company becomes stagnant; it is only a matter of time before aggressive competitors over take it” (replacement effect?)
Hence, WCM on its own would only have increased free cash flow and not really address the problem. It was only WCM together (complimentarity?) with dividend policy that created the atmosphere of urgency and seriousness to induce real change in both culture and efficiency. Given the high debt, failure to improve performance was to risk default, bankruptcy, layoffs, etc. Management also introduced five company wide priorities:
1) putting customers first 2) cash flow 3) WCM 4) Innovation 5) Earnings-per-share
Compensation schemes were redesigned. Previously bonuses were based on earnings-per-share. Under the new plan payout was based on EDBITDA, inventory turns, accounts receivable, and working capital, (consistent with the cash demands of high leverage). Outcome: Post-dividend Stock price performance: The total cumulative return to the company’s stock over the 42-month post-dividend period, is 275.5%. (S&P 500 index: 35.9%). Exogenous factors (Industry wide effects and unusual events) as reasons are ruled out as causes. Post-dividend Operational Performance: Relative to its own history and industry, SA’s operating performance improved substantially following the special dividend. Managers at SA used the increased leverage not only to absorb free cash flow, but also as a tool to disrupt the status quo and promote internal change. Financial leverage substituted for the then-absent capital and product market pressure, providing a sense of urgency to change. SA CEO: “our purpose was to use the company’s capital structure to influence and even drive a change in strategy and culture…” Conclusion: Evidence on Sealed Air’s lacklustre pre-dividend performance, its stalled manufacturing program, and employees’ views support the conclusion that its outstanding performance could not have been achieved absent financial leverage. It is equally unlikely, however, that substantial performance improvement would have been achieved without effective changes in internal control. At Sealed Air, the two reinforced on another to create an environment that supports value-maximising decision making.

MN404
Capital Structure Puzzle S.C. Myers
The paper refers to Miller Modigliani Theorem (MM), and it is worth looking at its Proposition I and Proposition II. Proposition I – 1) Does the capital structure of the firm alter its value? Proposition I says, assuming perfect capital markets and no tax effects, the value of the firm is unaffected by the capital structure it chooses, i.e. the capital structure irrelevance. In other words leverage can’t influence the firm value. (When the capital structure of the firm has no debt component, one says there is 0 leverage. So in a way leverage indicates the relative magnitude of debt component versus equity in the firm’s capital structure. Proposition II – 2) Does the dividend policy of the firm alter its value? Proposition II says, no it doesn’t. A firm can arbitrarily alter its dividend streams without affecting its value. When one starts considering effect of corporate taxes and costs related to various financing modes, some modifications are required. Key question which the paper tries to address is - ‘How do the firms choose their capital structure?’ To address this question, Myers argues in favour of and against two frameworks,
1) Static Tradeoff (ST) framework – In this, firm is viewed as setting a target debt-to-value ratio and gradually moving towards it.
2) Pecking order (PO) framework – The firm prefers internal to external financing and debt to equity when it issues securities. In pure Pecking order theory there is no debt-to-value target set by the firm. More will be discussed about the above comments regarding the PO framework at a later stage.
The author doesn’t use managerial or neutral mutation theories because managerial theories analyse the situation from only managers’ perspective ignoring the stockholders, and neutral mutation theories argue that capital structure chosen by the firm results from firm-specific habits – not giving much of an insight into the financial behaviour. ST framework – The firm’s optimal debt ratio is viewed as a tradeoff between the interest tax shields and costs of financial distress. So essentially, this is a trade-off between costs and benefits of borrowing. Let us start with the firm having 100% equity financing. This is our base line. Now as the firm reduces the equity component and increases the debt component, it starts
gaining some advantages. These advantages arise mainly due to the fact that interest payments done on this debt are deducted from firm’s taxable income. So now firm pays a lesser amount of tax – interest tax shield. But then there are costs of issuing debt, costs that are affiliated with writing covenants, with filing clauses for financial distress scenarios etc. A firm will keep on increasing the debt component until the difference between present value (PV) of interest tax shields and PV of financial distress costs is maximum. And the debt-to-value ratio at which this maximum is reached is the optimal ratio for the firm. But in real life we find that the firms identical in all other aspects have there debt-to-value ratio quite different from the other firms i.e. there is dispersion around the optimal ratio predicted by theory. This may happen because of deviations from the optimal or because the firms though identical in all the other aspects, set different target debt-to-value ratios. The two types of cases need to be kept separate and need to be analysed separately. Another factor, which justifies the dispersion of data, is – cost of adjustments. Suppose a firm sets a target debt-to-value ratio…the optimal one, and there are some random events that take the firm away from that ratio; then it’s not easy for the firm to quickly offset the random events because changing the ratio also involves costs. (Remember that ST framework definition on previous page use the word ‘gradually’ to highlight the same fact. After all firms aren’t springs that will recoil or stretch themselves without incurring any costs!) MM Proposition I – mentioned right in the beginning of this summary – had a phrase ‘no tax effects’. But in real world there are taxes to be paid. And as per the arguments in previous two paragraphs, firms’ have incentive to go for debt to make some gain on the tax front. So according to the corrected MM theory (which considers tax effects), any tax-paying corporation gains by borrowing, the grater the marginal tax rate, the greater the gain. Millers’ theory says that the party that has borrowed money will get tax deductions on interest payments. But the party that has lent money i.e. the party that receives these interest payments will have to pay tax on the interest…(Government doesn’t want to lose money.) And corporate interest tax shield is offset by personal income tax payments on the interest. But this is only true when the firm pays a full statutory rate. A firm paying lower rates would set a net loss on corporate borrowings and net gain on corporate lendings. As a result, 1) There is tax advantage of borrowing to the firms facing full statutory rate. 2) There is a tax advantage of lending (or at least not borrowing) to firms with large tax carryforwards. For first statement an example would be…IBM should borrow more than Bethleham steel, because it pays full statutory rates and is really going to gain on tax fronts if it borrows. Bethleham Steel pays lower tax rates anyway (Steel industry) so it may not have incentives to issue debt. For second statement an example would be, GM having a larger debt-to-equity ratio than Chrysler, because when this paper was written (1984) Chrysler would
have had large tax carryforwards and also because it would have had to pay out more interest rate to investors as the company wasn’t doing well and was risky to invest in. (Unfortunately changing times have seen GM to be thrown in the same category as that of Chrysler and a recent paper might replace the name of GM by Toyota and would keep Chrysler as it is or replace it with GM or Ford – the Detroit giants that are bleeding cash.) The corrected MM theory and Miller’s theory both are the extreme cases, and there are compromise theories in between, advanced by D’Angelo, Modigliani and Masulis. Before moving to PO framework here are two remarks about the costs of financial distress,
1) Risky firms ought to borrow less, other things equal, because they have higher costs of threatened or actual default.
2) Firms holding tangible assets and active second-hand market will borrow ‘more’ (as per the paper it is ‘less’…but this must be a typographic error as the paper later argues in the favour of ‘more’, which also seems to be logically correct.) than the firms having intangible or specialized assets and/or growth opportunities. This is because specialized; intangible assets and growth opportunities are more likely to lose value in financial distress, increasing the distress costs.
PO framework – This framework says that,
1. Firms prefer internal financing. 2. They adapt their target dividend payouts ratios to their investment
opportunities, although dividends are sticky and target payout ratios are only gradually adjusted to shifts in the extent of investment opportunities.
3. If the firm has to go for external finance, then it will do so by issuing the safest securities first i.e. it’ll start with debt, then hybrid securities such as convertible bonds and finally equity. The firm won’t have a target debt-equity mix but will adjust itself to the cumulative requirement of external finance.
Professional managers avoid going for external financing because they want to avoid the discipline of the capital markets. One more argument in the favour of internal financing is the avoidance of issue costs of external one. And again within external financing debt is preferred because of the higher issue costs for equity - advisory, underwriting etc. To explain the propositions of PO framework regarding external financing ‘asymmetric information’ viewpoint is helpful. (In the following discussion I have retained the same mathematical notation as used in the paper, to maintain clarity. But I have deliberately omitted the conditional expectation expressions as it could be done without compromising on lucidity of the summary.)
Suppose the firm has to raise N dollars in order to undertake some potentially valuable investment opportunity. Let y be the opportunity’s net present value (NPV) for the firm and x be what the firm would be worth if the opportunity is lost. The managers of the firm know x and y but investors don’t. The benefits of raising N dollars by a security issues is y, the NPV of the firm’s investment opportunity. There is also a possible cost: the firm may have to sell the securities for a less than it is really worth. Suppose the firm issues a stock with aggregate market value, when issued, of N. However the manager knows that the shares are really worth N1. That is N1 is what the new shares will be worth, other things held equal, when investors acquire manager’s special knowledge. Let ΔN be the amount by which the shares are over or undervalued, i.e. N1–N. Then the manager will issue and invest only when,
y ≥ ΔN
If the manager’s inside information is unfavourable then ΔN is negative and in that case firm will always issue. If the information is favourable then ΔN will be positive i.e. the equity at the time of issue would be undervalued. In this case if it is too much undervalued such that ΔN exceeds y, then the manager may forgo the investment/growth opportunity as he would know that he is being asked to float the issue at a much lower price than its actual worth. Following points are important with respect to the above discussion.
1) Cost of reliance on external financing – if the firm is dependent on the external financing then it will have to forgo the positive NPV opportunity if isn’t getting the right price for the issue. So it is always better to be ready with the internal finances to avoid a last minute fiasco. (Internal finances – this term implies that the company invests its own earnings into the growth opportunities. The company may do well and file record earnings. Instead of paying out all the profit as dividend to its shareholders, the firm may keep some of it, which can be invested in current/future opportunities.)
2) Advantage of debt over equity – if the firm does seek external funds, it is better of issuing debt than equity. The general rule is issue safe securities before risky ones. The way to reduce ΔN is to issue safest possible securities – strictly speaking, securities whose future value changes least when the manager’s inside information is revealed to the market.
In short, if the managers feel that the new equity issue I underpriced i.e. ΔN>0, then they will go for debt and if they feel that it is overpriced then they will exploit this opportunity and float inferior quality equity to take advantage of new investors. Problem is that investors, anticipating this logic, would always feel that if the firm is issuing equities then it is doing so because the issue is overpriced and they will be reluctant to buy the issue unless they go through the firm details seeing that the firm has issued substantial amount of debt and it is issuing
securities, not to exploit the overpricing opportunity, but because it can’t go for anymore debt – as this debt would substantially increase its costs. So the investors would make the firm follow the pecking order - Debt first and then the equity.
What we know about corporate financing behaviour?
1.Internal vs. External equity – Statistics shows that debt issues and internal financing play a crucial part in financing investment opportunities. New stock issues play a relatively small role. This is similar to the PO framework. ST can explain it by discussing the significant costs involved in equity issue and favourable tax treatment of capital gains relative to dividends. 2. Timing of security issues – firms apparently try to issue stocks when security prices are high. Given that the firm is going to opt for external finance, it’ll do so after the stock prices have risen than after they have fallen. This is contradictory to ST theory. If firm value rises, the debt-to-value ratio falls, and firm ought to issue debt, not equity, to rebalance their capital structure. The observation is also embarrassing for the PO framework. There is no reason to believe that the manager’s inside information is systematically more favourable when stock prices are high. Even if there were such a tendency, investors would have learned it by now and would interpret firm’s decision accordingly. 3. Borrowing against intangible and growth opportunities – for these kind of opportunities the firms will borrow less because of high distress costs. So there is a negative relationship between rates of investment in R&D and advertising, and the level of borrowing. On the other hand for the tangible assets like setting up a new plant, the firms will prefer borrowing.
4. Exchange offers – Stock prices rise, on average, when a firm offers to exchange debt for equity and fall when they offer to exchange equity for debt. This can be explained using the tax effects. If the debt ratio is below the optimal level and there are significant interest tax shield benefits then the firm would go for debt-for-equity exchanges and would tend to move closer to the optimum. The firm’s willingness to exchange debt for equity might signal that the firm’s debt capacity had, in management’s opinion, increased. It would signal an increase in firm’s value or reduction in the firm risk. Thus debt-for equity exchange would be good news and opposite exchange would be a bad one. 5. Issue of repurchase of shares – On average, stock price falls when firm announces a stock issue. Stock price rise, on average, when a stock repurchase is announced. 6. Existence of target ratios has been found in some cases. It has been seen that risky firms tend to borrow less, other things equal. And in 1984 (when this
paper was written) – there was no study clearly demonstrating that a firm’s tax status has predictable material effects on its tax policy.
Conclusion – the conclusion is some sort of modified Pecking Order theory.
1. Firms prefer not to go for common stock or risky securities, because they don’t want to fall in the dilemma of passing by positive NPV projects or issuing stock with a price, which they think is too low. (A scenario that arises when ΔN >0 i.e. when the issue is underpirced.)
2. Firms set target dividend payout ratios so that normal rates of equity investments can be met by internally generated funds.
3. If the firm goes for borrowing then it tries to keep the debt safe i.e. close to default-risk-free category. It does so to reduce financial costs of distress and to retain some reserve borrowing power for future contingencies.
4. Since target dividend payout ratios are sticky, and investment opportunities fluctuate relative to the internal cash flow, the firms may at some times exhaust their capacity to issue safe debt and if the firms still need money they will turn to less risky securities first i.e. risky debt, convertible bonds and finally common stock. (Risky debt is less risky than convertibles or common stock because stock prices can fluctuate rapidly and if the stock issue is underpriced, after the prices reach highs, firm repents its action of floating the issue at a lower price than it deserved.)
The modified Pecking Order theory recognises both, asymmetric information and cost of financial distress. As one moves up the pecking order these two factors start dominating, and firms starts facing higher odds that the future positive NPV projects will be passed by because the firm will be unwilling to finance them by common stock and risky securities. The firm may choose to reduce these costs and factors by issuing stock now even if it is not required, to create a reserve borrowing power for future, and to move down the Pecking Order. So issuance of new stock is sometimes done because - given the inherent risk involved in this financing option - it is sometimes better to go for the option now itself than in future. (Company may issue stock because of the uncertainty getting right price in future.) But whether the firm issues stock now or in the future, the information asymmetry question keeps looming large. The optimal dynamic issue strategy for firms in this asymmetric information environment is a question that remains to be addressed.
Easterbrook (1984): Two Agency-Cost Explanations of Dividends Abstract
- economic literature about dividends is usually assumes that managers are perfect agents of investors, and it seeks to determine why these agents pay dividends
- other literature assumes that managers are imperfect agents and inquires how managers’ interests may be aligned with shareholders’ interests
- however, the author argues that, logically, any dividend policy should be designed to minimize the sum of capital, agency, and taxation costs
- purpose of this paper: to ask whether dividends are a method of aligning managers’ interests with those of investors; it offers agency-cost explanations of dividends
The Dividend Problem
- Businesses find dividends obvious o managers are often convinced that higher dividends mean higher prices for
their shares - But: dividends are paid (and regulated) at considerable cost to the firms involved
o M&M declared dividends as irrelevant because investors could home brew their own dividends by selling from or borrowing against their portfolios
o Dividends are moreover taxable to many investors - Oftentimes, firms issue new stock at or around the time they pay dividends
The existence of dividends despite their costs has inspired a search for explanations
- A naïve explanation: dividends exist because they influence a firm’s financing policies, because they dissipate cash, and because they induce firms to float new securities
- Dividends can serve as signals (information content of dividends): o prosperous firms often withhold dividends because internal financing is
cheaper than issuing dividends and floating new securities o however, dividends do not distinguish well-managed firms from others
they are not irrational for poorly-managed or failing firms • such firms should disinvest or liquidate, and their managers
may choose dividends as a method of accomplishing this o needless to say, only a prospering firm can continue to pay dividends over
time, but a firm with a long record of prosperity would not need the verification available from the dividend signal
The author’s final arguments:
- Dividends may be useful in reducing the agency costs of management. - Dividends may keep firms in the capital market, where monitoring of managers is
available at lower cost, and may be useful in adjusting the level of risk taken by managers and the different classes of investors.
- Overall, this explanation offers a hope of understanding why firms simultaneously pay out dividends and raise new funds in the capital market.
Optissimo: Evaluating and rewarding sales staff
Product and Services Optissimo promised to sell finished eyewear to its customers within an hour of choosing the frame. It was first introduced in shopping malls and later at city centers. They believe time was a key factor for this particular customer segment. This approach requires a large investment in optical technology and a strong orientation towards customer service. Following were its auxiliary services: • Free of charge replacement for lenses and frames if they break within first year of
purchase. • 30% discount on new eyewear in case of loss or theft. • Free of charge exchange if the lens is unsuitable. Also for contact lens within a 15-20
day trial period if they are not tolerated by the customer. • Free of charge maintenance of glasses. Outlet area and the purchasing process The customer is greeted by a sales optician at the welcome point, who helps choose and suggest suitable lenses for customers. The sales optician’s ability to listen and ask the right questions aims at defining customer’s use for glass and thus recommending appropriate glasses and lens. The customer is referred to the optometrist if their eye sight needs to be measured. These tests are conducted electronically in a refraction room, and are much more precise than the traditional methods for eye-testing. The optometrist writes the prescription based on the eye test. After the sales optician receives the prescription and enters the relevant data regarding lens, type of frame and delivery time in the computer, it is the job of the laboratory technician to prepare the lenses and mount them in the frame to obtain the finished glass. Following are the products offered: • Standard production: This refers to the ready made closed frame. Production time is
12-15 minutes and time varies on non-technical factors. • Frameless glasses: Here lenses are attached to the frame with screws. Their
production requires more manual operations and takes 40 minutes. The one hour promise does not apply to this category as it may take more than an hour depending upon choice of frame.
• Partially frameless glasses: Their production requires less manual operations and
takes 9 minutes.
Work organization Providing quality service defines Optissimo’s distinctive approach and requires close coordinated interaction amongst the three organizational levels in the outlet. The sales optician’s performance is based on the use value a customer gives to the glasses, and what is recommended and produced. The optometrist’s performance is measured both on the time dedicated to a given operation and the service quality provided, which is measured by customer complaints. The laboratory technician’s is controlled by monitoring elapsed time between commissioning a job, production and delivery of glasses, which must be as promised, and by the number of pairs of glasses produced per day.
FRAUD AT WORLDCOM
LDDS began operations in 1984 offering services to local retail and commercial customers in he southern states. It was initially a loss making enterprise, and thus hired Bernie J. (Bernie) Ebbers to run things. It took him less than a year to make the comoany profitable. By the end of 1993, LDDS was the fourth largest long distance carrier in the United States. After a shareholder vote in May 1995, the company officially came to be known as Worldcom. Corporate Culture Worldcom had an autocratic style of management and followed a top down approach. Each department had its own rules and management style. There was no outlet for employees to express their concerns. Top hierarchy granted compensation and bonus beyond the company guidelines to a select group of individuals based on their loyalty to them. Expense to Revenue Ratio (E/R) Ratio Ebbers was obsessed with revenue growth and insisted on a 42% E/R ratio. He encouraged managers to push for revenue, even if it meant that long term costs would out weigh the short term gains. As business operations declined post the 1st quarter in 2000, CFO Sullivan used the following accounting tactics to achieve targeted performance: 1. Accrual releases: Accounting principles require companies to estimate expected
payments from line costs and match them with revenues in the income statement. Throughout 1999 and 2000, Sullivan told staff to release accruals which too high compared to the relative cash payments. Over a 7 quarter period between 1999 and 2000, Worldcom released $3.3 billion worth of accruals.
2. Expense capitalization: The above tactic could not be used by the end of 1st quarter of
2001 as few accruals were left to release. Sullivan devised a creative solution which started identifying costs of excess network capacity as capital expenditure rather than as an operating cost. Further, managers were asked to capitalize $771 million of non-revenue generating line expenses into an asset account, “construction in progress”. In the 10th quarterly report filed with the US SEC, Worldcom reported $4.1 billion of line costs and capital expenditure.
General Accounting Department Betty Vinson and Troy Normand, managers in the accounting department, were asked to release $828 million of line accruals in the income statement in October, 2000. They were assures by CFO Sullivan that they were doing nothing illegal and he would take complete responsibility for their actions. In April 2001, they were again asked to transfer $771 million of line costs in capital expenditure. They were handsomely rewarded with a raise and promotion for these actions.
Internal Audit Headed by Cynthia Copper, this department reported directly to Sullivan. It was responsible for primary operational audits to measure business unit performances and enforces spending controls. Efforts by Cooper to seek further information regarding Worldcom’s $2.3 billion capital expenditure and $400 million accruals in the wireless business failed. An independent financial audit carried by Cooper helped her to discover the ambiguity in the reports for capital expenditure and line cost accruals. External Auditor: Arthur Andersen Andersen considered Worldcom as its coveted client and wanted to be a committed member of its team. Although Andersen’s risk management software rated Worldcom as a “high risk” client, its audit team at Worldcom continued to rank it as a “moderate risk’ client. Andersen’s auditors were given limited access to the accounting information. Worldcom withheld information, altered documents, omitted information from requested materials and transferred millions of dollars in account balances to mislead Andersen. The Board of Directors The board members were former owners, officers, or directors of companies acquired by Worldcom. CEO Ebbers presided over board meetings and determined their agendas. Sullivan manipulated the information related to capital expenditures and line costs presented to the board. The board played a small role in the life, direction and culture of the company. The End Game By the beginning of 2002, Cooper’s audit team discovered $3 billion in questionable expenses, including $500 million in undocumented computer expenses. After all attempts to receive satisfactory answers from the accounting department failed, these findings were disclosed to the Audit Committee. When Sullivan could not provide an explanation for inappropriate capital expenses, he was asked to resign. On June 25, 2002, Worldcom announced that its profits had been inflated by $3.8 billion over the previous 5 quarters. Nasdaq immediately halted trading of Worldcom’s stock and S&P lowered long term corporate credit rating of Worldcom bonds from B+ to CCC-.
Fiat and GM: The Troubled Alliance (Lecture 1) Question 2 from the final exam for CEMS/IMEX students 2005/2006 refers to the FIAT and GM case. “Explain intuitively the logic behind the “hold-up problem” using as example the troubled alliance between Fiat and GM. Can you identify instances of bounded rationality, relationship-specific investment and opportunistic behavior in the business case?” Quick facts of the case: - In 2000 Fiat and GM enter into a ‘strategic and industrial alliance (Fiat acquires a 5.1% stake in GM and GM acquires a 20% stake in Fiat). - The agreement included a ‘put option’, which stipulated that Fiat would have the right to sell the remaining 80% to GM after 4 years at a fair market value. - Fiat entered into the alliance to save its declining auto division (losses since early 90’s) - GM entered to keep pace with consolidation trend and to help its European and Latin American divisions. - Synergies like cost savings, cross sharing of automotive technologies were focused upon. - By 2004, Fiat planned to exercise the ‘put option’, but GM rendered it void because Fiat had sold its financing arm and had recapitalized. Why did they enter into the alliance? Fiat: - It was faced by declining market share in Italy, western Europe and South America. It had overcapacity and its revenues declined. - Fiat was looking to merge with automakers like BMW and Volvo and it also approached GM in 1999 to divest Fiat in return for a 1/3rd stake in GM. They approached GM because of GM’s presence in North America (the only market where their operations did not overlap) and because they were both experiencing problems in Europe and South America. GM turned down the proposal - In 1999 DaimlerChrysler offered to buy Fiat. GM objected because it saw the merger as a potential threat to its own declining European market. GM: - GM had experienced overcapacity of its European brands (e.g. Opel, Saab) and its profits had decreased by 25.8% - GM saw the alliance, as “alliances are sometimes the only option that available companies will consider. Quite simply, we are not in the business of acquiring a company we cannot work with on a partnership basis, because the auto, because the auto business is just too hard for us to be fighting our own partners. With an alliance we enter the relationship that our partner also wants enter the relationship” An example of bounded rationality. - GM had been using a strategy to enter into alliances with companies in order to see whether they would be interested to acquire the company (i.e. it used this strategy to

acquire Saab and Isuzu Motors). These acquisitions have not been very successful. Investors saw less of a gain from the alliance for GM than for Fiat. - The alliance sought to achieve cost savings through a common purchasing strategy (with the aim to achieve cost savings of 2 billion euro’s by 2005). It also aimed to share technological know-how of diesel engines. - Seeing that the auto industry is an oligopolistic market Fiat was not allowed to enter into other alliances if it sought to divest its auto arm. How did the alliance unfold? - There were some synergies realized, such as global sourcing. However, in 2001 the terrorist attacks in New York led to a significant fall in orders for Fiat. By 2002 they incurred an operating loss of $404 million and by mid-2002 it had a net debt of $6 billion. - Fiat became interested in selling its auto arm to GM through the put option. GM showed disinterest because of Fiat’s beleaguered financial position. Fiat’s decline continued as sales dropped, capacity utilization fell, and high warranty costs. In 2002 both Fiat and GM sought to cut their losses and closed factories and laid off workers. - Despite cost-cutting GM found itself running out of cash ($9 billion pension fund liability and $47 billion of healthcare costs). - End of 2002 GM wrote down its investment in Fiat from $2.4 billion to $220 million, which illustrated its reluctance to buy Fiat. - End of 2002 Fiat re-capitalized. Selling its GM shares to Merrill Lynch and selling its stake in an energy consortium and it sold its financing arm. - A professor of auto industry economics said “Eventually, Fiat cannot stay on its own. That has nothing to do with Fiat but with the economies of car making.” Fiat needed 5 billion euros. Its parent company invested 3 and it turned to GM for the rest. GM refused and its stake was subsequently reduced to 10%. - It was opinioned that GM would only agree if Fiat would rescue it from the obligatory put option or give a considerable return for its investment. Fiat was however determined to save its auto division and did not want to exercise the put option yet. Fiat restructured again and made a small profit in mid-2004. End of the alliance - Mid-2004 GM agreed to help Fiat out of its financial turbulence. However, by end 2004 there were speculations that GM was seeking to sell its stake in Fiat and deny the obligation of the put option. - GM argued that the put option was void because Fiat had sold its financing arm Fidis. Fiat countered by saying GM could buyout 51% of Fidis and that Fiat’s strategic freedom was restricted because the alliance between GM and Fiat stipulated that Fiat could not enter into alliances with others (relationship-specific investment). - Fiat agreed to cancel the put option if GM paid $3 billion, but GM only agreed to pay up to the book value of its stake, which was $500 million. Many were of the opinion that simply pumping cash into Fiat would not save its declining market share, but the Fiat owners were not keen to sell Fiat (also seeing that it was politically sensitive).
Some points of analysis I think in this case we can distill several examples of bounded rationality, relationship-specific investments, and opportunistic behavior. Bounded rationality: - GM thought the key points of the agreement were cost savings and technology sharing (i.e. being able to produce small cars and learn about diesel technology). For Fiat it seemed more about finding an eventual party to merge with. - GM did not anticipate Fiat selling its financing arm and its huge losses and future debt. - Contingencies such as 9/11 taking place and perhaps a misjudgment of the economics of the auto industry by both parties (i.e. Fiat being too small to be on its own) could have led to contingencies after the alliance was created (transaction-cost theory). Relationship-specific investment: - GM sunk a $2.4 billion investment and agreed to the put option. - Fiat agreed not to enter into other ‘strategic alliances’. Opportunistic behavior: - Fiat recapitalized, selling its financing arm Fidis. - Fiat used the put option as a way to hold up GM by leaving it no choice but to buy. - GM sought to use the new information that Fiat re-capitalized to hold up Fiat by declaring the put option void (i.e. Fiat had invested into the agreement and hence would have to abide to it).
MN-415
Competition in the Wide Body Aircraft Market Birth of a new market: In 1965, PanAm signed an agreement with Boeing to acquire a new large aircraft fleet, the 747. American Airlines followed by wanting to order aircrafts that were bigger than the existing ones but smaller than 747’s. Since Boeing was busy, this left McDonnell Douglas and Lockheed as potential contenders. First serious credible signal for commitment came in September 1967, when specific design proposals were sent to the airlines. Difference: McDonnell Douglas prepared the first draft in 6 months as opposed to 9 for Lockheed. The Market and the Players: McDonnell Douglas Corporation’s DC-10 was designed to fill the market hole between the 727 and the new 747. Despite their illustrious past, they were overtaken by Boeing. Lockheed developed the L-1011 for the same market. By undertaking this project it was stretching its financial resources as a shortfall of sales below the desired level would prove disastrous for Lockheed. Different market segmentations can be considered on the basis of range, no. of engines, passenger capacity size etc. Although DC-10 and L-1011 were close substitutes, 747 could be a market on its own. In practice, however, the above designs were viewed as close substitutes in the long haul, high capacity aircraft market. Market size and break even level: Market size was estimated between 1000-1300 units worldwide in the ensuing 5 years, with one third of the demand coming from the airlines outside the US. Break-even was influenced by many factors: capital expenditure outlays, slope of learning curve and intensity of price competition. Selling price was estimated at $15-$17 million. Average variable costs were $100 million for the first unit, falling 23% by doubling cumulative output, which would result in $15.5 million for the 150th unit. How to sell an airplane: The first stage involves salespeople and engineers meet with the airline to discuss the aircraft technical details and the financial and contractual matters. When this approached completion, a senior figure takes over granting concessions over price or financing. Airlines have bargaining power and often ask for extraordinary privileges, called “green stamps”. Due to high level of government involvement, often bribes are paid. Each deal is tailor made and accompanied by last minute concessions.

The learning curve: Learning in the aircraft industry takes place through rationalization in production. This is partially offset by organizational forgetting. This implies loss of expertise and experience by employees moving internally or leaving the company. Volatility and turnover is very high. After a period of high turnover, productivity can fall below previous levels attained through accumulation of experience. A temporary slip can throw the competitor out of the game as leading manufacturer moves down the learning curve, becomes more competitive and can now price more aggressively. Games begin: • First bids were submitted in February 1968 and were within $200,000 of each other. • American Airlines placed its first order with McDonnell Douglas • Lockheed, by aggressive marketing, secured the next 3 large orders. Thus, pressure
was on McDonnell to leave the market when it could. • In 1968, United placed an order with McDonnell, thus cementing the market in a
triopoly. Engine trouble: Rolls Royce • Development costs for RB.211 were very high. There was uncertainty over breaking
even as Lockheed projects were not coming steadily. • Rolls Royce was under financial strain and the burden to save RB.211 program was
placed on Lockheed, which renegotiated the contract in Rolls Royce favor. Forgetting curve: • Lockheed’s production rates had to be cut down causing backward movement along
the learning curve and increase in production cost. • Low cumulative orders implied long term survival uncertainty, which drove away
potential demand. • Airbus entry in 1971 made Lockheed’s long term survival uncertain. McDonnell Douglas: • A DC-10 crash in 1974 killed more than 300 people and public confidence in DC-10
dropped • A safer version of the plane, MD-11, was introduced but sales never took off. How the war was won: Boeing • Throughout 1970’s, Boeing benefited from McDonnell’s and Lockheed’s trouble and
747 eventually emerged as winner • Learning curve dynamics transformed a series of temporary advantages into a
permanent one • More Boeing got ahead in the race, it got more efficient in production, and
competitive in future sales.
DE BEERS – MN 415 Study Group 5 : Marco, Susana, Georgina, Neha, Xiao, Fatma, Rakhi. Brief discussion of history DeBeers was founded by Cecil Rhodes in 1870. Since then, it has been a highly successful and effective controller of the diamond market having developed a unique purchasing and marketing cartel that has influenced prices in the market virtually undisturbed for almost a century. However, lately, more and more players have challenged DeBeers dominance and ever since, DeBeers has been struggling to keep the Cartel intact. DeBeers’ traditional role has been to take on the position of the custodian of the entire industry, protecting producers, dealers and cutters through its cartel from the vices of free markets. In the last century, it has managed to do this by safeguarding its cartel from competitors, by buying off excess supply, storing it in vast stockpiles to protect the prices, and by launching advertising campaigns on behalf of the entire industry. (e.g. A diamond is forever....) However, in the late 1990s, DeBeers realized that the diamond market was getting extremely competitive, especially with the opening of new diamond mines in Canada, resulting in a decline of DeBeers market share from 80% to 65% in 1999 and a general underperformance of its stock. In the current scenario, it is becoming increasingly obvious that in an industry where DeBeers is no longer the sole supplier of diamonds, the traditional custodian role that DeBeers has adopted over the past may not be sustainable. A diamond may be forever, but is the DeBeers cartel? 1. Mechanisms De Beers has used to
a) ensure that prices remain consistently high in the global diamond market
- By regulating the quantity and price of the diamonds in the market through the Central
Selling Organization (CSO), that served as a clearing house for the entire industry.
- By maintaining the notion that diamonds are a scarce commodity. This they did through
marketing campaings and by purchaising excess supplies when that was needed to avoid
price decreases.
b) to ensure that any deviant player is adequately punished to maintain success of the cartel
- By reducing the amount of diamonds allocated to any disobeying dealer (Israel 1970’s)
- By dismissing sightholders from the Syndicate’s diamond sightings (Israel 1970’s, Russia)
- By releasing in the market at a lower price the kind of diamonds the deviant player was
trying to sell, making prices drop (Zaire, Australia)
2. According to the theory, the deviation possibility depends only on two variables, namely the
number of firms (n) and the discount factor (δ). All other possible factors are being held constant or simply ignored. Among the most important assumptions there are:
• All players are perfectly rational,
1
• None of the firms has more power than the other in price-quantity setting, in other words there is no cartel leader,
• Monopoly profit is divided equally between all firms in the cartel, • Payoffs of all strategies are exactly known in advance by all firms, • Payoffs of all strategies are constant through the game, • δ is same for all firms and constant in all periods, • In punishment phases, the profit is zero to all firms in the cartel, • Game will be played infinitely many times or no one knows when it is going to end, and
the industry’s demand curve will be constant through out the game. Under these assumptions, cartel is sustainable if δ ≥n/(n-1). So as the number of firms increases, the sustainability of cartel will decrease. In other words,
rational cartel would try to keep the n as small as possible. When we look at the DeBeers’ cartel, we can easily see that most of these assumptions do not
hold. These is why, the theory it self is not enough to explain the all deviation related decisions of firms in the cartel, as we will try to explain below.
First of all, in this cartel, all firms do not have equal powers and/or market shares; there is an obvious dominance of DeBeers. Quantity decisions of each firm are done by DeBeers as well as the price decision. So the other firms are, in a way, price takers as in the perfect competition case. Payoffs are known for the present period only and are different for each firm. Any information regarding δ is not given but claiming that r (risk adjusted interest rate) depends on the size of the firm (and hence differs from firm to firm) would not be wrong. Lastly, and probably most importantly, the punishment phase profits are not known by the firms in the beginning of the “game”, the only available information to the firms about this profit is the punishment profits of once deviated firms which are certainly not zero and changes from firm to firm. And if one firm deviates, it was this firm only (and DeBeers itself) who is going to suffer from punishment profits, not the other firms in the cartel because DeBeers was guaranteeing a certain amount of profit to them once they agree to sell through the CSO.
Probably these are the main reasons why firms were not deviating even though n was increasing and, hence, their profits were decreasing.
In addition to these, knowing that not accepting a new firm to the cartel would mean having a
new competitor and as a result of the inevitable supply increase it would harm the scarcity notion of diamond, DeBeers was sometimes willing to increase n even though it is against the theory’s result.
But of course, the theory is still explaining, for example, why Russia in 1980s and Zaire in 70s disobeyed the cartel rules. These were because of the enormous profit potential from selling directly to the market. But apparently they miscalculated something and came back to the cartel (may be because of unknown punishment payoffs or may be simply they were not perfectly rational). Apart from a possible miscalculation, the fact that Russia was valuing a steady inflow of foreign currency more than a risky higher return was another reason for them to return to the cartel.
2
Russia’s attempt made other firms question the life of the cartel. They wanted to know it because it would change all their strategies: having big enough δ to satisfy the inequality given above was no longer enough to continue to be in the cartel.
As we tried to explain, there are much more factors than n and δ values that affects the
sustainability of the cartel.
3. “Judo Economics” refers to a situation where an entrant attacks the market of an unusually big incumbent in a small specialist segment/niche product. There is a situation of Judo Economics in this case, the entrant being Argle Diamonds Mines PLC, which was operating Australia’s most profitable mine. Argyle chose to operate in niche markets, such as rare, high priced gems or coloured gems. Argyle opted for this less aggressive strategy since all out warfare against De Beers would have provoked strong retaliation that may have doomed Argyle’s prospects (for instance the tough punishment De Beers gave to Zaire when it tried to sell on the free market. Zaire consequently suffered from a dramatic drop in its revenues.) By operating in niche markets Argyle was less likely to provoke all out warfare by De Beers. The strategy created a very profitable position for Argyle which could build an image of its own for coloured gems, especially as coloured gems are not an important part of De Beers’ marketing plan. De Beers did retaliate after sometime: • The CSO imposed price cuts for most of Argyle’s gems of industrial and near gem quality. Consequently prices for the types of stones marketed by Argyle fell sharply and in the first half year of 1997 Argyle reported a set back in sales and profit. • It decreased the fraction of Argyle’s production that De Beers agreed to purchase to 85%. Argyle threatened not to renew its marketing contract with the CSO, but De Beers’ inflexibility eventually led to Argyle breaking away from the cartel in 1996. A possible reason for De Beers’ retaliation was to create a reputation of aggression i.e. send a signal to the industry that selling outside the CSO, even if in specialist segments, would not go unpunished. This ensures De Beers’ pre-eminent control over price and quantity in the industry.
4. Until 1997, De Beers in order to maintain its monopoly focused its efforts on maintaining power in distribution through the Central Selling Organization (CSO), the marketing tool of De Beers. CSO regulated the quantity and price in the market. • As it is said in the case study, packages of diamonds were bought and sold at sights, held ten
times a year in London, on a take-it-or-leave it basis. • Then it was considered a privilege to attend these sights and no dealer dared to refuse a
package offered to them, because if they did so the probability of attending the next sight was minor, if not zero.
• So CSO, and hence De Beers, enjoyed their power since over 80% of the world’s diamonds were traded through it.
• However, from 1997 and on the market for diamonds became more and more competitive. • Therefore, De Beers had to build up a loyal supportive base in order to sell their output. • So they introduced a strategy called “Supplier of Choice” (SoC), which included also a re-
evaluation of current and potential sight holders through certain objective criteria like market position, financial standing, marketing strengths etc.
• Through this scheme, De Beers wanted to distinguish the more promising sight holders in order to invite them to benefit from a closer relationship with the company. (At the end of 2003, 25% of sight holders were disposed)
• De Beers guaranteed a steady supply of diamonds and the support of marketing activities of its sight holders through its “Added Value Services”.
3
(Refer also to APPENDIX 2 in the update of the case study)
5. In the midst of its civil war, Angola producers increased the supply of rough diamonds by selling
them directly in the market while maintaining its agreement with De Beers. But De Beers didn’t inflict any punishment on these producers. The main reasons are stated as follows.
1. Angola was not quite big enough to destabilize the cartel on its own. 2. Angola problem was never perceived as a long-term threat to the CSO but a product
of the political turmoil in country at that time. 3. Angola’s supply of diamond is far from predicable and outside the De Beers’ control
considering its turbulent political situation.
Angola’s diamonds are plentiful and among the highest-quality gems in the world which cost around three times as much per carat as South African diamonds. But the unceasing civil war made the production quite unpredictable. In 1992, UNITA captured from the government the Cuango vally, where some of the best diamonds lie. De Beers had to buy the smuggled diamonds on open market at huge expense because of its little choice. When UNITA withdrew, the supply of smuggle diamonds from Angola slowed to trickle. From this fact, we could conclude that the supply of diamonds was quite unstable due to the situation of civil war and that was outside De Beers’ control. So De Beers wouldn’t observably change the supply of diamonds even inflicting any punishment on Angola’s producers.
6. For over a century De Beers role has been the one of guardian of the whole industry. Every time
it tried to prevent the threats by buying extra gems on the market and stocking piles of gems unsold. It negotiated with countries all over the world. But the cultures and selfish desires unstable this strategy. The efforts to by-pass the selling of diamonds through CSO has increases in the 1990s to a level it was too costly even for a large company as De Beers. The major problem was caused by the continuous discovering of new mines all over the world. The production share of the De Beers was just 44% in 2002 while the market share went down from 80% in the old days to 65% in 1999. Great number for a market leader, but not enough to maintain the position of the custodian and the monopoly of the whole industry.
In the late 1990s a necessary of a re-focus of the top strategy was necessary. The motto “ A
diamond is forever” made no sense in the new scenario. De Beers did not represent the entire industry any more, it became just the top dog of it. The left 35% of the market share could benefit of the huge advertisement campaign of De Beers without incurring in the cost. Furthermore, the marketing cost did not produce any premium over the customer prize as the De Beers diamonds were not differentiated.
At the beginning of the new century, De Beers announced the change of its strategy. The Central
Selling Organization became Diamond Trading Company (DTC) which a new logo Forevermark inscribed into its stones to ensure its quality so that the sightholders can use it to justify a high quality and receive a premium prize from the customers.
De Beers tried to enlarge and keep the cartel together until it could. It has been successful for a
lot of years, so that there was no need to change completely its strategy until now. In the 1990s we assisted to the last efforts of the De Beers to keep on with the old strategy so that it occurred in loss of profit. But this behavior was reasonable. A cartel is much more profitable for the companies than a competitive market. De Beers changed strategy at the right time, when it
4

understood that its efforts would be much more costly in the future. And it changed it before incurring in heavy losses.
It is more interesting to understand why DeBeers cartel failed and other, for example the OPEC
one, does not. Firstly, in OPEC cartel there is not such a leader country as De Beers was. De Beers was not
flexible in the negotiations, so that the great advantages of its deals were for De Beers and not for the other party. This created tensions and envy in the cartel forecasting greater profits in leaving the cartel.
Then oil does not need a marketing campaign to create an image that it is worthy by the
customers much more than an assembly of carbons. The free riding in marketing was one of the greater reasons for De Beers’ change of strategy.
5
“De Beers and Beyond: The History of the International Diamond Cartel” by London Business School Jewellery diamonds are unjustifiably expensive, given that they are not scarce and would cost only $2 to $30 if put to industrial use. This has been mainly due to De Beers maintaining a unique purchasing and marketing cartel. Lately more and more players have been ready to challenge the cartel. - Diamonds were first found in South Africa in 1867 (prior to which there were only diamonds in India and Brazil). The scarcity of resourceful land and the need of a minimum infrastructure forced miners to live together. Digger committees were formed that fought off latecomers and gave out claims in a region. Scale concerns made claimholders merge with bigger claimholders. Equipment for digging was hired by groups and hence cooperation was intensified. - 1880, Rhodes (a businessman) started De Beers and by 1887 it was the sole owner of South African diamond mines and he managed the distribution channels (merchants abided to Rhodes’ terms of business because they had similar interests in high prices and a sense of scarcity). - Oppenheimer (a German businessman) noticed that De Beers cartel might not be sustainable in the long-run since there was an incentive for members to break away in the expectation of higher quantities and prices. New diamond reserves in Australia, Siberia and Western Africa also added to the difficulty. In 1926 Oppenheimer gained full control of De Beers. He made members sign an exclusive dealing requirement (i.e. making outside contracts almost impossible). Structure of De Beers * A subsidiary of De Beers buys all the diamonds from all producers (incl. De Beers’ mines itself, which represented about a ½ of total supply). * Each year De Beers determines the total amount of diamonds it plans to sell in the market (each producer gets a certain % of total output, De Beers buys their diamonds and markets them through its Central Selling Organization (CSO)). * The CSO regulates the quantity and price in the market. Diamonds are bought and sold at sights, held ten times a year, few dealers refuse a packet of diamonds offered to them. Haggling over price and quantity could lead to dealers not being invited again (80% of the world’s diamond supply used to go through the CSO, now it’s between 65-75%) * De Beers keeps diamonds a scarce commodity by purchasing excess supplies and through advertising. Beneficial for producers, they are provided with a steady inflow of foreign currency. Beneficial for dealers, as they enjoy stable price increases, which are passed onto consumers. De Beers benefits by charging handling fees, there is a large incentive to by-pass the CSO.
Threats to the cartel - Diamonds were held for investment purposes in Israel (especially in the 70’s when there was high inflation). This artificial reduction of supply led to high prices, but De Beers had no more control over how many diamonds were in the market (i.e. it did not want diamonds to be resold). This created room for speculation on diamond prices. De Beers solved this by: 1. levying a surcharge on diamonds sold through the CSO, which it could easily withdraw if it suspected speculation (hence dropping prices of diamonds drastically). 2. De Beers warned the Israeli dealers that they should not disobey the CSO or their orders would be cut by 20%. 3. Israeli dealers continued and finally they were excluded from the sightings (the highest penalty). Prices came back to normal and Israel complied again, however, it had paid a high price of defection. However, De Beers also suffered as they had to buy up the large quantities that speculators decided to sell (Stocks of De Beers were worth $2 billion in 1984). - Zaire, who contributed less than 3% to world output, undercut the cartel by selling some of its stocks in the free market for industrial diamonds. De Beers reacted by selling some its stocks and Zaire saw its revenues drop drastically as diamond prices dropped. It soon obliged again. - Large quantities were discovered in Serbia in 1957, which presented about 20-30% of world production. De Beers negotiated a deal with the Soviet government that 95% of Russia’s diamond output would be channelled through the CSO. The Soviet Union realized the potential from undercutting the cartel (Soviet Union was in political turmoil and required foreign currency inflow). De Beers conceded by buying up all of the Soviet Union’s supplies (i.e. providing a steady inflow of FX) and the Soviet Union decided to comply. Other suppliers saw this happen and forced De Beers to concede a price increase of 7.5% otherwise they would join Russia. - October 1987, investing in diamonds became attractive again especially with the stock market crash. De Beers raised prices at sightings and discouraged purchasing for investment purposes, but members did not comply and either resold packages at a premium or built up their own supplies. De Beers replied by managing demand (i.e. targeting new consumers group (e.g. males) and stressing that “diamonds are forever”, thus not to be resold!). - Large discoveries in Australia posed a new threat, similar in size to Russia’s. Argyle Diamonds Miners Plc. entered niche markets for diamonds, such as rare high-priced coloured gems, hence not upsetting the industry leader. De Beers cut prices and the quantities it sold of Argyle’s diamonds. Argyle disagreed and broke away from the cartel. It has since marketed diamonds independently. - Angola, a small producer, but it deviated from the cartel by increasing supply. De Beers left it unpunished. - Large discoveries in Canada led to a battle for exploration between De Beers and Australia’s BHP. BHP won and De Beers has been encouraging it to sell through the CSO but BHP fears an anti-trust investigation by the US. - Beginning of the 1990’s, Russia was in need of hard currency and credit (using its vast diamond supplies as collateral). Russia signalled to the De Beers its size of

diamond stockpile (about 200 million carats), this would be enough to form a distribution cartel similar to the CSO. But if Russia cannot guarantee a buyer nobody will give it a loan. Russia ‘leaked’ about $800 mln. Russia made new demands to the CSO (a larger share of sales, higher prices and a seat on the board). De Beers saw that there was a conflict of interests between state-run firms (wanting short-run foreign currency cash flows) and other mining firms (that sought high prices and limited supply). In 1996 De Beers ended its agreement with Russia and Russia wanted to re-negotiate. De Beers also saw that Russia would be important to the cartel and it started to gain control over the Russian diamond industry by buying up assets. - Threats are occurring at shorter and shorter time intervals.
“De Beers and Beyond: An Update (1997-2003)” by Reichel and Kretschmer (London School of Economics) * In the last century De Beers has kept diamonds precious by buying up of excess supply and stockpiling it to protect prices and by advertising. * Late 1990’s, diamond market increasingly competitive (market share decline from 80 to 65% in 1999). The market was characterized by flat demand and excess supply. De Beers had to change. 3 main areas of change for De Beers:
1. Increasing efficiency and cutting costs by 15% (increase transparency and customer-focus)
2. Go private to avoid shareholders’ demands for short-term profit 3. Supplier of choice strategy by promoting more competition downstream while
binding them close to their upstream business Further detail on changes 2 and 3: 2. Throughout history De Beers had to decrease profits to balance the market (prevent excess supply and sanction competitors). It hence realized it had to ensure long-term profits rather than for short-term minded shareholders. 3. * Foster advertising and branding efforts by downstream firms and bind customers close to the upstream business (i.e. producers). It reviews those that it sells to by looking at their financial standing, market position and distributional and marketing strength. These sight holders then benefit from De Beers steady supply of diamonds and marketing activities. * A primary goal was to initiate consumer demand where retailers create their own brand and advertise (i.e. more effective because it is closer to the customer). BUT, the growth of the industry continued to underperform and it was clear that downstream retailers were free-riding on De Beers marketing efforts. De Beers made the decision to choose only the best retailers and train them in marketing and advertising. In addition, its diamonds were now inscribed with the new name of the CSO, which was now ‘diamond trading company’ * Competition in branding developed, especially as De Beers lost its grip on the industry. Other diamond suppliers, such as BHP and Alrosa, now needed to create a brand. De Beers did this by creating a joint venture with LVMH (seeking a price premium of 25-30% over unbranded jewellery). There is hence a trend towards vertical integration of producer and seller. De Beers was successful because it already benefited from a strong brand name among consumers (this resulted in network effects downstream). Further developments in operations and exploration: * De Beers is still having trouble in establishing itself in the Canadian market, worth 17% of the total market. Other firms are buying up mining companies. * Continuously improving its ties with Botswana and Namibia * Civil war in Angola and the Congo has challenged the cartel. United Nations has started investigations into De Beers exploiting the natural resources of the Congo.
* Russia is still a concern. In 2001 the official contract between Alrosa, from whom De Beers bought diamonds, and De Beers ended. New agreement to buy $4 billion a year is under review by the European Commission for abuse of market position by De Beers. The question remains whether Russia benefits from a fixed contract with De Beers or is it better off exploring other opportunities and selling on a willingly basis with De Beers? Challenges to the diamond market: * Expected to grow by 4% over next 10 years * Greater demand from developing countries, such as India and China * Experts believe 50% of value increases will be because of price increases rather than higher sales. Does this contradict De Beer’s demand-driven strategy? * Intensified advertisement and branding will lead to higher costs and higher prices will lead to consolidation of retailers. Currently, there are 130 different diamond brands, the market can simply not sustain this. * Downstream firms have been stockpiling, as De Beers has been selling off its stockpiles in recent years, in the anticipation of price increases and low interest rates. Conclusion Diamonds industry has become increasingly competitive up and downstream. It remains to be seen whether the supplier of choice strategy will defend De Beers from further challenges in the future. “Angolan Diamonds. De Beers’ worst friend” by The Economist Angola produces 15% of the world’s output of diamonds. They are the high-quality gems, costing around 3 times as much as South African diamonds. Civil war has been diamond production by Angola highly volatile. In 1992 UNITA captured the Cuango valley, where some of the best diamonds lie, they have been producing and smuggling out large quantities of diamonds. De Beers had no choice but to buy them up in the market. Since then the government has regained control over the Cuango valley and has started to hand out concessions to miners to mine for diamonds. De Beers has been lagging behind to its rivals in acquiring these concessions. Other firms and especially Russia have been interested in dealing with these mining and production companies outside of De Beers cartel. De Beers is trying to persuade producers from Angola to sell through it CSO (especially a large consortium in the Cuango Valley). However, Angola is unwilling to comply since they remember the times when De Beers charged them huge fees and hence they were underpaid for their gems. Whether De Beers can re-gain control depends a lot on the political situation, but it seems not wise to bet on a total re-gain of control. “De Beers is it” by The Economist Global demand has fallen by 5% in 1998, especially driven by a 20% decrease in Japan’s retail market, posing a new threat to De Beers. The CSO absorbs this drop in retail demand by restraining supply. But De Beers cannot sustain this forever,
especially since it is highly costly to stockpile (even before the fall in demand De Beers had about $4 to $5 billion worth of stock). Supply is also conspiring against De Beers (2 mining firms in Canada are threatening to flood the market). Analysts believe Canada’s output could boost sales outside the cartel by a 1/3rd. This would make it costly for De Beers to keep prices up. If the cartel’s market share dropped there would be no incentive for any producer to promote diamonds (i.e. defection is detrimental to all). Advertising has become increasingly important for De Beers. Even if diamonds become like any commodity market De Beers is likely to remain market leader, since it has lowest costs and its mines produce half of the world’s gems. However, De Beers margins have shrunk already and in such a scenario they would shrink even more. * De Beers could avoid commoditisation and providing a free ride to its rivals by advertising only its own diamonds. The brand could be used as a signal to consumers, who currently cannot distinguish a $10,000 diamond from a $100,000 diamond. De Beers is currently etching in its logo into the diamonds it sells. * Meanwhile De Beers continues to concentrate on controlling supply through joint ventures (in Angola its improving its political connections and buying mines). * The author believes De Beers dominance is likely to erode. It could become the Coca-Cola of luxury brands- a giant that faces competition elsewhere, but still has the distribution and marketing to set prices in many markets.
Notes on how I would answer the questions discussed in class Q1: Describe mechanisms (with examples) DeBeers has used to (a) ensure that prices remain consistently high in the global diamond market; and (b) to ensure that any deviant player is adequately punished to maintain the success of the cartel. - To keep prices high it has used the CSO as its main mechanism, where it allocates the production it has bought up from producers and does so in order to sustain scarcity and hence high prices in the industry. It has also advertised its diamonds heavily to retailers. - In order to do this it has had to ensure that it had full control over production. There was a clear incentive for especially large producers to deviate and increase their own quantities and profits. It has used several mechanisms to sustain collusion: *sell through a central organisation, *punish deviators by excluding them from the sales *advise deviators of the benefits of the cartel (e.g. Israel) *Flood the market to diminish benefits in case of deviation (e.g. Zaire) *More recently it has concentrated more on demand and ensuring a strong downstream brand of diamonds sold through De Beers Q2: Consider the price cartel model dealt in the second handout. In the model, the discount factor δ can be interpreted as 1/(1+r) where r is the risk adjusted interest rate (nominal interest rate plus a risk premium rate). Note that in times where the future becomes more uncertain and people are risk averse, the required risk adjusted return (interest rate) will be higher and consequently δ will be lower. Use the conclusion of the model (always remembering that the model is simple and hence cannot capture all the richness of reality) to shed light on the actual fortunes of the diamond cartel in the past and more recent times. - When the future becomes more uncertain it is discounted heavier to account for the higher inherent risk. In cartel formation and sustainability members discount the future payoff from cooperation and if that is higher than their discounted payoff from non-cooperation they will cooperate. - In the case of the De Beers cartel this can be applied nicely. As more players entered the future of the cartel became increasingly uncertain (as coordination and observance became more difficult) and hence the discount factor decreased (i.e. higher r) making cooperation less likely. - Also, we could say that the game became increasingly to look like a finite game (hence increasing the incentive to deviate in the short-run even more). - In addition, large suppliers often sold some of their production outside of the CSO. This added to the uncertainty for members, especially as large suppliers, such as Russia and Canada did this. - Random shocks to supply (e.g. in case of the civil war in Angola) reduced the incentive for De Beers to use the grim trigger strategy (i.e. exclude Angola from further cooperation).
Q3: ‘Judo Economics’ refer to a guerilla warfare situation where an entrant attacks the market of an (usually big) incumbent in a small specialist segment/niche/product. If the entrant attacks the whole market of the incumbent, the incumbent could retaliate very strongly and this coupled with the already established reputation of the incumbent might doom the prospects of the entrant. Recognizing the futility of an all out warfare, the entrant attacks a small segment/niche/product hoping that the incumbent will find it too costly to start a price warfare in this small segment as this could depress the price/reputation of the incumbent across the incumbent’s whole spectrum of products. An example could be Easyjet’s (mid 90s) entry into low margins no frills airlines market in UK (serving some popular routes within UK and a few not so far away airports in the continent) where British Airways was the targeted incumbent. For quite sometime, BA did not retaliate for fear of depressing prices over much larger volumes of traffic. It also hesitated to take on Easyjet specifically in the no frills segment as this could tarnish BA’s reputation in the top end of the market (which was BA’s focus). Finally, after some years erosion of profits, BA introduced a new company called ‘Go’ which was to take on ‘Easyjet’ directly, though by this time Easyjet was well established. In this case, there appears to be a situation of ‘judo economics’ attempted by an entrant. Identify the entrant and explain this move. However, Debeers did retaliate after sometime. Explain this move of Debeers. Q4: Explain how DeBeers organizes its sightings (where diamonds are sold to dealers through the Central Selling Organization). Explain how the principle works for DeBeers? Q5: When Angola went into civil war and started exporting rough diamonds directly to the market, DeBeers did not inflict any punishment on the Angolan diamond producers. This was very unlike DeBeers’s reaction to other deviant producers. What might have prompted DeBeers not to react? Q6: Discuss Debeer’s branding efforts (from the second article from ‘The Economist’). Should Debeer’s have attempted this earlier?
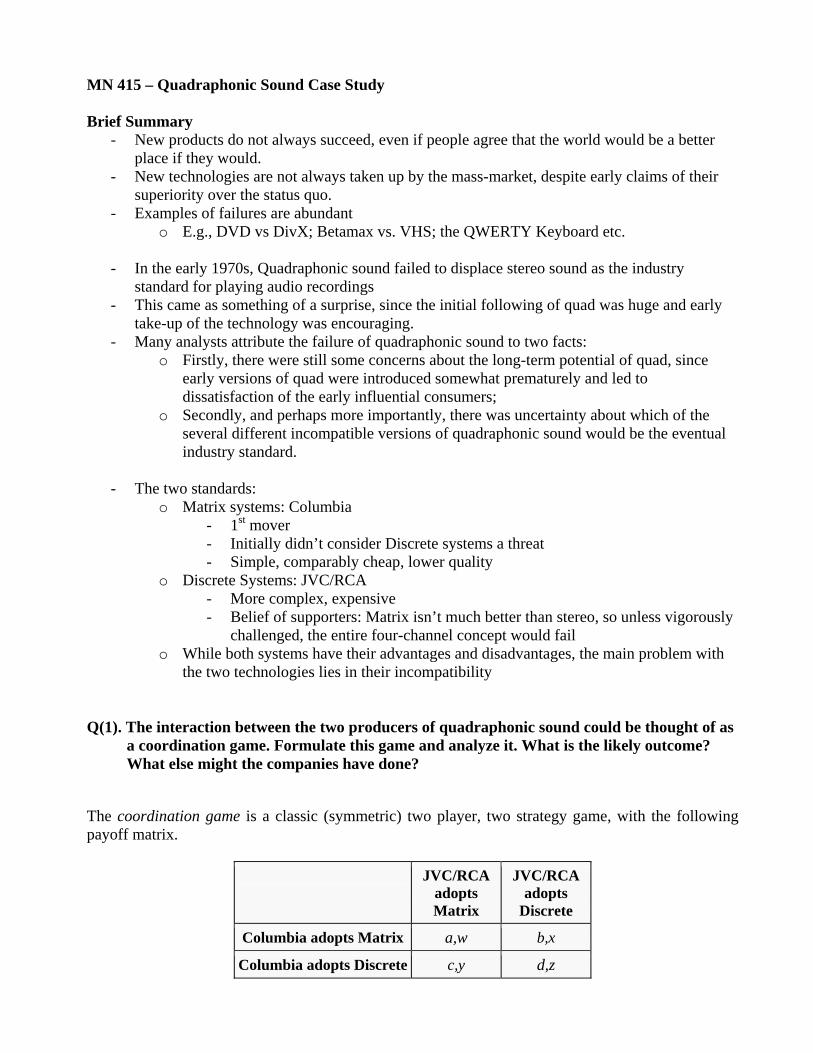
MN 415 – Quadraphonic Sound Case Study Brief Summary
- New products do not always succeed, even if people agree that the world would be a better place if they would.
- New technologies are not always taken up by the mass-market, despite early claims of their superiority over the status quo.
- Examples of failures are abundant o E.g., DVD vs DivX; Betamax vs. VHS; the QWERTY Keyboard etc.
- In the early 1970s, Quadraphonic sound failed to displace stereo sound as the industry
standard for playing audio recordings - This came as something of a surprise, since the initial following of quad was huge and early
take-up of the technology was encouraging. - Many analysts attribute the failure of quadraphonic sound to two facts:
o Firstly, there were still some concerns about the long-term potential of quad, since early versions of quad were introduced somewhat prematurely and led to dissatisfaction of the early influential consumers;
o Secondly, and perhaps more importantly, there was uncertainty about which of the several different incompatible versions of quadraphonic sound would be the eventual industry standard.
- The two standards:
o Matrix systems: Columbia - 1st mover - Initially didn’t consider Discrete systems a threat - Simple, comparably cheap, lower quality
o Discrete Systems: JVC/RCA - More complex, expensive - Belief of supporters: Matrix isn’t much better than stereo, so unless vigorously
challenged, the entire four-channel concept would fail o While both systems have their advantages and disadvantages, the main problem with
the two technologies lies in their incompatibility Q(1). The interaction between the two producers of quadraphonic sound could be thought of as
a coordination game. Formulate this game and analyze it. What is the likely outcome? What else might the companies have done?
The coordination game is a classic (symmetric) two player, two strategy game, with the following payoff matrix.
JVC/RCA adopts Matrix
JVC/RCA adopts
Discrete
Columbia adopts Matrix a,w b,x
Columbia adopts Discrete c,y d,z
The payoffs are according to a>d>b; a>d>c; z>w>y; z>w>x. The players should thus cooperate on either of the two strategies to receive a high payoff; in other words, they should agree on adopting one technology which is to become the market standard. If they fail to do so, few sales result. Moreover, the example of quadraphonic sounds shows that such failure might also result in failure of both strategies. Both (a,w) and (d,z) are pure strategy Nash equilibria. This is a coordination game where a different pure strategy equilibrium is preferred by each player. In the Columbia-JVC/RCA game, for instance, Columbia, which specializes in the production of Matrix systems, would prefer the (a,w) equilibrium because its payoff (a) would be higher than the payoff (d)it would receive in the (d,z) case. Yet, while Columbia prefers the production of Matrix systems, its second best option would be (d,z) rather than (b,x) (remember: a>d>b). The same holds for JVC except that JVC’s first option would be (d,z), followed by (a,w). Either equilibrium (i.e., joint decision to go for one technology) thus results in higher payoffs than the strategies where the players specialize in different technologies.
Q(2). What are the externalities in this case (externalities are benefits and costs that one party
creates for another but which are not directly transacted through the market)?
- Network effects exists if consumption benefits depend positively on the total number of consumers who purchase compatible products. If the network effect is direct, as in a physical network, increases in the number of consumers on the same network raise the consumption benefits for everyone on the network.
- In this case: the consumption benefits of the hardware are increasing the variety of compatible software. A virtual (or indirect) network effect arises because increases in the number of users of compatible hardware increase the demand for compatible software and hence the supply of software varieties: the increase in the availability of software varieties increases the benefit to all consumers who adopt compatible hardware. These consumers make up a virtual network
o The effort to establish quadraphonic sound in the home audio market failed, because there was not enough four- channel software produced for the quad hardware. It is especially the relationship between hardware and software that generates the network externalities
- A network benefit in the quad case would be the increased availability of records as the customer base grows
- A network cost from the producers’ perspective would be competition for the customer base. o From the Artists’ point of view, costs include:
Little financial incentives to record work in quad under conventional recording contracts
Feared that poor quad reproduction might hurt their reputations due to technical problems
- Externalities furthermore depend on expectations of customers regarding the future size of
the network. These expectations depend on the installed customer base; they are decisive in the acceptance and adoption of the products in question. In light of quadraphonic sound, this implies that customer expectations that one technology will become the market standard could
indeed have lead to that technology becoming the standard (instead, the whole technology failed).
- In the long run, the co-existence of competing incompatible technologies is unlikely. Rather, a small initial advantage might influence customer expectations about the adoption of a particular standard (this could be seen as a cost by one producers and a benefit by the other). This in turn will lead to more customers adopting the standard. Because the value of the product increases in the number of adopters, the value of the network increases to future adopters such that this technology becomes the market standard.
Summary:
- The attempt to introduce quad technology resulted in enormous costs to both consumers and producers because the existing coordination problem confused customers. Joining the network requires a sunk investment (for consumers). If the network does not grow adequately or, in the worst case, is abandoned, consumers are trapped with an “orphan” technology. In other words, expected network benefits will not be realized and consumers may be unwilling to join the network. This problem is particularly severe where the successful diffusion of a product depends on the availability of complementary products (records, in our case).
o Confusion among the public about the nature, performance and operating characteristics of quad and merits and demerits of matrix vs discrete technology, prevented four channel of becoming the next step after stereo (disillusionment was setting in by the end of 1974)
o Missing optimism from retailer side and insufficient promotional effort; Owing to “Quad wars” instead of concentrated efforts to promote quad in general, system- specific appeals were much less subject to free- riding inefficiencies
collusive arrangement on promotion between rivals could have helped to clarify the confusion and scepticism of the consumers towards the quad
Q(3). Who would stand to lose from a transition to Quadraphonic sound? To win?
- Losers: o Artists b/c producing according to quadraphonic standards is costly (plus: there are 2
different standards, which makes production even more costly) quality issues
o Consumers – have to decide on one system; incompatibility of the two systems (i.e., if they own one system they can only buy the disks for that system. The other ones will work but only in stereo quality, meaning that they are not better off but worse)
o Producers (the ones of the technology that doesn’t make it) - Winners:
o Retailers o Consumers (the ones that believe Quad sound to be superior to stereo sound) o Artists (sales increase if consumers switch technologies?) o Producers of the new technology would win once the installed customer base is large
enough
Q(4). Think of reasons why a single superior technology may not replace an older, inferior one. Are they present in this case?
- utility - compatibility - price - wrong entry point/strategy - poor advertising of advantages - lack of standardized technology among producers - poor quality of technology - if the installed customer base does not grow rapidly enough, then the utility customers get
from switching is too small (e.g., in this case – the sound libraries were too small) Externalities (compare Q2)!!
Q(5). What would you have done if you were one of the Quad producers? In other words,
what drove the result of quadraphonic failure? - wrong entry point/strategy - poor advertising of advantages - lack of standardized technology among producers Two possible reasons for failure: [1] The confusion of customers. The introduction of a competing, yet incompatible technology confused both existing and potential customers as well as suppliers of records (artists and record companies). Both technologies were introduced too early (and prematurely), which disappointed early customers. These are the customers who usually start off the desired bandwagon effect. In addition, the introduction of the second technology gave rise to uncertainty about which technology would become industry standard. This also holds for artists and record companies, who were mostly reluctant to switch because they didn’t know which format to produce (producing both would have been very costly). [2] The early “success” of the technology might have prevented long-term success of the quadraphonic technology. Initially, the number of early adopters was quite promising. However, the introduction of a second, incompatible technology split the market and lowered expected future benefits. This lead potential customers, whose main concern was the availability of software (which was not given owing to the market splitting between discrete and matrix) to abstain from switching to quadraphonic sound. Rather, they stayed with the old stereo systems. What could they have done?
collusive arrangement on promotion between rivals could have helped to clarify the confusion and scepticism of the consumers towards the quad.
Strategic Aspects of Innovation BDSS-Ch 13
MN-416
CREATIVE DESTRUCTION Some firms exploit opportunities for creating profitable competitive position that other firms either ignore or cannot exploit. Markets have quiet periods where they have developed products and technologies that earn positive economic profits. These quiet periods are punctuated by shocks or discontinuities that replace old resources with new ones. Entrepreneurs exploit opportunities created by these shocks and achieve positive profits in next period of quiet. Schumpeter calls this evolutionary process creative destruction. Schumpeter believed that static efficiency was less important than dynamic efficiency which achieves long term growth and technological improvement. There is also the concept of destructive technologies. This is well explained with the help of following examples: • Personal computers replacing powerful mainframes • Ink jet printers replacing high visual resolution laser printers • Email replacing snail mail and telephone Prahalad and Hamel introduced the concept of strategic intent, which means the obsession to achieve a particular goal. They also talk about strategic stretch, which is the stretch between ambition and resources. Companies have to expand and adapt their current stock of resources, and create new ones. Richard D’Aveni talks about hyper competition and argues that a firm’s chief strategic goal should be to disrupt existing resources of advantages in the industry and create new ones. A firm that rests on its laurels, seeking to harvest from existing sources of advantages, will be quickly replaced by more innovative rivals.
THE INCENTIVE TO INNOVATE Business history has many instances when big companies with large resource base were either overtaken or their market position eroded by smaller resource base companies. Explanation is that small firms are nimble and less bureaucratic, thus willing to innovate and break established practices. There are 2 forces which make it rational for firms not to innovate: 1. Sunk cost effect: It arises when firm has committed its resources and organizational
capabilities to a particular technology, and thus find it less valuable to switch to another technology. A firm that has not yet committed to a technology can compare costs of alternate technologies under consideration and is not biased.
2. Replacement effect: According to Kenneth Arrow, an entrant would be willing to
spend more than the monopolist to develop an innovation, assuming that they both have equal innovative capabilities. By innovation an entrant can replace the monopolist, but the monopolist can only replace itself.
Efficiency effect: This comes into play when incumbent monopolist anticipates that the entrant may also have the same opportunity to innovate. We compare the following to understand this: (1) loss in profits when monopolist becomes one of the 2 competitors in a duopoly. (2) the profits of a duopolist. In most cases (1) is larger than (2). Monopolist has more to lose from another firm’s entry than the firm has to gain from entering the market. Entrant takes business away from the monopolist and also drives down prices. This makes incentive of incumbent to innovate stronger than that of entrant. INNOVATION COMPETITION It is critical to anticipate a rival’s response to amount of R&D. The advantage of the first mover is to protect its ideas with patents and trademarks. Patent races: The term patent describes the race between firms to innovate first. The firm which wins the patent race obtains exclusive rights to develop and market the product. Failure to anticipate competitor’s investment in R&D may prove costly for a firm. Following areas need due consideration: 1. How much does investment increase R&D productivity- if diminishing returns, R&D
may not improve chances to win patent race.
2. Response of other firms to this increase in R&D expenditure – this will influence
profitability depending on increasing or decreasing returns. 3. Number of competitors – if diminishing returns to R&D, several small firms are a
threat to innovation. If increasing returns, then one large firm conducting extensive R&D is a formidable competitor.
Choosing the technology: Firms can select form a variety of technologies. 2 major dimensions which influence the choice are: 1. Riskiness of methodology. 2. Degree to which success of one technology is related to the success of another. EVOLUTIONARY ECONOMICS AND DYNAMIC CAPABILITIES The ability of a firm to maintain and adapt the capabilities that provide it with competitive advantage is referred to as its dynamic capabilities (Tecee, Pisano and Shuen). Firms unable to do so eventually get supplanted. Due to the following reasons, a firm’s dynamic capabilities are limited: 1. Learning is incremental than path breaking – It is difficult for a firm to ignore its past
while conceptualizing new routines. The search is path dependent i.e. depends on the path a firm has taken in the past to get where it is now. This makes it hard for a firm to adapt minor changes in technology.
2. Firm’s dynamic capabilities are complementary assets – A change in organizational
routine may give rise to sunk cost effect, thus reducing the likelihood of change. 3. Windows of opportunity – Over time, a narrow set of design or product emerge as
dominant. Learning curve, effect, network externalities and sunk cost effect take over and firms are reluctant to adapt to new technologies.
THE ENVIRONMENT Porter views competition as an evolutionary process. It involves recognizing new technologies and markets, and moving aggressively to exploit them. Porter identifies the following 4 attributes that promote or impede a firm’s ability to achieve competitive advantage: 1. Factor conditions: Describes position with regard to factors of production. The
important fop’s are highly specialized to the needs of a particular industry. 2. Demand conditions: These include size, growth and character of home demand.
Sophisticated customers or unique home conditions stimulate innovation. 3. Related supplier or supporting industries: Firms with home market advantage are
favorably positioned to achieve global competitive advantage. Companies with skillful home based suppliers can be early beneficiaries of new production now-how and may shape innovation in supplying firms.
4. Strategy, structure and rivalry: This includes local management practices,
organizational structures, corporate governance and nature of local capital markets. Firms that survive vigorous local competition are usually more efficient and innovative than international rivals.
MANAGING INNOVATION According to Rosabeth Canter, innovation is bringing a new problem solving idea into use. In addition to internal development, strategies such as spin-offs, joint ventures and alliances can facilitate entry to new business or develop new capabilities. A firm faces a dilemma in managing its innovation activities. On one hand, formal structure and controls are necessary to co-ordinate innovative activities. And on the other hand, looseness and flexibility may foster innovation, creativity and adaptiveness to changing circumstances.
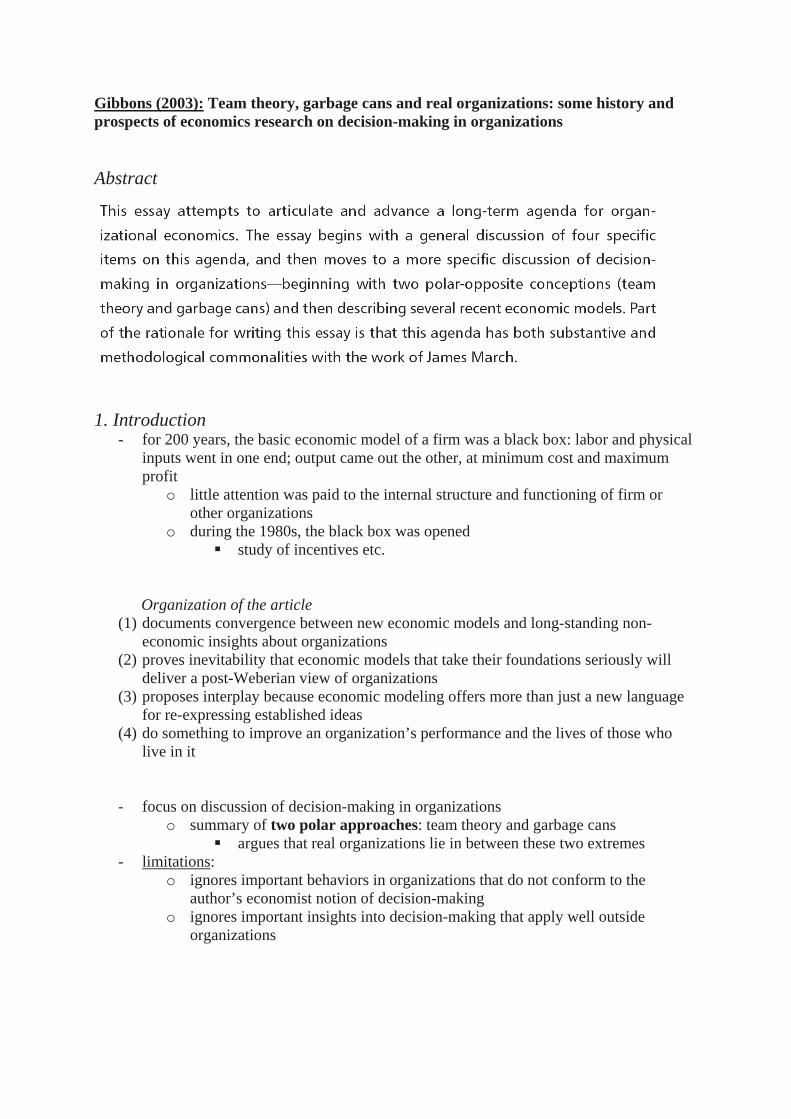
Gibbons (2003): Team theory, garbage cans and real organizations: some history and prospects of economics research on decision-making in organizations Abstract
1. Introduction
- for 200 years, the basic economic model of a firm was a black box: labor and physical inputs went in one end; output came out the other, at minimum cost and maximum profit
o little attention was paid to the internal structure and functioning of firm or other organizations
o during the 1980s, the black box was opened study of incentives etc.
Organization of the article (1) documents convergence between new economic models and long-standing non-
economic insights about organizations (2) proves inevitability that economic models that take their foundations seriously will
deliver a post-Weberian view of organizations (3) proposes interplay because economic modeling offers more than just a new language
for re-expressing established ideas (4) do something to improve an organization’s performance and the lives of those who
live in it
- focus on discussion of decision-making in organizations o summary of two polar approaches: team theory and garbage cans
argues that real organizations lie in between these two extremes - limitations:
o ignores important behaviors in organizations that do not conform to the author’s economist notion of decision-making
o ignores important insights into decision-making that apply well outside organizations
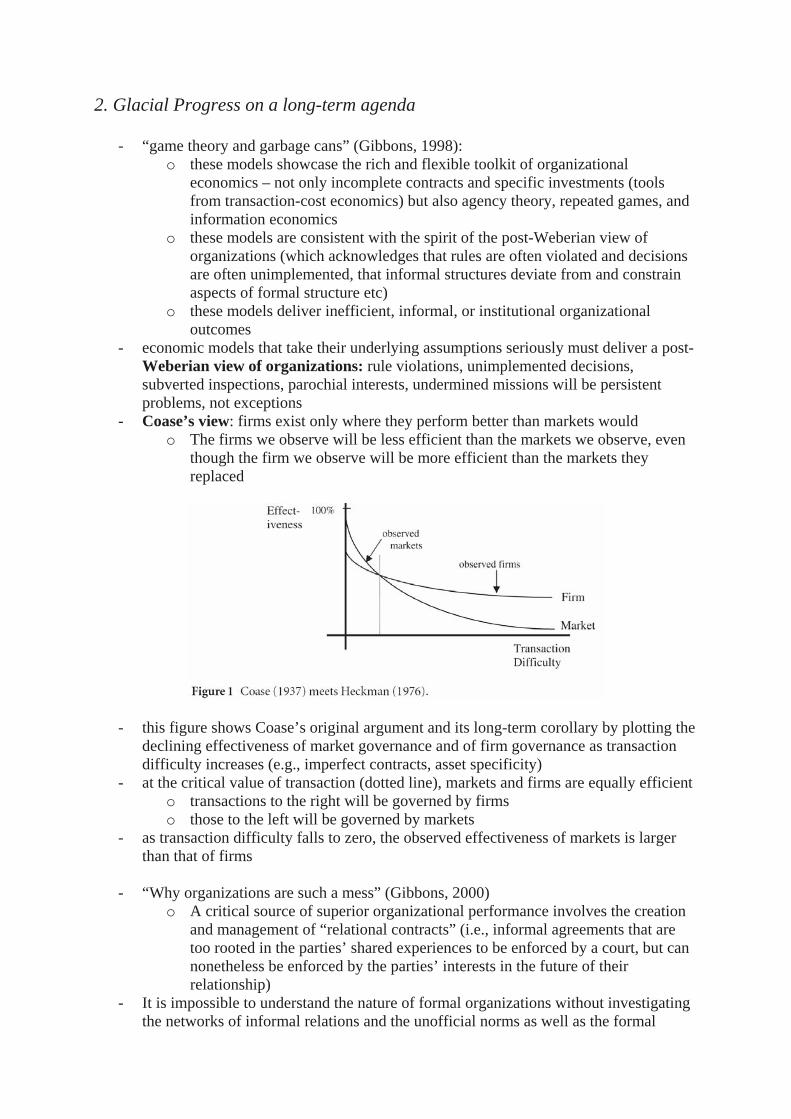
2. Glacial Progress on a long-term agenda
- “game theory and garbage cans” (Gibbons, 1998): o these models showcase the rich and flexible toolkit of organizational
economics – not only incomplete contracts and specific investments (tools from transaction-cost economics) but also agency theory, repeated games, and information economics
o these models are consistent with the spirit of the post-Weberian view of organizations (which acknowledges that rules are often violated and decisions are often unimplemented, that informal structures deviate from and constrain aspects of formal structure etc)
o these models deliver inefficient, informal, or institutional organizational outcomes
- economic models that take their underlying assumptions seriously must deliver a post-Weberian view of organizations: rule violations, unimplemented decisions, subverted inspections, parochial interests, undermined missions will be persistent problems, not exceptions
- Coase’s view: firms exist only where they perform better than markets would o The firms we observe will be less efficient than the markets we observe, even
though the firm we observe will be more efficient than the markets they replaced
- this figure shows Coase’s original argument and its long-term corollary by plotting the declining effectiveness of market governance and of firm governance as transaction difficulty increases (e.g., imperfect contracts, asset specificity)
- at the critical value of transaction (dotted line), markets and firms are equally efficient o transactions to the right will be governed by firms o those to the left will be governed by markets
- as transaction difficulty falls to zero, the observed effectiveness of markets is larger than that of firms
- “Why organizations are such a mess” (Gibbons, 2000)
o A critical source of superior organizational performance involves the creation and management of “relational contracts” (i.e., informal agreements that are too rooted in the parties’ shared experiences to be enforced by a court, but can nonetheless be enforced by the parties’ interests in the future of their relationship)
- It is impossible to understand the nature of formal organizations without investigating the networks of informal relations and the unofficial norms as well as the formal
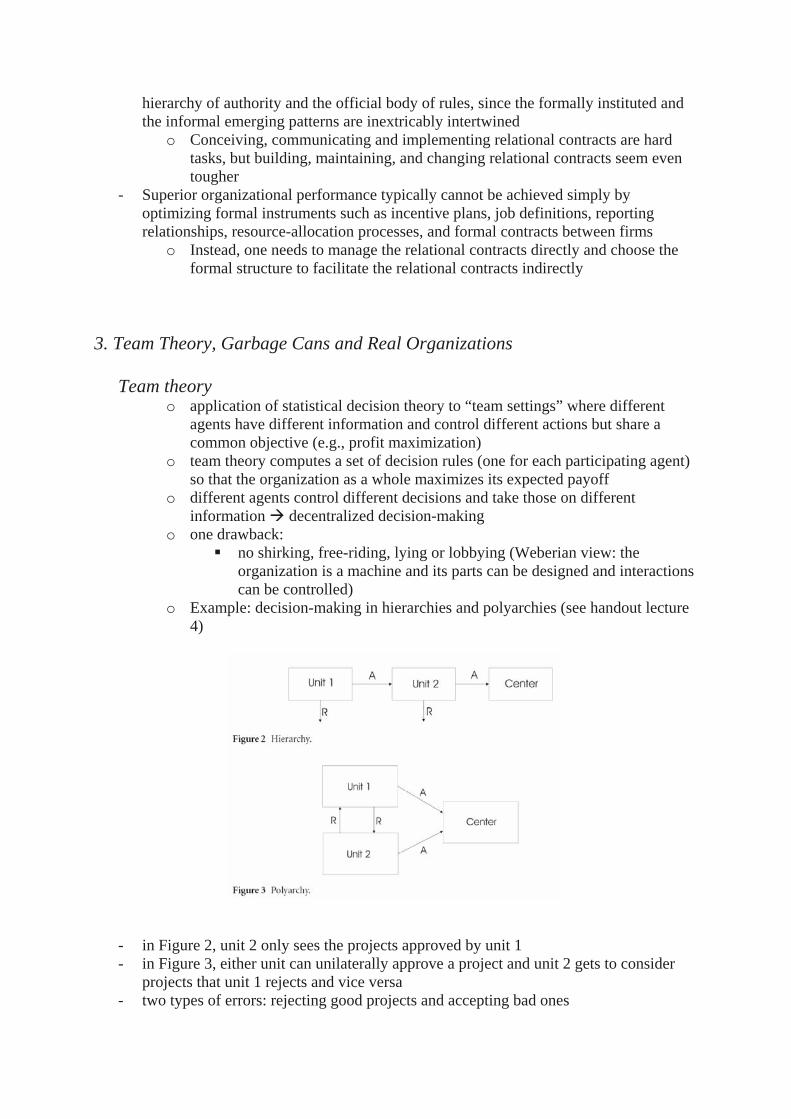
hierarchy of authority and the official body of rules, since the formally instituted and the informal emerging patterns are inextricably intertwined
o Conceiving, communicating and implementing relational contracts are hard tasks, but building, maintaining, and changing relational contracts seem even tougher
- Superior organizational performance typically cannot be achieved simply by optimizing formal instruments such as incentive plans, job definitions, reporting relationships, resource-allocation processes, and formal contracts between firms
o Instead, one needs to manage the relational contracts directly and choose the formal structure to facilitate the relational contracts indirectly
3. Team Theory, Garbage Cans and Real Organizations
Team theory
o application of statistical decision theory to “team settings” where different agents have different information and control different actions but share a common objective (e.g., profit maximization)
o team theory computes a set of decision rules (one for each participating agent) so that the organization as a whole maximizes its expected payoff
o different agents control different decisions and take those on different information decentralized decision-making
o one drawback: no shirking, free-riding, lying or lobbying (Weberian view: the
organization is a machine and its parts can be designed and interactions can be controlled)
o Example: decision-making in hierarchies and polyarchies (see handout lecture 4)
- in Figure 2, unit 2 only sees the projects approved by unit 1 - in Figure 3, either unit can unilaterally approve a project and unit 2 gets to consider
projects that unit 1 rejects and vice versa - two types of errors: rejecting good projects and accepting bad ones
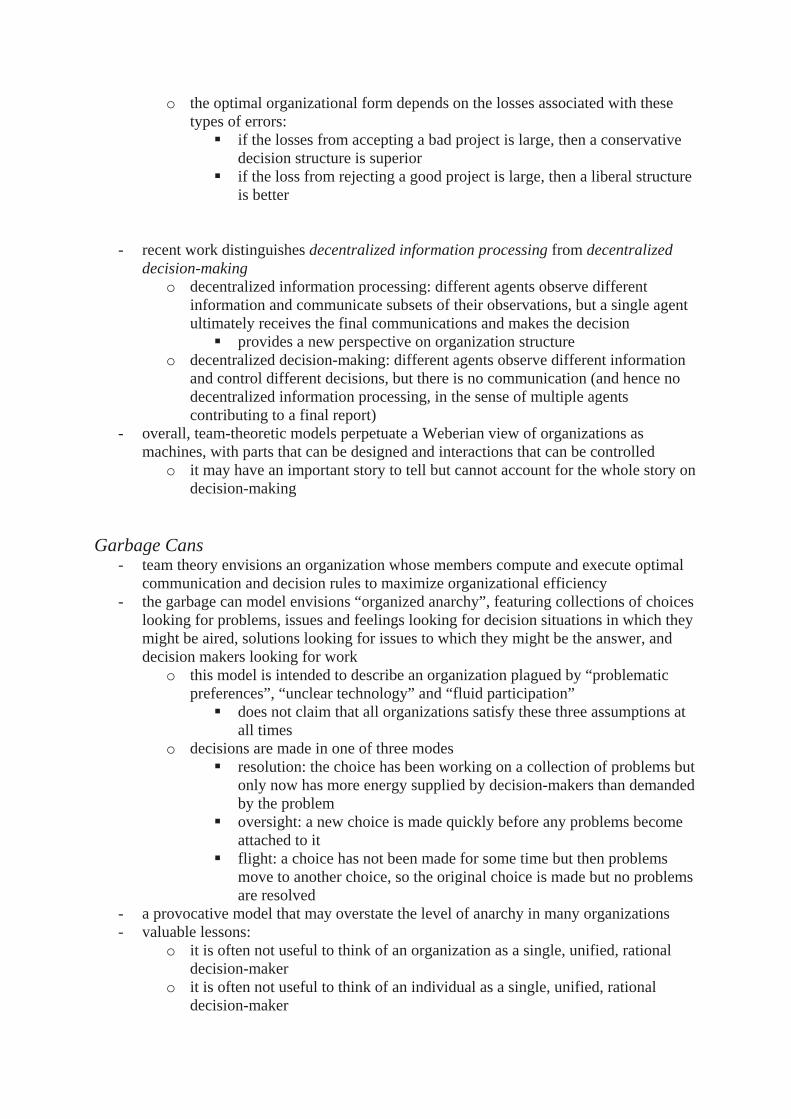
o the optimal organizational form depends on the losses associated with these types of errors:
if the losses from accepting a bad project is large, then a conservative decision structure is superior
if the loss from rejecting a good project is large, then a liberal structure is better
- recent work distinguishes decentralized information processing from decentralized decision-making
o decentralized information processing: different agents observe different information and communicate subsets of their observations, but a single agent ultimately receives the final communications and makes the decision
provides a new perspective on organization structure o decentralized decision-making: different agents observe different information
and control different decisions, but there is no communication (and hence no decentralized information processing, in the sense of multiple agents contributing to a final report)
- overall, team-theoretic models perpetuate a Weberian view of organizations as machines, with parts that can be designed and interactions that can be controlled
o it may have an important story to tell but cannot account for the whole story on decision-making
Garbage Cans
- team theory envisions an organization whose members compute and execute optimal communication and decision rules to maximize organizational efficiency
- the garbage can model envisions “organized anarchy”, featuring collections of choices looking for problems, issues and feelings looking for decision situations in which they might be aired, solutions looking for issues to which they might be the answer, and decision makers looking for work
o this model is intended to describe an organization plagued by “problematic preferences”, “unclear technology” and “fluid participation”
does not claim that all organizations satisfy these three assumptions at all times
o decisions are made in one of three modes resolution: the choice has been working on a collection of problems but
only now has more energy supplied by decision-makers than demanded by the problem
oversight: a new choice is made quickly before any problems become attached to it
flight: a choice has not been made for some time but then problems move to another choice, so the original choice is made but no problems are resolved
- a provocative model that may overstate the level of anarchy in many organizations - valuable lessons:
o it is often not useful to think of an organization as a single, unified, rational decision-maker
o it is often not useful to think of an individual as a single, unified, rational decision-maker
Real Organizations Feldman and March (1981) summarize decision-making in organizations as follows:
(1) much information that is gathered and communicated by individuals and organizations has little decision relevance
(2) much of the information that is used to justify a decision is collected and interpreted after the decision has been (substantially) made
(3) much of the information gathered in response to requests for information is not considered in the making of decisions for which it was requested
(4) regardless of the information available at the time a decision is first considered, more information is requested
(5) complaints that an organization does not have enough information to make a decision occur while available information is ignored
(6) the relevance of the information provided in the decision-making process to the decision being made is less conspicuous than is the insistence on information
- these findings are at odds with decision theory for a single, rational decision-maker - however, many behaviors described are at least partially consistent with simple game-
theoretic models of signaling or free-riding o ordinary organizational procedures provide positive incentives for
underestimating the costs of information relative to its benefits o much of the information used in organizational life is subject to strategic
misinterpretation o information as a signal and symbol
4. Recent Economic Models of Decision-Making in Organizations
4.1. Lobbying
- Milgrom & Roberts (1988): introduction of the idea of influence activities (attempts to manipulate information so as to influence decisions to one’s own benefit)
o E.g., consider Holmström’s (1982) model of career concerns in labor markets. Workers know that firms will use workers’ outputs to draw inferences about workers’ abilities, and that these inferences will in turn determine subsequent wage offers, so workers have an incentive to work hard to influence the firm’s inference, even if the workers have no private information about their abilities
o In this model, influence activities are productive but oftentimes, in reality, they either distract people from performing productive tasks or merely change the distribution of organizational resources across members, without improving overall productivity
o They suggest two way that an organization could respond to the prospect of wasteful influence activities
Closing relevant communication channels costly Eliminate influence activities by adjusting internal structures and
processes away from what would otherwise be optimal, to eliminate members’ incentives to manipulate information
o Example: see handout lecture 5 and exercise 8
4.2 Informal Authority (Aghion and Tirole (1997) formal vs. informal authority) Motivation: “rubber stamping”: the boss enjoys formal authority but approves the subordinate decision without inspection or consideration. In other words, the boss has the formal authority, but the subordinate has the real authority.
o Example: it seems that shareholders often rubber-stamp the board’s decision Questions: Why would anyone with formal authority cede it?
o And: if the boss has the formal authority, can’t he always take back any delegation to a subordinate?
The Aghion-Tirole model (see handout lecture 5) attempts to provide answers to these questions. Findings:
- The boss desires to cede real authority whenever the subordinate has superior information and sufficiently similar preferences
Further Applications:
- The same model can be applied to delegation - This is modelled as the subordinate having the formal authority (but the boss perhaps
having the real authority) Findings (in contrast to the formal vs. real authority scenario):
- The subordinate picks the project whenever he is informed as opposed to only whenever he is informed but the boss is not
- Thus, the subordinate’s incentive to collect information is stronger while the boss’ incentive is weaker as she only picks the project whenever she is informed but the subordinate is not
- In short, delegation increases the subordinate’s incentives but decreases the boss’ 5. Conclusion The paper
- ignores applications of decision-making that apply outside organizations, - ignores works on heuristics and attributions, - assumes self-interested preferences and ignores social utility, and - assumes exogenous preferences which might, in reality, be contingent preferences.
THE DISCIPLINE OF TEAMS Katzenbach & Smith
What differentiates various levels of team performance, where and how teams work best, and what top management can do to enhance their effectiveness? To understand how teams deliver extra performance, we must distinguish between teams and other forms of working groups. That distinction turns on performance results.
A working group’s performance is a function of what its members do as individuals - Working group members don’t take responsibility for results other than their own
A team’s performance includes both individual results and “collective work products” (=what two or more members must work on together; reflects the joint contribution of team members)
- Teams differ fundamentally from working groups because they require both individual and mutual accountability
For managers to make better decisions about whether, when, or how to encourage and use teams, it is important to be more precise about what a team is and what it isn't. DEFINITION: “A team is a small number of people with complementary skills who are committed to a common purpose, set of performance goals, and approach for which they hold themselves mutually accountable”.
Size issue: Large numbers of people have trouble interacting constructively as a group, much less doing real work together (apart from logistical problems)
Skill requirements fall into three categories:
o Technical or functional expertise (eg. engineers and marketers) o Problem-Solving and Decision-Making Skills, at least by some members o Interpersonal skills, which are essential for effective communication and constructive conflict
The essence of a team: common commitment (requires a purpose in which team members can believe)
The best teams also translate their common purpose into specific performance goals:
o Specific team-performance goals help define a set of work products that are different both from an organisation-wide mission and from individual job objectives
o The specificity of performance objectives facilitates clear communication and constructive conflict within the team
o The attainability of specific goals helps teams maintain their focus on getting results o Specific objectives have a levelling effect conducive to team behaviour o Specific goals allow a team to achieve small wins as it pursues its broader purpose o Performance goals are symbols of accomplishments that motivate and energise
→ the combination of purpose and specific goals is essential to performance
Agreeing on the specifics of work and how they fit together to integrate individual skills and advance team performance lies at the heart of shaping a common approach. o Every member of a successful team does equivalent amounts of real work; all members,
including the team leader, contribute in concrete ways to the team's work product.
No group ever becomes a team until it can hold itself accountable as a team o But when a team shares a common purpose, goals, and approach, mutual accountability grows
as a natural counterpart.
Three Types of Teams and the Unique Challenges They Face:
Recommend – fast and effective start and handoff that is required to get recommendations implemented (cross-involvement of recommenders and implementers)
Make or Do – concentrate on “critical delivery points,” focus on performance and how teams are conducive to it
Run (oversee an aspect of the business) – is a “real team” approach needed? Many groups that run things can be more effective as “working groups” than as teams: less risky and disruptive. On the other hand, teams provide higher performance (especially when broad behavioral change is needed, and specific purposes and goals are identified – not overall performance)
– teams at top are the most difficult, powerful, smaller and less formalized What is missing in the article?
Why teams perform better than mere aggregations of individuals (“working groups”)? What realistically goes wrong in building a team and how to fix it – the root causes for common
problems and how to circumvent them (besides often misusing the term “team”)
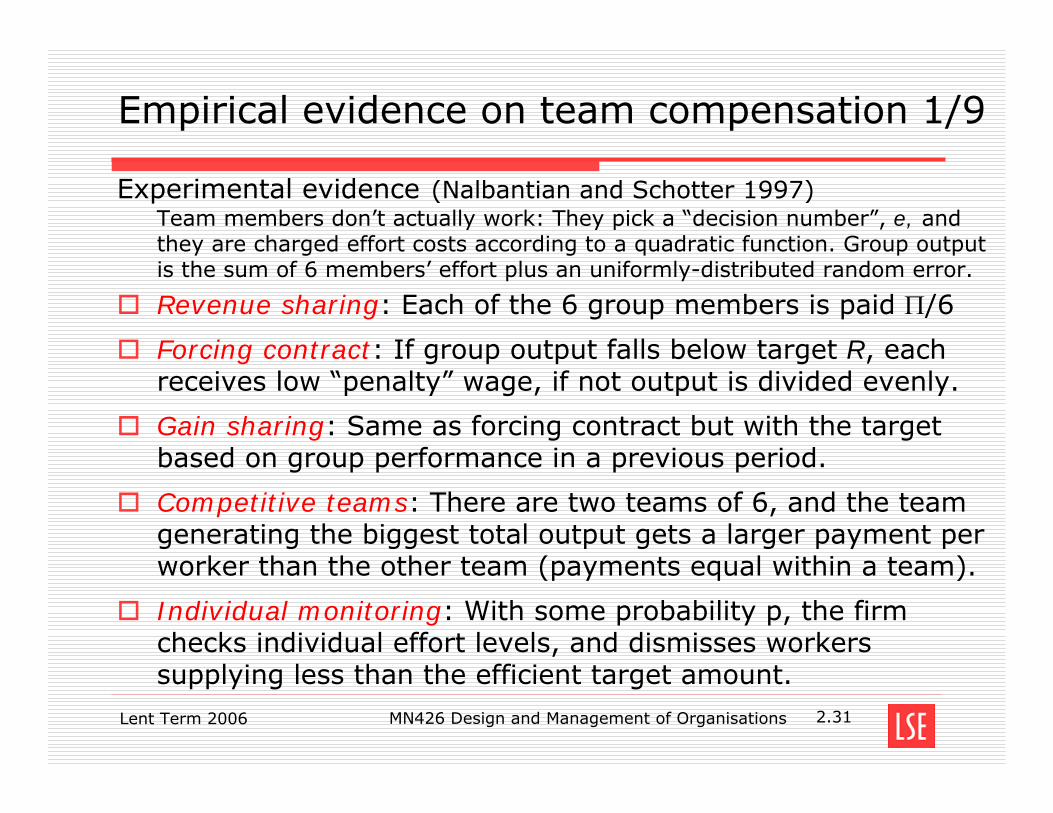
Lent Term 2006 MN426 Design and Management of Organisations 2.31
Empirical evidence on team compensation 1/9
Experimental evidence (Nalbantian and Schotter 1997)Team members don’t actually work: They pick a “decision number”, e, and they are charged effort costs according to a quadratic function. Group output is the sum of 6 members’ effort plus an uniformly-distributed random error.
Revenue sharing: Each of the 6 group members is paid Π/6
Forcing contract: If group output falls below target R, each receives low “penalty” wage, if not output is divided evenly.
Gain sharing: Same as forcing contract but with the target based on group performance in a previous period.
Competitive teams: There are two teams of 6, and the team generating the biggest total output gets a larger payment per worker than the other team (payments equal within a team).
Individual monitoring: With some probability p, the firm checks individual effort levels, and dismisses workers supplying less than the efficient target amount.
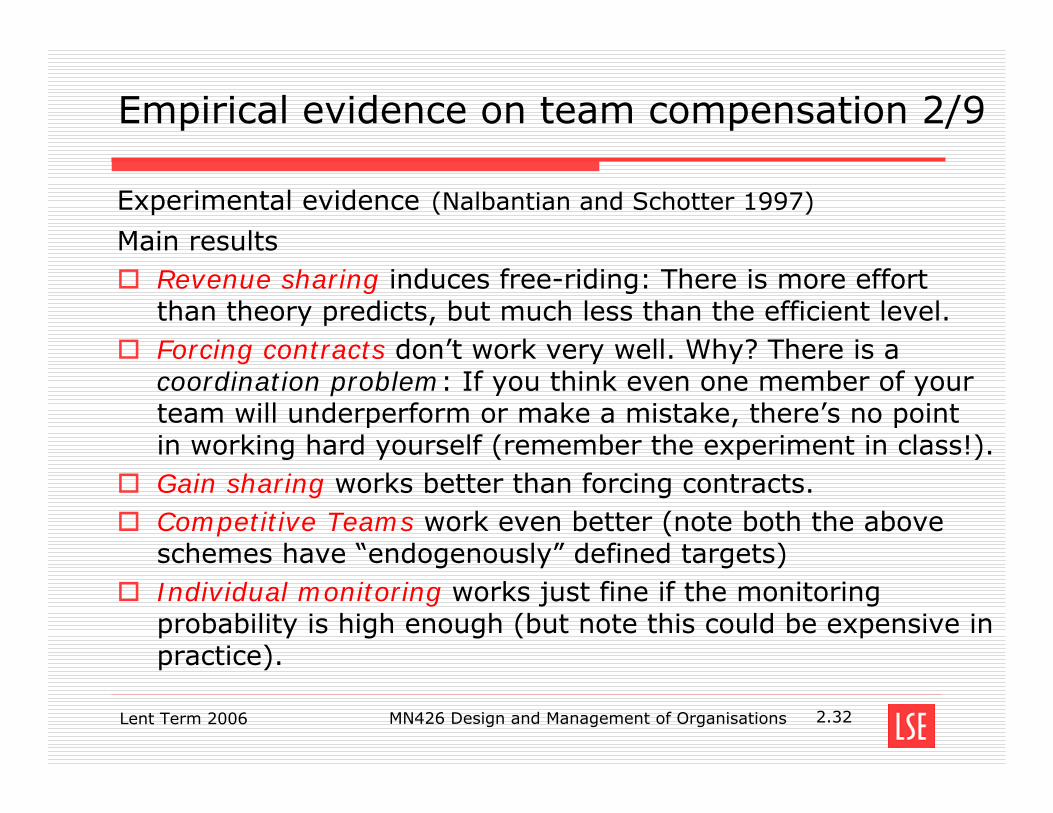
Lent Term 2006 MN426 Design and Management of Organisations 2.32
Empirical evidence on team compensation 2/9
Experimental evidence (Nalbantian and Schotter 1997)
Main resultsRevenue sharing induces free-riding: There is more effort than theory predicts, but much less than the efficient level.Forcing contracts don’t work very well. Why? There is a coordination problem: If you think even one member of your team will underperform or make a mistake, there’s no point in working hard yourself (remember the experiment in class!). Gain sharing works better than forcing contracts. Competitive Teams work even better (note both the above schemes have “endogenously” defined targets)Individual monitoring works just fine if the monitoring probability is high enough (but note this could be expensive in practice).
MN426 Productivity Under Group Incentives: An Experimental Study By Haig R. Nalbantian and Andrew Schotter. Theme The authors seek conduct an experiment to investigate the problem of moral hazard and the performance characteristics of various group incentive schemes deduced from economic theory, namely;
1. Partnership Schemes: Revenue Sharing (used as reference point)
Here, the lowest effort is observed because free-riding and shirking is a dominant Strategy1.
2. Target Based Schemes Forcing Contracts Forcing contract is seen as a remedy to the shirking dilemma presented by revenue sharing. Here revenue target is set exogenously for the group and if it is achieved the workers share in all the revenue generated. Should it fails, each worker is paid a relatively low penalty wage.
3. Profit Sharing This is nothing more than a forcing contract scheme with a lower target and a penalty wage of zero.
4. Gainsharing Again this is similar to the target based and profit sharing schemes but here the target is generated endogenously by the previous output of workers. Hence it is a forcing contract with a target based on historical performance.
5. Tournament-Based Schemes: Competitive Teams In contrast to target-based schemes, tournaments make the payoffs of agents or groups of agents contingent upon relative, rather than absolute performance.
6. Individualistic Schemes: Monitoring Under this mechanism, the firm offers its workers a wage W greater than their opportunity wage W if they exert effort level e*. The firm check the effort with a probability P in each period, should the worker be caught exerting lower effort, he will be fired.
According to the economic theory, the Partnership Schemes: Revenue Sharing suffer most severely from disincentive effects and hence represent the archetypical incentive mechanism for which free-riding is a dominant strategy that yields Pareto-inferior outcomes for all. Thus, using this scheme as a reference point against the others, the authors wanted to find the benefits that these other schemes bring to the group and what factors were crucial in allowing greater effort to be exerted under these schemes. The experiment was simple as it is only a matter of comparing the worst scheme (revenue sharing) against all of the others which according to economic theory can yield more efficient outcomes in terms of effort levels. 1
In this case, least effort will be exerted in comparison to other scheme. This is because each agent does not take into account the positive externality that his/her effort would bring to the group’s outcome.
The findings were as of following;
A. Shirking happens
When experimental subjects are placed under an incentive plan which provides strong incentives to shirk (i.e. revenue sharing scheme), their effort levels do approach the shirking equilibrium2 as they near the end of the experiment.
B. History matters
The history of a group and its performance in the past is an important predictor of how that group will perform when a new incentive programme is introduced.
C. A little competition goes a long way
Evidence indicates that one effective way to increase group effort is to introduce some within-firm competition between work units performing the same task the same task – setting up an intrafirm team tournament.
D. Monitoring works but it is costly
When monitoring is possible but not perfect, high level of effort can be elicited from workers. However, unless the probability of detection is great (and therefore, costly to maintain), such monitoring schemes are likely to fail. In other words, monitoring would only work if it is imposed properly. However, the trade-off is higher cost associated with the scheme.
2
The equilibrium value can be obtained mathematically. The set up is that we have done in class where the tool of FOC is employed to find the effort level under Nash Equilibrium.
Armin Falk & Andrea Ichino (2006): Clean Evidence on Peer Pressure Abstract While confounding factors typically jeopardize the possibility of using observational data to measure peer effects, field experiments over the potential for obtaining clean evidence. In this paper we measure the output of subjects who were asked to stuff letters into envelopes, with a remuneration completely independent of output. We study two treatments. In the "pair" treatment two subjects work at the same time in the same room. Peer effects are possible in this situation and imply that outputs within pairs should be similar. In the "single" treatment, which serves as a control, subjects work alone in a room and peer effects are ruled out by design. Our main results are as follows: First, we find clear and unambiguous evidence for the existence of peer effects in the pair treatment. The standard deviations of output are significantly smaller within pairs than between pairs. Second, average output in the pair treatment largely exceeds output in the single treatment, i.e., peer effects raise productivity. Third, low productivity workers are significantly more sensitive to the behavior of peers than are high productivity workers. Our findings yield important implications for the design of the workplace. Introduction
- Is individual behaviour modified by peer effects? - Are there any peer effects on a working environment? - Are workers performing better, while working with others, or when working alone?
The Experiment
- Subjects: 24 High-school students in Switzerland
- Place: High-school building
- Task: Fold two sheets of paper and stuff them into an envelope over a period of four hours (w/out a break)
- Reward: 90 Swiss Francs regardless of output
Further Characteristics: - Subjects are divided into two groups:
o Pair Treatment: Teams of 2 Free to communicate Cooperation prohibited
o Single Treatment: Subjects work alone in a room Rules out peer effects
Behavioral Hypotheses Proposition 1
If peer effects exist, then the absolute value of the difference between output levels within pairs should be smaller than if there were no peer effects.
Proposition 2 If the peer effects contribute positively to the productivity, then the average output of the pair treatment exceeds that of the single treatment.
Proposition 3 Positive peer effects may lead to an individual output increase, which is inversely related to the individual’s innate productivity.
Testing the propositions…Results Proposition 1
- The single and pair data ARE different - The standard deviations within pairs are significantly smaller than between pairs
Proposition 2 - Comparison of average output levels in pair and the single treatment ARE NOT similar,
even if incentives are similar. Peer effects contribute positively to raising the overall productivity
Proposition 3
- Subjects with low innate productivity are more affected by the influence of peers, than those with higher innate productivity
Conclusion
- Behavior of subjects working in pairs is significantly different from the behavior of subjects working alone.
- Peer effects work in the direction of raising the overall average productivity significantly. - Less productive workers are influenced more than high productivity ones. Limitations and questions for thought... - How can low and high productivity workers be allocated optimally? - Subjects interacted only once and did not know each other - How would the results change with repeated interaction? - What would happen to the productivity of high productivity workers if it became clear
that rewards are independent of output?
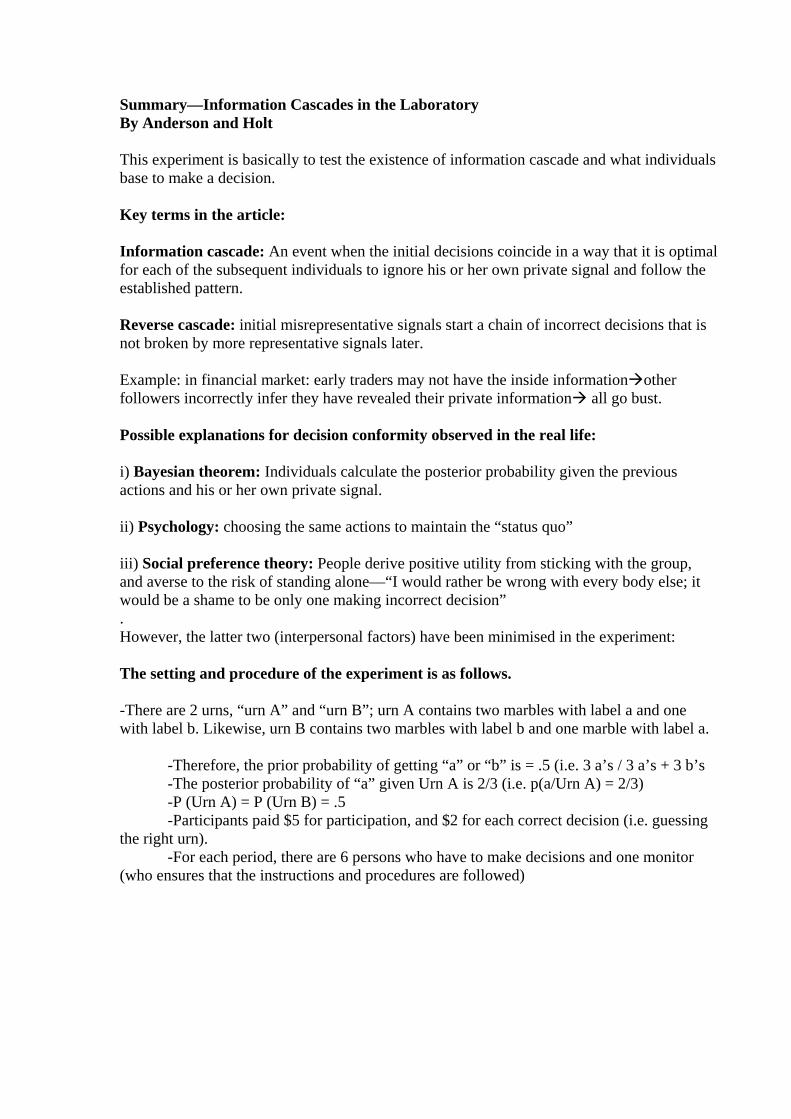
Summary—Information Cascades in the Laboratory By Anderson and Holt This experiment is basically to test the existence of information cascade and what individuals base to make a decision. Key terms in the article: Information cascade: An event when the initial decisions coincide in a way that it is optimal for each of the subsequent individuals to ignore his or her own private signal and follow the established pattern. Reverse cascade: initial misrepresentative signals start a chain of incorrect decisions that is not broken by more representative signals later. Example: in financial market: early traders may not have the inside information other followers incorrectly infer they have revealed their private information all go bust. Possible explanations for decision conformity observed in the real life: i) Bayesian theorem: Individuals calculate the posterior probability given the previous actions and his or her own private signal. ii) Psychology: choosing the same actions to maintain the “status quo” iii) Social preference theory: People derive positive utility from sticking with the group, and averse to the risk of standing alone—“I would rather be wrong with every body else; it would be a shame to be only one making incorrect decision” . However, the latter two (interpersonal factors) have been minimised in the experiment: The setting and procedure of the experiment is as follows. -There are 2 urns, “urn A” and “urn B”; urn A contains two marbles with label a and one with label b. Likewise, urn B contains two marbles with label b and one marble with label a. -Therefore, the prior probability of getting “a” or “b” is = .5 (i.e. 3 a’s / 3 a’s + 3 b’s -The posterior probability of “a” given Urn A is 2/3 (i.e. p(a/Urn A) = 2/3) -P (Urn A) = P (Urn B) = .5 -Participants paid $5 for participation, and $2 for each correct decision (i.e. guessing the right urn). -For each period, there are 6 persons who have to make decisions and one monitor (who ensures that the instructions and procedures are followed)
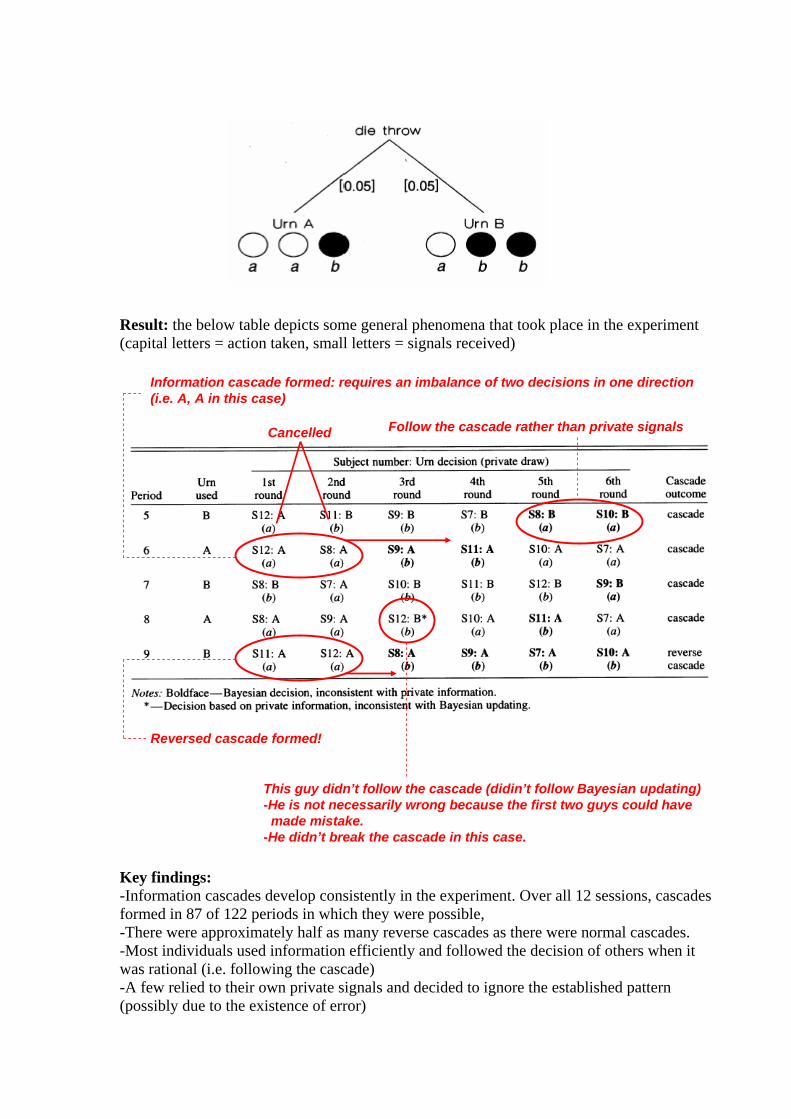
Result: the below table depicts some general phenomena that took place in the experiment (capital letters = action taken, small letters = signals received)
Follow the cascade rather than private signalsCancelled
Information cascade formed: requires an imbalance of two decisions in one direction (i.e. A, A in this case)
Reversed cascade formed!
This guy didn’t follow the cascade (didin’t follow Bayesian updating)-He is not necessarily wrong because the first two guys could have
made mistake.-He didn’t break the cascade in this case.
Key findings: -Information cascades develop consistently in the experiment. Over all 12 sessions, cascades formed in 87 of 122 periods in which they were possible, -There were approximately half as many reverse cascades as there were normal cascades. -Most individuals used information efficiently and followed the decision of others when it was rational (i.e. following the cascade) -A few relied to their own private signals and decided to ignore the established pattern (possibly due to the existence of error)
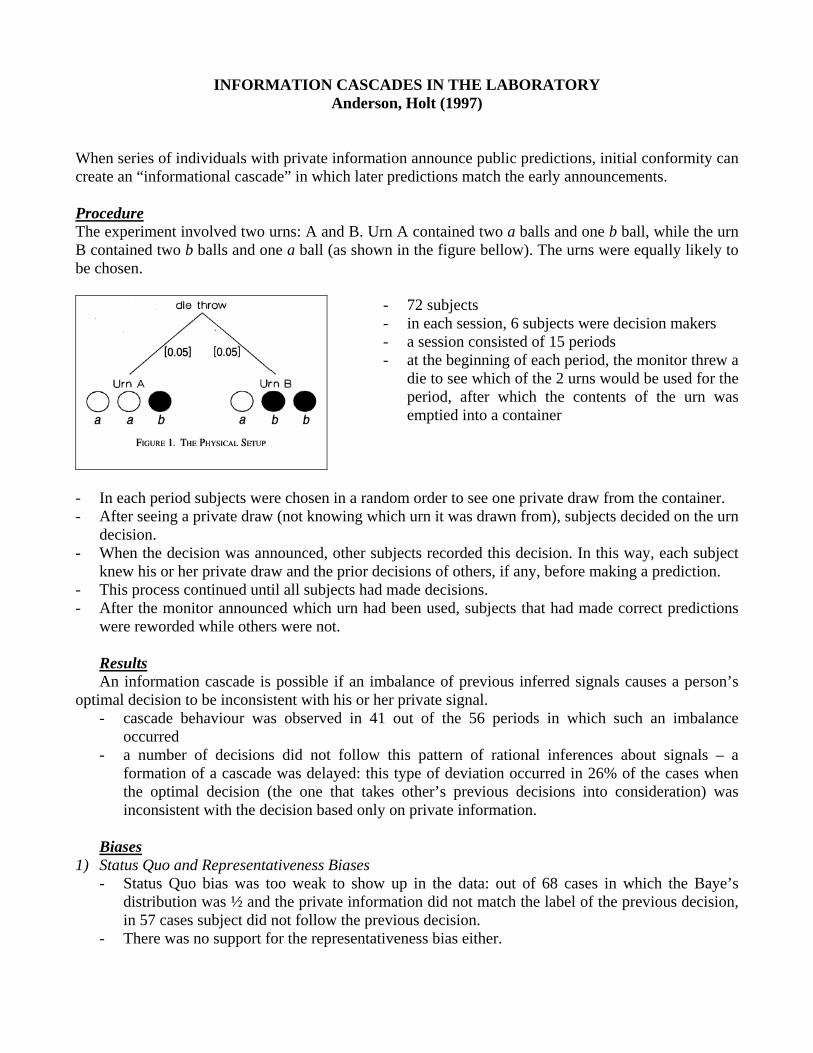
INFORMATION CASCADES IN THE LABORATORY Anderson, Holt (1997)
When series of individuals with private information announce public predictions, initial conformity can create an “informational cascade” in which later predictions match the early announcements. Procedure The experiment involved two urns: A and B. Urn A contained two a balls and one b ball, while the urn B contained two b balls and one a ball (as shown in the figure bellow). The urns were equally likely to be chosen.
- 72 subjects - in each session, 6 subjects were decision makers - a session consisted of 15 periods - at the beginning of each period, the monitor threw a
die to see which of the 2 urns would be used for the period, after which the contents of the urn was emptied into a container
- In each period subjects were chosen in a random order to see one private draw from the container. - After seeing a private draw (not knowing which urn it was drawn from), subjects decided on the urn
decision. - When the decision was announced, other subjects recorded this decision. In this way, each subject
knew his or her private draw and the prior decisions of others, if any, before making a prediction. - This process continued until all subjects had made decisions. - After the monitor announced which urn had been used, subjects that had made correct predictions
were reworded while others were not. Results An information cascade is possible if an imbalance of previous inferred signals causes a person’s
optimal decision to be inconsistent with his or her private signal. - cascade behaviour was observed in 41 out of the 56 periods in which such an imbalance
occurred - a number of decisions did not follow this pattern of rational inferences about signals – a
formation of a cascade was delayed: this type of deviation occurred in 26% of the cases when the optimal decision (the one that takes other’s previous decisions into consideration) was inconsistent with the decision based only on private information.
Biases
1) Status Quo and Representativeness Biases - Status Quo bias was too weak to show up in the data: out of 68 cases in which the Baye’s
distribution was ½ and the private information did not match the label of the previous decision, in 57 cases subject did not follow the previous decision.
- There was no support for the representativeness bias either.
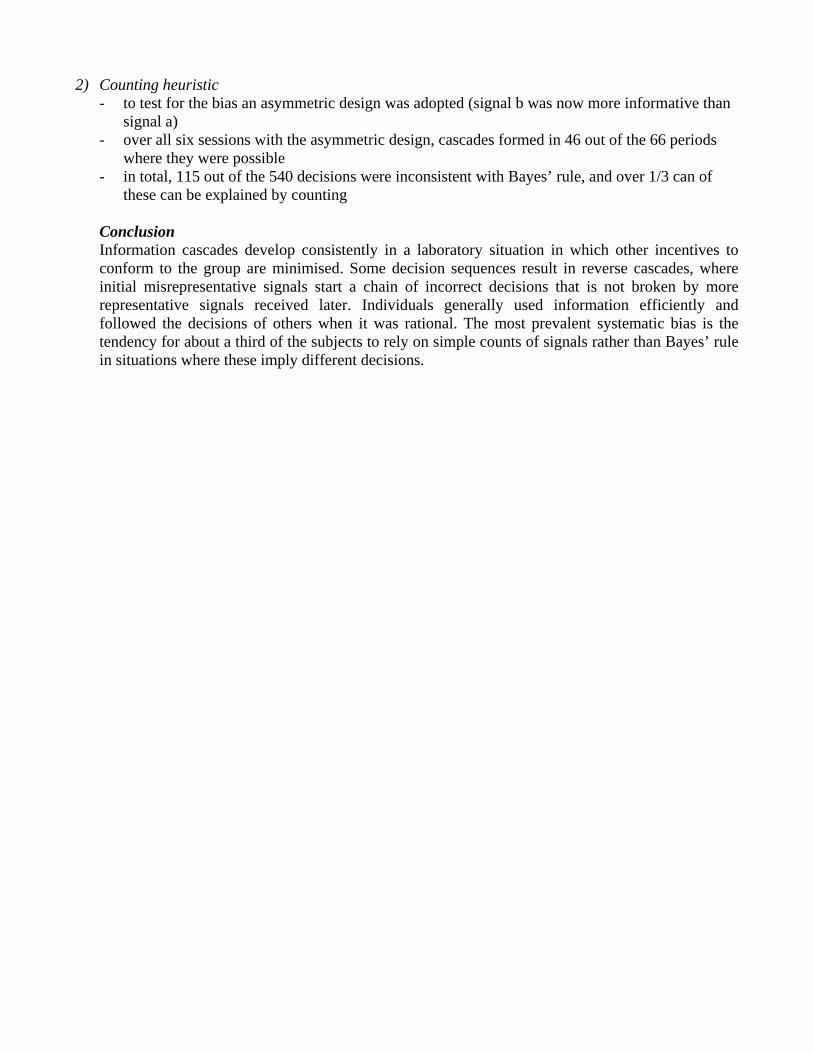
2) Counting heuristic - to test for the bias an asymmetric design was adopted (signal b was now more informative than
signal a) - over all six sessions with the asymmetric design, cascades formed in 46 out of the 66 periods
where they were possible - in total, 115 out of the 540 decisions were inconsistent with Bayes’ rule, and over 1/3 can of
these can be explained by counting Conclusion Information cascades develop consistently in a laboratory situation in which other incentives to conform to the group are minimised. Some decision sequences result in reverse cascades, where initial misrepresentative signals start a chain of incorrect decisions that is not broken by more representative signals received later. Individuals generally used information efficiently and followed the decisions of others when it was rational. The most prevalent systematic bias is the tendency for about a third of the subjects to rely on simple counts of signals rather than Bayes’ rule in situations where these imply different decisions.
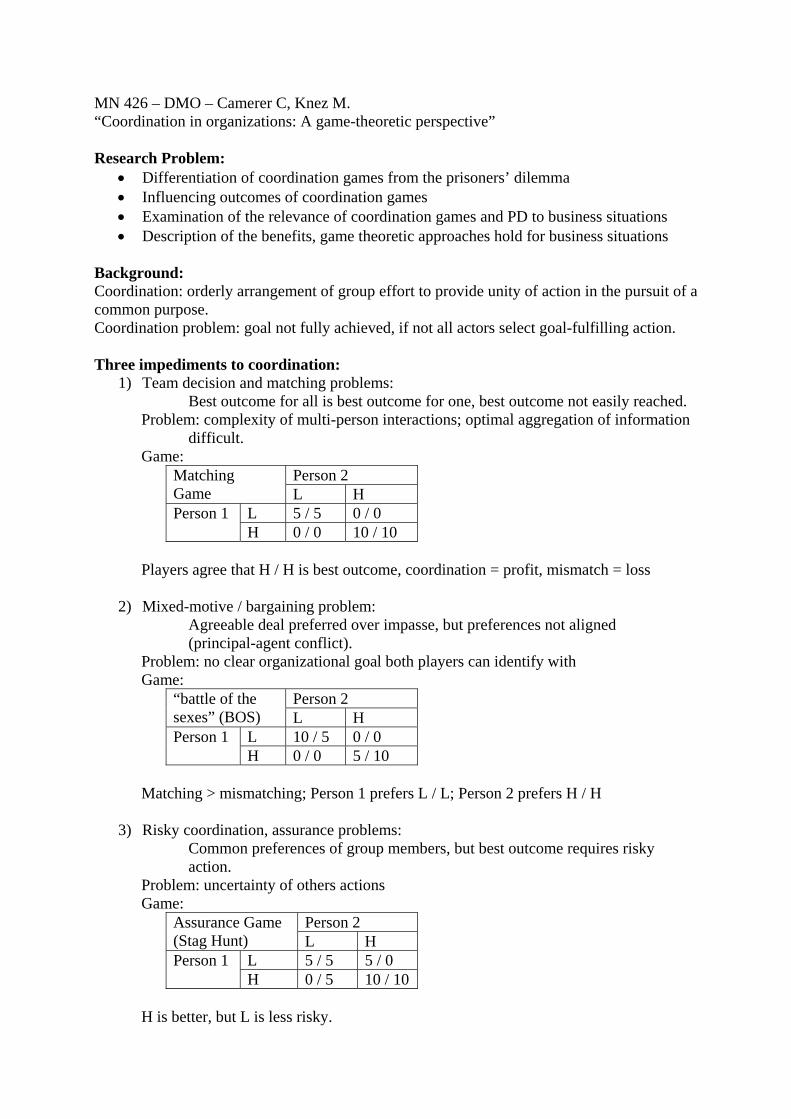
MN 426 – DMO – Camerer C, Knez M. “Coordination in organizations: A game-theoretic perspective” Research Problem:
• Differentiation of coordination games from the prisoners’ dilemma • Influencing outcomes of coordination games • Examination of the relevance of coordination games and PD to business situations • Description of the benefits, game theoretic approaches hold for business situations
Background: Coordination: orderly arrangement of group effort to provide unity of action in the pursuit of a common purpose. Coordination problem: goal not fully achieved, if not all actors select goal-fulfilling action. Three impediments to coordination:
1) Team decision and matching problems: Best outcome for all is best outcome for one, best outcome not easily reached.
Problem: complexity of multi-person interactions; optimal aggregation of information difficult.
Game: Person 2 Matching
Game L H L 5 / 5 0 / 0 Person 1 H 0 / 0 10 / 10
Players agree that H / H is best outcome, coordination = profit, mismatch = loss
2) Mixed-motive / bargaining problem: Agreeable deal preferred over impasse, but preferences not aligned (principal-agent conflict).
Problem: no clear organizational goal both players can identify with Game:
Person 2 “battle of the sexes” (BOS) L H
L 10 / 5 0 / 0 Person 1 H 0 / 0 5 / 10
Matching > mismatching; Person 1 prefers L / L; Person 2 prefers H / H
3) Risky coordination, assurance problems: Common preferences of group members, but best outcome requires risky action.
Problem: uncertainty of others actions Game:
Person 2 Assurance Game (Stag Hunt) L H
L 5 / 5 5 / 0 Person 1 H 0 / 5 10 / 10
H is better, but L is less risky.
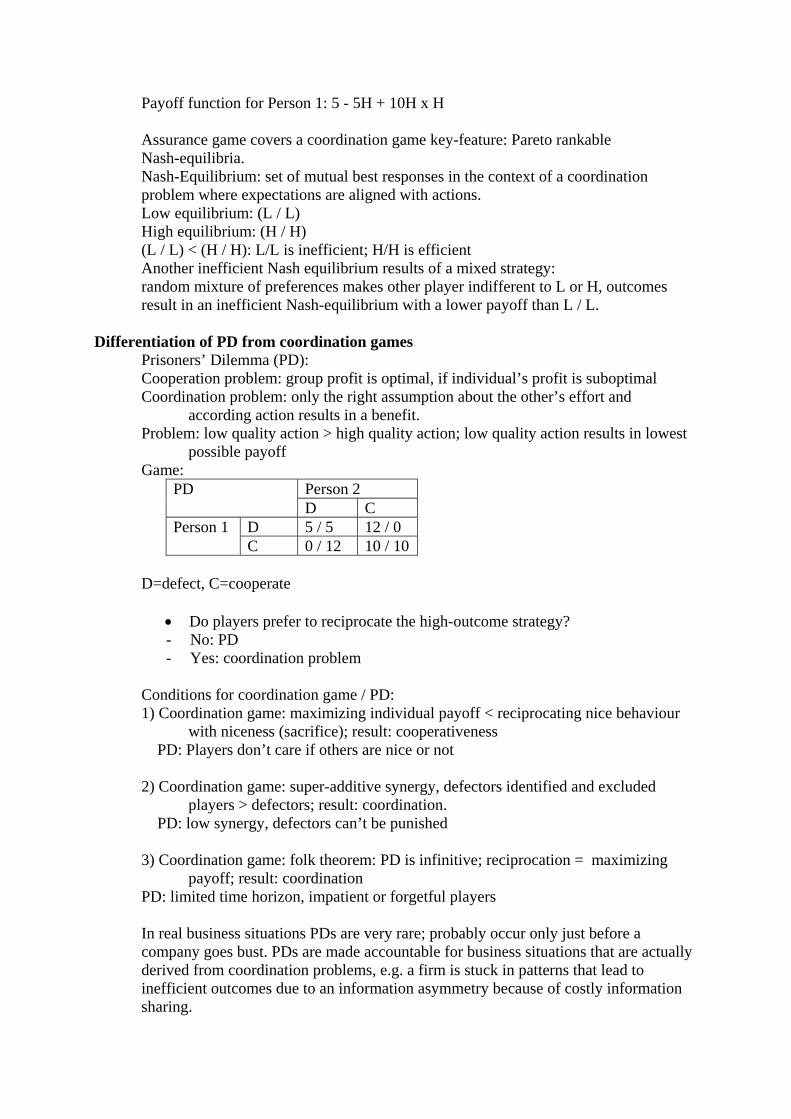
Payoff function for Person 1: 5 - 5H + 10H x H Assurance game covers a coordination game key-feature: Pareto rankable Nash-equilibria. Nash-Equilibrium: set of mutual best responses in the context of a coordination problem where expectations are aligned with actions. Low equilibrium: (L / L) High equilibrium: (H / H) (L / L) < (H / H): L/L is inefficient; H/H is efficient Another inefficient Nash equilibrium results of a mixed strategy: random mixture of preferences makes other player indifferent to L or H, outcomes result in an inefficient Nash-equilibrium with a lower payoff than L / L.
Differentiation of PD from coordination games
Prisoners’ Dilemma (PD): Cooperation problem: group profit is optimal, if individual’s profit is suboptimal Coordination problem: only the right assumption about the other’s effort and
according action results in a benefit. Problem: low quality action > high quality action; low quality action results in lowest
possible payoff Game:
Person 2 PD D C
D 5 / 5 12 / 0 Person 1 C 0 / 12 10 / 10
D=defect, C=cooperate
• Do players prefer to reciprocate the high-outcome strategy? - No: PD - Yes: coordination problem
Conditions for coordination game / PD: 1) Coordination game: maximizing individual payoff < reciprocating nice behaviour
with niceness (sacrifice); result: cooperativeness PD: Players don’t care if others are nice or not 2) Coordination game: super-additive synergy, defectors identified and excluded players > defectors; result: coordination. PD: low synergy, defectors can’t be punished 3) Coordination game: folk theorem: PD is infinitive; reciprocation = maximizing
payoff; result: coordination PD: limited time horizon, impatient or forgetful players
In real business situations PDs are very rare; probably occur only just before a company goes bust. PDs are made accountable for business situations that are actually derived from coordination problems, e.g. a firm is stuck in patterns that lead to inefficient outcomes due to an information asymmetry because of costly information sharing.
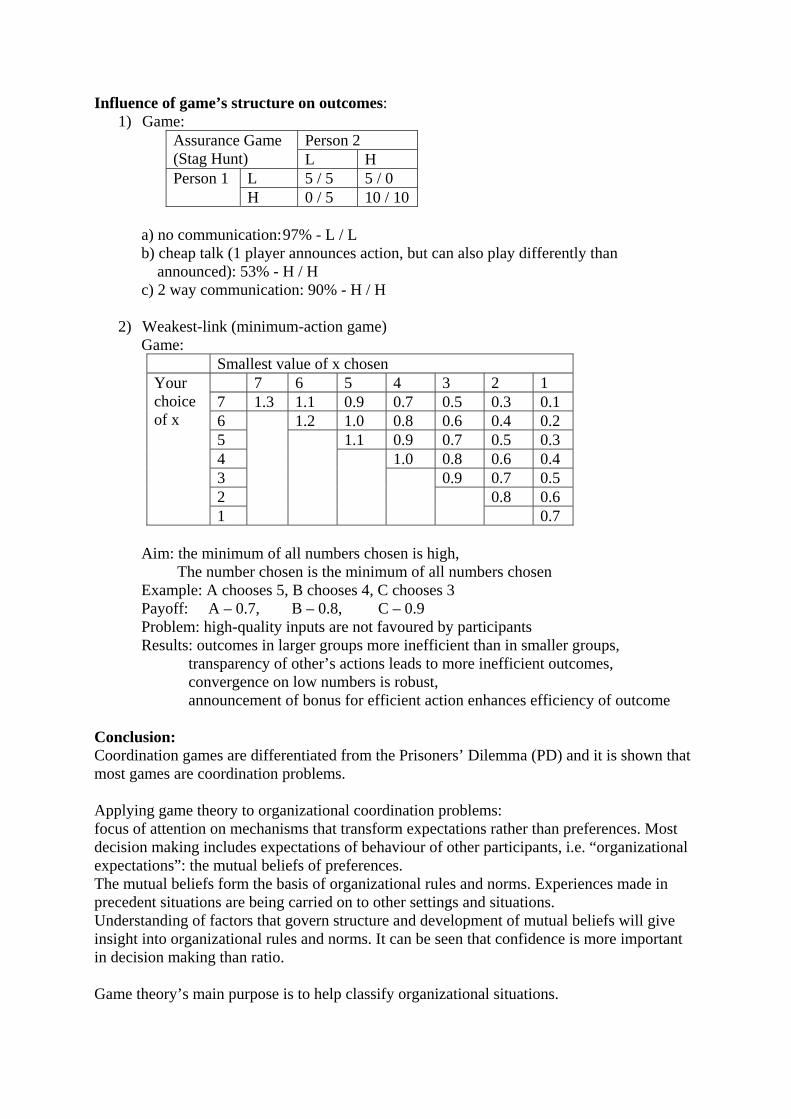
Influence of game’s structure on outcomes: 1) Game:
Person 2 Assurance Game (Stag Hunt) L H
L 5 / 5 5 / 0 Person 1 H 0 / 5 10 / 10
a) no communication: 97% - L / L b) cheap talk (1 player announces action, but can also play differently than announced): 53% - H / H c) 2 way communication: 90% - H / H
2) Weakest-link (minimum-action game)
Game: Smallest value of x chosen
7 6 5 4 3 2 1 7 1.3 1.1 0.9 0.7 0.5 0.3 0.1 6 1.2 1.0 0.8 0.6 0.4 0.2 5 1.1 0.9 0.7 0.5 0.3 4 1.0 0.8 0.6 0.4 3 0.9 0.7 0.5 2 0.8 0.6
Your choice of x
1
0.7
Aim: the minimum of all numbers chosen is high, The number chosen is the minimum of all numbers chosen Example: A chooses 5, B chooses 4, C chooses 3 Payoff: A – 0.7, B – 0.8, C – 0.9 Problem: high-quality inputs are not favoured by participants Results: outcomes in larger groups more inefficient than in smaller groups,
transparency of other’s actions leads to more inefficient outcomes, convergence on low numbers is robust, announcement of bonus for efficient action enhances efficiency of outcome
Conclusion: Coordination games are differentiated from the Prisoners’ Dilemma (PD) and it is shown that most games are coordination problems. Applying game theory to organizational coordination problems: focus of attention on mechanisms that transform expectations rather than preferences. Most decision making includes expectations of behaviour of other participants, i.e. “organizational expectations”: the mutual beliefs of preferences. The mutual beliefs form the basis of organizational rules and norms. Experiences made in precedent situations are being carried on to other settings and situations. Understanding of factors that govern structure and development of mutual beliefs will give insight into organizational rules and norms. It can be seen that confidence is more important in decision making than ratio. Game theory’s main purpose is to help classify organizational situations.
The Decision Maker Matters. Individual versus Team Behaviour in experimental beauty-contest games. (Kocher, M., Sutter, M. 2005) Seminar Week 3 Introduction In Economics a decision maker is usually modeled as an individual. However, in many real-life situations the decision makers are in fact, groups rather than individuals, such as families, board of directors or committees. Traditional economic theory does not differentiate between the influence of the type of decision maker on (rationality of) actual decisions. Question & Hypothesis Hypothesis 1: Groups apply deeper levels of reasoning than individuals, which implies that group guesses are closer to the game theoretic equilibrium. Hypothesis 2: If groups compete directly against individuals in the beauty contest game, groups should win the contest more often than individuals (and get a higher payoff). Methodology & Experiment Setup An experimental beauty contest game is used, which combines intellective (calculating, iterating) and judgmental task (expecting others’ guesses) o n decision makers o simultaneously choose a number from the interval [0,100] o hence the mean of all choices is xt in round t o The winner is the decision maker whose number is closest to a fraction of the mean
x* (defined by p · xt, where p between (0,1) p announced at the beginning and fixed in all rounds) (p here 2/3)
(=a contest where entrants are asked to pick a number between 0 and 100, with the winner of the contest being the person that is closest to 2/3 the average number picked for all contestants.) Experiment Session 1 (Competition between homogeneous decision maker): 140 first year students were allocated, so that 35 individuals played against each other & 35 groups (à 3) played against each other over four rounds. Winners of each round received 10.5€, Groups 31.5€. Individuals and groups played separately, rules explained via written instructions, 5min to decide on number, player guesses written on cards which were collected, results announced after each round, no communication between different decision makers Results & Interpretation (Session 1): Except for round 1, groups consistently guess closer to the game theoretic equilibrium and converge faster. Groups learn faster than individuals and adapt faster to a newly introduced task. One explanation for this could be the possibility of discussing the structure and the dynamics of the beauty contest game with the group. Individuals also converge the equilibrium, but learn from experience. H1 could be confirmed for rounds 2 to 4. Experiment Session 2 (Competition between heterogeneous decision makers): Ceteris Paribus:
60 first year students were allocated, so that 24 individuals played against 12 groups (à 3) over four rounds. One unit of observation consisted of 2 individuals and a group. Winning individual (group) received 5 (18)€. Results & Interpretation (Session 2): Insignificant difference in performance in round 1 (groups take time to coordinate), groups outperform individuals thereafter. Groups win 22 times out of 48 cases, but had been expected to win 16 times, if the distribution of winnings were random. Individuals win 26 times, which is 6 less than had been expected if wins would occur randomly. Individuals’ payoff is ~40% less than groups. H2 confirmed. Limitations & Further Questions How do groups aggregate the choices preferred by single group members into single group decision? Which is the optimal group size? How to overcome adverse effects (e.g. groupthink)?
“Resources and Relationships: Social Networks and Mobility in the Workplace” by Podolny and Baron (Lecture 4) The authors investigate the importance of structure and content of individuals’ networks in intra-organizational mobility (i.e. promotion). Consistent with previous research (Burt 1980) they find that having a large sparse network of informal ties for acquiring information and resources enhances individuals’ mobility. However, in contrast to this research, they emphasize the importance of consistent role expectations for performance and mobility (i.e. this arises from having small dense networks of individuals). Hence, this last point stresses the importance of contents of ties. They then develop a typology of the interaction between contents and network structure. An explanation of the theory behind the research Burt extrapolates the configuration of network ties that create opportunities for brokering and entrepreneurialism in relations among firms, through a network full of structural holes (i.e. being connected to many actors who are they themselves unconnected), to the firm-level by saying that it enhances opportunities for intra-firm promotions. It will be easier to play off people against one another and hence get promoted yourself. The authors then complement Burt’s argument by also supporting Coleman’s theory of social capital, which holds that small networks that display high closure and coherence (i.e. not large networks with structural holes) are conducive to creating a social identity that can help in getting an understanding of the expectations behind one’s role and hence promoting mobility within one’s social network. From this they derive that it is important not to merely look at structure but to also take into account the content of the ties involved. Interaction between Network Structure and Content Burt argues that it is useful to focus on the pattern of relationships among people to whom ego is tied. The authors use the terms direct (i.e. the person’s connection to those within one’s network) and indirect ties (i.e. those among the people in the person’s network). They argue that a larger number of direct ties is conducive to career mobility and the number of indirect ties has a negative effect. The authors stress the importance of the contents, especially crucial sources of organizational identity and social support, that flows through informal ties and that previous research has ignored this by instead concentrating on informal ties as a means to transmit information and resources (i.e. more on control and structure rather than on also contents). Important distinction between resource-based and identity-based ties. In terms of the former Burt’s theory is applicable in the sense that large sparse networks of informal ties are more conducive to mobility but identity-based ties benefit more from smaller and more cohesive social networks. Coleman states that social capital allows one to better optimize one’s resources because there is a clear normative order in contrast to a sparse network where there are diverse and disconnected allegiances and preferences. The authors conclude by saying that a dense network creates: 1. A clear and consistent set of expectations for one’s role and (i.e. role conflict is resolved) 2. develops trust and support
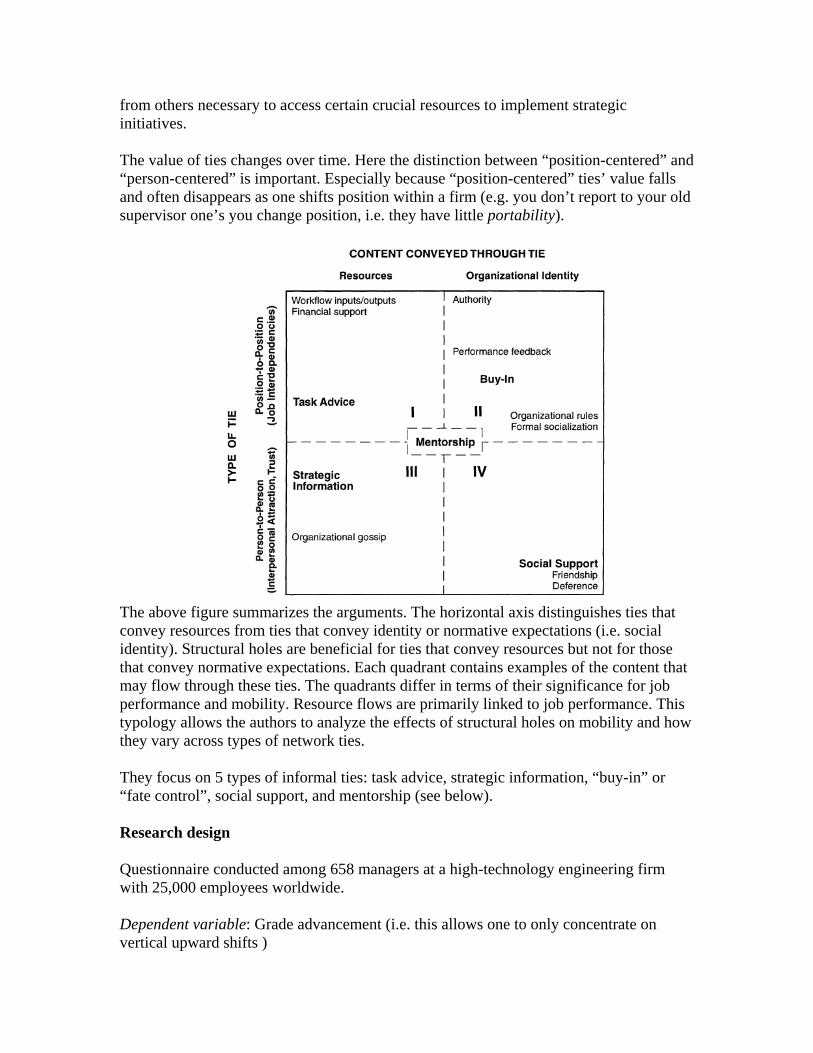
from others necessary to access certain crucial resources to implement strategic initiatives. The value of ties changes over time. Here the distinction between “position-centered” and “person-centered” is important. Especially because “position-centered” ties’ value falls and often disappears as one shifts position within a firm (e.g. you don’t report to your old supervisor one’s you change position, i.e. they have little portability).
The above figure summarizes the arguments. The horizontal axis distinguishes ties that convey resources from ties that convey identity or normative expectations (i.e. social identity). Structural holes are beneficial for ties that convey resources but not for those that convey normative expectations. Each quadrant contains examples of the content that may flow through these ties. The quadrants differ in terms of their significance for job performance and mobility. Resource flows are primarily linked to job performance. This typology allows the authors to analyze the effects of structural holes on mobility and how they vary across types of network ties. They focus on 5 types of informal ties: task advice, strategic information, “buy-in” or “fate control”, social support, and mentorship (see below). Research design Questionnaire conducted among 658 managers at a high-technology engineering firm with 25,000 employees worldwide. Dependent variable: Grade advancement (i.e. this allows one to only concentrate on vertical upward shifts )
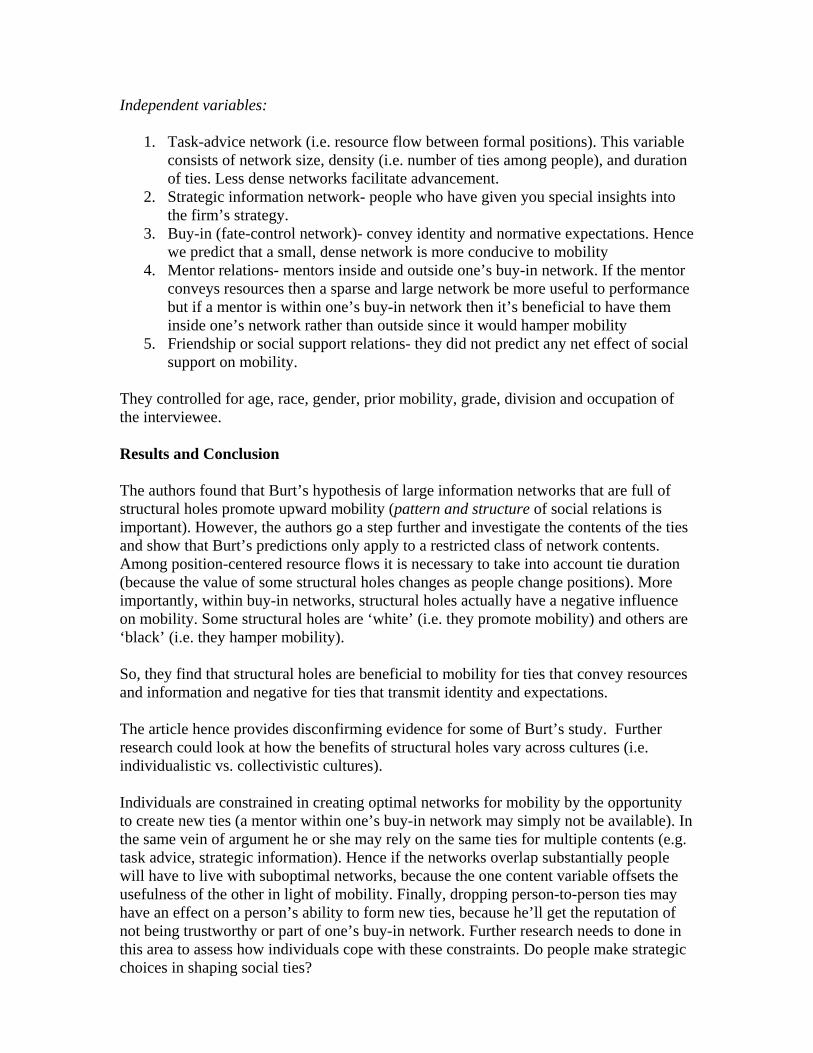
Independent variables:
1. Task-advice network (i.e. resource flow between formal positions). This variable consists of network size, density (i.e. number of ties among people), and duration of ties. Less dense networks facilitate advancement.
2. Strategic information network- people who have given you special insights into the firm’s strategy.
3. Buy-in (fate-control network)- convey identity and normative expectations. Hence we predict that a small, dense network is more conducive to mobility
4. Mentor relations- mentors inside and outside one’s buy-in network. If the mentor conveys resources then a sparse and large network be more useful to performance but if a mentor is within one’s buy-in network then it’s beneficial to have them inside one’s network rather than outside since it would hamper mobility
5. Friendship or social support relations- they did not predict any net effect of social support on mobility.
They controlled for age, race, gender, prior mobility, grade, division and occupation of the interviewee. Results and Conclusion The authors found that Burt’s hypothesis of large information networks that are full of structural holes promote upward mobility (pattern and structure of social relations is important). However, the authors go a step further and investigate the contents of the ties and show that Burt’s predictions only apply to a restricted class of network contents. Among position-centered resource flows it is necessary to take into account tie duration (because the value of some structural holes changes as people change positions). More importantly, within buy-in networks, structural holes actually have a negative influence on mobility. Some structural holes are ‘white’ (i.e. they promote mobility) and others are ‘black’ (i.e. they hamper mobility). So, they find that structural holes are beneficial to mobility for ties that convey resources and information and negative for ties that transmit identity and expectations. The article hence provides disconfirming evidence for some of Burt’s study. Further research could look at how the benefits of structural holes vary across cultures (i.e. individualistic vs. collectivistic cultures). Individuals are constrained in creating optimal networks for mobility by the opportunity to create new ties (a mentor within one’s buy-in network may simply not be available). In the same vein of argument he or she may rely on the same ties for multiple contents (e.g. task advice, strategic information). Hence if the networks overlap substantially people will have to live with suboptimal networks, because the one content variable offsets the usefulness of the other in light of mobility. Finally, dropping person-to-person ties may have an effect on a person’s ability to form new ties, because he’ll get the reputation of not being trustworthy or part of one’s buy-in network. Further research needs to done in this area to assess how individuals cope with these constraints. Do people make strategic choices in shaping social ties?

In Praise of Hierarchy Elliott Jaques, 1990, Lecture, Week 4 Although managerial hierarchy is though of as killing initiative and creativity, the author argues that managerial hierarchy is the most efficient and in fact the most natural structure “ever devised” for large organisations. Properly structured, hierarchy can release energy and creativity, rationalise productivity and actually improve morale. Problems of hierarchy: • How to release and sustain thrust, initiative and entrepreneurship amongst the people
who work in corporate hierarchies. • Excessive layering • Few manager seem to add real value to the work of their subordinates • Hierarchies foster nastier human behaviour; greed, insensitivity, careerism and self
importance Advantage of hierarchy: • It is the only form of organisation that can enable a company to employ large numbers
of people and yet preserve unambiguous accountability for the work they do. Groups According to Jaques, solutions that concentrate on groups fail to take into account the real nature of employment systems. People are not employed in groups, they are employed individually, and their employment contracts are individual, you can’t promote or fire a group. Authority is secondary, but accountability is vital. For example, if the manager of the group is held accountable for the outcomes, then in the final analysis, he will have to agree with group decisions or have the authority to block them, which means that the group never really had decision-making power to begin with. If on the other hand groups are allowed to make decisions without their manager’s approval, then accountability will suffer, for if a group does badly, the group is never fired. In the long run, therefore group authority without group accountability is dysfunctional, and group authority with group accountability is unacceptable. For hierarchy to work properly is important to place emphasis on accountability for getting the work done. The problem is not to find an alternative to hierarchy but to make it work efficiently. The tasks and mental work we carry out are not only more or less complex as they separate out into discrete categories or types of complexity. Hierarchy has the opportunity to meet four of any organisation’s fundamental needs:
- to add value to work as it moves through the organisation, - to identify and nail down accountability at each stage of the value adding process, - to place people with the necessary competence at each organisational layer - and build a general consensus and acceptance of the managerial structure that
achieves these ends.
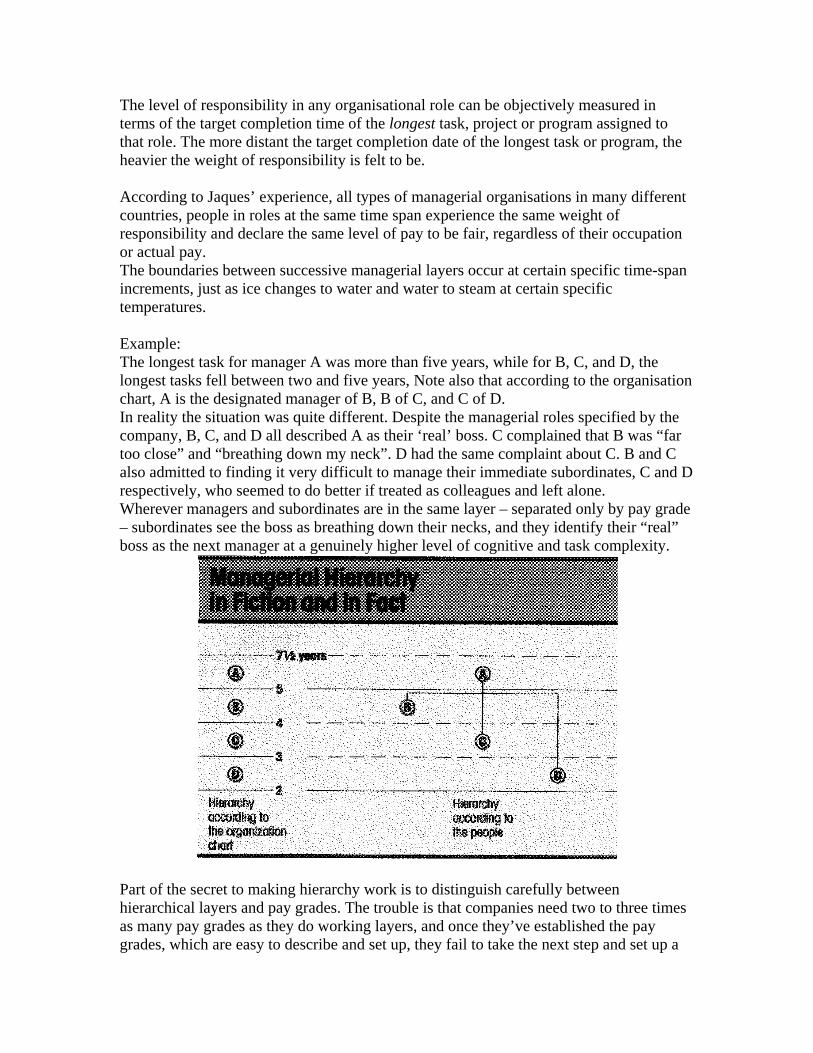
The level of responsibility in any organisational role can be objectively measured in terms of the target completion time of the longest task, project or program assigned to that role. The more distant the target completion date of the longest task or program, the heavier the weight of responsibility is felt to be. According to Jaques’ experience, all types of managerial organisations in many different countries, people in roles at the same time span experience the same weight of responsibility and declare the same level of pay to be fair, regardless of their occupation or actual pay. The boundaries between successive managerial layers occur at certain specific time-span increments, just as ice changes to water and water to steam at certain specific temperatures. Example: The longest task for manager A was more than five years, while for B, C, and D, the longest tasks fell between two and five years, Note also that according to the organisation chart, A is the designated manager of B, B of C, and C of D. In reality the situation was quite different. Despite the managerial roles specified by the company, B, C, and D all described A as their ‘real’ boss. C complained that B was “far too close” and “breathing down my neck”. D had the same complaint about C. B and C also admitted to finding it very difficult to manage their immediate subordinates, C and D respectively, who seemed to do better if treated as colleagues and left alone. Wherever managers and subordinates are in the same layer – separated only by pay grade – subordinates see the boss as breathing down their necks, and they identify their “real” boss as the next manager at a genuinely higher level of cognitive and task complexity.
Part of the secret to making hierarchy work is to distinguish carefully between hierarchical layers and pay grades. The trouble is that companies need two to three times as many pay grades as they do working layers, and once they’ve established the pay grades, which are easy to describe and set up, they fail to take the next step and set up a
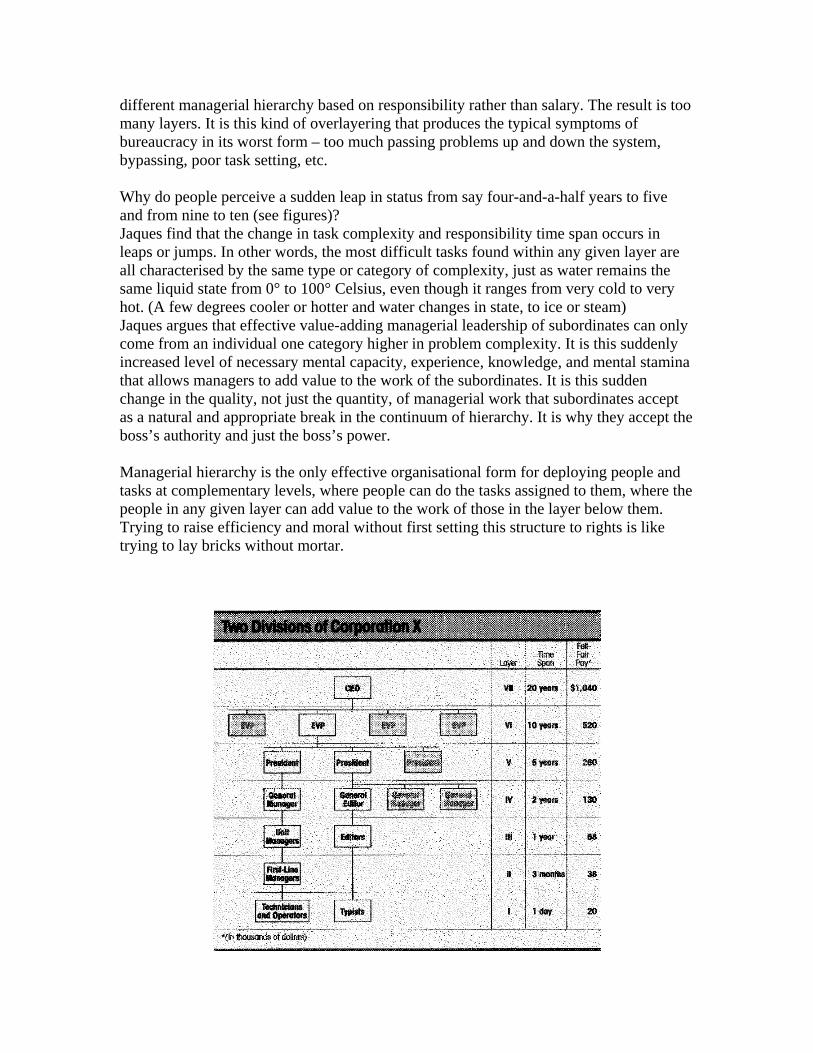
different managerial hierarchy based on responsibility rather than salary. The result is too many layers. It is this kind of overlayering that produces the typical symptoms of bureaucracy in its worst form – too much passing problems up and down the system, bypassing, poor task setting, etc. Why do people perceive a sudden leap in status from say four-and-a-half years to five and from nine to ten (see figures)? Jaques find that the change in task complexity and responsibility time span occurs in leaps or jumps. In other words, the most difficult tasks found within any given layer are all characterised by the same type or category of complexity, just as water remains the same liquid state from 0° to 100° Celsius, even though it ranges from very cold to very hot. (A few degrees cooler or hotter and water changes in state, to ice or steam) Jaques argues that effective value-adding managerial leadership of subordinates can only come from an individual one category higher in problem complexity. It is this suddenly increased level of necessary mental capacity, experience, knowledge, and mental stamina that allows managers to add value to the work of the subordinates. It is this sudden change in the quality, not just the quantity, of managerial work that subordinates accept as a natural and appropriate break in the continuum of hierarchy. It is why they accept the boss’s authority and just the boss’s power. Managerial hierarchy is the only effective organisational form for deploying people and tasks at complementary levels, where people can do the tasks assigned to them, where the people in any given layer can add value to the work of those in the layer below them. Trying to raise efficiency and moral without first setting this structure to rights is like trying to lay bricks without mortar.
LEADING BY EXAMPLE IN THE PRESENCE OF FREE RIDER INCENTIVES Gächter, Renner (2004)
Leading by example or “role modelling” – frequently used in order to enhance the followers’ motivation, especially if the desired behaviour cannot be enforced by other means like rewards or penalties.
Outline of the experiment: - A simple team cooperation dilemma in which complete free riding is a dominant strategy, but the
total surplus would be maximised if all players contribute their whole endowment - Leading by example is implemented as a sequential decision making process (leaders decide first
on their contribution to the team project, his decision is then conveyed to the followers who decide privately on their contribution)
Main objective of the experiments is to examine: 1. Whether a leader effect can be observed 2. Whether it positively affects the behaviour of the leader and subjects in the leader role raise their
level of cooperation 3. Whether the presence of a leader enhances efficiency and groups with a leader achieve higher
cooperation rates Design of the experiment Each of the 4 team members has to decide on how many out of 20 tokens to keep and how many
tokens to contribute to team project The size of the team project is the sum of all contributions to it Regardless of what the other group members contribute, every individual is better off by keeping
all tokens for himself = therefore, the only Nash equilibrium is full free riding Treatment variations - three categories of treatments: Treatment 0 (control group) - groups with a leader play a one shot game - groups without a leader play simultaneously => Since the experiment is just played once, there is no reason for the followers not to free ride if they want to maximise their payoffs; the leader, anticipating that, has as well no reason to contribute. Treatments 1and 2
o Treatment 1 – subjects who were to become leaders were chosen randomly before the first period started, and then the group played a 10 period team game
o Treatment 2 – subjects first played a no-leader game (10 periods) and then a leader sequence (10 periods). The leaders were subsequently chosen according to their contribution in the first sequence. Therefore, before period 11 started, subjects with either the highest or the lowest average contribution in their group in the previous periods were assigned to the leader role.
Treatments 3 and 4 – The same procedure as in treatment 2, but with increased gains from cooperation. The results
1. Leading by example in a one-shot experiment • Overall, the leaders contributed on average more than their followers and control subjects (those
without a leader) • The more the leaders contributed, the higher were the followers’ contributions • Interestingly, in some groups the followers contributed on average more than the leader • However, from the additional calculations it follows that the average leader would have been
better off if he/she contributed 0 tokens to the team project (their boldness did not get them more earnings)
2. Treatment 1 • Leaders contributed more than subjects in the control groups and more than their followers • The presence of a leader seems not to have mattered much: strange, given the correlation of
leader and follower contributions that was observed in the one-shot experiment • Testing the argument about leader quality -> treatment 2
3. Treatment 2 - The subjects with the highest contribution: Pro social types - The subjects with the lowest contribution: Free rider types • Free riders (in the role of leaders) increased their contribution by 114% (compared to the first
sequence where they were not leaders) • Pro social types, however, don’t change much their behaviour substantially once they become
leaders • Overall, on average pro social types contributed more than free riders, but their average
contributions are not significantly different from the contributions of randomly selected leaders => there is no evidence for the existence of “good” and “bad” leaders
4. Treatments 3 and 4 – the impact of the increased gains • Leaders contribute more than the followers(significantly) and the subjects in the control
groups (insignificantly more) • However, the difference in contributions of leaders and followers is clearly diminished no • When pro social types and free riders become leaders – pro socials do not change their
contributions significantly, while free riders significantly increase their contributions • Overall, it is shown that increased gains from cooperation exert a strong influence on the
overall level of cooperation (the overall contributions are higher on average) => The leadership problem is reduced if the gains from cooperation increase (possible explanation: impact of the presence of a leader on overall cooperation levels)
Conclusion - The results showed that leading by example, in the sense of positively correlated leader and
follower contributions, is present in all repeated team games. - Although, on average, the followers will follow the leader’s example and increase their
contribution, they do so only half-heartedly, in particular, in team games with low gains from cooperation.
- Given this situation, however, on average, it pays to be bold and contribute high amounts.
Hermalin (1998): Toward an Economics Theory of Leadership: Leading by Example Research Problem
- explore leadership within organizations - Most economic analyses focus on formal or contractual relationships and thus miss
the defining feature of leadership: o A leader is someone with followers (voluntary) o How does a leader induce others to follow her?
Economic assumption: Followers follow because it is in their interest to do so because they believe the leader to have better information about what they should do than they have
Findings
- Leadership is about transmitting information to followers o In this light, it is important that the leader can convince her followers that she
is not misleading them to her own benefit (as her profits are increasing in employees’ efforts, she has an incentive to lie)
o There are two ways to convince employees to put in high levels of effort: Leader sacrifice: leader offers gifts to the followers (e.g., pizza, free
coffee) • Such “side-payments” only lead to a second-best outcome
(under symmetric information) because the signal is merely a transfer which has no direct impact on welfare
Leading by example: leader herself puts in high effort thereby convincing followers that she considers it worthwhile
• Superior to the “side-payments” outcome because it is a productive action which directly increases welfare
Limitations
- focus on what the leader does to induce employees to follow her - no consideration why leader is chosen or why some people want to be leaders
Links to other academic concepts/models/literature
- the idea that employees base their actions on a leader’s (first-mover) announcement bears some relation to the “herd behaviour” and “informational cascades” literature
- link to the model developed by Holmström (1982): team production with many agents:
o leader and followers are modelled as members of a team the leader shares the team output so she has an incentive to
exaggerated the value of effort the information structure limits the leader’s ability to coerce
followers, so she must somehow convince them that following is worthwhile
“The Illusion of Leadership: Misattribution of Cause in Coordination Games” by Weber, Camerer, Rottenstreich, and Knez (Lecture 5) Introduction The authors predicted that subjects would underestimate the strength of situational effect (group size) and attribute cause to personal traits of the leaders instead. Leaders would be credited with the success of the small groups and blamed for the failure of the big groups. The research is set within three strands of previous research, namely social psychology (i.e. attributions of cause for a certain outcome), game theory (i.e. weak-link games: being unsure what others will do creates strategic uncertainty to go for the highest payoff because it can also involve low earnings and costs of effort, subjects prefer to reciprocate what others do), and organizational behavior (i.e. psychological evidence of misattributions of leadership). Research design Experiment 1- Players were assigned to either a group of 10 or pairs. 8 rounds were played in which each player chose a personal fee and finally the lowest personal fee chosen would determine the size of the reward to be paid to all the members of the group. The leader gave a speech to encourage coordination after round 2. Participants were given a questionnaire after round 2 and after the leader’s speech. Experiment 2- It adds to experiment 1 by asking players whether they want to cast a costly vote ($0.25) to replace the leader after round 8 and then play an additional 4 rounds. Experiment 3- Instructions presented subjects with a more realistic and familiar task (i.e. a project team producing a series of reports and they earn money on how rapidly the report is produced Results Experiment 1- Fees are not significantly different between large and small groups in round 1 and 2. This is consistent with the theory that participants fail to realize group-size effects. After the leader’s speech outcomes of the questionnaires differ considerably. Leaders in small groups were judged effective while leaders of the large groups were judged ineffective. Subjects realize the situational effect but fail to adjust for it sufficiently in judging the leaders. Experiment 2- first part was an exact replication of the results of experiment 1. More subjects vote to replace the leader after round 8 in large groups than in small groups. Participants are willing to act upon their attributions to bad leaders. Experiment 3- Replicates experiment 1’s results. They blame leaders despite the fact that they realize the situational difficulty of large groups. A more realistic situation does hence not weaken misattributions to leadership quality.
Conclusion The research establishes that attribution is a mistake given the awareness of the situational variable. The general argument made in previous research is that leadership is ‘romanticized’. One part of this argument says that the true effect of different leaders on outcome is small. The other part says that performance tends to be attributed to leadership skill. In low-performance cue conditions, while leadership skill is held constant, leaders are rated lower than in high-performance cue conditions (“Performance-cue paradigm”). However, a key criticism is that when certain actions are unobservable subjects should use performance to rate the leader (e.g. success of an operation by a surgeon). In authors’ experiments all actions are observed and hence it is a misattribution of leadership. In real life people often misattribute success. For example, being the coach of a team with only star players is less difficult than being the coach of a team with worse players. In terms of game theory the article adds by questioning the belief that the game is assumed to be commonly known (there is little scope for players to make errors in deciding whether outcomes were caused by other players, chance moves, or by game structure). In our game we used a situational variable for which players could blame the leaders (i.e. high or low quality leaders).
Piece Rate, Fixed Wages and Incentives: Evidence from a Field Experiment Bruce Shearer
MN 426: Week 6
- This paper uses data from field experiment to estimate the gain in productivity that is realized when workers are paid piece rate rather than fixed wages.
Experimental Design and Details: - Experimental settings allow the direct identification of the incentive effect
through a comparison of average productivity under different compensation systems. In other words, gathering experimental evidence helps solve the endogeneity problem (Endogeneity problem: Firm’s choice and workers’ productivity may partially be affected by unobservable factors which are not incorporated in the model)
- The experiment was conducted within a tree-planting firm. Nine male planters
were randomly selected and were observed planting under both piece rates and fixed wages.
- Tree-planting industry is well suited this study of incentive effect as there is no
team production and there exists a good measure of each worker’s productivity. Size of firm is small enough that planters work under supervision of firm manager and monitors. (The planting was controlled for quality by the firm.)
- Measure of Productivity: As planting is simple but physically exhausting work,
the productivity of the planters is determined by their effort level as well as the conditions of the terrain on which they are planting (the ground which is hard or rocky takes more time and effort to plant).
- Piece rates setting: Workers are paid strictly in proportion to their individual
output—no base wage is received. Higher piece rates correspond to tougher planting conditions. Fixed wages setting: The firm did not set standard under fixed wages. (If worker were required to meet daily production standard, they would choose effort level that meet standard exactly. This was confirmed by the manager, and is also evident in the data.)
- The experiment was conducted under randomized-block design. Three blocks of
land were chosen on which to conduct the experiment. Each block of land was internally homogeneous in terms of planting conditions, yet differed from the other two. Each block of land was divided into two parts, or compensation regions—one to be planted under piece rates and the other to be planted under fixed wages.
- A group of nine male planters was randomly selected and each planted an equal
number of days under each compensation system. At the beginning of each workday, each planter was randomly assigned to an area of land within his compensation region, and informed of his compensation system for that particular day.
Results:- Workers were more productive under piece rates than fixed wage wages—the
difference in average productivity being 219 trees. This represents an increase in average productivity of approximately 21% when worker ware paid piece rates. Also, average productivity for each planter is higher under piece rates.
- The variance of worker output is higher under piece rates. This reflects that
worker adjust their effort to changing conditions when they are paid piece rates. - Workers earned more when planning under piece rates. But piece rates provided
lower unit cost than fixed wages (by 13%). - The lower bound to incentive effect is calculated as 21.7%, which suggests that
the unconditional incentive effect will not decrease much outside of the sample. This means that the model developed in this paper permits generalization of the incentive effect on non-experimental planting condition.
- This model also permits evaluation of alternative compensation policies within the
firm. o The fixed rate would lead to a 2.7% increase in unit costs relative to piece
rates in the present labor market conditions. o Efficiency wages are considered as a possible alternative to piece rates. o In order to enforce the higher level of effort observed under piece rates, a
higher wage must be paid. Further Research: - The result from this paper coincides with the results presented by Lazear (2000),
who studied windshield installers in US. Replication studies in other industries will allow to further comparisons along these lines.
- Workers may self-select into firms based on the compensation system, implying a
permanent change may lead to turnover within the firm. Lazear (2000) found that turnover was significant after a change from fixed wages to piece rates. Then, the analysis should be further extended to allow for general equilibrium effects in incentive models.
Shirking or work morale? The impact of regulating Bruno S. Frey Views on shirking
• Shirking is very common in principal-agent relationships due to the problems of information, incomplete contracts, costly monitoring.
• Standard economics assume that rational agents shirk, and they have to be disciplined by monitoring and regulating.
• So, a lot of effort is put in to find out the ways to “discipline” agents, i.e. by unemployment.
• This article shows how the disciplining activities such as regulations affect the work morale of employees. And suggests that it is important to target the regulations according to the specific work morale of individual agents.
Importance of work morale
• Work morale has a significant influence on the effort level chosen by the agents. • Morale is much more effective in determining the behavior (work effort in this
case) than regulations in some cases. Four cases are given: (not very important) 1. It is difficult to formulate regulations and monitor whether they are being
followed. Individuals have little incentives to follow them. For example, spitting on the streets and littering in public. This could relate to work conditions as well.
2. When the quality of performance is difficult to observe, regulations are relatively ineffective. Example; doctor-patient, lawyer-client relationships which are strongly based on trust.
3. In collective decision makings, it is difficult to evaluate performance of an individual.
4. When activities require a high degree of discretionary decision making e.g.; management, advanced teaching, complex tasks such as research and invention.
Implicit contract and the misattribution effect
• When there is no monitoring (it is a form of regulation), the employment relationship has an “implicit contract” also called “psychological contract” by the psychologists. It means that, the principal offers recognition of the employee’s work morale. The agent values the recognition positively and puts in more effort compared to when there is less recognition by the principal. Higher recognition is in a way a non-monetary reward for the agent.
• However, when agents are monitored (regulated) more tightly, then it shows that
principals do not trust the agents. The principals attribute a particular work
morale to them. The consequence is, those agents with high morale and do not shrink now are attributed a lower morale than they actually have. Agents feel that their actual high morale is not acknowledged by the principal. As a result, the implicit contract is broken by the principals and agents respond by reducing their work morale. In the end, shirking increases. This is called the misattribution effect: monitoring crowds out morale.
• Two psychological theories support the crowding out of morale:
a. Norm of reciprocity, the equilibrium of recognition and work morale, included in the implicit contract is disrupted. Employees with the high morale feel that the interaction with the principal no longer yields positive net benefits as their “excess morale” is not appreciated. Equity theory and social exchange theory says that people continue interactions as long as all parties derive net benefits. In this case, employees no longer have net benefits and cut back their effort. Akerlof suggests that a “gift” is offered by the employees but not accepted by the employers. b. Agents with excess morale may feel “overjustified” when the high morale they have is not required because the regulations force a particular behavior upon them anyway. This is similar to the situation when the intrinsic motive of one is negatively affected by the extrinsic rewards.
• In addition to these theories, misattribution effect is also supported by the fact that
most people believe that their performance is better than the average. (This phenomenon is called ipsative) So due to this ipsative misperception, workers feel their work morale is underrated even if the evaluation is correct (even if they actually have a lower morale.) As a result of this misattribution, employees tend to reduce work morale and increase shirking.
• On the other hand, there are some situations in which monitoring and regulating
do not always result in destroying excess morale. If the monitoring clearly prevent “others” from shirking, agents do not feel they have excess morale. Actually, non-shirkers have their interest in others not shirking for equity reasons; they feel it to be unjust if some get the same wage for less effort. The other case is if the standard of work morale determined by the regulations is higher than the actual prevailing one, then the agents slowly adjust their morale upwards. However, this is believed to be hard to achieve.
Uniformity of regulations
• It is difficult for principals to establish regulations directed only at the shirkers. But, when the regulations are uniform, two such errors are likely. -Agents who shirk are not monitored and regulated. The cost is mainly the
negative effects on the non-shirkers. -Agents who do not shirk are monitored. Even if they are not punished they feel
badly because of the mistrust. An attempt to design regulations corresponding to different morale of agents is
costly, so perfect targeting is not achieved. Therefore, the misattribution effect remains.
• There is a distinction between private and public organizations. Private
institutions will use more of differentiation of regulations because they are under competition and are subject to market test so they have to perform better. Public institutions typically have uniform regulations. The result of the tendency to treat employees uniformly is the slightness of wage differentiation: the best workers are paid much less, and worst workers more, than if they were in the private sector. And due to the uniform regulations, there is a stronger tendency to converge to an average work morale. So, in the public sector, distribution of work effort and wages is more compressed than the underlying distribution of skills.
Applications
• Professors at Swiss universities have to teach 8 hours a week. Some of them teach more, despite not being paid, due to their high work ethics. A few professors teach less than 8 hours. The response of ministry of education is to introduce uniform controls applicable to everyone. The superior teaching morale of some professors is thus rejected by the principal. As a result, although those teaching less than 8 hours previously now conform the regulations, but professors teaching more than 8 hours reduce their excess morale and many teach only the necessary 8 hours.
• In Japanese firms also, where there is a high level of trust between workers and
principals, a tightening of a regulation would result in a strong reduction of the work morale. Again, the implicit contract would be broken.
“Pay enough or don’t pay at all” by Gneezy and Rustichini (Lecture 6) The authors found that in not all of the cases offering monetary incentives produced higher performance. In some cases it even lowered performance relative to the situation where no money was offered. Introduction Economic theory predicts that an increase in financial incentives increases performance. The authors’ main result is that performance does not vary in monotonic way with incentives. Factors, different from money, may enter into the decision of the agent (e.g. social norms of for example duty to the community or reciprocity). By offering money the incentive for reciprocity is destroyed and the action becomes less appealing on its own merits. Intrinsic motivation may be replaced by monetary motivation (extrinsic motivation) (the net effect may be a reduction in overall motivation). In economic terms, we can say if the reward directly affects the utility of an individual in a negative way then performance may decline with the increase in monetary incentive. In particular they study the differential effect of small and large rewards on performance. Research design Experiment 1- 4 groups were asked to answer 50 questions taken from an IQ test. 1st group was simply asked to answer as many questions as they could (the problems were chosen such that giving the right answer was mostly dependent upon effort). 2nd group subjects were given an additional payment of 10 cents for every question answered correctly. 3rd group subjects were given an additional payment of 1 NIS for every question answered correctly. 4th group subjects were given an additional payment of 3 NIS for every question answered correctly. Experiment 2- Conducted among a group of high school children who were doing volunteer work. The group was divided into 3 groups. 1st group was the control group (they were simply told how important the work they were doing was). 2nd group in addition to the speech they were promised 1% of the total amount collected. 3rd group in addition to the speech they were promised 10% of the total amount collected. Experiment 3- authors asked the subjects what incentive they would give people working on their behalf (no reward or low-reward). The agent would not know that the principal had decided its payoff, so it would merely be presented with payoffs not knowing that they could have been altered by a principal. Results Experiment 1- Averages of correct answers; 28 in 1st group, 23 in the 2nd, 34.7 in the 3rd, 34.1 in the 4th. The results indicate that the effect of the introduction of monetary incentives and their change affect in the same way individuals with different characteristics, such as higher talent or willingness to put out effort. Experiment 2- Average amount collected; 238.67 for 1st group, 153.67 for 2nd group, 219.33 in the 3rd group. The difference was significant, which as in experiment 1,
indicates that the difference between treatments is uniform among subjects with high and those with low performance. Effect of monetary incentives can be, for small amounts, detrimental to performance. Experiment 3- Most chose a low-reward, which was subtracted from their final payoff and as it induces less effort is the wrong contract in the principal-agent relationship. 87% chose a low reward under experiment 1 and 76% under experiment 2. Conclusion In this model the agent has a utility function of the activity a with monetary reward r, which then becomes u(a,r), which is then added to a function of intrinsic motivation (m(a,r)). The latter term captures the negative effect of r on intrinsic motivation, since the derivative of m in respect of r is negative, hence m decreases in r. Furthermore, one could say that intrinsic motivation is displaced by extrinsic motivation (i.e. rewards). There is hence a discontinuity between an increase in reward and increased performance. An important prediction is that once perception has been changed it is hard to reverse (e.g. mothers choosing to pay the fine for picking up their children late instead of picking them up on time in order to avoid the fine (i.e. no intrinsic motivation anymore). One can call these effects consequences of principals trying to complete incomplete contracts. Small compensation might be seen as insulting and therefore making the practical implications of the research minimal. However, firstly, not all small compensations are seen as insulting (e.g. paying back a small amount for recycling a soft drink bottle may make subjects feel ‘cheap’ when they recycle instead of recycling without the monetary incentive). Secondly, insulting compensations do not have to be small (e.g. a professor being paid $200 per month to move office may find it insulting regardless of the relatively high compensation). Hence it seems widely accepted that a sufficiently high reward reduces the variance around the mean value of the behavior predicted by the theory. There is a fundamental difference in the nature of the two experiments. In the donation experiment there might be more altruistic/intrinsic motivation. Hence making the results even more apparent, because the donation experiment showed a much starker decrease in performance and a higher reward did not even bring the performance back to its level without reward. Contracts, social or private, are usually incomplete, and regulate an interaction in a situation of incomplete information. The introduction of a reward modifies some terms of the contract but also provides information. New behavior is a response to the new information and payoff structure. Standard Bayesian updating of information seems unsuited for this situation.
INCENTIVES FOR HELPING ON THE JOB: THEORY AND EVIDENCE Drago, Garvey (1998)
- This article develops and tests a model of how commonly used incentive schemes affect workers’ choices to help one another.
- The evidence from the research run consistently supports the hypothesis that helping efforts are reduced, while individual efforts are increased, when promotion incentives are strong.
- Piece rates and profit sharing appear to have little effect on helping efforts, while task variety and helping efforts are positively correlated.
Theoretical Model
- two workers that might compete for a promotional prize - each agent selects two types of effort: its own (which directly increases his or her own measured
contribution to output), and the helping effort (increases the measured contribution of the other worker)
=> In essence, help by worker 1 increases the productivity of worker 2, and worker 2 receives at least partial credit for this increase even though it was in fact due to worker 1’s help.
- It is important the notion that increasing incentives for one type of effort will increase the cost of other types of effort.
- Theoretical equilibrium implies: o A larger promotional prize reduces helping o Piece rates reduce helping efforts indirectly, by raising own effort and thereby the
opportunity cost of helping o Tournaments have the greatest absolute value effect on helping incentives – not only by
raising the opportunity cost of helping, but also by directly punishing the agent for helping
Data and Methodology
Data used from 1988 survey of non-supervisory employees at 23 workplaces in Australia (skewed toward manufacturing: 82% of respondents are employed in that industry).
Individual respondents were later classified into work groups based on additional research The questionnaire included 11 items addressing the behaviour of fellow employees The authors were able to extract individual levels of help by subtracting perceived help
provided by others from a measure of overall work-group help. Additionally, prizes take the form of ex post differences in compensation between “winners”
and “losers”. Findings
Piece rate - negatively related to helping efforts but it is not statistically significant. Share scheme coefficient is, contrary to predictions, negative but statistically insignificant. More consistent with theory predictions, prize coefficient is negatively and significantly related
to helping efforts, suggesting that tournaments indeed discourage helping efforts. The task variety variable attracts a positive and significant coefficient, consistent with the
notion that a broad range of tasks increases potential gains from trade in helping efforts.
However… Alternative proxies for task variety were considered, and proved to be positive, but statistically
insignificant. The model was applied to the smaller sample for which there are no missing data. Evidence suggests that strong unions might inhibit help through narrow and tightly enforced job
classifications (related to the classification of work groups). Helping effort question was stated negatively (workgroups were help is never requested or
received might be coded as always helping since members “never refuse” to help) Efficiency wage explanation
- Testing for absenteeism: reductions are often associated with share schemes - A standard efficiency wage variable fails to attract significance in absence equations = supports
the notion that the “prize” result should not be attributed to efficiency wages Conclusions
The key finding of this article is that worker decisions to help one another are strongly influenced by promotional-based incentives. The data do not support the hypothesis that simple and repetitive jobs induce workers to help others as a way to alleviate boredom or more generally to utilise spare productive capacity. The insight is that firms in which helping is relatively important will optimally choose a small prize for promotion and will exhibit relatively low levels of individual effort and high levels of helping.

Fairness and Retaliation: The Economics of Reciprocity Fehr & Gächter Introduction Reciprocity means that in response to friendly actions, people are nicer and much more co-operative; and in response to hostile actions they are frequently much more nasty and brutal. People repay gifts and take revenge even in interactions with complete strangers and even if it is costly and yields neither present nor future material awards. Cooperative reciprocal tendency is termed as positive reciprocity while retaliatory aspect is called negative reciprocity. In competitive markets with incomplete contracts (Define), reciprocal types dominate aggregate results. When people face strong material incentives to free ride, the self-interest model predicts no cooperation at all. Positive and Negative Reciprocity In reciprocity, individuals respond to friendly or hostile action even if no material gain is expected. Normative power of reciprocity has an important impact on social policy issues; they are much less likely to be endorsed by public opinion when they award people independent of whether and how much they contribute to society. Positive reciprocity does not appear to diminish even if even if monetary stake size is high: Fehr and Tougareva found strong positive reciprocity is an experiment conducted in Moscow where individuals earned an average of 10 weeks salary in a 2 hour experiment. Number of subjects who show a concern for fairness and behave reciprocally in one shot games is relatively high. Studies show that fraction of fraction of subjects exhibiting reciprocal choices is between 40-60%. There is an emerging consensus that propensity to punish harmful behavior is stronger than the propensity to reward friendly behavior (Offerman, 1999; Charness and Rabin, 2000). Desire to punish hostile intentions and to reward kind intentions is also important (Rabin 1993, Blount, 1995; Falk and Fischbacher , 1999) Public Goods For self interested agents, public good represent a difficulty that since all agents will want to be free-riders on the efforts of others, no agent will contribute willingly to public good. Positive reciprocity means that people are willing to contribute to a public good if others are also willing, because it represents a kind action which induces reciprocally motivated people to contribute. Negative reciprocity can play the role that if subjects expect others to free ride, they interpret this as a hostile act and they can punish others by free riding too.

Self interested types free ride because they are self-interested, and reciprocal types free ride because they observe others free riding. Impact of negative reciprocity changes radically if others are given the chance to observe the contribution of others, and are given a chance to punish those who do not contribute. It is important that punishment is costly for the imposing agent as selfish subjects will never punish. According to a Fehr and Gatcher study, the more a subject free rides relative to others, the more it gets punished. Free riders are punished irrespective of whether there are future rewrds for the punisher. This has a larger disciplining effect on subject’s cooperation behavior. Social Norms It can be thought of as a behavioral public good where in which everyone should make a positive contribution – that is, follow the norm, and should be willing to enforce the social norm with informal social sanctions, even at some immediate cost to themselves. Studies on social norms
• Regulate use of common pool resources (Ostrom, 1998) • Ways land owners settle disputes (Ellickson, 1994) • Play important role in collective action problems (Elster, 1989) and in provision
of public goods (Ostrom 1998) Social norms are not necessarily beneficial for society. Depending on the specific context of the norm, it may deter or encourage socially beneficial behavior. Reciprocity as a contract enforcement device Conjecture that reciprocity plays as important role in choice of effort has been experimented often. Study by Gachter and Kirchsteiger (1997) concludes that in response to generous job offers, people on an average are willing to put forward extra effort above the implied limit induced by monetary considerations. Another study by Fehr, Gachter and Kirchsteiger (1997) concludes that a selfish employer will never reward or punish since it is costly. Reciprocity contributes to enforcement of contracts; provides incentives for potential cheaters to cooperate and limit their degree of on-cooperation. Work Motivation and Performance Incentives Explicit incentives may cause a hostile atmosphere of threat and distrust, which reduces reciprocity based extra effort. Study shows that reciprocity based effort elicitation and explicit performance may be in conflict with one another. Explicit incentives may crowd out reciprocal choices.
Wage rigidity, rent sharing and competition Fehr and Falk (1999) confirm the existence of downward wage rigidity in a version one of the most competitive environment – competitive double auction. Data analysis shows that employers high wage policy in the market with incomplete contracts could sustain higher effort levels and increase effort levels relative to a low wage policy. Managers are reluctant to cut wages in recession as it expresses hostility to workers and is interpreted as an insult (Bewley, 1999). Firms reduce employment in response to workers reciprocity (Falk and Fehr, 2000) Found positive correlation between firms profit opportunities and rent paid to workers. Fehr, Gachter and Kirchsteiger (1996) There exists positive relation between long run wages and profitability of non-unionized industries. (Oswald and Safney, 1996) Foundation of incomplete contracts Implicit contracts are more profitable because they as they induce much higher effort levels. The promised bonus is not cheap talk as reciprocal principals condition bonus payment on effort level. Conditional bonus payments provide a strong pecuniary incentive for agent to perform as desired by the principal. Explicit contracts crowd out positive reciprocity and may induce negative reciprocity.
Fairness and Retaliation: The Economics of Reciprocity Ernst Fehr and Simon Gächter
MN 426: Week 8
- In traditional economics views, human beings are portrayed as self-interested seeking.
- However, many people deviate from purely self-interested behavior in a reciprocal manner.
- Reciprocity means that in response to friendly (hostile) actions, people are frequently much nicer & more cooperative (nasty & brutal) than predicted by self-interested model even it is costly for them and yields neither present of future material rewards.
- When people face strong material incentive to free-ride, he self-interest model predicts no cooperation at all. But, as a consequence of punishing behavior of the reciprocal types, a very high level of cooperation can be achieved.
Positive and Negative Reciprocity: Some Evidence - Terminology: Cooperative reciprocal tendencies = Positive reciprocity; Retaliatory reciprocal tendencies = Negative reciprocity - Reciprocity is fundamentally different from “cooperative” or “retaliatory”
in repeated interaction. In the case of reciprocity, the actor is responding to friendly or hostile action even if no material gain can be expected.
- Reciprocity is also different from altruism because the latter in a form of “unconditional” kindness.
- Evidence for Positive Reciprocity: Smiling waitress gets tipped more than less friendly ones; some people find it is difficult to accept free samples without actually buying anything. In trust and exchange game (see Lecture 8), many Proposers send money and many Responders give back some money (with positive correlation between the amount of money Proposers send to Responder and amount sent back by Responder).
- Evidence for Negative Reciprocity: In ultimatum bargaining experiment (see Lecture 8), Proposers who offer Responder less than 30% of available sum are highly possibly rejected. This is because low offer is viewed as “unfair”.
- Note: (i) There emerges consensus that the propensity to punish harmful actions is stronger than propensity to reward friendly behavior. (ii) It’s found that behavior in the ultimatum game is systematically linked to testosterone level (mediator of males’ willingness to engage in aggressive behavior.
Public Goods: - For a group of self-interested agents, public goods present difficulty that since
all agents will want to free ride on the effort of others, no agent will contribute willingly to public goods.
- Positive reciprocity implies that subjects are willing to contribute something to public good if others are also willing to do so. However, to sustain contributing to public goods as a stable behavioral regularity, a sufficiently high proportion of the agents in the game have to be reciprocally motivated.
- Negative reciprocity explains that people choose to free ride because the observe others free riding. (This is different from self-interested types who
free ride because of their self-interest; even both produce indistinguishable outcome. Public good game provides example where selfish types can induce reciprocal types to make selfish choice.)
- Impact of negative reciprocity changes radically if subjects are given opportunity to observe the contribution of others and punish. When punishment is costly to punisher, self-interested subjects will never punish while reciprocal subjects will choose to punish free riders. This induces selfish type to make cooperative choices.
From Public Goods to Social Norms: - Definition: Social norm is 1) a behavioral regularity that is 2) based on
socially shared belief of how one ought to behave which triggers 3) the enforcement of the prescribed behavior by informal social sanctions.
- Social norm can be though as a sort of behavioral public good. Everybody should make a positive contribution- to follow the norm, and willing to enforce the social norm with informal sanctions even at some cost to themselves.
- Example: Social norms influence 1) work morale and behavior against ate busters, 2) consumption and saving decision, 3) tax evasion and abuse of welfare payment, etc.
- Social norms constitute constraints usually on individual behavior beyond legal, information and budget constraints usually considered by economists.
Reciprocity as a Contract Enforcement Device: - Controlled laboratory experiment provides evidence that reciprocity
substantially contributes to the enforcement contract. The power of reciprocity derives from the fact that it provides incentives for potential cheaters to behave cooperatively or at least to limit their degree if noncooperation.
- From Fehr, Gachter and Kirchsteiger (1997), experimental employers could offer a wage contract that stipulated a binding wage w and desires effort level e^. If the experimental worker accepted this offer, he was free to choose actual effort level e ranging from Min and Max level.
- Result: If employers have no rewarding/punishment opportunity after observing e:
>> Many employers make quite generous offers (offer contracts stipulated a desired effort of e^ = 7; an offered wage implied that workers received 44% of total surplus). Many workers honor this generosity (even 83% of workers still shirk, 73% of this shirk was not fully shirk). People are on average willing to put forward extra effort above what is implied by purely pecuniary consideration.
If employers are allowed to reward/punish workers after observing e: >> Workers chose much higher effort levels; shirking rate declined from 83% to 26%. There’s increase in average effort and aggregate monetary payoff (40%).
Work Motivation and Performance Incentives: - Explicit incentives may cause hostile atmosphere of threat and distrust, which
reduces any reciprocal-based extra effort. - From Fehr and Gachter (2000) experiments, effort level in contract “with no
incentives” and effort levels in contract “with explicit incentives” were
compared. (With explicit incentives contract, employers have possibility to stipulate fine to be paid by worker in case of verified shirking.)
- Result: Except at the low rent levels, the average effort is lower in the presence of the explicit incentives. Explicit incentives may “crowd out” reciprocal effort choices.
Wage Rigidity, rent Sharing and Compensation - Employers are reluctant to cut wages in recession because they doing so may
decrease productivity. - The fact that the presence of reciprocal types in the labor market gives rise to
downward wage rigidity has been demonstrated in number of experiments. - From Fehr and Falk (1999) carried out a series of “double auction” in labor
market; experimental firms and workers can make a wage bids. If the bid was accepted, a labor contract was concluded. Consider 2 treatment conditions- complete and incomplete contract. o Result: In the market with complete contracts, employers take full
advantage of low wage offers made by the worker, and consequently wage are close to competitive level in the market. In contrast, high wage policy in the market with incomplete contracts was quite rational, because in this way they could sustain higher effort levels and increase profits relative to a low wage policy.
- Evidence for rent-sharing: It is found clear positive correlation between firm’s profit opportunities and the rents paid to workers.
Foundations of Incomplete Contracts: - It’s shown that the presence of reciprocal types is an independent source of the
absence of explicit incentives. - Feht, Klein, and Schmidt (2000) conducted an experiment in which principals
had choice between implicit contract (specifies wage and desired effort level, and promised bonus which is not obligated to pay) and explicit contract (same as implicit setting, but here employers can impose a fine on agent being verifiable shirking).
- The self-interest model predicts that the principals prefer explicit contract. But the experimental evidence is far different from this prediction.
- Result: Most employers (88%) chose implicit contract. Those choosing explicit contract made an average loss (-9 tokens/contract), while those choosing implicit ones made profit (26 tokens/contract).
The hidden cost of returns and incentives - Trust and Trustworthiness among CEOs (Fehr and List, 2004) Seminar, Week 8 Question: Do CEOs respond differently to incentives and do they provide incentives differently in situations of trust and trustworthiness - compared to a control group of students? Methodology: Experimental investigation as version of the trust game. 2 treatments for 2 different groups (students and CEOs) Students CEOs - Cuban coffee managers 1. basic trust game (Trust) 2. trust game in which sender (principal) announces a desired payback y~ if actual payback from recipient (agent) is smaller than desired payback y<y~ , the sender can impose a fine on the recipient, f=4. Yet, the he can also abstain from from paying the fine, i.e. f=0. Paying the fine is at the discretion of the principal. (TWP) Results: Overall: CEOs transfer more to the agents and get paid back more than the student. On average, CEO principals and agents send significantly more money either way. There are more trusting and more trustworthy than students. They make themselves more vulnerable than students (trust more) and send more money back (more trustworthy). TWP: If punishment option available but not used the agents pay back more and principals earn more. They pay even more than in the mere trust condition, in which no punishment option is available at all, which formally would be the same as f=0. This suggests that the mere existence of P option allows for higher returns, if the principal refrains from using it. If it is available and eh doesn't use it, i.e. specifies f=0, it gives him the opportunity to signal his trust to the agents, which interpret it that way by paying back more and exhibiting trustworthiness. (HIDDEN RETURNS of INCENTIVES). If f=4 the CEO agents pay back less than if it is not available (HIDDEN COSTS of INCENTIVES). For students it does not make a difference. Principals who choose f=0 transfer more money, i.e. they exhibit more trust if they can indicate their good intentions. Overall, CEOs have the highest efficiency levels and more trust. Interpretation: RECIPROCITY Most important results. Pay back more if principal refrains from using the punishment option ( i.e. f=0).
Just the mere indication of the punishment can be seen as a hostile act and/ or an act of distrust, which is reciprocated by the agent in the same way. If the agent knows it is available but the principal chooses f=0, i.e. refrains from using it, it may be perceived as a kind act which is returned in kind. Problem: Even if all this is case, it does not seem to be fully understood by the subjects as they choose f=4, which leads to lower payoffs. Question: Why are the CEOs more trusting? Because they have learned that this helps? Or did they become more trusting as they moved up the ladder?
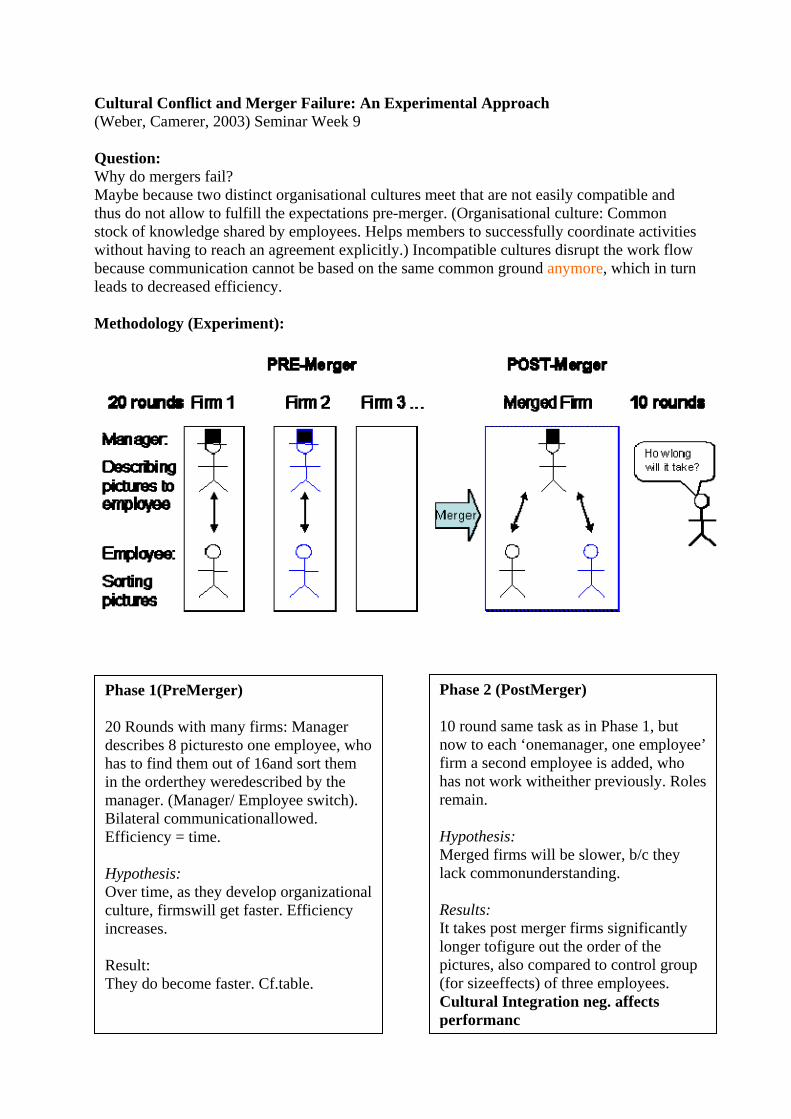
Cultural Conflict and Merger Failure: An Experimental Approach (Weber, Camerer, 2003) Seminar Week 9 Question: Why do mergers fail? Maybe because two distinct organisational cultures meet that are not easily compatible and thus do not allow to fulfill the expectations pre-merger. (Organisational culture: Common stock of knowledge shared by employees. Helps members to successfully coordinate activities without having to reach an agreement explicitly.) Incompatible cultures disrupt the work flow because communication cannot be based on the same common ground anymore, which in turn leads to decreased efficiency. Methodology (Experiment):
Phase 2 (PostMerger) 10 round same task as in Phase 1, but now to each ‘onemanager, one employee’ firm a second employee is added, who has not work witheither previously. Roles remain. Hypothesis: Merged firms will be slower, b/c they lack commonunderstanding. Results: It takes post merger firms significantly longer tofigure out the order of the pictures, also compared to control group (for sizeeffects) of three employees. Cultural Integration neg. affects performanc
Phase 1(PreMerger) 20 Rounds with many firms: Manager describes 8 picturesto one employee, who has to find them out of 16and sort them in the orderthey weredescribed by the manager. (Manager/ Employee switch). Bilateral communicationallowed. Efficiency = time. Hypothesis: Over time, as they develop organizational culture, firmswill get faster. Efficiency increases. Result: They do become faster. Cf.table.
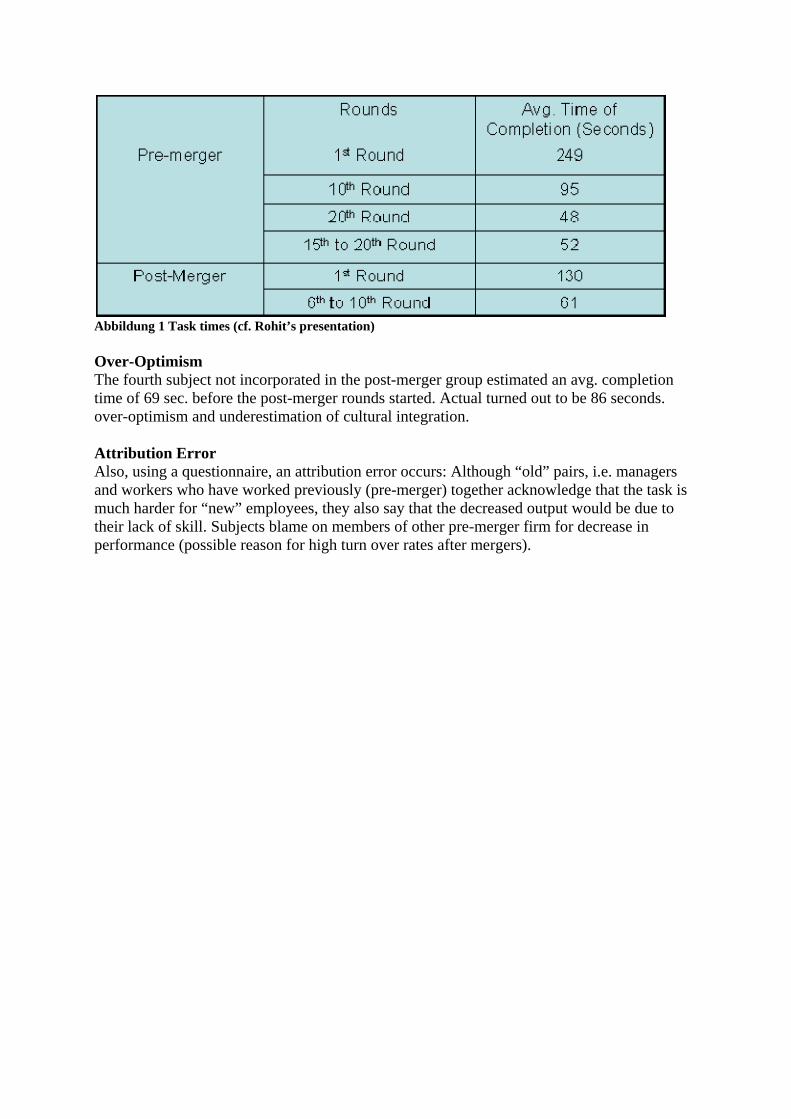
Abbildung 1 Task times (cf. Rohit’s presentation) Over-Optimism The fourth subject not incorporated in the post-merger group estimated an avg. completion time of 69 sec. before the post-merger rounds started. Actual turned out to be 86 seconds. over-optimism and underestimation of cultural integration. Attribution Error Also, using a questionnaire, an attribution error occurs: Although “old” pairs, i.e. managers and workers who have worked previously (pre-merger) together acknowledge that the task is much harder for “new” employees, they also say that the decreased output would be due to their lack of skill. Subjects blame on members of other pre-merger firm for decrease in performance (possible reason for high turn over rates after mergers).
“Exploring the Relationship between corporate social performance and employer attractiveness” by Backhaus, Stone and Heiner (Lecture 10) The authors look at the importance of CSP and explore the effects of the different dimensions on organizational attractiveness. Introduction CSP has been defined as a “business organization’s configuration of principles of social responsibility, processes of social responsiveness and policies, programs, and observable outcomes as they relate to the firm’s societal relationships.” (i.e. CSP is a multidimensional construct) One stream of research suggest that job-seekers look for organizations with which they perceive congruence between their and the organization’s values. A second stream of research concentrates on attributes of the organization. The organization’s image is built up out of a collection of knowledge, beliefs, and feelings about an organization (e.g. CSP). The study adds to current research by looking at: 1. Attitudes of job seekers to CSP and how it affects their decisions 2. It expands the list of CSP dimensions from 5 to 11 3. How the variations in the levels of CSP affect the relationship between CSP and organizational attractiveness 4. Exploring patterns of effects of combinations of CSP ratings on organizational attractiveness. 4 theories related to the importance of CSP: 1. Stakeholder Theory (i.e. good management theory)- good management of relationships with various stakeholders (i.e. those who have vested interests in the firm’s performance and those who are directly affected by the firm’s actions) results in stronger corporate performance. Firms must be responsive to the competing demands of those who hold a stake in the organization. 2. Signaling Theory- organizational characteristics have show to be indicative of personnel practices and job seekers tend to use these characteristics as clues. Individuals use these clues to form conclusions about the firm’s intentions or actions. 3. Social Identity Theory- Individuals derive part of their self-concept from their membership in certain social groups. Individuals suffer detrimental effects of a firm’s negative but also of its positive reputation. 4. Organizational attraction- investigates the effects of organizational characteristics, such as structural attributes, on individuals’ perception of the firm. Previous research suggests that CSP and organizational attractiveness are related. Research design 8 hypotheses:
1. Job seekers rate CSP as an important organizational attribute when considering prospective employers. Signaling and social identity theory suggest that behaviors of the firm that are visible to the public affect self-identity of the worker. Hence hypothesis 2: 2. Environment, community relations, diversity, product issues, and employee relations are more important dimensions of CSP than non-US operations, alcohol, tobacco, gambling, military contracting and nuclear power. The importance of certain aspects of CSP differs by groups of jobseekers. Hypotheses 3 and 4 thus follow, women and minorities use CSP as a signal of potential working conditions 3. Dimensions of diversity more important to female job seekers. 4. Minority job seekers will rate diversity as more important than would be non-minority job seekers. It is important for organizations to convey specific information as well as information that is personally relevant to the job seeker (e.g. organizational structure and image have an effect on the jobseeker’s choice) 5. Firms’ CSP ratings will affect the job seeker’s assessment of employer attractiveness. We can understand CSP’s functions better when we examine them on a dimension-by-dimension basis. 6. Individual dimensions will have differential effects on job seeker’s assessment of employer attractiveness 7. Employee relations will be most influential. Employee relations are very central to the personal effect of CSP upon the jobseeker. 8. Product issues will be second-most influential. Data was collected among 297 undergraduates as an in-class exercise. Students were asked about the importance of CSP in four stages in the recruitment process. Then they were asked about the relative importance of 11 dimensions of CSP. Then they studied the effects of CSP knowledge (i.e. ratings) on attractiveness of firms. Which combinations of variables made a firm more attractive? Results CSP was found to be significantly important. In addition, the CSP dimensions of environment, community relations, diversity, product issues, and employee relations were more important than non-US operations, alcohol, tobacco, gambling, military contracting and nuclear power. Women and minorities rate diversity as an important factor in their job search. Individual dimensions did have different effects on participants’ assessment of firms. The largest changes are associated with the environment, diversity and community relations. The effect of product issues is less and employee relations the least (i.e. hypotheses 7 and 8 are not supported). The analysis also revealed interesting patterns in the way CSP dimension ratings affected firm ratings. Firms with high CSP ratings got high overall ratings. CSP ratings of 1, defined as poor, resulted in the lowest firm ratings. For all dimensions, a CSP rating of 2, defined as neutral, resulted in significantly higher firm ratings. This difference was quite marked, especially in the area of environment. The difference in effect between a CSP rating of 2 and 3, good, again was significant and is particularly dramatic in the area of community relations and diversity. The difference between a neutral and good rating in the areas of environment and employee relations had less impact. In the product issues dimension, a rating of neutral resulted in a better overall
firm rating than the good rating. This was the only dimension that had an outcome that deviated from the expected order. Furthermore, it was found that CSP is important to the overall assessment of a company. CSP is considered most important at the stage in the recruitment process when deciding to take a job offer. After subjects were given information about CSP their ratings of organizational attractiveness dropped significantly. Different categories gave different reactions by respondents (e.g. a poor CSP score in environment created a particular strong negative reaction, but as long as it is acceptable it did not reduce ratings significantly). Community relations and diversity require companies to actually demonstrate positive actions in these areas (subjects set a high benchmark for these in their ratings of firm image). Interactions among categories was also interesting (e.g. low employee relations created low attractiveness ratings even when other factors were high). Conclusion CSP is important in the recruitment process and firm’s with low scores are going to experience problems in attracting talent. There is thus a need for image management, which refers to attempts by an organization to construct positive perceptions of itself to stakeholders (especially in specific dimensions of CSP). Research lacks in the generalizability, there is a need to conduct the research among people at different career stages with different skills, education and experience. It would be interesting to expand the study by looking at CSP in the job/company choice and its importance relative to other factors, such as salary or promotion possibilities. Research should continue to investigate the interaction of positive and negative ratings and how individual differences affect the relationship between CSP and organizational attractiveness. We could also look at studies of actual behavior to avoid social desirability bias.
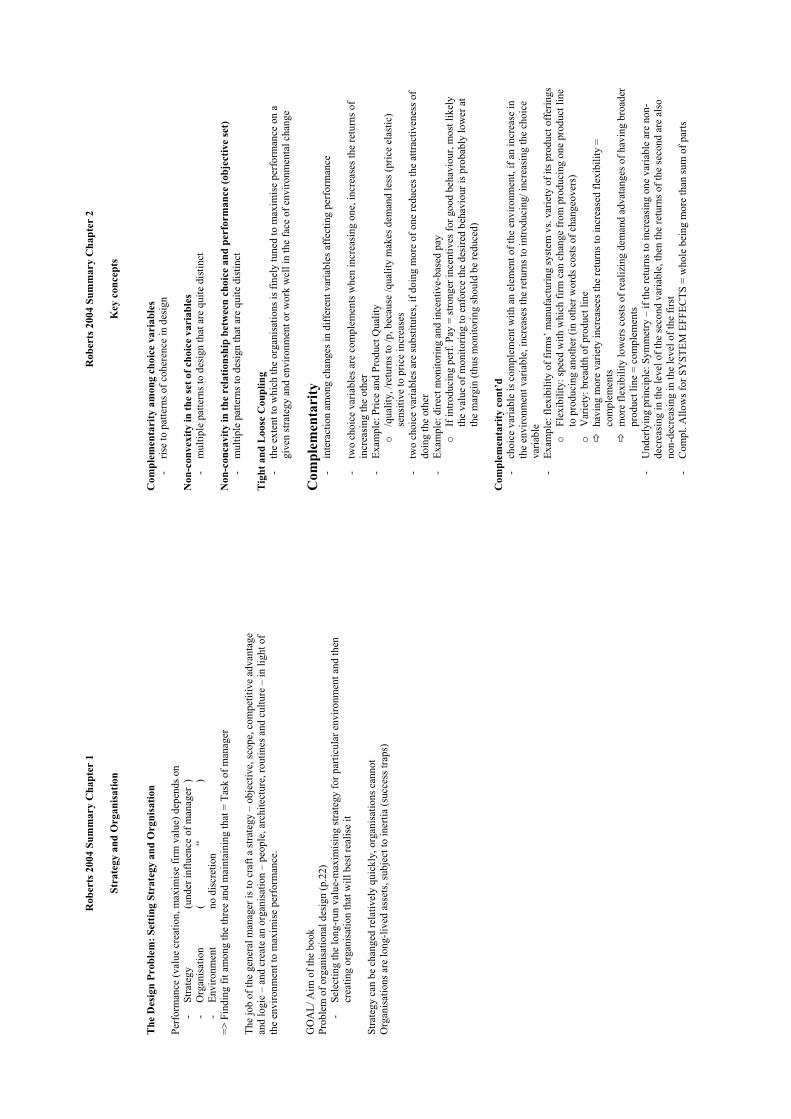
Rob
erts
200
4 Su
mm
ary
Cha
pter
1
Stra
tegy
and
Org
anis
atio
n
The
Des
ign
Prob
lem
: Set
ting
Stra
tegy
and
Org
nisa
tion
Perf
orm
ance
(val
ue c
reat
ion,
max
imis
e fir
m v
alue
) dep
ends
on
-
Stra
tegy
(und
er in
fluen
ce o
f man
ager
)
-
Org
anis
atio
n
(
“
) -
Envi
ronm
ent
no
dis
cret
ion
=> F
indi
ng fi
t am
ong
the
thre
e an
d m
aint
aini
ng th
at =
Tas
k of
man
ager
The
job
of th
e ge
nera
l man
ager
is to
cra
ft a
stra
tegy
– o
bjec
tive,
scop
e, c
ompe
titiv
e ad
vant
age
and
logi
c –
and
crea
te a
n or
gani
satio
n –
peop
le, a
rchi
tect
ure,
rout
ines
and
cul
ture
– in
ligh
t of
the
envi
ronm
ent t
o m
axim
ise
perf
orm
ance
.
GO
AL/
Aim
of t
he b
ook
Prob
lem
of o
rgan
isat
iona
l des
ign
(p.2
2)
-Se
lect
ing
the
long
-run
val
ue-m
axim
isin
g st
rate
gy fo
r par
ticul
ar e
nviro
nmen
t and
then
cr
eatin
g or
gani
satio
n th
at w
ill b
est r
ealis
e it
Stra
tegy
can
be
chan
ged
rela
tivel
y qu
ickl
y, o
rgan
isat
ions
can
not
Org
anis
atio
ns a
re lo
ng-li
ved
asse
ts, s
ubje
ct to
iner
tia (s
ucce
ss tr
aps)
Rob
erts
200
4 Su
mm
ary
Cha
pter
2
Key
con
cept
s
Com
plem
enta
rity
am
ong
choi
ce v
aria
bles
-
rise
to p
atte
rns o
f coh
eren
ce in
des
ign
Non
-con
vexi
ty in
the
set o
f cho
ice
vari
able
s -
mul
tiple
pat
tern
s to
desi
gn th
at a
re q
uite
dis
tinct
Non
-con
cavi
ty in
the
rela
tions
hip
betw
een
choi
ce a
nd p
erfo
rman
ce (o
bjec
tive
set)
-
mul
tiple
pat
tern
s to
desi
gn th
at a
re q
uite
dis
tinct
Tig
ht a
nd L
oose
Cou
plin
g -
the
exte
nt to
whi
ch th
e or
gani
satio
ns is
fine
ly tu
ned
to m
axim
ise
perf
orm
ance
on
a gi
ven
stra
tegy
and
env
ironm
ent o
r wor
k w
ell i
n th
e fa
ce o
f env
ironm
enta
l cha
nge
Com
plem
enta
rity
-in
tera
ctio
n am
ong
chan
ges i
n di
ffer
ent v
aria
bles
aff
ectin
g pe
rfor
man
ce
-tw
o ch
oice
var
iabl
es a
re c
ompl
emen
ts w
hen
incr
easi
ng o
ne, i
ncre
ases
the
retu
rns o
f in
crea
sing
the
othe
r -
Exam
ple:
Pric
e an
d Pr
oduc
t Qua
lity
o/q
ualit
y, /r
etur
ns to
/p, b
ecau
se /q
ualit
y m
akes
dem
and
less
(pric
e el
astic
) se
nsiti
ve to
pric
e in
crea
ses
-tw
o ch
oice
var
iabl
es a
re su
bstit
utes
, if d
oing
mor
e of
one
redu
ces t
he a
ttrac
tiven
ess o
f do
ing
the
othe
r -
Exam
ple:
dire
ct m
onito
ring
and
ince
ntiv
e-ba
sed
pay
oIf
intro
duci
ng p
erf.
Pay
= st
rong
er in
cent
ives
for g
ood
beha
viou
r, m
ost l
ikel
y th
e va
lue
of m
onito
ring
to e
nfor
ce th
e de
sire
d be
havi
our i
s pro
babl
y lo
wer
at
the
mar
gin
(thus
mon
itorin
g sh
ould
be
redu
ced)
Com
plem
enta
rity
con
t’d
-ch
oice
var
iabl
e is
com
plem
ent w
ith a
n el
emen
t of t
he e
nviro
nmen
t, if
an in
crea
se in
th
e en
viro
nmen
t var
iabl
e, in
crea
ses t
he re
turn
s to
intro
duci
ng/ i
ncre
asin
g th
e ch
oice
va
riabl
e-
Exam
ple:
flex
ibili
ty o
f firm
s’ m
anuf
actu
ring
syst
em v
s. va
riety
of i
ts p
rodu
ct o
ffer
ings
o
Flex
ibili
ty: s
peed
with
whi
ch fi
rm c
an c
hang
e fr
om p
rodu
cing
one
pro
duct
line
to
pro
duci
ng a
noth
er (i
n ot
her w
ords
cos
ts o
f cha
ngeo
vers
) o
Var
iety
: bre
adth
of p
rodu
ct li
ne
havi
ng m
ore
varie
ty in
crea
sees
the
retu
rns t
o in
crea
sed
flexi
bilit
y =
com
plem
ents
m
ore
flexi
bilit
y lo
wer
s cos
ts o
f rea
lizin
g de
man
d ad
vata
nges
of h
avin
g br
oade
r pr
oduc
t lin
e =
com
plem
ents
-
Und
erly
ing
prin
cipl
e: S
ymm
etry
– if
the
retu
rns t
o in
crea
sing
one
var
iabl
e ar
e no
n-de
crea
sing
in th
e le
vel o
f the
seco
nd v
aria
ble,
then
the
retu
rns o
f the
seco
nd a
re a
lso
non-
decr
easi
ng in
the
leve
l of t
he fi
rst
-C
ompl
. Allo
ws f
or S
YST
EM E
FFEC
TS =
who
le b
eing
mor
e th
an su
m o
f par
ts
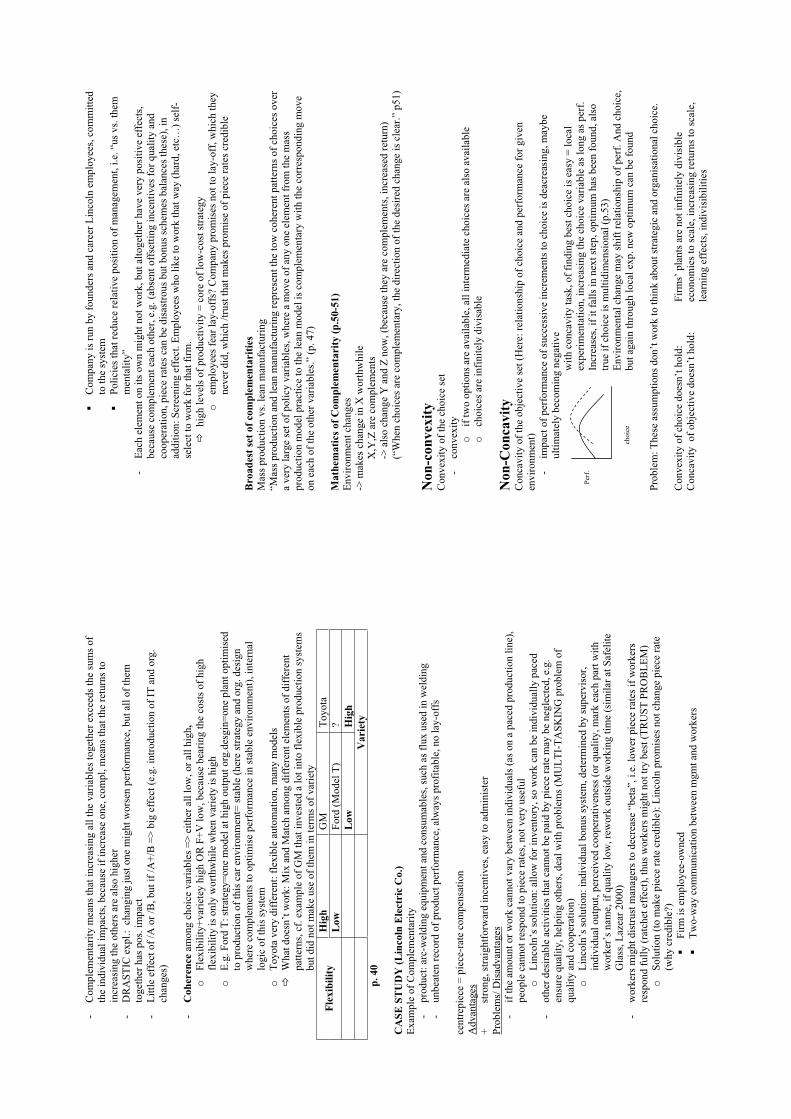
-C
ompl
emen
tarit
y m
eans
that
incr
easi
ng a
ll th
e va
riabl
es to
geth
er e
xcee
ds th
e su
ms o
f th
e in
divi
dual
impa
cts,
beca
use
if in
crea
se o
ne, c
ompl
, mea
ns th
at th
e re
turn
s to
incr
easi
ng th
e ot
hers
are
als
o hi
gher
-
DR
AST
IC e
xpl.:
cha
ngin
g ju
st o
ne m
ight
wor
sen
perf
orm
ance
, but
all
of th
em
toge
ther
has
pos
. im
pact
-
Littl
e ef
fect
of /
A o
r /B
, but
if /A
+/B
=>
big
effe
ct (e
.g. i
ntro
duct
ion
of IT
and
org
. ch
ange
s)
-C
oher
ence
amon
g ch
oice
var
iabl
es =
> ei
ther
all
low
, or a
ll hi
gh,
oFl
exib
ility
+var
iete
y hi
gh O
R F
+V lo
w, b
ecau
se b
earin
g th
e co
sts o
f hig
h fle
xibi
lity
is o
nly
wor
thw
hile
whe
n va
riety
is h
igh
oE.
g. F
ord
T: st
rate
gy=o
ne m
odel
at h
igh
outp
ut o
rg.d
esgi
n=on
e pl
ant o
ptim
ised
to
pro
duct
ion
of th
is c
ar e
nviro
nmen
t= st
able
(her
e st
rate
gy a
nd o
rg. d
esig
n w
here
com
plem
ents
to o
ptim
ise
perf
orm
ance
in st
able
env
ironm
ent),
inte
rnal
lo
gic
of th
is sy
stem
oTo
yota
ver
y di
ffer
ent:
flexi
ble
auto
mat
ion,
man
y m
odel
sW
hat d
oesn
’t w
ork:
Mix
and
Mat
ch a
mon
g di
ffer
ent e
lem
ents
of d
iffer
ent
patte
rns,
cf. e
xam
ple
of G
M th
at in
vest
ed a
lot i
nto
flexi
ble
prod
uctio
n sy
stem
s bu
t did
not
mak
e us
e of
them
in te
rms o
f var
iety
H
igh
GM
Toyo
taFl
exib
ility
Low
Fo
rd (M
odel
T)
?L
ow
Hig
hV
arie
typ.
40
CA
SE S
TU
DY
(Lin
coln
Ele
ctri
c C
o.)
Exam
ple
of C
ompl
emen
tarit
y
-pr
oduc
t: ar
c-w
eldi
ng e
quip
men
t and
con
sum
able
s, su
ch a
s flu
x us
ed in
wel
ding
-
unbe
aten
reco
rd o
f pro
duct
per
form
ance
, alw
ays p
rofit
able
, no
lay-
offs
cent
repi
ece
= pi
ece-
rate
com
pens
atio
n A
dvan
tage
s+
st
rong
, stra
ight
forw
ard
ince
ntiv
es, e
asy
to a
dmin
iste
r Pr
oble
ms/
Dis
adva
ntag
es-
if th
e am
ount
or w
ork
cann
ot v
ary
betw
een
indi
vidu
als (
as o
n a
pace
d pr
oduc
tion
line)
, pe
ople
can
not r
espo
nd to
pie
ce ra
tes,
not v
ery
usef
ul
oLi
ncol
n’s s
olut
ion:
allo
w fo
r inv
ento
ry, s
o w
ork
can
be in
divi
dual
ly p
aced
-
othe
r des
irabl
e ac
tiviti
es th
at c
anno
t be
paid
by
piec
e ra
te m
ay b
e ne
glec
ted,
e.g
. en
sure
qua
lity,
hel
ping
oth
ers,
deal
with
pro
blem
s (M
ULT
I-TA
SKIN
G p
robl
em o
f qu
ality
and
coo
pera
tion)
o
Linc
oln’
s sol
utio
n: in
divi
dual
bon
us sy
stem
, det
erm
ined
by
supe
rvis
or,
indi
vidu
al o
utpu
t, pe
rcei
ved
coop
erat
iven
ess (
or q
ualit
y, m
ark
each
par
t with
w
orke
r’s n
ame,
if q
ualit
y lo
w, r
ewor
k ou
tsid
e w
orki
ng ti
me
(sim
ilar a
t Saf
elite
G
lass
, Laz
ear 2
000)
-
wor
kers
mig
ht d
istru
st m
anag
ers t
o de
crea
se “
beta
”, i.
e. lo
wer
pie
ce ra
tes i
f wor
kers
re
spon
d fu
lly (r
atch
et e
ffec
t), th
us w
orke
rs m
ight
not
try
best
(TR
UST
PR
OB
LEM
) o
Solu
tion
(to m
ake
piec
e ra
te c
redi
ble)
: Lin
coln
pro
mis
es n
ot c
hang
e pi
ece
rate
(w
hy c
redi
ble?
) Fi
rm is
em
ploy
ee-o
wne
d Tw
o-w
ay c
omm
unic
atio
n be
twee
n m
gmt a
nd w
orke
rs
Com
pany
is ru
n by
foun
ders
and
car
eer L
inco
ln e
mpl
oyee
s, co
mm
itted
to
the
syst
em
Polic
ies t
hat r
educ
e re
lativ
e po
sitio
n of
man
agem
ent,
i.e. “
us v
s. th
em
men
talit
y”
-Ea
ch e
lem
ent o
n its
ow
n m
ight
not
wor
k, b
ut a
ltoge
ther
hav
e ve
ry p
ositi
ve e
ffec
ts,
beca
use
com
plem
ent e
ach
othe
r, e.
g. (a
bsen
t off
setti
ng in
cent
ives
for q
ualit
y an
d co
oper
atio
n, p
iece
rate
s can
be
disa
stro
us b
ut b
onus
sche
mes
bal
ance
s the
se),
in
addi
tion:
Scr
eeni
ng e
ffec
t. Em
ploy
ees w
ho li
ke to
wor
k th
at w
ay (h
ard,
etc
…) s
elf-
sele
ct to
wor
k fo
r tha
t firm
. hi
gh le
vels
of p
rodu
ctiv
ity =
cor
e of
low
-cos
t stra
tegy
o
empl
oyee
s fea
r lay
-off
s? C
ompa
ny p
rom
ises
not
to la
y-of
f, w
hich
they
ne
ver d
id, w
hich
/tru
st th
at m
akes
pro
mis
e of
pie
ce ra
tes c
redi
ble
Bro
ades
t set
of c
ompl
emen
tari
ties
Mas
s pro
duct
ion
vs. l
ean
man
ufac
turin
g “M
ass p
rodu
ctio
n an
d le
an m
anuf
actu
ring
repr
esen
t the
tow
coh
eren
t pat
tern
s of c
hoic
es o
ver
a ve
ry la
rge
set o
f pol
icy
varia
bles
, whe
re a
mov
e of
any
one
ele
men
t fro
m th
e m
ass
prod
uctio
n m
odel
pra
ctic
e to
the
lean
mod
el is
com
plem
enta
ry w
ith th
e co
rres
pond
ing
mov
e on
eac
h of
the
othe
r var
iabl
es.”
(p. 4
7)
Mat
hem
atic
s of C
ompl
emen
tari
ty (p
.50-
51)
Envi
ronm
ent c
hang
es
-> m
akes
cha
nge
in X
wor
thw
hile
X,Y
,Z a
re c
ompl
emen
ts
->
als
o ch
ange
Y a
nd Z
now
, (be
caus
e th
ey a
re c
ompl
emen
ts, i
ncre
ased
retu
rn)
(“
Whe
n ch
oice
s are
com
plem
enta
ry, t
he d
irect
ion
of th
e de
sire
d ch
ange
is c
lear
.” p
51)
Non
-con
vexi
ty
Con
vexi
ty o
f the
cho
ice
set
-co
nvex
ityo
if tw
o op
tions
are
ava
ilabl
e, a
ll in
term
edia
te c
hoic
es a
re a
lso
avai
labl
e o
choi
ces a
re in
finite
ly d
ivis
able
Non
-Con
cavi
tyC
onca
vity
of t
he o
bjec
tive
set (
Her
e: re
latio
nshi
p of
cho
ice
and
perf
orm
ance
for g
iven
en
viro
nmen
t)
-im
pact
of p
erfo
rman
ce o
f suc
cess
ive
incr
emen
ts to
cho
ice
is d
eacr
easi
ng, m
aybe
ul
timat
ely
beco
min
g ne
gativ
e w
ith c
onca
vity
task
, of f
indi
ng b
est c
hoic
e is
eas
y =
loca
l ex
perim
enta
tion,
incr
easi
ng th
e ch
oice
var
iabl
e as
long
as p
erf.
Incr
ease
s, if
it fa
lls in
nex
t ste
p, o
ptim
um h
as b
een
foun
d, a
lso
true
if ch
oice
is m
ultid
imen
sion
al (p
.53)
choi
ce
Perf
.
Envi
ronm
enta
l cha
nge
may
shift
rela
tions
hip
of p
erf.
And
cho
ice,
bu
t aga
in th
roug
h lo
cal e
xp. n
ew o
ptim
um c
an b
e fo
und
Prob
lem
: The
se a
ssum
ptio
ns d
on’t
wor
k to
thin
k ab
out s
trate
gic
and
orga
nisa
tiona
l cho
ice.
Con
vexi
ty o
f cho
ice
does
n’t h
old:
Firm
s’ p
lant
s are
not
infin
itely
div
isib
le
Con
cavi
ty o
f obj
ectiv
e do
esn’
t hol
d:
econ
omie
s to
scal
e, in
crea
sing
retu
rns t
o sc
ale,
le
arni
ng e
ffec
ts, i
ndiv
isib
ilitie
s
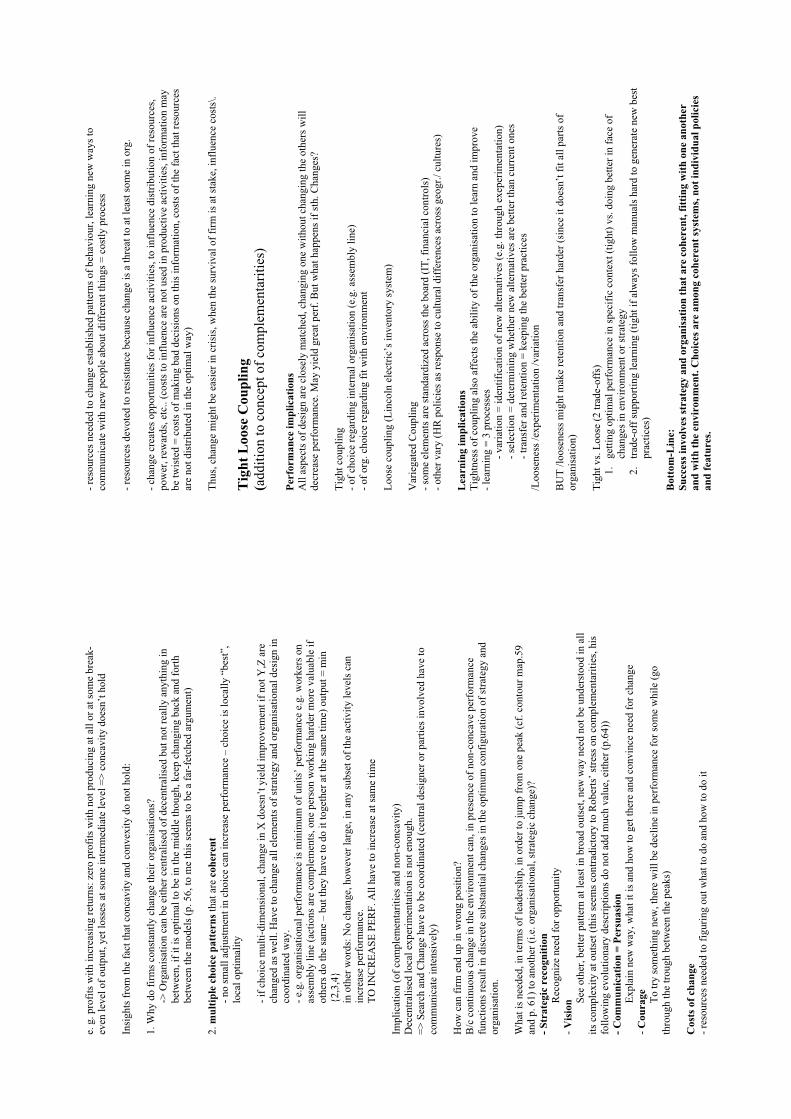
e. g
. pro
fits w
ith in
crea
sing
retu
rns:
zer
o pr
ofits
with
not
pro
duci
ng a
t all
or a
t som
e br
eak-
even
leve
l of o
utpu
t, ye
t los
ses a
t som
e in
term
edia
te le
vel =
> co
ncav
ity d
oesn
’t ho
ld
Insi
ghts
from
the
fact
that
con
cavi
ty a
nd c
onve
xity
do
not h
old:
1. W
hy d
o fir
ms c
onst
antly
cha
nge
thei
r org
anis
atio
ns?
-> O
rgan
isat
ion
can
be e
ither
cen
tralis
ed o
f dec
entra
lised
but
not
real
ly a
nyth
ing
in
betw
een,
if it
is o
ptim
al to
be
in th
e m
iddl
e th
ough
, kee
p ch
angi
ng b
ack
and
forth
be
twee
n th
e m
odel
s (p.
56,
to m
e th
is se
ems t
o be
a fa
r-fe
tche
d ar
gum
ent)
2.m
ultip
le c
hoic
e pa
tter
ns th
at a
re c
oher
ent
- no
smal
l adj
ustm
ent i
n ch
oice
can
incr
ease
per
form
ance
– c
hoic
e is
loca
lly “
best
”,
loca
l opt
imal
ity
- if c
hoic
e m
ulti-
dim
ensi
onal
, cha
nge
in X
doe
sn’t
yiel
d im
prov
emen
t if n
ot Y
,Z a
re
chan
ged
as w
ell.
Hav
e to
cha
nge
all e
lem
ents
of s
trate
gy a
nd o
rgan
isat
iona
l des
ign
in
coor
dina
ted
way
.- e
.g. o
rgan
isat
iona
l per
form
ance
is m
inim
um o
f uni
ts’ p
erfo
rman
ce e
.g. w
orke
rs o
n as
sem
bly
line
(act
ions
are
com
plem
ents
, one
per
son
wor
king
har
der m
ore
valu
able
if
othe
rs d
o th
e sa
me
– bu
t the
y ha
ve to
do
it to
geth
er a
t the
sam
e tim
e) o
utpu
t = m
in
{2,3
,4}
in o
ther
wor
ds: N
o ch
ange
, how
ever
larg
e, in
any
subs
et o
f the
act
ivity
leve
ls c
an
incr
ease
per
form
ance
.
TO IN
CR
EASE
PER
F. A
ll ha
ve to
incr
ease
at s
ame
time
Impl
icat
ion
(of c
ompl
emen
tarit
ies a
nd n
on-c
onca
vity
) D
ecen
tralis
ed lo
cal e
xper
imen
tatio
n is
not
eno
ugh.
=>
Sea
rch
and
Cha
nge
have
to b
e co
ordi
nate
d (c
entra
l des
igne
r or p
artie
s inv
olve
d ha
ve to
co
mm
unic
ate
inte
nsiv
ely)
How
can
firm
end
up
in w
rong
pos
ition
? B
/c c
ontin
uous
cha
nge
in th
e en
viro
nmen
t can
, in
pres
ence
of n
on-c
onca
ve p
erfo
rman
ce
func
tions
resu
lt in
dis
cret
e su
bsta
ntia
l cha
nges
in th
e op
timum
con
figur
atio
n of
stra
tegy
and
or
gani
satio
n.
Wha
t is n
eede
d, in
term
s of l
eade
rshi
p, in
ord
er to
jum
p fr
om o
ne p
eak
(cf.
cont
our m
ap.5
9 an
d p.
61)
to a
noth
er (i
.e. o
rgan
isat
iona
l, st
rate
gic
chan
ge)?
- S
trat
egic
rec
ogni
tion
R
ecog
nize
nee
d fo
r opp
ortu
nity
-V
isio
n
See
othe
r, be
tter p
atte
rn a
t lea
st in
bro
ad o
utse
t, ne
w w
ay n
eed
not b
e un
ders
tood
in a
ll its
com
plex
ity a
t out
set (
this
seem
s con
tradi
ctor
y to
Rob
erts
’ stre
ss o
n co
mpl
emen
tarit
ies,
his
follo
win
g ev
olut
iona
ry d
escr
iptio
ns d
o no
t add
muc
h va
lue,
eith
er (p
.64)
) - C
omm
unic
atio
n =
Pers
uasi
on
Ex
plai
n ne
w w
ay, w
hat i
t is a
nd h
ow to
get
ther
e an
d co
nvin
ce n
eed
for c
hang
e -C
oura
ge
To tr
y so
met
hing
new
, the
re w
ill b
e de
clin
e in
per
form
ance
for s
ome
whi
le (g
o th
roug
h th
e tro
ugh
betw
een
the
peak
s)
Cos
ts o
f cha
nge
- res
ourc
es n
eede
d to
figu
ring
out w
hat t
o do
and
how
to d
o it
- res
ourc
es n
eede
d to
cha
nge
esta
blis
hed
patte
rns o
f beh
avio
ur, l
earn
ing
new
way
s to
com
mun
icat
e w
ith n
ew p
eopl
e ab
out d
iffer
ent t
hing
s = c
ostly
pro
cess
- res
ourc
es d
evot
ed to
resi
stan
ce b
ecau
se c
hang
e is
a th
reat
to a
t lea
st so
me
in o
rg.
- cha
nge
crea
tes o
ppor
tuni
ties f
or in
fluen
ce a
ctiv
ities
, to
influ
ence
dis
tribu
tion
of re
sour
ces,
pow
er, r
ewar
ds, e
tc..
(cos
ts to
influ
ence
are
not
use
d in
pro
duct
ive
activ
ities
, inf
orm
atio
n m
ay
be tw
iste
d =
cost
s of m
akin
g ba
d de
cisi
ons o
n th
is in
form
atio
n, c
osts
of t
he fa
ct th
at re
sour
ces
are
not d
istri
bute
d in
the
optim
al w
ay)
Thus
, cha
nge
mig
ht b
e ea
sier
in c
risis
, whe
n th
e su
rviv
al o
f firm
is a
t sta
ke, i
nflu
ence
cos
ts\.
Tig
ht L
oose
Cou
plin
g (a
dditi
on to
con
cept
of c
ompl
emen
tarit
ies)
Perf
orm
ance
impl
icat
ions
A
ll as
pect
s of d
esig
n ar
e cl
osel
y m
atch
ed, c
hang
ing
one
with
out c
hang
ing
the
othe
rs w
ill
decr
ease
per
form
ance
. May
yie
ld g
reat
per
f. B
ut w
hat h
appe
ns if
sth.
Cha
nges
?
Tigh
t cou
plin
g - o
f cho
ice
rega
rdin
g in
tern
al o
rgan
isat
ion
(e.g
. ass
embl
y lin
e)
- of o
rg. c
hoic
e re
gard
ing
fit w
ith e
nviro
nmen
t
Loos
e co
uplin
g (L
inco
ln e
lect
ric’s
inve
ntor
y sy
stem
)
Var
iega
ted
Cou
plin
g - s
ome
elem
ents
are
stan
dard
ized
acr
oss t
he b
oard
(IT,
fina
ncia
l con
trols
) - o
ther
var
y (H
R p
olic
ies a
s res
pons
e to
cul
tura
l diff
eren
ces a
cros
s geo
gr./
cultu
res)
Lea
rnin
g im
plic
atio
ns
Tigh
tnes
s of c
oupl
ing
also
aff
ects
the
abili
ty o
f the
org
anis
atio
n to
lear
n an
d im
prov
e - l
earn
ing
= 3
proc
esse
s
- var
iatio
n =
iden
tific
atio
n of
new
alte
rnat
ives
(e.g
. thr
ough
exe
perim
enta
tion)
- sel
ectio
n =
dete
rmin
ing
whe
ther
new
alte
rnat
ives
are
bet
ter t
han
curr
ent o
nes
- t
rans
fer a
nd re
tent
ion
= ke
epin
g th
e be
tter p
ract
ices
/L
oose
ness
/exp
erim
enta
tion
/var
iatio
n
BU
T /lo
osen
ess m
ight
mak
e re
tent
ion
and
trans
fer h
arde
r (si
nce
it do
esn’
t fit
all p
arts
of
orga
nisa
tion)
Tigh
t vs.
Loos
e (2
trad
e-of
fs)
1.ge
tting
opt
imal
per
form
ance
in sp
ecifi
c co
ntex
t (tig
ht) v
s. do
ing
bette
r in
face
of
chan
ges i
n en
viro
nmen
t or s
trate
gy
2.tra
de-o
ff su
ppor
ting
lear
ning
(tig
ht if
alw
ays f
ollo
w m
anua
ls h
ard
to g
ener
ate
new
bes
t pr
actic
es)
Bot
tom
-Lin
e:
Succ
ess i
nvol
ves s
trat
egy
and
orga
nisa
tion
that
are
coh
eren
t, fit
ting
with
one
ano
ther
an
d w
ith th
e en
viro
nmen
t. C
hoic
es a
re a
mon
g co
here
nt sy
stem
s, no
t ind
ivid
ual p
olic
ies
and
feat
ures
.
Rob
erts
200
4 Su
mm
ary
Cha
pter
3
The
Nat
ure
and
Purp
ose
of th
e Fi
rm
MA
RK
ET
S -
Spec
ialis
atio
n le
ads t
o m
utua
l dep
ende
nce
(p.7
4)
-Tw
o m
ain
issu
es o
f org
anis
atio
n o
Coo
rdin
atio
nN
eede
d ta
sks a
re c
ompl
eted
with
out d
uplic
atio
n Ta
sks i
ndic
ated
by
stra
tegy
are
car
ried
out i
n a
cost
-min
imal
way
o
Mot
ivat
ion
So n
eede
d ta
sks a
re d
one
in th
e w
ay se
t out
abo
ve
At l
east
cos
ts to
org
anis
atio
n B
ecom
e ne
cess
ary
beca
use
peop
le a
re se
lf-in
tere
sted
and
try
to
min
imis
e co
sts t
hem
selv
es
Mot
ivat
e pe
ople
so th
ey b
ehav
e he
lps a
chie
ving
a c
oord
inat
ed so
lutio
n
-M
AR
KET
= B
ench
mar
k of
mot
ivat
ion/
coo
rdin
atio
n w
ithin
an
orga
nisa
tion
oM
arke
t lea
ds to
inte
rdep
ende
ncie
s am
ong
peop
le to
be
fully
inte
rnal
ized
o
Coo
rdin
ates
act
ions
and
allo
catio
n of
out
com
es
oPr
ovid
e in
tens
e in
cent
ives
for b
ehav
iour
(Mot
ivat
ion
func
tion)
PRO
BL
EM
S of
MA
RK
ET
S?
-H
owev
er, e
cono
mic
act
ivity
shou
ld o
ccur
with
in o
ther
form
s, if
it is
a b
ette
r w
ay to
co
ordi
nate
and
mot
ivat
e th
an d
oes t
he m
arke
t.
o(b
ecau
se o
f mar
ket f
ailu
res,
trans
actio
n co
sts,
uncl
ear p
rope
rty ri
ghts
– q
uite
a
few
exp
lana
tions
for t
he e
xist
ence
of f
irms,
even
if o
ne ta
kes t
he C
oase
th
eore
m, w
ith a
ll pr
oper
ty ri
ghts
cle
arly
def
ined
, the
re a
re m
any
reas
ons w
hy
the
envi
sion
ed b
arga
inin
g m
ight
not
wor
k,
cots
of i
dent
ifyin
g th
e re
leva
nt p
artie
s,br
ingi
ng th
em to
geth
er to
neg
otia
te,
esta
blis
hing
the
term
s and
then
enf
orci
ng th
e ag
reem
ent.)
…
=> M
any
prob
lem
s res
ult f
rom
info
rmat
iona
l pro
blem
s
Mar
kets
fail,
bec
ause
of I
nfor
mat
ion
asym
met
ries
(p.
82)
-
e. g
. sec
ond
cars
, qua
lity
hard
to d
eter
min
e o
SELL
ERS
of g
ood
cars
will
put
reso
urce
s int
o m
akin
g su
re th
at th
ey h
ave
good
car
s – S
IGN
ALL
ING
qua
lity
oB
UY
ERS
will
inve
st re
sour
ces t
o m
ake
sure
wha
t car
they
are
off
ered
, SC
REE
NIN
G q
ualit
y no
eff
icie
nt a
lloca
tion
beca
use,
surp
lus l
ost b
y ea
ting
up th
ese
reso
urce
s (C
f. Sp
ence
197
3)
1. P
robl
em o
f inf
orm
atio
nal a
sym
met
ry (A
dver
se S
elec
tion)
-Tr
ade
brea
ks d
own
com
plet
ely
oIf
elim
inat
ing
info
rmat
ion
asym
met
ry is
not
pos
sibl
e, th
en b
uyer
s will
refu
se to
pa
y m
ore
than
the
expe
cted
val
ue o
f the
goo
d, a
vera
ged
acro
ss a
ll di
ffer
ent
qual
ity le
vels
they
exp
ect t
o be
off
ered
.
oTh
en b
est q
ualit
y go
ods m
ight
not
be
offe
red
at a
ll an
ymor
e, b
ecau
se th
ey
wou
ld o
nly
reap
a m
iddl
ing
pric
e be
low
thei
r tru
e va
lue.
Thu
s the
y ar
e no
t of
fere
d at
all
anym
ore.
=>
offe
red
qual
ity
(i.e
. wha
t is o
ffer
ed, i
s wor
se in
qu
ality
wha
t wou
ld b
e po
tent
ially
ava
ilabl
e) T
HE
sele
ctio
n of
car
s on
offe
r is
not r
epre
sent
ativ
e of
the
unde
rlyin
g di
strib
utio
n of
qua
lity,
it is
an
AD
VER
SE
SELE
CTI
ON
oTh
is is
ant
icip
ated
by
ratio
nal b
uyer
s, th
ey
thei
r WTP
=>
selle
rs w
ith
rela
tivel
y hi
gher
pric
es w
ithdr
aw th
eir c
ars a
s wel
l =>
offe
red
qual
ity
oTh
is a
gain
is a
ntic
ipat
ed b
y ra
tiona
l buy
ers…
. on
ly v
ery
low
qua
lity-
cars
will
be
on o
ffer
in th
e en
d (m
arke
t for
hig
her e
nd
prod
ucts
fail,
alth
ough
ther
e ar
e pe
ople
wou
ld b
e w
illin
g to
pay
for t
hese
, the
y ha
ve th
e re
spec
tive
WTP
)
2. P
robl
em M
OR
AL
HA
ZA
RD
-In
abili
ty to
obs
erve
oth
ers a
ctio
ns, a
nd th
us d
eter
min
e w
heth
er th
ey a
dher
e to
ag
reem
ents
o
Sale
speo
ple
in fi
eld
play
ing
golf?
o
Is k
now
ledg
e w
orke
r thi
nkin
g ab
out j
ob o
r som
ethi
ng e
lse?
-
prob
lem
s, if
info
rmat
ion/
kno
wle
dge
is n
ot o
bser
vabl
e by
thos
e, in
who
se in
tere
sts t
he
actio
ns a
re to
be
take
n o
is m
y br
oker
’s re
com
men
datio
n ju
st b
ased
to g
et c
omm
issi
ons
oam
I de
nied
med
ical
trea
tmen
t bec
ause
not
nee
ded
or b
ecau
se in
sura
nce
does
n’t w
ant t
o pa
y
3. P
robl
em H
OL
D-U
P
Res
ult:
cann
ot w
rite
cont
ract
s =>
no m
arke
ts c
an e
xist
-
only
mea
surin
g pe
rfor
man
ce in
dire
ctly
and
impr
ecis
ely,
onl
y co
ntra
ctin
g on
pro
xies
an
d si
gnal
s rat
her t
han
valu
e-cr
eatin
g ch
oice
s and
act
ions
IN
EFFI
CIE
NC
IES
oM
isdi
rect
ed e
ffor
t o
Mis
allo
catio
n of
risk
o
To lo
w e
ffor
t pro
visi
on
oEx
pend
iture
s on
mon
itorin
g o
Exp
endi
ture
s on
man
ipul
atin
g th
e pe
rfor
man
ce m
easu
res
BU
T: c
an b
e pr
oble
ms w
ithin
firm
s as w
ell
Als
o, e
ven
cont
ract
s tha
t cou
ld b
e en
forc
ed, m
ight
not
be
enfo
rcea
ble
by th
ird p
artie
s. C
an b
e so
lved
by
self-
enfo
rcin
g ag
reem
ents
(whi
ch w
ork
bette
r with
in o
rgan
isat
ions
) – p
artie
s fin
d in
th
eir i
nter
est t
o ad
here
to th
e ag
reem
ent,
even
in a
bsen
ce o
f inc
entiv
es th
at th
roug
h ou
tsid
e en
forc
emen
t.
Com
mitm
ent t
o ag
reem
ents
-
rene
gotia
tion
(p.8
5/86
)
FIR
MS
vs. M
AR
KE
TS
- FIR
MS
exis
ts b
/c o
f - I
nfor
mat
iona
l asy
mm
etry
- C
ontra
ctua
l inc
ompl
eten
ess

Coa
se: f
irms e
xist
s bec
ause
of t
he c
osts
of o
rgan
isin
g ec
onom
ic a
ctiv
ity, t
o ac
hiev
e co
ordi
natio
n an
d m
otiv
atio
n, fi
rms a
re m
ore
effic
ient
than
mar
ket,
i.e. i
t is c
heap
er to
org
anis
e tra
nsac
tion
this
way
, Bou
ndar
ies o
f the
firm
are
eff
icie
nt, c
reat
e m
ost v
alue
.
BU
T no
tion
of e
ffic
ienc
y m
ore
subt
le
-ef
ficie
ncy
of a
ctua
l arr
ange
men
ts is
con
stra
ined
by
info
rmat
iona
l and
obs
erva
tiona
l lim
itatio
ns
LOC
K-I
N-
aris
es b
ecau
se o
f ass
et-s
peci
fity
(ass
ets w
hich
use
d in
the
next
-bes
t use
wou
ld b
e of
m
uch
less
val
ue)
hold
-up
Atte
mpt
s by
tradi
ng p
artn
ers t
o ap
prop
riate
som
e of
the
retu
rns t
hat t
he
asse
t’s o
wne
rs e
xpec
ted
whe
n or
igin
ally
inve
stin
g in
them
, e.g
. A m
akes
in
vest
men
t to
serv
e bu
yer
-on
ce in
vest
men
t is m
ade
– co
sts a
re su
nk, i
.e. e
ven
if A
onl
y re
ceiv
ed v
aria
ble
cost
s fr
om b
uyer
, wou
ld n
ot b
e w
orth
whi
le to
with
draw
-
don’
t pla
y an
y ro
le, w
hen
dete
rmin
ing
how
muc
h va
lue
is c
reat
ed b
y co
oper
atio
n vs
. to
bre
ak o
ff re
latio
nshi
p to
refu
se to
rene
gotia
te a
nd b
reak
off
the
deal
leav
es h
im w
ith th
e ne
arly
wor
thle
ss
asse
t
One
solu
tion:
-
To h
ave
the
buye
r pay
par
t of t
he in
vest
men
t upf
ront
, in
effe
ct, p
ay p
artly
for a
mou
nt
to b
e (m
is)a
ppro
pria
ted
late
r (on
ly if
agr
eem
ent e
nfor
cabl
e)
-B
ring
both
act
ions
und
er o
ne ro
of, v
ertic
al in
tegr
atio
n
CO
STS
INSI
DE
the
FIR
M
Tran
sact
ion
cost
s IN
SID
E th
e fir
m?
(p.9
3)
-co
mm
unic
atio
n up
-and
-dow
n -
info
rmat
ion
over
load
cen
ter/t
op
Sele
ctiv
e In
terv
entio
n? C
over
ed in
cou
rse?
(p. 9
4 et
sqq.
)
Prop
erty
Rig
hts (
p. 9
5)
Why
doe
s int
erve
ntio
n of
hig
her l
evel
s not
wor
k? I.
e. c
an h
igh-
leve
l em
ploy
ees l
imit
them
selv
es to
onl
y ef
ficie
ncy-
enha
ncin
g ac
tiviti
es?
CO
STS
of in
terv
entio
n -
dest
roys
opp
ortu
nity
and
ince
ntiv
es fo
r low
er le
vels
to le
arn
-un
derc
uts t
heir
auto
nom
y an
d th
e pe
rfor
man
ce in
cent
ives
that
com
e w
ith th
at
(Agh
ion/
Tiro
le 1
997)
-
crea
tes o
ppor
tuni
ty fo
r low
er le
vels
to in
fluen
ce th
e in
terv
entio
ns, i
.e. i
nflu
ence
the
deci
sion
s of h
ighe
r lev
els (
basi
cally
, cre
ates
room
for p
oliti
cisi
ng) i
n th
eir i
nter
est
(may
be th
roug
h m
anip
ulat
ion
of in
form
atio
n, b
ecau
se e
xecu
tives
rely
on
thei
r in
form
atio
n)
-C
OST
s of I
NFL
UEN
CE
activ
ities
o
Res
ourc
es w
aste
d on
non
-pro
duct
ive
(onl
y di
strib
utio
nal)
activ
ities
o
Bad
dec
isio
ns m
ight
be
the
resu
lt
o(h
ave
to c
hang
e or
g. d
esig
n in
ord
er to
con
trol i
nflu
ence
act
iviti
es)
Solu
tion
1.lim
it co
mm
unic
atio
n be
twee
n lo
wer
leve
ls
Man
g. (c
f. 3
strik
es a
nd y
ou’r
e ou
t po
licy
at A
BB
2.
stru
ctur
e de
c. p
roce
ss –
(adh
eren
ce to
bur
eauc
ratic
rule
s)
3.lim
it th
e ga
ins t
hat c
an b
e ea
rned
from
influ
ence
act
iviti
es, i
.e. p
ay e
very
body
the
sam
e 4.
outs
ourc
e ac
tivity
, use
out
side
supp
liers
Ther
e co
sts o
f org
anis
ing
inte
rnal
ly (i
nsid
e th
e fir
m),
and
ther
e ar
e co
sts o
f org
anis
ing
in th
e m
arke
t pla
ce. I
f cos
ts in
the
mar
ket a
re h
ighe
r, or
gani
se in
side
the
firm
.
NA
TUR
E O
F th
e FI
RM
-
hier
arch
ic (C
oase
/ Sim
on)
-co
ntra
ctua
l net
wor
k (A
lchi
an/ D
emse
tz)
-fir
ms e
xist
bec
ause
mar
ket i
ncen
tives
mig
ht b
e to
o st
rong
, firm
s can
pro
vide
wea
ker
ince
ntiv
es, e
.g. i
n m
ulti-
task
ing
cont
ext (
here
: inc
entiv
es a
re to
o st
rong
if th
ey c
ause
di
vers
ion
of e
ffor
t fro
m o
ther
val
ued
activ
ities
, for
whi
ch c
anno
t be
give
n eq
ually
st
rong
ince
ntiv
es)
-e.
g. sa
les a
gent
IN-H
OU
SE –
OU
TSID
E
OU
TSID
Eo
sells
man
y pr
oduc
ts
have
to g
ive
stro
ng in
cent
ive
(hig
h co
mm
issi
on ra
te) t
o se
ll yo
urs
also
ince
ntiv
e to
gat
her i
nfor
mat
ion
IN-H
ouse
(sol
utio
n)
ose
ll yo
ur p
rodu
cts,
gath
er in
fo.
-W
eak
ince
ntiv
es, p
ay fi
xed
sala
ry, e
qual
ly b
alan
ced
ince
ntiv
es a
nd a
sk to
sell
prod
uct,
gath
er in
fo, a
dvis
e cu
stom
ers w
ell
Trad
e-O
ffC
oope
ratio
n
-H
elpi
ng o
ther
s, de
velo
ping
ove
rall
bran
d, c
usto
mer
repu
tatio
n of
the
firm
and
In
itiat
ive
(fun
dam
enta
l mul
ti-ta
skin
g pr
oble
m in
an
orga
nisa
tion)
- i
ncre
ase
unit’
s sal
es, s
elf-
inte
rest
=>
the
unde
rlyin
g tra
de-o
ff o
f org
anis
atio
nal d
esig
n, ta
sk if
man
agem
ent t
o pu
sh th
e or
gani
satio
n to
the
coop
erat
ion/
initi
ativ
e-fr
ontie
r, de
pend
s on
HO
W th
e pi
eces
fit t
oget
her
“Peo
ple,
arc
hite
ctur
e, p
roce
sses
, rou
tines
, cul
ture
aff
ect b
ehav
iour
that
is in
duce
d. W
here
an
orgn
isat
ion
wan
ts to
pos
ition
itse
lf, d
epen
ds o
n th
e ac
tiviti
es, i
t is u
nder
taki
ng, w
hat i
t is
tryin
g to
acc
ompl
ish,
i.e.
its s
trate
gy. A
shift
in st
rate
gy m
ight
lead
to a
cha
nge
in th
e or
gani
satio
n. T
he st
rate
gy w
ill a
lso
dete
rmin
e, h
ow m
uch
the
firm
spen
ds o
n or
gani
satio
n,
and
thus
whe
re th
e fr
ontie
r will
lie.
“
Exam
ples
A
BB
= 1
300o
pera
ting
com
pani
es a
nd a
bout
500
0 pr
ofit
cent
ers w
ith a
bout
35
empl
oyee
s eac
h
Vey
stro
ng in
cent
ives
for i
nitia
tive
-R
espo
nsib
ility
ass
igne
d -
Peop
le c
ould
see
impa
ct o
f the
ir ac
tions
on
resu
lts,
mot
ivat
ion
John
son&
John
son
- Hig
h le
vels
of i
nitia
tive
- was
div
ided
into
150
sepa
rate
, ind
ivid
ually
resp
onsi
ble
units
BP
Expl
orat
ion
-D
issa
ggre
gatio
n of
bus
ines
s int
o se
para
te u
nits
with
cle
ar re
spon
sibi
litie
s =>
initi
ativ
e-
But
als
o cr
eate
d ne
ed to
coo
pera
te in
shar
ing
info
rmat
ion
and
best
pra
ctic
es
Solu
tion:
org
anis
ed b
usin
esse
s int
o pe
er g
roup
s, es
tabl
ishe
d no
rms o
f sha
ring
and
info
rmat
ion
and
help
ing
each
oth
er, e
.g. p
ract
ice
of p
eer a
sssi
ts
Nov
o N
ordi
sk
-gr
eat c
risis
-
chan
ges o
rg. d
esig
n. L
eavi
ng la
rge
disc
retio
n to
indi
vidu
al b
usin
ess u
nits
but
in
stitu
ting
syst
ems o
f adh
erin
g m
ore
stro
ngly
to c
ompa
ny p
olic
ies
Prob
lem
: M
easu
ring
coop
erat
ion,
thus
har
d to
pro
vide
form
al in
cent
ives
for i
t. Th
us in
ord
er to
indu
ce
coop
erat
ion,
rely
on
soci
al n
etw
orks
and
nor
ms
Rob
erts
200
4 Su
mm
ary
Cha
pter
4
Mot
ivat
ion
in th
e M
oder
n Fi
rm
From
a d
esig
n pe
rspe
ctiv
e th
e m
otiv
atio
n pr
oble
ms i
s to
brin
g ab
out a
clo
ser a
lignm
ent o
f the
or
gani
satio
n m
embe
rs’ i
nter
ests
with
thos
e of
the
orga
nisa
tion
and
thus
incr
easi
ng th
e ef
ficie
ncy
of th
e or
gani
satio
n an
d th
e ch
oice
s it m
akes
.
The
Sour
ce a
nd N
atur
e of
Mot
ivat
ion
Prob
lem
s....
......
......
......
......
......
......
......
......
......
......
......
..1
Sim
ple
Age
ncy
Theo
ry (p
. 126
)....
......
......
......
......
......
......
......
......
......
......
......
......
......
......
......
...2
Cho
ice
of P
erfo
rman
ce M
easu
res (
p.13
5)...
......
......
......
......
......
......
......
......
......
......
......
......
......
.4
Mul
ti-Ta
skin
g in
Age
ncy
Rel
atio
nshi
ps (p
.140
).....
......
......
......
......
......
......
......
......
......
......
......
.6
Gro
up P
erfo
rman
ce P
ay...
......
......
......
......
......
......
......
......
......
......
......
......
......
......
......
......
......
....9
M
anip
ulat
ion
of P
erfo
rman
ce M
easu
res.
......
......
......
......
......
......
......
......
......
......
......
......
......
.....
9 Su
bjec
tive
Eval
uatio
ns...
......
......
......
......
......
......
......
......
......
......
......
......
......
......
......
......
......
....1
0 R
eput
atio
ns...
......
......
......
......
......
......
......
......
......
......
......
......
......
......
......
......
......
......
......
......
....1
0 PA
RC
and
Mot
ivat
ion
(p.1
64).
......
......
......
......
......
......
......
......
......
......
......
......
......
......
......
......
10
The
Sou
rce
and
Nat
ure
of M
otiv
atio
n P
robl
ems
Mot
ivat
ion
of in
cent
ive
prob
lem
s occ
ur w
hen
ther
e ar
e ex
tern
aliti
es, i
.e. a
dis
parit
y be
twee
n th
e co
sts a
nd b
enef
its th
at a
n in
divi
dual
bea
rs v
ersu
s tho
se th
at a
ccru
e to
the
orga
nisa
tion
as a
w
hole
. In
othe
r wor
ds: S
omeo
ne e
lse
has t
o be
ar so
me
of th
e co
sts o
f one
’s a
ctio
ns (n
egat
ive)
, or
enj
oys t
he fr
uits
of o
ne’s
act
ions
(pos
itive
ext
erna
litie
s)
1.m
embe
rs in
an
orga
nisa
tion
only
rece
ive
smal
l fra
ctio
n of
the
outc
omes
of t
heir
actio
ns b
ut b
ear a
dis
prop
ortio
nate
par
t of t
he c
osts
invo
lved
=> to
o lit
tle o
f des
ired
activ
ity fo
r org
anis
atio
nal e
ffic
ienc
y a.
e.g.
wor
ker w
ho w
orks
har
der h
as to
bea
r all
the
cost
s but
doe
s not
get
an
ythi
ng in
exc
hang
e fo
r tha
t b.
shar
ehol
der w
ho e
xhib
its d
ilige
nce
in m
onito
ring
man
agem
ent,
bear
s all
the
cost
s of t
his a
ctiv
ity, h
owev
er th
e be
nefit
s of t
his a
ctiv
ity a
ccru
e to
all
shar
ehol
ders
=>
mos
t lik
ely
less
mon
itorin
g th
an w
ould
be
optim
al
2.fr
actio
n of
ben
efits
exc
eeds
the
cost
s tha
t the
y be
ar
=> c
hoos
e to
o m
uch
of th
at a
ctiv
ity
Why
are
ther
e sy
stem
atic
diff
eren
ces b
etw
een
cost
s and
ben
efits
that
acc
rue
to th
e or
gani
satio
n an
d th
ose
that
the
deci
sion
mak
er fa
ces?
(Ben
chm
ark:
con
tract
s in
the
free
m
arke
t, th
ere
ever
ythi
ng im
agin
able
can
be
devi
sed)
1.
Dec
isio
ns a
nd a
ctio
ns a
ffec
t oth
er p
artie
s,2.
inte
rest
s are
typi
cally
not
fully
alig
ned
3.co
ntra
ctin
g po
ssib
ilitie
s are
lim
ited
4.
repu
tatio
ns a
re o
nly
parti
ally
eff
ectiv
e
Mos
t per
vasi
ve d
iffic
ultie
s AG
EN
CY
PR
OB
LE
MS
Lim
ited
obse
rvab
ility
of b
ehav
iour
=>
mor
al h
azar
d. (C
onte
xt fo
r age
ncy
theo
ry)
-If
beh
avio
ur is
not
obs
erva
ble
and
mea
sura
ble
in ti
mel
y fa
shio
n, c
ontra
cts c
anno
t be
writ
ten
on th
at b
ehav
iour
, als
o m
akes
repu
tatio
n co
ncer
ns to
gui
de b
ehav
iour
im
poss
ible
form
al in
cent
ives
hav
e to
be
base
d on
noi
sy, i
mpr
ecis
e in
dica
tors
of w
hat t
he
agen
t has
don
e Fr
ee-R
idin
g:-
seve
ral i
ndiv
idua
ls c
ontri
bute
to so
me
outc
ome
but a
ll sh
are
the
outc
ome.
-
Expl
.: Te
amw
ork,
eve
rybo
dy h
as in
cent
ive
to sh
irk, s
ince
one
incu
rs a
ll co
sts o
f ad
ditio
nal e
ffor
t but
onl
y a
part
of th
e in
crem
enta
l gai
n So
lutio
n: (M
utua
l) M
onito
ring
of e
ach
othe
rs c
ontri
butio
ns (y
et, t
his d
epen
ds
on h
ow m
uch
the
othe
r lik
e di
slik
e th
e la
zy o
nes t
o fr
ee-r
ide
on th
eir e
ffor
t, if
they
don
’t ca
re, t
his m
ight
lead
to th
e si
tuat
ion
that
they
don
’t w
ork
hard
ei
ther
, inf
iltra
tion
of la
zine
ss, m
ight
cal
l for
est
ablis
hing
a g
roup
nor
m fo
r w
orki
ng h
ard)
, Pee
r Pre
ssur
e
Beh
avio
ur m
ight
be
obse
rvab
le b
y pa
rties
invo
lved
but
it is
not
pos
sibl
e to
est
ablis
h th
e fa
cts
to a
n ou
tsid
e pa
rty. T
hus c
ontra
cts o
n th
is b
ehav
iour
can
not b
e en
forc
ed b
y ou
tsid
e pa
rty a
nd
can
thus
not
act
as m
otiv
atio
n =>
this
type
of b
ehav
iour
is n
ot c
ontra
ctib
le.
Parti
es m
ight
fail
to sp
ecify
wha
t sho
uld
be d
one
in d
iffer
ent c
ircum
stan
ces (
125)
Info
rmat
ion
on w
hich
act
ions
are
bas
ed is
onl
y av
aila
ble
to p
erso
n ta
king
the
actio
n, w
hat
inte
rest
s diff
er b
etw
een
thos
e w
ho ta
ke a
ctio
ns a
nd th
ose
in w
hose
inte
rest
they
shou
ld b
e ta
ken?
(Cf.
Agh
ion/
Tiro
le 1
997
mod
el)
Expl
. Em
pire
-bui
ldin
g C
EOs
Sim
ple
Age
ncy
Theo
ry (p
. 126
) If
eff
ort c
ould
be
cont
ract
ed, i
.e. w
as o
bser
vabl
e an
d ve
rifia
ble
to th
e co
urts
, and
des
ired
actio
n co
uld
be d
eter
min
ed a
nd d
escr
ibed
bef
ore
the
fact
(per
fect
info
rmat
ion
mod
el),
prin
cipa
l wou
ld b
uy sp
ecifi
c am
ount
of e
ffor
t tha
t wou
ld b
e op
timal
for h
im. =
No
Mot
ivat
ion
Prob
lem
Mot
ivat
ion
prob
lem
in th
e si
mpl
est P
rinci
pal-a
gent
mod
el:
-P
cann
ot o
bser
ve A
’s b
ehav
iour
-
Som
e no
isy
sign
al is
obs
erve
d an
d ca
n be
con
tract
ed u
pon
(nee
d si
gnal
oth
erw
ise
cann
ot p
rovi
de in
cent
ives
) -
Sign
al v
arie
s with
A’s
eff
ort b
ut a
lso
incl
udes
som
e ra
ndom
var
iabi
lity
that
can
not b
e re
mov
ed (i
.e. s
= e
+
)-
E.g.
S c
an b
e lin
ked
to o
utpu
t, vo
lum
e, sa
les,
cost
s, re
venu
e -
Ran
dom
var
iabi
lity
can
be:
mea
sure
men
t err
or (e
.g. b
ecau
se m
onito
ring
is n
ot c
ontin
ual)
othe
r fac
tors
(act
ions
of o
ther
par
ties,
stat
e of
dem
and
(oil
pric
e), r
ando
m
perf
orm
ance
of a
mac
hine
) no
t und
er th
e in
fluen
ce o
f the
age
nt, i
.e. r
ando
mne
ss b
eyon
d ag
ent’s
con
trol
-ho
wev
er, i
f age
nt b
ore
full
bene
fits a
nd c
osts
of h
is a
ctio
ns h
e w
ould
take
eff
icie
nt
effo
rt ch
oice
(sel
l-the
-sho
p)
-2
reas
ons w
hy th
is d
oes n
ot w
ork
Ben
efits
mig
ht b
e un
certa
in b
ut a
gent
is ri
sk-a
vers
e -
Then
hav
ing
bear
the
full
but u
ncer
tain
impa
ct (i
.e. t
he fu
ll m
argi
nal
retu
rn o
f his
eff
ort c
hoic
e) o
f his
act
ions
is in
effic
ient
bec
ause
it m
eans
th
at h
e sh
ould
ers a
ll he
risk
aris
ing
from
unc
erta
inty
, whi
le ri
sk-
abso
rbin
g ca
pabi
lity
of P
is n
ot u
sed
(dep
ends
on
how
stro
ngly
risk
-av
erse
the
two
are)
-
If P
is ri
sk-n
eutra
l, sh
e sh
ould
shou
lder
all
risk,
bec
ause
it is
cos
tless
fo
r her
-
(CO
UN
TER
: Pro
blem
in th
is c
ase,
she
mig
ht n
ot o
nly
bear
risk
from
ra
ndom
ness
, var
iabi
lity
mig
ht a
lso
be d
ue to
shirk
ing
of a
gent
. Thi
s va
riabi
lity
then
wou
ld b
e bo
rne
by P
. Thu
s A d
oesn
’t fa
ce a
ll be
nefit
s an
d co
sts o
f her
cho
ices
.) -
Des
irabi
lity
of ri
sk-s
harin
g he
mig
ht fi
nanc
ially
con
stra
ined
and
thus
can
not c
over
any
neg
ativ
e re
turn
s th
at m
ight
aris
e -
cann
ot c
over
any
neg
ativ
e re
turn
s of h
is a
ctio
ns
-th
us, s
ellin
g fir
m to
age
nt is
not
pos
sibl
e, o
r if h
e ha
s opt
ion
of
bank
rupt
cy, d
oesn
’t be
ar fu
ll co
sts e
ither
Und
erly
ing
logi
c of
ince
ntiv
e pa
y:
-M
akin
g th
e in
cent
ives
mor
e in
tens
e in
crea
ses t
he e
xpec
ted
retu
rn to
the
agen
t fro
m
exer
ting
mor
e ef
fort
=> w
ill w
ork
hard
er
-ch
oice
of t
he in
cent
ive
sche
me
mus
t be
mad
e in
ligh
t tha
t the
leve
l of e
ffor
t act
ually
ch
osen
will
be
wha
t mot
ivat
es th
e ag
ent t
o pr
ovid
e
TR
AD
E-O
FF R
isk
vs. I
ncen
tives
(th
e na
ture
of t
he tr
ade-
off d
epen
ds o
n th
e re
ason
the
agen
t doe
s not
bea
r all
the
mar
gina
l co
sts a
nd b
enef
its)
-lim
ited
liabi
lity
case
(age
nt is
risk
neu
tral a
nd a
lpha
can
not b
e ne
gativ
e?) ?
p.13
0-13
1?
Not
sure
her
e, se
ems c
onfu
sing
pr
ovid
ing
mor
e in
tens
e in
cent
ives
invo
lves
incr
easi
ng th
e pa
ymen
t for
the
good
stat
e w
ithou
t any
off
-set
ting
decr
ease
in p
aym
ents
whe
n th
e pe
rfor
man
ce
appe
ars b
ed (a
ssum
ing
the
paym
ent i
n th
e ba
d st
ate
is a
lread
y as
low
as
feas
ible
) co
sts o
f get
ting
mor
e ef
fort
is th
at e
xpec
ted
retu
rns m
ust b
e pa
ssed
on
to th
e ag
ent,
even
thou
gh h
is p
ay is
alre
ady
enou
gh to
attr
act h
im to
the
job
-ris
k av
ersi
on (m
ore
wid
ely
stud
ied)
gi
ving
mor
e in
tens
e in
cent
ives
(i.e
. inc
reas
ing
beta
, com
mis
sion
rate
pai
d to
sa
lesp
erso
n) in
crea
ses t
he e
ffor
t pro
vide
d be
caus
e th
e be
nefit
s of e
xtra
eff
ort
accr
ue to
age
nt “
mor
e di
rect
ly”
mor
e in
tens
e in
cent
ives
als
o m
ake
pay
mor
e ris
ky (s
ince
a g
iven
am
ount
of
rand
om v
aria
tion
in th
e pe
rfor
man
ce m
easu
re (e
.g. s
ales
) is a
lso
trans
late
d m
ore
dire
ctly
, i.e
. res
ults
in a
gre
ater
var
ianc
e in
pay
H
avin
g th
e ag
ent b
ear r
isk
is c
ostly
if
P =
risk-
neut
ral a
nd A
= ri
sk-a
vers
e (e
ven
whe
n P
not r
isk-
neut
ral),
in
crea
sing
the
inte
nsity
of i
ncen
tives
mea
ns sh
iftin
g m
ore
risk
onto
the
agen
t th
an w
ould
be
desi
rabl
e, p
rinci
pal h
as to
com
pens
ate
agen
t for
bea
ring
risk
P’s p
robl
em
Det
erm
inin
g de
sire
d le
vel o
f int
ensi
ty =
TR
AD
E-O
FF
Cos
ts o
f hav
ing
to c
ompe
nsat
e ag
ent f
or B
OTH
exe
rting
ext
ra e
ffor
t and
be
arin
g ris
ks a
gain
st b
enef
its g
ener
ated
by
extra
eff
ort t
hrou
gh m
ore
inte
nse/
st
rong
er in
cent
ives
G
ener
ally
, the
solu
tion
is to
hav
e th
e ag
ent f
ace
less
inte
nse
ince
ntiv
es th
an a
re n
eede
d to
indu
ce th
e fu
ll ob
serv
abili
ty, f
irst-b
est l
evel
of e
ffor
t, w
here
the
risks
and
cos
ts it
wou
ld b
ring
are
irrel
evan
t. A
lso
agen
t bea
rs m
ore
risk
than
wou
ld b
e ef
ficie
nt a
bsen
t th
e ne
ed fo
r inc
entiv
es.
Impl
icat
ions
: - s
trong
er in
cent
ives
whe
n (a
ll fo
llow
som
e co
st-b
enef
it-lo
gic)
a.
Age
nt le
ss ri
sk-a
vers
ei.
Ince
ntiv
e in
tens
ity is
det
erm
ined
by
tradi
ng o
ff c
osts
of b
earin
g m
ore
risk
vs. b
enef
its fr
om in
duci
ng m
ore
effo
rt. T
hus,
redu
ced
mar
gina
l co
sts o
f ris
k-be
arin
g (r
isk
aver
sion
) (lo
gic:
cos
ts o
f A’s
bea
ring
extra
ris
k de
crea
se w
hen
A is
less
risk
-ave
rse)
(Sin
ce ri
sk a
vers
ion
may
de
pend
on
wea
lth, m
ight
exp
ect t
o se
e w
ealth
ier o
nes t
o be
bet
ter a
ble
to b
ear r
isk)
b.
Perf
orm
ance
mea
sure
men
t mor
e ac
cura
te
i.St
rong
er in
cent
ives
tran
slat
e le
ss st
rong
ly in
to v
aria
nce
in p
ay (l
ess
unco
ntro
lled
risk
in th
e ag
ent’s
rew
ard
= le
ss a
dditi
onal
risk
-bea
ring
cost
s) T
hus,
endu
ce m
ore
effo
rt th
roug
h st
rong
er in
cent
ives
bec
ause
co
sts o
f doi
ng so
are
low
er.
1.ac
tion
= ob
serv
ed p
erfo
rman
ce g
ive
stro
ng in
cent
ives
2.
actio
n <>
obs
erve
d pe
rfor
man
ce w
eake
r inc
entiv
es
c.H
ighe
r eff
ort m
ore
valu
able
to p
rinci
pal
i.Th
e gr
eate
r he
bene
fit o
f ext
ra e
ffor
t, th
e hi
gher
the
optim
al a
mou
nt o
f ef
fort
to in
duce
and
thus
the
mor
e in
tens
e sh
ould
be
the
ince
ntiv
es
d.Th
e be
tter/
mor
e ea
sily
A c
an re
spon
d to
stro
nger
ince
ntiv
es (r
espo
nsiv
enes
s of
A’s
eff
ort c
hoic
e to
stro
nger
ince
ntiv
es)
i.Th
e m
ore
effo
rt re
spon
ds to
ince
ntiv
es, i
.e. c
reat
es e
xtra
val
ue, t
he
mor
e in
tens
e sh
ould
be
the
ince
ntiv
es (c
ost-b
enef
it-lo
gic)
(c
+d m
ight
exp
lain
why
ince
ntiv
e in
tens
ity in
crea
ses w
ith h
iera
rchy
in m
ost
firm
s, to
p ex
ecut
ives
dec
. hav
e gr
eat i
mpa
ct o
n pe
rf.,
can
pull
man
y le
vers
)
Insi
ghts
Com
plem
enta
rity
betw
een
stro
nger
ince
ntiv
es a
nd im
prov
ing
perf
orm
ance
mea
sure
s ->
with
stro
nger
ince
ntiv
es th
e be
nefit
s of i
ncre
asin
g ac
cura
cy o
f per
f. M
easu
rem
ent i
ncre
ase
If in
cent
ives
at a
ll, g
ive
subs
tant
ial o
nes,
beca
use
of d
iscr
ete
fixed
cos
ts o
f pe
rfor
man
ce p
ay. T
hus b
ette
r to
give
no
expl
icit
ince
ntiv
es a
t all
rath
er th
an w
eak
ones
.If
ince
ntiv
e pa
y is
use
d, w
orke
r fac
es ri
sk in
pay
. The
risk
has
a c
ost t
o th
e w
orke
r tha
t is
incr
easi
ng in
the
pers
onal
cos
t of i
ncre
asin
g th
e pr
ovis
ion
of e
ffor
t. If
the
mar
gina
l co
st o
f ext
ra e
ffor
t is n
ot z
ero,
this
term
doe
s not
dis
appe
ar a
s the
am
ount
of e
xtra
ef
fort
that
the
firm
seek
s to
indu
ce (a
nd, c
orre
spon
ding
ly, t
he in
tens
ity o
f inc
entiv
es)
beco
mes
smal
l. Th
us, a
littl
e in
ince
ntiv
e pa
y, a
lthou
gh, i
t may
indu
ce a
littl
e m
ore
effo
rt, b
rings
a d
iscr
ete
jum
p in
cos
ts.
???
I DO
N’t
GET
TH
IS. C
AN
SO
MEO
NE
EXPL
AIN
????
Cho
ice
of P
erfo
rman
ce M
easu
res
(p.1
35)
Poss
ible
mea
sure
s are
sale
s, et
c. (s
ee a
bove
) sto
ck p
rice,
acc
ount
ing
retu
rns..
Pay
shou
ld d
epen
d on
free
ly (s
o no
t to
incu
r fur
ther
cos
ts) a
vaila
ble
mea
sure
that
is
info
rmat
ive
abou
t age
nt’s
eff
ort p
rovi
sion
Info
rmat
ive
= ta
king
pro
per a
ccou
nt a
llow
s mor
e pr
ecis
e in
fere
nce
abou
t age
nt’s
cho
ice
(“In
form
ativ
enes
s Prin
cipl
e” –
onl
y in
clud
e th
ose
mea
sure
that
tell
you
som
ethi
ng a
bout
ag
ents
’ eff
ort c
hoic
es)
e.g.
succ
ess o
f exp
lora
tion
but a
lso
crud
e oi
l pric
e pl
ays a
role
for s
ucce
ss o
f oil
com
pani
es
Solu
tion
at B
P “s
elf-
help
” in
per
form
ance
pay
(=ch
ange
in p
erfo
rman
ce n
ot a
ttrib
utab
le to
ch
ange
in o
il pr
ice)
=>
Res
ult:
2 m
easu
res:
act
ual e
arni
ngs a
nd o
il pr
ice
Var
iabl
e th
at is
cor
rela
ted
with
noi
se in
per
form
ance
mea
sure
men
t is u
sefu
lly e
mpl
oyed
in
perf
orm
ance
eva
luat
ion
in o
rder
to fi
lter o
ut so
me
of e
xtra
neou
s ran
dom
ness
.
e.g.
Exec
utiv
e co
mpe
nsat
ion
Bon
uses
bas
ed o
n pu
blic
ly a
vaila
ble
acco
untin
g re
turn
s and
som
e bo
nus t
ied
to st
ock
pric
e
Stra
nge,
sinc
e al
l inf
o. S
houl
d be
par
t of s
tock
pric
e (in
eff
icie
nt c
apita
l mar
kets
) B
UT
acct
. inf
o gi
ves i
nfor
mat
ion
abou
t eff
ort o
f div
isio
n he
ads (
thus
shou
ld b
e us
ed, e
ven
if th
ey g
et st
ock
optio
ns, t
oo)
Mul
tiple
mea
sure
s inc
reas
e ac
cura
cy b
ut th
is n
eed
not b
e ex
pans
ive,
e.g
. mea
surin
g sa
les
orga
nisa
tion
by p
rofit
abili
ty, i
.e. r
even
ue a
nd c
osts
rath
er th
an ju
st c
osts
alo
ne. E
ven
if sa
les
man
ager
s don
’t ha
ve in
fluen
ce o
ver c
osts
, thi
s will
hel
p fo
cus o
n pr
ofita
ble
acco
unts
. (p.
138
)
Com
para
tive
Perf
orm
ance
Eva
luat
ion
-
good
mea
sure
of h
ow m
uch
effo
rt pe
rson
put
s in,
bec
ause
thos
e fa
ctor
s aff
ectin
g th
e re
sults
of a
ll (m
arke
t con
ditio
ns, e
tc.)
are
filte
red
out
Rat
iona
le-
redu
ces n
oise
in m
easu
red
perf
orm
ance
=>
redu
ces r
ando
mne
ss in
rew
ards
=>
stro
nger
ince
ntiv
es c
an b
e pr
ovid
ed =
> m
ore
effo
rt ca
n be
indu
ced
-e.
g. C
EOs a
re p
aid
both
in te
rms o
f how
wel
l the
y di
d an
d in
com
paris
on to
firm
s in
the
sam
e in
dust
ry
TOU
RN
AM
ENTS
= m
ore
extre
me
form
of c
ompa
rativ
e pe
rfor
man
ce e
valu
atio
n -
Rew
ards
onl
y ba
sed
on re
lativ
e ra
nkin
g am
ong
peer
s -
(Rew
ards
not
bas
ed o
n an
y ab
solu
te p
erfo
rman
ce m
easu
re)
Ver
y us
eful
, whe
n it
is h
ard
to sp
ecify
and
mea
sure
resu
lts in
any
qua
ntita
tive
way
, on
whi
ch p
ay c
ould
be
base
d B
UT
still
it is
cle
ar w
ho h
as d
one
the
best
job
Win
ner c
an b
e id
entif
ied
and
rew
arde
d (o
ften
used
in p
rom
otio
ns: p
rize
= be
tter
job,
pay
, opp
ortu
nity
to c
ompe
te fo
r nex
t pro
mot
ion)
Ben
efits
of t
hese
exa
mpl
es: p
erfo
rman
ce m
easu
res a
re fr
eely
ava
ilabl
e, m
eani
ng th
at th
ey a
re
sim
ple
and
easy
to a
dmin
iste
r. If
mea
sure
s hav
e to
be
devi
sed
and
colle
cted
, it w
ill in
volv
e la
rge
fixed
cos
ts to
do
so. A
lso
if to
o m
any
mea
sure
, sys
tem
mig
ht b
ecom
e to
o co
mpl
icat
ed in
or
der t
o m
otiv
ate
effe
ctiv
ely
(as i
n ca
se o
f “B
alan
ce S
core
card
”).
Des
igne
r has
to d
ecid
e be
twee
n m
easu
ring
inpu
ts (e
ffor
t, tim
e, e
tc…
) and
out
puts
(sal
es,
piec
es, e
tc.).
Cho
ice
depe
nds o
n w
hat i
s obs
erva
ble
and
wha
t des
igne
r (ge
nera
l man
ger)
kn
ows.
If d
esig
ner d
oesn
’t’ k
now
wha
t sho
uld
be d
one,
will
spec
ify re
sults
and
leav
e to
A to
del
iver
re
sults
.
!! If
unc
erta
inty
/lik
elih
ood
that
des
igne
r doe
s not
kno
w w
hat b
ehav
iour
is d
esira
ble,
neg
ativ
e as
soci
atio
n be
twee
n un
certa
inty
and
ince
ntiv
es m
ay b
e re
vers
ed!!
Mul
ti-Ta
skin
g in
Age
ncy
Rel
atio
nshi
ps (p
.140
) P
need
s to
mot
ivat
e-
over
all e
ffor
t and
-al
loca
tion
amon
g ta
sks
Prob
lem
atic
in c
onte
xt o
f 1.
desi
red
activ
ities
com
pete
for a
gent
’s ti
me
and
atte
ntio
n o
doin
g m
ore
of o
ne in
crea
ses t
he c
osts
/ diff
icul
ty o
f doi
ng th
e ot
her w
hile
the
prec
isio
n or
tim
elin
ess o
f mea
sure
s is n
ot c
ompa
rabl
e ac
ross
the
task
s, i.e
. it i
s ex
pens
ive
to d
esig
n in
cent
ives
that
lead
the
agen
t to
devo
te e
noug
h tim
e to
bo
th a
ctiv
ities
o
e.g.
del
iver
ing
cu
rren
t per
form
ance
an
d de
velo
ping
new
bus
ines
s cu
rren
t per
form
ance
can
mea
sure
d ha
rd to
mea
sure
the
seco
nd, u
nles
s age
nt c
an b
e di
rect
ly o
bser
ved
draw
ing
up b
usin
ess p
lans
(but
: mig
ht tr
y ha
rd to
find
new
biz
op
portu
nitie
s and
then
in th
e en
d do
esn’
t hav
e an
ythi
ng to
show
for i
t, be
caus
e al
l inv
estig
ated
pro
ject
s, al
thou
gh in
tere
stin
g an
d pr
omis
ing
in
the
begi
nnin
g, w
ere,
afte
r clo
se in
vest
igat
ion,
foun
d no
t to
be
wor
thw
hile
)o
e.g.
pro
vidi
ng
initi
ativ
e
an
d
coop
erat
ion
initi
ativ
e is
eas
ily m
easu
red
(e.g
. sal
es)
coop
erat
ion
is m
uch
hard
er to
mea
sure
, bec
ause
ha
rder
to o
bser
ve
resu
lts o
f coo
pera
tion
are
tied
up in
oth
er u
nits
’ per
form
ance
2.
no se
para
te m
easu
res f
or th
e pe
rfor
man
ce o
n th
e tw
o ta
sks (
i.e. a
vaila
ble
mea
sure
s co
nfou
nd th
e re
sults
of 2
act
iviti
es.)
How
A sp
ends
tim
e de
pend
s on
ince
ntiv
es
BEN
CH
MA
RK
CA
SE
-ac
tiviti
es a
re n
on-r
ival
rous
, i.e
. do
not c
ompe
te fo
r tim
e an
d at
tent
ion,
i.e.
cos
ts o
f one
ac
t1 a
re in
depe
nden
t of t
he le
vel o
f act
2 -
sepa
rate
, ind
epen
dent
(but
impe
rfec
t, i.e
. not
per
fect
ly p
reci
se) p
erfo
rman
ce m
easu
res
choi
ce o
f one
leve
l of a
ctiv
ity w
ill n
ot a
ffec
t the
cos
t-rew
ard
trade
-off
s fac
ed in
ch
oosi
ng th
e le
vel o
f the
oth
er
ince
ntiv
es o
f eac
h ac
tivity
can
be
set i
ndep
ende
ntly
to in
duce
e1
and
e2 a
t de
sire
d le
vels
ad 1
. 1st
PR
OB
LEM
:
A1
and
A2
com
pete
at t
he m
argi
n -
wor
king
har
der i
n ac
tivity
incr
ease
s the
cos
ts o
f pro
vidi
ng th
e ot
her a
ctiv
ity
-R
esul
t: In
crea
sing
rew
ards
for A
1 w
ill le
ad to
ove
r-pr
opor
tiona
lly le
ss A
2, si
nce
the
mar
gina
l cos
ts o
f A2
have
rise
n, y
et th
e re
war
ds re
mai
n un
chan
ged
ince
ntiv
es fo
r A1
and
A2
have
to d
esig
ned
coor
dina
tedl
y -
inte
nsiti
es o
f diff
eren
t act
iviti
es =
com
plem
ents
st
reng
then
ing
the
inte
nsity
of o
ne a
ctiv
ity m
akes
it m
ore
attra
ctiv
e to
st
reng
then
ince
ntiv
es fo
r the
oth
er a
ctiv
ity a
s wel
l Th
us in
tens
ity sh
ould
be
inte
nse
for a
ll, o
r rel
ativ
ely
mut
ed fo
r all
Unl
ess i
ncen
tives
are
bal
ance
d, a
gent
will
tend
to o
vere
mph
asiz
e be
tter-
com
pens
ated
act
ivity
an
d un
der-
supp
ly th
e ot
her.
E.g.
ince
ntiv
es sy
stem
at L
inco
ln E
lect
ric. P
rovi
des s
trong
, ba
lanc
ed in
cent
ives
.
2nd
PR
OB
LEM
: acc
urac
y an
d tim
elin
ess,
mea
sure
s for
two
task
s diff
er in
pre
cisi
on
- mor
e pr
ecis
e m
easu
re, l
ess c
ostly
to p
rovi
de st
rong
ince
ntiv
es
- e.g
. cos
t con
trol v
s. de
velo
ping
new
bus
ines
s ide
as
=> c
heap
to p
rovi
de in
cent
ives
for c
ost c
ontro
l, co
stly
for n
ew b
iz id
eas
Inte
nse
ince
ntiv
es fo
r des
irabl
e ac
tiviti
es m
ight
be
bad
idea
, bec
ause
it b
ecom
es n
egat
ive
ince
ntiv
e fo
r oth
er a
ctiv
ities
that
are
als
o de
sira
ble.
(“Y
ou g
et w
hat y
ou p
ay fo
r.”)
- e. g
. mer
it pa
y fo
r tea
cher
s (cf
. MR
pp.
230-
1 al
so)
- pay
teac
hers
bas
ed o
n pu
pils
’ tes
t suc
cess
, tea
cher
s will
mai
nly
teac
h te
stin
g ab
ilitie
s and
te
ach
less
cre
ativ
ity, c
itize
nshi
p, v
alue
s, i.e
. thi
ngs t
hat a
re n
ot te
sted
=>
Mer
it pa
y on
test
per
form
ance
is li
kely
to d
rive
thes
e ou
t, al
thou
gh th
ey a
re p
rovi
ded
in
the
abse
nce
of e
xplic
it in
cent
ives
- I
f wea
k in
cent
ives
for b
oth,
age
nt w
on’t
exer
t muc
h ef
fort
to b
oth.
Thu
s, m
ight
be
bette
r to
leav
e te
ache
rs’ p
ay to
stud
ents
’ tes
t res
ults
, e.g
. sam
e in
bus
ines
s. C
EOs a
re fr
ustra
ted
that
th
eir e
mpl
oyee
s gen
erat
e no
w n
ew id
eas,
whi
ch m
ight
be
due
to st
rong
ince
ntiv
es fo
r cur
rent
pe
rfor
man
ce
SOLU
TIO
N: s
epar
ate
the
two
task
s bet
wee
n th
e tw
o ag
ents
, pro
vide
opt
imal
ince
ntiv
e fo
r ea
ch (Y
ET, s
omet
imes
impo
ssib
le)
C
OST
S of
this
solu
tion:
syne
rgie
s los
t e.
g. sa
les r
epre
sent
ativ
e: sh
ould
to b
oth
– se
ll pr
oduc
t and
brin
g id
eas “
back
hom
e” fo
r pr
oduc
t dev
elop
men
t (IN
HO
USE
) if n
ew id
eas d
on’t
play
role
(OU
SUR
CE)
ad 2
. N
o ad
equa
te m
easu
res f
or th
e tw
o di
ffer
ent t
asks
e.
g.
man
ager
s M1
and
M2
for t
wo
busi
ness
uni
ts B
1 an
d B
2
e1 a
nd e
2 =
effo
rt ch
oice
s aff
ectin
g un
it’s p
erfo
rman
ce
d1 a
nd d
2 =
deci
sion
s tha
t bot
h ow
n un
it’s p
erfo
rman
ce b
ut A
LSO
aff
ect t
he o
ther
un
it’s p
erfo
rman
ce
Prob
lem
: can
’t di
stin
guis
h th
e ef
fect
s of e
1, d
1 an
d d2
on
B1,
i.e.
it’s
not
pos
sibl
e to
of
fer i
ncen
tives
sepa
rate
ly fo
r eff
ort a
nd d
ecis
ions
For g
ood
d1 a
nd d
2 (i.
e. a
ctiv
ities
with
spill
over
eff
ects
), in
cent
ives
shou
ld b
e ba
sed
on b
oth
units
’ per
form
ance
(e.g
. ove
rall
prof
itabi
lity,
oth
er u
nit’s
per
form
ance
ent
ers p
ositi
vely
into
is
rew
ards
)To
indu
ce e
ffic
ient
e1
and
e2, o
nly
narr
ow m
easu
res o
f per
form
ance
of B
1 an
d B
2 al
one
wou
ld b
e us
ed.
BU
T, if
com
mon
fact
ors a
ffec
t pro
fits o
f B1
and
B2,
com
para
tive
eval
uatio
n sh
ould
be
used
(I
nfor
mat
iven
ess p
rinci
ple)
, i.e
. com
pens
atio
n of
B1
is le
ss p
ositi
ve if
B2
does
wel
l (pa
y is
ne
gativ
ely
rela
ted
to o
ther
div
isio
n’s r
etur
ns).
Thus
, the
re is
a tr
ade-
off o
f e1
and
d1, b
ecau
se
good
d1
will
als
o le
ad to
hig
her B
1.
Get
ting
bette
r dec
isio
ns m
eans
mak
ing
man
ager
s con
cern
ed w
ith o
wn
perf
orm
ance
as w
ell a
s ot
her u
nit’s
per
form
ance
= lo
adin
g av
oida
ble
risk
from
B2
=> in
crea
se c
ost (
b/c
mor
e ris
k) =
> le
ss in
tens
e in
cent
ives
Opt
imal
sche
me
bala
nces
gai
ns a
nd lo
sses
, dep
ends
on
rela
tive
impo
rtanc
e of
eff
ort a
nd
deci
sion
s.
Exte
nsio
n: it
’s p
ossi
ble,
B1
can
mak
e de
cisi
ons f
or B
2, e
.g.
Rul
e =
proj
ects
(tha
t aff
ect o
ther
uni
t) on
ly im
plem
ente
d if
both
uni
ts a
gree
to it
M
anag
ers a
ccep
t pro
ject
s tha
t lea
d to
hig
her p
ay (i
ncre
ase
thei
r util
ity),
Q: P
ay d
epen
ds o
n in
cent
ive
sche
me
used
In
gen
eral
fo
r wel
l-des
igne
d sc
hem
e, p
ay in
crea
ses i
n ow
n un
it’s p
erfo
rman
ce
1.pa
y on
ly o
n ow
n un
it’s p
erfo
rman
ce
2.pa
y on
ly o
n bo
th u
nits
’ per
form
ance
o
exte
nsio
n: c
ompa
rativ
e ev
alua
tion
ad 1
. M o
nly
care
s abo
ut o
wn
units
, acc
ept t
hese
pro
ject
s
mig
ht re
ject
thos
e th
at h
urt t
hem
but
wou
ld in
crea
se o
vera
ll va
lue
ad 2
. acc
ept t
hose
that
are
goo
d fo
r bot
h ex
tens
ion:
onl
y fe
w w
ill b
e ac
cept
ed, s
ince
goo
d fo
r B2
mea
ns b
ad fo
r B1,
i.e. p
roje
cts
will
onl
y ac
cept
ed if
they
are
goo
d fo
r bot
h, m
eani
ng th
at th
ose,
whi
ch a
re g
ood
for
just
one
uni
t mig
ht n
ot b
e ac
cept
ed (a
lthou
gh th
ese
wou
ld in
crea
se o
vera
ll va
lue)
SO
LUTI
ON
: ru
le: i
f bot
h ag
ree
= im
plem
ente
d, if
dis
agre
e =
refe
rred
to th
ird p
arty
(th
is p
arty
shou
ld b
e in
cent
ivis
ed to
mak
e go
od d
ecis
ions
, e.g
. bec
ause
car
es a
bout
ov
eral
l val
ue)
Ref
erra
l pro
cess
= c
ostly
, the
refo
re fi
rst s
ee, w
heth
er p
artie
s agr
ee.
e.g.
IBM
con
curr
ence
syst
em =
pro
ject
s tha
t aff
ecte
d ot
her u
nits
had
to g
et si
gn-o
ff
from
thes
e un
its, o
/w re
ferr
ed u
pwar
ds a
nd so
on
(as f
ar a
s exe
cutiv
e co
mm
ittee
)
Mul
ti-Ta
skin
g =
very
com
plex
, sol
utio
n to
this
pro
blem
can
invo
lve
mul
tiple
asp
ects
of
orga
nisa
tiona
l des
ign.
DES
CR
IPTI
ON
from
Ch.
3
Mod
el o
f mul
ti-ta
skin
g (H
olm
strö
m a
nd M
ilgro
m 1
991)
G
OA
L (w
hen
vario
us a
ctiv
ities
com
pete
for t
ime
and
atte
ntio
n of
age
nt)
-of
ferin
g in
cent
ives
that
are
stro
ng A
ND
-
bala
nced
-fir
ms e
xist
bec
ause
mar
ket i
ncen
tives
mig
ht b
e to
o st
rong
, firm
s can
pro
vide
wea
ker
ince
ntiv
es (h
ere:
ince
ntiv
es a
re to
o st
rong
if th
ey c
ause
div
ersi
on o
f eff
ort f
rom
oth
er
valu
ed a
ctiv
ities
, for
whi
ch c
anno
t be
give
n eq
ually
stro
ng in
cent
ives
) -
e.g.
sale
s age
nt IN
-HO
USE
– O
UTS
IDE
OU
TSID
E ose
lls m
any
prod
ucts
ha
ve to
giv
e st
rong
ince
ntiv
e (h
igh
com
mis
sion
rate
) to
sell
your
s al
so in
cent
ivis
e to
gat
her i
nfor
mat
ion
IN-H
ouse
(sol
utio
n)
ose
ll yo
ur p
rodu
cts,
gath
er in
fo.
-W
eak
ince
ntiv
es, p
ay fi
xed
sala
ry, e
qual
ly b
alan
ced
ince
ntiv
es a
nd a
sk to
sell
prod
uct,
gath
er in
fo, a
dvis
e cu
stom
ers w
ell
Res
ts o
n 2
obse
rvat
ions
mul
tiple
way
s per
son
can
spen
d tim
e, m
any
of w
hich
mig
ht b
e of
val
ue to
em
ploy
er
1.co
mpe
te fo
r tim
e an
d at
tent
ion
=> in
cent
ives
mus
t be
com
para
ble,
oth
erw
ise
pers
on
will
focu
s dis
prop
ortio
nate
ly o
n th
ings
that
are
wel
l com
pens
ated
and
not
on
the
othe
rs
2.pr
ovid
ing
stro
ng fi
nanc
ial i
ncen
tives
is c
ostly
if p
erso
n is
risk
-ave
rse,
a.it
load
s ext
ra ri
sk in
to p
ay b
ecau
se, t
he p
rinci
pal t
hen
wou
ld h
ave
to
com
pens
ate
the
agen
t for
bea
ring
risk
as w
ell,
b.
c if
mea
surin
g pe
rfor
man
ce is
har
d
Two
activ
ities
-
O o
utpu
t = e
asily
mea
sure
d, i.
e. c
(pro
vidi
ng st
rong
ince
ntiv
es)
-I i
nves
tmen
t in
activ
ities
aff
ectin
g lo
ng-te
rm v
alue
of d
ivis
ion,
har
d to
mea
sure
c(
stro
ng in
cent
ives
), h
ave
to b
e co
mpe
nsat
ed fo
r bea
ring
risk,
cos
tly fo
r prin
cipa
l -
If o
nly
ince
ntiv
es fo
r O, m
anag
er te
mpt
ed to
mor
tgag
e th
e fu
ture
and
focu
s on
thes
e (u
ndes
irabl
e to
prin
cipa
l) So
lutio
n-
sell
com
pany
to m
anag
ers (
MB
O)
-tre
at m
anag
er a
s em
ploy
ee, p
ay sa
lary
, giv
e w
eak
ince
ntiv
es fo
r bot
h ac
tiviti
es
Gro
up P
erfo
rman
ce P
ay
Perf
orm
ance
pay
pro
blem
: des
troys
coo
pera
tion
and
team
wor
k So
lutio
n: c
olle
ctiv
e ev
alua
tion,
ince
ntiv
ise
grou
ps a
s ind
ivid
uals
, see
abo
ve
Prob
lem
: fre
e-rid
ing
(cf.
team
pro
duct
ion
mod
el M
N41
6)
So
lutio
n: m
utua
l mon
itorin
g, p
eer p
ress
ue (c
f. M
N 4
16),
smal
l gro
ups
Esta
blis
hing
nor
m fo
r wor
king
har
d
Und
erly
ing
prob
lem
: em
ploy
ee o
nly
unde
rtake
s act
ion
if co
sts <
rew
ards
of a
ctio
ns
In
gro
up, p
rofit
s of e
xtra
eff
ort a
re sh
ared
, cos
ts b
orne
by
agen
t e.
g. st
ock
base
d pa
y =
cost
s of e
xtra
eff
ort b
orne
onl
y by
age
nt,
who
just
get
s fric
tion
of re
war
ds, s
hare
d w
ith 1
000s
of o
ther
sh
areh
olde
rs=>
bad
mot
ivat
iona
l too
l W
hy so
com
mon
thou
gh?
- sup
ports
nor
ms o
f “w
orki
ng h
ard”
- w
orke
rs th
ink
like
“ow
ners
”
Man
ipul
atio
n of
Per
form
ance
Mea
sure
sM
easu
res a
re m
anip
ulab
le =
oth
er w
ays t
o in
crea
se S
IGN
AL,
than
pro
vidi
ng e
ffor
t (co
stly
for
orga
nisa
tion,
des
troys
val
ue, f
irst:
effo
rt is
dire
cted
at o
ther
act
iviti
es, o
utco
me
is lo
st (s
ales
ar
en’t
incr
ease
d), f
irm p
ays o
ut o
n so
met
hing
that
was
n’t g
ener
ated
, thu
s it l
ives
off
its
“sub
stan
ce”)
e.g.
at H
einz
man
ager
s wer
e ex
pect
ed to
pos
t ste
adily
incr
easi
ng re
sults
=>
acc
ount
man
ipul
atio
n to
ach
ieve
targ
ets
Rea
son
for P
robl
em
-po
orly
des
igne
d in
cent
ives
(e.g
. onl
y ge
t bon
us if
targ
et is
met
=>
agen
t will
onl
y do
th
ings
nee
ded
to m
eet t
arge
t, no
mor
e)
Solu
tion
-cl
oser
mon
itorin
g
-m
akin
g m
easu
res l
ess m
anip
ulab
le
-su
bjec
tive
eval
uatio
ns
Sub
ject
ive
Eva
luat
ions
A
genc
y th
eory
ass
umes
, con
tract
s can
be
writ
ten
on o
bser
ved
perf
orm
ance
mea
sure
s Pr
oble
m: O
ften
mea
sure
s are
ava
ilabl
e, b
ut in
form
atio
n pr
ovid
ed to
o co
mpl
ex, t
oo
rich,
to b
e de
scrib
ed in
con
tract
OR
to b
e us
ed in
ver
ifica
tion
by th
ird p
artie
s. =>
use
subj
ectiv
e ev
alua
tions
Pr
oble
ms:
If
Prin
cipa
l’s p
rom
ise
not c
redi
ble
(b/c
see
belo
w) n
ot in
duce
eff
ort i
n fir
st p
lace
(a
ntic
ipat
ed b
y ag
ent)
-Pr
inci
pal m
ight
just
not
pay
rew
ards
bec
ause
says
jobs
has
not
bee
n do
ne p
rope
rly
-Pe
rcei
ved
arbi
trarin
ess a
nd a
mbi
guity
can
und
erm
ine
ince
ntiv
es
-B
ias a
nd fa
vour
itism
-
Prin
cipa
l mig
ht b
e to
o fo
rgiv
ing
in p
ayin
g re
war
ds (e
.g. b
oard
of d
irect
ors -
> C
EO
com
pens
atio
n)
Subj
ect t
o in
fluen
ce a
ctiv
ities
, bec
omin
g po
litic
ised
-
To w
ork,
mea
sure
mus
t be
unam
bigu
ous,
mut
ually
und
erst
ood
=> If
not
, age
nt h
as in
cent
ive
to in
fluen
ce d
ecis
ions
of p
rinci
pal
Solu
tion
R
eput
atio
n of
prin
cipa
l
Age
nt w
ill e
xtra
pola
te p
ast b
ehav
iour
into
the
futu
re
Rep
utat
ions
Ea
ch ti
me
parti
es in
tera
ct, P
mus
t per
ceiv
e/ a
ntic
ipat
e fu
ture
, add
ition
al o
ppor
tuni
ties t
o ga
in
from
repu
tatio
n
To w
ork,
it is
nee
ded
to h
ave
-lo
ng-te
rm h
oriz
on
-fr
eque
nt a
nd m
any
inte
ract
ions
bet
wee
n P
and
A
-ch
eatin
g by
P m
ust b
e ob
serv
able
by
A, e
ven
if A
is n
ot a
ffec
ted,
(i.e
. is n
ot w
orki
ng
for P
this
tim
e)
Val
ue o
f rep
utat
ion
and
impo
rtanc
e of
repu
tatio
n-be
arer
bei
ng lo
ng-li
ved
=> a
dvan
tage
for o
rgan
isin
g pe
rman
ent f
irm ra
ther
than
leav
ing
trans
actio
n to
mar
ket d
ealin
gs
(cf.
Kre
ps 1
990)
PAR
C a
nd M
otiv
atio
n (p
.164
) Pe
ople
, arc
hite
ctur
e, ro
utin
es, c
ultu
re
-fo
rmal
age
ncy
emph
asiz
es c
ontra
ctua
l res
pons
es to
mot
ivat
ion
-B
UT
all a
spec
ts o
f org
anis
atio
n ha
ve to
be
empl
oyed
(e.g
. als
o m
anag
eria
l vis
ion
and
stra
tegy
)M
anag
eria
l vis
ion
-ca
n be
ver
y m
otiv
atin
g fo
r em
ploy
ees,
b/c
peop
le li
ke th
eir w
ork
(red
uces
div
erge
nce
of in
tere
sts t
hat u
nder
lie m
otiv
atio
n pr
oble
m) a
nd th
ey k
now
wha
t the
y ar
e w
orki
ng
for,
i.e. w
hat w
ill b
e re
war
ded
-go
od fi
t bet
wee
n pe
ople
and
org
anis
atio
n
-e.
g.o
Form
al in
cent
ive
syst
em c
an le
ad p
eopl
e to
self-
sele
ct (C
f. Sa
felit
e G
lass
(L
azea
r 200
0))
Org
anis
atio
nal a
rchi
tect
ure
can
affe
ct m
otiv
atio
n A
BB
130
0 bu
sine
ss u
nits
, 500
0 pr
ofits
cen
ters
-
Smal
l foc
us, b
ette
r mea
sure
s, st
rong
er in
cent
ives
-
Peop
le se
e im
pact
of a
ctio
n -
smal
l uni
ts \f
ree-
ridin
g
Bas
is o
n w
hich
org
anis
atio
nal u
nits
are
def
ined
, def
ines
wha
t is i
mpo
rtant
Exte
rnal
bou
ndar
ies c
an in
duce
mot
ivat
ion
as w
ell,
(esp
. in
mul
ti-ta
skin
g co
ntex
t) - e
.g. i
n co
ntex
t of d
eliv
erin
g cu
rren
t per
form
ance
and
new
idea
s =>
if n
ew id
eas c
reat
ed, l
et th
em sp
in-o
ff (p
eopl
e ex
pect
that
new
idea
s are
real
ly v
alue
d, g
ive
thos
e m
anag
er la
rge
stak
e in
spin
-off
) in
othe
r wor
ds: o
ppor
tuni
ty fo
r spi
n-of
f can
giv
e ba
lanc
ed in
cent
ives
A
noth
er e
xmpl
e:
Sh
ould
som
eone
be
empl
oyee
usi
ng a
sset
s (to
ols)
of t
he fi
rm O
R
Out
side
con
ract
or o
wni
ng a
nd u
sing
ow
n to
ols?
Allo
catio
n of
dec
isio
n au
thor
ity c
an a
ffec
t inc
entiv
es a
s wel
l, Em
pow
erin
g m
anag
ers/
em
ploy
ees m
ay in
duce
them
to d
o a
bette
r job
of g
athe
ring
info
. and
mak
ing
choi
ces (
cf. A
ghio
n/ T
irole
mod
el 1
997)
C
OST
of e
mpo
wer
men
t M
mak
es d
ecis
ions
bes
t for
him
not
bes
t for
firm
(cf.
Agh
ion/
Tiro
le, t
here
this
is
ens
ured
thro
ugh
alig
nmen
t of i
ncen
tives
).
Fina
ncia
l/ ow
ners
hip
stru
ctur
e ca
n af
fect
mot
ivat
ion
C
orp.
= li
mite
d lia
bilit
y co
mpa
ny
+
Shar
ehol
der-
owne
rs d
iver
sify
thei
r ris
k gi
ve m
anag
emen
t to
prof
essi
onal
man
ager
s - r
educ
es in
cent
ives
to m
onito
r (C
ON
TRA
ST: m
embe
r of p
artn
ersh
ips h
ave
very
st
rong
ince
ntiv
e to
mon
itor d
ecis
ion-
mak
ing
in th
eir f
irms)
Rou
tines
can
aff
ect m
otiv
atio
n -
mea
sure
s use
d to
trac
k pe
rfor
man
ce
om
ake
less
man
pula
ble
om
ore
accu
rate
C
ultu
re-
norm
s abo
ut w
orki
ng h
ard
-no
rms a
bout
risk
-taki
ng
-w
hat s
ort o
f beh
avio
ur is
app
ropr
iate
Fo
ster
cul
ture
that
enc
oura
ges p
erfo
rman
ce, i
f pos
sibl
e
Expl
.B
P: a
fter d
iasg
greg
atio
n - i
nstit
uted
pee
r gro
ups =
> ne
twor
ks e
volv
ed, e
tc..
cros
s-un
it co
oper
atio
n - e
xcha
nge
best
pra
ctic
es
Exam
ple
for P
AR
C
Hig
h C
omm
itmen
t Hum
an R
esou
rce
Man
agem
ent S
yste
ms
-gu
aran
teed
em
ploy
men
t -
Egal
itaria
n va
lues
-
Self-
man
aged
team
s -
Prem
ium
com
pens
atio
n (p
erf.
Pay,
team
, uni
t, fir
m-b
ased
) -
Rig
orou
s Pre
-em
ploy
emen
t scr
eeni
ng
-Ex
tens
ive
soci
alis
atio
n an
d tra
inin
g of
em
ploy
ees
-Tr
ansp
aren
cy o
f inf
orm
atio
n w
ithin
firm
-
Ope
n co
mm
unic
atio
n -
Emph
asis
on
empl
oyee
s sym
bolic
and
real
“ow
ners
hip”
of f
irm
=> L
ogic
: int
eres
ts o
f firm
and
em
ploy
ees a
re c
lose
ly a
ligne
d, sc
reen
ing,
soci
alis
atio
n an
d id
entif
icat
ion
ensu
re n
orm
s tha
t ens
ure
enfo
rcem
ent w
orks
(mut
ual m
onito
ring
and
soci
al
pres
sure
)
PRO
W
orks
wel
l if h
ard
to m
easu
re p
erf.
Acc
urat
ely
and
form
al in
cent
ives
har
d to
pro
vide
CO
STS
(CO
NTR
A)
Hig
h fix
ed (a
nd su
nk) c
osts
– in
vest
men
t to
ensu
re n
orm
s (so
cial
isat
ion,
trai
ning
, re
crui
tmen
t) m
aint
ain
atm
osph
ere
of tr
ust
Pa
y ab
ove
aver
age
leve
ls
Esse
ntia
l:
Stan
dard
s can
not
deg
rade
, oth
erw
ise
high
cos
ts b
ut lo
w e
ffor
t
Inte
ract
ion
amon
g el
emen
ts im
porta
nt:
Ex
plic
it in
cent
ives
and
hig
h co
mm
itmen
t sys
tem
may
be
subs
titut
es b
ecau
se
Logi
c of
reci
proc
ity
If
trus
t is h
igh,
peo
ple
exhi
bit h
igh
effo
rt
Ince
ntiv
e pa
y m
ay b
e se
en a
s sig
nal o
f dis
trust
, thu
s peo
ple
low
er e
ffor
t pro
visi
on.
Rob
erts
200
4 Su
mm
ary
Cha
pter
5
Org
aniz
ing
for
Perf
orm
ance
How
the
parts
fit t
oget
her.
Id
ea:
Des
ign
ince
ntiv
es to
pro
vide
inte
nse
ince
ntiv
es
s. t.
co
nstra
ints
of t
he c
orpo
rate
form
and
the
inte
rdep
ende
ncie
s tha
t thi
s cor
pora
te
form
bot
h cr
eate
s and
is m
eant
to c
ontro
l
=> F
rom
Tig
htly
cou
pled
, den
se c
orpo
rate
form
to th
e Lo
osel
y co
uple
d di
sagg
rega
ted
orga
nisa
tiona
l for
m
Elem
ents
Red
raw
ing
horiz
onta
l and
ver
tical
bou
ndar
ies o
f the
firm
o
to in
crea
se st
rate
gic
focu
s C
reat
ing
smal
l sub
units
o
With
dec
isio
n rig
hts
\ lay
ers o
f man
agem
ent
Hol
d un
its a
ccou
ntab
le fo
r per
form
ance
o
Link
ing
them
to m
anag
e th
eir i
nter
depe
nden
cies
(i.e
. hor
izon
tally
so in
fo fl
ows
dire
ctly
, rat
her t
han
up a
nd d
own)
C
ultu
ral n
orm
s tha
t fac
ilita
te p
erfo
rman
ce
Rec
ently
, man
y fir
ms h
ave
adop
ted
this
des
ign
mod
el in
resp
onse
to in
crea
sed
need
s to
impr
ove
perf
orm
ance
. G
loba
lisat
ion
falli
ng b
arrie
rs to
oin
tern
atio
nal t
rade
ea
sier
long
-dis
tanc
e co
mm
unic
atio
n an
d tra
nspo
rtatio
n =
ente
r for
eign
m
arke
ts =
mor
e co
mpe
titio
n in
pro
duct
and
serv
ice
=> e
ffic
ienc
y ne
eded
for p
rofit
abili
ty a
nd su
rviv
al
oin
tern
atio
nal i
nves
tmen
t m
ore
pres
sure
from
inve
stor
s, es
p. a
ccep
tanc
e of
shar
ehol
der v
alue
m
odel
Expl
.: B
P fr
om p
oliti
cise
d to
p-he
avy
bure
aucr
ativ
oil
cong
lom
erat
e to
one
of t
he m
ost
prof
itabl
e fir
ms i
n th
e w
orld
1.
dive
stin
g al
l non
-cor
e bu
sine
sses
, FO
CU
S on
a.
upst
ream
oil
and
gas e
xplo
ratio
n an
d pr
oduc
tion
b.do
wns
tream
pet
role
um re
finin
g an
d m
arke
ting
c.pe
troch
emic
als
2.or
gani
satio
nal c
hang
es (l
ay-o
ffs,
dive
stin
g, e
tc.)
a.e.
g. “
asse
t fed
erat
ion”
in B
PX (u
pstre
am e
xplo
ratio
n bu
sine
ss) =
prim
e ex
ampl
e of
dis
aggr
egat
ed d
esig
n,
i.B
PX d
ivid
ed in
to so
me
40 b
usin
ess u
nits
= “
asse
ts”
= 1
maj
or fi
eld
and
co-lo
cate
d fie
lds
ii.pe
rfor
man
ce e
valu
atio
n di
scus
sion
wer
e pu
shed
dow
n to
indi
vidu
al
field
s, w
ith m
anag
ers o
f # o
f fie
lds b
eing
giv
en d
ecis
ion
auth
ority
(and
as
it w
orke
d w
ell,
this
was
ado
pted
for a
ll fie
lds)
iii
.ta
rget
s wer
e ne
gotia
ted
with
top
man
agem
ent o
f BPX
dire
ctly
iv
.“c
harte
rs”
wer
e gi
ven
to m
anag
ers =
bou
nds o
n th
eir a
ctiv
ities
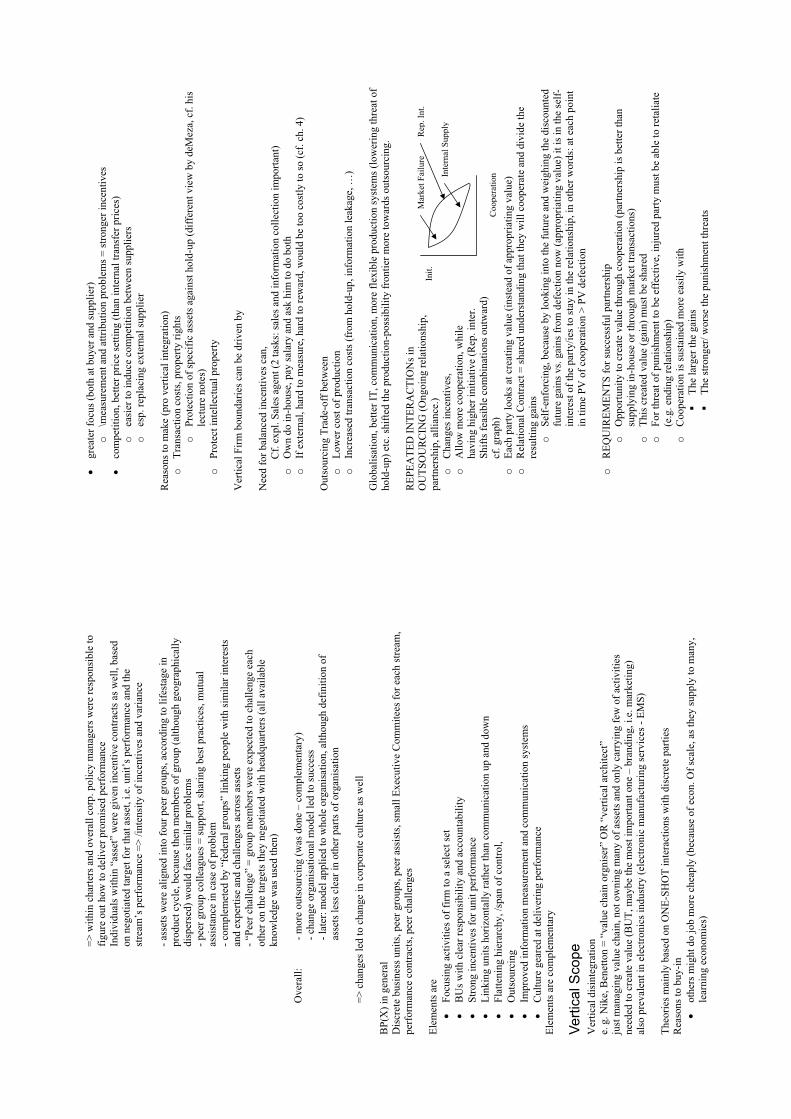
=> w
ithin
cha
rters
and
ove
rall
corp
. pol
icy
man
ager
s wer
e re
spon
sibl
e to
fig
ure
out h
ow to
del
iver
pro
mis
ed p
erfo
rman
ce
Indi
vidu
als w
ithin
“as
set”
wer
e gi
ven
ince
ntiv
e co
ntra
cts a
s wel
l, ba
sed
on n
egot
iate
d ta
rget
for t
hat a
sset
, i.e
. uni
t’s p
erfo
rman
ce a
nd th
e st
ream
’s p
erfo
rman
ce =
> /in
tens
ity o
f inc
entiv
es a
nd v
aria
nce
- ass
ets w
ere
alig
ned
into
four
pee
r gro
ups,
acco
rdin
g to
life
stag
e in
pr
oduc
t cyc
le, b
ecau
se th
en m
embe
rs o
f gro
up (a
lthou
gh g
eogr
aphi
cally
di
sper
sed)
wou
ld fa
ce si
mila
r pro
blem
s - p
eer g
roup
col
leag
ues =
supp
ort,
shar
ing
best
pra
ctic
es, m
utua
l as
sist
ance
in c
ase
of p
robl
em
- com
plem
eted
by
“fed
eral
gro
ups”
link
ing
peop
le w
ith si
mila
r int
eres
ts
and
expe
rtise
and
cha
lleng
es a
cros
s ass
ets
- “Pe
er c
halle
nge”
= g
roup
mem
bers
wer
e ex
pect
ed to
cha
lleng
e ea
ch
othe
r on
the
targ
ets t
hey
nego
tiate
d w
ith h
eadq
uarte
rs (a
ll av
aila
ble
know
ledg
e w
as u
sed
then
)
O
vera
ll:
- mor
e ou
tsou
rcin
g (w
as d
one
– co
mpl
emen
tary
)
- cha
nge
orga
nisa
tiona
l mod
el le
d to
succ
ess
- lat
er: m
odel
app
lied
to w
hole
org
anis
atio
n, a
lthou
gh d
efin
ition
of
asse
ts le
ss c
lear
in o
ther
par
ts o
f org
anis
atio
n
=>
cha
nges
led
to c
hang
e in
cor
pora
te c
ultu
re a
s wel
l
BP(
X) i
n ge
nera
l D
iscr
ete
busi
ness
uni
ts, p
eer g
roup
s, pe
er a
ssis
ts, s
mal
l Exe
cutiv
e C
omm
itees
for e
ach
stre
am,
perf
orm
ance
con
tract
s, pe
er c
halle
nges
Elem
ents
are
Fo
cusi
ng a
ctiv
ities
of f
irm to
a se
lect
set
BU
s with
cle
ar re
spon
sibi
lity
and
acco
unta
bilit
y St
rong
ince
ntiv
es fo
r uni
t per
form
ance
Li
nkin
g un
its h
oriz
onta
lly ra
ther
than
com
mun
icat
ion
up a
nd d
own
Flat
teni
ng h
iera
rchy
, /sp
an o
f con
trol,
Out
sour
cing
Impr
oved
info
rmat
ion
mea
sure
men
t and
com
mun
icat
ion
syst
ems
Cul
ture
gea
red
at d
eliv
erin
g pe
rfor
man
ce
Elem
ents
are
com
plem
enta
ry
Verti
cal S
cope
V
ertic
al d
isin
tegr
atio
n e.
g. N
ike,
Ben
etto
n =
“val
ue c
hain
org
nise
r” O
R “
verti
cal a
rchi
tect
” ju
st m
anag
ing
valu
e ch
ain,
not
ow
ning
man
y of
ass
ets a
nd o
nly
carr
ying
few
of a
ctiv
ities
ne
eded
to c
reat
e va
lue
(BU
T, m
aybe
the
mos
t im
porta
nt o
ne –
bra
ndin
g, i.
e. m
arke
ting)
al
so p
reva
lent
in e
lect
roni
cs in
dust
ry (e
lect
roni
c m
anuf
actu
ring
serv
ices
- EM
S)
Theo
ries m
ainl
y ba
sed
on O
NE-
SHO
T in
tera
ctio
ns w
ith d
iscr
ete
parti
es
Rea
sons
to b
uy-in
ot
hers
mig
ht d
o jo
b m
ore
chea
ply
(bec
ause
of e
con.
Of s
cale
, as t
hey
supp
ly to
man
y,
lear
ning
eco
nom
ies)
grea
ter f
ocus
(bot
h at
buy
er a
nd su
pplie
r)
o\m
easu
rem
ent a
nd a
ttrib
utio
n pr
oble
ms =
stro
nger
ince
ntiv
es
com
petit
ion,
bet
ter p
rice
setti
ng (t
han
inte
rnal
tran
sfer
pric
es)
oea
sier
to in
duce
com
petit
ion
betw
een
supp
liers
o
esp.
repl
acin
g ex
tern
al su
pplie
r
Rea
sons
to m
ake
(pro
ver
tical
inte
grat
ion)
o
Tran
sact
ion
cost
s, pr
oper
ty ri
ghts
o
Prot
ectio
n of
spec
ific
asse
ts a
gain
st h
old-
up (d
iffer
ent v
iew
by
deM
eza,
cf.
his
lect
ure
note
s)
oPr
otec
t int
elle
ctua
l pro
perty
Ver
tical
Firm
bou
ndar
ies c
an b
e dr
iven
by
Nee
d fo
r bal
ance
d in
cent
ives
can
,
Cf.
expl
. Sal
es a
gent
(2 ta
sks:
sale
s and
info
rmat
ion
colle
ctio
n im
porta
nt)
oO
wn
do in
-hou
se, p
ay sa
lary
and
ask
him
to d
o bo
th
oIf
ext
erna
l, ha
rd to
mea
sure
, har
d to
rew
ard,
wou
ld b
e to
o co
stly
to so
(cf.
ch. 4
)
Out
sour
cing
Tra
de-o
ff b
etw
een
oLo
wer
cos
t of p
rodu
ctio
n o
Incr
ease
d tra
nsac
tion
cost
s (fr
om h
old-
up, i
nfor
mat
ion
leak
age,
…)
Glo
balis
atio
n, b
ette
r IT,
com
mun
icat
ion,
mor
e fle
xibl
e pr
oduc
tion
syst
ems (
low
erin
g th
reat
of
hold
-up)
etc
. shi
fted
the
prod
uctio
n-po
ssib
ility
fron
tier m
ore
tow
ards
out
sour
cing
.
REP
EATE
D IN
TER
AC
TIO
Ns i
n O
UTS
OU
RC
ING
(Ong
oing
rela
tions
hip,
pa
rtner
ship
, alli
ance
.)
Coo
pera
tion
Init.
Mar
ket F
ailu
re
Inte
rnal
Sup
ply
Rep
. Int
.
oC
hang
es in
cent
ives
, o
Allo
w m
ore
coop
erat
ion,
whi
le
havi
ng h
ighe
r ini
tiativ
e (R
ep. i
nter
. Sh
ifts f
easi
ble
com
bina
tions
out
war
d)
cf. g
raph
)o
Each
par
ty lo
oks a
t cre
atin
g va
lue
(inst
ead
of a
ppro
pria
ting
valu
e)
oR
elat
iona
l Con
tract
= sh
ared
und
erst
andi
ng th
at th
ey w
ill c
oope
rate
and
div
ide
the
resu
lting
gai
ns
oSe
lf-en
forc
ing,
bec
ause
by
look
ing
into
the
futu
re a
nd w
eigh
ing
the
disc
ount
ed
futu
re g
ains
vs.
gain
s fro
m d
efec
tion
now
(app
ropr
iatin
g va
lue)
it is
in th
e se
lf-in
tere
st o
f the
par
ty/ie
s to
stay
in th
e re
latio
nshi
p, in
oth
er w
ords
: at e
ach
poin
t in
tim
e PV
of c
oope
ratio
n >
PV d
efec
tion
oR
EQU
IREM
ENTS
for s
ucce
ssfu
l par
tner
ship
o
Opp
ortu
nity
to c
reat
e va
lue
thro
ugh
coop
erat
ion
(par
tner
ship
is b
ette
r tha
n su
pply
ing
in-h
ouse
or t
hrou
gh m
arke
t tra
nsac
tions
) o
This
cre
ated
val
ue (g
ain)
mus
t be
shar
ed
oFo
r thr
eat o
f pun
ishm
ent t
o be
eff
ectiv
e, in
jure
d pa
rty m
ust b
e ab
le to
reta
liate
(e
.g. e
ndin
g re
latio
nshi
p)
oC
oope
ratio
n is
sust
aine
d m
ore
easi
ly w
ith
The
larg
er th
e ga
ins
The
stro
nger
/ wor
se th
e pu
nish
men
t thr
eats
Tran
sgre
ssio
n m
ust b
e ob
serv
able
=>
par
ties m
ight
gai
n by
wor
seni
ng th
eir o
utsi
de o
ptio
ns (l
imiti
ng c
hoic
e =
com
mitm
ent)
= m
ore
depe
nden
t on
each
oth
er
The
mor
e w
eigh
t on
futu
re d
ealin
gs
Low
dis
coun
t rat
e fo
r fut
ure
oC
osts
of c
apita
l: If
low
(e.g
. int
eres
t rat
es a
re lo
w),
easi
er to
mai
ntai
n co
oper
atio
n, b
ecau
se lo
wer
dis
coun
t ra
te o
f fut
ure
retu
rns.
Futu
re m
atte
rs m
uch,
i.e.
mon
ey in
th
e fu
ture
is w
orth
a lo
t. o
Cos
ts o
f cap
ital a
lso
depe
nd o
n fir
ms’
ove
rall
finan
cial
st
reng
th: E
.g. s
trong
firm
s are
abl
e to
bor
row
at l
ower
ra
tes,
thus
they
dis
coun
t fut
ure
less
, mor
e w
illin
g to
su
stai
n co
oper
atio
n o
In o
ther
wor
ds: 2
wea
k fir
ms =
har
d to
sust
ain
coop
erat
ion.
Eve
n if
stro
ng fi
rm in
the
partn
ersh
ip, i
f so
me
reas
on fu
ture
cou
nts l
ess,
mor
e lik
ely
to d
efec
t (e
.g. c
ash
cris
is) (
see
belo
w *
*)
Freq
uent
inte
ract
ion
How
do
prin
cipl
es fl
esh
out i
n re
ality
(mai
nly
Toyo
ta)?
1.
not a
ll pr
oduc
t are
acq
uire
d th
roug
h lo
ng-te
rm re
latio
ns (m
ight
be
bette
r tro
ugh
mar
ket
e.g.
com
mod
ities
OR
in-h
ouse
, e.g
. fin
anci
al re
sour
ce o
r hum
an re
sour
ce m
gmt.
or
prod
. dev
elop
men
t) 2.
Sele
ctio
n of
par
tner
s = C
ruci
al (m
any
reso
urce
s dev
oted
to)
a.Es
tabl
ish
basi
c un
ders
tand
ing
wha
t the
rela
tions
hip
is a
bout
=>
then
con
tract
s mig
ht b
e sh
ort a
nd si
mpl
e (T
oyot
a)
3.Pu
nish
men
ts
a.M
ost s
ever
e fo
rm =
end
ing
rela
tions
hip
b.M
ake
puni
shm
ent c
redi
ble,
e.g
. Toy
ota’
s “2-
supp
lier p
olic
y”, c
an a
lway
s re
treat
on
2nd su
pplie
r, (o
r hav
e th
at c
apab
ility
in-h
ouse
, so,
in c
ase
of
defe
ctio
n of
oth
er p
arty
one
cou
ld re
treat
to th
at c
apab
ility
) i.
Ben
efits
1.th
is a
llow
s for
mor
e nu
ance
d in
cent
ives
(tha
n th
reat
of
term
inat
ion)
, e. g
. com
petit
ion
betw
een
supp
liers
can
be
indu
ced,
shar
ing
info
rmat
ion
ii.
Cos
ts 1.2
rela
tions
hips
mus
t be
man
aged
2.
poss
ibly
, los
s of e
con.
of s
cale
3.
subt
ly, i
n an
y of
2 su
pplie
r-re
latio
nshi
ps, t
here
is (m
ost l
ikel
y) a
lit
tle le
ss v
alue
cre
ated
than
if T
oyot
a ha
d on
ly o
ne re
latio
nshi
p Tr
ade-
Off
- One
supp
lier =
mor
e va
lue
crea
ted
- 2 su
pplie
rs
= le
ss v
alue
cre
ated
in e
ach,
BU
T /th
reat
of p
unis
hmen
t =>
mor
e co
oper
atio
n 4.
Tran
sgre
ssio
n (m
ost d
iffic
ult p
art t
o ob
serv
e, w
heth
er p
artn
er a
dher
ed to
term
s),
beca
use
ofte
n be
havi
our i
s not
dire
ctly
obs
erva
ble,
so in
cas
e of
bad
pro
duct
s de
liver
ed (o
ther
par
ty c
anno
t cle
arly
say
whe
ther
it is
due
to e
xter
nal c
ircum
stan
ces o
r in
tend
ed m
isbe
havi
our)
= a
sym
met
ry o
f inf
orm
atio
n +
resu
lting
pro
blem
s a.
Solu
tion
(at T
oyot
a): E
xten
sive
info
rmat
ion
shar
ing,
eng
inee
rs v
isit
plan
ts,
faci
litie
s, et
c…
Wea
knes
s in
Toyo
ta’s
syst
em
-To
yota
mig
ht b
e to
o st
rong
rela
tive
to su
pplie
rs
o(W
hy d
oesn
’t it
use
this
pow
er to
sque
eze
prof
its o
ut o
f the
ir su
pplie
rs?)
-
Toyo
ta to
o co
ncer
ned
abou
t its
repu
tatio
n o
(sup
plie
rs a
re o
rgan
ised
with
in fo
rmal
ass
ocia
tion
=> w
ould
kno
w a
bout
any
m
isbe
havi
our i
mm
edia
tely
) o
Toyo
ta b
orro
ws a
t low
inte
rest
rate
s =>
futu
re re
turn
s are
not
dis
coun
ted
muc
h =>
futu
re m
eans
a lo
t =>
repu
tatio
n (f
or fu
ture
) is i
mpo
rtant
“lo
oms l
arge
”
**Im
porta
nce
of w
eigh
t of f
utur
e re
turn
s (e.
g. d
isco
unt r
ate)
“W
hen
imm
edia
te su
rviv
al is
at
stak
e, lo
nger
term
con
side
ratio
ns a
re n
ot v
ery
salie
nt.”
Tw
o ex
ampl
es fr
om a
uto
indu
stry
. 1.
GM
Put i
nto
plac
e, e
xten
sive
info
. sha
ring
syst
em w
ith su
pplie
rs.
THEN
. GM
got
into
trou
ble
(cas
h cr
isis
) nea
r ban
krup
tcy,
use
d in
fo. t
o sq
ueez
e su
pplie
rs o
ut =
har
med
thei
r rep
utat
ion
YET
beh
avio
ur w
as ra
tiona
l fro
m G
M p
oint
of
view
2. U
PF-T
hom
pson
– F
OR
D (L
and
Rov
er)
U
PF =
sole
supp
lier o
f cha
ssis
for R
over
’s “
Dis
cove
ry”-
mod
el
U
PF, w
ent i
nto
“rec
eive
rshi
p” ru
n by
KPM
G
Ford
off
ered
hel
p, o
ffer
ing
one-
time
paym
ent t
o U
PF a
nd h
ighe
r pric
e pe
r cha
ssis
(F
ord
was
dep
ende
nt o
n su
pplie
r)
KPM
G-r
un U
PF a
sked
for m
uch
mor
e at
tem
ptin
g to
app
ropr
iate
val
ue th
roug
h ho
ld-
up
5.Lo
ng-te
rm re
latio
nshi
ps n
eed
to a
djus
t ove
r tim
e
-be
caus
e of
cha
ngin
g ci
rcum
stan
ce
AFF
ECT
oex
tent
of c
oope
ratio
n th
at is
pos
sibl
e o
divi
sion
of r
etur
ns
oap
prop
riate
mix
of a
ctiv
ities
, par
ties u
nder
take
=> F
or lo
ng-te
rm to
wor
k =
parti
es m
ust b
e w
illin
g to
adj
ust a
gree
men
ts “
on th
e go
”
Xer
ox a
nd F
uji P
hoto
Film
(for
med
Join
t Ven
ture
) =>
Fuji
Xer
ox (o
ne o
f lon
gest
-la
stin
g) ro
les,
partn
ers,
activ
ities
, etc
… a
ll ch
ange
d th
roug
hout
6.Ea
ch p
arty
mus
t be
conc
erne
d ab
out t
heir
own
actio
ns, a
nd w
hat c
onse
quen
ces i
t m
ight
hav
e on
the
partn
ersh
ip, e
.g. b
y ch
angi
ng re
turn
s of p
artn
ersh
ip (a
nd th
us a
ffec
t po
ssib
ility
for c
ontin
ued
coop
erat
ion)
7.M
akin
g pa
rties
mor
e de
pend
ent o
n ea
ch o
ther
(AT&
T)
Hor
izon
tal S
cope
R
easo
ning
for c
ongl
omer
ates
(put
ting
two
diff
eren
t und
er c
omm
on ro
of)
- wha
t aff
ect s
houl
d th
is h
ave
on c
orpo
rate
val
ue?
OR
- W
hy sh
ould
they
hav
e di
ffer
ent v
alue
if se
para
te?
OLD
reas
onin
g: R
isk
Div
ersi
ficat
ion
(like
div
ersi
fied
portf
olio
) BU
T do
esn’
t mak
e se
nse
beca
use
shar
ehol
ders
can
div
ersi
fy th
emse
lves
. (A
ctua
lly d
iver
sifie
d fir
m w
ould
rest
rict t
heir
choi
ce b
ecau
se n
ow c
anno
t do
it th
emse
lves
).
CO
UN
TER
-AR
GU
MEN
T:
-m
aybe
shar
ehol
ders
can
not d
iver
sify
them
selv
es e
asily
o
(e.g
. in
fam
ily-o
wne
d fir
ms,
firm
s can
not e
asily
div
ersi
fy th
roug
h ca
pita
l m
arke
ts)
-st
ockh
olde
rs c
anno
t div
ersi
fy th
eir e
mpl
oym
ent,
thro
ugh
dive
rsifi
catio
n (if
cro
ss-
subs
idiz
atio
n is
pos
sibl
e) lo
wer
s ris
k of
lay-
offs
, pay
cut
so
(val
ue to
shar
ehol
ders
mig
ht b
e th
at a
vera
ge to
tal c
ompe
nsat
ion
is a
lso
low
ered
)-
Cap
ital a
lloca
tion
with
in o
ne c
ompa
ny m
ight
be
easi
er b
ecau
se in
form
aton
al
asym
met
ries m
ight
be
less
ened
with
in o
ne fi
rm (t
han
thro
ugh
mar
ket t
rans
actio
ns)
-H
uman
cap
ital a
lloca
tion
mig
ht b
e ea
sier
, sin
ce in
form
atio
n flo
ws m
ore
free
ly,
beca
use
of c
ultu
re (s
hare
d un
ders
tand
ing,
exp
erie
nce,
lang
uage
) o
Mig
ht a
lso
allo
w d
evel
opm
ent o
f hum
an c
apita
l mor
e ea
sily
, sin
ce m
ore
expe
rienc
es c
an b
e of
fere
d-
Firm
has
und
er-u
tiliz
ed c
apab
ilitie
s/ re
sour
ces b
ut c
anno
t ext
end
with
in c
urre
nt
busi
ness
(bec
ause
not
attr
activ
e)
-Ex
tern
aliti
es b
etw
een
busi
ness
es m
ight
favo
ur in
tegr
atin
g bu
sine
sses
bec
ause
ex
tern
aliti
es re
quire
coo
pera
tion
oIn
duci
ng c
oope
ratio
n w
ithin
firm
mig
ht b
e ea
sier
bec
ause
can
off
er m
ore
mut
ed o
r mor
e ba
lanc
ed in
cent
ives
-
Com
plem
enta
ritie
s can
be
basi
s for
inte
rdep
ende
nce
betw
een
pote
ntia
lly se
para
te
busi
ness
es =
> in
tegr
atio
n o
Expl
. Son
y (h
ardw
are
– co
nsum
er e
lect
roni
cs) b
uyin
g C
olum
bia
Pict
ures
an
d C
BS
Rec
ords
(sof
twar
e –
cont
ent)
Dra
wba
cks o
f int
egra
tion
-N
o le
ader
ship
exp
erie
nce
conc
erni
ng b
usin
ess o
f new
firm
, litt
le e
xper
ienc
e or
un
ders
tand
ing
the
new
bus
ines
s -
Top
exec
utiv
es’ a
ttent
ion
mig
ht b
e di
verte
d fr
om th
e co
re b
usin
esse
s -
Tens
ion
betw
een
busi
ness
es
-C
apita
l Allo
catio
n =
sour
ce o
f ine
ffic
ienc
y o
Ris
k-re
duct
ion
for m
anag
ers a
nd e
mpl
oyee
s mig
ht m
ean
capi
tal i
s not
in
vest
ed w
here
it h
as h
ighe
st-v
alue
use
o
Cro
ss-s
ubsi
diza
tion
mig
ht m
ean
that
ince
ntiv
es w
ithin
bus
ines
ses a
re
mut
ed (c
ompa
red
to st
and-
alon
e)
oSi
ngle
firm
mig
ht m
ean
mor
e in
fluen
ce a
ctiv
ities
, or r
esou
rces
was
ted
to
limit
thes
e o
Met
hods
to c
ompe
te fo
r cap
ital (
are
diff
eren
t fro
m m
arke
t) m
ore
exte
nsiv
e op
portu
nitie
s to
depr
ecat
e or
sabo
tage
oth
ers’
pro
ject
s o
Empi
rical
ly so
me
of th
ese
poin
ts se
em to
hav
e be
en sh
own
in re
ality
M
arke
ts v
alue
d di
vers
ified
firm
s les
s tha
n su
m o
f its
con
stitu
ents
(“
dive
rsifi
catio
n di
scou
nt”)
M
etho
d: c
ompa
re c
ongl
omer
ate
with
sum
of i
ndiv
idua
l com
pani
es
in th
e sa
me
lines
of b
usin
ess i
n te
rms o
f sto
ck p
erfo
rman
ce a
nd
inve
stm
ent c
hoic
es
Res
ult:
cong
lom
erat
e in
vest
s les
s int
o st
rong
div
isio
ns (t
han
focu
sed
com
pani
es in
sam
e bu
sine
ss) a
nd m
ore
into
wea
ker o
nes
Expl
anat
ion:
influ
ence
act
iviti
es –
cro
ss-s
ubsi
disa
tion
from
w
inne
rs to
lose
rs (2
inte
rpre
tatio
n)
oIn
fluen
ce a
ctiv
ities
twis
ting
actu
al c
hoic
es
oFi
rm a
dopt
ed m
echa
nism
s tha
t lim
it th
ese
influ
ence
ac
tiviti
es (m
aybe
by
dist
ribut
ing
capi
tal m
ore
even
ly
than
wou
ld b
e de
sira
ble
for e
ffic
ienc
y. E
qual
ity
inst
ead
of e
ffic
ienc
y)
oA
lso
empi
rical
resu
lts q
uest
ioni
ng “
dive
rsifi
catio
n di
scou
nt”
base
d on
po
tent
ial c
ross
-sub
sidi
satio
n E.
g. o
ne st
udy
show
s tha
t bus
ines
s did
not
ado
pt to
o di
ffer
ent
capi
tal a
lloca
tion
(i.e.
the
lines
of b
usin
ess t
hey
inve
sted
in) b
efor
e an
d af
ter m
erge
r In
199
0s d
iver
sify
ing
firm
s met
with
pos
itive
stoc
k m
arke
t re
actio
ns, i
n lin
e w
ith o
bser
vatio
n th
at o
ften
posi
tive
stoc
k m
arke
t re
turn
s to
acqu
ired
firm
and
zer
o to
acq
uirin
g fir
m =
in a
ggre
gate
va
lue
is c
reat
ed in
mer
gers
C
onun
drum
of G
E, th
e m
ost d
iver
sifie
d an
d m
ost p
rofit
able
firm
in
the
wor
ld
oW
hat t
o m
ake
of th
ese
seem
ingl
y di
sagr
eein
g fa
cts?
So
met
imes
val
ue is
cre
ated
by
dive
rsifi
catio
n =
man
ager
s cho
ose
thes
e op
tion,
esp
. if u
nder
utili
sed
capa
bilit
ies o
r res
ourc
es
Som
etim
es b
y ha
ving
focu
sed
com
pani
es
-Em
pire
-Bui
ldin
g?
oO
ccur
s som
etim
es
oTO
DA
Y, C
EOs h
ave
sign
ifica
nt st
ock
optio
ns th
at w
ould
dec
reas
e in
va
lue,
or a
t lea
st m
ake
them
ver
y se
nsiti
ve to
firm
val
ue
-O
rgan
isat
iona
l des
ign
oC
ompa
nies
on
thei
r ow
n m
ight
ado
pt d
iffer
ent o
rgan
isat
iona
l des
igns
(all
dim
ensi
on o
f P A
R C
) wor
king
opt
imal
ly in
the
spec
ific
envi
ronm
ent
oEi
ther
– o
r – c
hoic
e (b
oth
cost
ly)
Man
agin
g va
rious
des
igns
form
s und
er o
ne ro
of =
com
plex
ity =
> /in
fluen
ce a
ctiv
ities
and
loss
of c
ontro
l M
akin
g de
sign
s mor
e co
mm
on, s
imila
r (bu
t the
n de
sign
mig
ht n
ot
be o
ptim
al a
nym
ore
in th
e sp
ecifi
c en
viro
nmen
ts a
nd in
divi
dual
bu
sine
ss n
eeds
)
Sum
mar
y: T
he lo
gic
of d
iver
sific
atio
n -
dive
rsifi
catio
n, if
bus
ines
s foc
used
on
grow
th
-fo
cus,
if fir
m tu
ned
in o
n de
liver
ing
perf
orm
ance
in c
urre
nt b
usin
ess (
then
one
sh
ould
als
o se
e ot
her o
rgan
isat
iona
l cha
nges
targ
eted
at i
ncre
asin
g cu
rren
t pe
rfor
man
ce (b
ecau
se o
f com
plem
enta
ritie
s)
-if
envi
ronm
enta
l cha
nges
allo
w b
usin
ess t
o gr
ow e
ven
in e
xist
ing
lines
than
one
w
ould
exp
ect t
o se
e le
ss d
iver
sific
atio
n (le
ss sc
ope)
(Rob
erts
see
one
such
cha
nge
in g
loba
lisat
ion,
allo
ws t
o en
ter n
ew m
arke
ts (g
row
geo
grap
hica
lly, n
ot in
scop
e)
mor
e ea
sily
, cos
ts o
f tra
nspo
rt\, c
omm
unic
atio
n\)
Inte
rnal
Org
anis
atio
n an
d P
efor
man
ce
How
doe
s int
erna
l org
anis
atio
n af
fect
per
form
ance
? C
hang
es o
f dis
aggr
egat
ed, l
oose
ly c
oupl
ed fi
rms
-cl
arity
abo
ut st
rate
gy a
nd c
orpo
rate
pol
icie
s -
dsic
rete
org
anis
atio
nal u
nits
(ofte
n sm
alle
r tha
n be
fore
) ->
focu
s
1.gi
ve le
ader
s dec
isio
n au
thor
ity o
ver o
pera
tiona
l and
stra
tegi
c op
tions
2.
hold
acc
ount
able
for r
esul
ts
-de
laye
ring
= fe
wer
laye
rs
-le
ss c
entra
l sta
ff
-st
reng
then
ince
ntiv
es a
t ind
ivid
ual a
nd u
nit l
evel
,1.
desi
rabl
y tie
d to
ove
rall
perf
orm
ance
as w
ell
-m
ore
reso
urce
s to
man
agem
ent t
rain
ing
and
deve
lopm
ent
-/h
oriz
onta
l com
mun
icat
ion
-Im
prov
e in
form
atio
n sy
stem
s tha
t allo
w m
ore
com
mun
icat
ion
and
bette
r per
form
ance
m
easu
rem
ent
Elem
ents
link
ed b
y w
eb o
f com
plem
enta
ry re
latio
nshi
ps. O
ne m
ight
see
all b
eing
don
e al
toge
ther
(cf.
case
of “
Seal
ed A
ir C
orpo
ratio
n” W
ruck
MN
404)
. Loo
k at
eff
ects
of e
ach
mov
e an
d se
e at
its l
inks
with
oth
er e
lem
ents
-
Dis
cret
e un
its a
nd d
ecis
ion-
right
s to
unit
lead
ers
1.Im
prov
es in
cent
ives
at u
nit l
evel
H
avin
g re
spon
sibi
lity
is m
otiv
atin
g in
itse
lf (a
lso,
you
will
inve
st m
ore
into
you
r dec
isio
n, if
you
hav
e th
e rig
hts t
o so
(cf.A
ghio
n/Ti
role
199
7)
If y
ou h
ave
resp
onsi
bilit
y fo
r dec
., do
n’t n
eed
to in
fluen
ce th
eir
deci
sion
s any
mor
e (le
ss re
sour
ces w
aste
d an
d m
ore
time
for b
ette
r de
cisi
ons)
Del
ayer
ing
and
less
cen
tral s
tatff
aug
men
ts th
ese
affe
cts,
/spa
n of
co
ntro
l, le
ss re
sour
ces t
o in
terv
ene
at lo
wer
leve
ls (c
redi
ble
com
mitm
ent n
ot to
inte
rven
e, a
s you
don
’t ha
ve re
sour
ces t
o so
an
ymor
e)=
mor
e re
spon
sibi
lity
at b
otto
m-le
vel
Del
ayer
ing,
smal
l uni
ts d
ecis
ions
righ
ts =
com
plem
ents
C
lear
er re
latio
nshi
p be
twee
n de
cisi
ons/
cho
ices
and
out
com
es
Faci
litat
es le
arni
ng
/mot
ivat
ion
oH
ighe
r int
rinsi
c m
otiv
atio
n be
caus
e yo
u se
e w
hat y
ou’v
e do
neo
Can
pro
vide
bet
ter f
orm
al in
cent
ives
bec
ause
m
easu
rem
ent i
s mor
e ac
cura
te, i
.e. e
asie
r, le
ss c
ostly
=>
smal
l uni
ts a
nd m
ore
inte
nse
ince
ntiv
es a
re c
ompl
emen
ts
oSm
all u
nits
mak
e fo
rmal
ince
ntiv
es m
ore
valu
able
be
caus
e fr
ee-r
ider
pro
blem
is re
duce
d an
d (s
trong
er)
norm
s can
be
impl
emen
ted
bette
r In
cent
ive
inte
nsity
AN
D m
easu
rem
ent a
ccur
acy
(MA
) com
plem
ents
M
A is
incr
ease
d w
ith
Smal
l uni
ts/
Bet
ter I
nfo.
Sys
tem
s C
larit
y ab
out s
trate
gy ->
cla
rity
abou
t wha
t nee
ds to
be
mea
sure
d (/M
A a
llow
s bro
ader
span
of c
ontro
l) 2.
/spe
ed a
dopt
ion
of n
ew in
form
atio
n In
form
atio
n is
mos
t ava
ilabl
e to
fron
tline
per
sonn
el, i
f the
y ca
n m
ake
deci
sion
s =>
bette
r dec
isio
ns (i
f the
y kn
ow c
orp.
stra
tegy
, etc
..) a
nd if
m
easu
re d
irect
ly li
nked
to g
oals
of c
orp.
stra
tegy
M
ost v
alua
ble
if en
viro
nmen
t cha
ngin
g fa
st (b
ecau
se in
fo. c
hang
es
ofte
n)
Com
plem
enta
ry to
\ver
tical
com
mun
icat
ion,
\spa
n of
con
trol,
\cla
rity
abou
t stra
tegy
(if o
nly
thro
ugh
/MA
)
-C
OST
s of e
mpo
wer
ing
fron
tline
1.
qual
ity o
f dec
isio
n-m
akin
g m
ay w
orse
n (b
/c)
b/c
mid
dle
man
ager
s are
gon
e lo
wer
leve
ls m
ight
not
hav
e in
fo a
bout
spill
over
eff
ects
m
ight
not
hav
e in
cent
ives
to a
ccou
nt fo
r the
se e
ffec
ts
BU
T no
w to
p m
anag
emen
t clo
ser t
o fr
ontli
ne, m
ost l
ikel
y th
ere
info
. no
w is
bet
ter (
also
thro
ugh
/info
. sys
tem
s), t
hus,
if pr
oble
m is
pas
sed
up c
an b
ase
deci
sion
on
good
info
. 2.
exec
utiv
e ov
erlo
ad (m
iddl
e m
anag
ers g
one)
de
c. m
ust m
ove
dow
n =>
mea
sure
s to
incr
ease
dec
.mak
ing
by fr
onlin
e m
anag
ers a
nd d
elay
erin
g =
com
plem
ents
(CO
OPE
RA
TIO
N n
eeds
to b
e in
duce
d)fr
ontli
ne m
anag
ers m
ake
bette
r dec
isio
ns if
they
can
get
the
info
abo
ut
spill
over
etc
. whi
ch w
as fu
rther
in th
e he
ad o
f the
mid
dle
man
ager
, ov
erse
eing
two
units
, thr
ough
/inf
orm
atio
n sy
stem
s, /h
oriz
onta
l co
mm
unic
atio
n, c
lear
cor
p. st
rate
gy
link
pay
to m
easu
res i
n su
ch w
ay th
at p
eopl
e ar
e in
cent
ivis
ed to
mak
e de
cisi
on ta
king
acc
ount
of e
ffec
ts o
n ot
her u
nits
, i.e
. lin
k pa
y al
so to
ov
eral
l per
form
ance
3.
limite
d ca
pabi
litie
s of u
nit/
fron
tline
A
SK: W
ould
mid
dle-
man
agem
ent o
r cen
ter o
f org
anis
atio
n do
any
be
tter?
If
not
incr
ease
cap
abili
ty b
y tra
inin
g an
d de
velo
pmen
t 4.
Som
e is
sues
mig
ht b
e be
tter a
ddre
ssed
by
cent
er
Such
as r
egul
ator
y an
d en
viro
nmen
tal a
nd g
over
nmen
tal i
ssue
s =>
mat
rix fo
rms
Who
le S
yste
m
Logi
c of
com
plem
enta
ritie
s app
lies a
lso
to v
ertic
al a
nd h
oriz
onta
l sco
pe o
f the
firm
. So
me
rese
arch
ers h
ave
test
ed c
ompa
nies
on
thei
r per
form
ance
and
to w
hich
ext
ent t
he fi
rms
had
adop
ted
elem
ents
of t
his m
odel
: -
foun
d st
atis
tical
ly si
gnifi
cant
cor
rela
tions
bet
wee
n th
e el
emen
ts o
f the
mod
el (e
.g.
adop
ting
horiz
onta
l lin
kage
s and
inve
stm
ents
into
IT a
nd c
omm
unic
atio
n sy
stem
s -
Thos
e fir
ms t
hat h
ad a
dopt
ed a
ll of
the
elem
ents
did
con
side
rabl
y be
tter (
had
best
pe
rfor
man
ce)
-w
orst
-per
form
ing
firm
s in
sam
ple
wer
e th
ose
that
had
onl
y ad
opte
d a
few
of t
he
elem
ents
(sug
gest
ing
com
plem
enta
rity
of e
lem
ents
) =>
do
it al
l or n
othi
ng m
ix-a
nd-m
atch
doe
sn’t
wor
k
Rui
grok
, W. e
t al.
1999
: Cor
pora
te R
estru
ctur
ing
and
New
For
ms o
f Org
aniz
ing.
Evi
denc
e fr
om E
urop
e. In
: Man
agem
ent I
nter
natio
nal R
evie
w, 3
9 (S
pec.
Issu
e) 4
1-64
Whi
tting
ton,
W. e
t al (
1999
): C
hang
e an
d C
ompl
emen
tarit
ies i
n th
e N
ew C
ompe
titiv
e La
ndsc
ape:
A E
urop
ean
Pane
l Stu
dy. 1
992-
1996
. In:
Org
anis
atio
n Sc
ienc
e 10
, pp.
583
-600
.


![21st Century[1].Jerald](https://img.pdfslide.us/doc/110x75/552101504a795963718b4a0f/21st-century1jerald.jpg)