Embed Size (px)
Citation preview
The Fair Market Value of Rooftop Solar
1
Edward H. Comer Vice President, General Counsel
and Corporate Secretary Edison Electric Institute
NCSL Legislative Summit August 18, 2014
Minneapolis, Minnesota
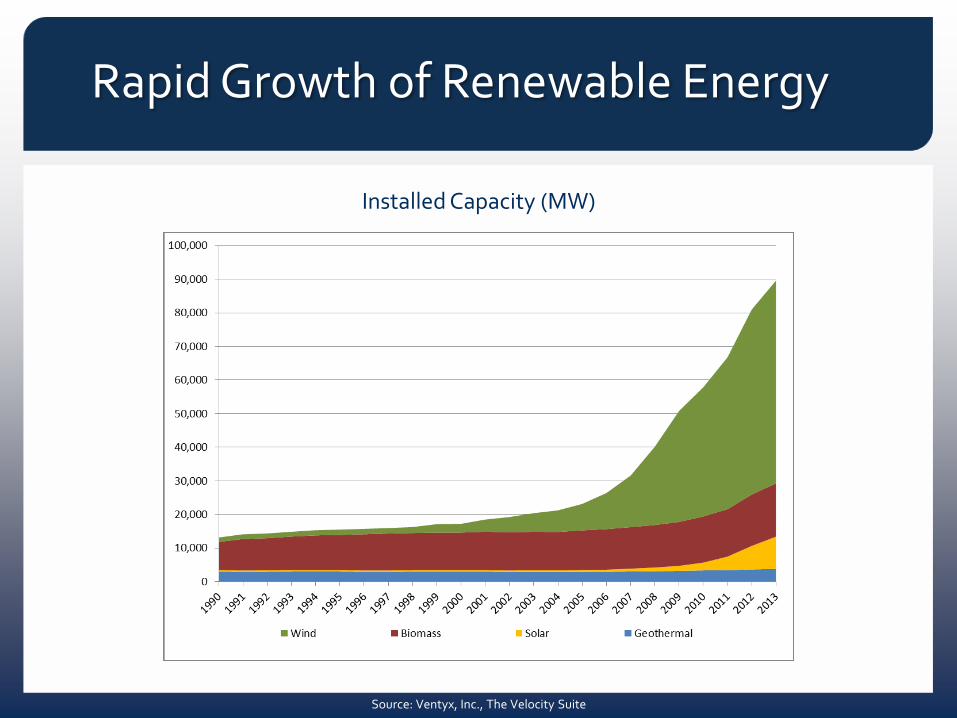
Source: Ventyx, Inc., The Velocity Suite
Installed Capacity (MW)
Rapid Growth of Renewable Energy
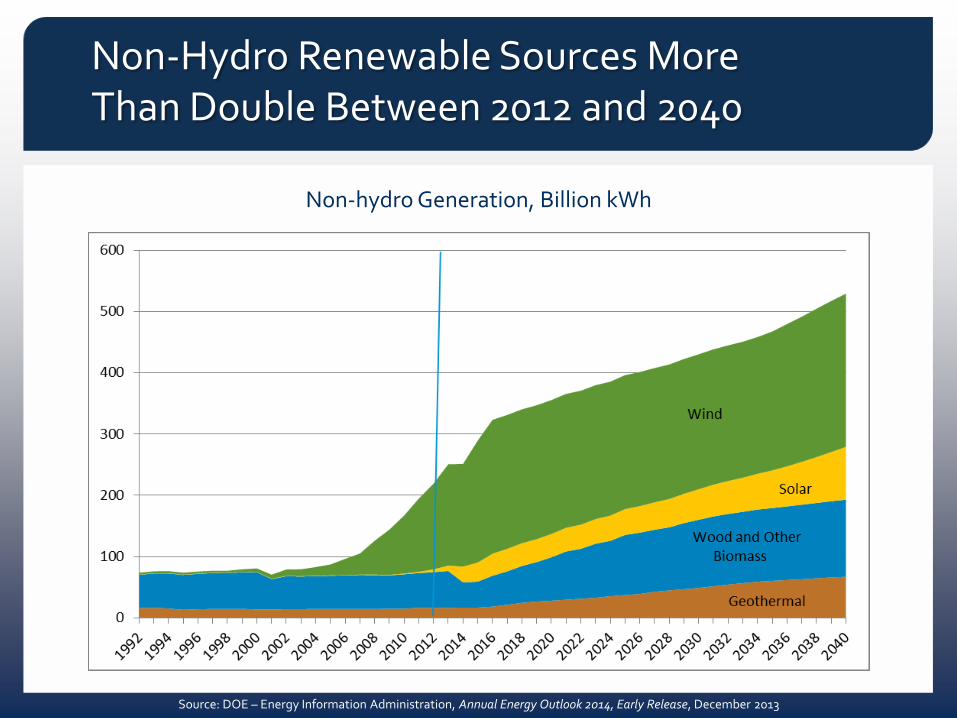
Source: DOE – Energy Information Administration, Annual Energy Outlook 2014, Early Release, December 2013
Non-hydro Generation, Billion kWh
Non-Hydro Renewable Sources More Than Double Between 2012 and 2040
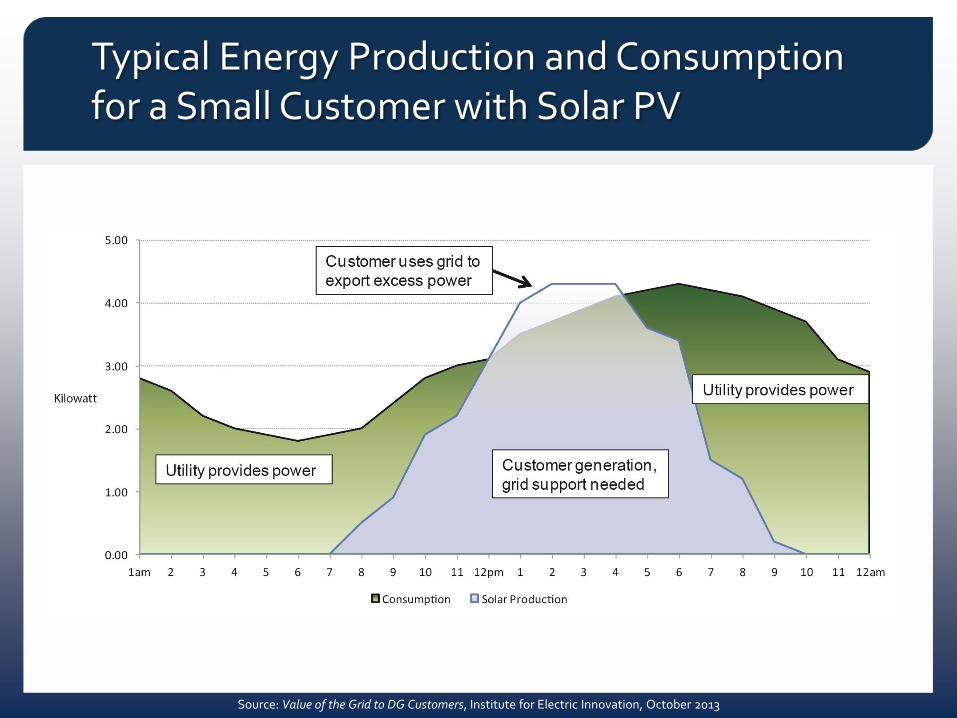
Typical Energy Production and Consumption for a Small Customer with Solar PV
Source: Value of the Grid to DG Customers, Institute for Electric Innovation, October 2013
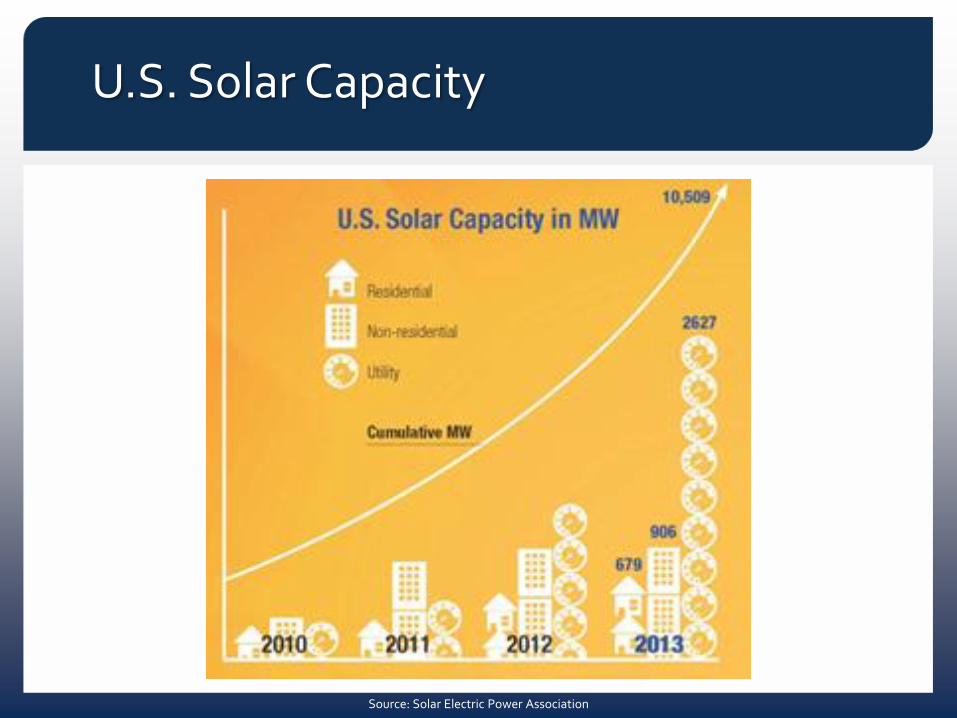
U.S. Solar Capacity
Source: Solar Electric Power Association
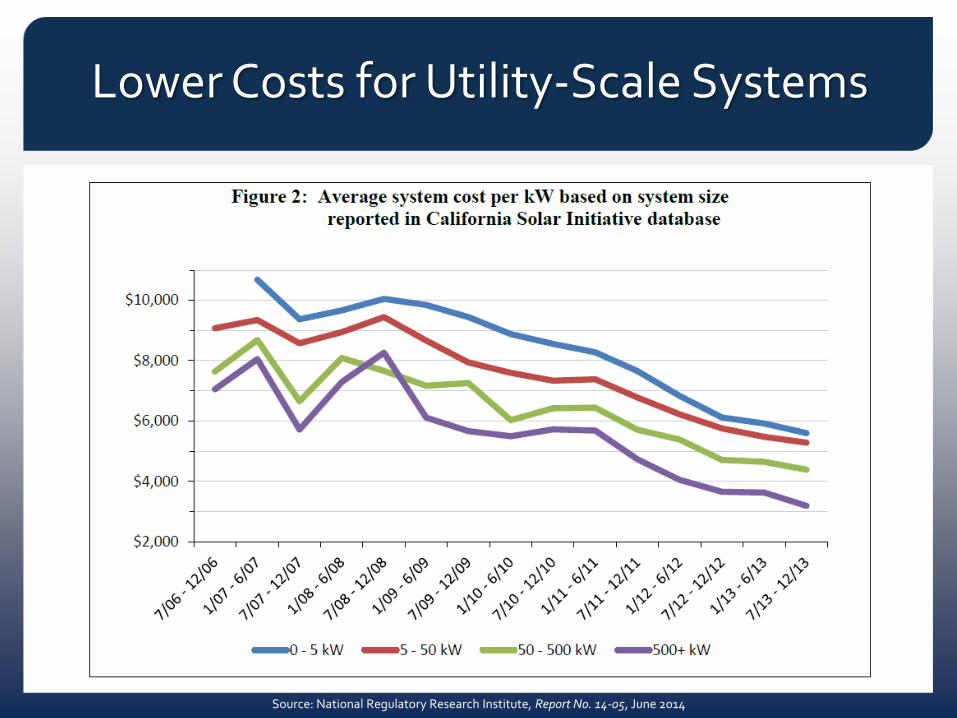
Lower Costs for Utility-Scale Systems
Source: National Regulatory Research Institute, Report No. 14-05, June 2014
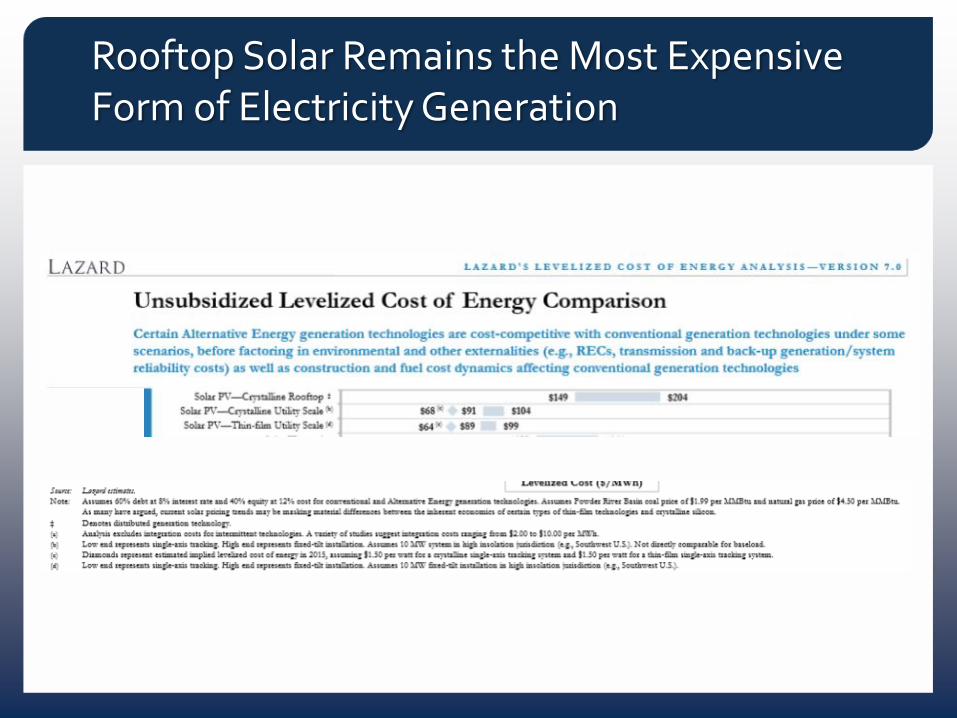
Rooftop Solar Remains the Most Expensive Form of Electricity Generation
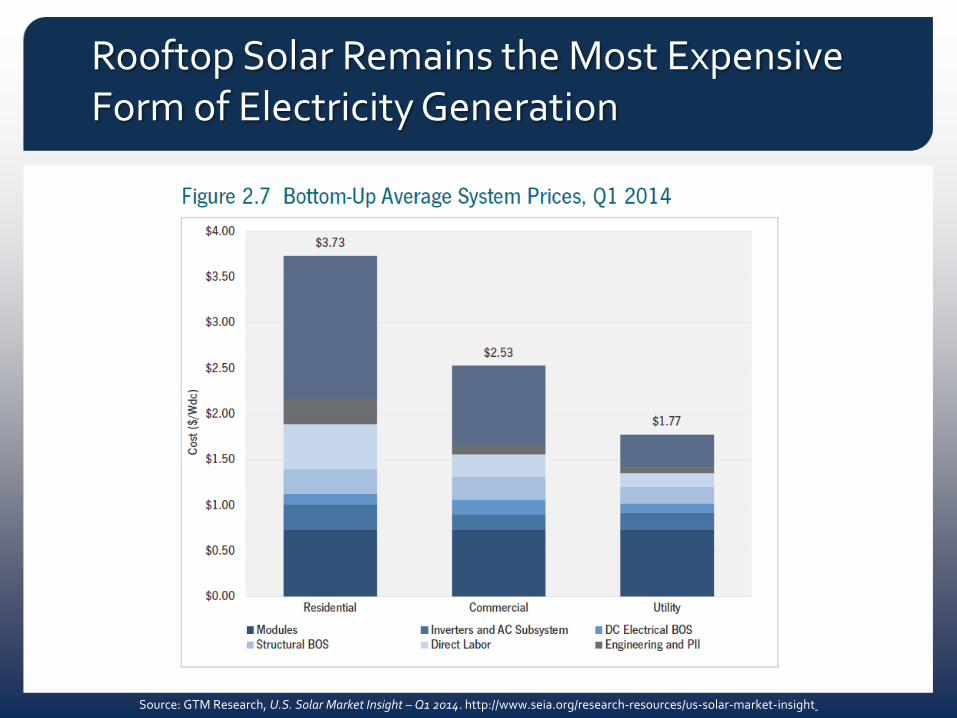
Source: GTM Research, U.S. Solar Market Insight – Q1 2014. http://www.seia.org/research-resources/us-solar-market-insight
Rooftop Solar Remains the Most Expensive Form of Electricity Generation
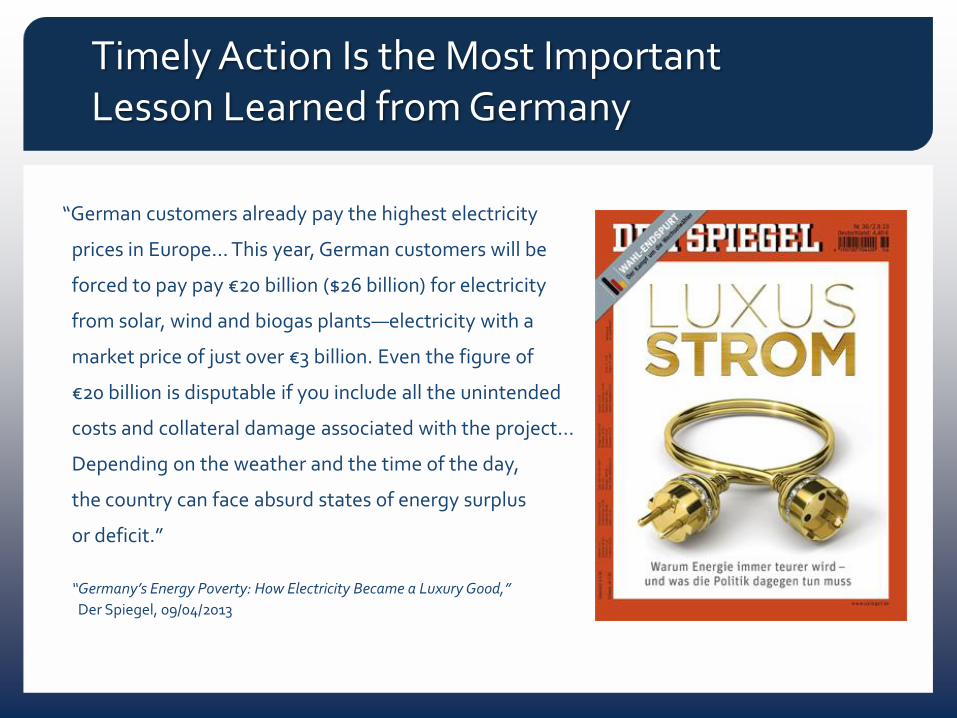
“German customers already pay the highest electricity
prices in Europe… This year, German customers will be
forced to pay pay €20 billion ($26 billion) for electricity
from solar, wind and biogas plants—electricity with a
market price of just over €3 billion. Even the figure of
€20 billion is disputable if you include all the unintended
costs and collateral damage associated with the project…
Depending on the weather and the time of the day,
the country can face absurd states of energy surplus
or deficit.”
“Germany’s Energy Poverty: How Electricity Became a Luxury Good,”
Der Spiegel, 09/04/2013
Timely Action Is the Most Important Lesson Learned from Germany
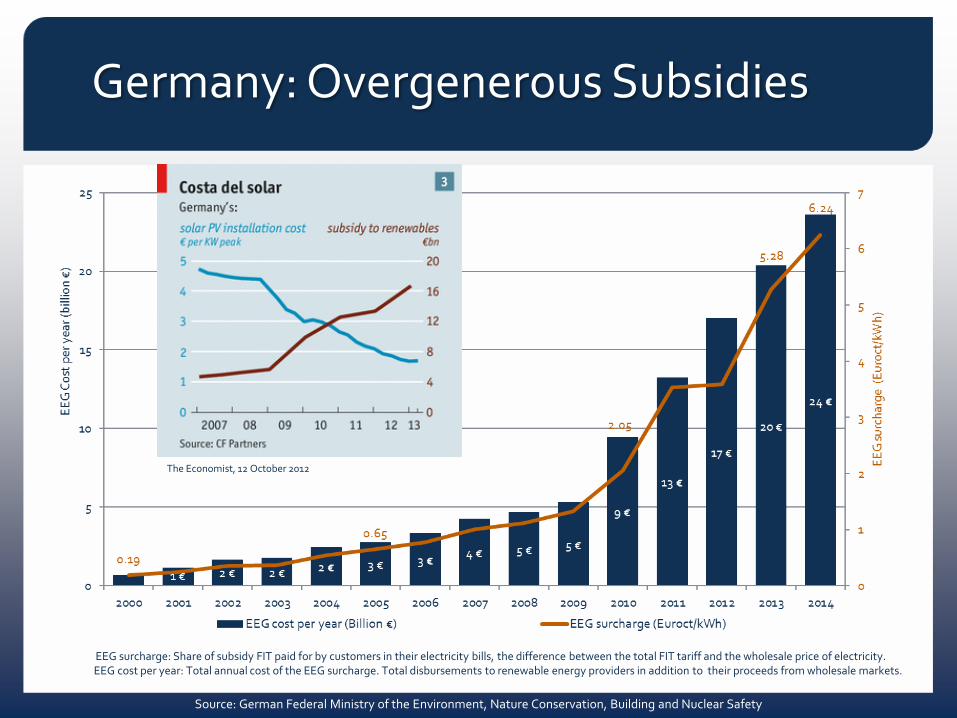
Source: German Federal Ministry of the Environment, Nature Conservation, Building and Nuclear Safety
The Economist, 12 October 2012
EEG surcharge: Share of subsidy FIT paid for by customers in their electricity bills, the difference between the total FIT tariff and the wholesale price of electricity. EEG cost per year: Total annual cost of the EEG surcharge. Total disbursements to renewable energy providers in addition to their proceeds from wholesale markets.
Germany: Overgenerous Subsidies
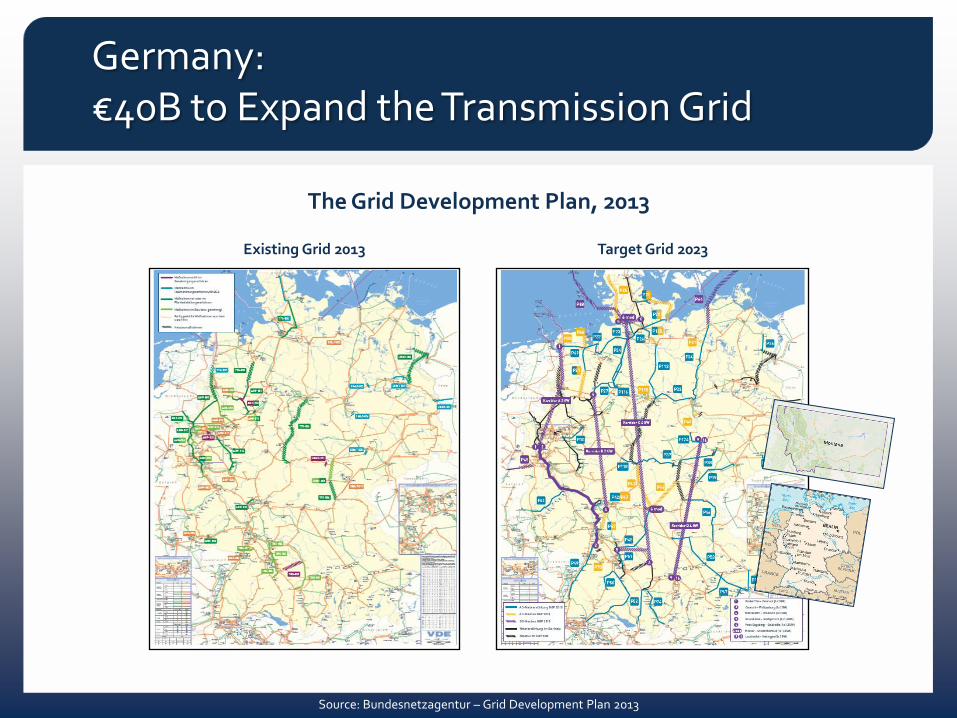
Target Grid 2023
Source: Bundesnetzagentur – Grid Development Plan 2013
The Grid Development Plan, 2013
Existing Grid 2013
Germany: €40B to Expand the Transmission Grid
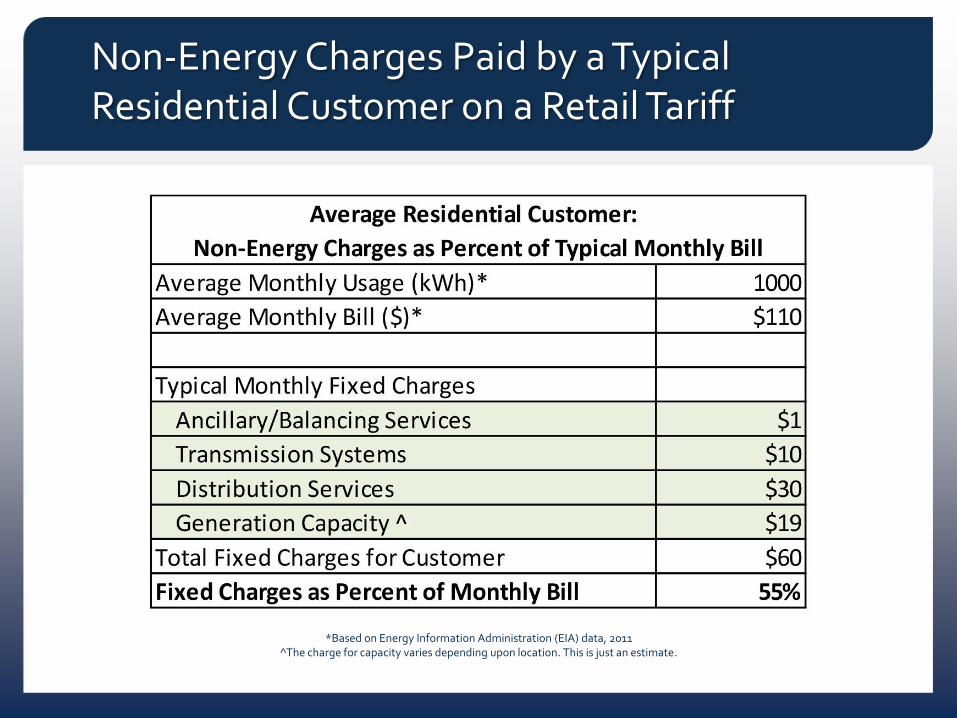
Non-Energy Charges Paid by a Typical Residential Customer on a Retail Tariff
*Based on Energy Information Administration (EIA) data, 2011 ^The charge for capacity varies depending upon location. This is just an estimate.
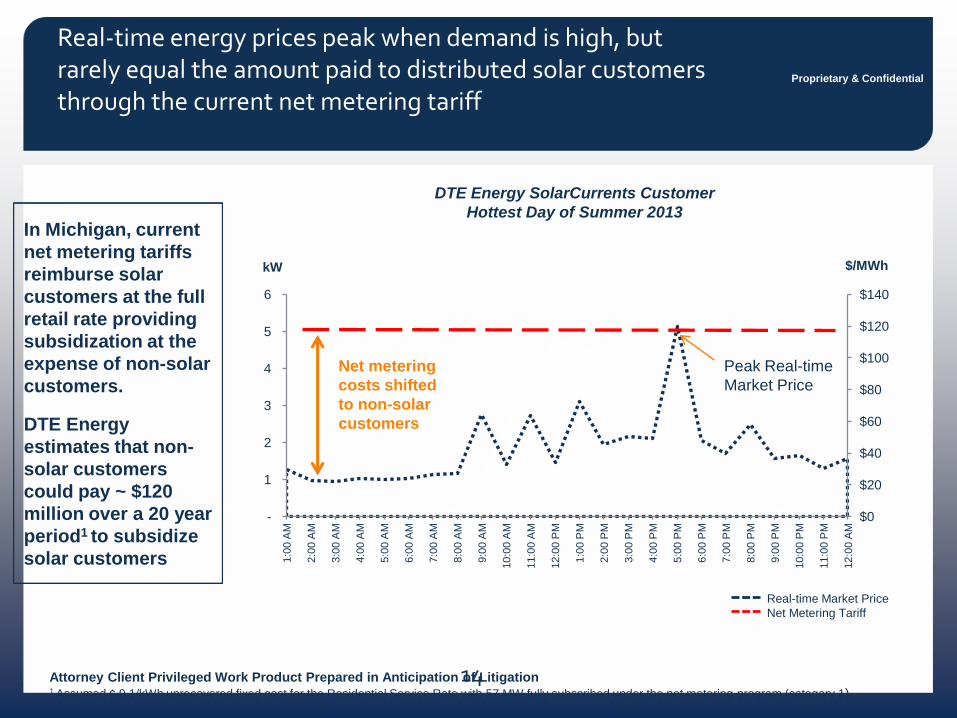
Real-time energy prices peak when demand is high, but rarely equal the amount paid to distributed solar customers through the current net metering tariff
14
Proprietary & Confidential
Attorney Client Privileged Work Product Prepared in Anticipation of Litigation 1 Assumed ¢ 9.1/kWh unrecovered fixed cost for the Residential Service Rate with 57 MW fully subscribed under the net metering program (category 1)
DTE Energy SolarCurrents Customer
Hottest Day of Summer 2013
kW $/MWh
$0
$20
$40
$60
$80
$100
$120
$140
-
1
2
3
4
5
6 1:0
0 A
M
2:0
0 A
M
3:0
0 A
M
4:0
0 A
M
5:0
0 A
M
6:0
0 A
M
7:0
0 A
M
8:0
0 A
M
9:0
0 A
M
10:0
0 A
M
11:0
0 A
M
12:0
0 P
M
1:0
0 P
M
2:0
0 P
M
3:0
0 P
M
4:0
0 P
M
5:0
0 P
M
6:0
0 P
M
7:0
0 P
M
8:0
0 P
M
9:0
0 P
M
10:0
0 P
M
11:0
0 P
M
12:0
0 A
M
Real-time Market Price
Net Metering Tariff
In Michigan, current
net metering tariffs
reimburse solar
customers at the full
retail rate providing
subsidization at the
expense of non-solar
customers.
DTE Energy
estimates that non-
solar customers
could pay ~ $120
million over a 20 year
period1 to subsidize
solar customers
Net metering
costs shifted
to non-solar
customers
Peak Real-time
Market Price
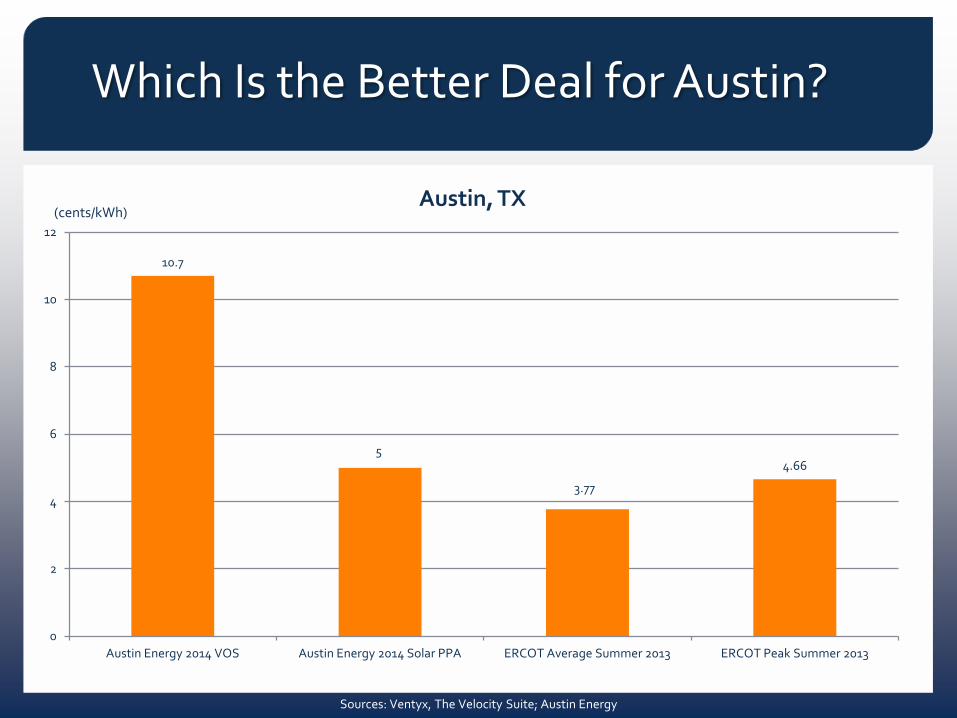
10.7
5
3.77
4.66
0
2
4
6
8
10
12
Austin Energy 2014 VOS Austin Energy 2014 Solar PPA ERCOT Average Summer 2013 ERCOT Peak Summer 2013
(cents/kWh)
Sources: Ventyx, The Velocity Suite; Austin Energy
Which Is the Better Deal for Austin?
Austin, TX
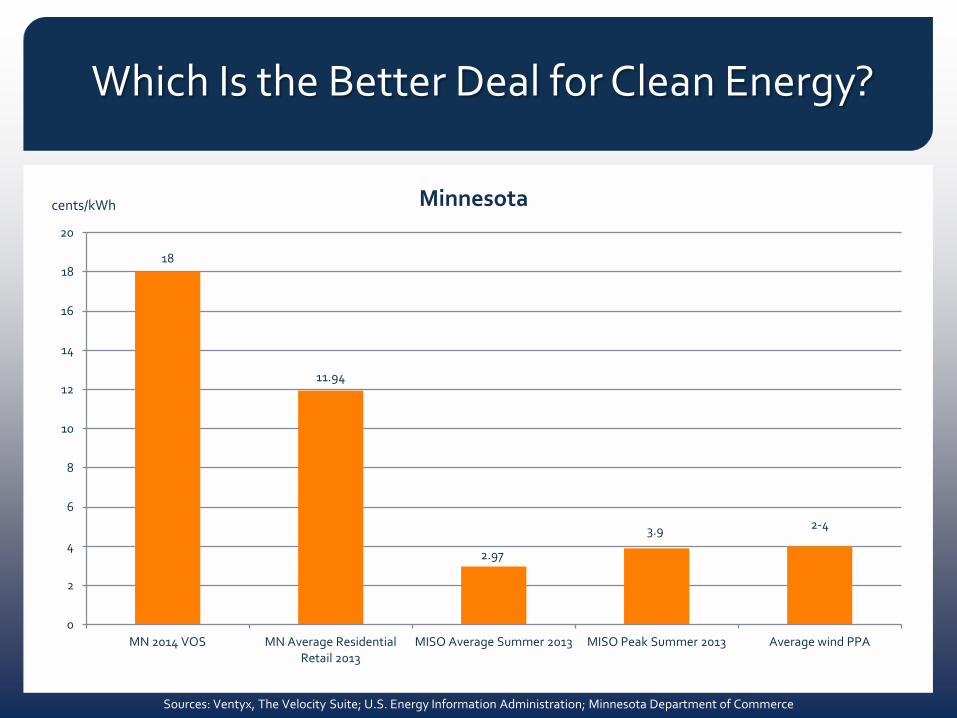
18
11.94
2.97
3.9 2-4
0
2
4
6
8
10
12
14
16
18
20
MN 2014 VOS MN Average Residential Retail 2013
MISO Average Summer 2013 MISO Peak Summer 2013 Average wind PPA
cents/kWh Minnesota
Sources: Ventyx, The Velocity Suite; U.S. Energy Information Administration; Minnesota Department of Commerce
Which Is the Better Deal for Clean Energy?
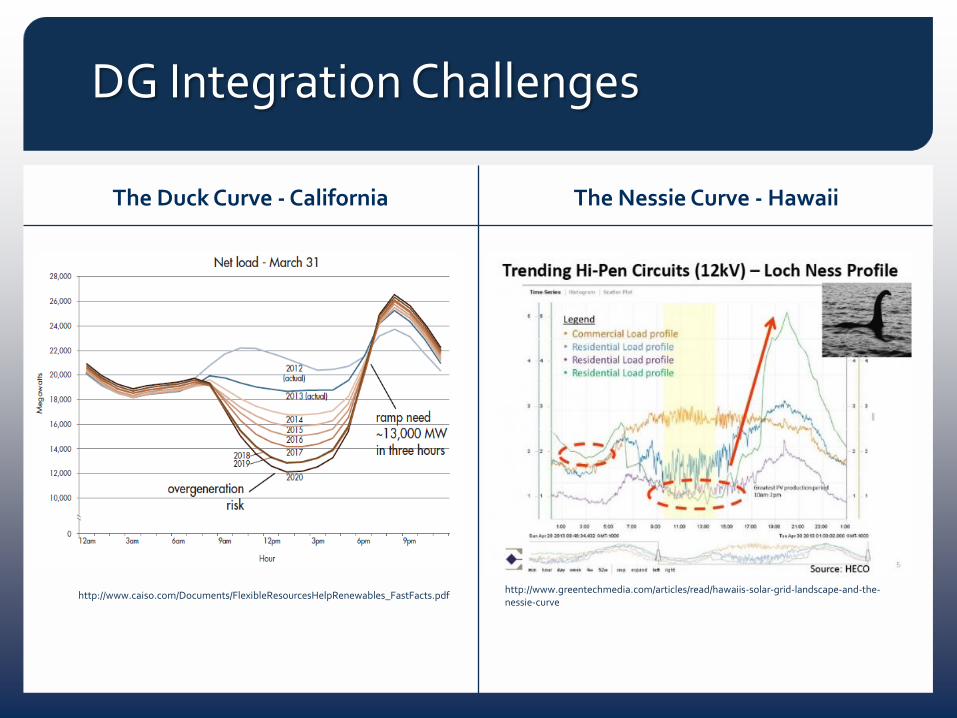
http://www.greentechmedia.com/articles/read/hawaiis-solar-grid-landscape-and-the-nessie-curve
http://www.caiso.com/Documents/FlexibleResourcesHelpRenewables_FastFacts.pdf
The Duck Curve - California The Nessie Curve - Hawaii
DG Integration Challenges
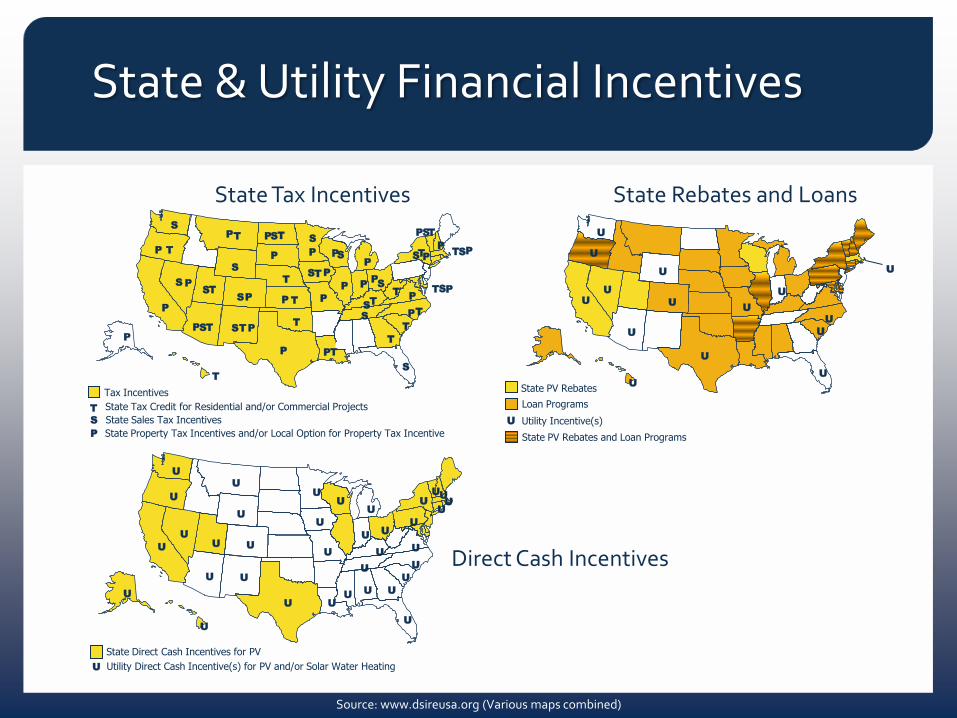
State Tax Incentives
Tax Incentives
State Tax Credit for Residential and/or Commercial Projects
T
T
T
T
T
T T
T T
T
T
T
T
T
T
T
T T
T
T
T
T
State Sales Tax Incentives S
S
S
S
S
S
S S
S
S
S
S
S
S
S
S
S
S
S
S
State Property Tax Incentives and/or Local Option for Property Tax Incentive P
P
P
P
P P
P
P
P
P P
P
P
P
P
P
P
P
P
P
P P
P
P
P
P P
P
P
Source: www.dsireusa.org (Various maps combined)
State Rebates and Loans
Loan Programs
Utility Incentive(s) U
U
U
U
U
U
U
U U
U
U
U
U
U
U
U
State PV Rebates
State PV Rebates and Loan Programs
State Direct Cash Incentives for PV
U
U
U
U
U
U
U
U
U
U
U
U
U U U
U U U
U U
U U
U
U
U
U U
Utility Direct Cash Incentive(s) for PV and/or Solar Water Heating U
U
U
U U
U
U
U U
U
Direct Cash Incentives
State & Utility Financial Incentives
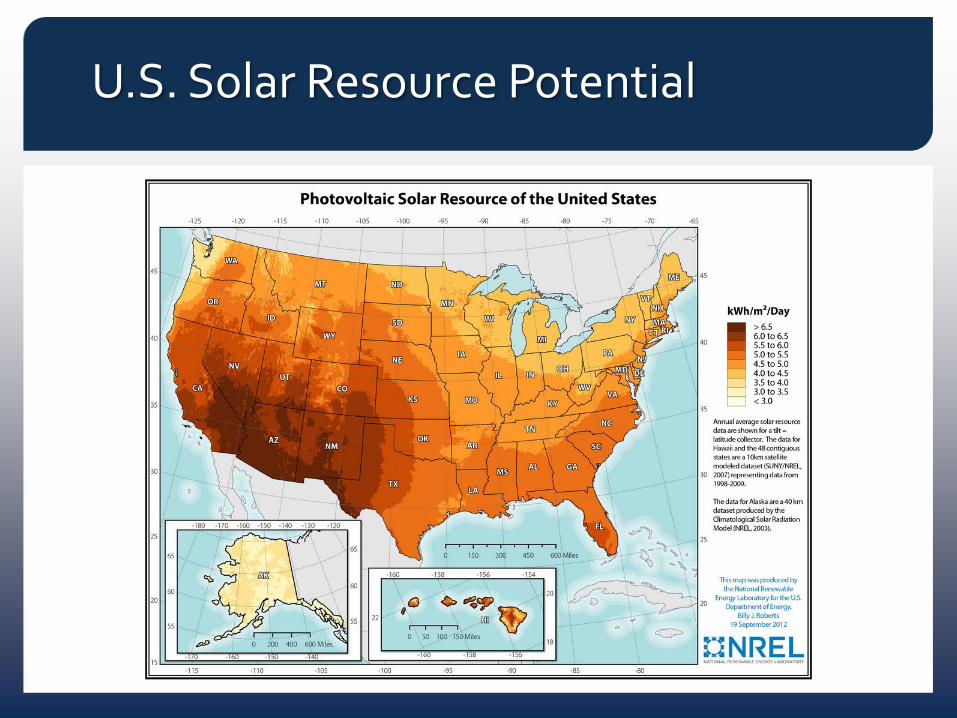
U.S. Solar Resource Potential
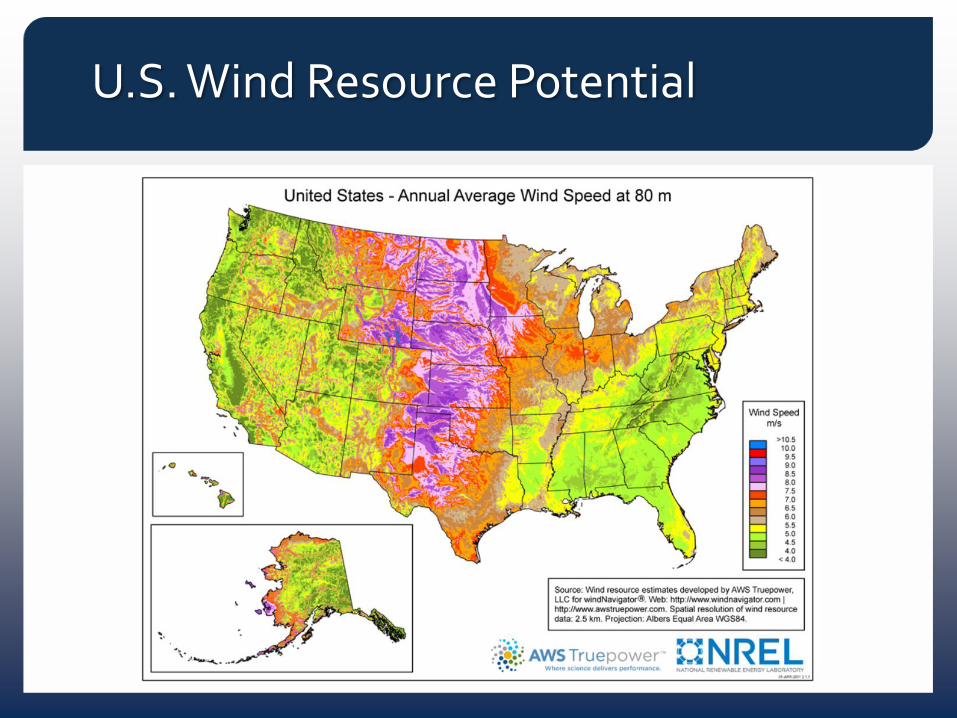
U.S. Wind Resource Potential
Key Takeaways
Promote clean energy as part of our diverse fuel mix in a way that achieves low costs, maintains the reliability of the system, and is fair and equitable to all stakeholders.
Focus on those clean energy resources that are most available in your state and most cost effective for your constituents.
Keep rates low.
Larger clean energy sources are cheaper.
Provide utility commissions with goals, but let them use their expertise to integrate renewable energy at the lowest cost for your constituents.
Be cautious of subsidies that are hidden and hard to undo.