Embed Size (px)
Citation preview

1
The factors affecting airspace capacity in Europe: A Framework Methodology based on Cross Sectional Time-Series Analysis using
Simulated Controller Workload Data
Arnab Majumdar and Washington Y. Ochieng �
Centre for Transport Studies Dept. of Civil & Environmental Engineering, Imperial College London
Email: [email protected] [email protected]
Gerard McAuley, Jean Michel Lenzi and Catalin Lepadatu
EUROCONTROL DAS/AFN Division, Brussels, Belgium Email: [email protected]
[email protected] [email protected]
Air traffic in Europe is increasing at a rapid rate and traffic patterns no longer display
pronounced daily peaks but instead exhibit peak spreading. Airspace capacity planning can no
longer be for the peak period but must consider the whole day. En-route airspace capacity in
the high density European air traffic network is determined by controller workload. Controller
workload is primarily affected by the features of the air traffic and ATC sector and capacity is
usually estimated using the simulation model, the Re-organized ATC Mathematical Simulator
(RAMS) model of air traffic controller workload. This paper considers the air traffic and ATC
sector factors that affect controller workload throughout the whole day and provides a
framework using cross-sectional time-series analysis of the RAMS simulation output. Two
simulation studies are presented in contrasting regions of European airspace to show the
robustness of the method. Controller interviews are used to enhance the analysis. The results
indicate that a sub-set of traffic and sector variables and their parameter estimates can be used
to predict controller workload in any sector of the two regions simulated in any given hour.
KEY WORDS
1. Air Traffic Control 2. Workload 3. Capacity 4.Cross-section time-series
2
1. INTRODUCTION The rapid rise in European air traffic has highlighted the role of ATC and of controllers in the
European aviation system. For example, in the period between 1985 and 1990, air traffic in
Europe increased by 7.1% annually (EUROCONTROL, 1991). A major implication of this air
traffic growth has been the rise in flight delays in Europe. For example, over a period of four
years, the number of flights in Europe delayed by at least 15 minutes almost doubled (ECAC,
1998). The economic impact of delays, as well as other inefficiencies in the ATC system (e.g.
non-optimal flight profiles), was calculated to cost Europe US $5 billion annually (European
Commission, 2003). The main cause of these inefficiencies has been the lack of a single,
integrated ATC system throughout Europe. The European Commission has planned reform of
the European air traffic control system with the aim of creating a “single European sky”
(European Commission, 2003). Such moves should lead to a consolidation of air traffic
management providers, and eventually reduce the number of centres controlling flights across
Europe from the current 49 to perhaps four or five.
Since the late 1980s there have been various efforts led by the European Organisation for the
Safety of Air Navigation (EUROCONTROL)1, to develop initiatives to tackle the en-route
airspace capacity. To cope with the predicted air traffic demands, the current European Air
Traffic Management Programme (EATMP) envisages a "gate-to-gate" concept, in which
flights are treated as a continuum, from the first interaction with ATM until post-flight
activities (EUROCONTROL, 1998). To achieve this, a broad range of procedures and
technologies are considered which has the potential to change the way in which controllers
work in the future ATC system of Europe.
In the European air transport network, the primary constraint at the busiest airports, e.g.
London Heathrow, is the lack of runway capacity. However, for airports that are not runway
constrained, the en-route airspace capacity provides a major constraint. Within the gate-to-
gate concept of EATMP, any initiatives to increase current en-route airspace capacity, as well
as those considering future capacity scenarios, needs a reliable definition and measure of
airspace capacity. The problem here is that in the dense European air traffic environment, en-
route airspace capacity depends not only upon spatial-geometrical separation criteria, but also
on the workload of air traffic controllers (Arthur D. Little, 2000). There is then a need to
understand controller workload and the factors that drive it. This analysis attempts to better
analyse en-route airspace capacity, as opposed to other components of gate-to-gate capacity.
1 EUROCONTROL is the pan-European organisation established in 1960 to co-ordinate European air traffic control and air traffic management (ATC/ATM).
3
In addition, air traffic patterns in Europe no longer display pronounced daily peaks. There
appears to be a peak spreading throughout the day making planning approaches based on
daily peaks inappropriate. Instead, to improve airspace capacity planning, it is important to
understand the factors that affect controller workload, and their impact throughout the day.
This paper provides a method to assess the impact of these factors on controller workload
throughout the day, known as cross-sectional time series analysis. This analysis should help to
develop a reliable functional relationship between air traffic controller workload and the
various factors that affect it. The research presented in this paper uses a realistic simulation
model of air traffic controller’s workload to do this.
Section 2 of the paper provides a brief explanation of the European airspace capacity
estimation problem, emphasising the critical role of the air traffic controller workload.
Section 3 examines the factors that affect controller workload and airspace capacity. Section 4
discusses the issues to be considered in a simulation exercise involving air traffic controller
workload, whilst Section 5 outlines the Re-organized ATC Mathematical Simulator (RAMS)
(EUROCONTROL; 1996a, 1996b) to be used in a series of simulation experiments. The
methodology of cross-sectional time series analysis, also known as panel data analysis, is
discussed in Section 6. Sections 7 and 8 outline the main features of two contrasting
simulation scenarios that are analysed by cross-sectional time-series to show the robustness of
the method. A particular feature of the analysis described in Section 8 is the use of controller
interviews to enhance the cross-sectional time-series analysis. The paper is concluded in
Section 9.
2. EUROPEAN AIRSPACE CAPACITY ESTIMATION.
Experience in Europe suggests that en-route airspace capacity e.g. that of an ATC sector, is
determined by air traffic controller workload i.e. the mental and physical work done by the
controller to control traffic (Majumdar and Polak, 2001). This is in addition to spatial-
geometric and temporal criteria based upon the performance characteristics of the aircraft in
the sector (EUROCONTROL, 1991).
The capacity of an ATC sector can therefore be defined as the maximum number of aircraft
that are controlled in a particular ATC sector in a specified period, while still permitting an
acceptable level of controller workload. Such a definition requires three criteria to be
determined:
• the definition controller workload;
4
• a method for measuring controller workload; and
• quantification of an acceptable level of controller workload, i.e. the threshold value at full
capacity.
Controller workload is a confusing term with a multitude of definitions, models and measures
in the literature (Jorna, 1991). The practice in en-route airspace capacity estimation in Europe
is to use simulation modelling of controller workload where the workload is given by task-
time definitions obtained from a detailed non-intrusive objective record of the controller’s
actions by an independent observer (EUROCONTROL, 1996). Such records are supported by
controller verification of the tasks and their timings, especially for those tasks that involve a
significant mental component. Based upon these task-time definitions, threshold controller
loadings are defined for the number of minutes/ hour that controllers are occupied in their
tasks as recorded by the models, e.g. RAMS, described in more detail in Section 5.
(EUROCONTROL 1999). The capacity of an en-route ATC sector, is then defined as the
maximum number of aircraft controlled in a sector per hour given this threshold controller
loading.
3 AIRSPACE CAPACITY DRIVERS
Research indicates that the workload experienced by air traffic controllers, however it is
defined and measured, is affected by the complex interaction of (Mogford et. al 1995):
a) the situation in the airspace - i.e. by features of both the air traffic and the sector;
b) the state of the equipment - i.e. by the design, reliability and accuracy of equipment in the
control room and in the aircraft; and
c) the state of the controller, e.g. the controller’s age, experience, decision making strategies.
These parameters can be thought of as the drivers of controller workload, and consequently of
en-route airspace capacity, i.e. airspace capacity drivers. Thus the effect of these parameters
on controller workload must be understood if realistic and successful strategies for increasing
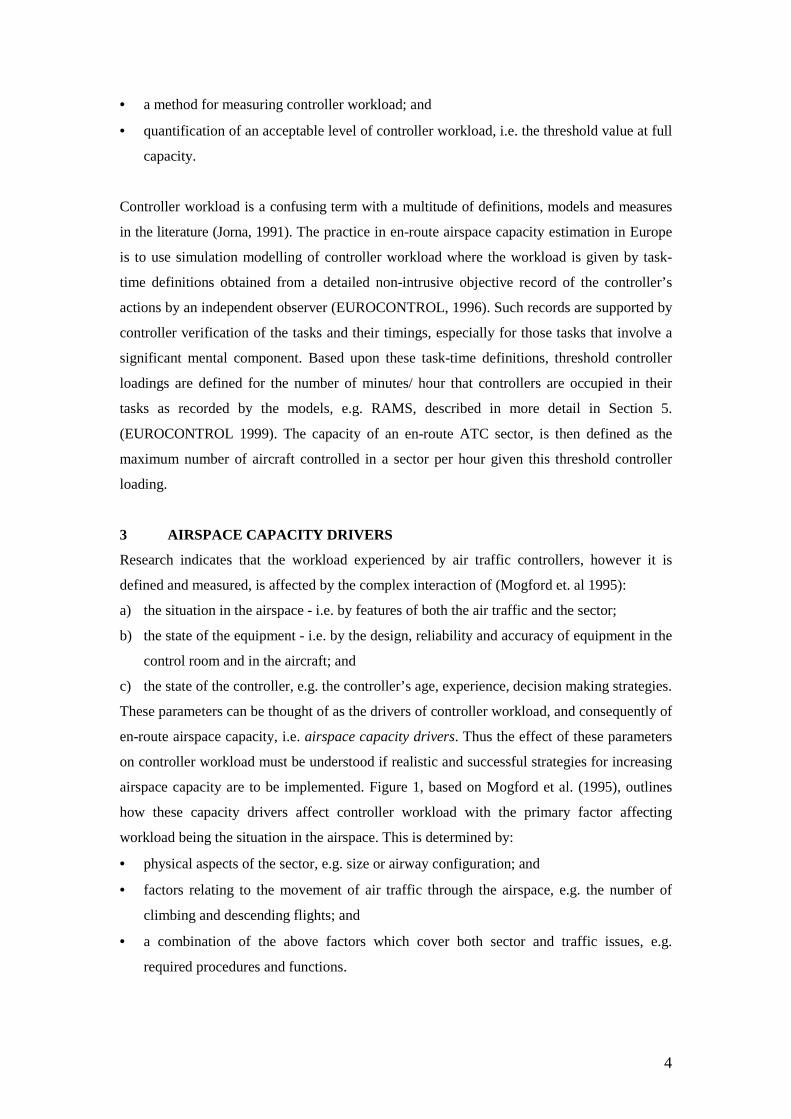
airspace capacity are to be implemented. Figure 1, based on Mogford et al. (1995), outlines
how these capacity drivers affect controller workload with the primary factor affecting
workload being the situation in the airspace. This is determined by:
• physical aspects of the sector, e.g. size or airway configuration; and
• factors relating to the movement of air traffic through the airspace, e.g. the number of
climbing and descending flights; and
• a combination of the above factors which cover both sector and traffic issues, e.g.
required procedures and functions.
5
This interaction between sector and traffic features can be thought of as ATC complexity, and
it is this that generates workload for the controller.
CONTROLLER WORKLOAD
RESULT MEDIATING FACTORS
QUALITY OF EQUIPMENT
INDIVIDUAL DIFFERENCESs
CONTROLLER COGNITIVE STRATEGIES
SOURCE FACTORS
ATC COMPLEXITY: AIR TRAFFIC
PATTERN AND SECTOR
CHARACTERISTICS
FIGURE 1: FACTORS AFFECTING CONTROLLER WORKLOAD Source : Mogford et al. (1995), page 5
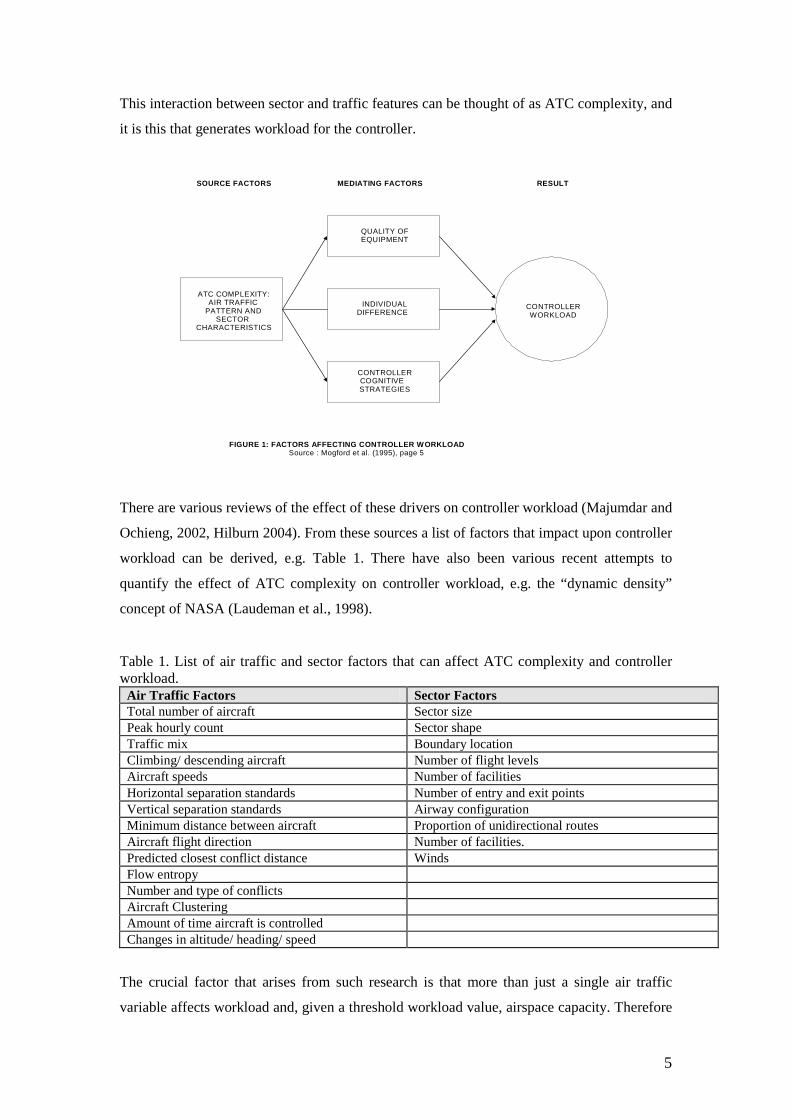
There are various reviews of the effect of these drivers on controller workload (Majumdar and
Ochieng, 2002, Hilburn 2004). From these sources a list of factors that impact upon controller
workload can be derived, e.g. Table 1. There have also been various recent attempts to
quantify the effect of ATC complexity on controller workload, e.g. the “dynamic density”
concept of NASA (Laudeman et al., 1998).
Table 1. List of air traffic and sector factors that can affect ATC complexity and controller workload.
Air Traffic Factors Sector Factors Total number of aircraft Sector size Peak hourly count Sector shape Traffic mix Boundary location Climbing/ descending aircraft Number of flight levels Aircraft speeds Number of facilities Horizontal separation standards Number of entry and exit points Vertical separation standards Airway configuration Minimum distance between aircraft Proportion of unidirectional routes Aircraft flight direction Number of facilities. Predicted closest conflict distance Winds Flow entropy Number and type of conflicts Aircraft Clustering Amount of time aircraft is controlled Changes in altitude/ heading/ speed
The crucial factor that arises from such research is that more than just a single air traffic
variable affects workload and, given a threshold workload value, airspace capacity. Therefore

6
estimating airspace capacity based upon the relationship between controller workload and
single air traffic variable, i.e. the number of aircraft entering the sector in given period
(outlined in EUROCONTROL, 1996), is not totally adequate.
Previous studies by Majumdar and Polak (2001), and Majumdar and Ochieng (2002)
considered just the peak workload hour of the simulation. Subsequently, Majumdar et al.
(2004) went further by considering the drivers that affect controller workload in a region of
European airspace throughout the day. This should help ATC/ATM planners and managers in
their task by enabling them to estimate accurately the controller workload throughout the day
based upon a particular set of drivers in any given sector at any given time of day. Their
initial results indicated promise in the method.
The following section outlines the considerations of this simulation modelling approach.
4. SIMULATION MODELLING OF EUROPEAN EN-ROUTE AIRSPACE
Wickens et al. (1997), Magill (1998) and Majumdar and Polak (2001) note the importance of
and advantages in the use of simulation modelling in ATC capacity estimation. Three
questions need to be answered in order to make effective use of simulation modelling:
• How will the work done by the ATC system be characterised by the simulation model?
• How well does the simulation model used represent the reality of the ATC system?
• what rules for the elements of the simulation model need to be encompassed for the
simulation scenarios in order to generate the appropriate output for analysis?
The task time thresholds mentioned in Section 2 for various air traffic controller workload
simulation models deals with the first of these questions. These thresholds have been
validated by several real-time studies and the experience gained from previous simulation
results, as well as from field studies (e.g. EUROCONTROL 1999).
As a priority, it is important to ensure that the simulation model chosen realistically reflects
the “real world” airspace environment under consideration. Furthermore, it should be
calibrated to give reasonable estimates of workload. The following section outlines the
features of the simulation model used this study to encompass these questions.
5. THE REORGANIZED ATC MATHEMATICAL SIMULATOR (RAMS)
The Re-Organized ATC mathematical Simulator (RAMS) (EUROCONTROL 1995, chosen
for the research presented in this paper, is a discrete-event simulation model of air traffic
7
controller workload. Whilst there are other controller workload simulation models, RAMS
together with its predecessor the European Airspace Model, has been used widely for 25 years
in Europe for airspace planning. The model has been verified by controllers
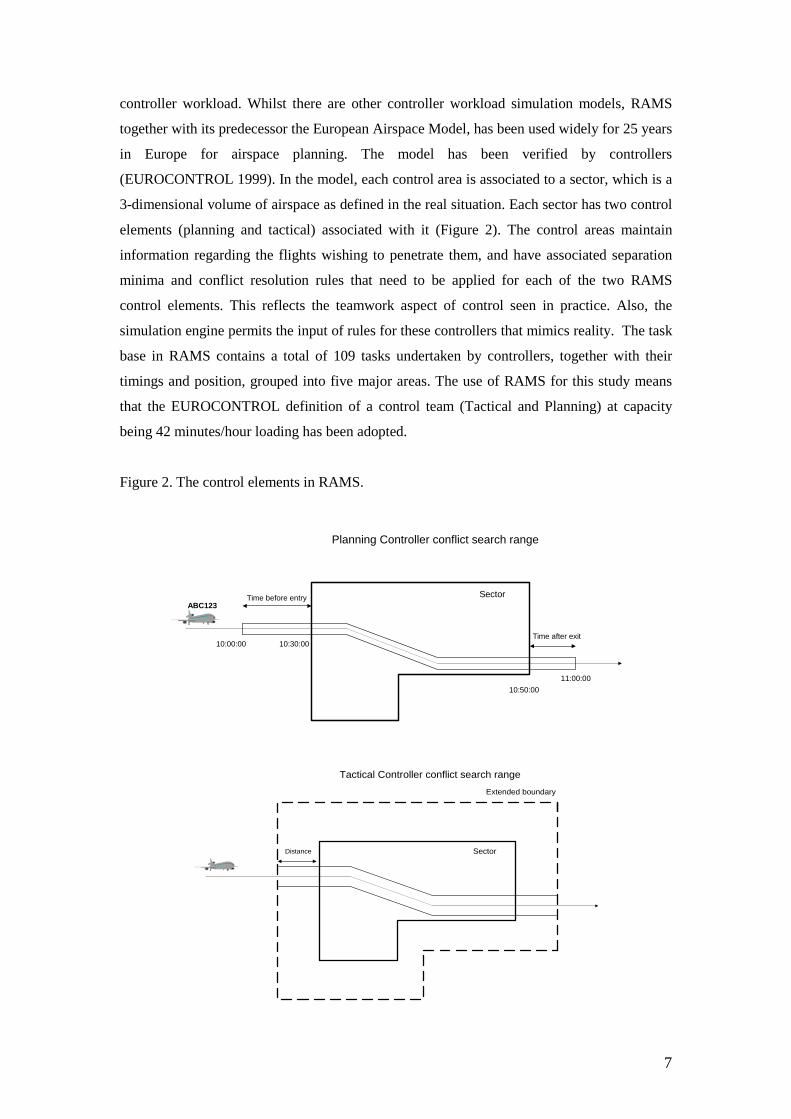
(EUROCONTROL 1999). In the model, each control area is associated to a sector, which is a
3-dimensional volume of airspace as defined in the real situation. Each sector has two control
elements (planning and tactical) associated with it (Figure 2). The control areas maintain
information regarding the flights wishing to penetrate them, and have associated separation
minima and conflict resolution rules that need to be applied for each of the two RAMS
control elements. This reflects the teamwork aspect of control seen in practice. Also, the
simulation engine permits the input of rules for these controllers that mimics reality. The task
base in RAMS contains a total of 109 tasks undertaken by controllers, together with their
timings and position, grouped into five major areas. The use of RAMS for this study means
that the EUROCONTROL definition of a control team (Tactical and Planning) at capacity
being 42 minutes/hour loading has been adopted.
Figure 2. The control elements in RAMS.
ABC123Time before entry
Time after exit
Planning Controller conflict search range
Sector
10:00:00 10:30:00
10:50:00
11:00:00
Extended boundary
Tactical Controller conflict search range
SectorDistance
8
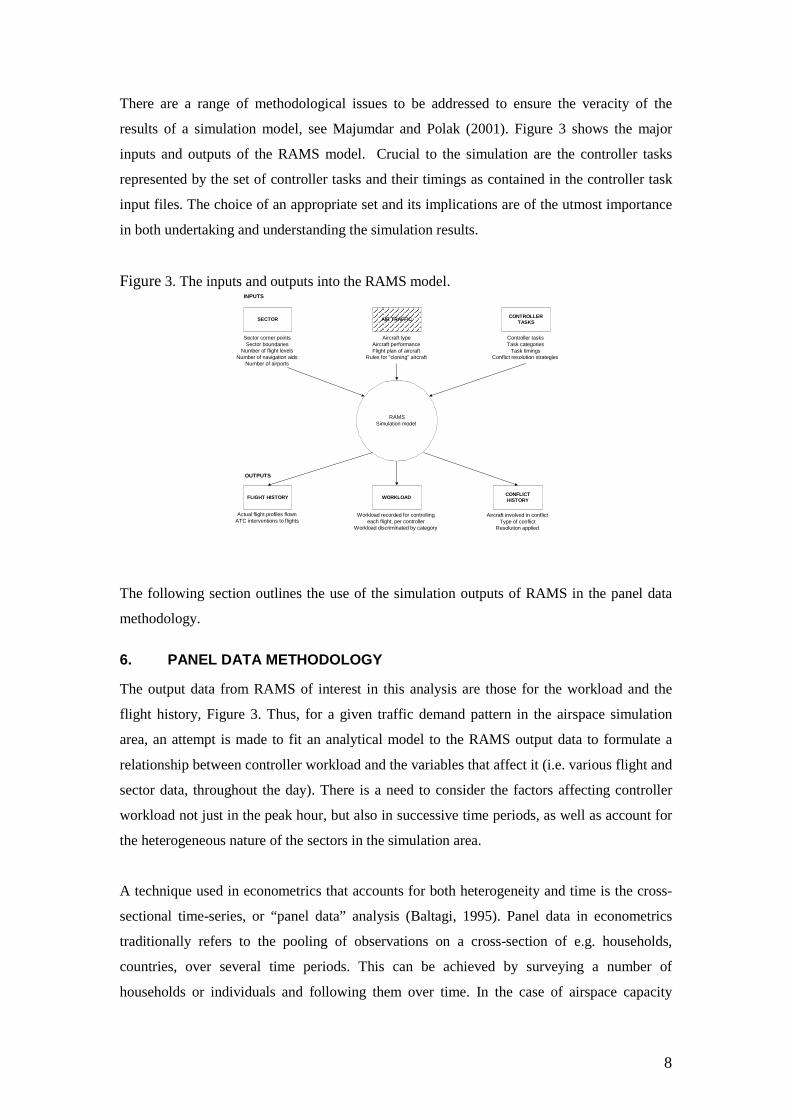
There are a range of methodological issues to be addressed to ensure the veracity of the
results of a simulation model, see Majumdar and Polak (2001). Figure 3 shows the major
inputs and outputs of the RAMS model. Crucial to the simulation are the controller tasks
represented by the set of controller tasks and their timings as contained in the controller task
input files. The choice of an appropriate set and its implications are of the utmost importance
in both undertaking and understanding the simulation results.
Figure 3. The inputs and outputs into the RAMS model.
SECTOR
Sector corner pointsSector boundaries
Number of flight levelsNumber of navigation aids
Number of airports
AIR TRAFFIC
Aircraft typeAircraft performanceFlight plan of aircraft
Rules for "cloning" aircraft
CONTROLLERTASKS
Controller tasksTask categories
Task timingsConflict resolution strategies
INPUTS
OUTPUTS
RAMSSimulation model
FLIGHT HISTORYCONFLICTHISTORYWORKLOAD
Actual flight profiles flownATC interventions to flights
Aircraft involved in conflictType of conflict
Resolution applied
Workload recorded for controllingeach flight, per controller
Workload discriminated by category
The following section outlines the use of the simulation outputs of RAMS in the panel data
methodology.
6. PANEL DATA METHODOLOGY
The output data from RAMS of interest in this analysis are those for the workload and the
flight history, Figure 3. Thus, for a given traffic demand pattern in the airspace simulation
area, an attempt is made to fit an analytical model to the RAMS output data to formulate a
relationship between controller workload and the variables that affect it (i.e. various flight and
sector data, throughout the day). There is a need to consider the factors affecting controller
workload not just in the peak hour, but also in successive time periods, as well as account for
the heterogeneous nature of the sectors in the simulation area.
A technique used in econometrics that accounts for both heterogeneity and time is the cross-
sectional time-series, or “panel data” analysis (Baltagi, 1995). Panel data in econometrics
traditionally refers to the pooling of observations on a cross-section of e.g. households,
countries, over several time periods. This can be achieved by surveying a number of
households or individuals and following them over time. In the case of airspace capacity
9
analysis, panel data refers to the pooling of observations on a cross-section of ATC sectors
over several periods of time, e.g. one hour intervals.
The major benefits of using panel data are outlined in (Baltagi 1995):
• Controlling for individual heterogeneity. Panel data analysis assumes that individuals,
countries and in the case of airspace research, ATC sectors, are heterogeneous. Time-
series and cross-section studies, which do not control for this heterogeneity, run the risk
of obtaining biased results.
• Provision of more informative data, more variability, less collinearity among the
variables, more degrees of freedom and more efficiency.
• The data are better suited to study the dynamics of adjustment.
• The data are better suited to the identification and measurement of effects that are simply
not detectable in pure cross-sections or pure time-series data.
• The data are usually gathered on micro units, such as individuals, or in the case of
capacity analysis, ATC sectors. Many variables can be more accurately measured at a
micro level, and biases resulting from aggregation over firms or individuals are
eliminated.
The RAMS simulation output data can be analyzed using a fixed effects time-series cross-
sectional model. The data is at the sector-level and the inclusion of fixed effects allows for
the control of other factors that might have influenced controller workload for which data is
unobservable (Verbeek, 2001). For example, this could include specific ATC procedures that
may have been implemented in some ATC sectors. These methods are simple to implement
and consist of ordinary least squares (OLS) regression with a dummy variable included for
each cross-section, in this case the sector. The OLS estimators have optimal properties when
the Gauss-Markov conditions are met. This means that the estimators are unbiased, linear and
have the minimum variance of any class of linear, unbiased estimators, i.e. they are “best”.
For the standard fixed effects model:
ititiit xy εβα +′+= (2)
the error term itε is assumed to be independent and identically distributed over individuals i
(i.e. the ATC sectors) and time, with zero mean and variance 2εσ (Verbeek, 2001). The
workload in sector i in time t is ity and �
represents the coefficients.
itx is a K-dimensional vector of explanatory variables, not including a constant. This means
that the effects of change in x are the same for all units and all periods, but that the average
10
level for unit i may be different from that unit j. iα thus capture the effects of those variables
that are peculiar to the i-th individual and that are constant over time. iα are treated as N fixed
unknown parameters.
After fitting a model, there is then a need for diagnostic testing to ensure the appropriate
model has been selected. In particular there is a need to consider the potential temporal
autocorrelation (or serial correlation) in the data undertaking the Bhargava et al.(1982) test
and then correcting with a first-order autoregressive process AR(1).
Based upon the above, a panel data (i.e. cross-sectional time-series) analysis on the basis of
the output of a RAMS simulation seems an appropriate method for estimating the functional
relationship between controller workload and its drivers i.e. a number of possible explanatory
variables, itx , outlined in Table 2.
Table 2. List of independent variables obtained from the RAMS output.
The strategy used to attempt to formulate a functional relationship between controller
workload and appropriate air traffic and sector variables is outlined in Figure 4.
Air Traffic Factors Airspace geometry Factors Total number of aircraft Sector shape Number of aircraft in continuous cruise profile Number of flight levels available Number of aircraft in cruise-descend profile Number of navaids Number of aircraft in cruise-climb profile Number of airports Number of aircraft in climb-climb profile Number of neighbouring sectors from which
aircraft enter Number of aircraft in descend-climb profile Number of neighbouring sectors to which aircraft
exit Number of aircraft in descend-descend profile Number of aircraft entering sector in cruise Number of aircraft entering sector in climb Number of aircraft entering sector in descend Number of aircraft exiting sector in cruise Number of aircraft exiting sector in climb Number of aircraft exiting sector in descend Average flight duration in sector Total flight time in sector Aircraft speeds
11
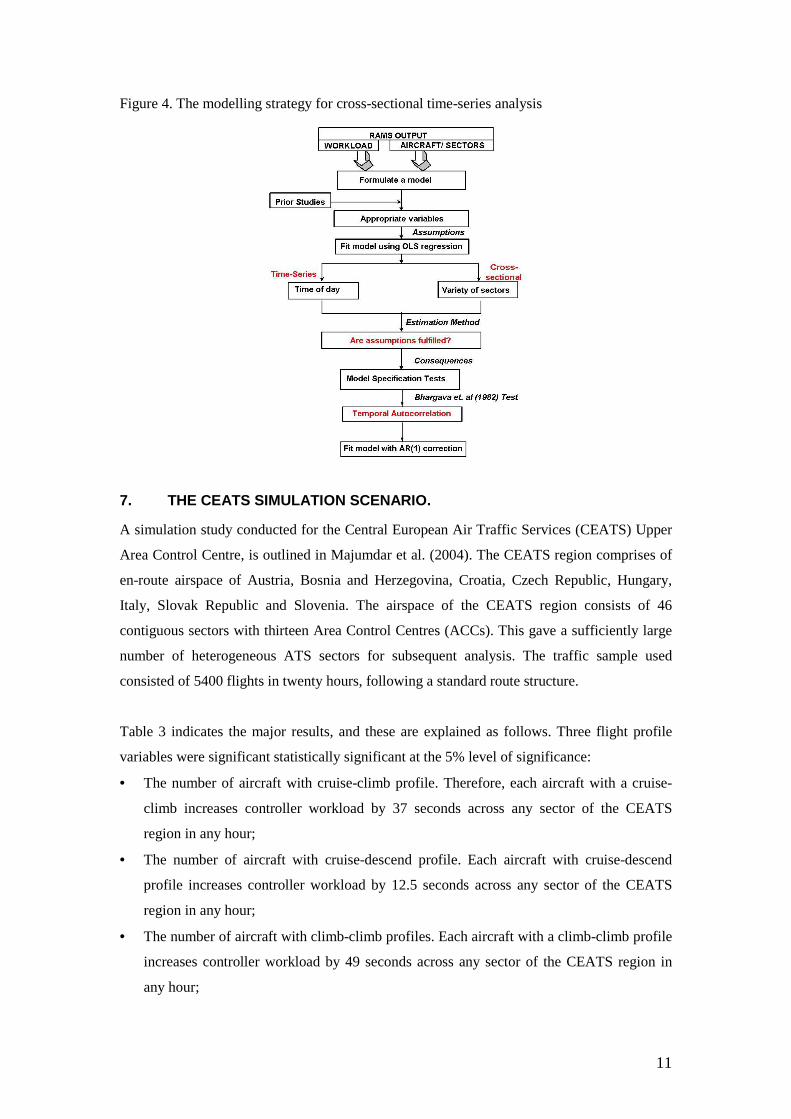
Figure 4. The modelling strategy for cross-sectional time-series analysis
7. THE CEATS SIMULATION SCENARIO.
A simulation study conducted for the Central European Air Traffic Services (CEATS) Upper
Area Control Centre, is outlined in Majumdar et al. (2004). The CEATS region comprises of
en-route airspace of Austria, Bosnia and Herzegovina, Croatia, Czech Republic, Hungary,
Italy, Slovak Republic and Slovenia. The airspace of the CEATS region consists of 46
contiguous sectors with thirteen Area Control Centres (ACCs). This gave a sufficiently large
number of heterogeneous ATS sectors for subsequent analysis. The traffic sample used
consisted of 5400 flights in twenty hours, following a standard route structure.
Table 3 indicates the major results, and these are explained as follows. Three flight profile
variables were significant statistically significant at the 5% level of significance:
• The number of aircraft with cruise-climb profile. Therefore, each aircraft with a cruise-
climb increases controller workload by 37 seconds across any sector of the CEATS
region in any hour;
• The number of aircraft with cruise-descend profile. Each aircraft with cruise-descend
profile increases controller workload by 12.5 seconds across any sector of the CEATS
region in any hour;
• The number of aircraft with climb-climb profiles. Each aircraft with a climb-climb profile
increases controller workload by 49 seconds across any sector of the CEATS region in
any hour;

12
The total flight time was found to be significant at the 5% level, with every second of the total
flight time variable increases controller workload by 0.012 seconds.
The variable for the difference in flight levels used is significant and negative, indicating that
for every difference of one flight level, controller workload decreases by one second. This
implies that the more flight levels there are in a sector, the less the workload associated with
factors such as conflict resolution. Presumably more flight levels give controllers more
options to avoid conflicts in a sector.
The speed difference variable is significant and indicates that for every 1 nm/h speed
difference between the fastest and slowest aircraft in the sector, controller workload increases
by 0.32 seconds. Therefore, the greater the speed homogeneity in a sector, the more
preferable it is for controller workload, i.e. less workload.
The variables for the number of neighbouring sectors from which aircraft enter a sector, and
exit from a sector were found to be significant and negative. Therefore, for every
neighbouring sector into which aircraft could enter or from which they could exit, controller
workload decreased by 12 to 13 seconds. A possible explanation for this is that whilst more
sectors indicate increased coordination workload, this effect is counteracted by the reduced
workload for conflict detection and resolution in any sector, though sector size effects need to
be considered in this case. In addition, the neighbouring sectors could indicate spatial effects
in the data not adequately captured by the variables present in this analysis.
Barring the number of aircraft exiting a sector in climb, all the other variables relating to
flight phases for aircraft entry and exit into a sector are significant and positive in sign and
value. This indicates that these variables combining both sector entry/ exit and flight phase
increase controller workload, the actual amount varying between 61 seconds for flights
entering sector in descend and 9 seconds for flights exiting sector in descend.
The predictive capabilities of this technique were strong. When the data is considered for all
the 46 sectors for 20 hours, a plot of actual workload recorded against the estimated workload
gives an indicator of the measure of accuracy of the model. Figure 5 shows this plot, along
with a 45 degrees line. This line indicates how closely the model predicts the actual workload,
since if the “actual” and predicted workloads were always equal, all points in this graph
would lie along this line. This figure shows that the model estimates reasonably well the
actual workload, though anomalies at high workloads should be investigated. Therefore it
seems that a subset of about ten significant variables, with their estimated parameter values,
13
can adequately predict the simulated workload obtained using RAMS in any given sector in
the CEATS region in any given hour. However, given the bespoke nature of ATC in different
airspace regions of Europe, there may be a need to consider other variables. Anomalies in the
results could be due to possible model misspecification, requiring the need to include
quadratic variables to account for interactions.
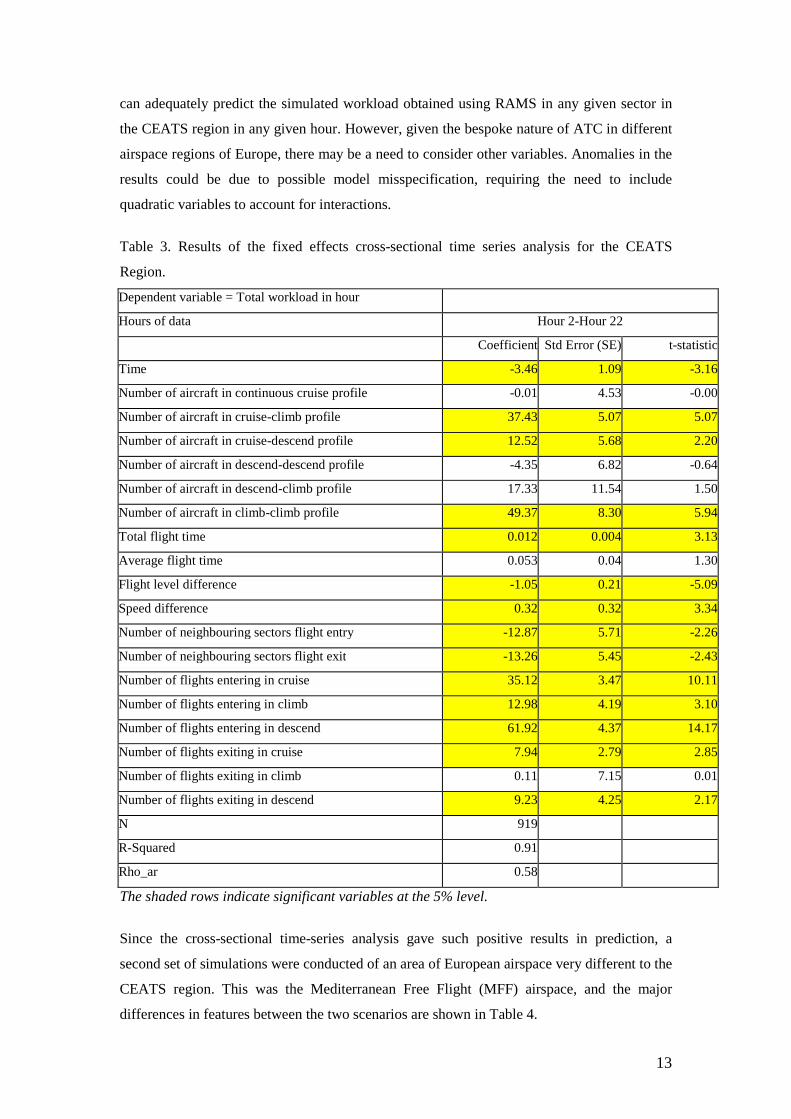
Table 3. Results of the fixed effects cross-sectional time series analysis for the CEATS
Region.
Dependent variable = Total workload in hour
Hours of data Hour 2-Hour 22
Coefficient Std Error (SE) t-statistic
Time -3.46 1.09 -3.16
Number of aircraft in continuous cruise profile -0.01 4.53 -0.00
Number of aircraft in cruise-climb profile 37.43 5.07 5.07
Number of aircraft in cruise-descend profile 12.52 5.68 2.20
Number of aircraft in descend-descend profile -4.35 6.82 -0.64
Number of aircraft in descend-climb profile 17.33 11.54 1.50
Number of aircraft in climb-climb profile 49.37 8.30 5.94
Total flight time 0.012 0.004 3.13
Average flight time 0.053 0.04 1.30
Flight level difference -1.05 0.21 -5.09
Speed difference 0.32 0.32 3.34
Number of neighbouring sectors flight entry -12.87 5.71 -2.26
Number of neighbouring sectors flight exit -13.26 5.45 -2.43
Number of flights entering in cruise 35.12 3.47 10.11
Number of flights entering in climb 12.98 4.19 3.10
Number of flights entering in descend 61.92 4.37 14.17
Number of flights exiting in cruise 7.94 2.79 2.85
Number of flights exiting in climb 0.11 7.15 0.01
Number of flights exiting in descend 9.23 4.25 2.17
N 919
R-Squared 0.91
Rho_ar 0.58
The shaded rows indicate significant variables at the 5% level.
Since the cross-sectional time-series analysis gave such positive results in prediction, a
second set of simulations were conducted of an area of European airspace very different to the
CEATS region. This was the Mediterranean Free Flight (MFF) airspace, and the major
differences in features between the two scenarios are shown in Table 4.
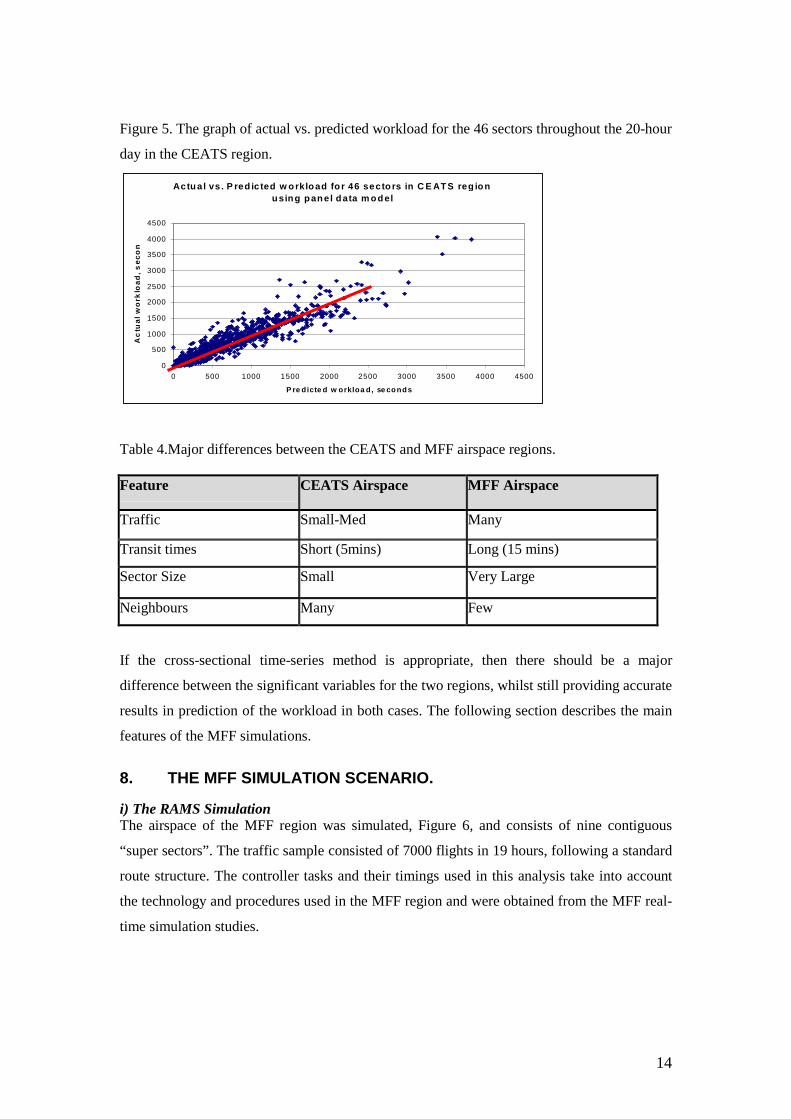
14
Figure 5. The graph of actual vs. predicted workload for the 46 sectors throughout the 20-hour
day in the CEATS region.
Actu a l vs . P red ic ted w o rklo ad fo r 46 secto rs in C E AT S reg io n u sin g p an el d ata m o d el
0
500
1000
1500
2000
2500
3000
3500
4000
4500
0 500 1000 1500 2000 2500 3000 3500 4000 4500
P re dicte d w orkloa d, se conds
Ac
tua
l w
ork
loa
d,
se
co
nd
s
Table 4.Major differences between the CEATS and MFF airspace regions. Feature CEATS Airspace MFF Airspace
Traffic Small-Med Many
Transit times Short (5mins) Long (15 mins)
Sector Size Small Very Large
Neighbours Many Few
If the cross-sectional time-series method is appropriate, then there should be a major
difference between the significant variables for the two regions, whilst still providing accurate
results in prediction of the workload in both cases. The following section describes the main
features of the MFF simulations.
8. THE MFF SIMULATION SCENARIO.
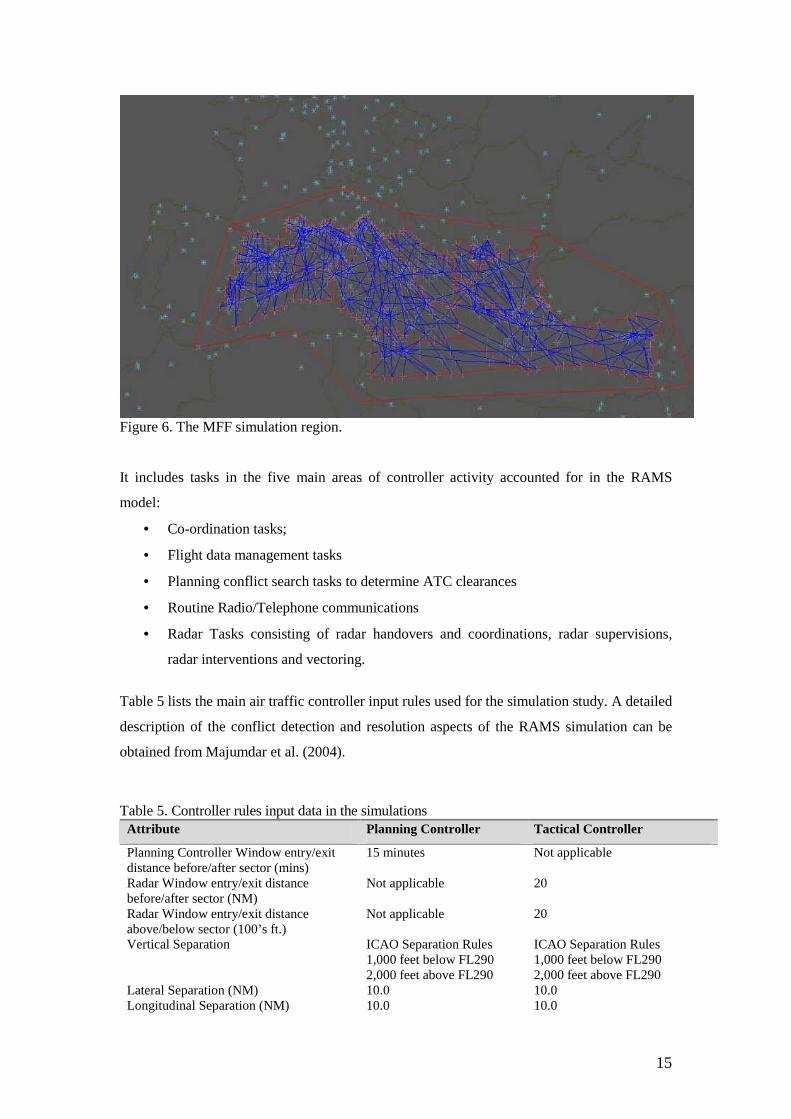
i) The RAMS Simulation The airspace of the MFF region was simulated, Figure 6, and consists of nine contiguous
“super sectors”. The traffic sample consisted of 7000 flights in 19 hours, following a standard
route structure. The controller tasks and their timings used in this analysis take into account
the technology and procedures used in the MFF region and were obtained from the MFF real-
time simulation studies.
15
Figure 6. The MFF simulation region. It includes tasks in the five main areas of controller activity accounted for in the RAMS
model:
• Co-ordination tasks;
• Flight data management tasks
• Planning conflict search tasks to determine ATC clearances
• Routine Radio/Telephone communications
• Radar Tasks consisting of radar handovers and coordinations, radar supervisions,
radar interventions and vectoring.
Table 5 lists the main air traffic controller input rules used for the simulation study. A detailed
description of the conflict detection and resolution aspects of the RAMS simulation can be
obtained from Majumdar et al. (2004).
Table 5. Controller rules input data in the simulations
Attribute Planning Controller Tactical Controller
Planning Controller Window entry/exit distance before/after sector (mins)
15 minutes Not applicable
Radar Window entry/exit distance before/after sector (NM)
Not applicable 20
Radar Window entry/exit distance above/below sector (100’s ft.)
Not applicable 20
Vertical Separation ICAO Separation Rules 1,000 feet below FL290 2,000 feet above FL290
ICAO Separation Rules 1,000 feet below FL290 2,000 feet above FL290
Lateral Separation (NM) 10.0 10.0 Longitudinal Separation (NM) 10.0 10.0
16
Detection Dynamics Defined Detection Dynamics
Defined Detection Dynamics .
Controller Task Base CEATS Tasks .
CEATS Tasks
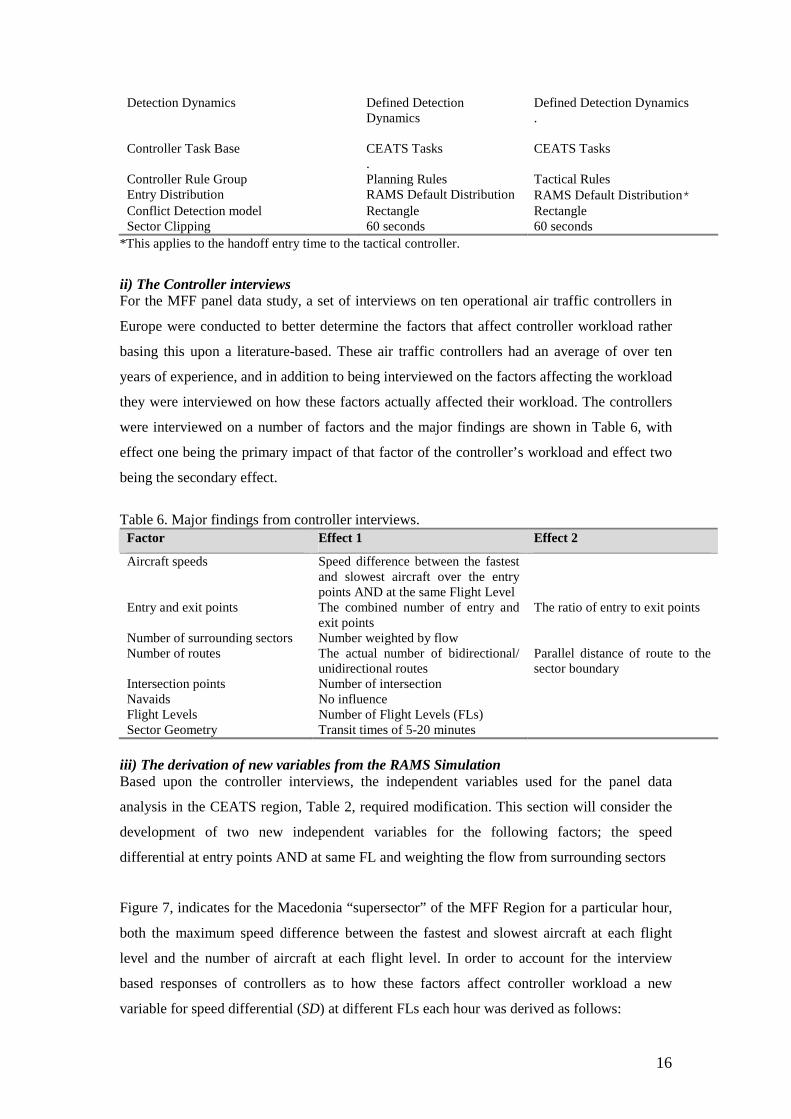
Controller Rule Group Planning Rules Tactical Rules Entry Distribution RAMS Default Distribution RAMS Default Distribution* Conflict Detection model Rectangle Rectangle Sector Clipping 60 seconds 60 seconds
*This applies to the handoff entry time to the tactical controller.
ii) The Controller interviews For the MFF panel data study, a set of interviews on ten operational air traffic controllers in
Europe were conducted to better determine the factors that affect controller workload rather
basing this upon a literature-based. These air traffic controllers had an average of over ten
years of experience, and in addition to being interviewed on the factors affecting the workload
they were interviewed on how these factors actually affected their workload. The controllers
were interviewed on a number of factors and the major findings are shown in Table 6, with
effect one being the primary impact of that factor of the controller’s workload and effect two
being the secondary effect.
Table 6. Major findings from controller interviews.
Factor Effect 1 Effect 2
Aircraft speeds Speed difference between the fastest and slowest aircraft over the entry points AND at the same Flight Level
Entry and exit points The combined number of entry and exit points
The ratio of entry to exit points
Number of surrounding sectors Number weighted by flow Number of routes The actual number of bidirectional/
unidirectional routes Parallel distance of route to the sector boundary
Intersection points Number of intersection Navaids No influence Flight Levels Number of Flight Levels (FLs) Sector Geometry Transit times of 5-20 minutes
iii) The derivation of new variables from the RAMS Simulation Based upon the controller interviews, the independent variables used for the panel data
analysis in the CEATS region, Table 2, required modification. This section will consider the
development of two new independent variables for the following factors; the speed
differential at entry points AND at same FL and weighting the flow from surrounding sectors
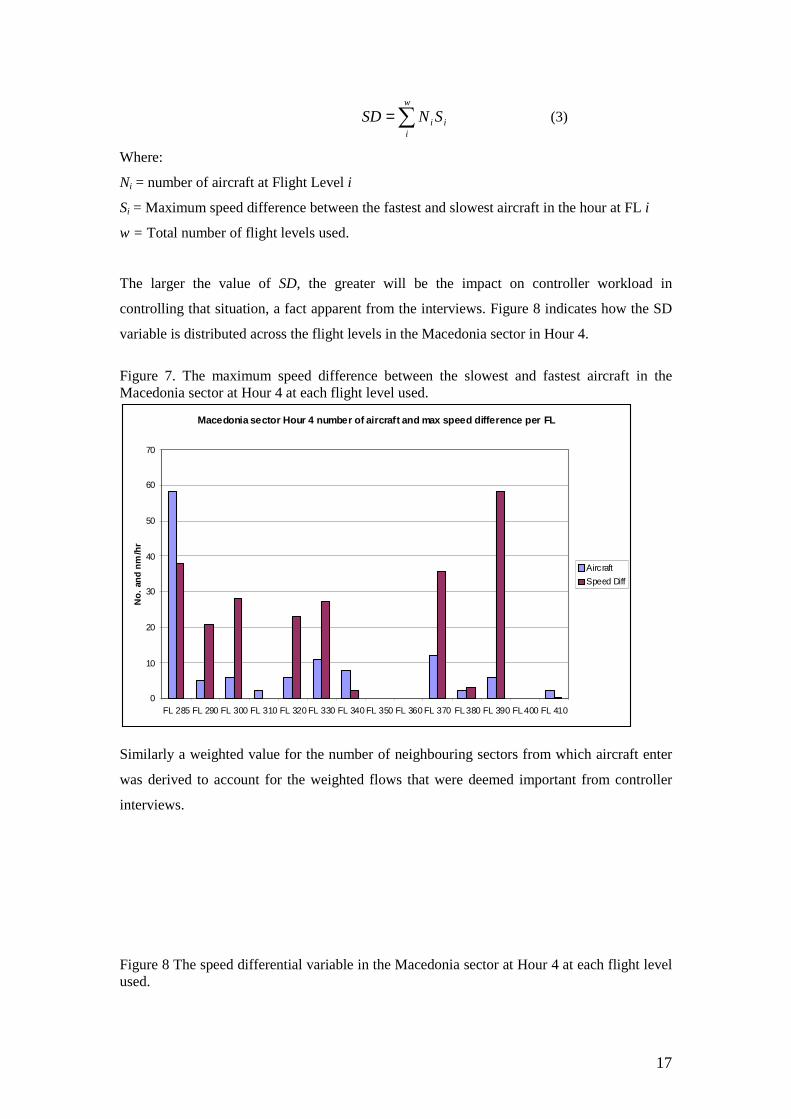
Figure 7, indicates for the Macedonia “supersector” of the MFF Region for a particular hour,
both the maximum speed difference between the fastest and slowest aircraft at each flight
level and the number of aircraft at each flight level. In order to account for the interview
based responses of controllers as to how these factors affect controller workload a new
variable for speed differential (SD) at different FLs each hour was derived as follows:
17
i
w
ii SNSD �= (3)
Where:
Ni = number of aircraft at Flight Level i
Si = Maximum speed difference between the fastest and slowest aircraft in the hour at FL i
w = Total number of flight levels used.
The larger the value of SD, the greater will be the impact on controller workload in
controlling that situation, a fact apparent from the interviews. Figure 8 indicates how the SD
variable is distributed across the flight levels in the Macedonia sector in Hour 4.
Figure 7. The maximum speed difference between the slowest and fastest aircraft in the Macedonia sector at Hour 4 at each flight level used.
Macedonia sector Hour 4 number of aircraft and max speed difference per FL
0
10
20
30
40
50
60
70
FL 285 FL 290 FL 300 FL 310 FL 320 FL 330 FL 340 FL 350 FL 360 FL 370 FL 380 FL 390 FL 400 FL 410
No
. an
d n
m/h
r
Aircraft
Speed Diff
Similarly a weighted value for the number of neighbouring sectors from which aircraft enter
was derived to account for the weighted flows that were deemed important from controller
interviews.
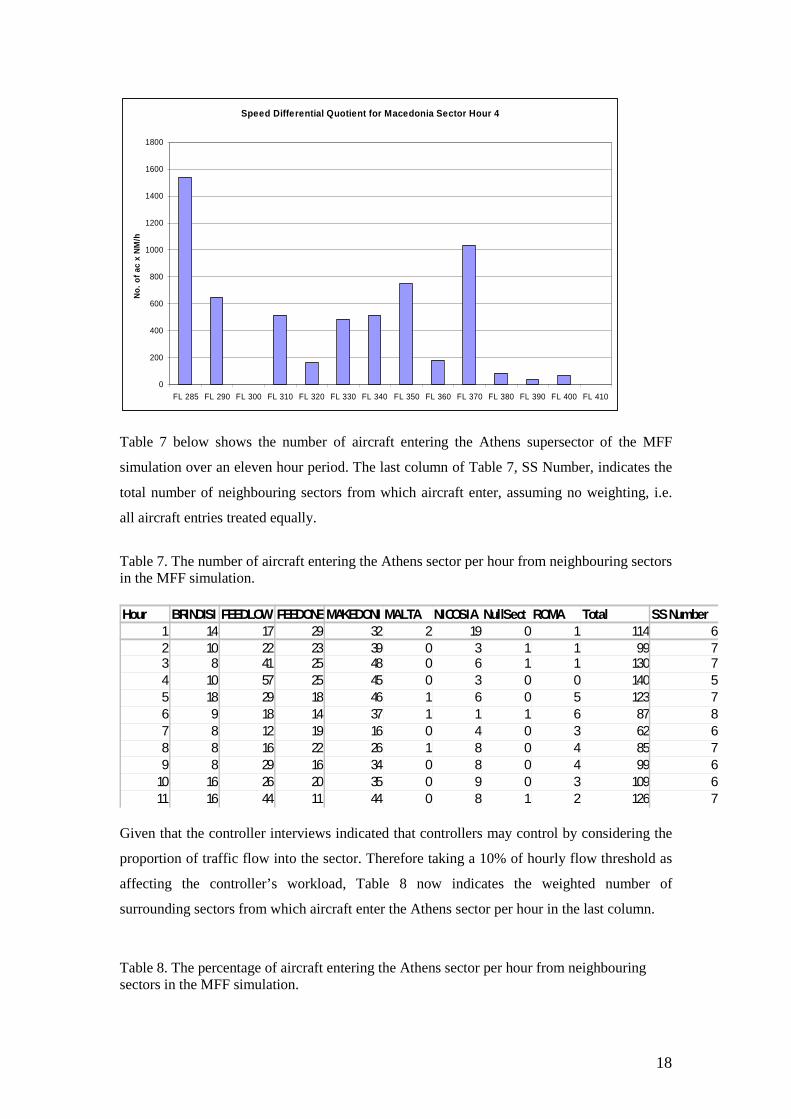
Figure 8 The speed differential variable in the Macedonia sector at Hour 4 at each flight level used.
18
Speed Differential Quotient for Macedonia Sector Hour 4
0
200
400
600
800
1000
1200
1400
1600
1800
FL 285 FL 290 FL 300 FL 310 FL 320 FL 330 FL 340 FL 350 FL 360 FL 370 FL 380 FL 390 FL 400 FL 410
No
. o
f ac
x N
M/h
Table 7 below shows the number of aircraft entering the Athens supersector of the MFF
simulation over an eleven hour period. The last column of Table 7, SS Number, indicates the
total number of neighbouring sectors from which aircraft enter, assuming no weighting, i.e.
all aircraft entries treated equally.
Table 7. The number of aircraft entering the Athens sector per hour from neighbouring sectors in the MFF simulation.
Given that the controller interviews indicated that controllers may control by considering the
proportion of traffic flow into the sector. Therefore taking a 10% of hourly flow threshold as
affecting the controller’s workload, Table 8 now indicates the weighted number of
surrounding sectors from which aircraft enter the Athens sector per hour in the last column.
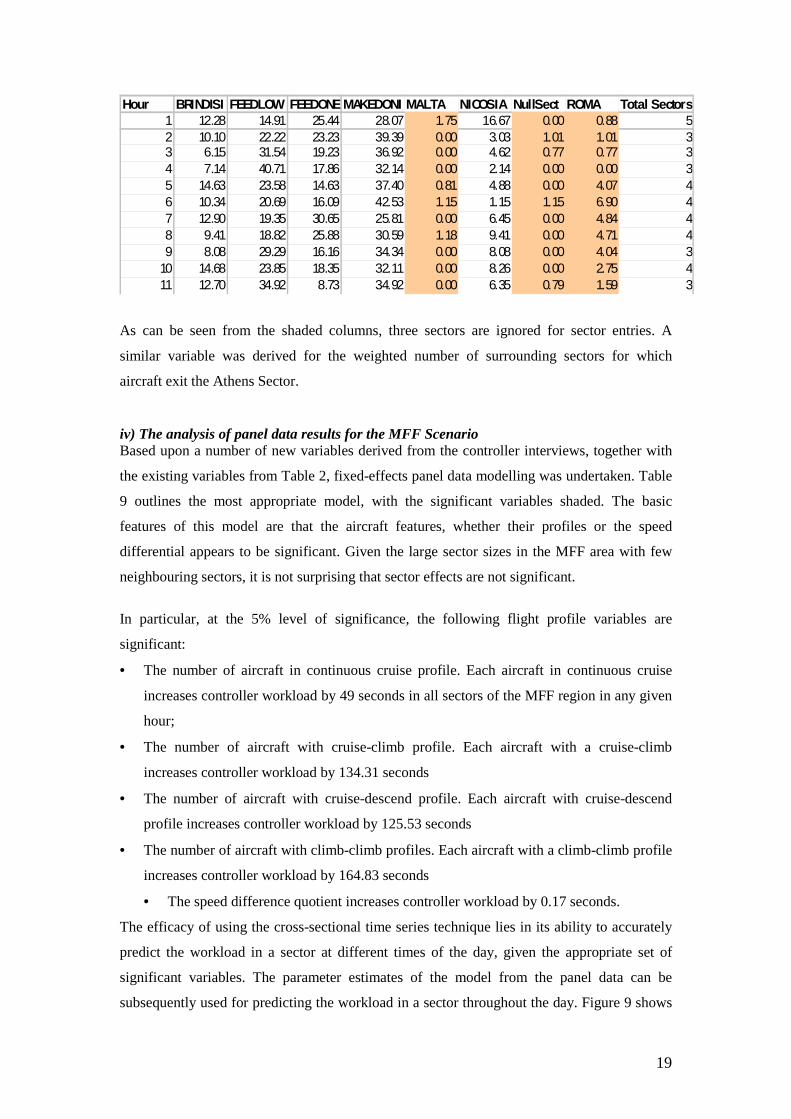
Table 8. The percentage of aircraft entering the Athens sector per hour from neighbouring sectors in the MFF simulation.
Hour BRINDISI FEEDLOW FEEDONEMAKEDONI MALTA NICOSIA NullSect ROMA Total SS Number1 14 17 29 32 2 19 0 1 114 62 10 22 23 39 0 3 1 1 99 73 8 41 25 48 0 6 1 1 130 74 10 57 25 45 0 3 0 0 140 55 18 29 18 46 1 6 0 5 123 76 9 18 14 37 1 1 1 6 87 87 8 12 19 16 0 4 0 3 62 68 8 16 22 26 1 8 0 4 85 79 8 29 16 34 0 8 0 4 99 6
10 16 26 20 35 0 9 0 3 109 611 16 44 11 44 0 8 1 2 126 7
19
As can be seen from the shaded columns, three sectors are ignored for sector entries. A
similar variable was derived for the weighted number of surrounding sectors for which
aircraft exit the Athens Sector.
iv) The analysis of panel data results for the MFF Scenario Based upon a number of new variables derived from the controller interviews, together with
the existing variables from Table 2, fixed-effects panel data modelling was undertaken. Table
9 outlines the most appropriate model, with the significant variables shaded. The basic
features of this model are that the aircraft features, whether their profiles or the speed
differential appears to be significant. Given the large sector sizes in the MFF area with few
neighbouring sectors, it is not surprising that sector effects are not significant.
In particular, at the 5% level of significance, the following flight profile variables are
significant:
• The number of aircraft in continuous cruise profile. Each aircraft in continuous cruise
increases controller workload by 49 seconds in all sectors of the MFF region in any given
hour;
• The number of aircraft with cruise-climb profile. Each aircraft with a cruise-climb
increases controller workload by 134.31 seconds
• The number of aircraft with cruise-descend profile. Each aircraft with cruise-descend
profile increases controller workload by 125.53 seconds
• The number of aircraft with climb-climb profiles. Each aircraft with a climb-climb profile
increases controller workload by 164.83 seconds
• The speed difference quotient increases controller workload by 0.17 seconds.
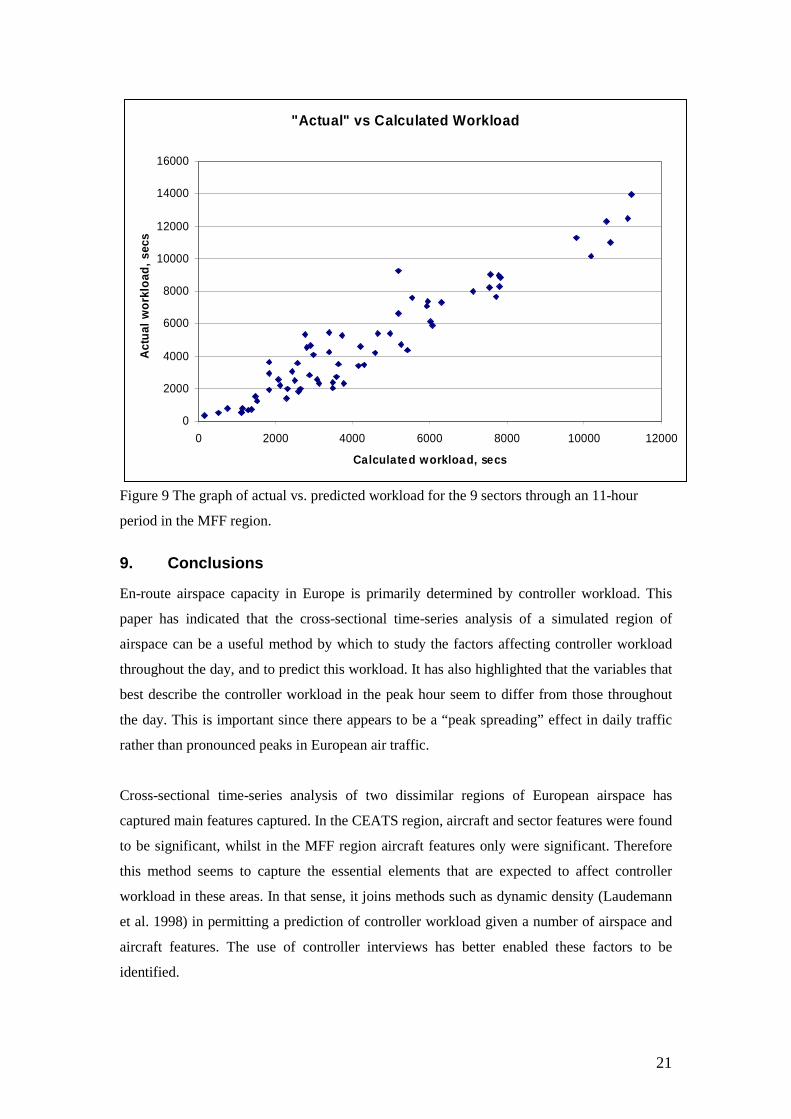
The efficacy of using the cross-sectional time series technique lies in its ability to accurately
predict the workload in a sector at different times of the day, given the appropriate set of
significant variables. The parameter estimates of the model from the panel data can be
subsequently used for predicting the workload in a sector throughout the day. Figure 9 shows
Hour BRINDISI FEEDLOW FEEDONEMAKEDONI MALTA NICOSIA NullSect ROMA Total Sectors1 12.28 14.91 25.44 28.07 1.75 16.67 0.00 0.88 52 10.10 22.22 23.23 39.39 0.00 3.03 1.01 1.01 33 6.15 31.54 19.23 36.92 0.00 4.62 0.77 0.77 34 7.14 40.71 17.86 32.14 0.00 2.14 0.00 0.00 35 14.63 23.58 14.63 37.40 0.81 4.88 0.00 4.07 46 10.34 20.69 16.09 42.53 1.15 1.15 1.15 6.90 47 12.90 19.35 30.65 25.81 0.00 6.45 0.00 4.84 48 9.41 18.82 25.88 30.59 1.18 9.41 0.00 4.71 49 8.08 29.29 16.16 34.34 0.00 8.08 0.00 4.04 3
10 14.68 23.85 18.35 32.11 0.00 8.26 0.00 2.75 411 12.70 34.92 8.73 34.92 0.00 6.35 0.79 1.59 3
20
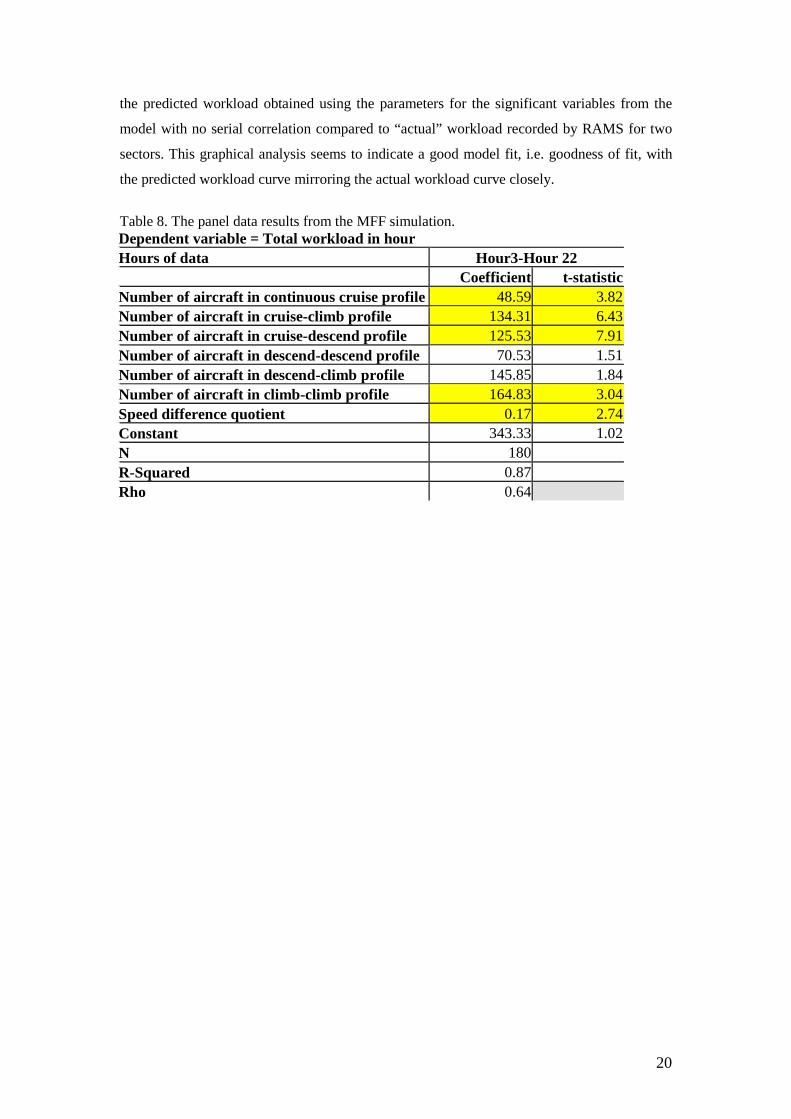
the predicted workload obtained using the parameters for the significant variables from the
model with no serial correlation compared to “actual” workload recorded by RAMS for two
sectors. This graphical analysis seems to indicate a good model fit, i.e. goodness of fit, with
the predicted workload curve mirroring the actual workload curve closely.
Table 8. The panel data results from the MFF simulation. Dependent variable = Total workload in hour Hours of data Hour3-Hour 22 Coefficient t-statistic Number of aircraft in continuous cruise profile 48.59 3.82 Number of aircraft in cruise-climb profile 134.31 6.43 Number of aircraft in cruise-descend profile 125.53 7.91 Number of aircraft in descend-descend profile 70.53 1.51 Number of aircraft in descend-climb profile 145.85 1.84 Number of aircraft in climb-climb profile 164.83 3.04 Speed difference quotient 0.17 2.74 Constant 343.33 1.02 N 180 R-Squared 0.87 Rho 0.64
21
"Actual" vs Calculated Workload
0
2000
4000
6000
8000
10000
12000
14000
16000
0 2000 4000 6000 8000 10000 12000
Calculated workload, secs
Act
ual
wo
rklo
ad,
secs
Figure 9 The graph of actual vs. predicted workload for the 9 sectors through an 11-hour
period in the MFF region.
9. Conclusions
En-route airspace capacity in Europe is primarily determined by controller workload. This
paper has indicated that the cross-sectional time-series analysis of a simulated region of
airspace can be a useful method by which to study the factors affecting controller workload
throughout the day, and to predict this workload. It has also highlighted that the variables that
best describe the controller workload in the peak hour seem to differ from those throughout
the day. This is important since there appears to be a “peak spreading” effect in daily traffic
rather than pronounced peaks in European air traffic.
Cross-sectional time-series analysis of two dissimilar regions of European airspace has
captured main features captured. In the CEATS region, aircraft and sector features were found
to be significant, whilst in the MFF region aircraft features only were significant. Therefore
this method seems to capture the essential elements that are expected to affect controller
workload in these areas. In that sense, it joins methods such as dynamic density (Laudemann
et al. 1998) in permitting a prediction of controller workload given a number of airspace and
aircraft features. The use of controller interviews has better enabled these factors to be
identified.

22
Given the strong predictive abilities of the analysis, there is a need to undertake further
analysis of this method to ensure its robustness, e.g. introducing non-linear methods. Finally it
should however be noted that the research presented here has been based on simulated data,
i.e. an analytical model based upon the output of a simulation model. As such, this is a good
initial step in obtaining the drivers of workload and operational data is needed for thorough
validation of the results, assuming enough of such data could be obtained for statistical
adequacy.
REFERENCES
Arthur D. Little Limited (2000) Study into the potential impact of changes in technology on the development of air transport in the UK - Final Report to Department of the Environment, Transport and Regions (DETR), DETR Contract No. PPAD 9/91/14, London U.K.
Baltagi, B.H. (1995) econometric analysis of panel data, John Wiley & Sons Ltd, Chichester, England:UK.
Bhargava, A, Franzini, L and W. Narendranathan (1982), Serial Correlation and the Fixed Effects Model, Review of Economic Studies 49, pp. 533-549.
ECAC (1998) Integrating air traffic management - the European experience, Paper presented by 36 Contracting States of ECAC to the World-wide CNS/ATM Systems Implementation Conference, Rio de Janeiro, May 1998.
EUROCONTROL (1991) European Air Traffic Control Harmonization and Integration Programme (EATCHIP), Phase 1 Report, EUROCONTROL, Brussels, Belgium.
EUROCONTROL EXPERIMENTAL CENTRE (1995) RAMS system overview document, Model Based Simulations Sub-Division, EUROCONTROL, Bretigny-sur-Orge, France
EUROCONTROL EXPERIMENTAL CENTRE (1996) RAMS User Manual Version 2.1, EEC/RAMS/UM/OO13, Model Based Simulations Sub-Division, EUROCONTROL, Bretigny-sur-Orge, France.
EUROCONTROL (1998) Air Traffic Management Strategy for 2000+, Volumes 1&2, EUROCONTROL, Belgium.
EUROCONTROL (1999) Model simulation of Bulgarian airspace, EEC Note 4/99, Project SIM-F-E1 (F7), ATM Operational & Simulation Expertise Group, EUROCONTROL, Bretigny-sur-Orge, France.
The European Commission (2003) Study on the implementation rules of economic regulation within the framework of the implementation of the single European sky, Final Report, TREN/f2/28-2002, Brussels.
Hilburn, B. (2004) Cognitive complexity in air traffic control – a literature review, EEC Note 04/04, Project COCA, EEC Network Capacity and Demand, EUROCONTROL, Bretigny-sur-Orge, France.
Jorna P.G.A.M (1991) Operator workload as a limiting factor in complex systems, Automation and Systems Issues, (eds.) J. Wise and D. Hopkin, NATO ASI series.
Laudeman, I.V., Shelden S.G., Branstrom, R. and C.L. Brasil (1998) Dynamic Density: an air traffic management metric, NASA-TM-1998-112226, April 1998.
Majumdar, A, Ochieng, W.Y. McAuley G, Lenzi, J.M. and Lepadatu C. " The Factors Affecting Airspace Capacity in Europe: A Cross-Sectional Time-Series Analysis Using Simulated Controller Workload” Journal of Navigation, 57(3), (2004), 385-405.

23
Majumdar, A. and W.Y. Ochieng (2002), The factors affecting air traffic controller workload: a multivariate analysis based upon simulation modelling of controller workload, Transportation Research Record, 1788, 58-69
Majumdar, A. and J.W. Polak (2001) A Framework for the Estimation of European Airspace Capacity using a Model of Controller Workload, Transportation Research Records, 1744, 30-43
Magill, S. A. N. (1997) Trajectory predictability and frequency of conflict-avoiding action, Paper presented at the CEAS 10th International Aerospace Conference, Amsterdam, the Netherlands, 1997.
Mogford, R.H., J.A. Guttman, S. L. Morrow and P. Kopardekar (1995) The complexity construct in air traffic control: a review and synthesis of the literature, DOT/FAA/CT-TN92/22, Department of Transportation/ Federal Aviation Administration Technical Center, Atlantic City, NJ.
Wickens C.D., A.S. Mavor. and J.P. McGee (Eds) (1997) Flight to the Future: human factors in air traffic control, National Academy Press, Washington DC, USA.
Verbeek, M (2000) A Guide to Modern Econometrics, John Wiley & Sons Ltd, Chichester, England:UK.