Embed Size (px)
Citation preview
NASA/TM-2001-210395
The F-15B Propulsion Flight Test Fixture: A New Flight Facility For Propulsion Research
Stephen Corda, M. Jake Vachon, Nathan Palumbo,Corey Diebler, Ting Tseng, Anthony Ginn, and David RichwineNASA Dryden Flight Research Center Edwards, California
July 2001

The NASA STI Program Office…in Profile
Since its founding, NASA has been dedicatedto the advancement of aeronautics and space science. The NASA Scientific and Technical Information (STI) Program Office plays a keypart in helping NASA maintain thisimportant role.
The NASA STI Program Office is operated byLangley Research Center, the lead center forNASA’s scientific and technical information.The NASA STI Program Office provides access to the NASA STI Database, the largest collectionof aeronautical and space science STI in theworld. The Program Office is also NASA’s institutional mechanism for disseminating theresults of its research and development activities. These results are published by NASA in theNASA STI Report Series, which includes the following report types:
• TECHNICAL PUBLICATION. Reports of completed research or a major significantphase of research that present the results of NASA programs and include extensive dataor theoretical analysis. Includes compilations of significant scientific and technical data and information deemed to be of continuing reference value. NASA’s counterpart of peer-reviewed formal professional papers but has less stringent limitations on manuscriptlength and extent of graphic presentations.
• TECHNICAL MEMORANDUM. Scientificand technical findings that are preliminary orof specialized interest, e.g., quick releasereports, working papers, and bibliographiesthat contain minimal annotation. Does notcontain extensive analysis.
• CONTRACTOR REPORT. Scientific and technical findings by NASA-sponsored contractors and grantees.
• CONFERENCE PUBLICATION. Collected papers from scientific andtechnical conferences, symposia, seminars,or other meetings sponsored or cosponsoredby NASA.
• SPECIAL PUBLICATION. Scientific,technical, or historical information fromNASA programs, projects, and mission,often concerned with subjects havingsubstantial public interest.
• TECHNICAL TRANSLATION. English- language translations of foreign scientific and technical material pertinent toNASA’s mission.
Specialized services that complement the STIProgram Office’s diverse offerings include creating custom thesauri, building customizeddatabases, organizing and publishing researchresults…even providing videos.
For more information about the NASA STIProgram Office, see the following:
• Access the NASA STI Program Home Pageat
http://www.sti.nasa.gov
• E-mail your question via the Internet to [email protected]
• Fax your question to the NASA Access HelpDesk at (301) 621-0134
• Telephone the NASA Access Help Desk at(301) 621-0390
• Write to:NASA Access Help DeskNASA Center for AeroSpace Information7121 Standard DriveHanover, MD 21076-1320
NASA/TM-2001-210395
The F-15B Propulsion Flight Test Fixture: A New Flight Facility For Propulsion Research
Stephen Corda, M. Jake Vachon, Nathan Palumbo,Corey Diebler, Ting Tseng, Anthony Ginn, and David RichwineNASA Dryden Flight Research Center Edwards, California
July 2001
National Aeronautics andSpace Administration
Dryden Flight Research CenterEdwards, California 93523-0273

NOTICE
Use of trade names or names of manufacturers in this document does not constitute an official endorsementof such products or manufacturers, either expressed or implied, by the National Aeronautics andSpace Administration.
Available from the following:
NASA Center for AeroSpace Information (CASI) National Technical Information Service (NTIS)7121 Standard Drive 5285 Port Royal RoadHanover, MD 21076-1320 Springfield, VA 22161-2171(301) 621-0390 (703) 487-4650
THE F-15B PROPULSION FLIGHT TEST FIXTURE: A NEW FLIGHT FACILITY FOR PROPULSION RESEARCH
Stephen Corda,* M. Jake Vachon,† Nathan Palumbo,‡ Corey Diebler,§
Ting Tseng,¶ Anthony Ginn,# and David Richwine**NASA Dryden Flight Research Center
Edwards, California
ABSTRACT
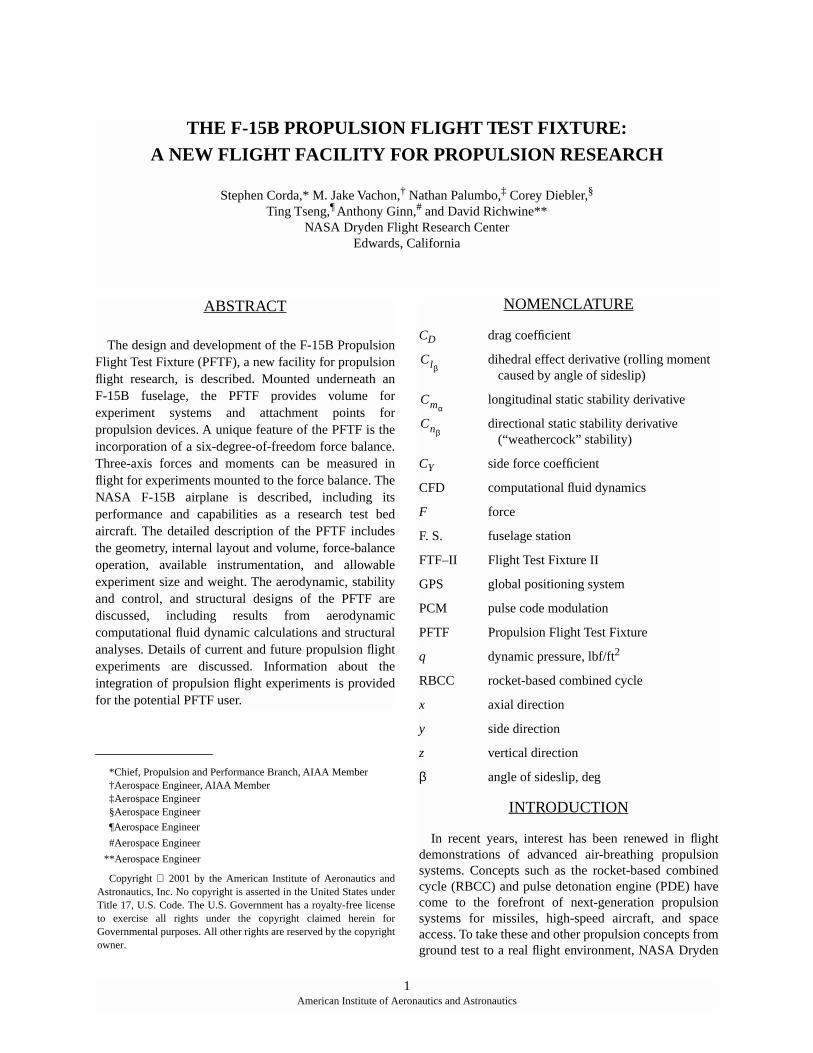
The design and development of the F-15B PropulsionFlight Test Fixture (PFTF), a new facility for propulsionflight research, is described. Mounted underneath anF-15B fuselage, the PFTF provides volume forexperiment systems and attachment points forpropulsion devices. A unique feature of the PFTF is theincorporation of a six-degree-of-freedom force balance.Three-axis forces and moments can be measured inflight for experiments mounted to the force balance. TheNASA F-15B airplane is described, including itsperformance and capabilities as a research test bedaircraft. The detailed description of the PFTF includesthe geometry, internal layout and volume, force-balanceoperation, available instrumentation, and allowableexperiment size and weight. The aerodynamic, stabilityand control, and structural designs of the PFTF arediscussed, including results from aerodynamiccomputational fluid dynamic calculations and structuralanalyses. Details of current and future propulsion flightexperiments are discussed. Information about theintegration of propulsion flight experiments is providedfor the potential PFTF user.
1American Institute of Aero
*Chief, Propulsion and Performance Branch, AIAA Member†Aerospace Engineer, AIAA Member‡Aerospace Engineer§Aerospace Engineer
¶Aerospace Engineer
#Aerospace Engineer
**Aerospace Engineer
Copyright 2001 by the American Institute of Aeronautics andAstronautics, Inc. No copyright is asserted in the United States underTitle 17, U.S. Code. The U.S. Government has a royalty-free licenseto exercise all rights under the copyright claimed herein forGovernmental purposes. All other rights are reserved by the copyrightowner.
NOMENCLATURE
CD drag coefficient
dihedral effect derivative (rolling moment caused by angle of sideslip)
longitudinal static stability derivative
directional static stability derivative (“weathercock” stability)
CY side force coefficient
CFD computational fluid dynamics
F force
F. S. fuselage station
FTF–II Flight Test Fixture II
GPS global positioning system
PCM pulse code modulation
PFTF Propulsion Flight Test Fixture
q dynamic pressure, lbf/ft2
RBCC rocket-based combined cycle
x axial direction
y side direction
z vertical direction
β angle of sideslip, deg
INTRODUCTION
In recent years, interest has been renewed in flightdemonstrations of advanced air-breathing propulsionsystems. Concepts such as the rocket-based combinedcycle (RBCC) and pulse detonation engine (PDE) havecome to the forefront of next-generation propulsionsystems for missiles, high-speed aircraft, and spaceaccess. To take these and other propulsion concepts fromground test to a real flight environment, NASA Dryden
Clβ
Cmα
Cnβ
nautics and Astronautics
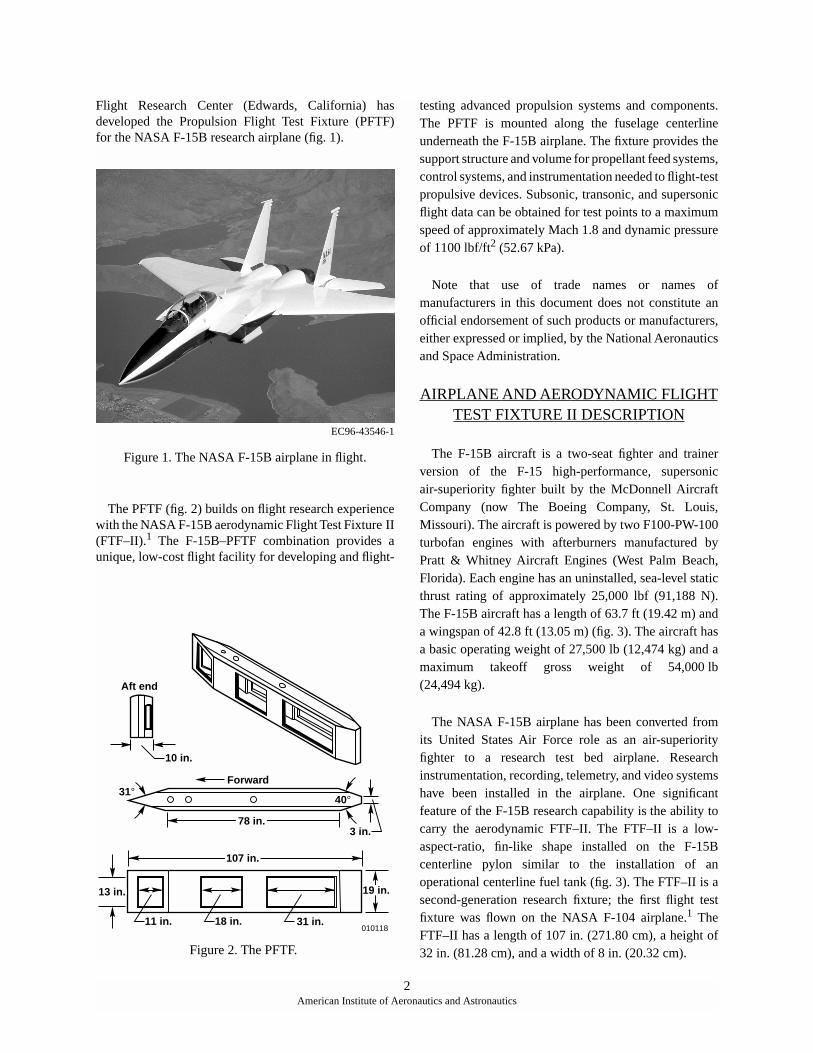
Flight Research Center (Edwards, California) hasdeveloped the Propulsion Flight Test Fixture (PFTF)for the NASA F-15B research airplane (fig. 1).
EC96-43546-1
Figure 1. The NASA F-15B airplane in flight.
The PFTF (fig. 2) builds on flight research experiencewith the NASA F-15B aerodynamic Flight Test Fixture II(FTF–II).1 The F-15B–PFTF combination provides aunique, low-cost flight facility for developing and flight-
testing advanced propulsion systems and components.The PFTF is mounted along the fuselage centerlineunderneath the F-15B airplane. The fixture provides thesupport structure and volume for propellant feed systems,control systems, and instrumentation needed to flight-testpropulsive devices. Subsonic, transonic, and supersonicflight data can be obtained for test points to a maximumspeed of approximately Mach 1.8 and dynamic pressureof 1100 lbf/ft2 (52.67 kPa).
Note that use of trade names or names ofmanufacturers in this document does not constitute anofficial endorsement of such products or manufacturers,either expressed or implied, by the National Aeronauticsand Space Administration.
AIRPLANE AND AERODYNAMIC FLIGHTTEST FIXTURE II DESCRIPTION
The F-15B aircraft is a two-seat fighter and trainerversion of the F-15 high-performance, supersonicair-superiority fighter built by the McDonnell AircraftCompany (now The Boeing Company, St. Louis,Missouri). The aircraft is powered by two F100-PW-100turbofan engines with afterburners manufactured byPratt & Whitney Aircraft Engines (West Palm Beach,Florida). Each engine has an uninstalled, sea-level staticthrust rating of approximately 25,000 lbf (91,188 N).The F-15B aircraft has a length of 63.7 ft (19.42 m) anda wingspan of 42.8 ft (13.05 m) (fig. 3). The aircraft hasa basic operating weight of 27,500 lb (12,474 kg) and amaximum takeoff gross weight of 54,000 lb(24,494 kg).
The NASA F-15B airplane has been converted fromits United States Air Force role as an air-superiorityfighter to a research test bed airplane. Researchinstrumentation, recording, telemetry, and video systemshave been installed in the airplane. One significantfeature of the F-15B research capability is the ability tocarry the aerodynamic FTF–II. The FTF–II is a low-aspect-ratio, fin-like shape installed on the F-15Bcenterline pylon similar to the installation of anoperational centerline fuel tank (fig. 3). The FTF–II is asecond-generation research fixture; the first flight testfixture was flown on the NASA F-104 airplane.1 TheFTF–II has a length of 107 in. (271.80 cm), a height of32 in. (81.28 cm), and a width of 8 in. (20.32 cm).
31°Forward
Aft end
3 in.
10 in.
11 in.
40°
13 in.
31 in.18 in.
19 in.
010118
78 in.
107 in.
Figure 2. The PFTF.
2American Institute of Aeronautics and Astronautics
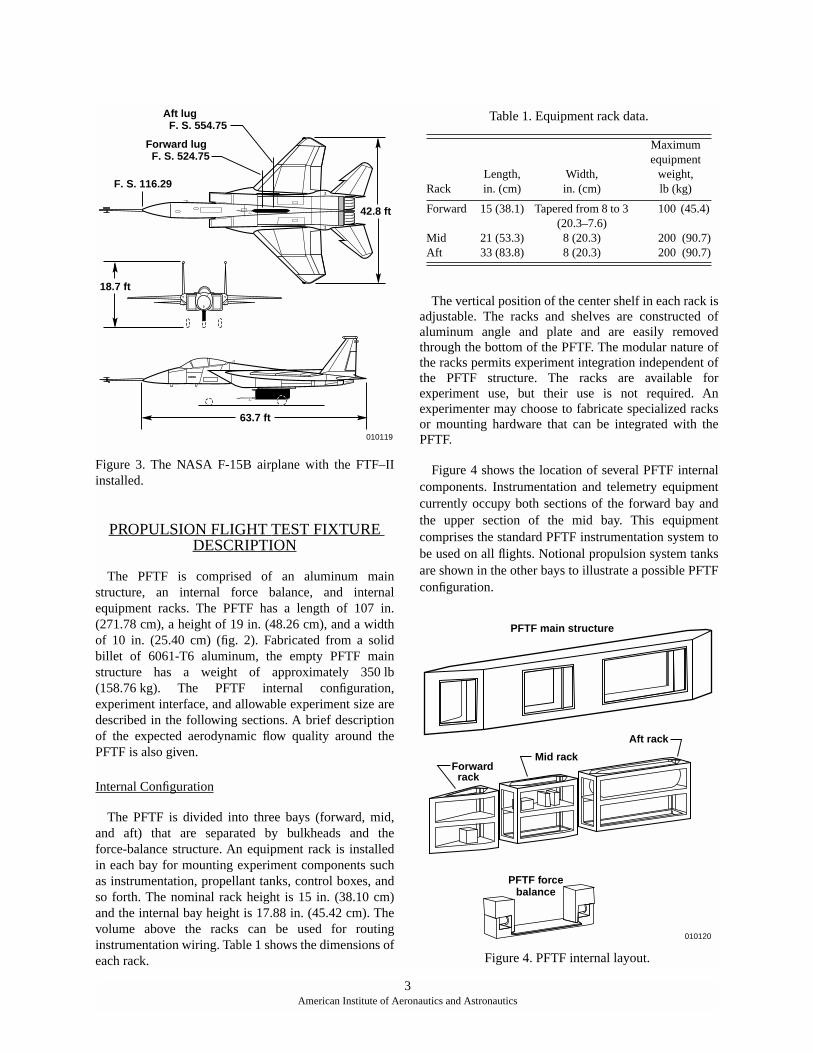
Figure 3. The NASA F-15B airplane with the FTF–IIinstalled.
PROPULSION FLIGHT TEST FIXTURE DESCRIPTION
The PFTF is comprised of an aluminum mainstructure, an internal force balance, and internalequipment racks. The PFTF has a length of 107 in.(271.78 cm), a height of 19 in. (48.26 cm), and a widthof 10 in. (25.40 cm) (fig. 2). Fabricated from a solidbillet of 6061-T6 aluminum, the empty PFTF mainstructure has a weight of approximately 350 lb(158.76 kg). The PFTF internal configuration,experiment interface, and allowable experiment size aredescribed in the following sections. A brief descriptionof the expected aerodynamic flow quality around thePFTF is also given.
Internal Configuration
The PFTF is divided into three bays (forward, mid,and aft) that are separated by bulkheads and theforce-balance structure. An equipment rack is installedin each bay for mounting experiment components suchas instrumentation, propellant tanks, control boxes, andso forth. The nominal rack height is 15 in. (38.10 cm)and the internal bay height is 17.88 in. (45.42 cm). Thevolume above the racks can be used for routinginstrumentation wiring. Table 1 shows the dimensions ofeach rack.
The vertical position of the center shelf in each rack isadjustable. The racks and shelves are constructed ofaluminum angle and plate and are easily removedthrough the bottom of the PFTF. The modular nature ofthe racks permits experiment integration independent ofthe PFTF structure. The racks are available forexperiment use, but their use is not required. Anexperimenter may choose to fabricate specialized racksor mounting hardware that can be integrated with thePFTF.
Figure 4 shows the location of several PFTF internalcomponents. Instrumentation and telemetry equipmentcurrently occupy both sections of the forward bay andthe upper section of the mid bay. This equipmentcomprises the standard PFTF instrumentation system tobe used on all flights. Notional propulsion system tanksare shown in the other bays to illustrate a possible PFTFconfiguration.
42.8 ft
F. S. 116.29
Forward lug F. S. 524.75
Aft lug F. S. 554.75
18.7 ft
63.7 ft
010119
Table 1. Equipment rack data.
RackLength,in. (cm)
Width,in. (cm)
Maximumequipment
weight,lb (kg)
Forward
MidAft
15 (38.1)
21 (53.3)33 (83.8)
Tapered from 8 to 3 (20.3–7.6)8 (20.3)8 (20.3)
100 (45.4)
200 (90.7)200 (90.7)
010120
PFTF forcebalance
PFTF main structure
Forward rack
Mid rack
Aft rack
Figure 4. PFTF internal layout.
3American Institute of Aeronautics and Astronautics
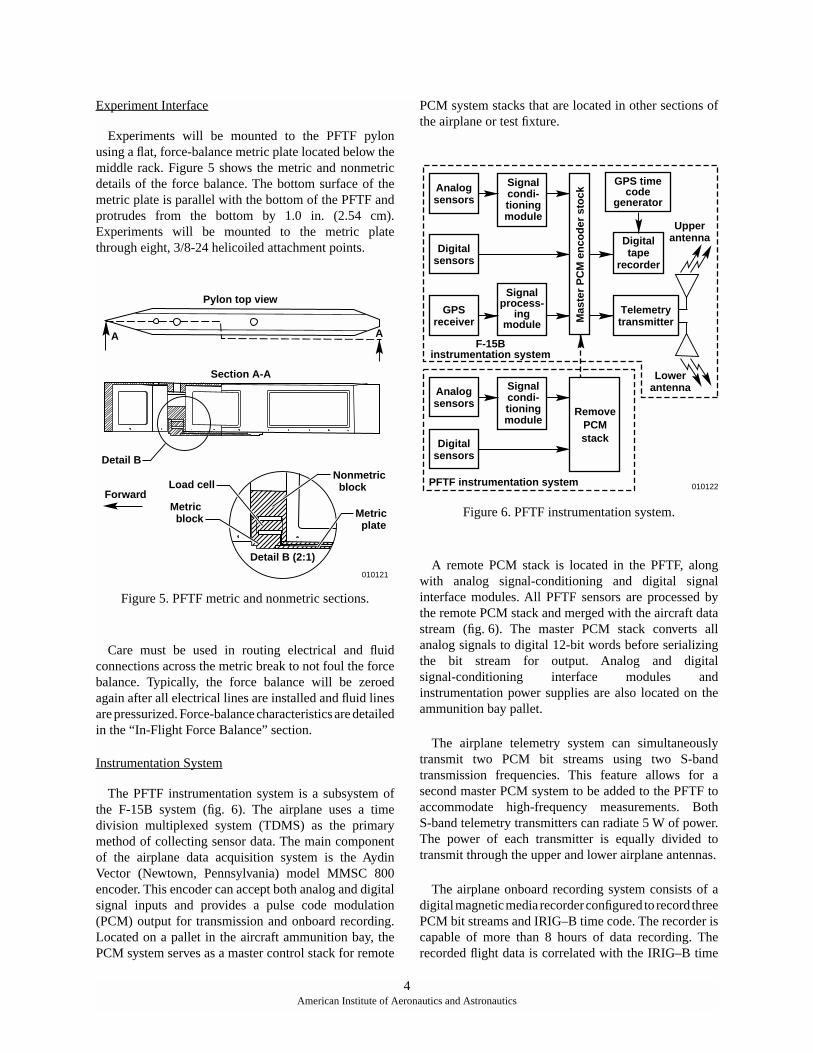
Experiment Interface
Experiments will be mounted to the PFTF pylonusing a flat, force-balance metric plate located below themiddle rack. Figure 5 shows the metric and nonmetricdetails of the force balance. The bottom surface of themetric plate is parallel with the bottom of the PFTF andprotrudes from the bottom by 1.0 in. (2.54 cm).Experiments will be mounted to the metric platethrough eight, 3/8-24 helicoiled attachment points.
Figure 5. PFTF metric and nonmetric sections.
Care must be used in routing electrical and fluidconnections across the metric break to not foul the forcebalance. Typically, the force balance will be zeroedagain after all electrical lines are installed and fluid linesare pressurized. Force-balance characteristics are detailedin the “In-Flight Force Balance” section.
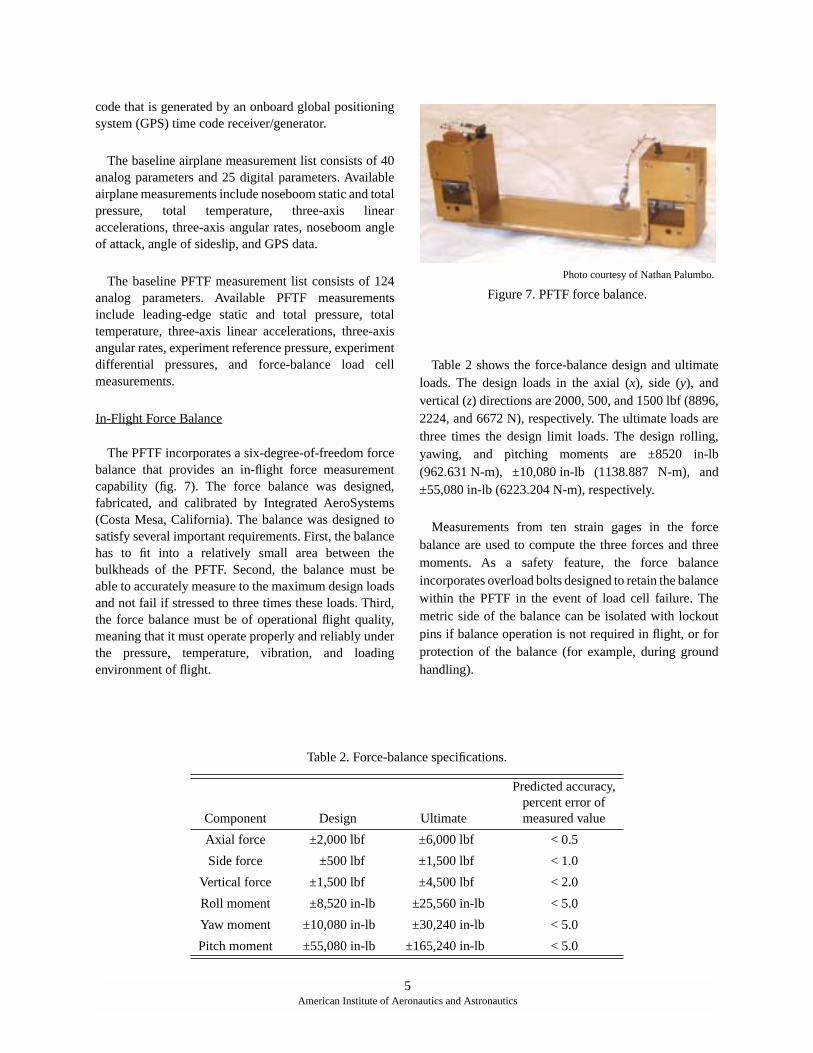
Instrumentation System
The PFTF instrumentation system is a subsystem ofthe F-15B system (fig. 6). The airplane uses a timedivision multiplexed system (TDMS) as the primarymethod of collecting sensor data. The main componentof the airplane data acquisition system is the AydinVector (Newtown, Pennsylvania) model MMSC 800encoder. This encoder can accept both analog and digitalsignal inputs and provides a pulse code modulation(PCM) output for transmission and onboard recording.Located on a pallet in the aircraft ammunition bay, thePCM system serves as a master control stack for remote
PCM system stacks that are located in other sections ofthe airplane or test fixture.
Figure 6. PFTF instrumentation system.
A remote PCM stack is located in the PFTF, alongwith analog signal-conditioning and digital signalinterface modules. All PFTF sensors are processed bythe remote PCM stack and merged with the aircraft datastream (fig. 6). The master PCM stack converts allanalog signals to digital 12-bit words before serializingthe bit stream for output. Analog and digitalsignal-conditioning interface modules andinstrumentation power supplies are also located on theammunition bay pallet.
The airplane telemetry system can simultaneouslytransmit two PCM bit streams using two S-bandtransmission frequencies. This feature allows for asecond master PCM system to be added to the PFTF toaccommodate high-frequency measurements. BothS-band telemetry transmitters can radiate 5 W of power.The power of each transmitter is equally divided totransmit through the upper and lower airplane antennas.
The airplane onboard recording system consists of adigital magnetic media recorder configured to record threePCM bit streams and IRIG–B time code. The recorder iscapable of more than 8 hours of data recording. Therecorded flight data is correlated with the IRIG–B time
Pylon top view
Nonmetric block
010121
Load cell
Metric block
Detail B
Detail B (2:1)
Section A-A
Forward
A A
Metric plate
Analogsensors
Digitalsensors
GPSreceiver M
aste
r P
CM
en
cod
er s
tock
Analogsensors
Signalcondi-tioningmodule
Signalprocess-
ingmodule
F-15Binstrumentation system
PFTF instrumentation system
Telemetrytransmitter
Upperantenna
Lowerantenna
010122
GPS timecode
generator
Digitaltape
recorder
Signalcondi-tioningmodule
Digitalsensors
RemovePCMstack
4American Institute of Aeronautics and Astronautics
code that is generated by an onboard global positioningsystem (GPS) time code receiver/generator.
The baseline airplane measurement list consists of 40analog parameters and 25 digital parameters. Availableairplane measurements include noseboom static and totalpressure, total temperature, three-axis linearaccelerations, three-axis angular rates, noseboom angleof attack, angle of sideslip, and GPS data.
The baseline PFTF measurement list consists of 124analog parameters. Available PFTF measurementsinclude leading-edge static and total pressure, totaltemperature, three-axis linear accelerations, three-axisangular rates, experiment reference pressure, experimentdifferential pressures, and force-balance load cellmeasurements.
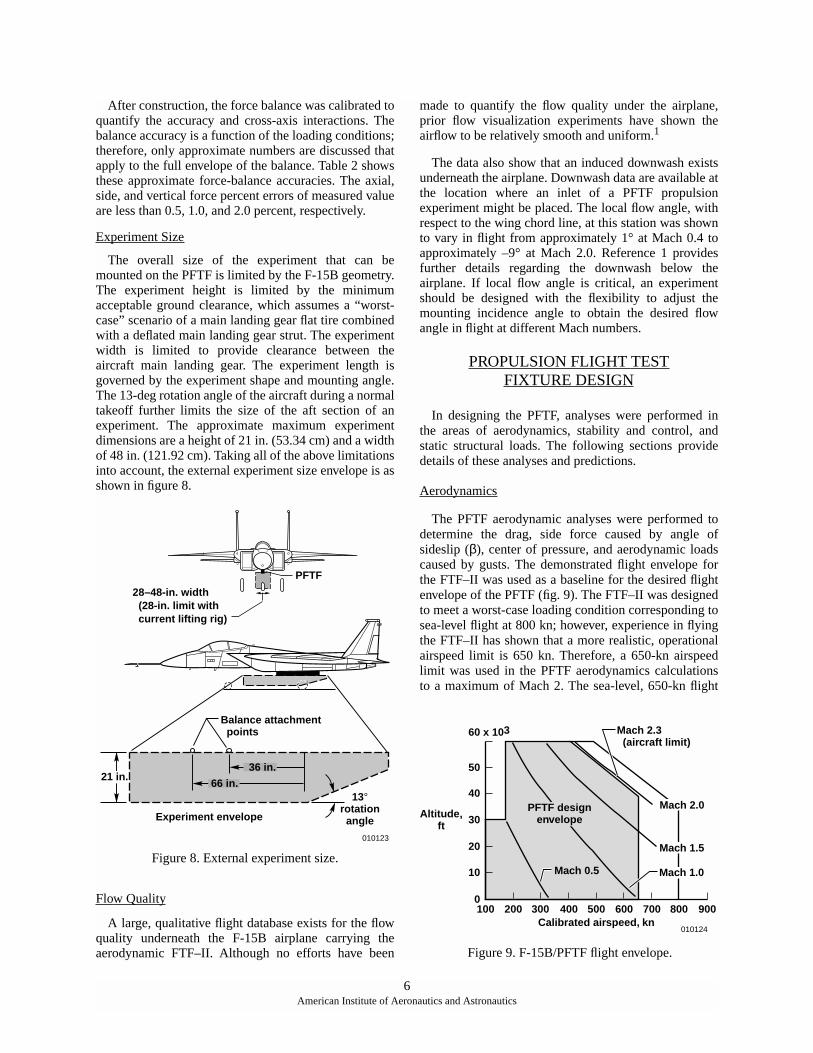
In-Flight Force Balance
The PFTF incorporates a six-degree-of-freedom forcebalance that provides an in-flight force measurementcapability (fig. 7). The force balance was designed,fabricated, and calibrated by Integrated AeroSystems(Costa Mesa, California). The balance was designed tosatisfy several important requirements. First, the balancehas to fit into a relatively small area between thebulkheads of the PFTF. Second, the balance must beable to accurately measure to the maximum design loadsand not fail if stressed to three times these loads. Third,the force balance must be of operational flight quality,meaning that it must operate properly and reliably underthe pressure, temperature, vibration, and loadingenvironment of flight.
Table 2 shows the force-balance design and ultimateloads. The design loads in the axial (x), side (y), andvertical (z) directions are 2000, 500, and 1500 lbf (8896,2224, and 6672 N), respectively. The ultimate loads arethree times the design limit loads. The design rolling,yawing, and pitching moments are ±8520 in-lb(962.631 N-m), ±10,080 in-lb (1138.887 N-m), and±55,080 in-lb (6223.204 N-m), respectively.
Measurements from ten strain gages in the forcebalance are used to compute the three forces and threemoments. As a safety feature, the force balanceincorporates overload bolts designed to retain the balancewithin the PFTF in the event of load cell failure. Themetric side of the balance can be isolated with lockoutpins if balance operation is not required in flight, or forprotection of the balance (for example, during groundhandling).
Photo courtesy of Nathan Palumbo.
Figure 7. PFTF force balance.
5American Institute of Aeronautics and Astronautics
Table 2. Force-balance specifications.
Component Design Ultimate
Predicted accuracy,percent error ofmeasured value
Axial force ±2,000 lbf ±6,000 lbf < 0.5
Side force ±500 lbf ±1,500 lbf < 1.0
Vertical force ±1,500 lbf ±4,500 lbf < 2.0
Roll moment ±8,520 in-lb ±25,560 in-lb < 5.0
Yaw moment ±10,080 in-lb ±30,240 in-lb < 5.0
Pitch moment ±55,080 in-lb ±165,240 in-lb < 5.0
After construction, the force balance was calibrated toquantify the accuracy and cross-axis interactions. Thebalance accuracy is a function of the loading conditions;therefore, only approximate numbers are discussed thatapply to the full envelope of the balance. Table 2 showsthese approximate force-balance accuracies. The axial,side, and vertical force percent errors of measured valueare less than 0.5, 1.0, and 2.0 percent, respectively.
Experiment Size
The overall size of the experiment that can bemounted on the PFTF is limited by the F-15B geometry.The experiment height is limited by the minimumacceptable ground clearance, which assumes a “worst-case” scenario of a main landing gear flat tire combinedwith a deflated main landing gear strut. The experimentwidth is limited to provide clearance between theaircraft main landing gear. The experiment length isgoverned by the experiment shape and mounting angle.The 13-deg rotation angle of the aircraft during a normaltakeoff further limits the size of the aft section of anexperiment. The approximate maximum experimentdimensions are a height of 21 in. (53.34 cm) and a widthof 48 in. (121.92 cm). Taking all of the above limitationsinto account, the external experiment size envelope is asshown in figure 8.
Figure 8. External experiment size.
Flow Quality
A large, qualitative flight database exists for the flowquality underneath the F-15B airplane carrying theaerodynamic FTF–II. Although no efforts have been
made to quantify the flow quality under the airplane,prior flow visualization experiments have shown theairflow to be relatively smooth and uniform.1
The data also show that an induced downwash existsunderneath the airplane. Downwash data are available atthe location where an inlet of a PFTF propulsionexperiment might be placed. The local flow angle, withrespect to the wing chord line, at this station was shownto vary in flight from approximately 1° at Mach 0.4 toapproximately –9° at Mach 2.0. Reference 1 providesfurther details regarding the downwash below theairplane. If local flow angle is critical, an experimentshould be designed with the flexibility to adjust themounting incidence angle to obtain the desired flowangle in flight at different Mach numbers.
PROPULSION FLIGHT TESTFIXTURE DESIGN
In designing the PFTF, analyses were performed inthe areas of aerodynamics, stability and control, andstatic structural loads. The following sections providedetails of these analyses and predictions.
Aerodynamics
The PFTF aerodynamic analyses were performed todetermine the drag, side force caused by angle ofsideslip (β), center of pressure, and aerodynamic loadscaused by gusts. The demonstrated flight envelope forthe FTF–II was used as a baseline for the desired flightenvelope of the PFTF (fig. 9). The FTF–II was designedto meet a worst-case loading condition corresponding tosea-level flight at 800 kn; however, experience in flyingthe FTF–II has shown that a more realistic, operationalairspeed limit is 650 kn. Therefore, a 650-kn airspeedlimit was used in the PFTF aerodynamics calculationsto a maximum of Mach 2. The sea-level, 650-kn flight
21 in.
PFTF
28–48-in. width (28-in. limit with current lifting rig)
Balance attachment points
Experiment envelope
010123
13°rotationangle
66 in.
36 in.
60 x 103
50
40
Altitude,ft
Mach 2.3 (aircraft limit)
Mach 0.5
30
20
10
0200100 300 400 500
Calibrated airspeed, kn700600 800 900
010124
PFTF designenvelope
Mach 2.0
Mach 1.5
Mach 1.0
Figure 9. F-15B/PFTF flight envelope.
6American Institute of Aeronautics and Astronautics
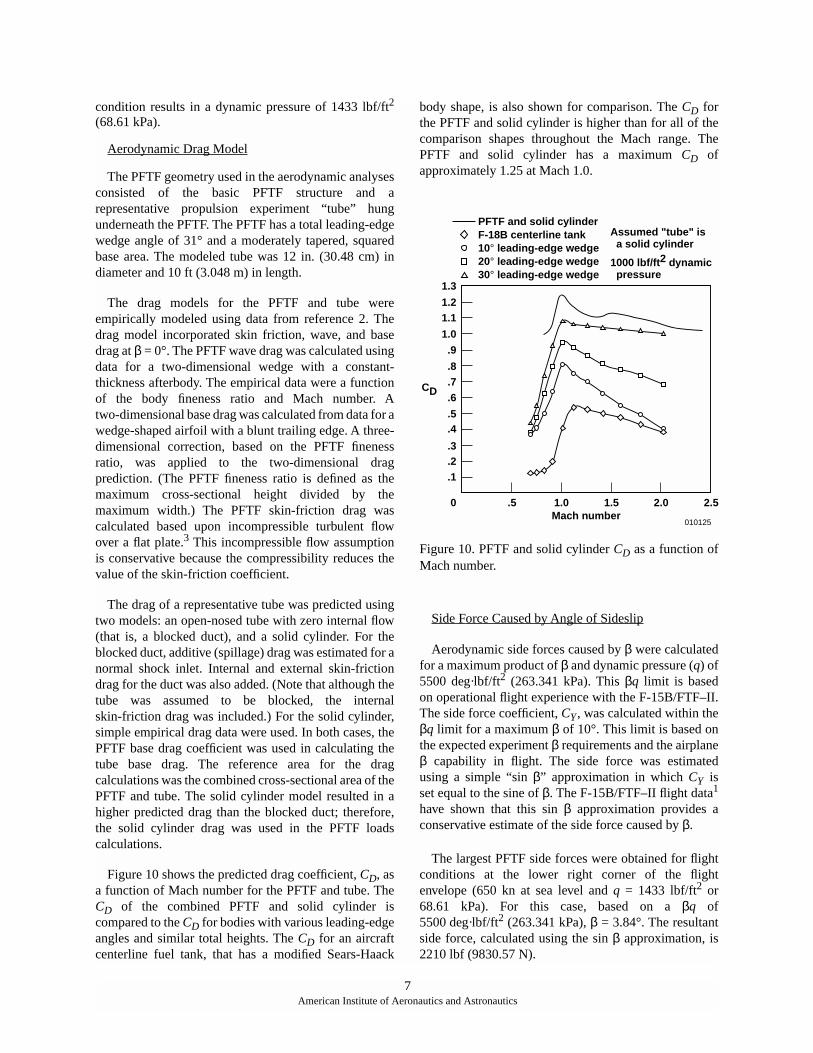
condition results in a dynamic pressure of 1433 lbf/ft2
(68.61 kPa).
Aerodynamic Drag Model
The PFTF geometry used in the aerodynamic analysesconsisted of the basic PFTF structure and arepresentative propulsion experiment “tube” hungunderneath the PFTF. The PFTF has a total leading-edgewedge angle of 31° and a moderately tapered, squaredbase area. The modeled tube was 12 in. (30.48 cm) indiameter and 10 ft (3.048 m) in length.
The drag models for the PFTF and tube wereempirically modeled using data from reference 2. Thedrag model incorporated skin friction, wave, and basedrag at β = 0°. The PFTF wave drag was calculated usingdata for a two-dimensional wedge with a constant-thickness afterbody. The empirical data were a functionof the body fineness ratio and Mach number. Atwo-dimensional base drag was calculated from data for awedge-shaped airfoil with a blunt trailing edge. A three-dimensional correction, based on the PFTF finenessratio, was applied to the two-dimensional dragprediction. (The PFTF fineness ratio is defined as themaximum cross-sectional height divided by themaximum width.) The PFTF skin-friction drag wascalculated based upon incompressible turbulent flowover a flat plate.3 This incompressible flow assumptionis conservative because the compressibility reduces thevalue of the skin-friction coefficient.
The drag of a representative tube was predicted usingtwo models: an open-nosed tube with zero internal flow(that is, a blocked duct), and a solid cylinder. For theblocked duct, additive (spillage) drag was estimated for anormal shock inlet. Internal and external skin-frictiondrag for the duct was also added. (Note that although thetube was assumed to be blocked, the internalskin-friction drag was included.) For the solid cylinder,simple empirical drag data were used. In both cases, thePFTF base drag coefficient was used in calculating thetube base drag. The reference area for the dragcalculations was the combined cross-sectional area of thePFTF and tube. The solid cylinder model resulted in ahigher predicted drag than the blocked duct; therefore,the solid cylinder drag was used in the PFTF loadscalculations.
Figure 10 shows the predicted drag coefficient, CD, asa function of Mach number for the PFTF and tube. TheCD of the combined PFTF and solid cylinder iscompared to the CD for bodies with various leading-edgeangles and similar total heights. The CD for an aircraftcenterline fuel tank, that has a modified Sears-Haack
body shape, is also shown for comparison. The CD forthe PFTF and solid cylinder is higher than for all of thecomparison shapes throughout the Mach range. ThePFTF and solid cylinder has a maximum CD ofapproximately 1.25 at Mach 1.0.
Figure 10. PFTF and solid cylinder CD as a function ofMach number.
Side Force Caused by Angle of Sideslip
Aerodynamic side forces caused by β were calculatedfor a maximum product of β and dynamic pressure (q) of5500 deg·lbf/ft2 (263.341 kPa). This βq limit is basedon operational flight experience with the F-15B/FTF–II.The side force coefficient, CY , was calculated within theβq limit for a maximum β of 10°. This limit is based onthe expected experiment β requirements and the airplaneβ capability in flight. The side force was estimatedusing a simple “sin β” approximation in which CY isset equal to the sine of β. The F-15B/FTF–II flight data1
have shown that this sin β approximation provides aconservative estimate of the side force caused by β.
The largest PFTF side forces were obtained for flightconditions at the lower right corner of the flightenvelope (650 kn at sea level and q = 1433 lbf/ft2 or68.61 kPa). For this case, based on a βq of5500 deg·lbf/ft2 (263.341 kPa), β = 3.84°. The resultantside force, calculated using the sin β approximation, is2210 lbf (9830.57 N).
1.3
1.21.1
1.0
.9
.8
.7
.6CD
.5
.4
.3
.2
.1
0 .5 1.0 1.5Mach number
010125
2.0 2.5
Assumed "tube" is a solid cylinder
1000 lbf/ft2 dynamic pressure
PFTF and solid cylinderF-18B centerline tank10° leading-edge wedge20° leading-edge wedge30° leading-edge wedge
7American Institute of Aeronautics and Astronautics
Aerodynamic Gust Loads
Aerodynamic loads on the PFTF caused by gusts wereinvestigated. At normal flight speeds, the gust loadsgenerally were not significant. The most critical flightcondition for gust loads was at rotation speed for takeoff.At rotation speed, a gust generated the largest change inthe relative β and, therefore, the highest load. TheF-15B aircraft rotates for takeoff at approximately120 kn (203 ft/sec or 61.87 m/sec), so this was theslowest speed at which gust loads were evaluated. Themaximum possible gust factor used in the calculationswas a velocity of 37 ft/sec (11.28 m/sec), based uponflight test experience.
For the 120-kn rotation speed, a 37-ft/sec(11.28 m/sec) gust that impacts the PFTF broadside at anangle of 90° to the free-stream direction results in arelative β of approximately 10.4°. As discussedpreviously, a maximum β of 10° is a reasonable limit forPFTF flight operations. The maximum allowable PFTFside load caused by a gust at takeoff rotation wascalculated to be 204 lbf (907.4 N). This gust load will notappreciably affect the aircraft controllability at takeoff.
Center of Pressure
The center of pressure for the PFTF was notanalytically or empirically determined. Typically, thecenter of pressure for lifting surfaces, such as wings, islocated at approximately the quarter-chord point forsubsonic flight and at the semichord point forsupersonic flight. For the FTF–II, the center of pressuretravel was estimated to be between 15- and 66-percentmean aerodynamic chord. Flight tests have shown thecenter of pressure for the FTF–II has not been fartherback than approximately 50-percent chord. Based uponthe FTF–II results, the center of pressure was estimatedto travel between 15-and 50-percent chord and have auniform pressure distribution along the vertical span ofthe fixture.
Stability and Control
The PFTF is mounted near the F-15B center of gravityand is not expected to cause significant stability andcontrol problems. Because the PFTF is mounted at thesame location as the centerline-mounted external fueltank, the configuration is expected to exhibit similarstability characteristics. To verify this assumption, astability analysis was performed for a representativePFTF geometry. The assumed configuration consisted ofthe PFTF; a 4-ft (1.22-m) long, 10-in. (25.4-cm)diameter, experiment “tube” mounted underneath thePFTF; and an aerodynamic fairing between the tube and
PFTF. The tube had a 30-deg total-angle conical nosetipand a blunt base.
A three-dimensional model of the computational fluiddynamics (CFD) of the PFTF and tube was created forthis configuration to determine aerodynamic forcesgenerated by the PFTF under several flight conditions.The aircraft center of gravity used for the analysis was28-percent mean aerodynamic chord, which correspondedto a fuselage station of 561.7. The computational gridwas created using commercially available software,4
and the solution was obtained using the WIND finite-volume, Navier-Stokes CFD code.5
The computed surface pressures were integrated toobtain the aerodynamic forces. The forces wereconverted to aircraft stability derivative increments andadded to F-15 air-superiority stability derivatives, whichwere used as the baseline configuration to obtain thecomplete F-15B/PFTF stability derivatives. The F-15air-superiority derivatives were obtained from U. S. AirForce flight tests.6 The calculated F-15B/PFTF stabilityderivatives were incorporated into the NASA DrydenF-15 manned flight simulator to examine handlingqualities.
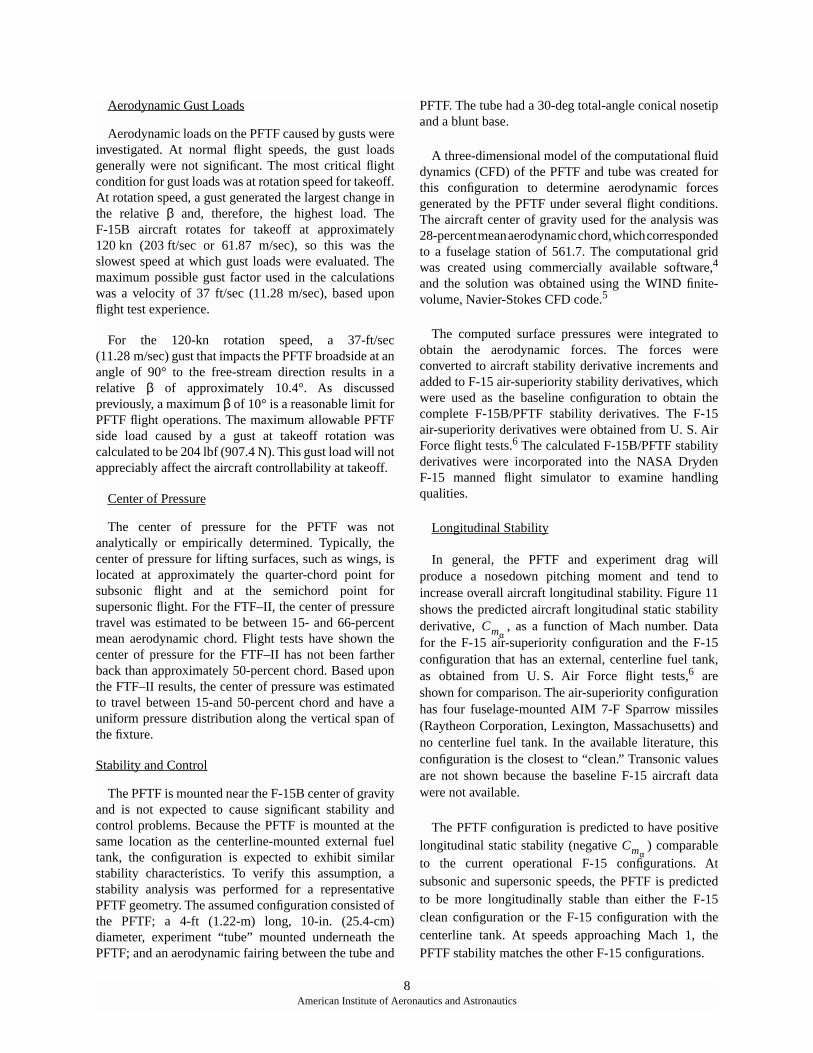
Longitudinal Stability
In general, the PFTF and experiment drag willproduce a nosedown pitching moment and tend toincrease overall aircraft longitudinal stability. Figure 11shows the predicted aircraft longitudinal static stabilityderivative, , as a function of Mach number. Datafor the F-15 air-superiority configuration and the F-15configuration that has an external, centerline fuel tank,as obtained from U. S. Air Force flight tests,6 areshown for comparison. The air-superiority configurationhas four fuselage-mounted AIM 7-F Sparrow missiles(Raytheon Corporation, Lexington, Massachusetts) andno centerline fuel tank. In the available literature, thisconfiguration is the closest to “clean.” Transonic valuesare not shown because the baseline F-15 aircraft datawere not available.
The PFTF configuration is predicted to have positivelongitudinal static stability (negative ) comparableto the current operational F-15 configurations. Atsubsonic and supersonic speeds, the PFTF is predictedto be more longitudinally stable than either the F-15clean configuration or the F-15 configuration with thecenterline tank. At speeds approaching Mach 1, thePFTF stability matches the other F-15 configurations.
Cmα
Cmα
8American Institute of Aeronautics and Astronautics
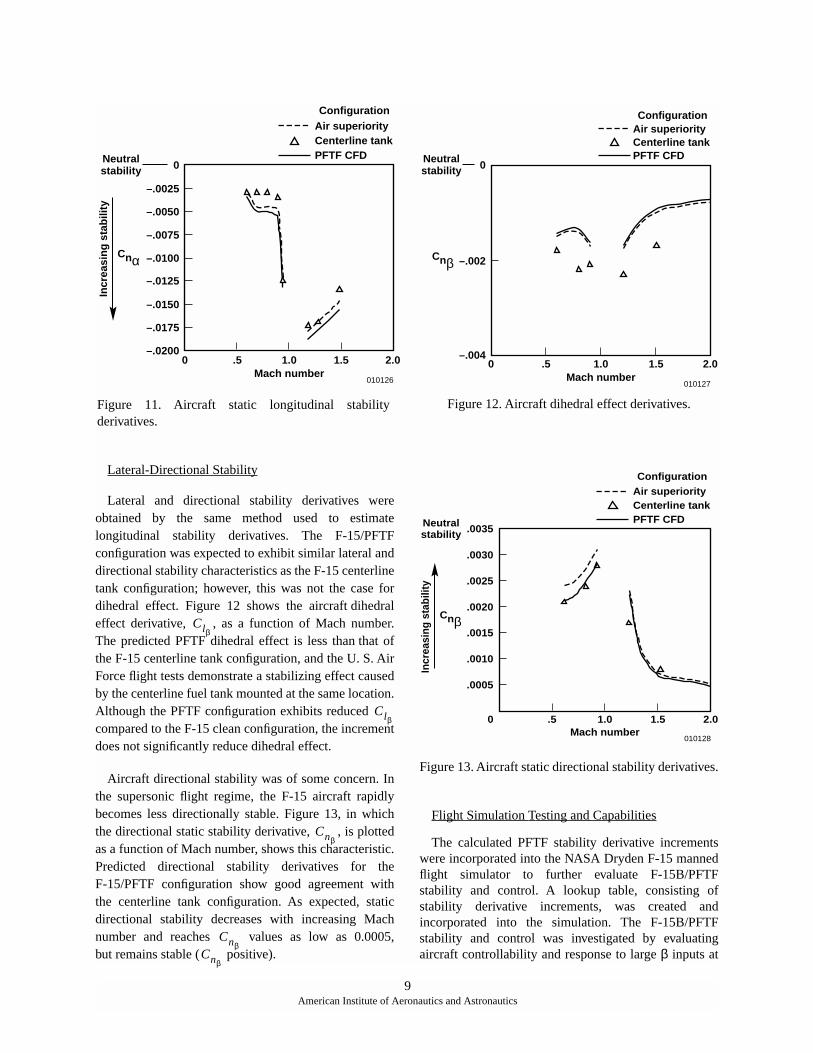
Lateral-Directional Stability
Lateral and directional stability derivatives wereobtained by the same method used to estimatelongitudinal stability derivatives. The F-15/PFTFconfiguration was expected to exhibit similar lateral anddirectional stability characteristics as the F-15 centerlinetank configuration; however, this was not the case fordihedral effect. Figure 12 shows the aircraft dihedraleffect derivative, , as a function of Mach number.The predicted PFTF dihedral effect is less than that ofthe F-15 centerline tank configuration, and the U. S. AirForce flight tests demonstrate a stabilizing effect causedby the centerline fuel tank mounted at the same location.Although the PFTF configuration exhibits reduced compared to the F-15 clean configuration, the incrementdoes not significantly reduce dihedral effect.
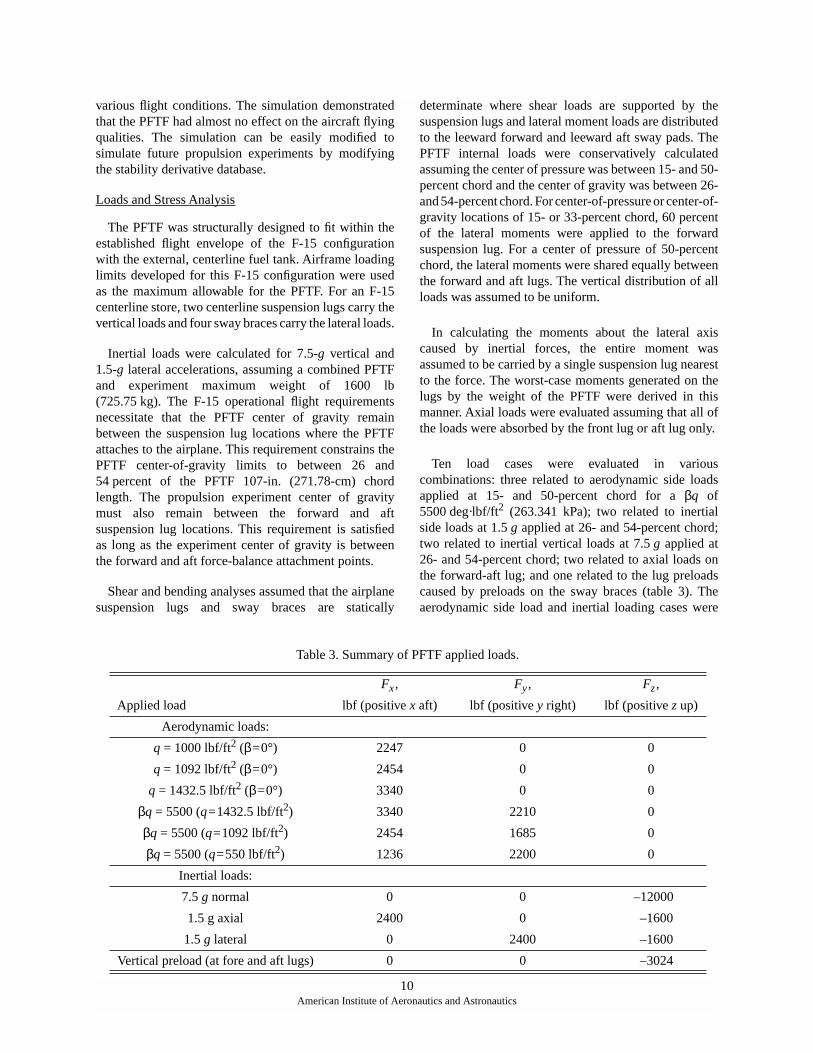
Aircraft directional stability was of some concern. Inthe supersonic flight regime, the F-15 aircraft rapidlybecomes less directionally stable. Figure 13, in whichthe directional static stability derivative, , is plottedas a function of Mach number, shows this characteristic.Predicted directional stability derivatives for theF-15/PFTF configuration show good agreement withthe centerline tank configuration. As expected, staticdirectional stability decreases with increasing Machnumber and reaches values as low as 0.0005,but remains stable ( positive).
Figure 12. Aircraft dihedral effect derivatives.
Figure 13. Aircraft static directional stability derivatives.
Flight Simulation Testing and Capabilities
The calculated PFTF stability derivative incrementswere incorporated into the NASA Dryden F-15 mannedflight simulator to further evaluate F-15B/PFTFstability and control. A lookup table, consisting ofstability derivative increments, was created andincorporated into the simulation. The F-15B/PFTFstability and control was investigated by evaluatingaircraft controllability and response to large β inputs at
0
–.0025
Neutralstability
Air superiorityCenterline tank PFTF CFD
Configuration
–.0050
–.0075
–.0100Cnα–.0125
–.0150
–.0175
0 .5
010126
–.02001.0
Mach number1.5 2.0
Incr
easi
ng
sta
bili
ty
Figure 11. Aircraft static longitudinal stabilityderivatives.
Clβ
Clβ
Cnβ
CnβCnβ
0
–.002
Neutralstability
Air superiorityCenterline tankPFTF CFD
Configuration
Cnβ
0 .5
010127
–.0041.0
Mach number1.5 2.0
Neutralstability
Cnβ
0 .5
010128
1.0Mach number
1.5 2.0
Incr
easi
ng s
tabi
lity
.0030
.0035
.0025
.0020
.0015
.0010
.0005
Air superiorityCenterline tank PFTF CFD
Configuration
9American Institute of Aeronautics and Astronautics
various flight conditions. The simulation demonstratedthat the PFTF had almost no effect on the aircraft flyingqualities. The simulation can be easily modified tosimulate future propulsion experiments by modifyingthe stability derivative database.
Loads and Stress Analysis
The PFTF was structurally designed to fit within theestablished flight envelope of the F-15 configurationwith the external, centerline fuel tank. Airframe loadinglimits developed for this F-15 configuration were usedas the maximum allowable for the PFTF. For an F-15centerline store, two centerline suspension lugs carry thevertical loads and four sway braces carry the lateral loads.
Inertial loads were calculated for 7.5-g vertical and1.5-g lateral accelerations, assuming a combined PFTFand experiment maximum weight of 1600 lb(725.75 kg). The F-15 operational flight requirementsnecessitate that the PFTF center of gravity remainbetween the suspension lug locations where the PFTFattaches to the airplane. This requirement constrains thePFTF center-of-gravity limits to between 26 and54 percent of the PFTF 107-in. (271.78-cm) chordlength. The propulsion experiment center of gravitymust also remain between the forward and aftsuspension lug locations. This requirement is satisfiedas long as the experiment center of gravity is betweenthe forward and aft force-balance attachment points.
Shear and bending analyses assumed that the airplanesuspension lugs and sway braces are statically
determinate where shear loads are supported by thesuspension lugs and lateral moment loads are distributedto the leeward forward and leeward aft sway pads. ThePFTF internal loads were conservatively calculatedassuming the center of pressure was between 15- and 50-percent chord and the center of gravity was between 26-and 54-percent chord. For center-of-pressure or center-of-gravity locations of 15- or 33-percent chord, 60 percentof the lateral moments were applied to the forwardsuspension lug. For a center of pressure of 50-percentchord, the lateral moments were shared equally betweenthe forward and aft lugs. The vertical distribution of allloads was assumed to be uniform.
In calculating the moments about the lateral axiscaused by inertial forces, the entire moment wasassumed to be carried by a single suspension lug nearestto the force. The worst-case moments generated on thelugs by the weight of the PFTF were derived in thismanner. Axial loads were evaluated assuming that all ofthe loads were absorbed by the front lug or aft lug only.
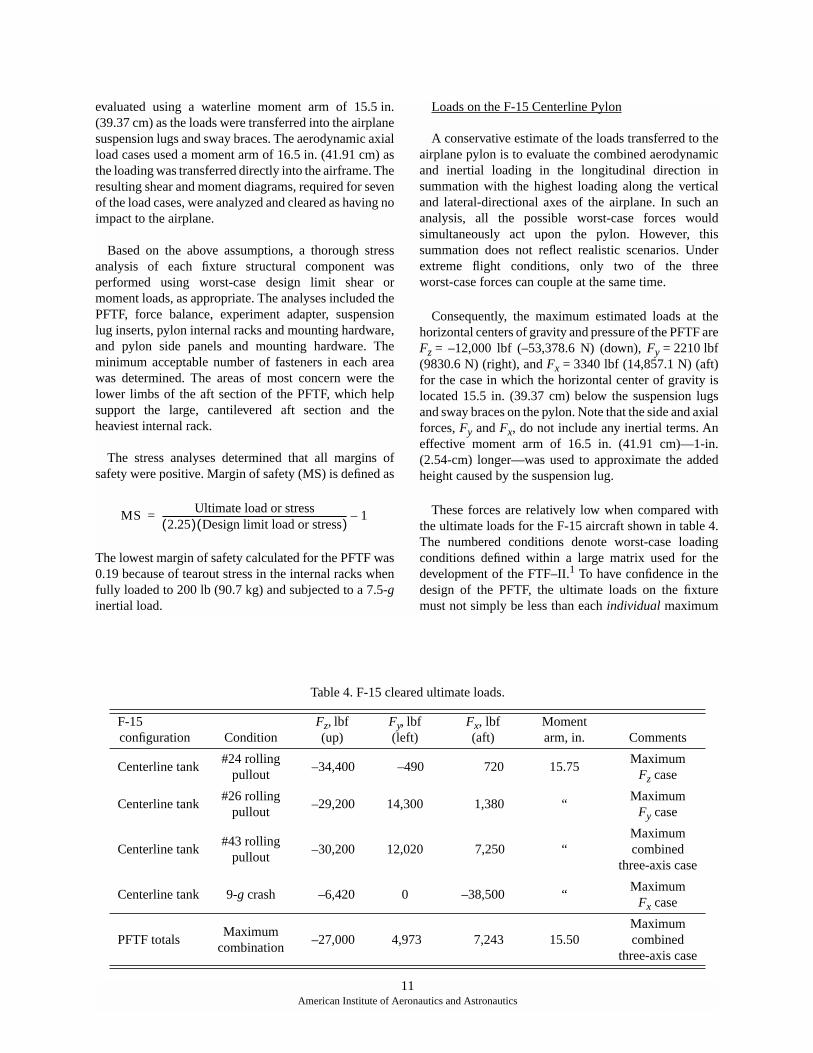
Ten load cases were evaluated in variouscombinations: three related to aerodynamic side loadsapplied at 15- and 50-percent chord for a βq of5500 deg·lbf/ft2 (263.341 kPa); two related to inertialside loads at 1.5 g applied at 26- and 54-percent chord;two related to inertial vertical loads at 7.5 g applied at26- and 54-percent chord; two related to axial loads onthe forward-aft lug; and one related to the lug preloadscaused by preloads on the sway braces (table 3). Theaerodynamic side load and inertial loading cases were
10American Institute of Aeronautics and Astronautics
Table 3. Summary of PFTF applied loads.
Fx, Fy, Fz,
Applied load lbf (positive x aft) lbf (positive y right) lbf (positive z up)
Aerodynamic loads:
q = 1000 lbf/ft2 (β=0°) 2247 0 0
q = 1092 lbf/ft2 (β=0°) 2454 0 0
q = 1432.5 lbf/ft2 (β=0°) 3340 0 0
βq = 5500 (q=1432.5 lbf/ft2) 3340 2210 0
βq = 5500 (q=1092 lbf/ft2) 2454 1685 0
βq = 5500 (q=550 lbf/ft2) 1236 2200 0
Inertial loads:
7.5 g normal 0 0 –12000
1.5 g axial 2400 0 –1600
1.5 g lateral 0 2400 –1600
Vertical preload (at fore and aft lugs) 0 0 –3024
evaluated using a waterline moment arm of 15.5 in.(39.37 cm) as the loads were transferred into the airplanesuspension lugs and sway braces. The aerodynamic axialload cases used a moment arm of 16.5 in. (41.91 cm) asthe loading was transferred directly into the airframe. Theresulting shear and moment diagrams, required for sevenof the load cases, were analyzed and cleared as having noimpact to the airplane.
Based on the above assumptions, a thorough stressanalysis of each fixture structural component wasperformed using worst-case design limit shear ormoment loads, as appropriate. The analyses included thePFTF, force balance, experiment adapter, suspensionlug inserts, pylon internal racks and mounting hardware,and pylon side panels and mounting hardware. Theminimum acceptable number of fasteners in each areawas determined. The areas of most concern were thelower limbs of the aft section of the PFTF, which helpsupport the large, cantilevered aft section and theheaviest internal rack.
The stress analyses determined that all margins ofsafety were positive. Margin of safety (MS) is defined as
The lowest margin of safety calculated for the PFTF was0.19 because of tearout stress in the internal racks whenfully loaded to 200 lb (90.7 kg) and subjected to a 7.5-ginertial load.
Loads on the F-15 Centerline Pylon
A conservative estimate of the loads transferred to theairplane pylon is to evaluate the combined aerodynamicand inertial loading in the longitudinal direction insummation with the highest loading along the verticaland lateral-directional axes of the airplane. In such ananalysis, all the possible worst-case forces wouldsimultaneously act upon the pylon. However, thissummation does not reflect realistic scenarios. Underextreme flight conditions, only two of the threeworst-case forces can couple at the same time.
Consequently, the maximum estimated loads at thehorizontal centers of gravity and pressure of the PFTF areFz = –12,000 lbf (–53,378.6 N) (down), Fy = 2210 lbf(9830.6 N) (right), and Fx = 3340 lbf (14,857.1 N) (aft)for the case in which the horizontal center of gravity islocated 15.5 in. (39.37 cm) below the suspension lugsand sway braces on the pylon. Note that the side and axialforces, Fy and Fx, do not include any inertial terms. Aneffective moment arm of 16.5 in. (41.91 cm)—1-in.(2.54-cm) longer—was used to approximate the addedheight caused by the suspension lug.
These forces are relatively low when compared withthe ultimate loads for the F-15 aircraft shown in table 4.The numbered conditions denote worst-case loadingconditions defined within a large matrix used for thedevelopment of the FTF–II.1 To have confidence in thedesign of the PFTF, the ultimate loads on the fixturemust not simply be less than each individual maximum
MS Ultimate load or stress2.25( ) Design limit load or stress( )
----------------------------------------------------------------------------------- 1–=
11American Institute of Aeronautics and Astronautics
Table 4. F-15 cleared ultimate loads.
F-15configuration Condition
Fz, lbf(up)
Fy, lbf(left)
Fx, lbf(aft)
Moment arm, in. Comments
Centerline tank#24 rolling
pullout–34,400 –490 720 15.75
MaximumFz case
Centerline tank#26 rolling
pullout–29,200 14,300 1,380 “
MaximumFy case
Centerline tank#43 rolling
pullout–30,200 12,020 7,250 “
Maximumcombined
three-axis case
Centerline tank 9-g crash –6,420 0 –38,500 “Maximum
Fx case
PFTF totalsMaximum
combination–27,000 4,973 7,243 15.50
Maximumcombined
three-axis case
on the F-15 configuration that has the centerline tank.Rather, the ultimate loads on the PFTF must be lessthan those incurred by the F-15 airplane for a maximumcombined three-axis loads case. Recall that theaerodynamic and inertial loading cases were evaluatedusing a moment arm of 15.5 in. (39.37 cm) as the loadswere transferred into the sway braces. The dynamicpressure cases use a moment arm of 16.5 in. (41.91 cm)as the loading is transferred directly into the airframe.
PLANNED FLIGHT EXPERIMENTS
Planned PFTF flight experiments are described toprovide insight about experiment design and PFTFflight test. The PFTF envelope expansion flights; flighttests of a simple, normal shock inlet configuration; andthe RBCC flight experiment are discussed.
Envelope Expansion Flights
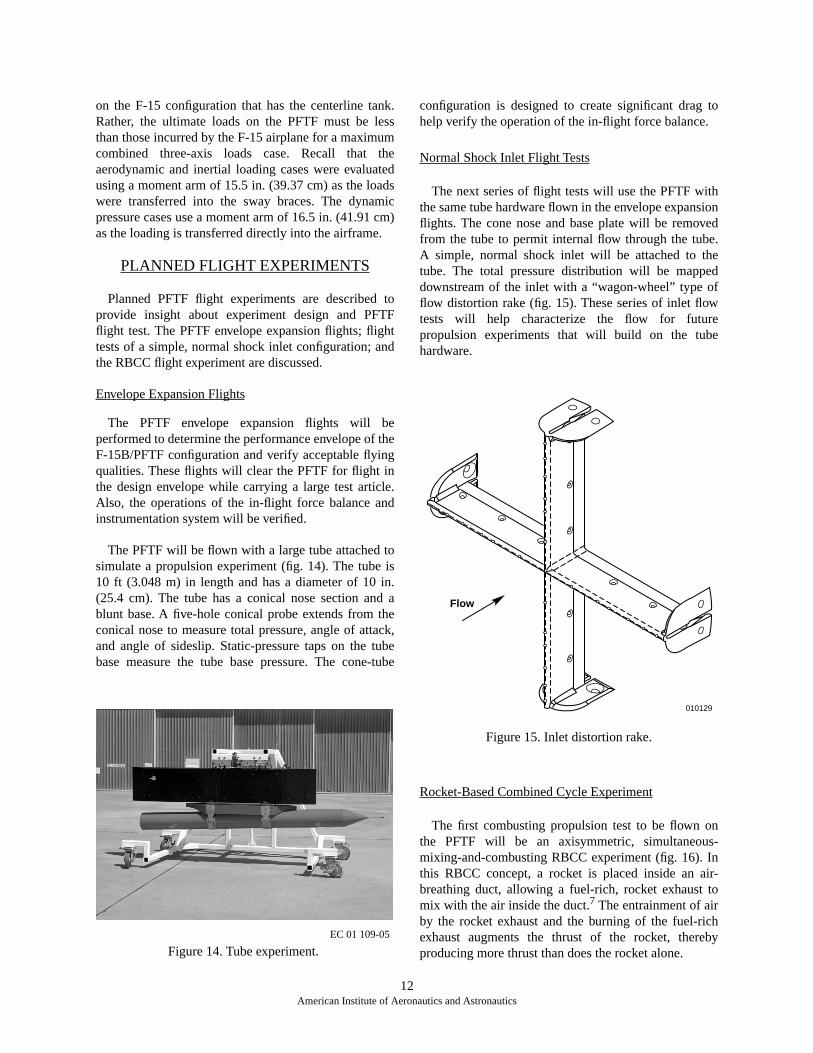
The PFTF envelope expansion flights will beperformed to determine the performance envelope of theF-15B/PFTF configuration and verify acceptable flyingqualities. These flights will clear the PFTF for flight inthe design envelope while carrying a large test article.Also, the operations of the in-flight force balance andinstrumentation system will be verified.
The PFTF will be flown with a large tube attached tosimulate a propulsion experiment (fig. 14). The tube is10 ft (3.048 m) in length and has a diameter of 10 in.(25.4 cm). The tube has a conical nose section and ablunt base. A five-hole conical probe extends from theconical nose to measure total pressure, angle of attack,and angle of sideslip. Static-pressure taps on the tubebase measure the tube base pressure. The cone-tube
configuration is designed to create significant drag tohelp verify the operation of the in-flight force balance.
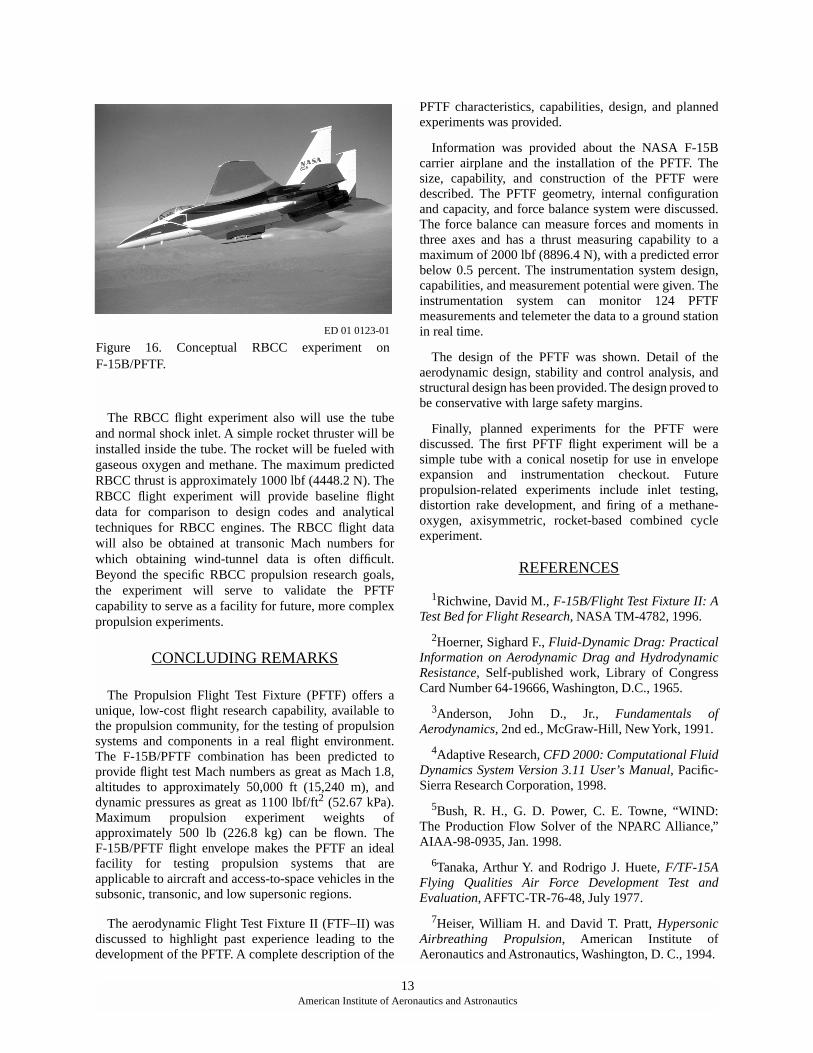
Normal Shock Inlet Flight Tests
The next series of flight tests will use the PFTF withthe same tube hardware flown in the envelope expansionflights. The cone nose and base plate will be removedfrom the tube to permit internal flow through the tube.A simple, normal shock inlet will be attached to thetube. The total pressure distribution will be mappeddownstream of the inlet with a “wagon-wheel” type offlow distortion rake (fig. 15). These series of inlet flowtests will help characterize the flow for futurepropulsion experiments that will build on the tubehardware.
Figure 15. Inlet distortion rake.
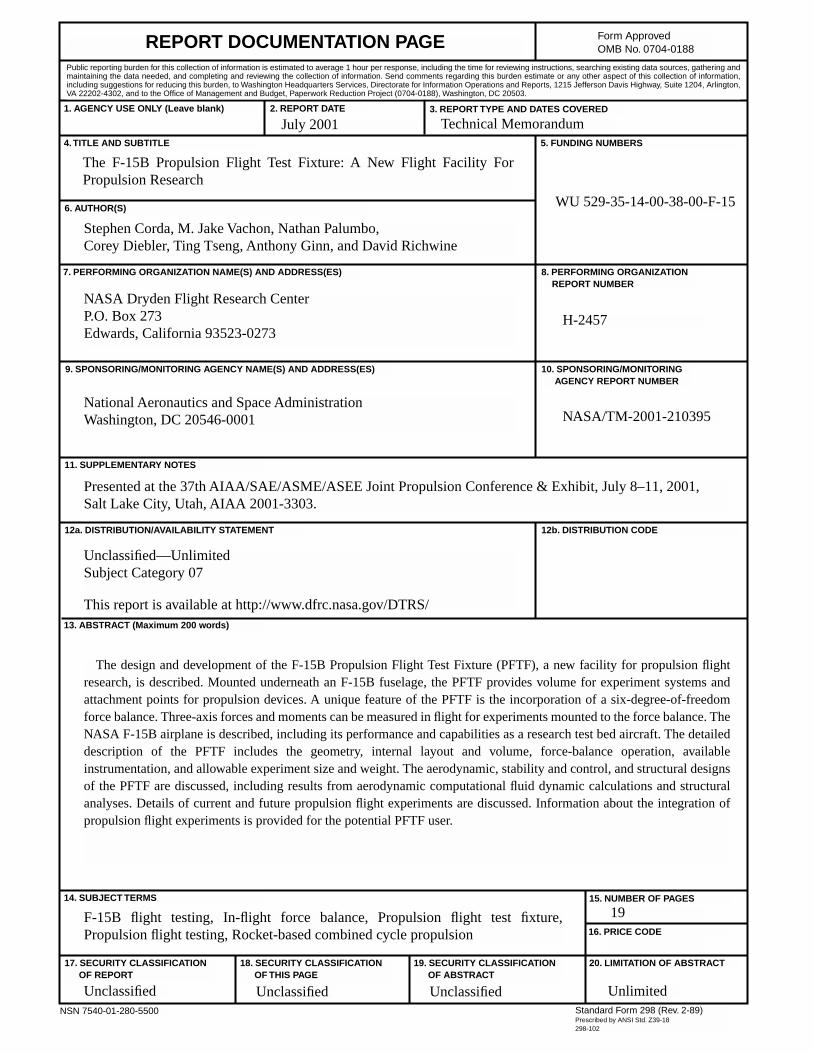
Rocket-Based Combined Cycle Experiment
The first combusting propulsion test to be flown onthe PFTF will be an axisymmetric, simultaneous-mixing-and-combusting RBCC experiment (fig. 16). Inthis RBCC concept, a rocket is placed inside an air-breathing duct, allowing a fuel-rich, rocket exhaust tomix with the air inside the duct.7 The entrainment of airby the rocket exhaust and the burning of the fuel-richexhaust augments the thrust of the rocket, therebyproducing more thrust than does the rocket alone.
EC 01 109-05
Figure 14. Tube experiment.
010129
Flow
12American Institute of Aeronautics and Astronautics
The RBCC flight experiment also will use the tubeand normal shock inlet. A simple rocket thruster will beinstalled inside the tube. The rocket will be fueled withgaseous oxygen and methane. The maximum predictedRBCC thrust is approximately 1000 lbf (4448.2 N). TheRBCC flight experiment will provide baseline flightdata for comparison to design codes and analyticaltechniques for RBCC engines. The RBCC flight datawill also be obtained at transonic Mach numbers forwhich obtaining wind-tunnel data is often difficult.Beyond the specific RBCC propulsion research goals,the experiment will serve to validate the PFTFcapability to serve as a facility for future, more complexpropulsion experiments.
CONCLUDING REMARKS
The Propulsion Flight Test Fixture (PFTF) offers aunique, low-cost flight research capability, available tothe propulsion community, for the testing of propulsionsystems and components in a real flight environment.The F-15B/PFTF combination has been predicted toprovide flight test Mach numbers as great as Mach 1.8,altitudes to approximately 50,000 ft (15,240 m), anddynamic pressures as great as 1100 lbf/ft2 (52.67 kPa).Maximum propulsion experiment weights ofapproximately 500 lb (226.8 kg) can be flown. TheF-15B/PFTF flight envelope makes the PFTF an idealfacility for testing propulsion systems that areapplicable to aircraft and access-to-space vehicles in thesubsonic, transonic, and low supersonic regions.
The aerodynamic Flight Test Fixture II (FTF–II) wasdiscussed to highlight past experience leading to thedevelopment of the PFTF. A complete description of the
PFTF characteristics, capabilities, design, and plannedexperiments was provided.
Information was provided about the NASA F-15Bcarrier airplane and the installation of the PFTF. Thesize, capability, and construction of the PFTF weredescribed. The PFTF geometry, internal configurationand capacity, and force balance system were discussed.The force balance can measure forces and moments inthree axes and has a thrust measuring capability to amaximum of 2000 lbf (8896.4 N), with a predicted errorbelow 0.5 percent. The instrumentation system design,capabilities, and measurement potential were given. Theinstrumentation system can monitor 124 PFTFmeasurements and telemeter the data to a ground stationin real time.
The design of the PFTF was shown. Detail of theaerodynamic design, stability and control analysis, andstructural design has been provided. The design proved tobe conservative with large safety margins.
Finally, planned experiments for the PFTF werediscussed. The first PFTF flight experiment will be asimple tube with a conical nosetip for use in envelopeexpansion and instrumentation checkout. Futurepropulsion-related experiments include inlet testing,distortion rake development, and firing of a methane-oxygen, axisymmetric, rocket-based combined cycleexperiment.
REFERENCES
1Richwine, David M., F-15B/Flight Test Fixture II: ATest Bed for Flight Research, NASA TM-4782, 1996.
2Hoerner, Sighard F., Fluid-Dynamic Drag: PracticalInformation on Aerodynamic Drag and HydrodynamicResistance, Self-published work, Library of CongressCard Number 64-19666, Washington, D.C., 1965.
3Anderson, John D., Jr., Fundamentals ofAerodynamics, 2nd ed., McGraw-Hill, New York, 1991.
4Adaptive Research, CFD 2000: Computational FluidDynamics System Version 3.11 User’s Manual, Pacific-Sierra Research Corporation, 1998.
5Bush, R. H., G. D. Power, C. E. Towne, “WIND:The Production Flow Solver of the NPARC Alliance,”AIAA-98-0935, Jan. 1998.
6Tanaka, Arthur Y. and Rodrigo J. Huete, F/TF-15AFlying Qualities Air Force Development Test andEvaluation, AFFTC-TR-76-48, July 1977.
7Heiser, William H. and David T. Pratt, HypersonicAirbreathing Propulsion, American Institute ofAeronautics and Astronautics, Washington, D. C., 1994.
ED 01 0123-01
Figure 16. Conceptual RBCC experiment onF-15B/PFTF.
13American Institute of Aeronautics and Astronautics
REPORT DOCUMENTATION PAGE Form ApprovedOMB No. 0704-0188
Public reporting burden for this collection of information is estimated to average 1 hour per response, including the time for reviewing instructions, searching existing data sources, gathering andmaintaining the data needed, and completing and reviewing the collection of information. Send comments regarding this burden estimate or any other aspect of this collection of information,including suggestions for reducing this burden, to Washington Headquarters Services, Directorate for Information Operations and Reports, 1215 Jefferson Davis Highway, Suite 1204, Arlington,VA 22202-4302, and to the Office of Management and Budget, Paperwork Reduction Project (0704-0188), Washington, DC 20503.
1. AGENCY USE ONLY (Leave blank) 2. REPORT DATE 3. REPORT TYPE AND DATES COVERED
4. TITLE AND SUBTITLE 5. FUNDING NUMBERS
6. AUTHOR(S)
8. PERFORMING ORGANIZATION REPORT NUMBER
7. PERFORMING ORGANIZATION NAME(S) AND ADDRESS(ES)
9. SPONSORING/MONITORING AGENCY NAME(S) AND ADDRESS(ES) 10. SPONSORING/MONITORING AGENCY REPORT NUMBER
11. SUPPLEMENTARY NOTES
12a. DISTRIBUTION/AVAILABILITY STATEMENT 12b. DISTRIBUTION CODE
13. ABSTRACT (Maximum 200 words)
14. SUBJECT TERMS 15. NUMBER OF PAGES
16. PRICE CODE
17. SECURITY CLASSIFICATION OF REPORT
18. SECURITY CLASSIFICATION OF THIS PAGE
19. SECURITY CLASSIFICATION OF ABSTRACT
20. LIMITATION OF ABSTRACT
NSN 7540-01-280-5500 Standard Form 298 (Rev. 2-89)Prescribed by ANSI Std. Z39-18298-102
The F-15B Propulsion Flight Test Fixture: A New Flight Facility ForPropulsion Research
WU 529-35-14-00-38-00-F-15
Stephen Corda, M. Jake Vachon, Nathan Palumbo,Corey Diebler, Ting Tseng, Anthony Ginn, and David Richwine
NASA Dryden Flight Research CenterP.O. Box 273Edwards, California 93523-0273
H-2457
National Aeronautics and Space AdministrationWashington, DC 20546-0001 NASA/TM-2001-210395
The design and development of the F-15B Propulsion Flight Test Fixture (PFTF), a new facility for propulsion flightresearch, is described. Mounted underneath an F-15B fuselage, the PFTF provides volume for experiment systems andattachment points for propulsion devices. A unique feature of the PFTF is the incorporation of a six-degree-of-freedomforce balance. Three-axis forces and moments can be measured in flight for experiments mounted to the force balance. TheNASA F-15B airplane is described, including its performance and capabilities as a research test bed aircraft. The detaileddescription of the PFTF includes the geometry, internal layout and volume, force-balance operation, availableinstrumentation, and allowable experiment size and weight. The aerodynamic, stability and control, and structural designsof the PFTF are discussed, including results from aerodynamic computational fluid dynamic calculations and structuralanalyses. Details of current and future propulsion flight experiments are discussed. Information about the integration ofpropulsion flight experiments is provided for the potential PFTF user.
F-15B flight testing, In-flight force balance, Propulsion flight test fixture,Propulsion flight testing, Rocket-based combined cycle propulsion
19
Unclassified Unclassified Unclassified Unlimited
July 2001 Technical Memorandum
Presented at the 37th AIAA/SAE/ASME/ASEE Joint Propulsion Conference & Exhibit, July 8–11, 2001,Salt Lake City, Utah, AIAA 2001-3303.
Unclassified—UnlimitedSubject Category 07
This report is available at http://www.dfrc.nasa.gov/DTRS/