Embed Size (px)
Citation preview

Team 4B – Test Fixture for Flight Components
(Willy)
Final Report
Abdulaziz Alzaid
Shanna Lechelt
Israel Sotelo
Alexandra Spotts
December 7, 2018
Department of Mechanical Engineering Northern Arizona University
Flagstaff, AZ 86001
Project Mentor: Chuck Vallance
Instructors: Sarah Oman and David Willy

i
DISCLAIMER
This report was prepared by students as part of a university course requirement. While considerable effort
has been put into the project, it is not the work of licensed engineers and has not undergone the extensive
verification that is common in the profession. The information, data, conclusions, and content of this
report should not be relied on or utilized without thorough, independent testing and verification.
University faculty members may have been associated with this project as advisors, sponsors, or course
instructors, but as such they are not responsible for the accuracy of results or conclusions.

ii
EXECUTIVE SUMMARY
The team was tasked with the responsibility of either redesigning or creating an original concept of a
universal test fixture capable of testing a variety of missile flight components, such as radomes and
leading edges, while withstanding simultaneous thermal and mechanical loading. The project's mentor
and client, Chuck Vallance, is a former Raytheon employee with expertise in missile testing and its
procedure. Chuck has conveyed to the team that current missile component test fixtures require a large
time allocation for set up and take down of this testing environment, in addition to a significant number of
workers to complete these tasks. The outcome of this project is to design a test fixture that addresses these
inefficiencies while satisfying all other customer and engineering requirements.
Once customer and engineering requirements were decided upon, the team started brainstorming designs
and benchmarking based on the functional and black box model. Although many of the test fixtures that
were benchmarked are not of the same nature as the test fixture, they all provided valuable information.
The benchmarking process helped the team determine what should be included in the fixture’s final
design and what should be left out.
Originally, the team was only able to design for mechanical and thermal loading as the primary
subsystems, but as the calculations became more thorough, the team was able to create a complete test
fixture. A decision matrix was used and evaluated to determine the full fixture designs.
The first system level design iteration was only suited for radomes, but incorporated a square, universal
mounting plate fit for radomes up to three feet (ft.) in diameter. The fitted plate, which connects to the
radome attachment ring, is fastened to the fixture with 24 individual screws that line the perimeter of the
fitted plate. The radome mounting plate combined unit is fixed and held in place for testing on either side
by symmetrical, “A” shaped side components, which are firmly mounted to the floor. To induce the
thermal loading required to achieve the necessary temperatures and heat fluxes of actual missile flight, the
team will surround the radome with six to eight radiant, quartz heat lamps. Finally, to apply the prescribed
mechanical load to the radome, the team has designed an attachment to the end of a hydraulic ram that
will cradle the radome as it pushes it into an upwards compression.
After consulting Chuck about the design, he provided the team with insight into which aspects of the test
fixture design were plausible, and which components were unrealistic. Although presently the design is
heavy and is largely dimensioned, it is robust, has a limited number of parts, and is simple to assemble,
transport, and store. The first iteration of heat flux, mechanical loading, beam, and bolt calculations
helped inform the final design for the semester, and with each subsequent iteration, the specifications of
the design will become more detailed, as will the bill of materials.
iii
ACKNOWLEDGEMENTS
The team would like to extend thanks to those that supported us throughout this project. We’d like to
thank our client and mentor, Chuck Vallance, for always giving us advice and guiding us through the
design process and our analyses. We’d also like to thank our capstone professors, Dr. Sarah Oman and
David Willy, for providing feedback and encouraging us to continuously improve our design. We’d also
like to thank our capstone teaching assistant, Amy Swartz, for providing insight and feedback on all our
assignments. Thanks to Brandon Lurie, who provided expertise and answered questions regarding our
ANSYS analyses. Lastly, we’d like to thank the NAU Mechanical Engineering Department for providing
the funding that made this project possible.

iv
TABLE OF CONTENTS
Contents DISCLAIMER .............................................................................................................................................. 1 EXECUTIVE SUMMARY ........................................................................................................................... 2 ACKNOWLEDGEMENTS .......................................................................................................................... 3 TABLE OF CONTENTS .............................................................................................................................. 4 1 BACKGROUND ................................................................................................................................ 1
1.1 Introduction .............................................................................................................................. 1 1.2 Project Description ................................................................................................................... 1 1.3 Original System ........................................................................................................................ 1
1.3.1 Original System Structure ........................................................................................... 1 1.3.2 Original System Operation .......................................................................................... 2 1.3.3 Original System Performance ..................................................................................... 2 1.3.4 Original System Deficiencies ...................................................................................... 2
2 REQUIREMENTS ............................................................................................................................. 3 2.1 Customer Requirements (CRs) ................................................................................................. 3 2.2 Engineering Requirements (ERs) ............................................................................................. 3 2.3 Testing Procedures (TPs) .......................................................................................................... 4
2.3.1 Quick Transportation Test ........................................................................................... 4 2.3.2 Quick Assembly Test ................................................................................................... 4 2.3.3 Standard Bolt Test ....................................................................................................... 5 2.3.4 Extreme Loading Test ................................................................................................. 5 2.3.5 Extreme Temperature Test........................................................................................... 5 2.3.6 Part Size Test ............................................................................................................... 5 2.3.7 Safety Factor Test ........................................................................................................ 6 2.3.8 Sensor Test .................................................................................................................. 6 2.3.9 Power Test ................................................................................................................... 6 2.3.10 Storage Test.................................................................................................................... 6
2.4 House of Quality (HoQ) ........................................................................................................... 6 3 EXISTING DESIGNS ........................................................................................................................ 7
3.1 Design Research ....................................................................................................................... 7 3.2 System Level ............................................................................................................................ 7
3.2.1 Existing Design #1: Gulfstream Aerospace Test Fixture ............................................ 7 3.2.2 Existing Design #2: Pyroceram Radome Thermal Testing ......................................... 8 3.2.3 Existing Design #3: NASA Aerostructures Test Wing (ATW) .................................... 8
3.3 Functional Decomposition ........................................................................................................ 9 3.3.1 Black Box Model ........................................................................................................ 9 3.3.2 Functional Model ...................................................................................................... 10
3.4 Subsystem Level ..................................................................................................................... 10 3.4.1 Subsystem #1: Thermal load ..................................................................................... 11
3.4.1.1 Existing Design #1: Pyroceram Radome Thermal Testing .......................... 11 3.4.1.2 Existing Design #2: Combined Loads Test Fixture ........................................ 11 3.4.1.2 Existing Design #3: A Test Fixture for Measuring High-Temperature Hypersonic-
Engine Seal Performance.............................................................................................. 11 3.4.2 Subsystem #2: Mechanical Load .............................................................................. 11
3.4.2.1 Existing Design #1: Gulfstream Aerospace Test Fixture ............................. 11 3.4.2.2 Existing Design #2: Combined Loads Test Fixture...................................... 11

v
3.4.2.3 Existing Design #3: NASA’s Armstrong Flight Research Center .................. 11 3.4.3 Subsystem #3: Beams ............................................................................................... 12
3.4.3.1 Existing Design #1: Gulfstream Aerospace Test Fixture ............................. 12 3.4.3.2 Existing Design #2: HDT Global ................................................................. 12 3.4.3.3 Existing Design #3: Hybrid Composite Beams ........................................... 12
4 DESIGNS CONSIDERED ............................................................................................................... 13 4.1 Thermal Loading .................................................................................................................... 13
4.1.1 Design #1: Oven........................................................................................................ 13 4.1.2 Design #2: Heat Coils ............................................................................................... 13 4.1.3 Design #3: Fixture ..................................................................................................... 13 4.1.4 Design #4: Fluid ....................................................................................................... 14
4.2 Mechanical Loading ............................................................................................................... 14 4.2.1 Design #5: Rings ...................................................................................................... 14 4.2.2 Design #6: Cradle...................................................................................................... 14
4.3 Test Fixture ............................................................................................................................. 15 4.3.1 Design #7: Rail.......................................................................................................... 15 4.3.2 Design #8: Turntable ................................................................................................. 15 4.3.3 Design #9: Upright .................................................................................................... 15
5 DESIGN SELECTED – First Semester ............................................................................................ 17 5.1 Rationale for Design Selection ............................................................................................... 17 5.2 Design Description ................................................................................................................. 19
5.2.1 Design Description .................................................................................................... 19 5.2.2 Thermal Loading Calculations .................................................................................. 21 5.2.3 Mechanical Loading Calculations ............................................................................. 21 5.2.4 Bolt Calculations ....................................................................................................... 22 5.2.5 Beam Calculations .................................................................................................... 22 5.2.6 Proof of Concept Prototype ....................................................................................... 23
6 PROPOSED DESIGN – First Semester ........................................................................................... 24 6.1 Description of Implementation Plan ....................................................................................... 24 6.2 Resources Needed .................................................................................................................. 24 6.3 Implementation, Scheduling, and Budget ............................................................................... 24 6.4 Design Model ......................................................................................................................... 25
7 IMPLEMENTATION – Second Semester ........................................................................................ 27 7.1 Scheduling .............................................................................................................................. 27 7.2 Manufacturing ........................................................................................................................ 27
7.2.1 Proof of Concept Prototype ....................................................................................... 27 7.2.2 Hypothetical Manufacturing ..................................................................................... 28
7.3 Analyses ................................................................................................................................. 29 7.3.1 Temperature Distribution Analyses ........................................................................... 29 7.3.2 Heat Flux Distribution Analysis ................................................................................ 30 7.3.3 Second Iteration Heat Flux Distribution – lexie ....................................................... 31 7.3.4 Second Iteration Compressible Flow ........................................................................ 32 7.3.5 Second Iteration Beams ............................................................................................ 35 7.3.6 Second Iteration Floor Bolts ..................................................................................... 36 7.3.7 Quartz Lamp Requirements ...................................................................................... 37
7.4 Design Changes ...................................................................................................................... 38 7.4.1 Quartz Lamps ............................................................................................................ 38 7.4.2 Beams ........................................................................................................................ 38 7.4.3 Floor and AMRAAM Mounting Plate ...................................................................... 39 7.4.4 Control Panel ............................................................................................................ 39 7.4.5 Final Design .............................................................................................................. 39

vi
8 Testing .............................................................................................................................................. 40 8.1 Introduction ............................................................................................................................ 40 8.2 Assembles Quickly (Time Study) ........................................................................................... 41 8.3 Transports Quickly from Storage ........................................................................................... 41 8.4 Mounts to Standard Bolt Pattern ............................................................................................ 41 8.5 Applies and Withstands Extreme Loads (Plate Stress) ........................................................... 42
8.5.1 Plate Stress First Iteration ......................................................................................... 42 8.5.2 Plate Stress Second Iteration ..................................................................................... 43
8.6 Applies and Withstands Heat Flux ......................................................................................... 45 8.7 Ability to Test Parts of All Sizes ............................................................................................. 45 8.8 Safety Factor ........................................................................................................................... 46 8.9 Sensors .................................................................................................................................... 46 8.10 Load Driven from Alternate Location ................................................................................ 46 8.11 Small Storage Space........................................................................................................... 47 8.12 Thermal Expansion in the Bolts ......................................................................................... 47
9 CONCLUSIONS .............................................................................................................................. 48 9.1 Contributions to Project Success ............................................................................................ 48 9.2 Opportunities for Improvement .............................................................................................. 49
10 REFERENCES ................................................................................................................................. 51 11 APPENDICES .................................................................................................................................. 52
11.1 Appendix A: House of Quality ........................................................................................... 52 11.2 Appendix B: Bill of Materials ............................................................................................ 52 11.3 Appendix C: CAD Models ................................................................................................. 53
1
1 BACKGROUND
1.1 Introduction
The team has been presented with the task of creating a universal test fixture for missile flight
components such as radomes and leading edges in high-temperature and high-pressure flight conditions.
The final design must have a quick assembly and take down time, with minimal time delay between each
step in the process. The team’s client and sponsor, Chuck Vallance, is a former Raytheon employee who
has requested the team to make changes to the current testing environment either by improving upon the
currently existing design or by a redesign using an original concept to increase the efficiency of the
testing process. This project is significant because as missile and flight technology continue to improve
and advance, the equipment used to test these designs must also do so. Large quantities of money are
invested into missiles and aircrafts. Testing these vehicles is one of the most essential steps to assuring
that failure during an actual flight does not occur, which typically leads to huge financial loss. By
designing a functional and technologically competent test fixture that can improve upon and more
accurately apply and measure the modes of loading, the findings of the final design could potentially have
applications in the flight industry.
1.2 Project Description
The following is the project description verbatim from the client.
“Outer mold line flight components, such as missile and aircraft radomes and wing leading edges
often operate in extremely harsh environments. Small practical radomes can be 6 inches in
diameter and 18 inches in length. A large radomes can be 4 feet in diameter and 8 feet long. Wing
leading edges can vary as dramatically. Successful design efforts for these hardware components
include testing to validate the design. Common environments to which the hardware is subjected
to include internal and external pressure, high heat fluxes, and pressure induced flight loads.
Specialized test rigs to perform the testing are standard. The output of this project will be a set of
design specifications for a test fixture which can be deployed in standard laboratories (may be
outside) and capable of testing a wide variety of radomes and leading-edge shapes and sizes as
well as producing a wide variety of testing environments (pressures, loads, fluxes). Some
fabrication and testing of scaled models of the test fixture will benefit this project to prove it is
viable but is not required.”
1.3 Original System
The original system is a missile radome and leading-edge test fixture. The fixture simulates supersonic
flight conditions and applies mechanical and thermal loading in different orientations. The following
sections will describe the original fixture in further detail.
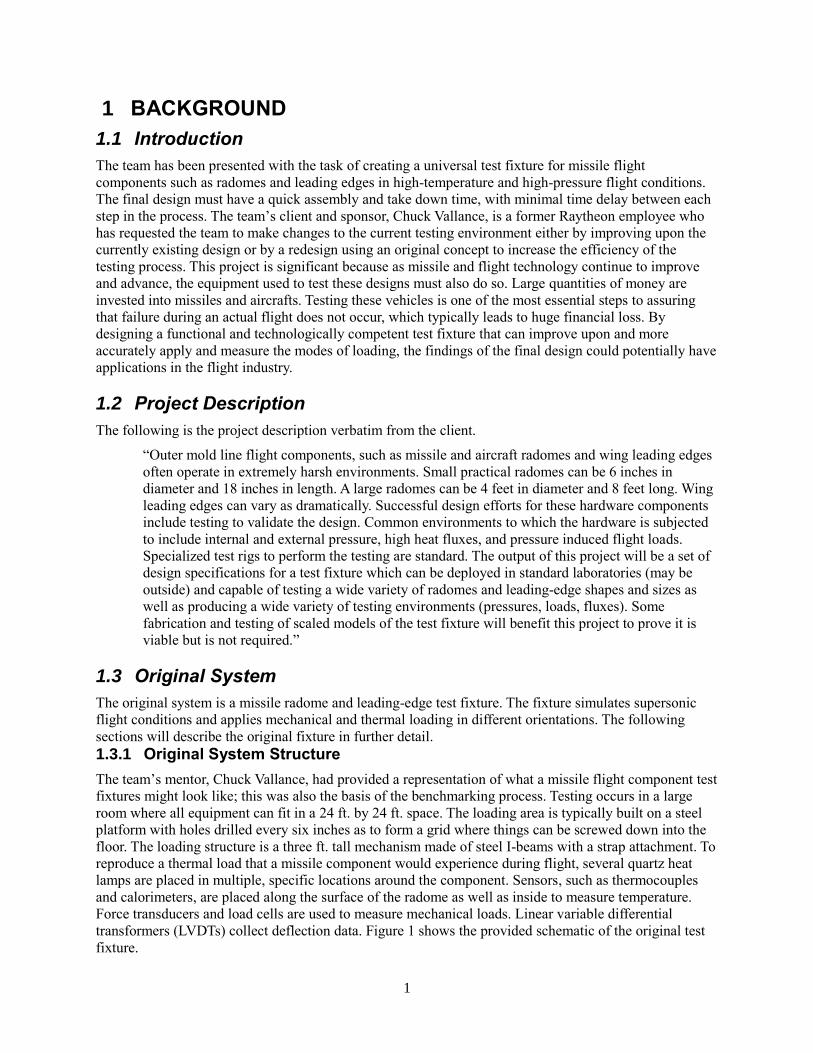
1.3.1 Original System Structure
The team’s mentor, Chuck Vallance, had provided a representation of what a missile flight component test
fixtures might look like; this was also the basis of the benchmarking process. Testing occurs in a large
room where all equipment can fit in a 24 ft. by 24 ft. space. The loading area is typically built on a steel
platform with holes drilled every six inches as to form a grid where things can be screwed down into the
floor. The loading structure is a three ft. tall mechanism made of steel I-beams with a strap attachment. To
reproduce a thermal load that a missile component would experience during flight, several quartz heat
lamps are placed in multiple, specific locations around the component. Sensors, such as thermocouples
and calorimeters, are placed along the surface of the radome as well as inside to measure temperature.
Force transducers and load cells are used to measure mechanical loads. Linear variable differential
transformers (LVDTs) collect deflection data. Figure 1 shows the provided schematic of the original test
fixture.

2
Figure 1: Original System Schematic
1.3.2 Original System Operation
When the fixture is powered, it begins simulating flight conditions. The strap is designed to cradle the
flight component that is subjected to testing and replicate a pulling mechanical load. The quartz lamps are
used to achieve a heat flux that is as equally distributed as possible. The quartz lamps include a water-
cooling system. Separate from the test fixture is a control room that receives signals from the sensors and
displays data from the testing room as well as prescribes loading and temperature profiles to the
mechanical and thermal equipment.
1.3.3 Original System Performance
The team was unable to visit the original test fixture. The client had also refrained from giving specific
performance parameters for the current fixture because he wanted the team to figure them out. Within the
first semester, the team was only able to observe fixtures and data collected from a select few designs that
are available to the public, many of which concern a different aspect of flight testing than that of which
the team was striving to address.
1.3.4 Original System Deficiencies
Although the original system was functional, there were three main areas of concern for the fixture. As it
stands, it takes hours or even days to set up and take down the assembly, meaning there is a large time and
labor investment. With this, it also required a lot of man power to assemble and tear down. Lastly, it was
unable to support testing for a variety of different radome sizes and orientations, making its capabilities
and diversity limited.

3
2 REQUIREMENTS
The following section details the customer and engineering requirements for the test fixture. It also
includes testing procedures to ensure that the fixture fulfills the requirements and a house of quality to
evaluate how each requirement relates to another.
2.1 Customer Requirements (CRs)
After meeting with the client, customer requirements were established. The purpose of the customer
requirements was to narrow the scope of the project and translate what the client wanted into qualitative
design requirements. The customer requirements are related to the functionality of the test fixture, as well
as safety, durability, and ease of use. Table 1 shows the customer needs that must be fulfilled for the test
fixture, as well as their corresponding weights. The requirements that were weighted the highest were
those that the client emphasized were of greater importance, such as simulating flight conditions, minimal
labor, and ability to test a variety of missile parts. Safety was also rated highly as it is essential to any
functional design.
Table 1: Customer Requirements
Qualitative Customer Requirements Weight (1-10)
Simulate supersonic and hypersonic flight conditions 9
Ability to test a variety of missile parts 7
Applies varying mechanical loads 7
Applies varying heat loads 7
Applies loads in different orientations 5
Minimal labor required for set up and changing out parts 9
Measures loads, strain, temperature, and heat flux 7
Transmits measurements to the command center 5
Portable 9
Compact Storage 3
Safe 9
2.2 Engineering Requirements (ERs)
Engineering requirements were decided based on customer requirements. The team identified how each
customer need could be translated into an engineering requirement that can be quantitatively measured.
Table 2 shows the engineering requirements as well as their target values. The target values were rough
estimates based on information provided by the client. The team does not have target values for the
resistance and voltage requirements because it was stated that the sensors and loads needed to be driven
from another location, but the exact numbers were not necessary.
4
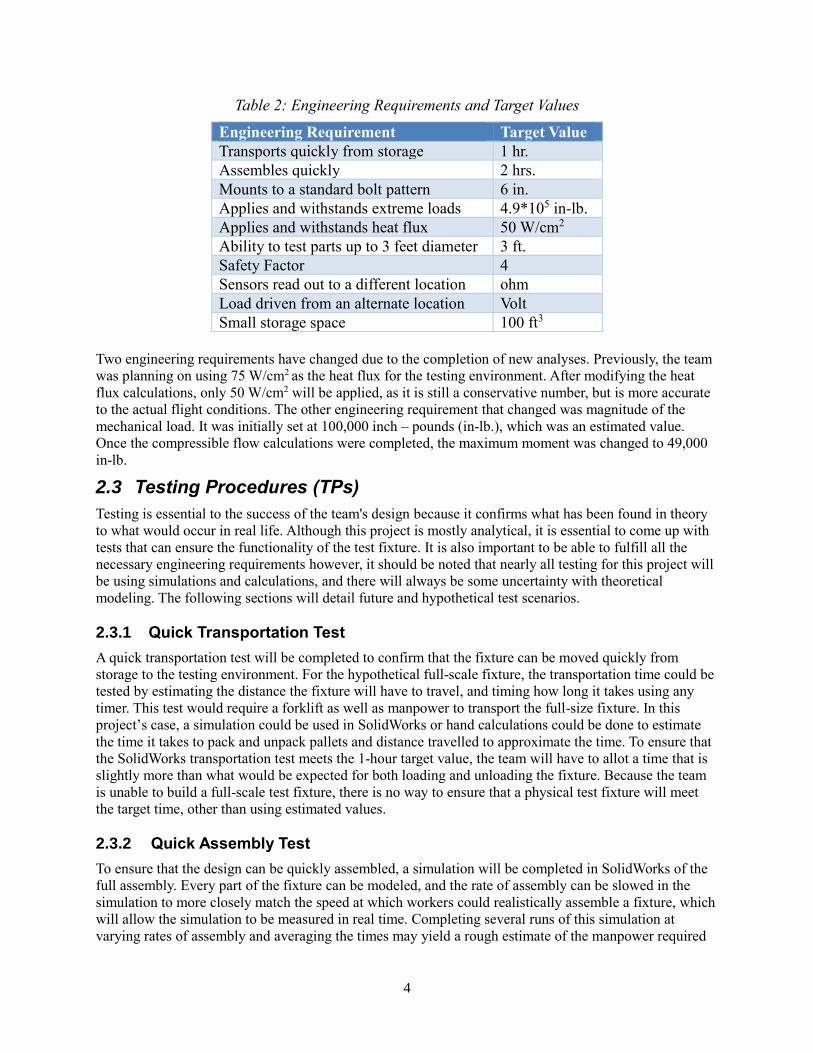
Table 2: Engineering Requirements and Target Values
Engineering Requirement Target Value
Transports quickly from storage 1 hr.
Assembles quickly 2 hrs.
Mounts to a standard bolt pattern 6 in.
Applies and withstands extreme loads 4.9*105 in-lb.
Applies and withstands heat flux 50 W/cm2
Ability to test parts up to 3 feet diameter 3 ft.
Safety Factor 4
Sensors read out to a different location ohm
Load driven from an alternate location Volt
Small storage space 100 ft3
Two engineering requirements have changed due to the completion of new analyses. Previously, the team
was planning on using 75 W/cm2 as the heat flux for the testing environment. After modifying the heat
flux calculations, only 50 W/cm2 will be applied, as it is still a conservative number, but is more accurate
to the actual flight conditions. The other engineering requirement that changed was magnitude of the
mechanical load. It was initially set at 100,000 inch – pounds (in-lb.), which was an estimated value.
Once the compressible flow calculations were completed, the maximum moment was changed to 49,000
in-lb.
2.3 Testing Procedures (TPs)
Testing is essential to the success of the team's design because it confirms what has been found in theory
to what would occur in real life. Although this project is mostly analytical, it is essential to come up with
tests that can ensure the functionality of the test fixture. It is also important to be able to fulfill all the
necessary engineering requirements however, it should be noted that nearly all testing for this project will
be using simulations and calculations, and there will always be some uncertainty with theoretical
modeling. The following sections will detail future and hypothetical test scenarios.
2.3.1 Quick Transportation Test
A quick transportation test will be completed to confirm that the fixture can be moved quickly from
storage to the testing environment. For the hypothetical full-scale fixture, the transportation time could be
tested by estimating the distance the fixture will have to travel, and timing how long it takes using any
timer. This test would require a forklift as well as manpower to transport the full-size fixture. In this
project’s case, a simulation could be used in SolidWorks or hand calculations could be done to estimate
the time it takes to pack and unpack pallets and distance travelled to approximate the time. To ensure that
the SolidWorks transportation test meets the 1-hour target value, the team will have to allot a time that is
slightly more than what would be expected for both loading and unloading the fixture. Because the team
is unable to build a full-scale test fixture, there is no way to ensure that a physical test fixture will meet
the target time, other than using estimated values.
2.3.2 Quick Assembly Test
To ensure that the design can be quickly assembled, a simulation will be completed in SolidWorks of the
full assembly. Every part of the fixture can be modeled, and the rate of assembly can be slowed in the
simulation to more closely match the speed at which workers could realistically assemble a fixture, which
will allow the simulation to be measured in real time. Completing several runs of this simulation at
varying rates of assembly and averaging the times may yield a rough estimate of the manpower required

5
to complete the assembly within the two-hour target value. An alternative way the assembly time can be
tested is to construct a scale model and time how long it takes to put together by hand. Then, scale model
analysis would be completed to see how much time it would take for the full-scale design. With this
assembly test, the team will need to contact the client to discuss how long each specific part takes to
assemble, as there are some very particular ways some specific parts need to be installed. This would
perhaps be a less accurate estimation of time, as the magnitude of the full-scale weight or adjusting the
rate of assembly to account for varying degrees manpower cannot be considered. The prototype would be
3D printed using on campus resources. Aside from that, the only materials required are glue to hold the
pieces together, a timer, and a person to assemble the fixture.
2.3.3 Standard Bolt Test
To test that the bolts fit the standard six-inch (in.) bolt pattern of the floor, one hole can be drilled into a
similar steel that would be utilized in the theoretical full-scale assembly. Then, the bolts in question could
be fitted to see if they matched the hole size and dimensions. For the purpose of this project, the bolt part
file will be downloaded from its vendor and matched to holes that will be modeled in SolidWorks. From
both tests, it will be clear whether the bolts will match with the bolt pattern correctly in the simulation as
well as an actual model.
2.3.4 Extreme Loading Test
The mechanical loading test can be completed hypothetically by attaching a force gauge to the
mechanism applying the load. This device can be found online at many retailers. The force meter will
accurately ensure that the target force of 7,500 pounds (lbs.) is being applied to a specific sized flight
component to induce the desired moment of 105 in-lb. A simulation can be modelled in ANSYS to see
what stresses are applied to the radome. The simulation is useful for this project, but only testing the
mechanism in real life will ensure that the necessary force is applied. The most accurate way to test if the
hypothetical fixture itself and the components can withstand the loads applied without failing, is to assure
that the factor of safety calculations are correct and that the factors of safety that are used are liberal.
2.3.5 Extreme Temperature Test
In order to test how much heat flux would be applied to the radome, ANSYS will again be utilized. The
approximate target heat flux of 75 W/cm2 will be applied using the software, then a temperature profile
will be plotted as a result of the applied heat flux. The software will also supply a heat flux contour plot.
This test will help ensure that the heat flux is being applied in the correct place and at the correct value.
The software will also be able to give values for heat flux for many kinds of missile parts. If extreme heat
fluxes were to be tested in real life, the temperatures at different points around the radome could be taken
using thermocouples and given the heat transfer coefficient conductive heat flux could be calculated. This
would be a way to ensure the design was applying the correct amount of loading.
2.3.6 Part Size Test
The ability of the fixture to handle different sizes of radomes can be quickly tested. The maximum
diameter radome that will be tested is three ft., therefore the mounting plate can be tested by modeling a
radome of that size in SolidWorks. This is a simple way to test the interface. One way to ensure the plate
is large enough is to measure it using a tape measure. The mounting plate should also have a few extra
inches on each side to ensure that it is large enough. Another analysis that should be considered after the
test is completed, is to ensure that the bolt holes on the plate are in the correct orientation to accept all
types and orientations of parts.
6
2.3.7 Safety Factor Test
Safety factors will be tested and calculated based on the results of the other tests, to assure that the fixture
will not fail at any point in the test. Every part of the fixture must have a minimum safety factor of four,
and that will be ensured by hand calculations as well as computer software. ANSYS can be used to
determine stresses and strains as a result of the mechanical loading, and factor of safety will be calculated
from there. ANSYS can also be used similarly for heat transfer applications, as mentioned in section
2.3.5.
2.3.8 Sensor Test
One way to test that the sensors are working correctly is to perform calibrations for each sensor. Once
calibrations are complete, the fixture can be run to see if the values received are within reason. If this test
is completed multiple times, it should ensure that all the sensors are connected correctly and are reading
out reasonable values. It also ensures that the data is being transmitted to the intended location.
2.3.9 Power Test
The power output of the fixture can be tested using a voltage and current reading. A voltmeter and
ammeter will be used to collect data for the power calculation. Power estimations can also be used by
contacting the vendor of the parts to obtain their power estimations.
2.3.10 Storage Test
A storage test can be completed by measuring the dimensions of the fixture when it is collapsed to
confirm it is under a volume of 100 ft3. A similar process can be completed using SolidWorks and the
modelled parts.
2.4 House of Quality (HoQ)
Once customer and engineering requirements were determined, the team created a House of Quality to
relate them to each other, as well as ranked currently existing designs. The House of Quality helped the
team prioritize design requirements by calculating the relative and absolute technical importance. The
team gave each customer need a value (on a 1-9 scale) based on how important it was to the client. Next,
the team determined how much each engineering requirement might influence each customer need. These
values were then used to determine absolute and relative technical importance. Each engineering
requirement was evaluated for how it related to other engineering requirements as well. As a result of the
House of Quality (Appendix A), applying both mechanical and thermal loads will be prioritized because
they are ranked highest in relative technical importance. Quick assembly, transportation, and testing parts
up to three ft. are ranked second, third, and fourth respectively. These requirements will be important,
although slightly less so than those ranked above. One item to note is that the team does not currently
have voltage or resistance target values for outputting the signals however, second semester those
calculations will be completed. Not only did the House of Quality help the team prioritize technical
requirements, it also provided benchmark information for existing test fixtures. Four existing fixtures
were benchmarked, so that the team could identify the strengths and weaknesses of the designs.
Benchmarking helped the team discern which elements of other fixtures should be incorporated into the
current design and which should be discarded.

7
3 EXISTING DESIGNS
This section of the report contains a compilation of all the aspects of research that have been completed
for the capstone design project. Starting with a description of how the team chose to conduct research and
select designs for the benchmarking analysis, each subsequent section will explore existing designs that
are similar as a full system to the original system. Following the broad overview of each system, the team
will provide an elaborate break down of the systems in the form of a functional decomposition and black
box model. Sequentially, each existing design will be broken down into a variety of sub-system
components and elaborate on their relevance to the engineering requirements and in the design project.
3.1 Design Research
For the team to gain a more comprehensive understanding of the current state of flight component test
fixtures, it was necessary to conduct research on presently existing designs. Due to facility restrictions,
on-site observations are not a viable research option. Instead, information on existing systems was
attained through web-based research, as it proved to be the most extensive and efficient method of
research. Through recommendations and guidance from the client in addition to academic resources, the
team was able to gather a small, but enough assortment of scholarly articles and studies.
After selecting three designs from the team’s research with similar processes as the current design, each
design was benchmarked, as seen in the QFD, located in Appendix A. Selected benchmarking designs
were scored in the right-most column of the QFD based upon how well each benchmark met each
customer need. As a result of detailed research, the team was able to acquire a thorough enough
understanding of the functionality and capabilities of each design to give each the most reasonable score
in comparison to the existing design. The benchmarking process compared three existing designs that
serve a different purpose than the team’s test fixture, but each of them included some type of approach
that either applied a mechanical or thermal load, or a testing environment that could be considered when
synthesizing design concepts.
3.2 System Level
Due to the nature of this project as well as company confidentiality, existing test fixture designs are not
readily available for public access. Because of this dilemma, the system level designs detailed in the
following three sections will not serve the same purpose as the system the team is expected to replace.
The design research for currently existing designs that exemplify components, testing procedures, or
features that are similar or can be related to the project objective. With limited system level options, the
three existing designs in this section were reviewed by the team and selected as the systems that most
accurately aim to include and execute the same tests and requirements as the original design.
3.2.1 Existing Design #1: Gulfstream Aerospace Test Fixture
The first design that the team benchmarked was the Gulfstream test fixture. The team used videos of the
testing environment to gather the information needed to benchmark this design [2]. The Gulfstream
Aerospace test fixture is suitable for only testing wings and leading edges. The inner side of the wing,
which would be attached to the body of the aircraft, is held in place by a fastening mechanism while the
opposing side, the point of the wing farthest away from the body, is subjected to a load in order to test
how the moment impacts the point closest to the body. The load is applied by a strong pully mechanism,
lifting the wing up, causing the wing to bend into an upwards, curved shape until fracture or the
conclusion of the test. Many wires and sensors are attached to the wing and the equipment to convey
information and data to the control room. Due to the restrictions on the content that Gulfstream Aerospace
can release about their testing environment, an educated assumption was made that thermal load testing
must occur in a separate environment that achieves all requirements needed for a successful and accurate
thermal load test. Referring to the QFD (Appendix A), the Gulfstream test fixture scored excellent for the
following customer needs:

8
• Applies varying loads • Measures load, strain, temperature, and heat flux • Measurements and data collection outside the bay • Safe for operators
These ratings were justified because this design meets all the basic requirements needed for the types of
loading that will be analyzed and could safely execute the desired test while keeping the operators and
analysts in the control room safe. Although it met these basic requirements needed for any loading test, it
was still missing quite a few major elements requested by the client and scored poorly in all other
categories. This benchmark was not precisely the type of design that is being considered, but it provided
some valuable information that helped the team identify areas in the designs that missed the target set by
the client.
3.2.2 Existing Design #2: Pyroceram Radome Thermal Testing
The second system level design that the team analyzed and benchmarked was an experiment that sought
to determine the thermal environment that would induce failure due to compressive stress for the
Pyroceram missile radome [3]. This experiment involved two major relevant testing analyses to determine
if the radome design was suitable for harsh thermal stresses under Mach four flight conditions. The first
component of this study consisted of conducting a thermal analysis computer simulation, using an IBM
7094 computer program. The radome trajectory and geometry selected for the simulation were chosen
such that the results would yield the highest rate of heat input as well as its corresponding tensile stress
induced by the thermal load. The data collected from this theoretical test was then used to influence the
conclusion and verify the speculated results by means of a full-scale wind-tunnel test. In order to induce
tensile stress due to thermal loading, the wind-tunnel was set to the desired Mach number, and then
radome was placed into the airstream for a pre-determined amount of time. The same test was conducted
multiple times to assure measurements for pressure, temperature, and tensile stress were consistent with
each trial. The only variable that was adjusted for each test was the radome's initial temperature, to
observe the varying effects of temperature on tensile stress. The experimental data was recorded to
compare its accuracy to the theoretical predictions.
As seen in the benchmarking columns of the QFD (Appendix A), the Pyroceram thermal loading test
scored well in the subsequent areas:
• Simulate supersonic and hypersonic flight conditions
• Applies varying heat loads and fluxes
• Measures load, strain, temperature, and heat flux
• Safe for operators
Although this experiment was dissimilar to this project, as it was primarily focused on the radomes and
evaluating their structural adequacy, this analysis conducted a thermal test in a manner that the team
would ideally wish to utilize in this project. By using a different means to achieve the same goal, despite
the contrasting focus, this study can be related to this project by comparing the similar flight conditions
and the anticipated results of this project. This test gave insight into what an efficient and successful
thermal testing process would consist of, had the team been given the opportunity to continue further with
the project.
3.2.3 Existing Design #3: NASA Aerostructures Test Wing (ATW)
The final existing design the team researched was the piezoelectric actuator structural excitation test, used
to induce instability identical to flutter during flight turbulence, in the NASA ATW [4]. Light-weight
aircraft wings lack structural stiffness, which can cause complications during flight. Piezoelectric devices
are used to both measure and generate motion to more accurately predict the onset of flutter in real flight
scenarios. This experiment used the piezoelectric actuators to test their ability to invoke the first-bending

9
and first-torsion modes on the ATW for both the ground and in-flight tests.
The impact vibration ground test was performed by first striking the ATW with a large mass, stimulating
the piezoelectric sensors to convert the movement into electrical signal response data. Accelerometers
placed at the outer edge of the ATW were also used to collect time response data at specific locations
along the wing. Conversely, an electrical signal is sent to the piezoelectric actuators via various
frequencies and voltages to prompt vibrations, which are applied to the ATW. The wingtip accelerometers
were used once again to record the actuator data at each of the voltages. The other phase of the actuator
testing consists of measuring the turbulence excitation and wing response at multiple, stabilized test
points over a 30 second interval. After the stabilization period, the piezoelectric actuators were signaled to
generate motion over the wing for 60 seconds while the accelerometers gather the response data, as
before.
This testing method strives to achieve a completely different set of objectives than this project, and
therefore, there were a limited number of engineering requirements this analysis could meet. Although
this existing design served a different purpose than the intended test fixture, there were still a few
concepts and design considerations used in this testing environment that could have potential applications
in this design and testing procedure. For this test to improve upon current flutter measurements and
predictions, wing excitation was essential for gathering the proper data needed to validate the structural
dynamics of an aircraft. In a way, this test was analogous to the team’s test fixture in that the design must
apply the correct thermal and mechanical loads to the flight components during the testing phase to assure
that those components do not fail during an actual flight. The piezoelectric actuator is a small and simple,
yet versatile device that was able to quickly drive and sense various loads with precision, when used in
conjunction with the accelerometers. These components of the excitation test conform to the requirements
of applying loads (although to a significantly lesser degree), sensing input, and transmitting data.
3.3 Functional Decomposition
The project had some complex processes, and it was necessary to break it down into pieces. This section
contains a black box model to show the inputs and outputs of the fixture: the types of material that go into
and out of the system, the types of energies that the fixture will be using, and the type of signals that go
into and out of the system. The next step was constructing a functional model, which explain the
functional roles of each input and output.
3.3.1 Black Box Model
The purpose of the black box model (Figure 2) was to show the input and the output of the design. There
are three types of inputs: materials, energy, and signals. The material inputs for the design were the fixture
and the missile parts that will be connected to the fixture. In terms of energies, there is hydraulic energy,
heat energy, electricity, and human energy. In terms of signals, there is a load signals input. The outputs of
this design were the fixture and the missile part. The only output energy was the human energy in order to
break down the fixture. The signal output will be the sensor signals that will be connected to the control
center. This model helped the team know what kind of input flows were required to transform them into
desired output flow.

10
Figure 2: Black Box Model
3.3.2 Functional Model
The functional model (Figure 3) was made based on the black box. The purpose of a functional model
was to break down the design into smaller systems and functions that were associated with each input and
output. The inputs and outputs are materials, energy, and signals. The functional model shows the process
each input goes through. The reason why a functional model is helpful is because each piece is a function
that needs to be solved and put to help the next function, one by one to reach the purpose of the design.
There will be four imports: the control center, fixture, missile part, and sensors. Each import will be
assembled by human energy. The control center will send signals to apply both mechanical and thermal
loading. The sensors that will be used are strain gages for the mechanical loading and thermocouples for
the thermal loading. Both types of sensors are connected to the missile part. The output will be signal of
voltage transfer back to the control center where all the data will be measured and calculated. Then using
human energy, the fixture will be taken down.
Figure 3: Functional Model
3.4 Subsystem Level
This section contains three subsystem levels that will be helpful for the design in order to ensure the
design produces accurate results for supersonic conditions and can be assembled quickly. The three
subsystem levels are thermal loading, mechanical loading, and the best beam to use. For each subsystem,
the team did research of existing designs that would help creating the best design possible for the fixture.

11
3.4.1 Subsystem #1: Thermal load
One of the requirements of the fixture was to test a missile part at a high temperature and to create an
environment as similar as possible to the flight conditions of hypersonic missiles. Hypersonic missiles
endure very high temperatures which can cause damage to the fixture. As a result of this, it was necessary
to research existing designs that apply these kinds of temperatures and find out the benefits and
disadvantages of each.
3.4.1.1 Existing Design #1: Pyroceram Radome Thermal Testing
This design was designed to apply the temperatures that occur at Mach number four. To get the thermal
loading analysis, they used IBM 7094 computer program [3]. This program can handle three dimensional
geometric configurations of heat transfer for radiation, convection, and conduction. This was helpful for
the team’s design because the output analysis was like what was required of this project.
3.4.1.2 Existing Design #2: Combined Loads Test Fixture
Their design was to test aerospace vehicle panels under simultaneous structural and thermal loading. The
density of quartz lamps is high. The goal was to reach the necessary higher heat flux, for the flight
conditions. A fence is important to shield the less massive material from the high heat. This design
utilized heat lamps in the same way the new design will [5]. One advantage this design had was that it
minimized the heat loss. The heat shield also made it safer.
3.4.1.2 Existing Design #3: A Test Fixture for Measuring High-Temperature Hypersonic-Engine Seal Performance
In this design, NASA is measuring a hypersonic engine seal at a high temperature. High density Watt
heaters are strapped on the sides, top, and bottom of the test rig. The heaters that they have been using are
35 kW. The fixture's temperature reached 1500 °F in five hours [6]. This was helpful because the team’s
design has the same purpose: to apply a high thermal loading and test it. Also, it gave the team some idea
of how long it will take to complete the testing. The test will most likely only be a few minutes long.
3.4.2 Subsystem #2: Mechanical Load
One of the major requirements that the fixture needs is the ability to apply a mechanical load that meets
with hypersonic flight conditions. For this design, mechanical loading will be applied to the missile part
using hydraulic energy. Because of the high temperatures, the material is important as well as the
performance.
3.4.2.1 Existing Design #1: Gulfstream Aerospace Test Fixture
The first existing design applies the mechanical load by a hydraulic ram that is connected to a beam above
the wing that is being tested. Two straps are connected on the end of the wing in order to pull it up and six
hydraulic rams push up in six different locations. These loads create a huge amount of moment on the
wing and that is the purpose of the test [2]. This is helpful because their goal is to create a high moment to
see if the wing can withstand it. In this project, the team will apply a moment to the missile part, which
will be a similar process.
3.4.2.2 Existing Design #2: Combined Loads Test Fixture
In this design NASA is applying mechanical loading to a vehicle panel. The panel is 48-by-48-in. The
load applied is from 30,000 lbf to 50,000 lbf. Hydraulics are used in order to add pressure from two sides
on ten different areas [5]. The is important for the design because it introduces the idea of using more than
one ram. Also applying the pressure from more than one side could make the results more accurate.
3.4.2.3 Existing Design #3: NASA’s Armstrong Flight Research Center
For this design, they use weight as pressure force, which means they are using gravity to apply pressure.

12
Using this type of pressure is less expensive than using hydraulics [7]. On the other hand, using weight
requires more room for the weight. This way is also not as safe as the hydraulics, because hypersonic
missiles accumulate huge amounts of pressure. This design introduces another way of applying the
moment to the missile part.
3.4.3 Subsystem #3: Beams
The beams are essential for the structure of the fixture. The hydraulic ram will create a high stress area
where it attaches to the beam. A large moment will be applied to the plate that holds the radome.
According to OSHA standards, the factor of safety needs to be four or more, which means the beams need
to have high moment of inertia. When the moments of inertia of the beams are high, the stresses on the
beam will be lower. As a result, the mechanical load will be more directly applied to the missile part,
instead of the beam deflecting.
3.4.3.1 Existing Design #1: Gulfstream Aerospace Test Fixture
The beams that Gulfstream use are rectangular beams. While I-beams have a higher moment of inertia,
rectangular beams are better at withstanding high stresses at bolt connections. Also, regarding the shear
stress that the bolts are holding [2], this information could be helpful if the shear calculations are higher
than expected. The team could use rectangular beams in that case.
3.4.3.2 Existing Design #2: HDT Global
This company has designed a beam that has unique properties by creating a highly oriented fiber layer.
The structure is flexible, and the angles of its fiber will increase the beam's strength under pressure loads
[8]. This design is helpful because one of the goals of this project is to make it fast to assemble, using
fiber rather than steel will make the beam lighter and quicker to assemble.
3.4.3.3 Existing Design #3: Hybrid Composite Beams
This beam is designed to endure high mechanical loading. At the same time, it is light. They use this kind
of beam for bridges. They use a concrete arch, a low-density foam core, and a fiber plastic shell [9]. The
purpose of their design is different than the purpose of this project, but it is still applicable. Using a
fiberglass beam, which is a lightweight, strong material, will help the design.

13
4 DESIGNS CONSIDERED
For this design project, there are three parameters that must be evaluated. The first two are the means by
which mechanical loading and thermal loading must be determined. Each has a unique set of engineering
requirements and there are many options for how these loads could be applied. The third parameter that
must be analyzed is the overall orientation and geometry of the test fixture. The test fixture will affix the
components and allow the loads to be applied. This section will review the designs considered and the
impact of each of the designs.
4.1 Thermal Loading
The thermal loading which simulates the extreme temperatures of supersonic flight must be replicated at
the same time as the mechanical loading. A successful design is one that will have an even distribution of
heat flux and still allow for the mechanical loading mechanism to operate. The next four designs are
attempts at solving these problems.
4.1.1 Design #1: Oven
The first thermal loading concept is simply an oven. In this concept, the entire test fixture is loaded into
an oven and the mechanical load is applied. The primary benefit to this system is that it is very simple,
and it avoids using complex and expensive heating mechanisms. Unfortunately, the drawbacks are
extensive. First, every single component in the test fixture would have to withstand temperatures nearing
the melting point of steel. This will drive up the cost of virtually every component on the structure,
negating any savings. Another drawback is the oven would now have to heat a large volume and would
result in a long heat up time.
4.1.2 Design #2: Heat Coils
Figure 4: Heat Coils Design
In this design, a coil system containing electrical current is wrapped around our flight component. As high
currents travel through the coils, heat is expelled, and the flight component is heated. One nice feature of
this design is that the amount of heat delivered can be accurately controlled. The coils can also be
wrapped around a variety of parts making it universal. Another benefit to this design is that the heat is
evenly distributed on the test component. The drawback of this design is that it blocks the part from being
able to receive the mechanical load.
4.1.3 Design #3: Fixture
Figure 5: Fixture Design
The thermal loading mechanism we are calling the fixture utilizes the same concept as the heat coils with
one addition. The entire heat coil mechanism is encased in metal allowing the mechanical load to be
applied. The inner surface of the fixture is perfectly matched to interface with the aerospace component to

14
be tested. This is the major drawback of this design. Every single part that would be tested requires a
unique fixture, eliminating the customers universal requirement.
4.1.4 Design #4: Fluid
Figure 6: Fluid Design
The application of thermal loading through a dense fluid is another way mechanical and thermal loading
can be applied simultaneously. The component to be tested would be inserted into the fluid stream at
some non-orthogonal angle, creating a moment on the part. The hot fluid would then heat the part. There
are several issues with this design, the first being that the extreme temperatures would cause many oils to
combust. Secondly, the part may become damaged from being in contact with the fluid. Finally, there
could be a health or safety risk if the oil were to spill.
4.2 Mechanical Loading
As flight vehicles turn while traveling at high velocities, there are lateral pressure loads applied to various
components. In addition to pressure loads, the vehicles experience lateral acceleration while turning. This
acceleration causes forces which must also be replicated in testing. The following two designs apply the
mechanical loading to flight components.
4.2.1 Design #5: Rings
Figure 7: Ring Design
The application of mechanical loading using concentric rings will allow for a more even distribution of
loading. The rings would have to be custom-made for each component leading to the same issues as the
fixture. One advantage to the ring design is that they could potentially be used on a variety of radome
sizes, the only differences being that they would just be situated at different distances from the base.
4.2.2 Design #6: Cradle
Figure 8: Cradle Design
The cradle is designed to evenly distribute the mechanical load on test parts and is also more universal
than the rings. The major disadvantage is that the curvature is generalized so it will not distribute loads as
evenly as the rings however, the overall cost will be lower as multiple fixtures will not have to be
manufactured.

15
4.3 Test Fixture
The test fixture is the overall assembly which holds and stabilizes the flight component and delivers the
mechanical and thermal loading to it. The design of the fixture will have a significant impact on assembly
times, storage volume, and ease of use. The fixture will also dictate the size and shape of components that
can be tested. Most importantly, the fixture will determine the overall safety and success of the tests to be
performed.
4.3.1 Design #7: Rail
Figure 9: Rail Design
The rail test fixture is a one-piece test fixture designed for simple setup and operation. The fixture is
composed of a single I-beam with the hydraulic ram and part interface permanently affixed. This test
fixture would transport easily and could be stored in pieces. There are a few disadvantages to this design,
which is that there is a small range of parts that can be tested; large components will simply not fit on the
I-beam.
4.3.2 Design #8: Turntable
Figure 10: Turntable Design
The turn table fixture is unique in that it rotates as mechanical and thermal loading is being applied.
Under normal test conditions, a part must be fully tested and then rotated 90 degrees and re-tested. This
fixture would save time as the parts would not have to be disconnected in between tests. In theory, the
part could be rotated during the test to create a sinusoidal load, effectively testing fatigue. This fixture
also offers the benefit of even heat distribution.
4.3.3 Design #9: Upright
Figure 11: Upright Design

16
The upright is a multi-sectional test fixture which is designed to handle a wide variety of components.
The mechanical load is applied from the floor minimizing deflection of the fixture. The fixture is versatile
and perhaps could be adapted for other tests.

17
5 DESIGN SELECTED – First Semester
The following section describes the process that the team used to select a design. First, a Pugh chart and
decision matrix helped the team decide on which designs to pursue. Next, the team completed engineering
calculations to validate that the designs could fulfill the necessary requirements.
5.1 Rationale for Design Selection
In the first iteration of the design process, the team focused on two subsystems: mechanical and thermal
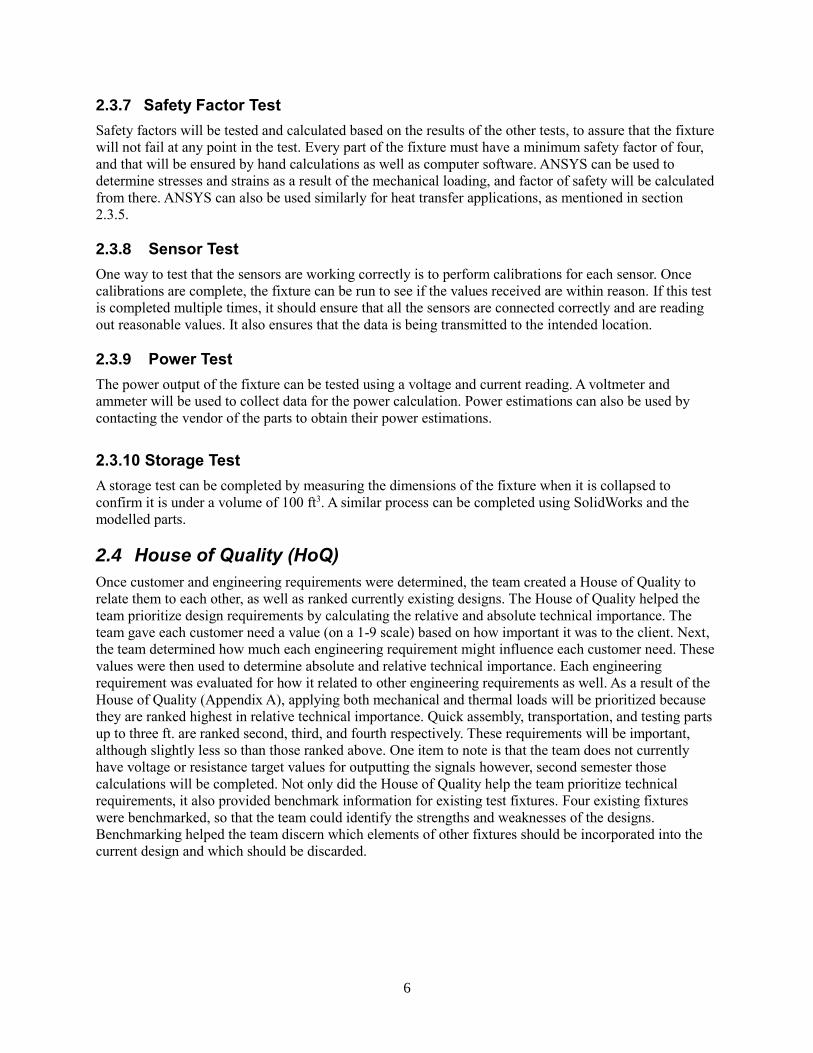
loading, as they were the most important parts of the design. As a result of the Pugh charts in Figures 12
and 13, the team decided to continue with the designs that most easily incorporate simultaneous
mechanical and thermal loading. This design was the fixture design, which fulfills all the customer needs
except universality. The fixture design was safe, nondestructive, and could be quickly assembled because
it was one single piece however, after meeting with the client and continuing with the iterative calculation
process, this fixture is not being considered anymore. The problem with the fixture is that inductance coils
were going to be used, which detracts from the universality of the fixture. Inductance coils can only be
used for metal radomes and do not work with all materials. This is an issue because radomes are made of
many different materials, even quartz.
Figure 12: Thermal Loading Pugh Chart
18
Figure 13: Mechanical Loading Pugh Chart
Instead of using the fixture design, the team is going to move forward with the cradle design and heating
lamps for the time being. The heating element may be changed, but lamps are being used for now because
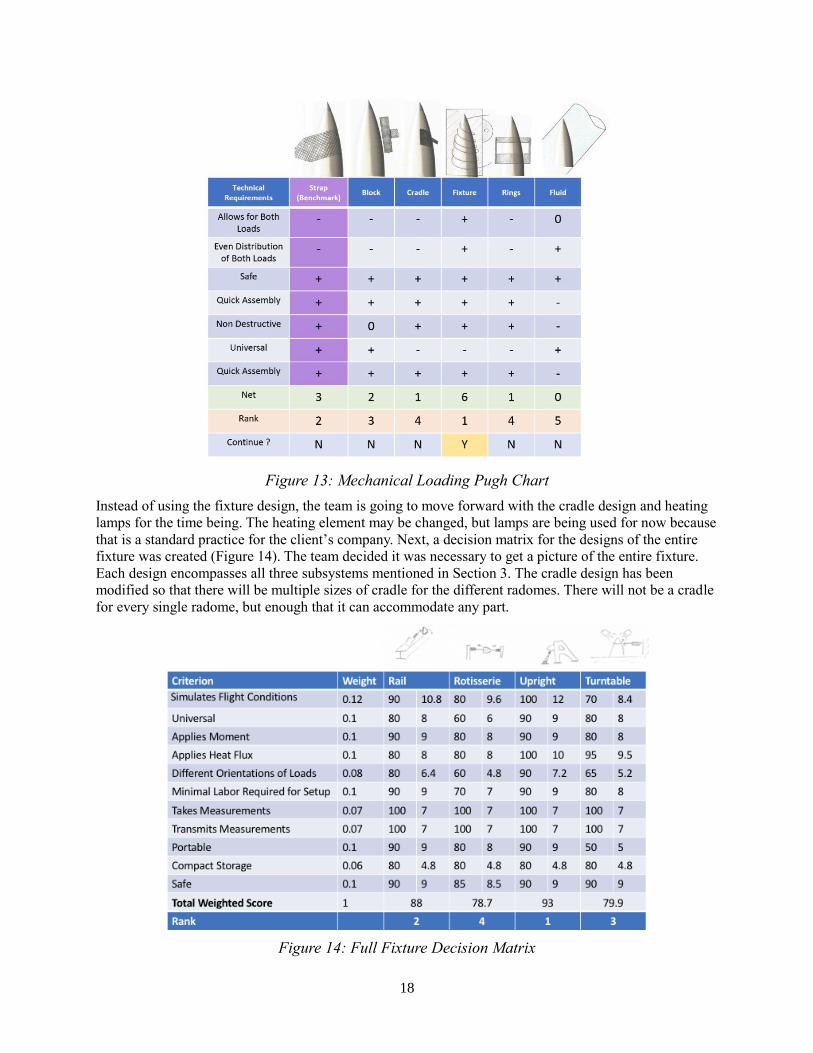
that is a standard practice for the client’s company. Next, a decision matrix for the designs of the entire
fixture was created (Figure 14). The team decided it was necessary to get a picture of the entire fixture.
Each design encompasses all three subsystems mentioned in Section 3. The cradle design has been
modified so that there will be multiple sizes of cradle for the different radomes. There will not be a cradle
for every single radome, but enough that it can accommodate any part.
Figure 14: Full Fixture Decision Matrix

19
As a result of the decision matrix, the upright fixture is being pursued. It fulfills nearly every design
requirement as is the most robust of the four. It was also selected because of its high scores in simulating
flight conditions, minimal labor for setup, and universality. The client has emphasized the importance of
these requirements, so they were considered most. The rail design also scored relatively high due to its
simple and effective design. However, the rail design cannot be used for large radomes as they will not fit
on the I-beam. Both the rotisserie and turntable design could not apply loading in different orientations, so
they were not selected. The rotisserie design also scored lower in universality. Therefore, the upright
fixture is the best design to fulfill all requirements and apply the mechanical and thermal loading
simultaneously.
5.2 Design Description
Based on the outcomes of the decision matrix and Pugh chart, and after having a discussion with the
client, we decided to move forward with the upright test fixture. In this section we will discuss in further
detail the fixture itself and the analyses used to determine the features of the fixture.
5.2.1 Design Description
The test fixture is composed of just four major components. There are two uprights which compose the
major structure, a universal plate and the hydraulic ram. The entire structure is assembled using various
threaded fasteners. The uprights can be lifted with forklift straps and the plate has a lift hook for easy
transport. The uprights as well as the universal plate can be stacked in small space reducing the overall
storage required. The hydraulic ram is a commercially available part however, the base plate and cradle
will need to be manufactured. The following figure illustrates the critical components of the assembly and
shows an AMRAAM radome. Figure 15 shows the orientation of the full design.
Figure 15: Proposed Test Fixture

20
The primary component in the fixture is the uprights. The uprights are constructed from six-in by eight-in
box beams with a 3/8-in. wall. The tubes are to be cut and welded into the configuration shown. Base
plates made from one-in. plate steel will be used to bolt the fixture to the floor of the testing bay. The
upright also has a lip with mounting holes for the plate to be bolted to. The two uprights are virtually
identical, the only difference being the side that the mounting lip is welded to. Figure 16 illustrates the
left-hand side upright in closer detail.
Figure 16: Left Upright
The main plate or universal plate is designed to allow a wide variety of aerospace components to be
bolted to the fixture. This interface is what allows a wide range of parts to be tested. This plate is 30 in by
30 in which is just large enough to test a Tomahawk radome. The plate has one-in diameter holes to
connect to the uprights, and a three-in diameter center hole to allow sensor cables to be passed through.
Figure 17 highlights the universal plate design.
Figure 17: Universal Plate
21
Each of the components in this assembly will have to be analyzed to ensure they can withstand the
mechanical and thermal loading which will be applied. The following sections provide a brief overview of
these analyses. Several of the analyses in the following sections were calculated before deciding upon this
fixture, and because of that, the beam calculations were performed on an I-beam instead of a box beam. It
is important to note that these the heat flux calculations and mechanical loading calculations were
performed for an AMRAAM missile and analyzing different missiles would result in unique loads.
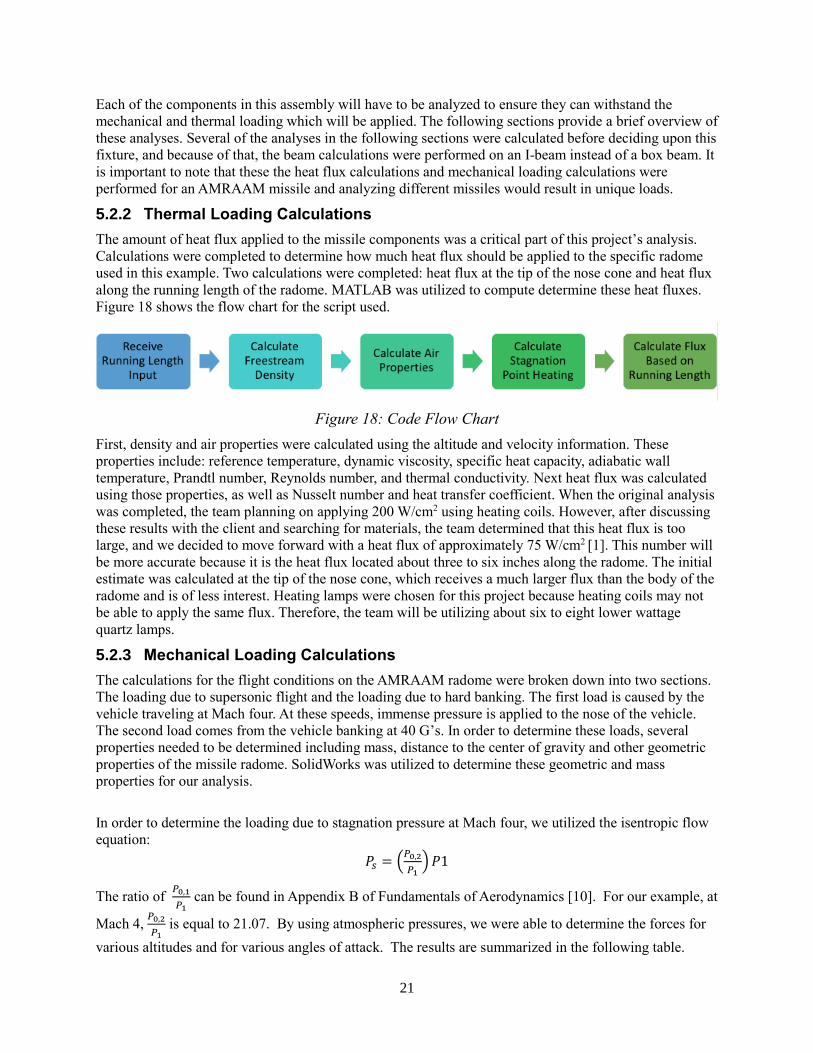
5.2.2 Thermal Loading Calculations
The amount of heat flux applied to the missile components was a critical part of this project’s analysis.
Calculations were completed to determine how much heat flux should be applied to the specific radome
used in this example. Two calculations were completed: heat flux at the tip of the nose cone and heat flux
along the running length of the radome. MATLAB was utilized to compute determine these heat fluxes.
Figure 18 shows the flow chart for the script used.
Figure 18: Code Flow Chart
First, density and air properties were calculated using the altitude and velocity information. These
properties include: reference temperature, dynamic viscosity, specific heat capacity, adiabatic wall
temperature, Prandtl number, Reynolds number, and thermal conductivity. Next heat flux was calculated
using those properties, as well as Nusselt number and heat transfer coefficient. When the original analysis
was completed, the team planning on applying 200 W/cm2 using heating coils. However, after discussing
these results with the client and searching for materials, the team determined that this heat flux is too
large, and we decided to move forward with a heat flux of approximately 75 W/cm2 [1]. This number will
be more accurate because it is the heat flux located about three to six inches along the radome. The initial
estimate was calculated at the tip of the nose cone, which receives a much larger flux than the body of the
radome and is of less interest. Heating lamps were chosen for this project because heating coils may not
be able to apply the same flux. Therefore, the team will be utilizing about six to eight lower wattage
quartz lamps.
5.2.3 Mechanical Loading Calculations
The calculations for the flight conditions on the AMRAAM radome were broken down into two sections.
The loading due to supersonic flight and the loading due to hard banking. The first load is caused by the
vehicle traveling at Mach four. At these speeds, immense pressure is applied to the nose of the vehicle.
The second load comes from the vehicle banking at 40 G’s. In order to determine these loads, several
properties needed to be determined including mass, distance to the center of gravity and other geometric
properties of the missile radome. SolidWorks was utilized to determine these geometric and mass
properties for our analysis.
In order to determine the loading due to stagnation pressure at Mach four, we utilized the isentropic flow
equation:
𝑃𝑠 = (𝑃0,2
𝑃1)𝑃1
The ratio of 𝑃0,1
𝑃1 can be found in Appendix B of Fundamentals of Aerodynamics [10]. For our example, at
Mach 4, 𝑃0,2
𝑃1 is equal to 21.07. By using atmospheric pressures, we were able to determine the forces for
various altitudes and for various angles of attack. The results are summarized in the following table.

22
Table 3 - Force due to Mach 4 Flight
AOA X-sectional
Area [in2] Altitude [ft]
Atmospheric
Pressure [𝑙𝑏
𝑓𝑡2]
Stagnation
Pressure [𝑙𝑏
𝑓𝑡2]
Force [lbf]
0° 38.48 52,000 232.8 4,905 1,311
5° 38.59 52,000 232.8 4,905 1,314
10° 38.93 52,000 232.8 4,905 1,326
0° 38.48 20,000 973.3 20,507 5,480
5° 38.59 20,000 973.3 20,507 5,496
10° 38.93 20,000 973.3 20,507 5,544
10° 38.93 0 2116.2 44,584 12,053
For determining the loading due to 40G turns, we simply used:
𝐹 = 𝑚𝑎 (1)
𝐹 = 5.91[𝑙𝑏] ∗ 40 ∗32.2 [𝑓𝑡
𝑠2]
F=7,612 [lbf]
The final calculation in Table 3 shows the vehicle traveling at Mach 4 at sea level. While this speed is
most likely unattainable at this altitude, the longitudinal force is 12,000 pounds. The lateral force due to a
40G turn was calculated to be 7,600 pounds. Fortunately for the vehicle, the maximum longitudinal and
lateral forces will not happen simultaneously. These calculations can now be used to determine the
loading on the individual components of the test fixture. These loading conditions can be multiplied by an
appropriate factor of safety and each flight component can be tested. The size and dimensions of the test
fixture will also be determined from these calculations.
5.2.4 Bolt Calculations
The bolt loading analytical calculations investigated the structural integrity of the threaded fasteners that
connect the mounting plate to the universal plate of the test fixture. The ¼"-20 X 1 ¾" UNC SAE grade 8,
steel hex head screw was the selected fastener for the first iteration of these bolt calculations. A total of 24
bolts with a preload of 5.5 kips was used to estimate the tensile load, the yielding and joint factors of
safety. As requested by the client, all aspects of our design must meet a factor of safety of four or greater.
Using the plate thickness, nut length, and washer thickness, the tensile load per bolt, yielding factor of
safety, and joint factor of safety came out to a value of 0.417 kip, 0.683, and 16.83, respectively. Although
the joint factor of safety significantly exceeds requirements, the yielding factor of safety noticeably
misses the mark. Upon further inspection, when the preload is reduced to approximately three kip, the
factor of safety requirements are met. This is important because it informs us that the current state of the
test fixture will be unable to support the required maximum load without failure. To account for this and
assure the fixture will be able to achieve a factor of safety of 4 while enduring expected maximum
loading, specific variables of the fasteners and universal mounting plate will need to be modified in the
2nd iteration of our calculations.
5.2.5 Beam Calculations
The purpose of this beam calculation is to determine the correct specification for the I-beam required for
this test fixture The I-beam was initially chosen because they typically have large moment of inertia
compared to other beams. The assumptions are that the load should be 100,000 N, and that the material is
steel, considering steel has high yielding stress which is 1,000 MPa [11] The stress of the I-beam should
not exceed 250 MPa and the length of the I-beam that is connected to the hydraulic ram is 0.9 m. After
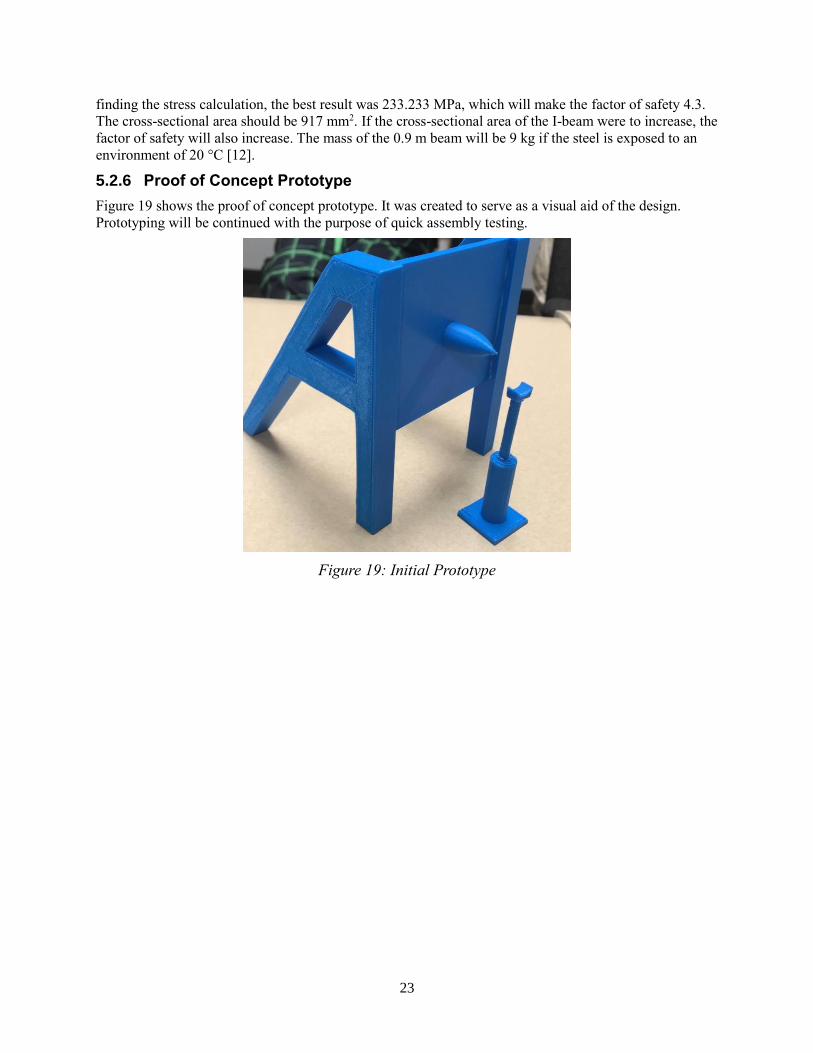
23
finding the stress calculation, the best result was 233.233 MPa, which will make the factor of safety 4.3.
The cross-sectional area should be 917 mm2. If the cross-sectional area of the I-beam were to increase, the
factor of safety will also increase. The mass of the 0.9 m beam will be 9 kg if the steel is exposed to an
environment of 20 °C [12].
5.2.6 Proof of Concept Prototype
Figure 19 shows the proof of concept prototype. It was created to serve as a visual aid of the design.
Prototyping will be continued with the purpose of quick assembly testing.
Figure 19: Initial Prototype

24
6 PROPOSED DESIGN – First Semester
The following section details the plan for implementing and furthering the design. It also includes the
resources that will be required for implementation and the bill of materials for the design. The schedule
and budget for the upcoming semester will be detailed in this section. The SolidWorks models of the
assembled design and parts will also be shown.
6.1 Description of Implementation Plan
The first step in implementing the design is to produce more detailed specifications using the current
drawings. Parts of the design have not been validated mathematically, so that will be a future requirement.
Bolt calculations for the radome mounting plate need to be readdressed in order to produce finite
specifications. These calculations may also reveal design flaws or weaknesses that will need to be
addressed. After all the parts have been validated and design changes have been made, a second iteration
of 3D printed prototyping will be completed. This prototype will be used to test the assembly time of the
entire test fixture. Next, load and power estimations will be completed for the whole fixture. The team
will also decide what will be used to power the fixture. After the power calculations are completed, a third
iteration of calculations will be completed if necessary. Because this project is iterative in nature, the
design will likely change before the end of the semester. Several rounds of calculations and prototyping
may be the result of this project.
6.2 Resources Needed
The bill of materials for the proposed design can be found in Appendix B. This details all the necessary
components to construct a full-scale fixture. It includes the part description, unit cost, total cost, and a link
to where the item cam be purchased. It is important to note the bill of materials does not include any labor
costs that may be required to build the full-size test fixture. Other resources that will be required for
implementation will be computer software. ANSYS and SolidWorks will be utilized to simulate and
model the test fixture. Another resource that will be needed for prototyping is a 3D printer. In addition,
the team will need various textbooks and online resources to continue to refine the test fixture design.
6.3 Implementation, Scheduling, and Budget
Table 4 shows the scheduling for the implementation procedure as described in 6.1. The dates are
tentative and will be revised as the semester progresses. The scheduling may also have to be accelerated
based on capstone requirements.
Table 4: Schedule
Task Estimated Completion Date
Produce Specifications September 10th, 2018
2nd Iteration Bolt Calculations September 24th, 2018
2nd Iteration of Prototyping October 15th, 2018
Quick Assembly Testing October 22nd, 2018
FEA Temperature Profile Modeling October 22nd, 2018
Load and Power Estimates November 5th, 2018
3rd Iteration of Calculations November 26th, 2018
3rd Iteration of Prototyping December 5th, 2018

25
As this is an analytical project, all the team’s expenses came from 3D printing. The overall budget of this
project is approximately $800 which was supplied by the university. However, the team intends to use
less than $200 on 3D printing for prototyping purposes. At this point in time 3D printing is the only
expense, however another potential area of cost is analytical software. Currently only $12.50 has been
spent on 3D printing for the proof of concept prototype. The MakerLab on campus will be used to print
the prototype.
6.4 Design Model
The following image (Figure 20) shows an isometric view of the entire test fixture assembly. The figure
shows the side legs of the test fixture and the universal mounting plate. A radome can also be seen
connected to the square adaptor plate. The universal plate has many bolt holes so that a wide variety of
parts can be easily attached to the fixture. Figure 12 also shows the hydraulic ram and cradle, which will
be used to apply the bending moment about the adapting plate. The heat lamps are not shown but will be
set up in a ring around the missile radome.
Figure 20: Assembly View of Test Fixture
Figure 21 shows an up-close view of the radome and adaptor plate in an exploded view. There is a ring
that attaches the missile to the adaptor plate. The bolts that will hold the assembly together are not shown.
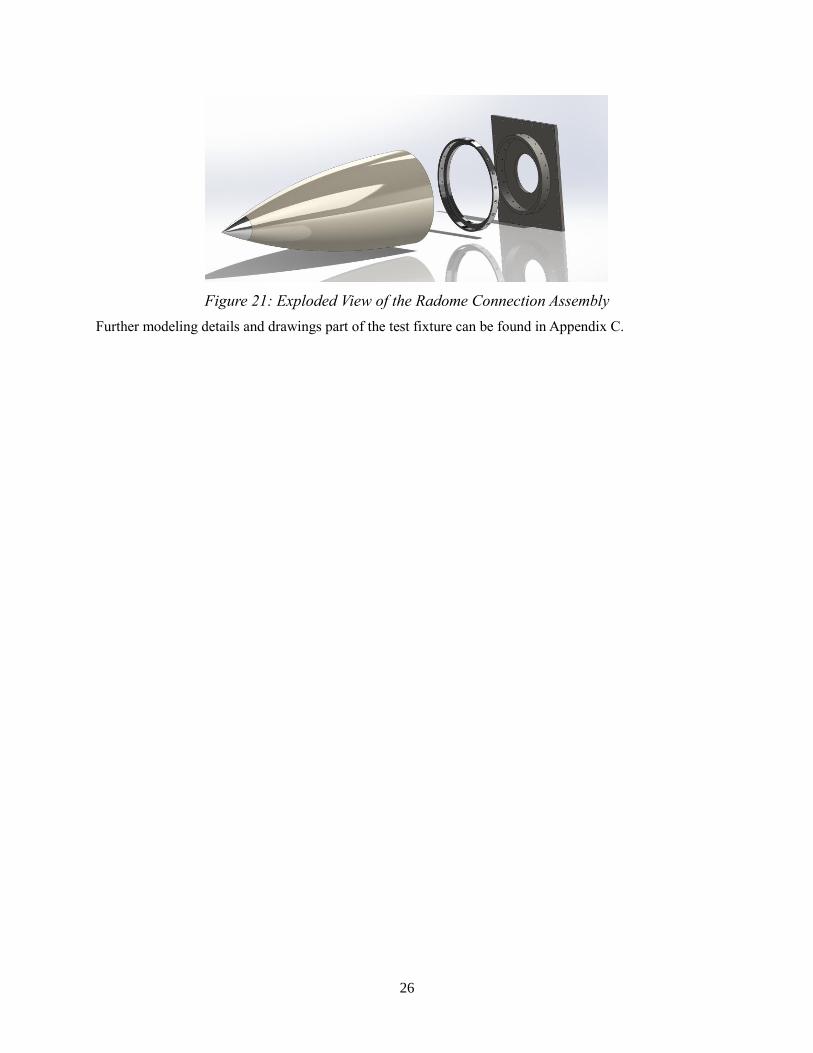
26
Figure 21: Exploded View of the Radome Connection Assembly
Further modeling details and drawings part of the test fixture can be found in Appendix C.

27
7 IMPLEMENTATION – Second Semester
Designing the test fixture is entirely analytical, therefore no physical implementation or manufacturing
will be completed. In place of manufacturing, the team is using analyses to validate that the design is
viable. The following section details the analyses that have been completed this semester. These analyses
are used to justify each design choice. Design changes as a result of each analysis will be discussed as
well.
7.1 Scheduling
In order to validate the design, the team continued the necessary analyses, including second iterations of
thermal loading, mechanical loading, beam, and bolt calculations. Figure 22 shows the schedule for
implementing our design and completing the necessary analyses.
Figure 22: Gantt Chart
For the most part the team stayed on schedule throughout the second semester. However, as the
semester progressed, more analyses that needed to be completed arose and the team had to adjust
for those. For example, while doing the heat flux analyses, it made sense to also look at the
temperature distributions, which was an additional analysis. Also, some of the analyses required
even more iterations than expected. For example, the team ended up completing three iterations
of the beam, bolt, and heat flux calculations.
7.2 Manufacturing
7.2.1 Proof of Concept Prototype
The prototype of the project was made at the end of the first semester to show the audience what the
fixture looks like. It was used to show that the fixture was the right scale and identify any errors that
could only be seen on a physical model. The prototype was modelled in SolidWorks and printed with a
3D printer. An AMRAAM radome is shown on the prototype. The heat lamps are not included in this
prototype. The prototype (Figure 23), is four pieces: the two A-Frames, the plate with radome attached,
and the hydraulic ram. The radome and ram are not exactly to scale.
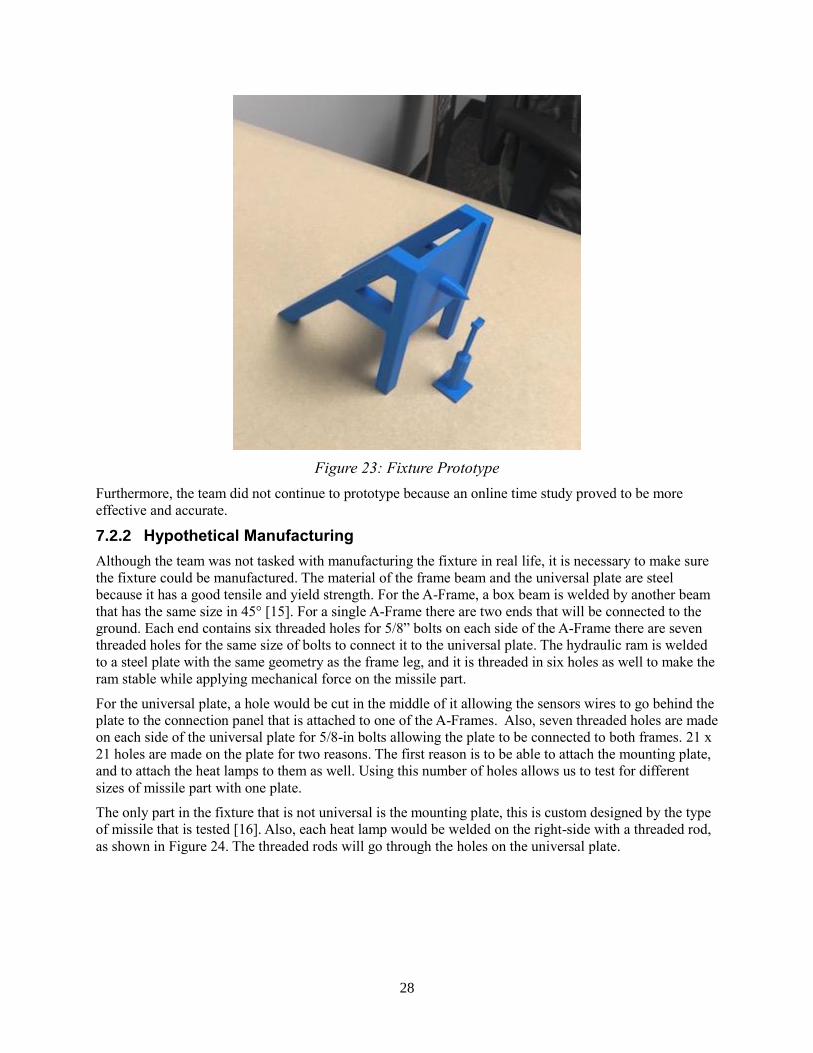
28
Figure 23: Fixture Prototype
Furthermore, the team did not continue to prototype because an online time study proved to be more
effective and accurate.
7.2.2 Hypothetical Manufacturing
Although the team was not tasked with manufacturing the fixture in real life, it is necessary to make sure
the fixture could be manufactured. The material of the frame beam and the universal plate are steel
because it has a good tensile and yield strength. For the A-Frame, a box beam is welded by another beam
that has the same size in 45° [15]. For a single A-Frame there are two ends that will be connected to the
ground. Each end contains six threaded holes for 5/8” bolts on each side of the A-Frame there are seven
threaded holes for the same size of bolts to connect it to the universal plate. The hydraulic ram is welded
to a steel plate with the same geometry as the frame leg, and it is threaded in six holes as well to make the
ram stable while applying mechanical force on the missile part.
For the universal plate, a hole would be cut in the middle of it allowing the sensors wires to go behind the
plate to the connection panel that is attached to one of the A-Frames. Also, seven threaded holes are made
on each side of the universal plate for 5/8-in bolts allowing the plate to be connected to both frames. 21 x
21 holes are made on the plate for two reasons. The first reason is to be able to attach the mounting plate,
and to attach the heat lamps to them as well. Using this number of holes allows us to test for different
sizes of missile part with one plate.
The only part in the fixture that is not universal is the mounting plate, this is custom designed by the type
of missile that is tested [16]. Also, each heat lamp would be welded on the right-side with a threaded rod,
as shown in Figure 24. The threaded rods will go through the holes on the universal plate.
29
Figure 24: Heat Lamp with Threaded Rod
7.3 Analyses
7.3.1 Temperature Distribution Analyses
One analysis that was performed was the temperature distribution analysis. This analysis was completed
in order to influence how the quartz lamps will be placed around the radome and to ensure there is
temperature data for future calculations. It is important that there is not a high temperature differential
surrounding the radome. The heat flux analysis that was discussed earlier was necessary for the
temperature distribution. For this reason, MATLAB was used, and new code was added to the previous
program. Finite-differencing was utilized and the radome was vertically cut into 20 slices. First, heat flux
due to aero heating was found for each slice. Then the height, radius, surface area, contact area, and
volume were found for each slice. After that the heat flux into and out of each slice was computed. This
included fluxes due to convection, conduction, radiation, and aero heating. Figure 25 shows the resistive
network that was used to sum the fluxes.
Figure 25: Resistive Network
Once the fluxes were found, temperatures were computed using the mass, surface area, time of flight, heat
transfer coefficient, and specific heat capacity of each section of the radome. Figure 26 shows the flow
chart of the code.

30
Figure 26: Temperature Distribution Flow Chart
Figure 27 shows the resulting temperatures of each section of nose cone. This model is of AIM-120D
AMRAAM, because the team is using this radome as a baseline. The temperatures only vary from about
125℃ to 160℃ at the base of the radome.
Figure 27: Temperature Results
7.3.2 Heat Flux Distribution Analysis
After the temperature distribution calculations were completed, the heat flux distribution was modelled
using the ray tracing method. Figure 28 shows the schematic used for this method.
Figure 28: Quartz Lamp Schematic
31
Figure 29 shows the six heating elements in each lamp and the rays that extend from each. The surface of
the radome was split into 20 sections, and the number of rays in each was added up. This data was plotted
and curve-fitted as seen in Figure 30.
Figure 29: Ray Tracing for Heat Flux Distribution
Figure 30: Heat Flux Distribution Plot
Both analyses show that in order to have an even heat flux and temperature distribution, the lamps must
be nearly touching each other, and should be 1 to 2 inches away from the radome. This is because the rays
do not extend out very much past the position of the lamp, which is extends from Position 2 to 7. The
team wants to heat each section to with 50 W/cm2 10%. This spacing will ensure that the radome is
evenly heated and is in the same temperature range.
7.3.3 Second Iteration Heat Flux Distribution – lexie
Because the first iteration of the heat flux distribution only showed the behavior qualitatively, further
analysis needed to be completed to determine any quantitative heat flux values. The curve fit in the first
iteration did not fit as well as necessary, so the data was fit again to better match the data. Figure 31
shows the data with the curve fit.
32
Figure 31: Qualitative Heat Flux Distribution
Figure 32 shows the quantitative heat flux distribution. This was found using the above curve fit and the
given value of 50 W/cm2. The lamps span from about Position 4 to 15. The peak at Position 18 is due to
errors in the curve fit.
Figure 32: Quantitative Heat Flux
7.3.4 Second Iteration Compressible Flow
The second analysis performed was the mechanical loading analysis. The loading is generated from two
different modes. High speed flight and extreme G banking. The first load is caused by the vehicle
traveling at Mach 4. At these speeds, immense forces are applied to the nose of the vehicle. The second
load comes from the vehicle banking at 40 G’s. Determining these loads is crucial in the design and
testing of AMRAAM radomes. The lateral loading of the radome was completed last semester so this
section will focus on compressible flow due to traveling at Mach 4.
y = 0.001x4 - 0.0363x3 + 0.4189x2 - 1.404x + 2.1863
0
0.5
1
1.5
2
2.5
3
3.5
4
4.5
0 5 10 15 20
Nu
mb
er o
f R
ays
Position
Heat Flux Distribution
50
51
52
53
54
55
56
57
0 5 10 15 20
Hea
t Fl
ux
(W/c
m2
)
Position
Heat Flux Distribution
33
The longitudinal loading the vehicle experiences is primarily composed of drag due to traveling at Mach
4. This drag force will be calculated utilizing isentropic compressible flow models. More specifically,
oblique shock waves and the resultant drag forces will create a moment if the vehicle changes its angle of
attack.
Figure 33: Oblique Shock Wave on Conical Section
The first step in the analysis is to determine the angle of the oblique shock wave which is designated β
(see Figure 33). The shock wave angle can be determined utilizing figures within the Fundamentals of
Aerodynamics text book. Figure 9.9 on page 613 illustrates the shock wave angle as a function of the
conical section half angle and the speed of flight (see Figure 34). For this example, the half angle of the
cone is 26° and the Mach number is 4. The output of this chart is the angle of the oblique shock wave β.
For this example, β is 40°.
Figure 34: Figure 9.9 from Fundamentals of Aerodynamics [10]
The next step in the analysis is to determine the pressure difference after the shock wave. Appendix B of
Fundamentals of Aerodynamics text book will be utilized for this result. Having determined that the air
speed after the shock wave is Mach 2.6, Appendix B then tells us that the ratio of pressure before and
after the shock wave will be 7.72.

34
Figure 35: Appendix B from Fundamentals of Aerodynamics [10]
Now that the pressure post shock wave is known, all of the information required to calculate the
coefficient of drag is available. The equation for the coefficient of drag is:
Where γ is the ratio of specific heat for air. This coefficient of drag can now be used to determine the
force of drag that the AMRAAM radome experiences along with the moment being applied to the base.
The force of drag is found using:
35
After calculating the lateral and longitudinal forces on the radome, it becomes clear that there are
enormous forces being applied to the quartz. The final calculation from equation 6 shows the vehicle
traveling at Mach 4 and with a 10° angle of attack will produce a moment of 45,503 in-lb. The lateral
force due to a 40G turn was calculated to be 7,612 lbs creating a moment of 49,098 in-lb. Fortunately for
the vehicle, the maximum longitudinal and lateral forces will not happen simultaneously. These
calculations can now be used to determine the requirements of the test fixture. Ultimately, it was shown
that the moments from 40G turns and full speed maneuvers produce similar moments. The value of
49,000 in-lb will be used in further calculation of our test fixture to determine the size and dimensions of
the structure.
SUMMARY OF RESULTS
Maximum Force Due to 40G Turn ……………………………….…..……7,612 [lbf]
Maximum Drag Force Due to Mach 4 Velocity ……………….…………40,627 [lbf]
Maximum Moment Due to Turn …………….…………..………..….…49,098 [in-lb]
Maximum Moment Due to Velocity …………………...…………….…19,404 [in-lb]
7.3.5 Second Iteration Beams
This analysis is about getting the right size of the beams, using the maximum force applied on an
AMRAAM radome. Based on the geometry of the fixture and the maximum force that would be applied
to a missile part, allowing ten inches between the base on the part and the hydraulic ram. The force should
be split in half and the calculation would be for one of the uprights. The reaction forces have also been
calculated all over a single A-Frame beams in order to get the maximum moment in order to get the
maximum stress on the upright. The material is YST 310 steel, which has a high yield strength and the
factor of safety of four. Next, considering the moment of inertia for a square hollow section will get us the
dimensions of the cross section needed. After that, using the density of steel and the dimensions of the
beam gave us the weight of a single upright which is 331 kg. Figure 31 shows the table that was used to
choose the beam size.

36
Figure 36: Properties of square hollow section [14]
7.3.6 Second Iteration Floor Bolts
The second iteration of the bolt analysis focuses primarily on the fasteners that hold each of the four legs
into the ground, keeping the entire fixture in place under any loading condition applied. Although the only
directly applied force from the hydraulic is applied onto the radome, each of the legs of the test fixture
receives a reaction force. These reaction forces, based upon the applied force on the radome, will
determine whether the entire fixture will be able to withstand the load on the radome. Firstly, there are a
few variables that the team has either calculated or were specifically given by the client; these
specifications will remain unchanged as all other variables are determined. The client has stated that the
bolts used in securing the fixture to the floor must be 5/8-in diameter bolts with 18 threads per inch. The
fixture must be able to handle and apply conditions to a variety of radome lengths and diameter sizes. For
the sake of consistency across all fixture analysis the team has decided to use a radome 17 in. in length
and 7 in. in diameter. The final parameter was the moment about half the radome’s diameter, located at
the connection point between the radome and the AMRAAM mounting ring, Mc. The moment created was
49,098 in-lbf, which was established from the aforementioned compressible flow calculations. For the
purpose of this analysis and in the manner the calculation program operates, the value of the force applied

37
on the radome, Fa, and its distance from the connection point, LAC, are arbitrary values and can be
adjusted at any time; the only constraint is that LAC must be greater than 6 in. due to the extension length
of the heat lamps from the mounting plate. Given Mc, LAC was selected to be 8 in., meaning Fa is 3,608.62
lbf applied on the radome.
Approaching the design from a side profile as seen in the figure called Upright, to solve for the reaction
forces at the front leg, named point B, and the back leg, named point D, the moment about point D must
be calculated to find FD. To find these moments, it's important to also know the various distances between
each of the points where either a moment occurs, or a force is applied. Finally, finding the reaction forces
requires the sum of the forces at equilibrium in the Y direction to solve for the reaction forces Fa, FB, FC.
It is to be noted that the force at point B puts the bolts in tension, while the force at point D puts the bolts
in compression. This however, should not affect the test results of the bolt integrity. The results are as
follows, summarized in Table 5.
Table 5: Summarized Floor Bolt Force Results and Distances
Point Type / Name Point Location Force at Point Location [lbf]
Point A Applied force on radome 3068.62
Point B Center of base of front leg 4196.11
Point C Given moment at mounting ring ---
Point D Center of base of back leg 1127.49
Relevant Distances Distance Value [in]
Length AB 8.25
Length AC 8
Length AD 74.25
Length BD 66
Length BC 0.25
Length CD 66.25
7.3.7 Quartz Lamp Requirements
Quartz lamps required three major items to work: water, air, and power. Each heater operates at 6 kW
with a voltage of 240 V. Testing an AMRAAM radome for example takes eight heaters touching side by
side. The power control system is model 915 [17], and it is wired to the junction box. Control current or
voltage from 0 to 97% with 0.1% resolution, which is highly accurate. Water and air are required to cool
the lamps after testing. The cooling process takes three to four minutes to be safe to touch. All the inlet
tubes would be connected to each other from one heater to the other and the same with the outlet water,
allowing to use only one water pump for the system. Using two tanks of forty gallons capacity, the water
flow rate is 10 gallons per minute and the temperature of the water is room temperature. For the
compressed air, cooling air flow is 4 SCFM at 3 PSI with a regenerative blower for each heater of 20
CFM at 6.2 PSI. Table 6 shows the amount of energy required for each test time for different numbers of
lamps.

38
Table 6: Amount of Energy Required for Lamps
Test time 8 Lamps (kwh) 10 Lamps (kwh) 12 Lamps (kwh)
30 seconds 0.4 0.45 0.5
45 seconds 0.6 0.675 0.75
1 minute 0.8 0.9 1
2 minutes 1.6 1.8 2
3 minutes 2.4 2.7 3
7.4 Design Changes
7.4.1 Quartz Lamps
One way that the test fixture design has changed is the way the quartz lamps will be arranged and what
model will be used. Previously, the team did not have a design for an apparatus to hold the lamps. Now,
the lamps will each be attached to a bracket that inserts into a hole in the universal plate. This design was
chosen because it fits easily with the current design and can cater to the size of the radome; lamps can be
added or removed. Model 5209 with 5 in. of lighted length are the chosen lamps because they can provide
the right heat flux and fit best with the design [13]. The team is using shorter lamps because the base of
the radome is the most important section, and the rest of the radome does not need to be heated. Having
shorter lamps also allows more room to apply the mechanical loading using the ram. Due to the above
heat flux and temperature analyses, the lamps will be nearly touching and will be 1 to 2 in. from the
radome. The spacing of the lamps is influenced by the analyses detailed in Section 7.1.1.
Figure 37: Heat Lamps Attached to Plate
7.4.2 Beams
The recent calculation of beams has changed the dimensions of the cross section of the beam, before we
just assumed the dimensions without knowing the amount of stress on the system. But at this moment
considering the stresses on the beam, it should be 220 mm x 220 mm, with thickness of 12 mm. Also, the
material is YST 310 steel which has the highest yield strength among the other types of steel. These
conclusions are a result of the second iteration of the beam calculations.
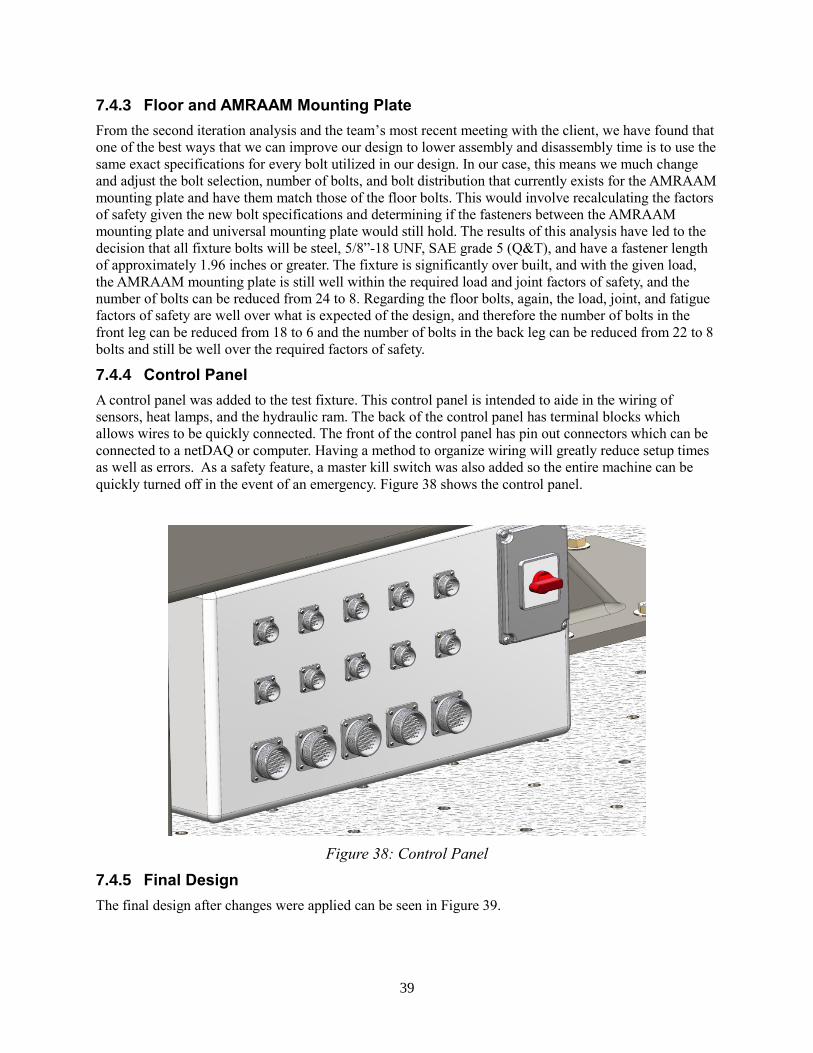
39
7.4.3 Floor and AMRAAM Mounting Plate
From the second iteration analysis and the team’s most recent meeting with the client, we have found that
one of the best ways that we can improve our design to lower assembly and disassembly time is to use the
same exact specifications for every bolt utilized in our design. In our case, this means we much change
and adjust the bolt selection, number of bolts, and bolt distribution that currently exists for the AMRAAM
mounting plate and have them match those of the floor bolts. This would involve recalculating the factors
of safety given the new bolt specifications and determining if the fasteners between the AMRAAM
mounting plate and universal mounting plate would still hold. The results of this analysis have led to the
decision that all fixture bolts will be steel, 5/8”-18 UNF, SAE grade 5 (Q&T), and have a fastener length
of approximately 1.96 inches or greater. The fixture is significantly over built, and with the given load,
the AMRAAM mounting plate is still well within the required load and joint factors of safety, and the
number of bolts can be reduced from 24 to 8. Regarding the floor bolts, again, the load, joint, and fatigue
factors of safety are well over what is expected of the design, and therefore the number of bolts in the
front leg can be reduced from 18 to 6 and the number of bolts in the back leg can be reduced from 22 to 8
bolts and still be well over the required factors of safety.
7.4.4 Control Panel
A control panel was added to the test fixture. This control panel is intended to aide in the wiring of
sensors, heat lamps, and the hydraulic ram. The back of the control panel has terminal blocks which
allows wires to be quickly connected. The front of the control panel has pin out connectors which can be
connected to a netDAQ or computer. Having a method to organize wiring will greatly reduce setup times
as well as errors. As a safety feature, a master kill switch was also added so the entire machine can be
quickly turned off in the event of an emergency. Figure 38 shows the control panel.
Figure 38: Control Panel
7.4.5 Final Design
The final design after changes were applied can be seen in Figure 39.

40
Figure 39: Final Design Isometric View
Figure 40 shows a close-up view of the lamps with the air, power, and water lines.
Figure 40: Close-Up of Radome and Lamps
8 Testing
8.1 Introduction
The following sections detail the testing that was performed in order to validate that the system fulfills all
the target values for each engineering requirement. In cases that the system does not hit the requirement,
explanations and justified redesigns are proposed. All testing was performed analytically. Table 6 shows
what each target value is. A more detailed section on why the customer and engineering requirements
were chosen is Section 2.
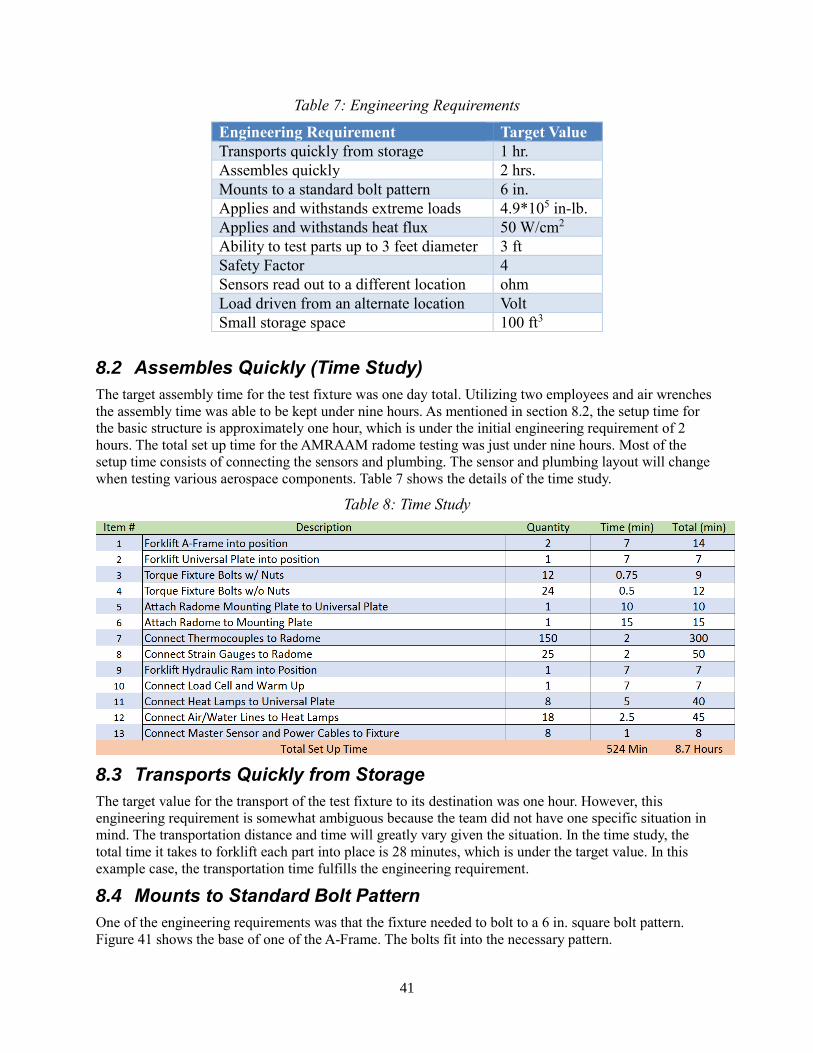
41
Table 7: Engineering Requirements
Engineering Requirement Target Value
Transports quickly from storage 1 hr.
Assembles quickly 2 hrs.
Mounts to a standard bolt pattern 6 in.
Applies and withstands extreme loads 4.9*105 in-lb.
Applies and withstands heat flux 50 W/cm2
Ability to test parts up to 3 feet diameter 3 ft
Safety Factor 4
Sensors read out to a different location ohm
Load driven from an alternate location Volt
Small storage space 100 ft3
8.2 Assembles Quickly (Time Study)
The target assembly time for the test fixture was one day total. Utilizing two employees and air wrenches
the assembly time was able to be kept under nine hours. As mentioned in section 8.2, the setup time for
the basic structure is approximately one hour, which is under the initial engineering requirement of 2
hours. The total set up time for the AMRAAM radome testing was just under nine hours. Most of the
setup time consists of connecting the sensors and plumbing. The sensor and plumbing layout will change
when testing various aerospace components. Table 7 shows the details of the time study.
Table 8: Time Study
8.3 Transports Quickly from Storage
The target value for the transport of the test fixture to its destination was one hour. However, this
engineering requirement is somewhat ambiguous because the team did not have one specific situation in
mind. The transportation distance and time will greatly vary given the situation. In the time study, the
total time it takes to forklift each part into place is 28 minutes, which is under the target value. In this
example case, the transportation time fulfills the engineering requirement.
8.4 Mounts to Standard Bolt Pattern
One of the engineering requirements was that the fixture needed to bolt to a 6 in. square bolt pattern.
Figure 41 shows the base of one of the A-Frame. The bolts fit into the necessary pattern.
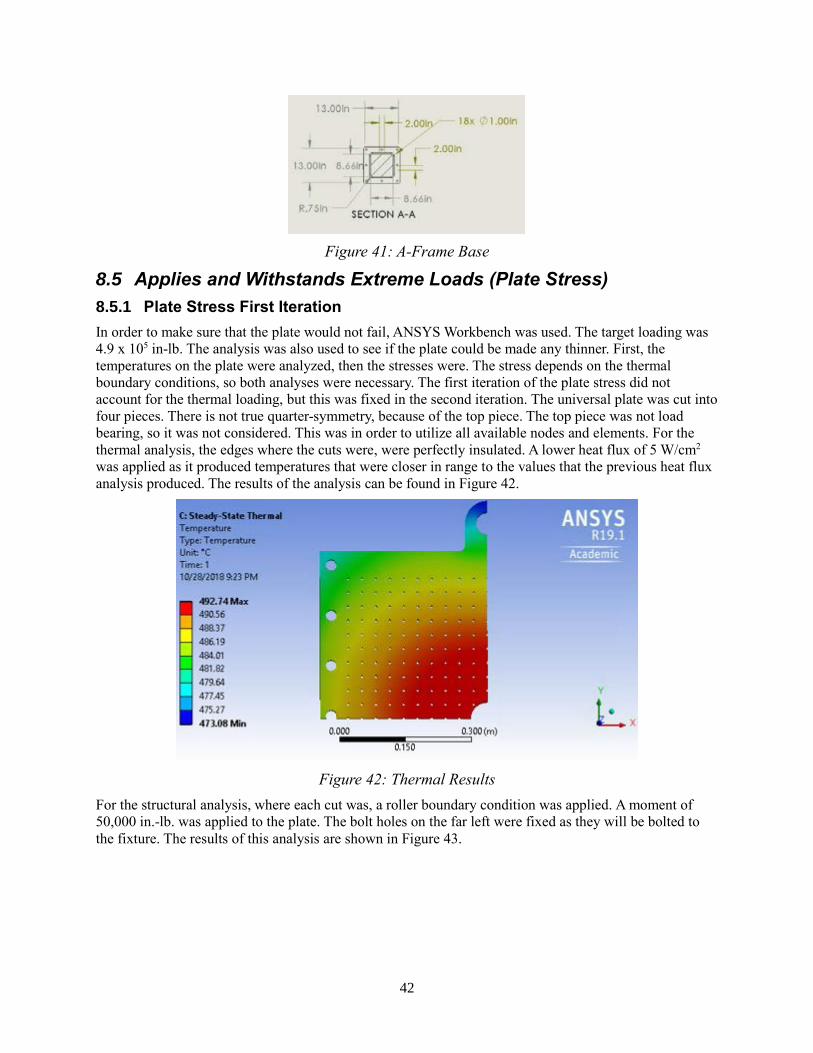
42
Figure 41: A-Frame Base
8.5 Applies and Withstands Extreme Loads (Plate Stress)
8.5.1 Plate Stress First Iteration
In order to make sure that the plate would not fail, ANSYS Workbench was used. The target loading was
4.9 x 10⁵ in-lb. The analysis was also used to see if the plate could be made any thinner. First, the
temperatures on the plate were analyzed, then the stresses were. The stress depends on the thermal
boundary conditions, so both analyses were necessary. The first iteration of the plate stress did not
account for the thermal loading, but this was fixed in the second iteration. The universal plate was cut into
four pieces. There is not true quarter-symmetry, because of the top piece. The top piece was not load
bearing, so it was not considered. This was in order to utilize all available nodes and elements. For the
thermal analysis, the edges where the cuts were, were perfectly insulated. A lower heat flux of 5 W/cm2
was applied as it produced temperatures that were closer in range to the values that the previous heat flux
analysis produced. The results of the analysis can be found in Figure 42.
Figure 42: Thermal Results
For the structural analysis, where each cut was, a roller boundary condition was applied. A moment of
50,000 in.-lb. was applied to the plate. The bolt holes on the far left were fixed as they will be bolted to
the fixture. The results of this analysis are shown in Figure 43.
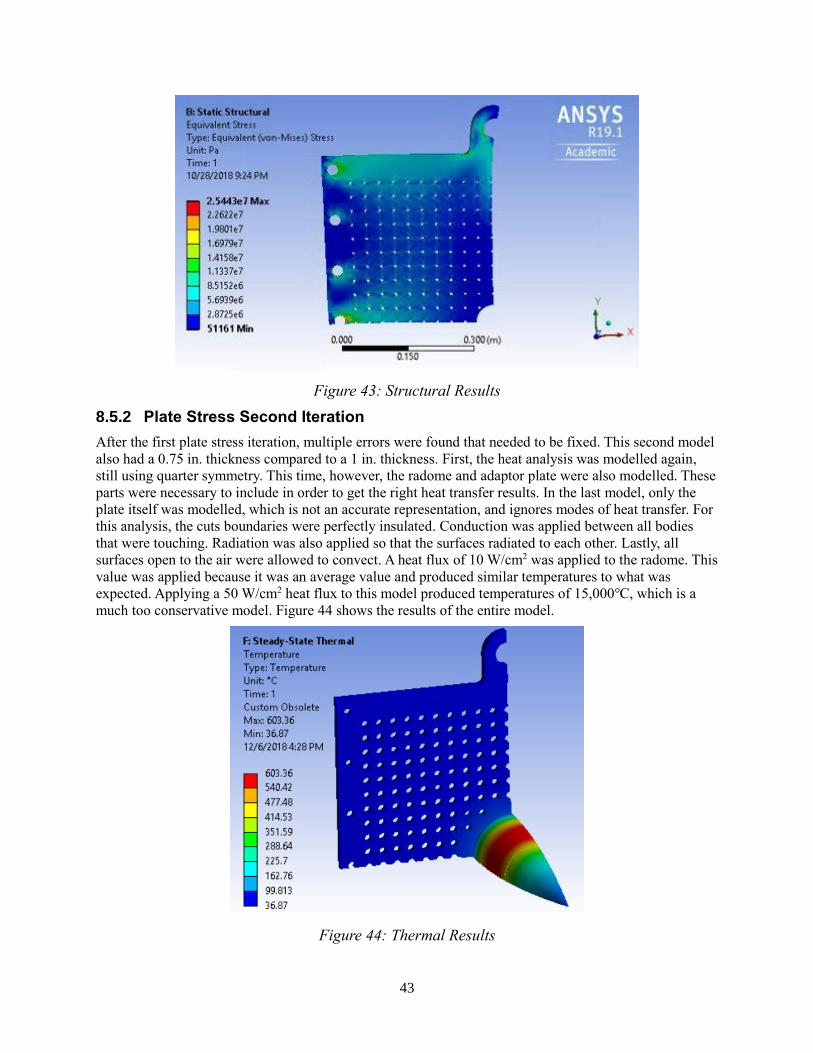
43
Figure 43: Structural Results
8.5.2 Plate Stress Second Iteration
After the first plate stress iteration, multiple errors were found that needed to be fixed. This second model
also had a 0.75 in. thickness compared to a 1 in. thickness. First, the heat analysis was modelled again,
still using quarter symmetry. This time, however, the radome and adaptor plate were also modelled. These
parts were necessary to include in order to get the right heat transfer results. In the last model, only the
plate itself was modelled, which is not an accurate representation, and ignores modes of heat transfer. For
this analysis, the cuts boundaries were perfectly insulated. Conduction was applied between all bodies
that were touching. Radiation was also applied so that the surfaces radiated to each other. Lastly, all
surfaces open to the air were allowed to convect. A heat flux of 10 W/cm2 was applied to the radome. This
value was applied because it was an average value and produced similar temperatures to what was
expected. Applying a 50 W/cm2 heat flux to this model produced temperatures of 15,000℃, which is a
much too conservative model. Figure 44 shows the results of the entire model.
Figure 44: Thermal Results

44
Figure 45 shows the temperature results on just the plate.
Figure 45: Thermal Plate Results
After the thermal analysis was completed, the solution to that model was imported to a new structural
model. This model was set up the same as the first iteration but used the thermal results as well. As seen
in Figure 46, most sections of the plate are well below the yield strength of steel, however, some higher
stresses occur due to the shape of the adaptor plate, which will change with each radome. Therefore, the
plate fulfills the engineering requirement of handling large amounts of mechanical loading.
Figure 46: Plate Principal Stress Results

45
8.6 Applies and Withstands Heat Flux
In order to validate that the test applies a correct amount of heat flux, the code that was used to determine
the correct heat flux for flight conditions was modified to apply a constant heat flux, which is
representative of the test environment. Figure 47 shows the temperatures in flight, and Figure 48 shows
the temperatures during the test. The lamps apply a heat flux of 50 W/cm2 to the aft half of the radome,
which is the area of concern. The goal of the plots was to show that the temperatures in test meet or
exceed the temperatures in flight.
`
Figure 47: Temperatures in Flight
Figure 48: Temperatures in Test
8.7 Ability to Test Parts of All Sizes
One of the other engineering requirements is the ability to test parts of sizes up to a three ft. diameter. The
team chose a universal plate with many holes to fulfill this need. Figure 49 shows the dimensions of the
universal plate. The plate is 30 in. wide, which does not quite meet the three-foot diameter requirement.
However, the radome adaptor ring could be modified so that a very large missile could still be tested. In
the case that a large radome could not be tested in this way, the plate would need to be made 6 in. wider
and taller to fit a three ft. radome.

46
Figure 49: Universal Plate Dimensions
8.8 Safety Factor
For safety factor, all factories and companies are required to follow OSHA standards, according to OSHA
the factor of safety must be four or more. When mechanical loading applies the maximum force on the
missile part, the factor of safety of the weakest point at the A-Frame would be 4.23 and the rest of the
beam would be higher considering the moment will be less on these points. On the universal plate, while
applying force, some nodes exposed to high stress, the maximum stress can a node take is 200 MPa,
which will make the factor of safety 1.25 on the maximum point. Increasing the cross-section area would
reduce the maximum stress, but there is no need to cause the rest of the nodes would have factor of safety
between five and nine. Also, the deformation would not happen even on the max stress node which would
make it safe to use. The load factor of safety of the adapter plate is 10.37. For the A-Frame leg the
maximum stress has a load factor of safety of 7.7. Therefore, the fixture will be safe to use at the
maximum force applied by the hydraulic ram once the fixture gets assembled.
8.9 Sensors
While there was no specific target value for the sensors, the team incorporated them into the design. The
sensors would be attached inside the missile part then the part would be attached to the universal plate.
All the wires will go through the plate to the circular connectors and terminal blocks on one of the A-
Frames, and that would be connected to a computer to show the data of the test. The sensors that would be
used in the test are thermocouples, strain gauges, and linear variable displacement transducers. The
concern was how many sensors it would take to make the data accurate and to cover the entire part. Fifty
to a hundred stain gauges and thermocouples would be distributed inside the part depending on the size of
the missile part.
8.10 Load Driven from Alternate Location
The fixture has three parts that need to transfer from storage to the test location using forklift, two A-
Frames and the universal plate. The forklift can carry 5,500 lbs. as a maximum weight, each A-Frame has
730 lbs., and the universal plate is about 116 lbs., so the forklift that will transfer the fixture has no
problem with the weight. But, the lane between the storage to the test location must be at least 90 inches
width, the A-Frame has 75 inches in width, allowing at least seven inches on both sides.

47
8.11 Small Storage Space
To make the fixture accessible and convenient for the user, the fixture design must be easily stored and fit
within a space consisting of a volume of 100 ft3. Although this test cannot be physically performed, the
test fixture was designed in such a way that it can be quickly and easily disassembled, and its major
components stacked and stored flat. Given that the dimensions of each individual part of the fixture is
known, when disassembled, the team can confidently estimate that the design will comfortably fit within
the required storage volume.
8.12 Thermal Expansion in the Bolts
A matter mentioned in a formal team meeting by the client regarding structural soundness during extreme
loading, was bolt reliability under high temperature and heat fluxes. Communicated by Chuck, it became
a concern that the fasteners used in the design were more likely to fail due to high thermal loading, with
additional mechanical loading, than large applications of mechanical loading alone. Discovered in the
mounting plate bolt calculations from section 5.2.4, under mechanical loading exclusively, the fasteners
will hold, and the system will not fail. The aim of the bolt thermal expansion test calculation was to
identify the stress the bolts will experience due to the applied thermal load, and then determine the
amount of deflection that will occur under these conditions. Minor deflection is expected in such an
environment, but this test is to assure that bolt deflection is minimal and will have no noticeable effects
on radome testing. Based on the previously calculated heat fluxes, applied temperature properties, and
minimal time exposure to this environment, it is fair to assume that any thermal applications that will
encounter the floor bolts or the bolts that connect the universal mounting plate to the rest of the fixture
will be so insignificant that their affects are negligible. The bolts that will experience the greatest
deflection during a test and therefore will require testing analysis are the adapter plate bolts, which are
located closest to the heat source. The calculated results from this test predicted a thermal loading stress
43.8 KSI. The notable output of this analysis revealed that each bolt would only deflect .00363 inches.
Confirming this result with the client proved that the effects of deflection due to thermal loading are so
insignificant that it will not compromise any sector of the fixture, signifying that the current bolt
arrangement is satisfactory.
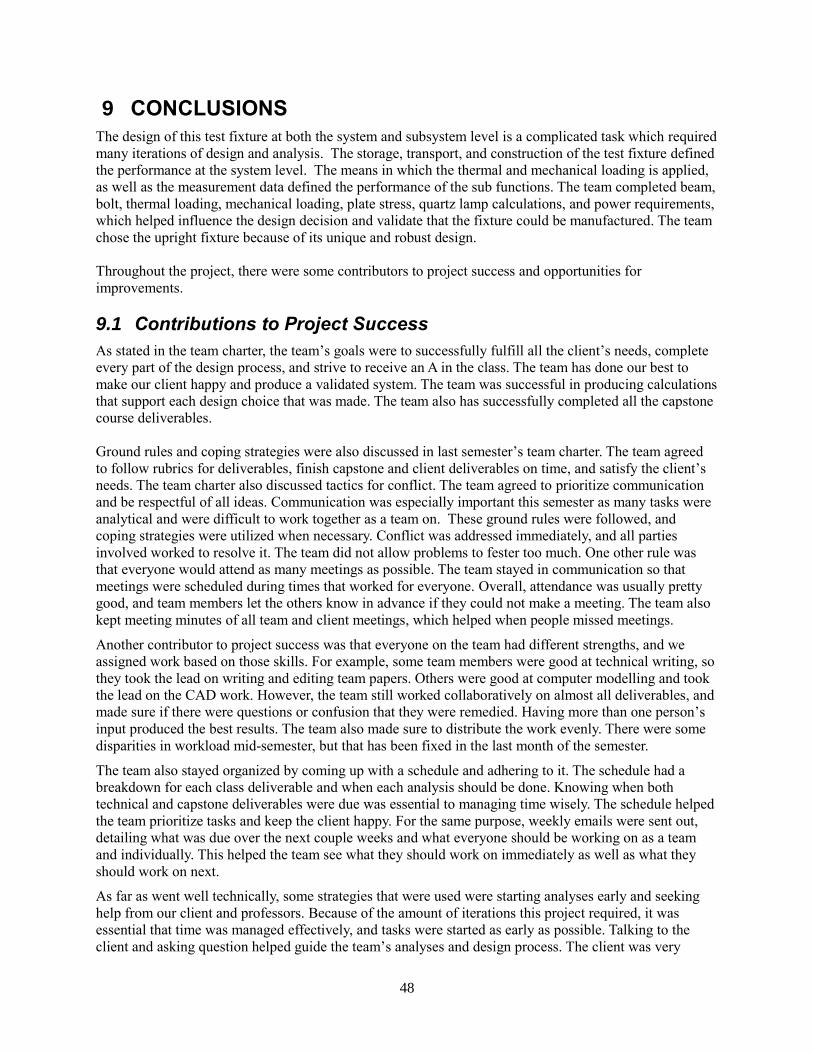
48
9 CONCLUSIONS
The design of this test fixture at both the system and subsystem level is a complicated task which required
many iterations of design and analysis. The storage, transport, and construction of the test fixture defined
the performance at the system level. The means in which the thermal and mechanical loading is applied,
as well as the measurement data defined the performance of the sub functions. The team completed beam,
bolt, thermal loading, mechanical loading, plate stress, quartz lamp calculations, and power requirements,
which helped influence the design decision and validate that the fixture could be manufactured. The team
chose the upright fixture because of its unique and robust design.
Throughout the project, there were some contributors to project success and opportunities for
improvements.
9.1 Contributions to Project Success
As stated in the team charter, the team’s goals were to successfully fulfill all the client’s needs, complete
every part of the design process, and strive to receive an A in the class. The team has done our best to
make our client happy and produce a validated system. The team was successful in producing calculations
that support each design choice that was made. The team also has successfully completed all the capstone
course deliverables.
Ground rules and coping strategies were also discussed in last semester’s team charter. The team agreed
to follow rubrics for deliverables, finish capstone and client deliverables on time, and satisfy the client’s
needs. The team charter also discussed tactics for conflict. The team agreed to prioritize communication
and be respectful of all ideas. Communication was especially important this semester as many tasks were
analytical and were difficult to work together as a team on. These ground rules were followed, and
coping strategies were utilized when necessary. Conflict was addressed immediately, and all parties
involved worked to resolve it. The team did not allow problems to fester too much. One other rule was
that everyone would attend as many meetings as possible. The team stayed in communication so that
meetings were scheduled during times that worked for everyone. Overall, attendance was usually pretty
good, and team members let the others know in advance if they could not make a meeting. The team also
kept meeting minutes of all team and client meetings, which helped when people missed meetings.
Another contributor to project success was that everyone on the team had different strengths, and we
assigned work based on those skills. For example, some team members were good at technical writing, so
they took the lead on writing and editing team papers. Others were good at computer modelling and took
the lead on the CAD work. However, the team still worked collaboratively on almost all deliverables, and
made sure if there were questions or confusion that they were remedied. Having more than one person’s
input produced the best results. The team also made sure to distribute the work evenly. There were some
disparities in workload mid-semester, but that has been fixed in the last month of the semester.
The team also stayed organized by coming up with a schedule and adhering to it. The schedule had a
breakdown for each class deliverable and when each analysis should be done. Knowing when both
technical and capstone deliverables were due was essential to managing time wisely. The schedule helped
the team prioritize tasks and keep the client happy. For the same purpose, weekly emails were sent out,
detailing what was due over the next couple weeks and what everyone should be working on as a team
and individually. This helped the team see what they should work on immediately as well as what they
should work on next.
As far as went well technically, some strategies that were used were starting analyses early and seeking
help from our client and professors. Because of the amount of iterations this project required, it was
essential that time was managed effectively, and tasks were started as early as possible. Talking to the
client and asking question helped guide the team’s analyses and design process. The client was very
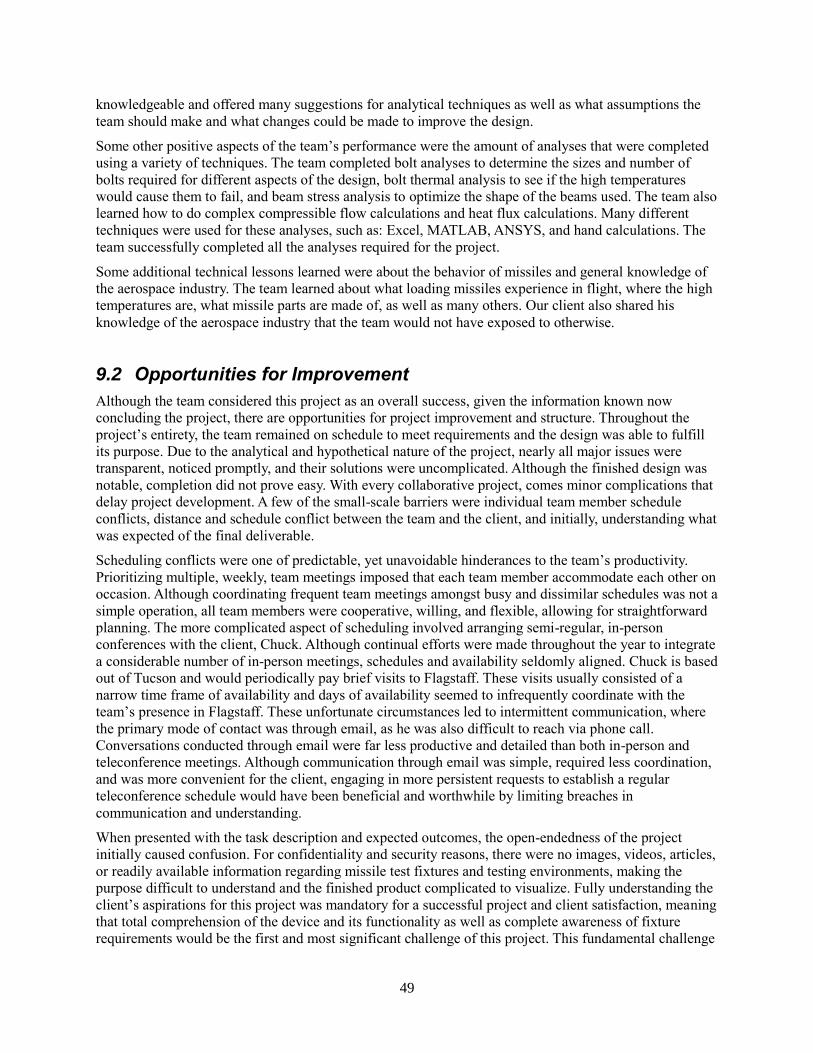
49
knowledgeable and offered many suggestions for analytical techniques as well as what assumptions the
team should make and what changes could be made to improve the design.
Some other positive aspects of the team’s performance were the amount of analyses that were completed
using a variety of techniques. The team completed bolt analyses to determine the sizes and number of
bolts required for different aspects of the design, bolt thermal analysis to see if the high temperatures
would cause them to fail, and beam stress analysis to optimize the shape of the beams used. The team also
learned how to do complex compressible flow calculations and heat flux calculations. Many different
techniques were used for these analyses, such as: Excel, MATLAB, ANSYS, and hand calculations. The
team successfully completed all the analyses required for the project.
Some additional technical lessons learned were about the behavior of missiles and general knowledge of
the aerospace industry. The team learned about what loading missiles experience in flight, where the high
temperatures are, what missile parts are made of, as well as many others. Our client also shared his
knowledge of the aerospace industry that the team would not have exposed to otherwise.
9.2 Opportunities for Improvement
Although the team considered this project as an overall success, given the information known now
concluding the project, there are opportunities for project improvement and structure. Throughout the
project’s entirety, the team remained on schedule to meet requirements and the design was able to fulfill
its purpose. Due to the analytical and hypothetical nature of the project, nearly all major issues were
transparent, noticed promptly, and their solutions were uncomplicated. Although the finished design was
notable, completion did not prove easy. With every collaborative project, comes minor complications that
delay project development. A few of the small-scale barriers were individual team member schedule
conflicts, distance and schedule conflict between the team and the client, and initially, understanding what
was expected of the final deliverable.
Scheduling conflicts were one of predictable, yet unavoidable hinderances to the team’s productivity.
Prioritizing multiple, weekly, team meetings imposed that each team member accommodate each other on
occasion. Although coordinating frequent team meetings amongst busy and dissimilar schedules was not a
simple operation, all team members were cooperative, willing, and flexible, allowing for straightforward
planning. The more complicated aspect of scheduling involved arranging semi-regular, in-person
conferences with the client, Chuck. Although continual efforts were made throughout the year to integrate
a considerable number of in-person meetings, schedules and availability seldomly aligned. Chuck is based
out of Tucson and would periodically pay brief visits to Flagstaff. These visits usually consisted of a
narrow time frame of availability and days of availability seemed to infrequently coordinate with the
team’s presence in Flagstaff. These unfortunate circumstances led to intermittent communication, where
the primary mode of contact was through email, as he was also difficult to reach via phone call.
Conversations conducted through email were far less productive and detailed than both in-person and
teleconference meetings. Although communication through email was simple, required less coordination,
and was more convenient for the client, engaging in more persistent requests to establish a regular
teleconference schedule would have been beneficial and worthwhile by limiting breaches in
communication and understanding.
When presented with the task description and expected outcomes, the open-endedness of the project
initially caused confusion. For confidentiality and security reasons, there were no images, videos, articles,
or readily available information regarding missile test fixtures and testing environments, making the
purpose difficult to understand and the finished product complicated to visualize. Fully understanding the
client’s aspirations for this project was mandatory for a successful project and client satisfaction, meaning
that total comprehension of the device and its functionality as well as complete awareness of fixture
requirements would be the first and most significant challenge of this project. This fundamental challenge

50
delayed the progression of the design process but spending the initial weeks of the project consistently
meeting with the client for further clarification and more explicit fixture illustrations, configuring a
reasonable, organized, and achievable method of approach, and arranging individual project obligations
proved to mitigate related issues following the foundation of these operations and procedures.
Being that the project is primarily analytical, most of the team’s greatest challenges were due to the
hypothetical nature of this project. From the project’s beginning, the team was not given the opportunity
to view or access the testing environment or visually inspect, analyze, or observe the current state and
functionality of the test fixture. Without even any access to exact fixture specifications or performance
data, the team was missing some significant information and considerably lacked resources. This was also
true of all similarly purposed testing equipment and devices, which hindered conceptual understanding
and visualization of part testing and turned existing and comparable design research into an unnecessarily
laborious task. With Chuck being the only and most reliable source of missile test fixture information, it
was imperative to assure that all questions were thoroughly answered and that all other detailed or desired
information was noted in full.
Even though the fixture’s functionality and plausibility were verified by an extensive series of
calculations, it would have been ideal to have a physically existing test fixture concluding the project.
Due to time, resource, and financial limitations, it would not be realistic for a group of four people to
forge a functional and safe missile test fixture. Had the team been granted the opportunity to manufacture
the final test fixture design, the team would have more substantial testing proof that the design was safe,
practical, and able to meet all engineering requirements as stated.

51
10 REFERENCES
[1] R. Cunnington, "Recommended Aeroheating Methods", Teleconference, 2018.
[2] Gulfstream Aerospace, "Ultimate Load Test I,” 2016. [Online]. Available:
https://www.youtube.com/watch?v=UGFZ7OWlNpo. [Accessed Feb. 5, 2018].
[3] Suess, R., Weckesser, L. "Radome Thermal Design for a Mach 4 Missile", 2018. [online]. Available at:
http://www.jhuapl.edu/techdigest/views/pdfs/V03_N6_1964/V3_N6_1964_Suess.pdf [Accessed 5
May 2018].
[4] Voracek, D., Reaves, M., Horta, L., Potter, S. "Ground and Flight Test Structural Excitation Using
Piezoelectric Actuators", 2018 [online]. Available at:
https://ntrs.nasa.gov/archive/nasa/casi.ntrs.nasa.gov/20020065233.pdf [Accessed 5 May 2018].
[5] Richards, W., Fields, R., & DeAngelis, M. (2004). Combined Loads Test Fixture for Thermal-
Structural Testing Aerospace Vehicle Panel Concepts - NASA/TM-2004-212039
[6] Steinetz, B. (1990). A test fixture for measuring high-temperature hypersonic-engine seal performance
- NASA-TM-103658.
[7] NASA Armstrong Flight Research Center "Composite Material Loads Testing,” 2016. [Online].
Available: https://www.youtube.com/watch?v=OeS1_h1doQg. [Accessed Aug. 19, 2016].
[8] HDT Global Inc. 2012. [Online]. Available: http://www.braider.com/Case-Studies/High-Pressure-
Airbeam.aspx. [Accessed FEB. 31, 2018]
[9] What is Hybrid Composite Beam, 2012. [Online] Available; http://innovativeglobal.net/products/hc-
bridge/. [Accessed Apr. 21, 2018].
[10] J.D. Anderson, Jr., Fundamentals of Aerodynamics. New York, NY: Mc Graw Hill, 2011
pp. 555-776, 1053-1057
[11] K. J. Anusavice and R. W. Phillips, Phillips science of dental materials. St. Louis, MO: Saunders,
2003.
[12] W. A. Nash and M. C. Potter, Schaums outlines: strength of materials. New York: McGraw Hill
Education, 2014
[13] Pcscontrols.com. (2018). [online] Available at:
http://www.pcscontrols.com/sites/default/files/HiTempIR%20Model5209%20User%20Manual.pdf
[Accessed 9 Oct. 2018].
[14] JSL Ispat Pvt. Ltd. (n.d.). Retrieved October 11, 2018, from http://www.jslispat.com/ [Accessed 23
Sep. 2018].
[15] Swanton Welding. Swanton Welding. [Online]. Available: https://swantonweld.com/. [Accessed: 06-
Dec-2018].
[16] Custom Machined Component Parts Made to Your Exact Specifications,” Custom Component Part
Manufacturers of Wisconsin. [Online]. Available: http://www.jonestools.com/CNCMachineParts.
[Accessed: 06-Dec-2018].
[17] Precision Control Systems, Inc. and Research Inc, “Model 910 & 915,” Precision Control Systems,
Inc. Research Inc. [Online]. Available: http://www.pcscontrols.com/controlir/model-910-915. [Accessed:
06-Dec-2018].
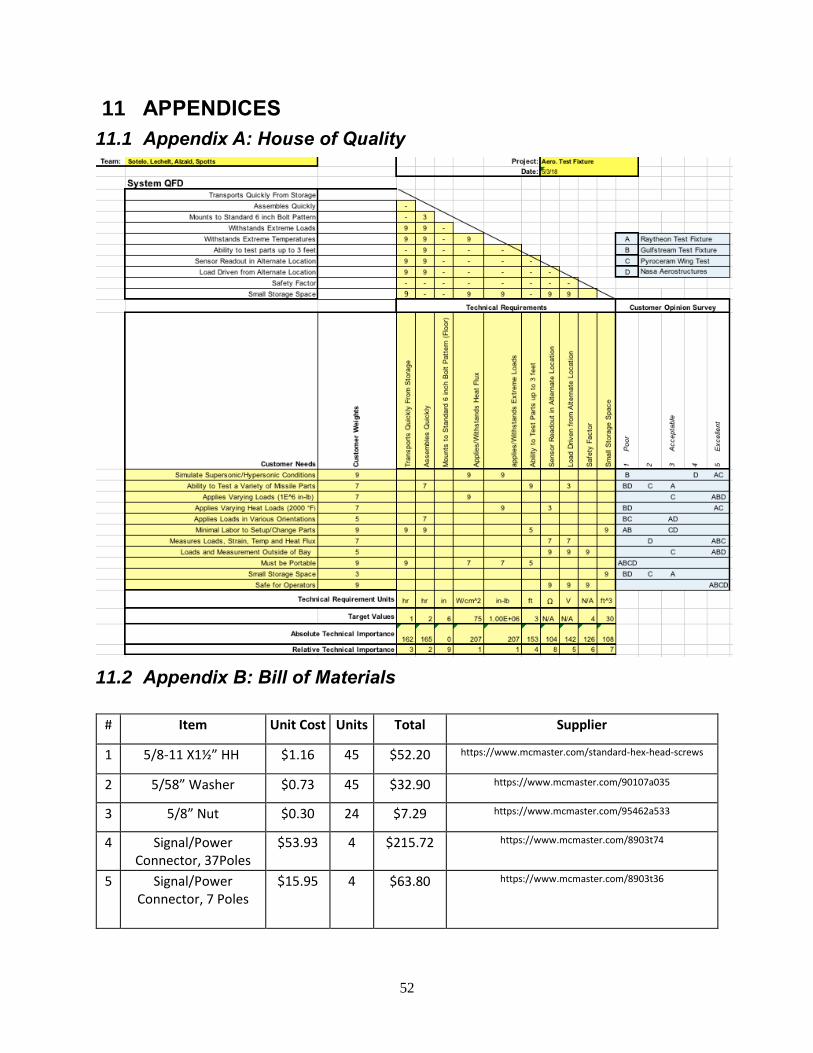
52
11 APPENDICES
11.1 Appendix A: House of Quality
11.2 Appendix B: Bill of Materials
# Item Unit Cost Units Total Supplier
1 5/8-11 X1½” HH $1.16 45 $52.20 https://www.mcmaster.com/standard-hex-head-screws
2 5/58” Washer $0.73 45 $32.90 https://www.mcmaster.com/90107a035
3 5/8” Nut $0.30 24 $7.29 https://www.mcmaster.com/95462a533
4 Signal/Power Connector, 37Poles
$53.93 4 $215.72 https://www.mcmaster.com/8903t74
5 Signal/Power Connector, 7 Poles
$15.95 4 $63.80
https://www.mcmaster.com/8903t36
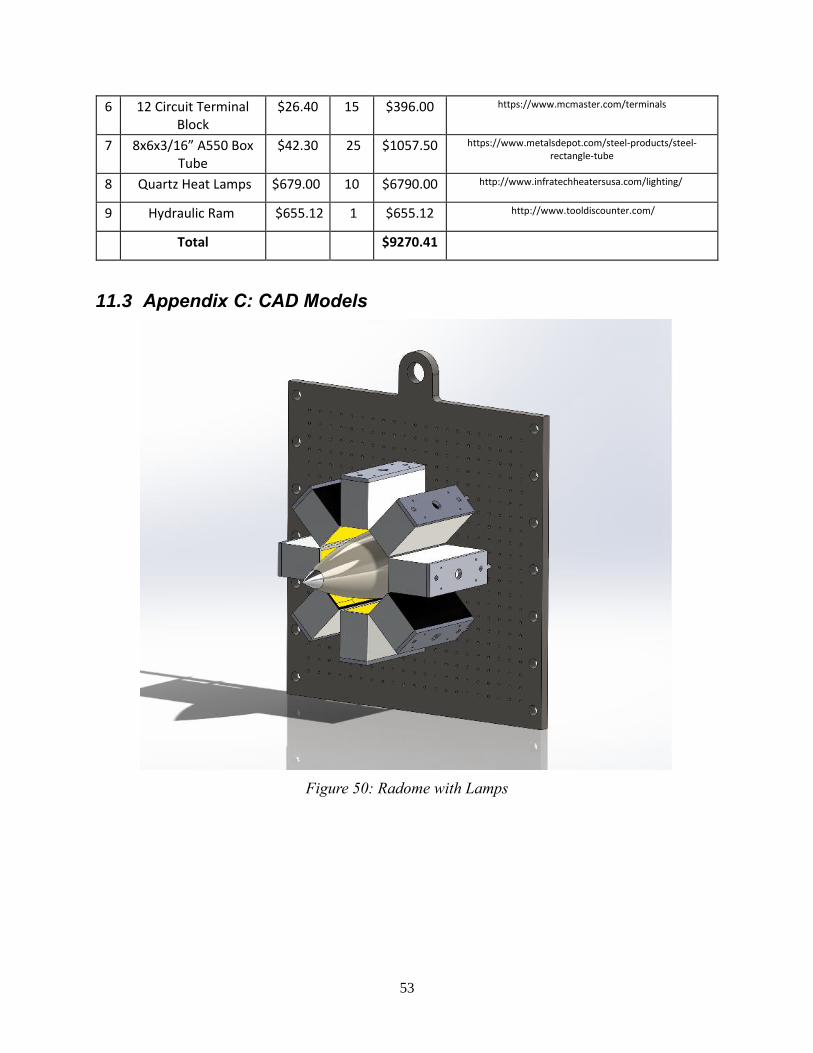
53
6 12 Circuit Terminal Block
$26.40 15 $396.00 https://www.mcmaster.com/terminals
7 8x6x3/16” A550 Box Tube
$42.30 25 $1057.50 https://www.metalsdepot.com/steel-products/steel-rectangle-tube
8 Quartz Heat Lamps $679.00 10 $6790.00 http://www.infratechheatersusa.com/lighting/
9 Hydraulic Ram $655.12 1 $655.12 http://www.tooldiscounter.com/
Total $9270.41
11.3 Appendix C: CAD Models
Figure 50: Radome with Lamps
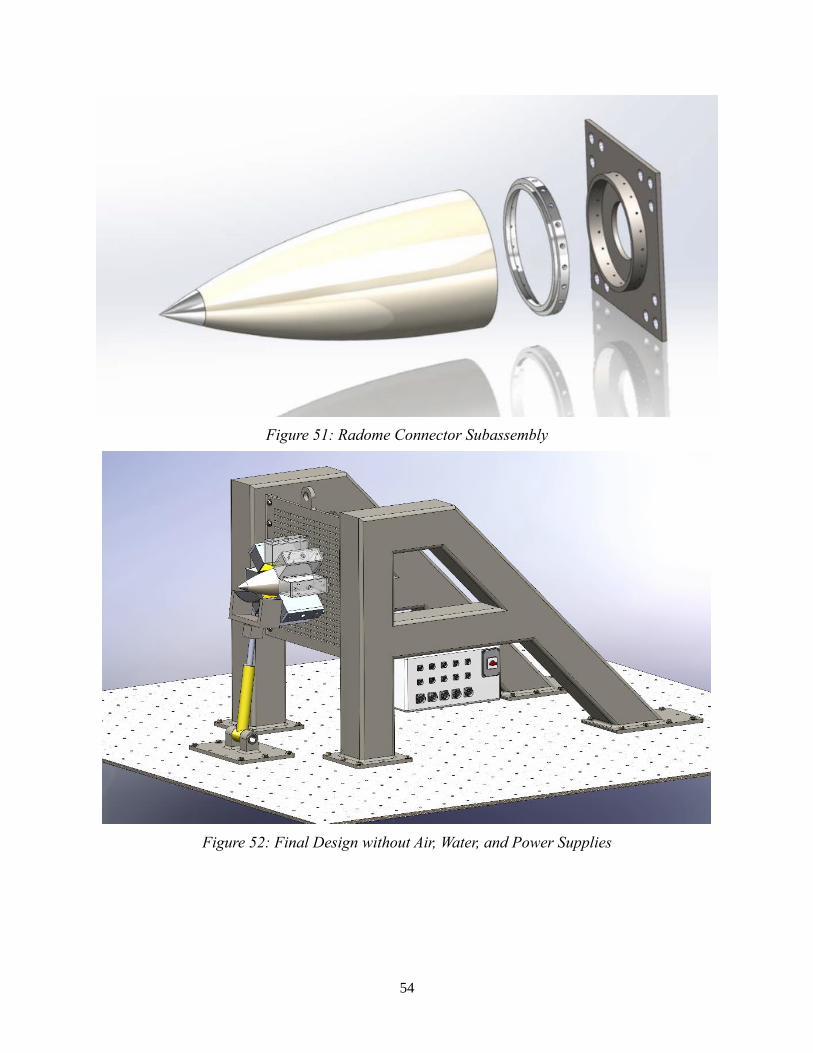
54
Figure 51: Radome Connector Subassembly
Figure 52: Final Design without Air, Water, and Power Supplies
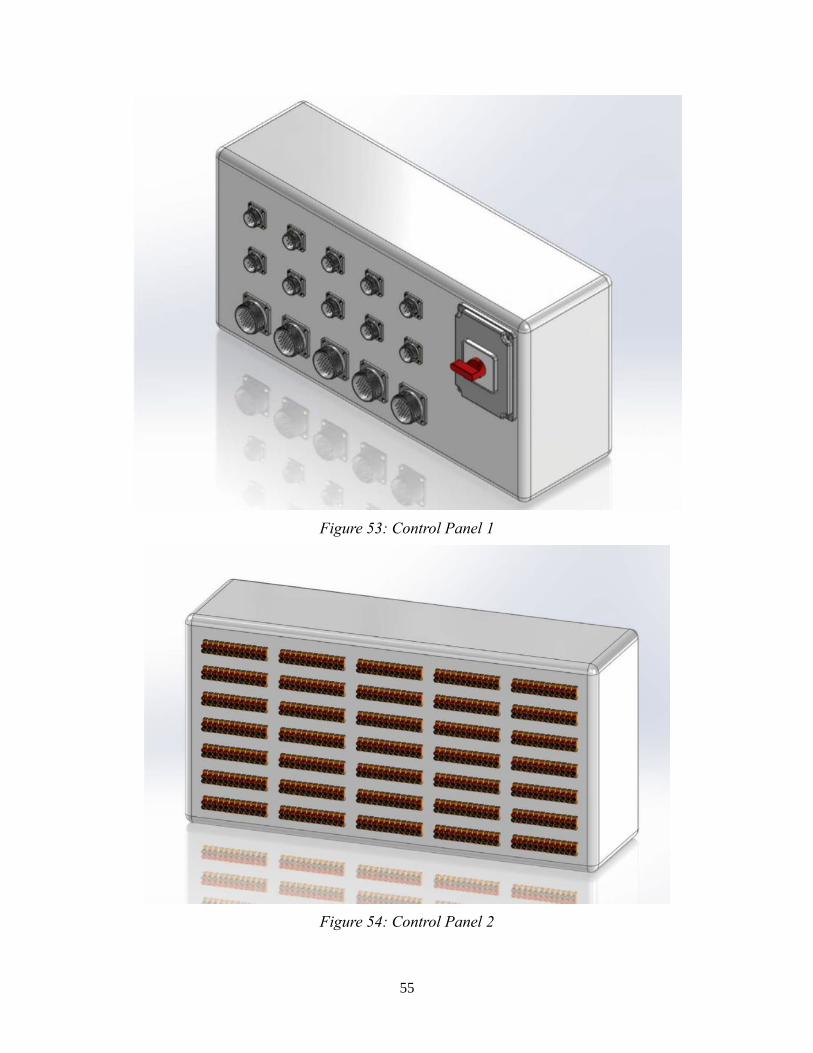
55
Figure 53: Control Panel 1
Figure 54: Control Panel 2

56
Figure 55: Hydraulic Ram
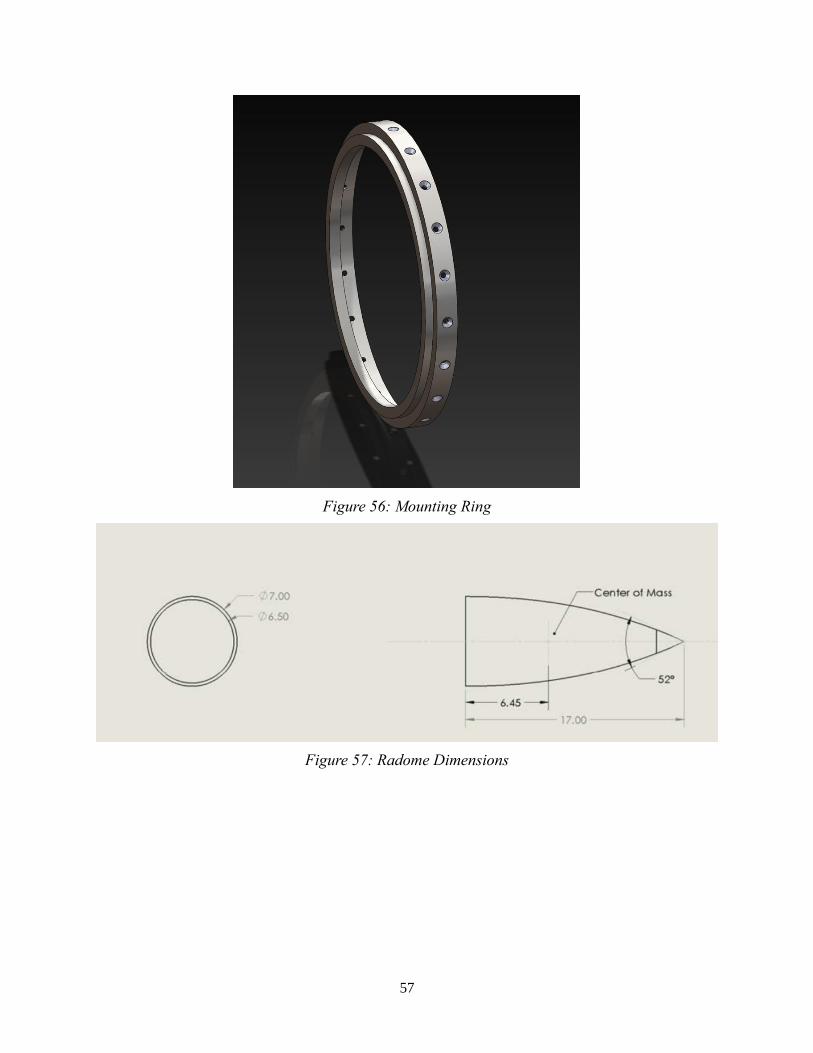
57
Figure 56: Mounting Ring
Figure 57: Radome Dimensions

58
Figure 58: Universal Plate Dimensions
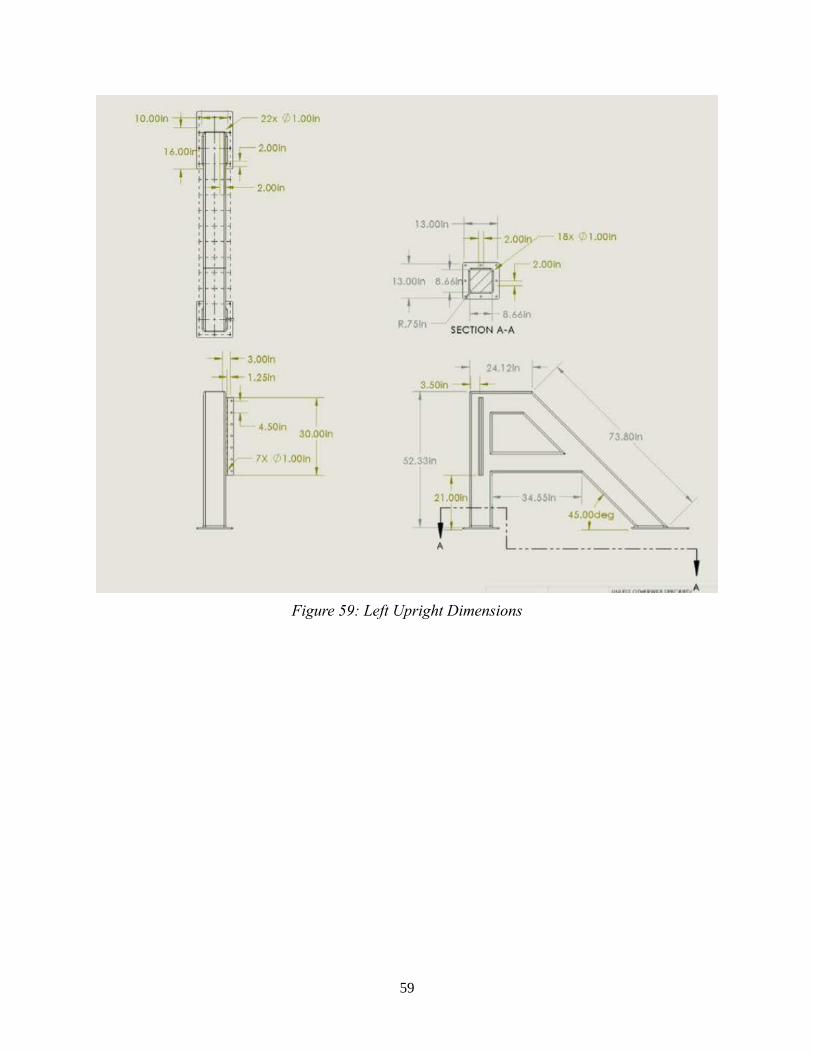
59
Figure 59: Left Upright Dimensions

60
Figure 60: Mounting Plate Dimensions