Embed Size (px)
Citation preview
Guided Research
Course Code: Eco 4395
Summer, 2019
The Extent of Impact of Different Factors on Female
Education in Developed and Developing Countries
Prepared by:
Md. Sadat Hassan Sizan
ID: 121 152 008
Guided by:
Musharrat Shabnam Shuchi
Lecturer
School of Business and Economics
United International University
Date of Submission: August 05, 2019

Acknowledgement
I would like to start by thanking Almighty Allah for every blessings of my life.
I would like to express my gratitude to my supervisor, Musharrat Shabnam Shuchi for guiding
me to complete this paper. She gave me support, guidance unconditionally which helps me to
complete this task in an efficient way.
Finally I would like to express my love to my family and friends as they are the strength of my
life.
Table
Serial No Content Page
1 Abstract 1
2 Introduction 2-3
3 Literature Review 4-5
4 Methodology 6-7
5 Data Analysis and Interpretation of
STATA Output
8-14
6 Findings 15-16
7 Conclusion 17
8 References 18
9 Appendix 19-20
1
Abstract
Female education is more than a blessing to every nation as female citizens play a significant
role in nation’s economic prosperity. But the real scenario is women are facing obstacles in
getting education even in 21st century which is referred to gender discrimination in education.
Several socioeconomic factors affect female education in developed and developing countries.
This paper explains the extent of impact of different factors on female education in both
developed and developing countries. Five variables have been used to conduct this study where
female education is the endogenous variable and it can be explained by some exogenous variable
like per capita GDP growth rate, poverty headcount ratio, government expenditure on education
and female labor force participation rate. Statistical analysis has been done by using STATA to
know the extent of these variables’ impact on female education. The study concluded that labor
force participation rate of female has the significant impact on education in both developed and
developing countries while other variables have almost similar impact on female education. Per
capita GDP growth rate was the weakest variable for developing countries and poverty
headcount ratio was the weakest variable for developed countries.
Keywords: Female Education, Gender Discrimination, Economic Prosperity, Socioeconomic
Factors, Developing Countries, Developed Countries.
2
Introduction:
Gender inequality is a common word that indicates an unequal treatment between male and
female. Gender inequality is happening across the world’s different cultures in a different
manner. Women are experiencing inequality in education, politics, work place, family, property,
income and many other sectors which is a curse to our society.
Female education is a blessing to every country but the real scenario is girls face obstacles to get
education every day. Poverty, religion, culture, politics act as the grounds of the barriers to
female education. Gender inequality in education is a vital problem in both developed and
developing countries that interrupts a country’s development in terms of income, human
development, technological progress, GDP, welfare and so many things. There are many
socioeconomic factors like poverty, social norms, less opportunities, poor health conditions that
affect female education and as a result women are not getting adequate education. But female
education is very important for every country as it accelerates a country’s economy. Uneducated
women cannot contribute to her family and nation much, on the other hand educated women is
like a blessing to her family and nation.
In developing countries, 25% girls are not able to finish primary education among all girls
(UNESCO 2013). There are 774 million illiterate people in developing countries and among
them two-third are women (UNESCO 2013).
Among all factors, poverty triggers female education the most. 7-16 years old girls do not ever
go to school in Somalia which is a developing country. Undoubtedly in education sector across
the world this is the highest inequality. However, gender equality in primary and as well as
secondary education has been achieved by Bangladesh tremendously. Bangladesh has
successfully brought about this gender parity by using stipends, tuition fee waiver and many
other public interventions.
Female participation rate in education has been increased in modern era but it is still lower than
male participation rate. Women are facing inequalities in education yet. But this is not acceptable
on 21st century. From this situation a very crucial question has been raised: “When will people
understand the importance of female education?” A country’s economic prosperity is somehow
linked with female education. If a country’s almost 50% of the total population is female, and if
they are uneducated, the country cannot go very far with its other half population who are
educated male. So discussing gender disparity in education is very critical as it hampers an
3
economy’s productivity. As a result, we have to concentrate on the factors that affect female
participation in education. And we have to find out the extent of the effect of different factors on
female participation in education. Thus we can easily remove the barriers to female education
that can help to get a productive and developed economy.
There is a clear view in front of us that developed countries have less gender disparity in
education compared to developing countries because of higher income, less poverty rate, better
health condition, more social awareness and so many things. Primary education should be the
main focus of less developed countries. When the country can maximize its returns from the
primary education, it should focus on secondary education and then higher education.
Extensive importance of female education provides the objective of the study to analyze the
extent of impacts of different factors on female education in both developed and developing
countries. So the study includes to analyze the condition of female education in both developed
and developing countries and to concentrate on some important factors that affect female
participation in education. Eventually the regression model will let us know the extent of impacts
of different factors.
4
Literature Review:
McWhirter, E. H (1997) conducted a paper named Perceived Barriers to Education and
Career: Ethnic and Gender Differences. They investigated gender and ethnic differences in
education and career by using a sample of 1139 Euro-American and Mexican-American high
school seniors and juniors. They used ANOVA and MANOVA method to assess the gender gap.
They found that female participants face more difficulties than male, Mexican-American
participants suffer more obstacle than Euro-Americans. They found consistent differences in
gender and ethnic groups.
Moheyuddin. G (2005) conducted a qualitative research named Gender Inequality in
Education: Impact on Income, Growth, and Development. He used female education as an
endogenous variable that can be explained by some factors in a significant extent like regional
factors, religious preference and civil freedom. He concluded that low investment in female
education is not an efficient choice for developing countries and it is bad for economic growth;
increase in per capita income can decrease gender inequality.
Balatchandirane. G conducted (2007) a research paper named Gender Discrimination in
Education and Economic Development: A Study of Asia through quantitative approach. He
examined gender discrimination in Asian countries and made a correlation between economic
growth and gender discrimination. He used Becker’s Coefficient of Discrimination to measure
the extent of discrimination against female. Literacy Rates, Enrolment Rates, Attendance Rates
and Mean Years of Schooling were the variables of this study. He found that Becker's Coefficient
Value can be vary from zero to infinity but author rarely found any value above 4, but the value
of 4 indicates high discrimination in education.
Jayachandran. S (2015) made a quantitative analysis named The Roots of Gender Inequality
in Developing Countries. She conducted a cross sectional study through the ratio of the college
enrollment rates of male and female that was plotted against GDP per capita for World Bank’s
World Development Indicators (WDI) data set’s listed countries. She used Male College
Enrollment Rate, Female College Enrollment Rate, and GDP Per Capita as variables. She
concluded that when GDP increase male biasness falls. She also found a negative relationship
between primary and secondary school enrollment and GDP that indicates major gender gap.
5
Odomore. A (2015) conducted a paper named Challenges to Female Education in the
Developing World and International Efforts to Address Those Challenges. He summarized
many articles and represented eight developing countries’ cross sectional analysis. He concluded
that many factors affect female education in developing countries like poverty, religious custom,
child marriage, menstruation, war conflicts, ancient traditions, and aversion regarding western
education.
Gautam. R, Reining. A and Holasek. K (2017) conducted a quantitative research named
Analyzing the Gender Disparity in Education between Developed and Developing
Countries. This paper includes a cross sectional study with F Test. Authors used several
variables like Life Expectancy, Percentage Of Urban Population, GNI Per Capita (PPP), Poverty
Headcount Ratio @ $1.90/Day (PPP), Expected Years Of Education (Female), Infant Mortality
Rate, Log (GNI Per Capita), Log (Expected Years Of Education). They concluded that GNI Per
Capita and literacy rate have positive correlation with female education and have the most
powerful impact on the level of female education. On the other hand, poverty rate has a strong
negative correlation with expected female education.
Kapur. R (2018) conducted a qualitative research named Factors Affecting Girl Child
Education. She came to a conclusion that geographical, health, socio cultural, economic,
educational, distance, religious and political factors affect female participation in education.
6
Methodology:
This paper analyses the extent of impacts of different factors on female education in both
developed and developing countries by using a cross sectional analysis. This is a quantitative
research that is conducted through some secondary data of 2010 from World Bank’s World
Development Indicators (WDI) data set. Statistical analysis of variables was conducted by
STATA and the results of the STATA were interpreted respectively.
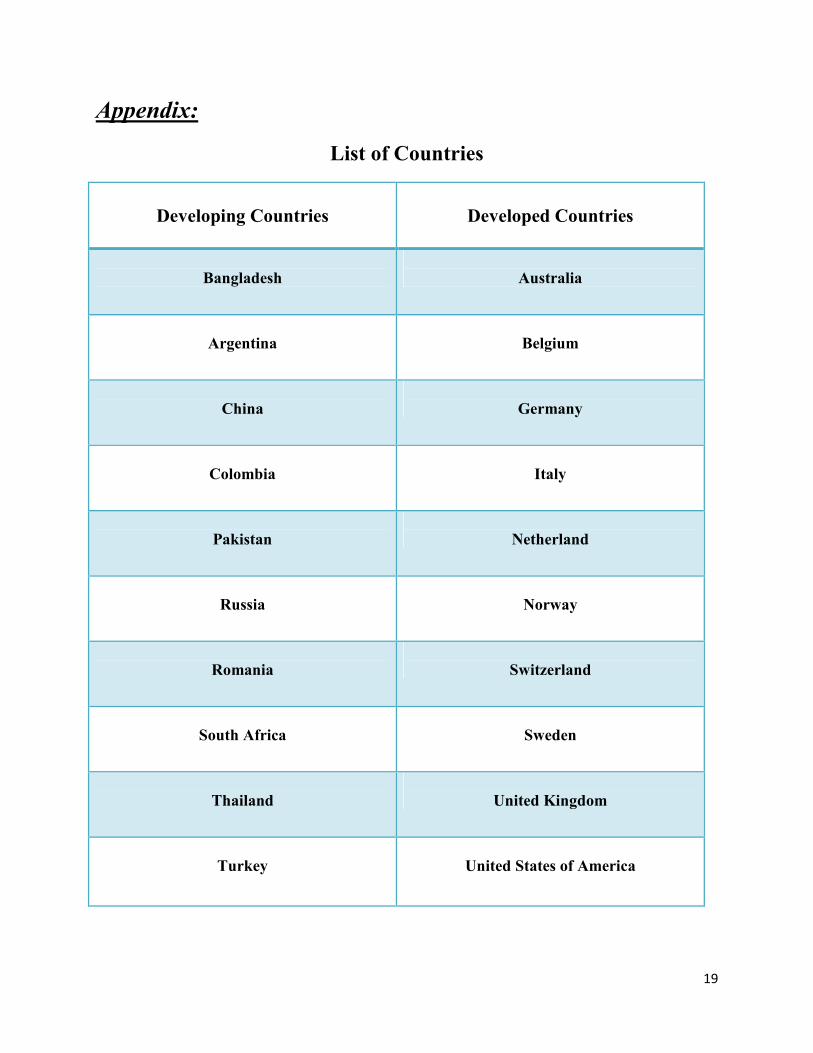
The analytical sector of this paper is divided into two sections. At first, the values for 10
developing countries were analyzed to understand the extent of impacts of different factors on
female education. After that values for 10 developed countries were examined for the same
purpose.
Model: Same model has been used in the both case of developing and developed countries.
edui= B0+ B1pcgdpi+ B2gei+ B3pvri+ B4lfpri+ui
Here, edu is dependent variable and rests of the variables are independent variables; i represents
number of observation.
Variable Description:
Dependent Variable:
edu= Educational attainment, at least completed lower secondary, population 25+, female (%)
(Cumulative)
It refers to the cumulative percentage of females among the population who are 25+ year old and
who have completed at least lower secondary level of education.
Independent Variable:
pcgdp= GDP per capita growth (annual %)
It represents a country’s economic growth that is done by its citizens. The value is measured by
dividing a country’s total GDP by its total populations.
7
ge= Government expenditure on education, total (% of government expenditure)
It represents the value that government spends for educational development. It is the value that
government spends on education as a percentage of government’s total spending.
pvr= Poverty headcount ratio at $1.90 a day (2011 PPP) (% of population)
It is the percentage of population that spends less than $1.90 per day international prices of 2011.
lfpr= Labor force participation rate, female (% of female population ages 15+) (modeled ILO
estimate)
It is the percentage of population ages 15+ that is active in the economy; the people who provide
the labor in production.
ui= Error term
B0= Intercept or Constant
B1, B2, B3, B4= Coefficients of the independent variables.
Time Period: 2010
Data Source: World Bank Data (World Development Indicators Data Set)
8
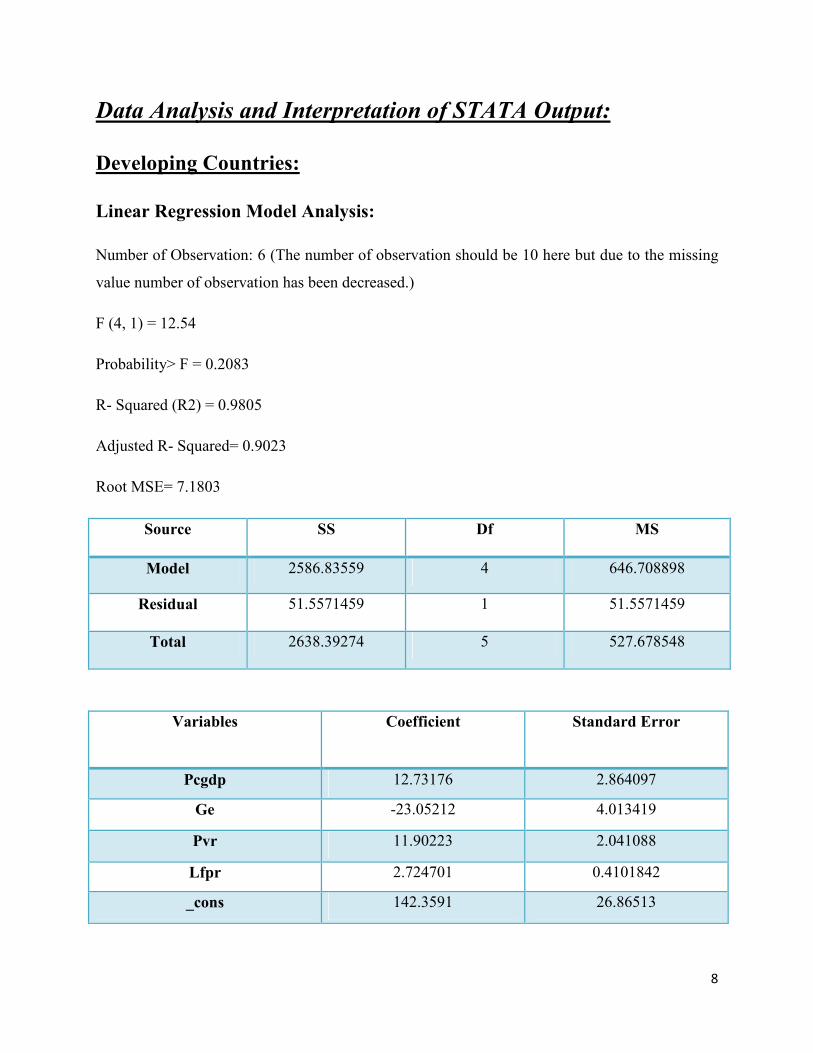
Data Analysis and Interpretation of STATA Output:
Developing Countries:
Linear Regression Model Analysis:
Number of Observation: 6 (The number of observation should be 10 here but due to the missing
value number of observation has been decreased.)
F (4, 1) = 12.54
Probability> F = 0.2083
R- Squared (R2) = 0.9805
Adjusted R- Squared= 0.9023
Root MSE= 7.1803
Source SS Df MS
Model 2586.83559 4 646.708898
Residual 51.5571459 1 51.5571459
Total 2638.39274 5 527.678548
Variables Coefficient
Standard Error
Pcgdp 12.73176 2.864097
Ge -23.05212 4.013419
Pvr 11.90223 2.041088
Lfpr 2.724701 0.4101842
_cons 142.3591 26.86513
9
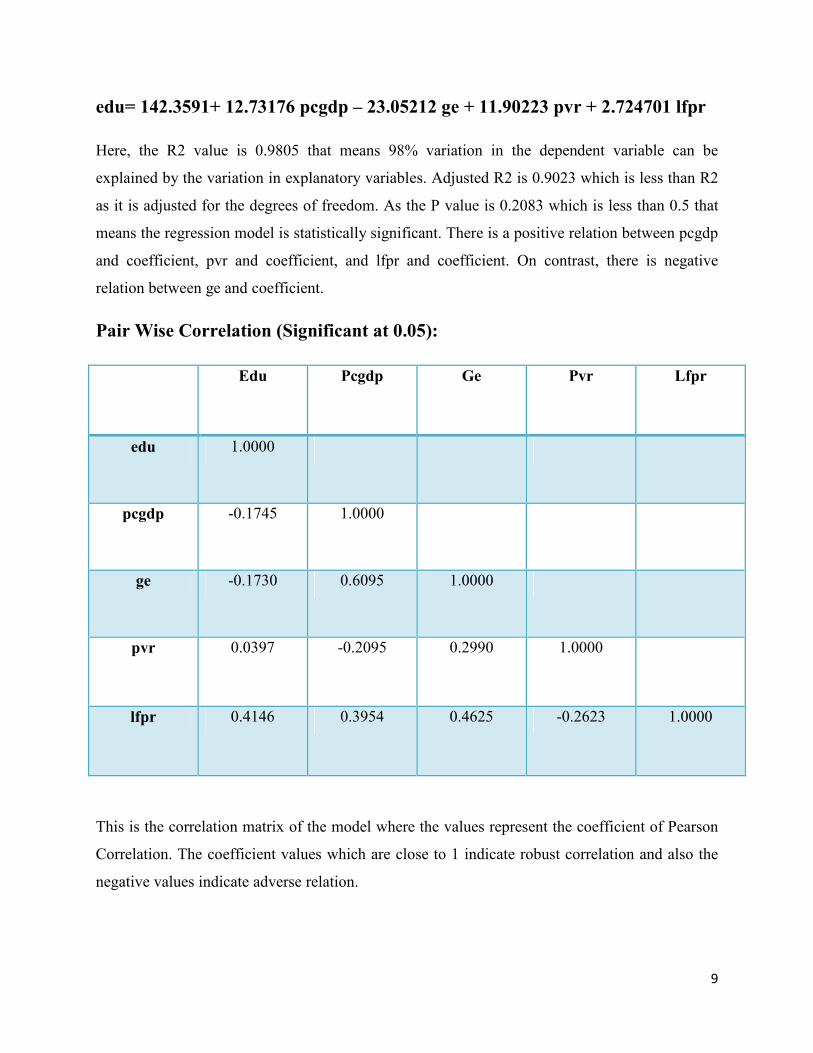
edu= 142.3591+ 12.73176 pcgdp – 23.05212 ge + 11.90223 pvr + 2.724701 lfpr
Here, the R2 value is 0.9805 that means 98% variation in the dependent variable can be
explained by the variation in explanatory variables. Adjusted R2 is 0.9023 which is less than R2
as it is adjusted for the degrees of freedom. As the P value is 0.2083 which is less than 0.5 that
means the regression model is statistically significant. There is a positive relation between pcgdp
and coefficient, pvr and coefficient, and lfpr and coefficient. On contrast, there is negative
relation between ge and coefficient.
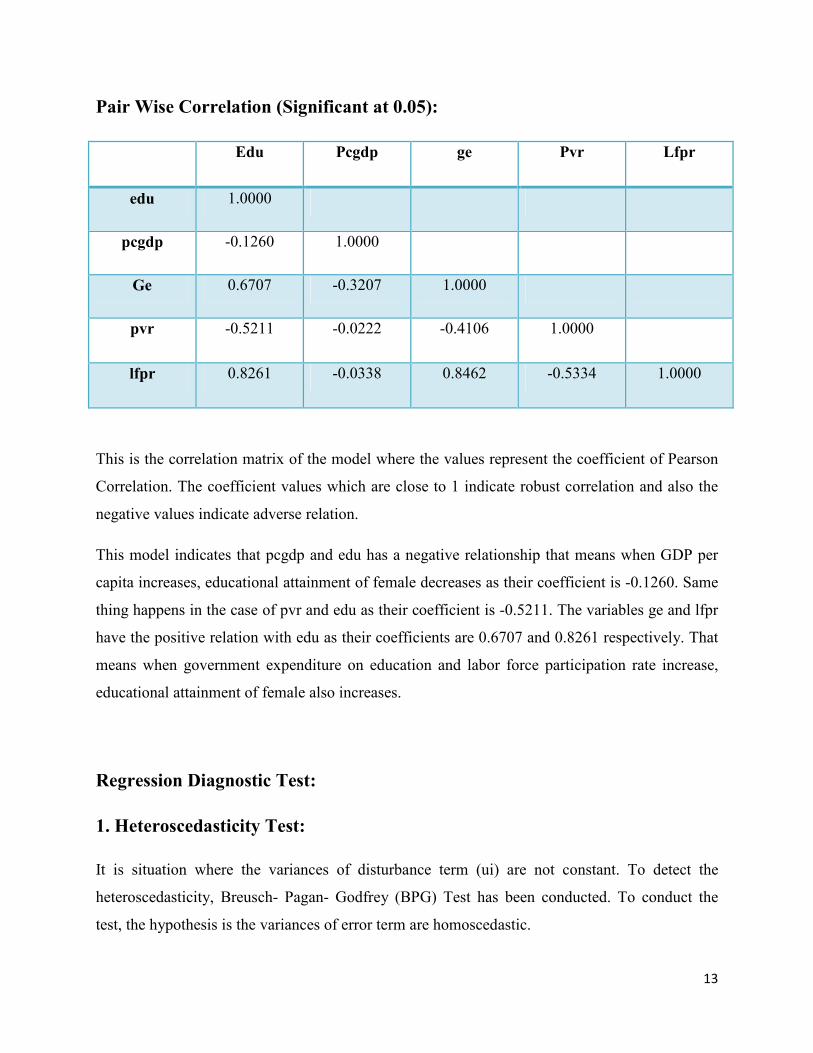
Pair Wise Correlation (Significant at 0.05):
Edu Pcgdp Ge Pvr Lfpr
edu 1.0000
pcgdp -0.1745 1.0000
ge -0.1730 0.6095 1.0000
pvr 0.0397 -0.2095 0.2990 1.0000
lfpr 0.4146 0.3954 0.4625 -0.2623 1.0000
This is the correlation matrix of the model where the values represent the coefficient of Pearson
Correlation. The coefficient values which are close to 1 indicate robust correlation and also the
negative values indicate adverse relation.
10
This model indicates that pcgdp and edu has a negative relationship that means when GDP per
capita increases, educational attainment of female decreases as their coefficient is -0.1745. Same
thing happens in the case of ge and edu as their coefficient is -0.1730. The variables pvr and lfpr
have the positive relation with edu as their coefficients are 0.0397 and 0.4146 respectively.
Regression Diagnostic Test:
1. Heteroscedasticity Test:
It is situation where the variances of disturbance term (ui) are not constant. To detect the
heteroscedasticity, Breusch- Pagan- Godfrey (BPG) Test has been conducted. To conduct the
test, the hypothesis is the variances of error term are homoscedastic.
chi2(1) = 0.06
Prob > chi2 = 0.8065
Ho: Homoscedasticity
Ha: Heteroscedasticity
BPG Test depends on the value of chi2. If p < 0.05 then Ho will be rejected.
Here, p= 0.8065 which is higher than 0.05 so we cannot reject the Ho. That means the variances
of the error term of this model are homoscedastic.
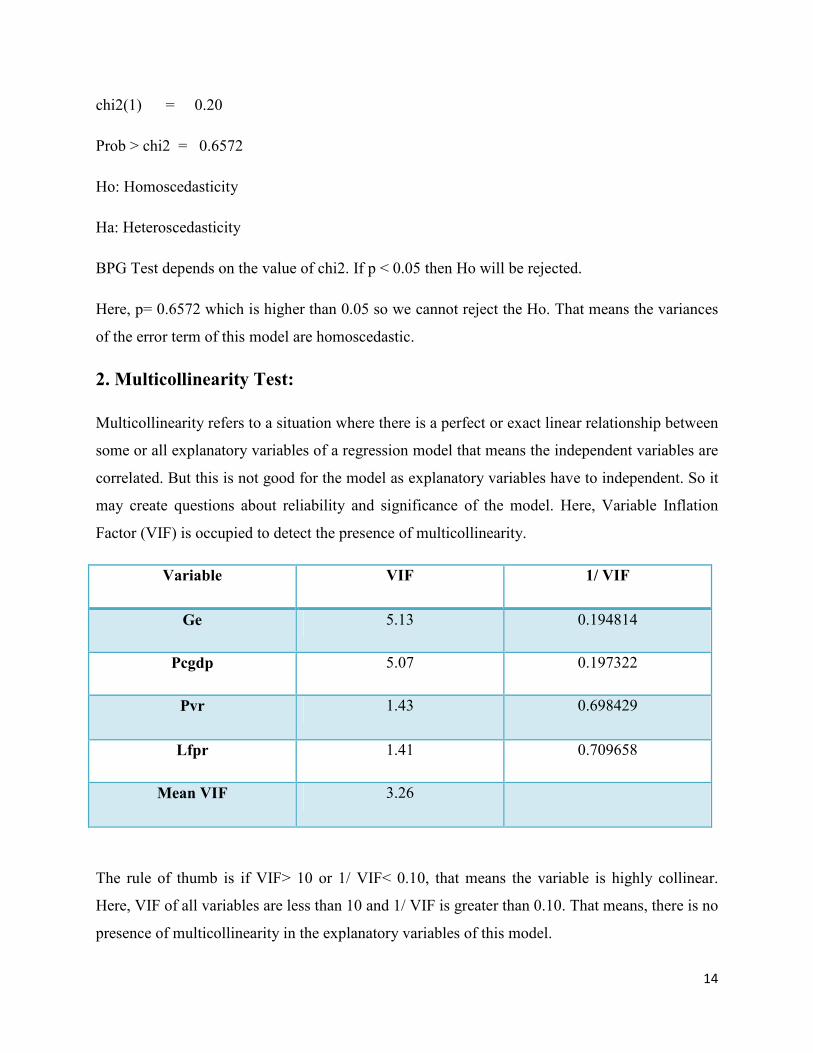
2. Multicollinearity Test:
Multicollinearity refers to a situation where there is a perfect or exact linear relationship between
some or all explanatory variables of a regression model that means the independent variables are
correlated. But this is not good for the model as explanatory variables have to independent. So it
may create questions about reliability and significance of the model. Here, Variable Inflation
Factor (VIF) is occupied to detect the presence of multicollinearity.
11
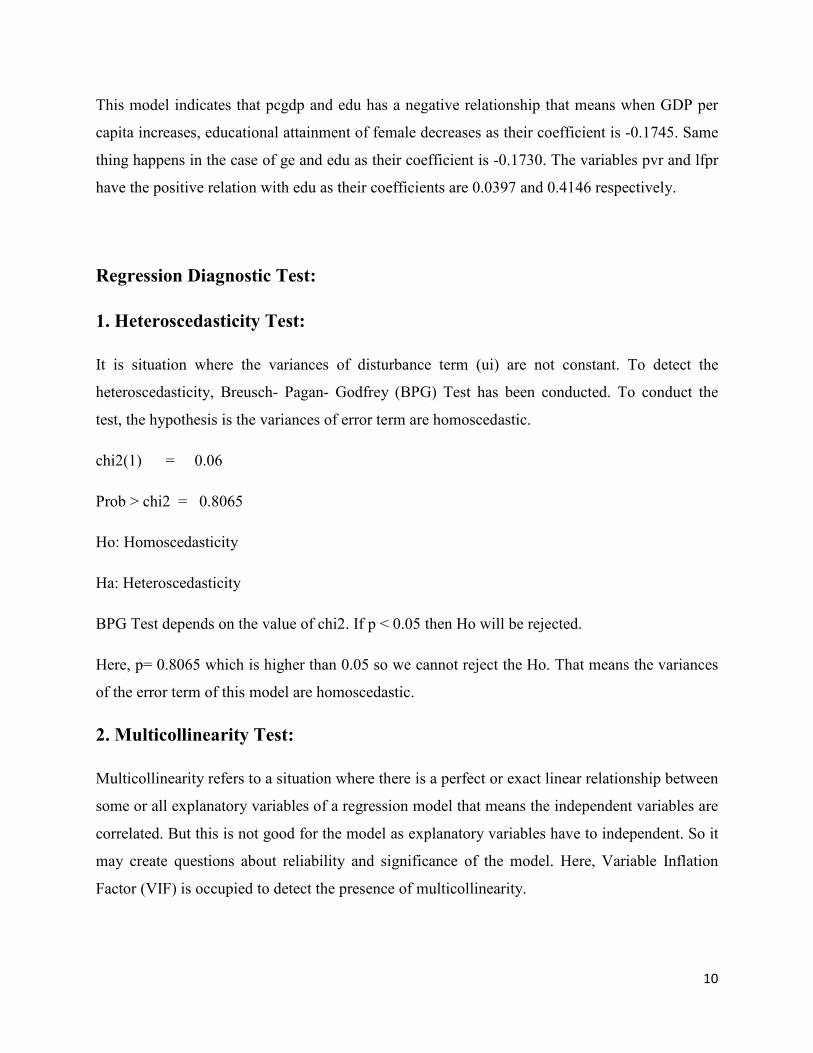
Variable VIF 1/ VIF
Ge 17.27 0.057891
Pcgdp 14.76 0.067741
Pvr 14.44 0.069256
Lfpr 3.32 0.301041
Mean VIF 12.45
The rule of thumb is if VIF> 10 or 1/ VIF< 0.10, that means the variable is highly collinear.
Here, only lfpr is not collinear but rests of the variables have multicollinearity.
Developed Countries:
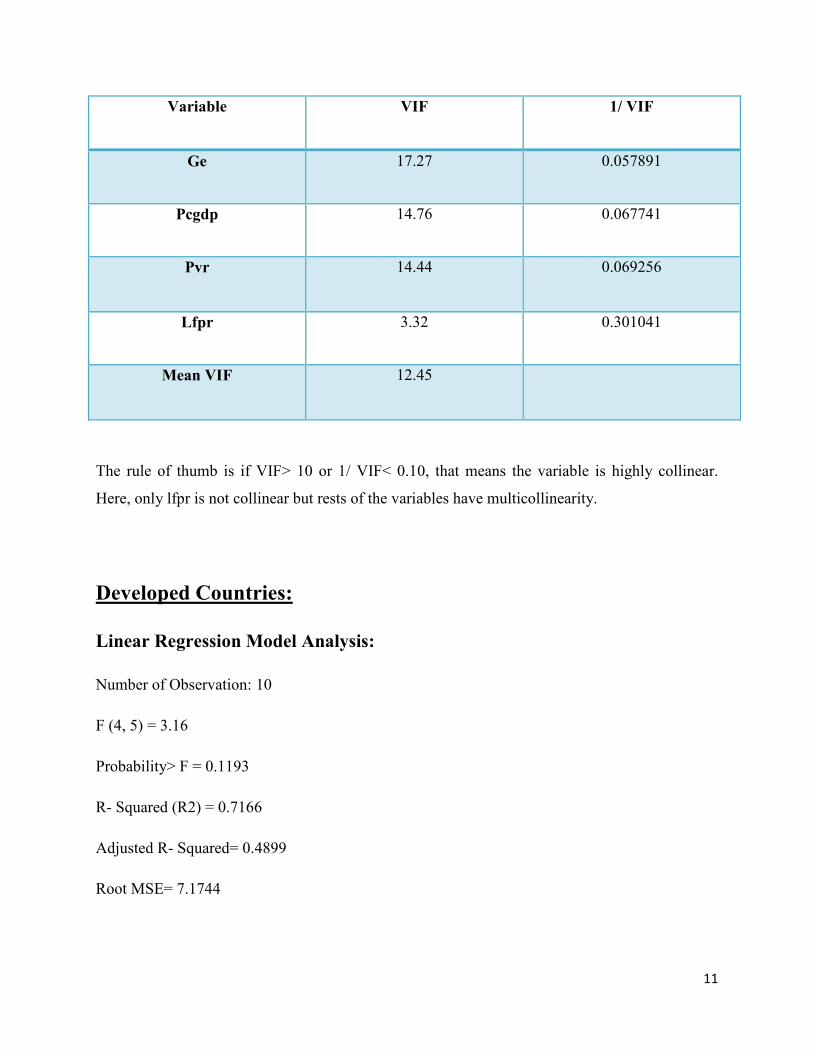
Linear Regression Model Analysis:
Number of Observation: 10
F (4, 5) = 3.16
Probability> F = 0.1193
R- Squared (R2) = 0.7166
Adjusted R- Squared= 0.4899
Root MSE= 7.1744
12
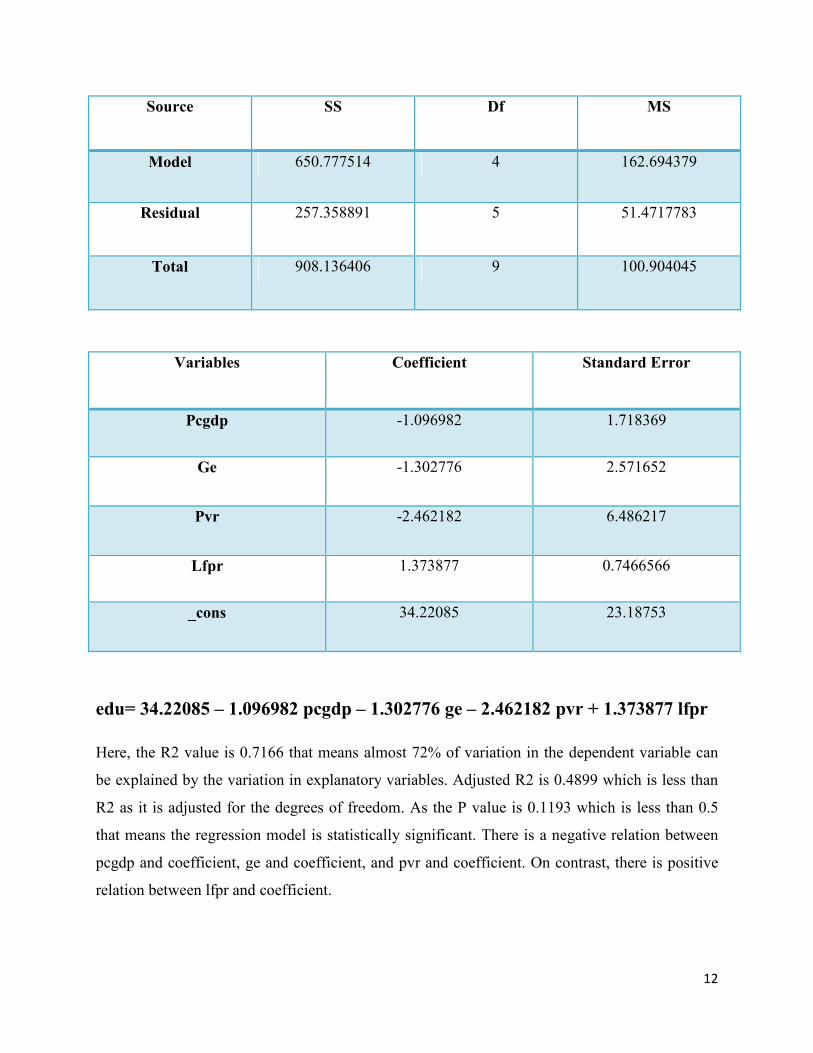
Source SS Df MS
Model 650.777514 4 162.694379
Residual 257.358891 5 51.4717783
Total 908.136406 9 100.904045
Variables Coefficient
Standard Error
Pcgdp -1.096982 1.718369
Ge -1.302776 2.571652
Pvr -2.462182 6.486217
Lfpr 1.373877 0.7466566
_cons 34.22085 23.18753
edu= 34.22085 – 1.096982 pcgdp – 1.302776 ge – 2.462182 pvr + 1.373877 lfpr
Here, the R2 value is 0.7166 that means almost 72% of variation in the dependent variable can
be explained by the variation in explanatory variables. Adjusted R2 is 0.4899 which is less than
R2 as it is adjusted for the degrees of freedom. As the P value is 0.1193 which is less than 0.5
that means the regression model is statistically significant. There is a negative relation between
pcgdp and coefficient, ge and coefficient, and pvr and coefficient. On contrast, there is positive
relation between lfpr and coefficient.
13
Pair Wise Correlation (Significant at 0.05):
Edu Pcgdp ge Pvr Lfpr
edu 1.0000
pcgdp -0.1260 1.0000
Ge 0.6707 -0.3207 1.0000
pvr -0.5211 -0.0222 -0.4106 1.0000
lfpr 0.8261 -0.0338 0.8462 -0.5334 1.0000
This is the correlation matrix of the model where the values represent the coefficient of Pearson
Correlation. The coefficient values which are close to 1 indicate robust correlation and also the
negative values indicate adverse relation.
This model indicates that pcgdp and edu has a negative relationship that means when GDP per
capita increases, educational attainment of female decreases as their coefficient is -0.1260. Same
thing happens in the case of pvr and edu as their coefficient is -0.5211. The variables ge and lfpr
have the positive relation with edu as their coefficients are 0.6707 and 0.8261 respectively. That
means when government expenditure on education and labor force participation rate increase,
educational attainment of female also increases.
Regression Diagnostic Test:
1. Heteroscedasticity Test:
It is situation where the variances of disturbance term (ui) are not constant. To detect the
heteroscedasticity, Breusch- Pagan- Godfrey (BPG) Test has been conducted. To conduct the
test, the hypothesis is the variances of error term are homoscedastic.
14
chi2(1) = 0.20
Prob > chi2 = 0.6572
Ho: Homoscedasticity
Ha: Heteroscedasticity
BPG Test depends on the value of chi2. If p < 0.05 then Ho will be rejected.
Here, p= 0.6572 which is higher than 0.05 so we cannot reject the Ho. That means the variances
of the error term of this model are homoscedastic.
2. Multicollinearity Test:
Multicollinearity refers to a situation where there is a perfect or exact linear relationship between
some or all explanatory variables of a regression model that means the independent variables are
correlated. But this is not good for the model as explanatory variables have to independent. So it
may create questions about reliability and significance of the model. Here, Variable Inflation
Factor (VIF) is occupied to detect the presence of multicollinearity.
Variable VIF 1/ VIF
Ge 5.13 0.194814
Pcgdp 5.07 0.197322
Pvr 1.43 0.698429
Lfpr 1.41 0.709658
Mean VIF 3.26
The rule of thumb is if VIF> 10 or 1/ VIF< 0.10, that means the variable is highly collinear.
Here, VIF of all variables are less than 10 and 1/ VIF is greater than 0.10. That means, there is no
presence of multicollinearity in the explanatory variables of this model.
15
Findings:
Developing Countries:
The normal situation is there must be a positive relation between GDP per capita growth and
female educational attainments. But in this model, a negative relation between these two
variables has been arrived. Similar thing happens in the case of government spending on
education and female educational attainments. GDP per capita growth rates in developing
countries are comparatively higher as GDP increases from smaller value to higher value. But in
some developing countries, there are still some social and cultural barriers to female education
that may interrupt the attainment of female education. In most of the developing countries,
government mainly focuses on primary level of education and spends the lion share on primary
education. As this paper has been conducted through lower secondary level of female education,
this may trigger a negative relationship between government spending and lower secondary
educational attainments of female. Poverty headcount ratio and labor force participation rate
have positive relationship with female education of lower secondary level. But poverty
headcount ratio should have the negative relation with female education. This may happen
because in some developing countries poverty ratio is high but government provides necessary
arrangements for female education. Labor force participation rate may have positive or negative
relation with female education based on different aspects. For instance, labor force participation
can enhance female education as female can earn by their own and spend their earnings on their
education. But they may have a negative relation in other context; if female work then they
wouldn’t have adequate time for their education.
In this study, for developing countries no independent variable has significant correlation with
female education. By comparing the correlation between dependent and independent variable, it
is clear that in developing countries, impact of per capita GDP growth rate and government
spending on education have almost similar negative impact on lower secondary female
educational attainments. Besides this, poverty headcount ratio and labor force participation rate
of female have also almost similar positive impact on lower secondary female educational
attainments. But the impact of labor force participation rate of female is higher.
16
Developed Countries:
Here the scenario of GDP per capita growth rate and female education is same as developing
countries. These two variables have negative relationship which is not familiar. In developed
countries, GDP per capita growth rate is lower that may force to get a negative relationship with
female education. Government expenditure plays an important role on female education in
developed countries as these two variables have positive relationship which is an acceptable
situation. In developed countries, poverty headcount ratio is very low that trigger a negative
relationship between poverty and female education and this is absolutely normal; female
education increases as poverty decreases. In developed countries, labor force participation rate of
female has a positive relation with female education and this may happen as women can afford
their own educational costs.
In developed countries, the impacts of government spending on education and labor force
participation rate of female are significant. But labor force participation rate of female affects the
female education most. While considering negative relationship, impact of GDP per capita
growth rate is higher than the impact of poverty headcount ration on female education at lower
secondary level.
17
Conclusion:
Based on the regression model, it is clear that labor force participation rate of female has the
significant impact on female educational attainment in both developed and developing countries
and this is the strongest variable among all independent variables. This triggers an opinion that
women can bear their own educational costs through earning by their own. The weakest variable
for developing countries is per capita GDP growth rate and for developed countries is poverty
headcount ratio.
This study shows that per capita GDP growth rate has negative relation with female education in
both developed and developing countries which is not natural. Based on the result of this study,
this situation indicates deleterious situation of not having fairness in the welfare distribution. So
every government should focus on welfare distribution and development of human capital. In
developing countries, government should more focus on education sector especially on above
primary level of education. If governments of developing countries provide free education after
primary level then situation can be changed with a good vibe. Government should create more
awareness regarding the extensive importance of female education through social media,
television, and campaign. Thus, the rate of female education will be higher and it can bring
prosperity to any nation. Only men can’t bear the burden of the economy and nation, they need
the help and support of women to faster the economic growth; as females are almost the half of
the population of the world so the role women on country’s prosperity is significant.
18
References:
� MCWHIRTER, E. H (1997), “Perceived Barriers to Education and Career: Ethnic and
Gender Differences”, Journal of Vocational Behavior 50, 124 – 140 (1997), Article No.
VB951536.
� Moheyuddin. G (2005), “Gender Inequality in Education: Impact on Income, Growth and
Development”, MPRA Paper No 685.
� Balatchandirane. G (2007), “Gender Discrimination in Education and Economic
Development: A Study of Asia”, V. R. F Series, No 426.
� Jayachandran. S (2015), “The Roots of Gender Inequality in Developing Countries”,
Annu. Rev. Econ. 2015. 7:63–88.
� Odomore. A (2015), “Challenges to Female Education in the Developing World and
International Efforts to Address those Challenges”, Texas State University.
� Gautam. R, Reining. A and Holasek. K (2017), “Analyzing the Gender Disparity in
Education between Developed and Developing Countries”, Georgia Institute of
Technology.
� Kapur. R (2018), “Factors Affecting Girl Child Education”.
19
Appendix:
List of Countries
Developing Countries
Developed Countries
Bangladesh
Australia
Argentina
Belgium
China
Germany
Colombia
Italy
Pakistan
Netherland
Russia
Norway
Romania
Switzerland
South Africa
Sweden
Thailand
United Kingdom
Turkey
United States of America
20
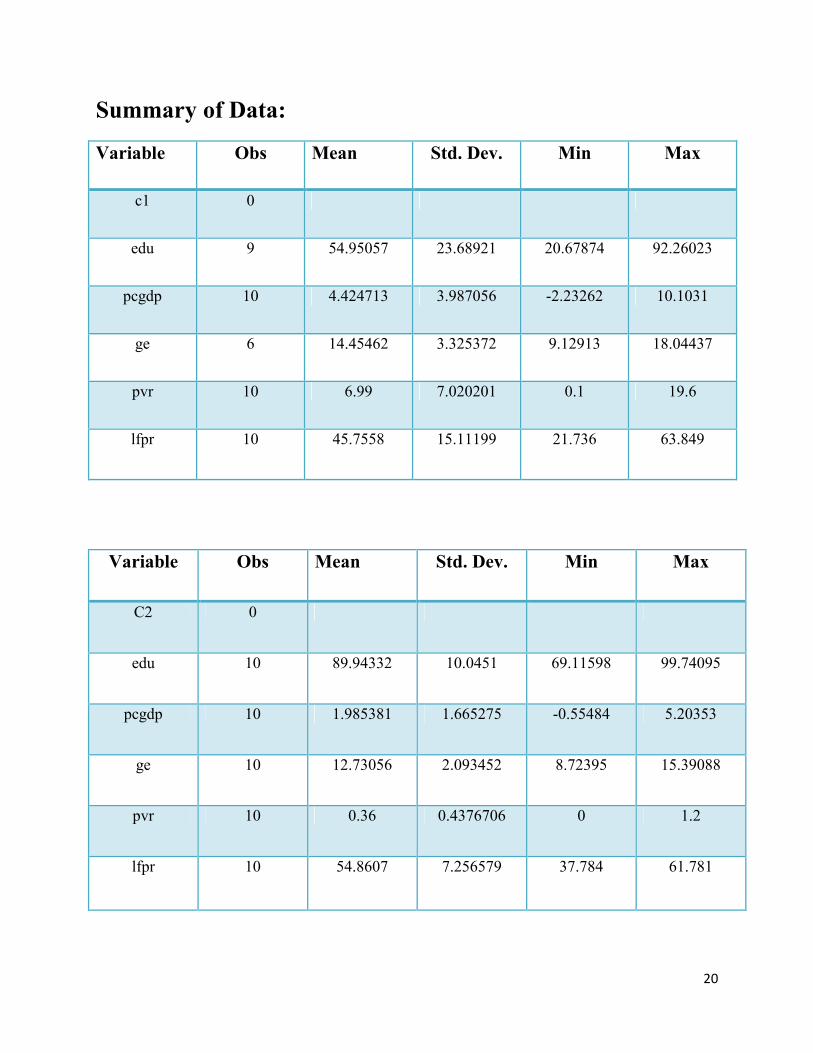
Summary of Data:
Variable Obs Mean Std. Dev. Min Max
c1 0
edu 9 54.95057 23.68921 20.67874 92.26023
pcgdp 10 4.424713 3.987056 -2.23262 10.1031
ge 6 14.45462 3.325372 9.12913 18.04437
pvr 10 6.99 7.020201 0.1 19.6
lfpr 10 45.7558 15.11199 21.736 63.849
Variable Obs Mean Std. Dev. Min Max
C2 0
edu 10 89.94332 10.0451 69.11598 99.74095
pcgdp 10 1.985381 1.665275 -0.55484 5.20353
ge 10 12.73056 2.093452 8.72395 15.39088
pvr 10 0.36 0.4376706 0 1.2
lfpr 10 54.8607 7.256579 37.784 61.781