Embed Size (px)
Citation preview

U.S. Department of Education Institute of Education Sciences National Center for Education Evaluation and Regional Assistance
Third National Even Start Evaluation Follow-Up Findings From the Experimental Design Study December 2004
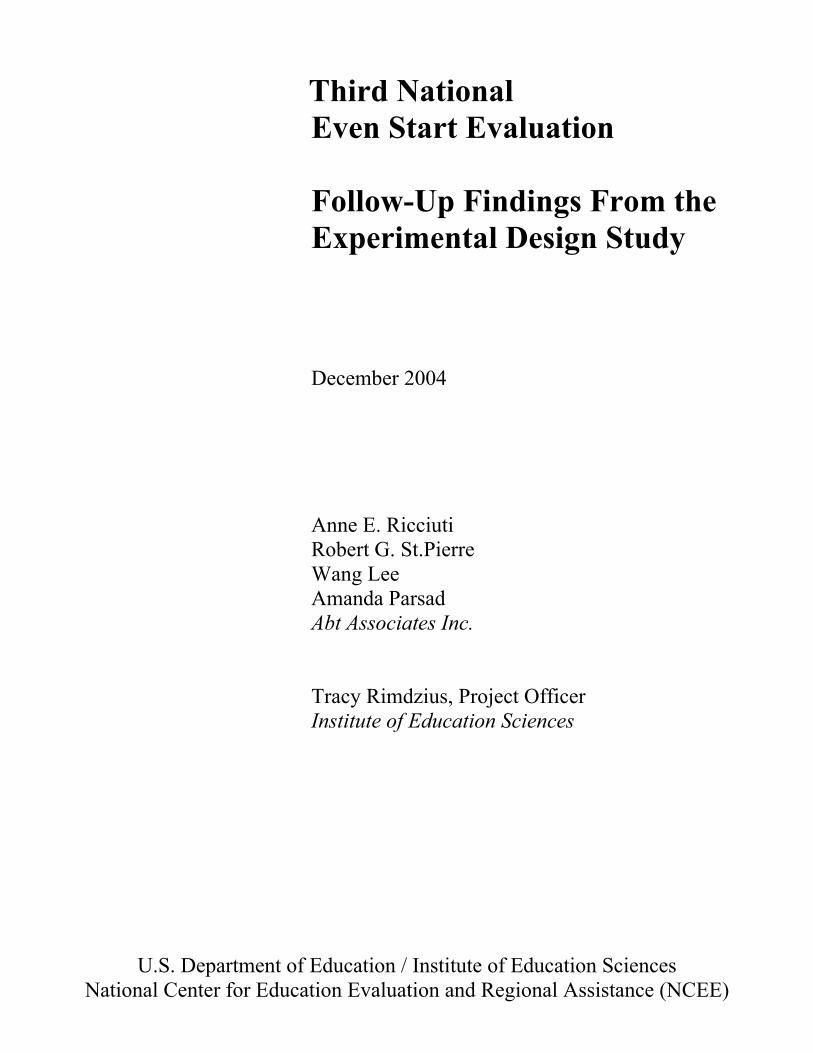
Third National Even Start Evaluation
Follow-Up Findings From the Experimental Design Study
December 2004
Anne E. Ricciuti Robert G. St.Pierre Wang Lee Amanda Parsad Abt Associates Inc.
Tracy Rimdzius, Project Officer Institute of Education Sciences
U.S. Department of Education / Institute of Education Sciences National Center for Education Evaluation and Regional Assistance (NCEE)
U.S. Department of Education Rod Paige Secretary Institute of Education Sciences Grover J. Whitehurst Director National Center for Education Evaluation and Regional Assistance Phoebe Cottingham Commissioner December 2004 This report was prepared for the Institute of Education Sciences under Contract No. EA 97049001. Tracy Rimdzius served as the project officer. The views expressed herein are those of the contractor. This publication is in the public domain. Authorization to reproduce it in whole or in part for educational purposes is granted. Suggested Citation Ricciuti, A.E., St.Pierre, R.G., Lee, W., Parsad, A. & Rimdzius, T. Third National Even Start Evaluation: Follow-Up Findings From the Experimental Design Study. U.S. Department of Education, Institute of Education Sciences, National Center for Education Evaluation and Regional Assistance. Washington, DC: 2004. This report is only available on the Internet. It can be downloaded at the Department’s Web site: http://www.ed.gov/ies/ncee

NCEE 2005-3002
Acknowledgments
iii
ACKNOWLEDGMENTS This report presents analyses of follow-up data collected from families that participated in the Experimental Design Study portion of the third national Even Start evaluation. Many individuals have contributed to the evaluation, and we would like to acknowledge their contributions. The national evaluation would not have been possible without the efforts of all local Even Start projects throughout the country. Each program year from 1997-1998 through 2000-2001, in addition to the challenging work of carrying out the Even Start model, projects collected and reported data describing the nature of their program, the intensity of the services they provided, the families they served, and the extent to which these families participated. Even Start state coordinators also provided support to projects and evaluation contractors that is necessary for the success of the evaluation. Special thanks are extended to the project directors and staff of the 18 Even Start projects that participated in the Experimental Design Study. This study benefited from the advice and comments of an Expert Work Group. Members include: Eloise Appel, Appel Associates; W. Steven Barnett, Rutgers University; Diane Givens, Webster-Groves School District, Rock Hill, Missouri; Paul Johnson, State of Colorado; Jeanne Paratore, Boston University; Douglas Powell, Purdue University; Flora Rodriguez-Brown, University of Illinois-Chicago; Susan Smith, Drake University; Catherine Snow, Harvard University; Patty Ball Thomas, State of Florida; Jeff Tucker, National Center for Family Literacy; and Maris Vinovskis, University of Michigan. Staff from the U.S. Department of Education provided guidance and support for the national evaluation. Special thanks are due to Tracy Rimdzius, project officer for the national evaluation, and Ricky Takai of the Institute of Education Sciences; Miriam Whitney, an Even Start program attorney; Laurette Crum, Theresa Buckley and Lonna Jones of the Budget Service; and Laura Lazo, Patricia McKee, and DonnaMarie Marlow of the Office of Elementary and Secondary Education.

Contents
v
CONTENTS
Acknowledgments ........................................................................................................................ iii Tables and Figures...................................................................................................................... vii Abbreviations ............................................................................................................................... ix Abstract......................................................................................................................................... xi Section 1: Background and Summary of Findings ................................................................... 1
Summary of Findings.................................................................................................................. 1 Study Limitations........................................................................................................................ 3
Section 2: The Even Start Family Literacy Program............................................................... 5
The Family Literacy Movement ................................................................................................. 5 The Family Literacy Model ........................................................................................................ 5 The Even Start Family Literacy Program................................................................................... 7
Section 3: Description of the Evaluation.................................................................................. 11
Implementation of the Evaluation............................................................................................. 11 Measures Used in the EDS ....................................................................................................... 15 Instruction Received by Even Start and Control Families........................................................ 16
Section 4: Evaluation Findings ................................................................................................. 29
Comparison of Follow-Up Data With Pretest Data Showed That Even Start Children and Parents Gained the Same Amount, But Not More, Than Control Children and Parents.......... 29 Even Start Children and Parents Made Gains Between Pretest and Follow-Up ...................... 31 Even Start Children and Parents Still Scored Low Compared to National Norms................... 32 Does Amount of Participation Make a Difference?.................................................................. 32 Limitations and Conclusions .................................................................................................... 33
References.................................................................................................................................... 41 Appendix A: Description of Outcome Measures..................................................................... 49
Child Outcome Measures............................................................................................................ 49 Parent and Family Outcome Measures ..................................................................................... 52
Appendix B: Graphical Displays of Pretest, Posttest, and Follow-up Data ..........................55

Tables and Figures
vii
TABLES AND FIGURES Figure 2.1: Model of Even Start’s Hypothesized Effects.......................................................... 9 Figure 3.1: Flow of Projects and Participants At Each Stage of the Evaluation, Including
Information on Analysis Sample for the Child PPVT and Parent WJ-R.............. 19 Table 3.1: Disposition of Sample for the Experimental Design Study .................................. 20 Table 3.2: Age of Even Start and Control Group Children at the Time of Random
Assignment in the EDS......................................................................................... 20 Table 3.3: Pretest Statistics on Selected Variables for Even Start and Control Families
in the EDS............................................................................................................. 21 Table 3.4: Characteristics of Various Analytic Subsets of Families in the EDS (Even Start
and Control Families Combined).......................................................................... 22 Table 3.5: Statistical Power Analysis for the EDS Follow-Up.............................................. 23 Table 3.6: Child Outcome Measures...................................................................................... 24 Table 3.7: Parent and Family Outcome Measures ................................................................. 25 Table 3.8: Percent of Even Start and Control Group Families in the EDS, by Type of Social
and Educational Service Received Between Pretest, Posttest, and Follow-Up (Based on Parent Report) ...................................................................................... 26
Table 3.9: Classroom Activities for Children at Least Age Three Who Were in a Center-Based Preschool or Kindergarten Classroom at the Time of Follow-Up Data Collection, by Even Start and Control Group Status ............................................ 27
Figure 3.2: Percent of Even Start Families that Made it Through the Period of Preparation and Were Enrolled for At Least “N” Months ....................................................... 28
Table 4.1: Summary of Even Start and Control Group Means, at Pre-test, Post-test, and
Follow-Up............................................................................................................. 34 Table 4.2: Summary of EDS Gains and Effect Sizes (Pretest vs. Follow-Up) ...................... 38 Table 4.3: Summary of Even Start Gains and Impacts (Pretest vs. Follow-Up) ................... 39 Table 4.4: Summary of Regressions Predicting Child Outcomes from Hours of
Participation and Family Background .................................................................. 40 Figure 4.1: Pretest and Posttest Standard Scores on the PPVT for Even Start and Control
Children in the EDS, and for Children in the Head Start FACES Study.............. 40

Abbreviations
ix
ABBREVIATIONS ABE Adult Basic Education ESL English as a Second Language EDS Experimental Design Study ESPIRS Even Start Performance Information Reporting System GED General Education Development credential or diploma FACES Head Start Family and Child Experiences Study HS High School JOBS Job Training for Basic Skills LIFT Literacy Involves Families Together PPVT Peabody Picture Vocabulary Test SSRS Social Skills Rating System TANF Temporary Assistance for Needy Families WJ-R Woodcock-Johnson Psychoeducational Battery (Revised)


Abstract
xi
ABSTRACT Citation: Ricciuti, A.E., R.G. St.Pierre, W. Lee, A. Parsad & T. Rimdzius. Third National Even Start Evaluation: Follow-Up Findings From the Experimental Design Study. U.S. Department of Education, Institute of Education Sciences, National Center for Education Evaluation and Regional Assistance. Washington, D.C., 2004. Background: The Even Start Family Literacy Program has provided instructional services to low-income children and their parents since 1989. A previous randomized controlled trial in the early 1990s did not show this program to have positive impacts. Purpose: To assess the effectiveness of Even Start in a group of grantees around the country. An earlier report from this study presented impact findings based on pretest and posttest data at the start and end of a school year. No program impacts were found. The purpose of the current report is to present impact analyses of follow-up data collected one year after posttest data. Setting: 18 Even Start grantees in 14 states that operated in the 1999-2000 and 2000-2001 school years. Subjects: 463 families eligible for and interested in participating in Even Start family literacy services. Intervention: Even Start families were offered family literacy services, defined as (1) interactive parent-child literacy activities, (2) parenting education, (3) adult education, and (4) early childhood education. Research Design: Randomized controlled field trial in which families were randomly assigned either to Even Start (309 families) or a control group (154 families). Control or Comparison Condition: Control families could participate in any educational and social services to which they were entitled, but they were not allowed to participate in Even Start for one year. Data Collection and Analysis: Pretest data on child and adult literacy skills were collected in the fall, posttest data were collected in the spring/summer, and follow-up data were collected the next spring. Measures included direct assessment of children (Peabody Picture Vocabulary Test, Woodcock-Johnson Battery, Story & Print Concepts), direct assessment of parents (Woodcock-Johnson Battery), teacher report on children (Social Skills Rating System), parent reports on economic and educational status, child literacy-related skills, home literacy environment and activities, parent assessment of children (Vineland Communication Domain), and school records. A longitudinal sample (data at all three waves) of children and parents was created for each outcome measure, and t-tests were conducted to assess differences in gains between Even Start
Abstract
xii
and control groups. The sample size for the analysis of any given outcome depends on several factors including attrition, age of the child, exclusion of families who were assessed in Spanish, and the need for longitudinal data. For example, the PPVT analysis for children was done with samples of 97 Even Start and 44 control children, and the Woodcock-Johnson analysis for parents was done with samples of 149 Even Start and 65 control parents. Findings: As was the case at posttest, Even Start children and parents made gains on a variety of literacy assessments and other measures at follow-up, but they did not gain more than children and parents in the control group. It had been hypothesized that follow-up data might show positive effects because (1) Even Start families had the opportunity to participate for a second school year, and (2) change in some outcomes might require more time than others. However, the follow-up data do not support either of these hypotheses. Conclusion: The underlying premise of Even Start as described by the statute and implemented in the field was not supported by this study.
Section 1: Background and Summary of Findings
1
SECTION 1: BACKGROUND AND SUMMARY OF FINDINGS
The third national Even Start evaluation included two complementary studies: (1) the
Even Start Performance Information Reporting System (ESPIRS) provided annual data on the universe of Even Start projects from 1997-1998 through 2000-2001, and (2) the Experimental Design Study (EDS) was an experimental study of Even Start’s effectiveness in 18 projects, reflecting the way that projects were implemented during 1999-2000 and 2000-2001.
The major set of evaluation findings are contained in the recently-released report by St.Pierre, Ricciuti, Tao, Creps, Swartz, Lee, Parsad & Rimdzius (2003). The analysis for that report relied on a comparison of pretest data collected at the beginning of the school year with posttest data collected at the end of the same school year from Even Start and control group families who participated in the EDS. The present document updates the findings from the St.Pierre, Ricciuti, Tao, et al (2003) report by comparing pretest data with follow-up data collected about nine months after the posttest. The findings presented in this document are consistent with and lead to the same conclusions as findings contained in the earlier report. SUMMARY OF FINDINGS
Eighteen Even Start projects and 463 families participated in the EDS -- 309 families were randomly assigned to participate in Even Start and 154 were assigned to a control group that could avail themselves of any educational services to which they were entitled, but they could not participate in Even Start. Pretest data on child and adult literacy skills were collected in the fall, posttest data were collected in the spring/summer, and follow-up data were collected in the following spring.
Although analysis of pretest compared with posttest data did not show that Even Start children and adults performed better than control group children and adults (see St.Pierre, Ricciuti, Tao, et al, 2003), it was hypothesized that follow-up data might show positive effects of Even Start due to either, or both, of two factors. First, families that were assigned to Even Start had the opportunity to participate in the program for approximately one school year between pretesting and posttesting. Collecting follow-up data nine months after posttesting gave those families the opportunity to participate in Even Start for a second school year, possibly leading to positive effects under the assumption that a greater amount of exposure to Even Start would lead to larger literacy gains and to statistically significant program impacts.
A second hypothesized reason that positive effects might show up in follow-up data is that change in some outcome measures is more long-term in nature than others, and impacts might be evident after two school years, even if there were no impacts after one year. An example is household income, which might not change until parents have increased their literacy skills or education level and found a job, or acquired a better job. Another example is child literacy levels, which are hypothesized to change, in part, as a result of temporally prior changes
Section 1: Background and Summary of Findings
2
in parenting skills and parent literacy. It takes time for the latter to occur, so it is possible that changes in child literacy that are not apparent after one school year of Even Start might be seen after two school years, due to changes that occur in parents. The follow-up data do not support either of these hypotheses. Findings from analyses of literacy gains based on a comparison of pretest data with follow-up data (collected about 18 months after pretest) are almost identical to the findings based on a comparison of pretest data with posttest data (about nine months after pretest). In short, at follow-up, while Even Start children and parents made gains on literacy assessments and other measures, children and parents in the 18 Even Start programs that participated in the EDS did not gain more than children and parents in the control group. We hypothesized that positive effects might be observed by the time of the follow-up data collection if families assigned to Even Start participated in instructional services for a substantially longer period of time. However, data from the Even Start Performance Information Reporting System (ESPIRS) show that Even Start EDS families participated in instructional services for an average of about 8 months between pretest and posttest data collection, and for an average of 10 months between pretest and follow-up data collection. Thus, providing the opportunity for an additional year of exposure to Even Start resulted in little additional participation on the part of families (an average of two additional months).
Another way in which we sought to understand participation in Even Start was to ask parents about the instructional services in which they participated during the prior year. At the posttest, significantly more Even Start parents than control parents reported that their children participated in early childhood education (72% vs. 32%), and that they participated in adult education (59% vs. 29%) and in parenting education (28% vs. 17%). By the follow-up assessment, more Even Start parents than control parents reported that their children participated in early childhood education (57% vs. 44%), and roughly equal percentages of Even Start and control parents reported participating in adult education (40% vs. 32%) and parenting education (17% vs. 20%). Although these data show that significantly more Even Start families than control families participated in instructional services, the participation rates for the two groups are not large in an absolute sense and are not nearly as different as might be expected, indicating both that Even Start families did not participate fully in the program, and that control families were able to find competing instructional services. Thus, in order for Even Start families to perform better than control families on literacy-related outcome measures, the instructional services in which Even Start families participated would have to be much more effective than the instructional services in which control group families participated. This is unlikely since many Even Start projects build on instructional services that already exist in the community – the same services in which control group parents and children may have been participating. Finally, it was hypothesized that positive effects on child literacy might be observed in the follow-up data collection because of the additional time that parents have to improve their parenting and literacy skills. These improvements would then be hypothesized to translate into changes in their interactions with their children, and additional family resources. However, the data do not show significant impacts of Even Start on parents’ literacy skills or parenting behaviors, so the subsequent lack of impacts on children is not surprising.

Section 1: Background and Summary of Findings
3
STUDY LIMITATIONS
The EDS used a random assignment design, the strongest approach for estimating program impacts. However, projects volunteered for this study instead of being randomly selected, so we cannot generalize to the Even Start population on a strict statistical basis. EDS families are more likely than the population of Even Start families to be Hispanic, and EDS projects are more likely than the population of Even Start projects to be in urban areas. Thus, findings from the EDS are most relevant to urban projects that serve large numbers of Hispanic/ESL families.
In addition, to be included in the analysis for this study, children and parents were required to have a complete set of data for a given outcome variable (i.e., data at pretest, posttest, and follow-up) with all direct assessments administered in English. This limits generalizability to families that are relatively stable over a two-year period as well as children and parents who were comfortable enough with English to be assessed in that language.

Section 2: The Even Start Family Literacy Program
5
SECTION 2: THE EVEN START FAMILY LITERACY PROGRAM
THE FAMILY LITERACY MOVEMENT
Through the mid-1900s, the nation’s literacy problems were addressed by a dual system of public and private sector efforts that included remediation programs for adults in the form of adult education or workplace literacy programs, and prevention programs for children in the form of early childhood education efforts such as Head Start. The seeds of a new approach were sown in the late 1970s and early 1980s when many of the first family literacy programs were planned and implemented (Smith, 1995).
Drawing on the experiences of existing early intervention and adult literacy programs, family literacy programs are based on the beliefs that children’s early learning is greatly influenced by their parents, that parents must develop and value their own literacy skills in order to support their children’s educational success, and that parents are their children’s first and best teachers. Family literacy programs seek to improve the literacy development of young children not only by providing early childhood education services directly to young children, but also by helping parents become more literate themselves, by helping parents understand more about how children learn, and by inculcating good teaching habits in parents. In the late 1980s this new approach emerged in full force as family literacy programs proliferated under a range of sponsors including state governments (e.g., Kentucky’s PACE program), local school districts (e.g., the Marin, CA Library Family Literacy Program), private organizations (e.g., the National Center for Family Literacy), private corporations (e.g., Stride-Rite’s Intergenerational Day Care program), and universities (e.g., El Paso State College’s Family Intergenerational English Literacy Program). The movement attained national status in 1989 when the federal government instituted its family literacy centerpiece, the Even Start Family Literacy Program. THE FAMILY LITERACY MODEL
Even Start, like most family literacy programs, offers instructional services that include early childhood education, adult literacy education, parenting education, and structured literacy interaction between parents and their children. According to Sharon Darling, President of the National Center for Family Literacy, the four-component family literacy model is intended to:
…promote intergenerational learning as an effective means to break the cycle of poverty and undereducation. Family literacy provides self-sufficiency for multiple generations simultaneously. When parents and children work together, the parents have the opportunities to gain the skills to fulfill their roles as parents, workers and citizens. Children gain academic readiness and reading skills to be successful learners in our schools (Darling, 2000).
Section 2: The Even Start Family Literacy Program
6
Recent legislation provided a definition of family literacy that is used in all federal programs that offer family literacy services. While Even Start is the premier federal family literacy program, family literacy services are allowable in programs such as Head Start, Title I, Adult Education and Reading First. Federal family literacy services are defined as follows:
Services provided to participants on a voluntary basis that are of sufficient intensity, in terms of hours, and of sufficient duration to make sustainable changes in a family, and that integrate all of the following activities: interactive literacy activities between parents and their children; training for parents regarding how to be the primary teacher for their children and full partners in the education of their children; parent literacy training that leads to economic self-sufficiency; and age-appropriate education to prepare children for success in school and life experiences. (Public Law 105-277).
One of the assumptions underlying the family literacy model is that a child will benefit
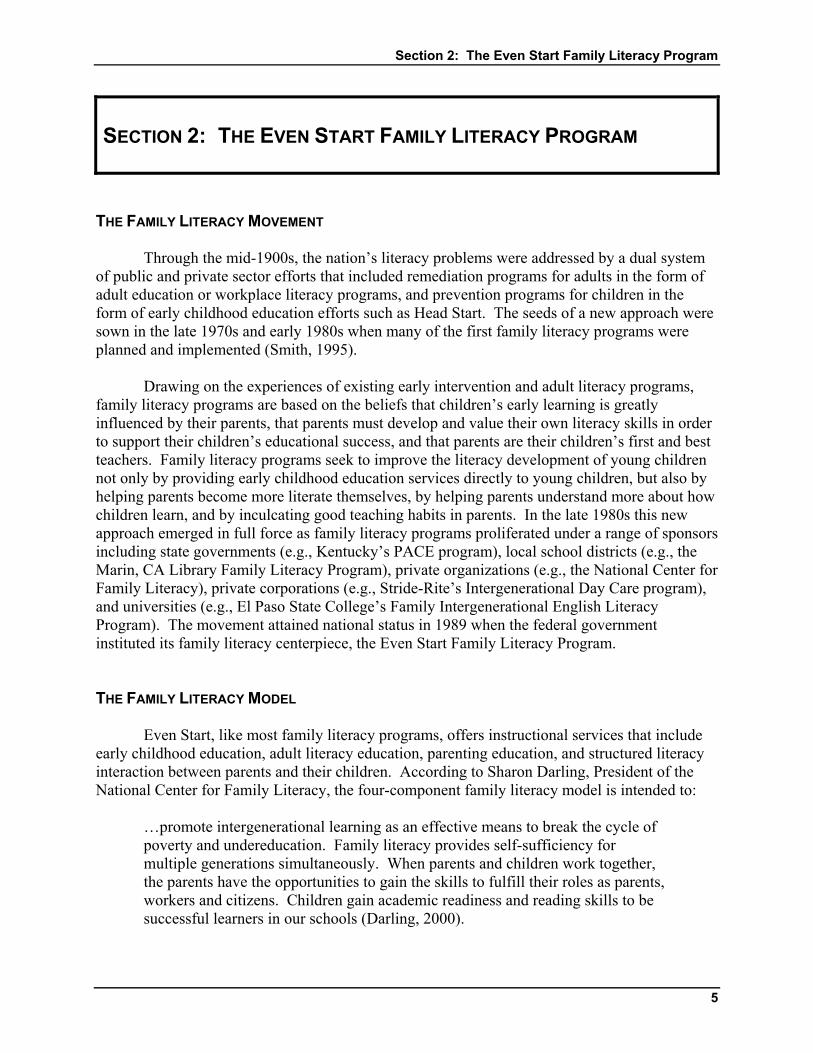
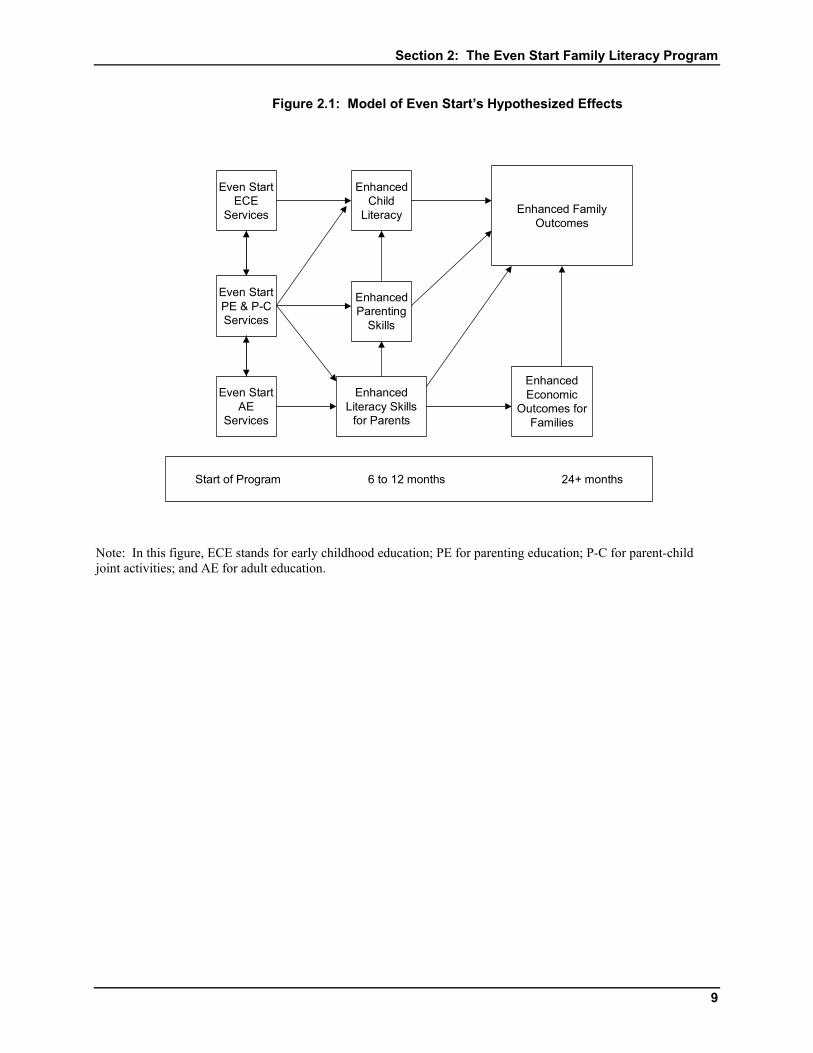
more from being in a family that participates in each family literacy service (early childhood education, adult education, parenting education and parent-child literacy activities), than from simply participating in an early childhood program. A model of family literacy theory described by St.Pierre, Ricciuti, Tao, et al (2003) predicts that family literacy programs such as Even Start will produce short-term positive effects on the literacy skills of children and parents who participate intensively in early childhood education and adult education services, as well as short-term positive effects on parenting skills and the home literacy environment due both to participation in parenting education and parent-child literacy activities (Figure 2.1). Early effects on child literacy skills and on parenting skills and household literacy resources, as well as enhanced parent literacy skills and enhanced economic outcomes for the family (e.g., improved parent education, better employment, increased household income) all are hypothesized to lead to longer-term positive effects on the literacy skills of children in the family and continued enhancement of economic outcomes.
What research about the instructional components of family literacy programs supports these hypotheses? A large body of research attests to the effectiveness of high-quality, intensive early childhood education programs at producing significant short-term children’s cognitive benefits for children from low-income families (e.g., Barnett, 1995; Karoly, Greenwood, Everingham, et al, 1998). Model early childhood programs such as the Abecedarian project (Ramey & Campbell, 1988) and the Perry Preschool Program (Schweinhart, Barnes & Weikart, 1993) have produced short-term IQ gains of between 0.5 and 1.0 standard deviation units.
Research evidence on the effectiveness of parenting education and adult education is much less compelling. There is little doubt that parents play a critical role in the cognitive development of their children. A large descriptive research literature links levels of parent education to levels of child achievement (National Research Council, 1998, 2000, 2001), and a number of studies have shown a positive relationship between language-rich parent-child interactions and language development of young children (Hart & Risley, 1995; National Research Council, 1998, 2000, 2001; Powell & D'Angelo, 2000). However, no experimental evidence has been found to support the hypothesis that parenting programs can make large enhancements in parent literacy and parenting skills, and most studies and reviews of research in
Section 2: The Even Start Family Literacy Program
7
this area have concluded that parenting education, by itself, is not able to affect child outcomes (Barnett, 1995; St.Pierre & Layzer, 1998; Wagner & Clayton, 1995; Clarke-Stewart, 1988).
Adult basic and secondary education programs have high dropout rates and low levels of intensity, making it difficult to see how they can be expected to lead to positive effects on literacy outcomes (Moore & Stavrianos, 1994), and most reviews of adult basic education programs have concluded that while education and training programs have modest positive effects on GED attainment, they have not been able to increase adults' literacy skills (Bos, Scrivener, Snipes & Hamilton, 2002; Datta, 1992; Duffy, 1992; Mikulecky, 1992). A comprehensive review of job training and search programs shows that these programs have small, but real effects on employment, AFDC receipt, and income (Fischer & Cordray, 1995). Still, welfare-to-work programs have not lifted substantial numbers of adults out of poverty, and a well-respected review of the impact of welfare-to-work programs concluded that, while almost of the programs studied led to small gains in earnings, many participants remained in poverty and on welfare (Gueron & Pauly, 1991). In addition, the authors voiced concern that even mothers who obtain jobs frequently leave or lose them, for reasons such as a lack of transportation or child care and loss of health benefits for children.
Thus, previous research about family literacy instructional components shows that high-quality, intensive early childhood education programs can indeed produce short-term cognitive benefits for low-income children. However, expectations about the effectiveness of parenting education and adult education programs for parents should be modest at best, with subsequent effects on their children being even more unlikely, leading Ramey, Ramey, Gaines & Blair (1995) to question the premise that adult-focused programs can ever have benefits for children. Even assuming that it might be possible to significantly alter parent literacy and parenting skills, research has not shown that these changes will translate into improved literacy performance among children in a timely manner (Ramey & Ramey, 1992).
In spite of the questions raised by this research evidence, the family literacy model hypothesizes that the instructional services described above will be more effective when integrated into a unified program, that some synergy is expected from receiving the combination of services, and that the integration of instructional services will lead to enhanced outcomes both for children and their parents. THE EVEN START FAMILY LITERACY PROGRAM
As the Nation’s largest and most visible family literacy program, Even Start addresses the basic educational needs of low-income families including parents and their children from birth through age seven by providing a unified program of family literacy services, defined as services that are of sufficient intensity in terms of hours, and of sufficient duration, to make sustainable changes in a family, and that integrate:
Interactive literacy activities between parents and their children (parent-child activities). Training for parents regarding how to be the primary teacher for their children and full
partners in the education of their children (parenting education).
Section 2: The Even Start Family Literacy Program
8
Parent literacy training that leads to economic self sufficiency (adult education). An age-appropriate education to prepare children for success in school and life
experiences (early childhood education).
Even Start’s long-term purpose is to help break the cycle of poverty and illiteracy for low-income families. Local Even Start projects are meant to integrate the components of family literacy and build on services that already exist in their communities. The program has grown steadily over the past decade, both in terms of federal funding as well as the number of projects that are supported with those funds. From a small demonstration program in which $14.8 million was used to fund 76 projects in 1989-1990, Even Start has grown ten-fold. In 2000-2001, $150 million in funding was distributed to 855 projects serving 32,000 families in all 50 states, and funding rose to $250 million in 2001-2002 (the appropriation was approximately $248 million in 2002-2003). Even Start has been reauthorized and amended several times, most recently through the Literacy Involves Families Together (LIFT) Act of 2000 and the No Child Left Behind Act of 2001. The third national evaluation was designed before these reauthorizations, so this report’s findings reflect Even Start as it was implemented pre-reauthorization.
Section 2: The Even Start Family Literacy Program
9
Note: In this figure, ECE stands for early childhood education; PE for parenting education; P-C for parent-child joint activities; and AE for adult education.
Even StartECE
Services
Even StartPE & P-CServices
Even StartAE
Services
EnhancedChild
Literacy
EnhancedParenting
Skills
EnhancedLiteracy Skills
for Parents
Enhanced FamilyOutcomes
EnhancedEconomic
Outcomes forFamilies
Start of Program 6 to 12 months 24+ months
Figure 2.1: Model of Even Start’s Hypothesized Effects

Section 3: Description of the Evaluation
11
SECTION 3: DESCRIPTION OF THE EVALUATION
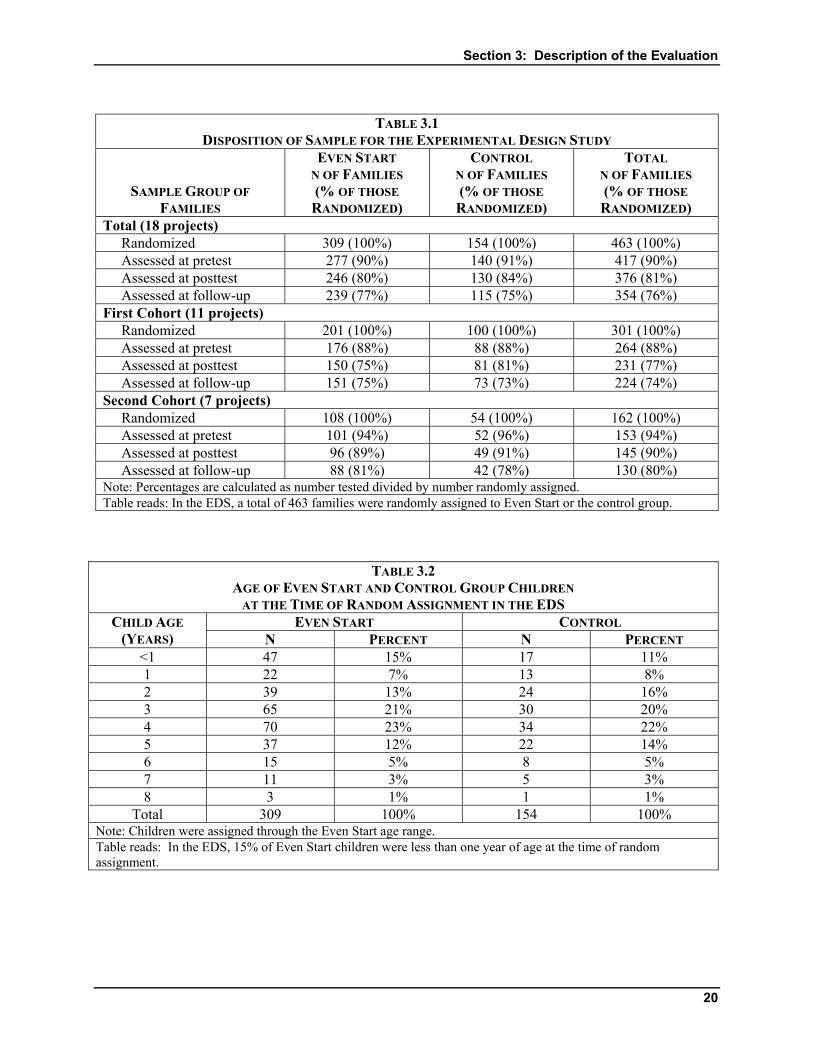
IMPLEMENTATION OF THE EVALUATION The original design for and resources allocated to the EDS called for an experiment to be conducted in 15 to 20 Even Start projects. In practice, the EDS was implemented in 18 projects which voluntarily agreed to randomly assign incoming families to be in Even Start or a control group, providing an experimental assessment of Even Start’s impacts. A summary of the numbers of projects and participants at each stage of the evaluation is given in Figure 3.1. EDS Sample and Evaluation Design. Projects were recruited during the 1999-2000 and 2000-2001 school years to participate in the EDS. During this time, all Even Start projects in the nation were screened for eligibility. To pass the eligibility screen, projects had to minimally meet Even Start’s legislative requirements, be in operation for at least two years, plan to operate through the length of the study, plan to serve about 20 new families at the start of data collection, offer instructional services of moderate or high intensity relative to all Even Start projects, and be willing to participate in a random assignment study. Projects also were recruited from urban and rural areas, as well as projects that served varying proportions of ESL participants. Over the two recruitment years, 115 out of a universe of about 750 projects met the selection criteria. All 115 eligible projects were contacted, materials were sent describing the study, telephone calls were made to all 115 projects to discuss the study, and site visits were made to many of the projects. In the end, 18 of these projects (about 15% of the eligible projects) were willing to participate in the study. The background characteristics of families in the two cohorts of projects were similar, so data were combined across all 18 projects for analytic purposes. The fact that only 115 out of 750 projects met the selection criteria for the EDS should not call the validity of the study into question. The selection criteria outlined above were applied in order to obtain a sample of projects that would be operating during the time of the study, that were not brand-new projects, that offered a reasonable amount of instructional service, and that could recruit a sufficient number of new families. All of these are fair study requirements.
However, the fact that only 18 out of 115 eligible projects were willing to participate in the EDS does make us worry about the generalizability of the findings (see discussion below). Why was the rate of participation of projects in the study so low? The key reason is that participation in the evaluation was not mandated – it was not a condition for continued receipt of federal funding. The approach of mandated participation in federal studies has been used in the recent past and has been shown to be very effective, e.g., for the Head Start Impact Study. In the absence of this sort of a mandate, the EDS had to rely on incentives and the good will of project staff. Several incentives were offered including a cash honorarium of $1,500 for each project, $20 for each family at each wave of data collection, and $15 for each teacher at each wave of data collection. Projects were offered the opportunity to meet with each other at national meetings, letters of commendation were written to local school boards, and discussions about the importance of the research were held with project staff. Of course, the main deterrent to
Section 3: Description of the Evaluation
12
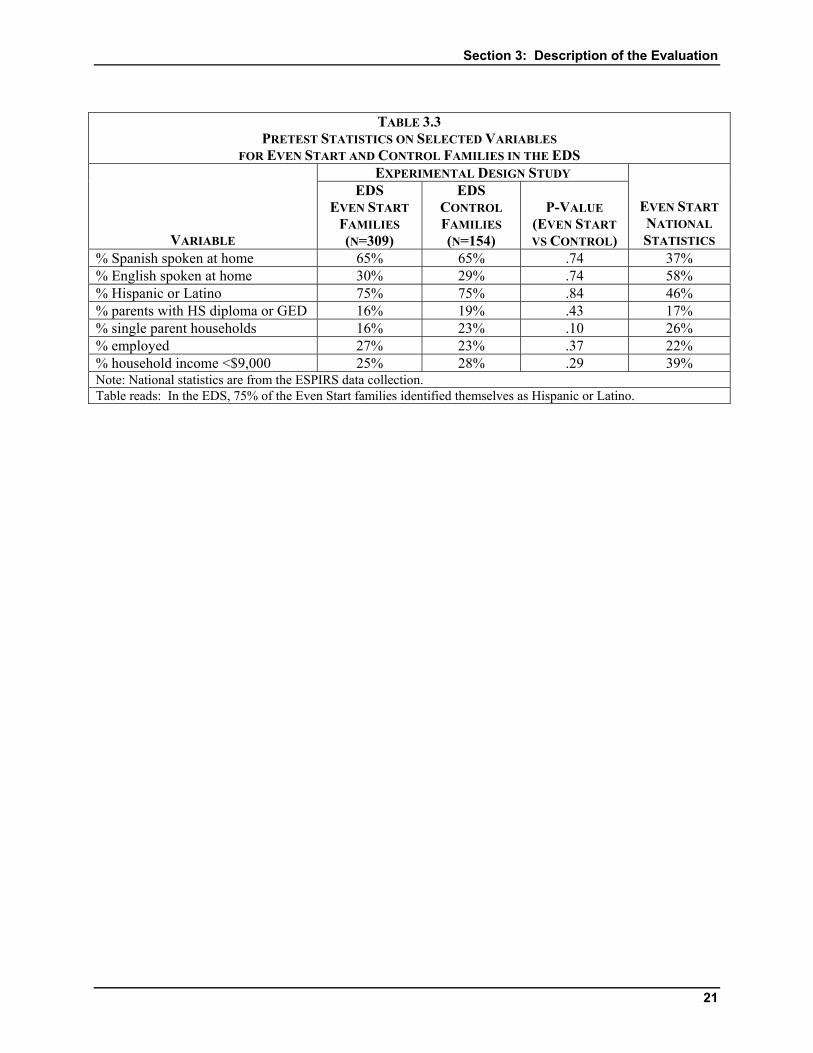
participating in the EDS was the requirement that projects allow research staff to randomly assign incoming families to be in Even Start or a control group. Randomization of Families. Each of the 18 EDS projects was asked to recruit families as they normally do and to provide listings of eligible families to Abt Associates staff who randomly assigned families either to participate in Even Start (two-thirds of the families) or to be in a control group (one-third of the families). Assignment to the control group meant that the family could not participate in Even Start for one year. A total of 463 families were randomly assigned in the EDS -- 309 to Even Start and 154 to the control group (Table 3.1 and Figure 3.1), maintaining the planned 2:1 ratio. This is an average of about 26 families per project. Instead of restricting children in the EDS to, say, preschoolers, children throughout the Even Start age range were included. Even though the EDS provided some data on all children in the study, the sample for analysis of literacy gains on direct assessments was limited to children who were at least 2.5 years old at the time of pretesting since most standardized literacy measures are not appropriate for children until they reach this age. About one-third of the children in the EDS were under 2.5 years of age at the time of pretest (Table 3.2). At the time of the follow-up, only about 10% of children in the EDS were under 2.5 years. Parent-report measures of child literacy skills were available for children of all ages. Comparability of Even Start and Control Groups. Even Start and control families were statistically equivalent at the time of randomization and at the pretest (Table 3.3). Group equivalence at the time of randomization is guaranteed, within known statistical bounds, by proper implementation of random assignment and a sufficiently large sample size. However, 10% of the families were lost between the time of randomization and time of pretest. This attrition occurred equally in the Even Start and control groups. An analysis of pretest data showed that Even Start and control groups did not differ significantly on the percent of families where Spanish was spoken at home, families where English was spoken at home, Hispanic families, parents with a high school diploma or a GED, single parent households, employed parents, and households with annual income less than $9,000. Generalizability of EDS Findings. The EDS used a random assignment design, the strongest approach for estimating program impacts. However, projects volunteered for this study instead of being randomly selected, so we cannot generalize to the Even Start population on a strict statistical basis. The plan was to select EDS projects to include urban and rural projects, projects that offer varying amounts of instruction, and projects that serve high and low percentages of ESL families. Due to the voluntary nature of the study, this plan could not be implemented perfectly, and while the EDS projects do represent major kinds of projects funded in Even Start, the data presented in Table 3.3 show that EDS families are more likely than the population of Even Start families to be Hispanic (75% vs. 46%). Further, 83% of EDS projects are in urban areas compared with 55% of all Even Start projects. These data suggest that findings from the EDS are most relevant to urban projects that serve large numbers of Hispanic/ESL families.
Data comparing the mean pretest scores of EDS families with the population of Even Start families on 18 parent-reported outcomes having to do with child literacy skills and home
Section 3: Description of the Evaluation
13
literacy activities are shown in St.Pierre, Ricciuti, Tao, et al (2003, Exhibit 6.1.41). For most variables there is no difference between the two groups, and the data support the contention that there are no important differences between EDS families and the Even Start population in terms of parent reported literacy skills and home literacy activities.
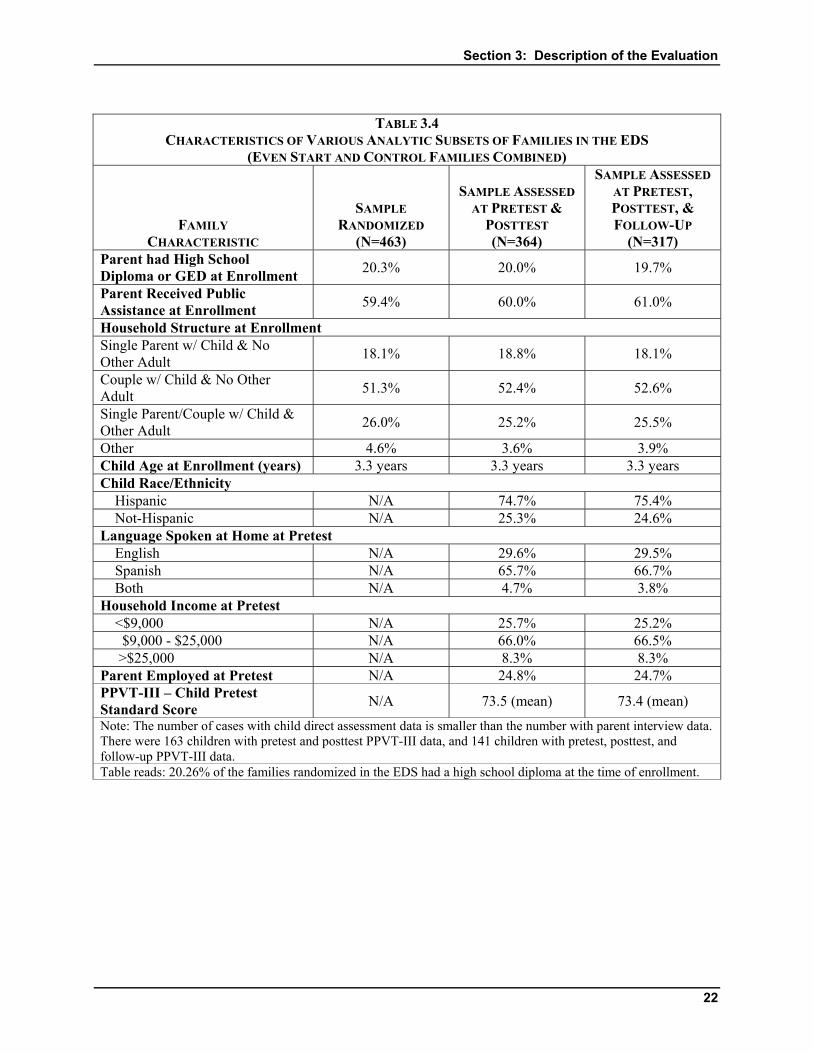
Data Collection. EDS data were collected at three time points. For the 11 projects that began the EDS in the 1999-2000 program year, pretest data were collected in fall 1999, posttest data in spring 2000, and follow-up data in spring 2001. For the seven projects that began the EDS in the 2000-2001 program year, pretest data were collected in fall 2000, posttest data in spring 2001, and follow-up data in spring 2002. In many projects, families entered Even Start on a rolling basis, so the pretest data collection was spread across several months (October through January) as new families entered the program. There was an average of 8.8 months between pretest and posttest, with a minimum of 5 months and maximum of 12 months. There was an average of 19.6 months between pretest and follow-up, with a minimum of 16 months, and a maximum of 24 months. Data collection from parents and children was done by field staff members that were recruited by, trained by, and employed by the research contractor. Field staff members had backgrounds in interviewing and in working with children, although experience assessing children and adults was not a prerequisite for employment. Data Collection Response Rates. Response rates for the EDS data collection were high compared with those achieved by many educational studies: 90% at the pretest, 81% at the first posttest, and 76% at the follow-up assessment (Table 3.1 and Figure 3.1). Response rates are based on completed parent interviews, which generally correspond to the number of adults for whom we have direct assessment data. As mentioned above, the number of children for whom direct assessment data is available is less than the number of parents with such data, since child assessments could only be administered to children over 2.5 years of age. Sample sizes for individual outcomes vary considerably due to (1) response rates, as noted above, (2) children who were too young to be tested, and (3) children/parents who were tested in Spanish. We examined the comparability of the samples of families who were randomized (n=463), those who were assessed at pretest and posttest (n=364, reported on in St.Pierre, Ricciuti, Tao et al, 2003), and those who were assessed at pretest, posttest, and follow-up (n=317, reported on in the current document). For the sample that was randomized, but never found at one of the assessment points, we have demographic information that was obtained as part of the consent and study enrollment process (Table 3.4). For the samples that were assessed at one or more time-points, we have additional demographic data, in addition to PPVT pretest scores. It can be seen that the three samples are quite comparable with regard to demographics and pretest assessment scores. Since the data presented in Table 3.3 show that the Even Start and control groups were statistically equivalent at pretest, and the data presented in Table 3.4 show that families in the longitudinal analytic sample (Even Start and control group combined) have the same characteristics as families in the sample at pretest, sample bias does not appear to be a concern when interpreting the longitudinal results presented in this report. Test Language. Many Even Start projects serve a high percentage of non-English speaking families and deciding which language to use for literacy assessments posed difficult issues for this evaluation. We selected literacy measures that were available in both English and
Section 3: Description of the Evaluation
14
Spanish, e.g., the Peabody Picture Vocabulary Test and the Woodcock-Johnson. However, the English version of each measure was administered whenever possible. This approach served two purposes. First, assessing in English is consistent with Even Start’s goal for adults and children to become literate in English. Second, assessing in English provides for the largest possible analytic sample of children and adults tested in a common language. We compared pretest data for adults and children tested in English with pretest data for the small number of adults and children tested in Spanish. In spite of the claims of publishers that English and Spanish test forms are “equivalent”, we found very large differences in the pretest scores of English test-takers and Spanish test-takers, making us uneasy about combining the two sets of data. Just as difficult was the fact that some children and adults took the Spanish version of an assessment at one time (pretest, posttest or follow-up) and the English version at another time. We were uneasy about trying to conduct any analysis of change when different test languages were used, and in the end we restricted analyses of child and parent literacy outcomes to children and parents who took the assessment in English at all three times (pretest, posttest, follow-up). This restriction led us to exclude 59 children and 86 parents from the analysis of child and parent literacy outcomes, representing 13% and 19%, respectively, of the total sample of 463 families. This limits the generalizability of findings to children and parents who were comfortable enough with English to be assessed in that language. Analysis Sample and Methods. The bottom part of Figure 3.1 shows how the analysis sample was constructed for two key outcome measures -- the PPVT, which was administered to children and the WJ-R, which was administered to adults. Ninety-seven Even Start children and 44 control group children had valid PPVT scores at all three time points and thus formed the analysis sample for this outcome measure. Children were excluded from the analysis of PPVT data for several reasons:
Thirty-two Even Start and 14 control children were in families that could not be found for the pretest data collection.
Eighty-seven Even Start and 43 control children were too young (under age 2.5) to be tested at pretest.
Forty Even Start and 19 control children took the PPVT in Spanish (the TVIP) at one or more time points.
Fifty-three Even Start and 34 control children did not have a complete set of longitudinal data (pretest, posttest, follow-up).
Similar logic was followed to construct the analysis sample on the Woodcock-Johnson of
149 Even Start adults and 65 control group adults.
Separate analyses were conducted for each of 41 separate outcome variables. While a smaller set of composite variables could have been derived using factor analytic techniques, we chose to present each outcome separately so that readers have a clear understanding of the meaning of each outcome. The analysis consisted of a comparison of Even Start and control families pooled across all 18 of the projects participating in the study. In other words, each family in the evaluation was given equal weight in the analysis.
Section 3: Description of the Evaluation
15
For continuous variables, differences in gains for treatment and control groups were tested by conducting a t-test on the simple pre-post gain score for each group. For dichotomous variables, a gain score was created that could take on the values of 0 (no change), -1 (negative change), or 1 (positive change). A McNemar test was then used to assess the differences in gain between treatment and control groups. For data collected through teacher ratings and school records, which were collected only at post-test, we tested for treatment/control differences with t-tests on the post-test scores.
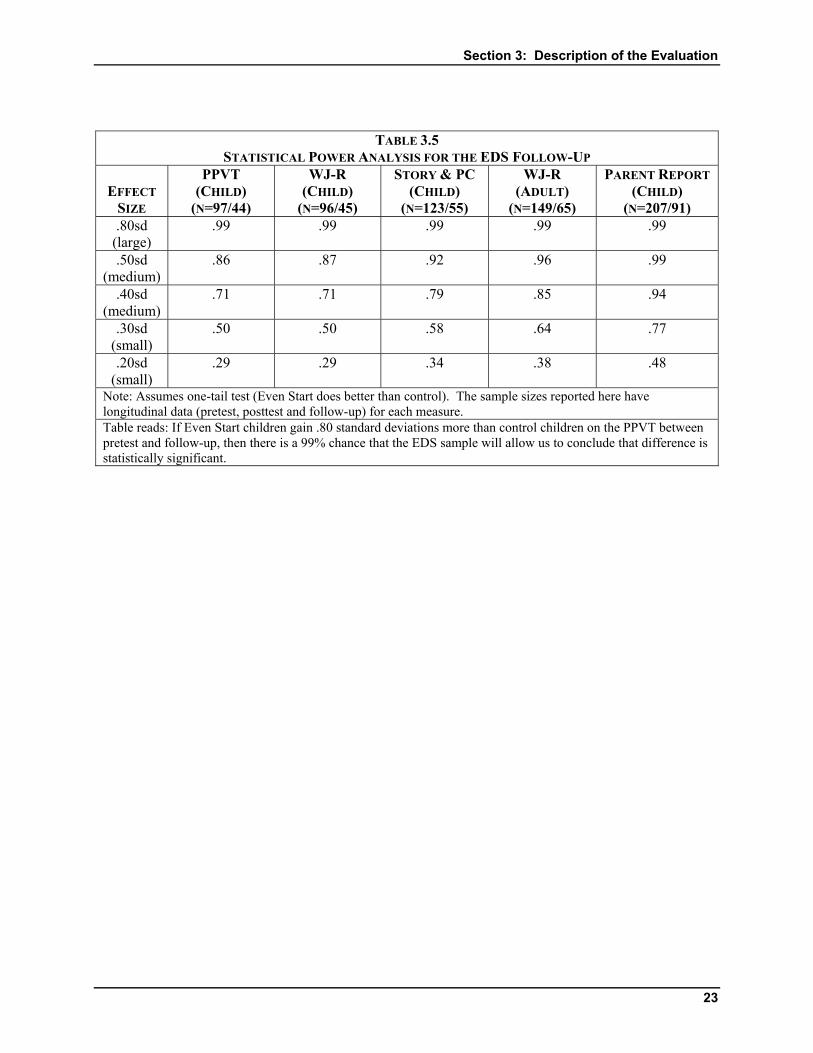
Although the data for this study are nested within sites, analyses to account for such nesting were not possible due to small sample sizes within each site.1 Using the Peabody Picture Vocabulary test as an example, there was a total of 97 Even Start and 44 control children with usable longitudinal data. Within-site samples ranged from 1 to 13 Even Start children and from 1 to 6 control children. Using the Woodcock-Johnson Letter-Word Identification test as an example for adults, there were a total of 149 Even Start adults and 65 control adults with usable longitudinal data. Within-site samples ranged from 2 to 14 Even Start adults and from 1 to 10 control adults. Finally, note that the gain scores shown in the tables of results are simple pre-post differences. Statistical Power. A total of 463 families were randomly assigned in the EDS – 309 to Even Start and 154 to the control group. For several reasons, the number of parents and children that enter into any given analysis of Even Start’s effectiveness is smaller than these totals: some families could not be found at the time of pretesting, posttesting, and follow-up testing; some children accepted into the study were too young (under 2.5 years of age) to be pretested; and some parents and children were assessed but had missing data on selected items. The statistical power to detect effects in the EDS therefore varies across measures. To understand statistical power it is helpful to have a shared definition of an “effect” produced by a program such as Even start. As an example, if Even Start had an effect of .50 standard deviations on the PPVT it would mean that the average child in Even Start gained a half standard deviation more than the average child in the control group. This is equivalent to 7.5 standard score points, because the PPVT standard deviation is 15.0 standard score points.
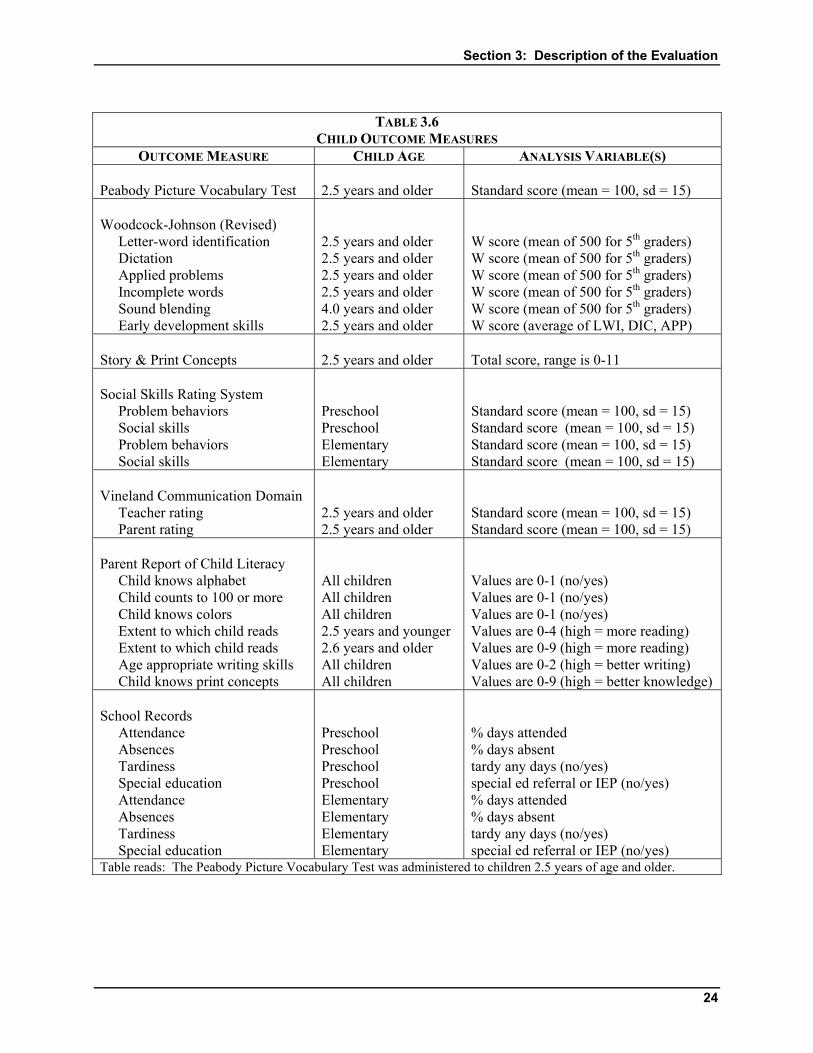
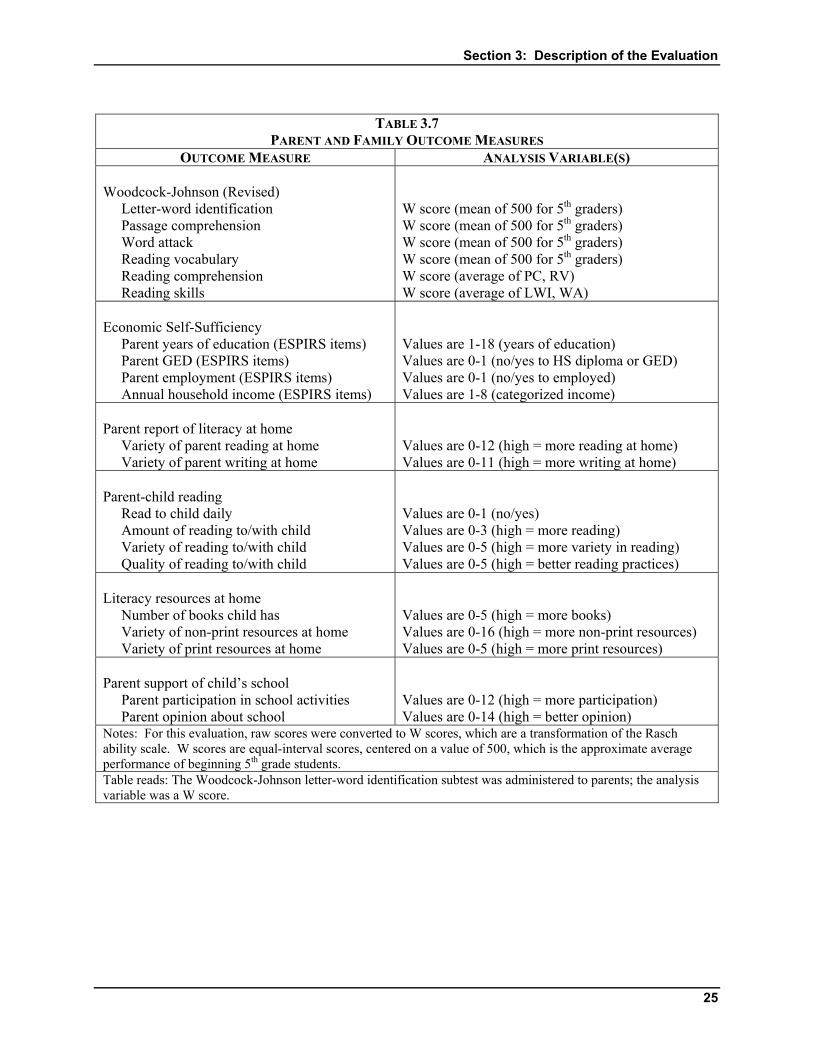
Table 3.5 shows statistical power for some of the key outcome measures. It can be seen that at follow-up, the EDS still had high statistical power to detect large and medium-sized effects, but poor power to detect small effects. Statistical power is greater than .85 for effects of .50 standard deviation (sd) or larger, greater then .70 for effects of .40 sd, and .85 or greater for effects of .30 sd for parents. But statistical power is less than .60 for effects of .30 sd for children, and less than .50 for effects of .20 sd or smaller. MEASURES USED IN THE EDS
Tables 3.6 and 3.7 list the outcome measures administered to children and parents, and Appendix A provides additional detail on each measure. Child outcomes were measured by 1 When possible, nesting should be taken into account in the analysis of nested designs. Here, we have a nested design but a nested analysis was not conducted due to small within-site sample sizes. When nesting is not taken into account, as in the present case, treatment effects may be overestimated.
Section 3: Description of the Evaluation
16
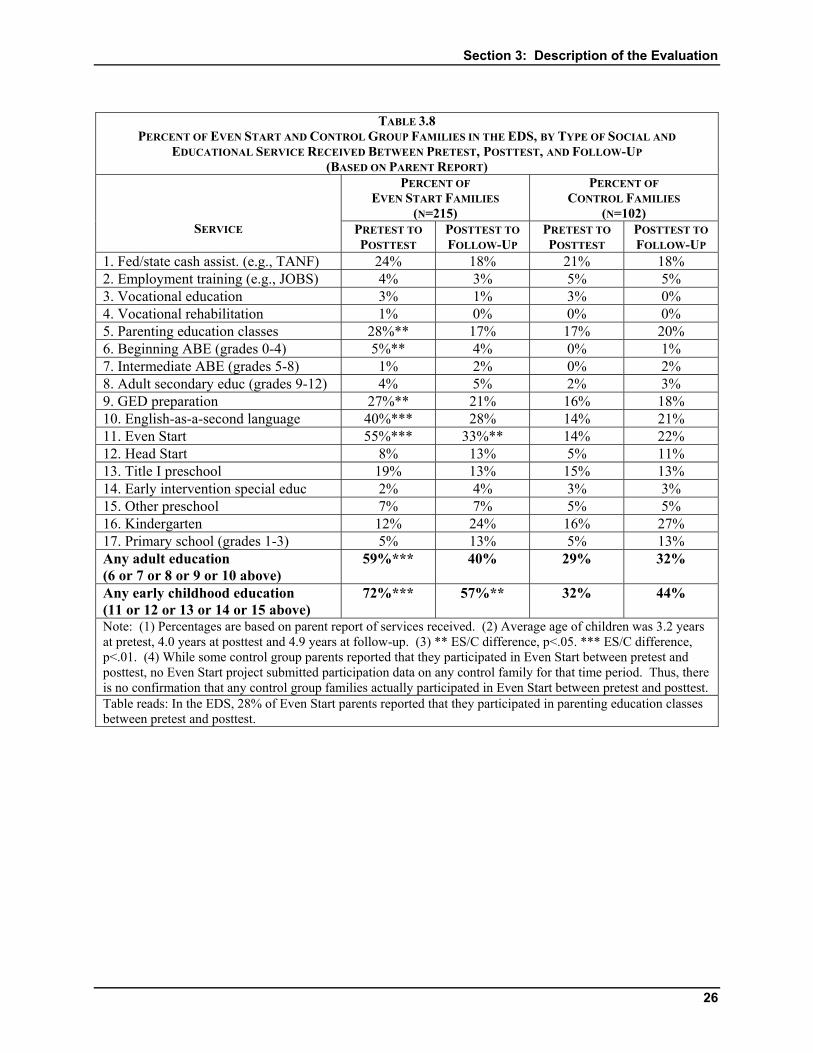
direct assessment of the child, parent report on the child’s skills, teacher report on the child’s behaviors in school, and a review of school records. The child measurement battery partially overlaps both with the ESPIRS that was administered to all Even Start families, and with measures for the Head Start FACES study. Parent outcomes were measured through direct assessment of literacy skills and parent self-report. Measurement of parent outcomes focused on language skills as opposed to the functional literacy or general skills that were measured in previous studies. Thus, the measurement battery is aligned with Even Start’s objectives. INSTRUCTION RECEIVED BY EVEN START AND CONTROL FAMILIES Families that were assigned to Even Start participated in the program at whatever levels of intensity and for whatever duration they desired. Families assigned to the control group were not allowed to participate in Even Start for one year. However, during that year they took part in any other educational and social programs for which they qualified and sought out. After the one-year period, control families were eligible to enroll in Even Start, and some families in some EDS projects did so -- 25 control group families (from the total of 154) reported that they participated in Even Start between the posttest and follow-up measurement. These families were retained in the control group for all of the analyses reported in this document. We conducted a separate set of analyses excluding control families that reported participating in Even Start after the one-year period, and the analysis results were unchanged. Parent Report of Instructional Services Received. The EDS parent interview included questions about the kinds of educational and social services in which families participated between pretest and posttest, and between posttest and follow-up. If Even Start families were participating fully in the program, and if parent report was a completely reliable measure, then the parent interview data ought to show us that very high percentages of Even Start families participate in each instructional service. This is not the case, as is demonstrated in Table 3.8 which shows the percentage of parents that reported participating in each instructional service between pretest and posttest, and between posttest and follow-up. Fewer Even Start families reported that they participated in early childhood education (57% vs. 72%), parenting education (17% vs. 28%), and adult education (40% vs. 59%) at the follow-up than at the posttest. This is a reasonable trend, given that Even Start families leave the program over time. However, the absolute percentages are quite low, given that all Even Start families are supposed to be participating in each of these instructional services.
A greater percentage of control parents reported participating in early childhood education (44% vs. 32%), parenting education (20% vs. 17%), and adult education (32% vs. 29%) at the follow-up than at the posttest. These increases make sense, since a small percentage of control parents reported that they joined Even Start after the posttest. In addition, more Even Start and control children participated in Head Start, kindergarten, and primary school at the follow-up than at the posttest. This is most likely a result of the increasing age of the children in both the Even Start and control groups (average child age was 3.2 years at pretest, 4.0 years at the posttest, and 4.9 years at the follow-up).
Section 3: Description of the Evaluation
17
At the posttest, significantly more Even Start parents than control parents reported that their children participated in early childhood education (72% vs. 32%), and that they participated in adult education (59% vs. 29%) and in parenting education (28% vs. 17%). By the follow-up, significantly more Even Start parents than control parents still reported that their children participated in early childhood education (57% vs. 44%), and roughly equal percentages of Even Start and control parents reported participating in adult education (40% vs. 32%) and parenting education (17% vs. 20%).
Although the data reported above show that significantly more Even Start families than control families participated in instructional services, the participation rates for the two groups are not nearly as different as might be expected, indicating both that Even Start families did not participate fully in the program, and that control families were able to find competing instructional services. Thus, in order for Even Start families to perform better than control families on literacy-related outcome measures, the instructional services in which Even Start families participated would have to be much more effective than the instructional services in which control group families participated. This is unlikely since many Even Start projects build on instructional services that already exist in the community – the same services in which control group parents and children may have been participating.
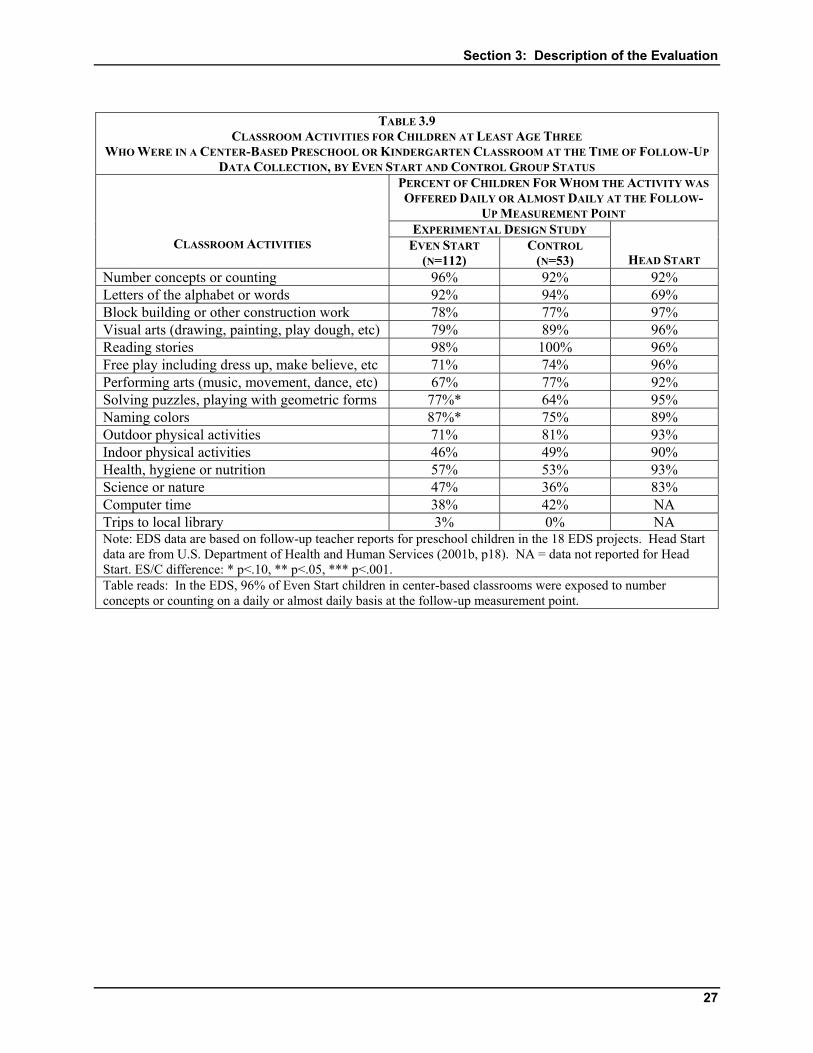
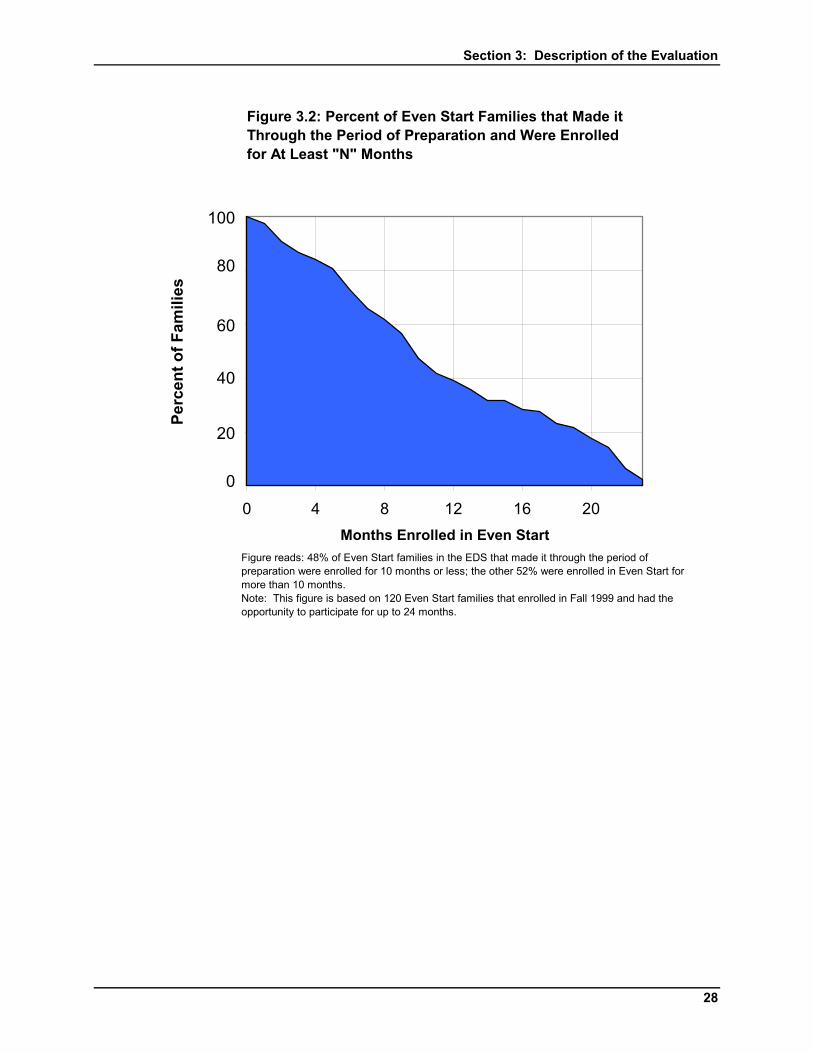
Teacher Reports of Classroom Activities. Teachers of Even Start and control children who were in center-based preschool or kindergarten settings were asked to report on the kinds of classroom activities that were available to children on a daily or almost daily basis. As was the case at the posttest (St.Pierre, Ricciuti, Tao et al, 2003), the classrooms in which Even Start and control children participated were very similar with regard to literacy-related activities (Table 3.9). Almost all Even Start children in center-based classrooms had many different kinds of literacy-related activities available to them on a daily or almost daily basis including number concepts or counting (96%), letters of the alphabet or words (92%), and reading stories (98%). Almost the same percentages of children in control classrooms were offered these literacy-related activities. At the follow-up, children in Even Start classrooms were more likely than control children to work on naming colors, and solving puzzles or working with geometric forms. Thus, teacher reports show few differences between the classroom experiences received by Even Start and control children. Length of Participation in Even Start. As described by St.Pierre, Ricciuti, Tao et al (2003), about one-third of the families that were randomly assigned to Even Start never participated enough to make it through Even Start’s period of preparation (a time in which families can try out the program without being officially enrolled) and hence be included in the national ESPIRS data collection system. For the remaining families, ESPIRS participation data showed that about 50% of Even Start families in the EDS participated in instructional services for 8 or fewer months between the pretest and posttest, while the other 50% participated for more than 8 months (out of a maximum of 12 months). Follow-up participation data2 showed that when given the opportunity to participate for up to 24 months, about half (48%) of the Even Start families participated for 10 or fewer months and half (52%) participated for more than 10
2 ESPIRS data collection ceased after the 2000-2001 program year, and so ESPIRS participation data beyond the posttest was available only for families in the group of 11 EDS projects that began the study in the 1999-2000 program year.
Section 3: Description of the Evaluation
18
months (Figure 3.2). Thus, the additional available year of instructional services resulted in only a couple of additional months of participation for the average Even Start EDS family.
Section 3: Description of the Evaluation
19
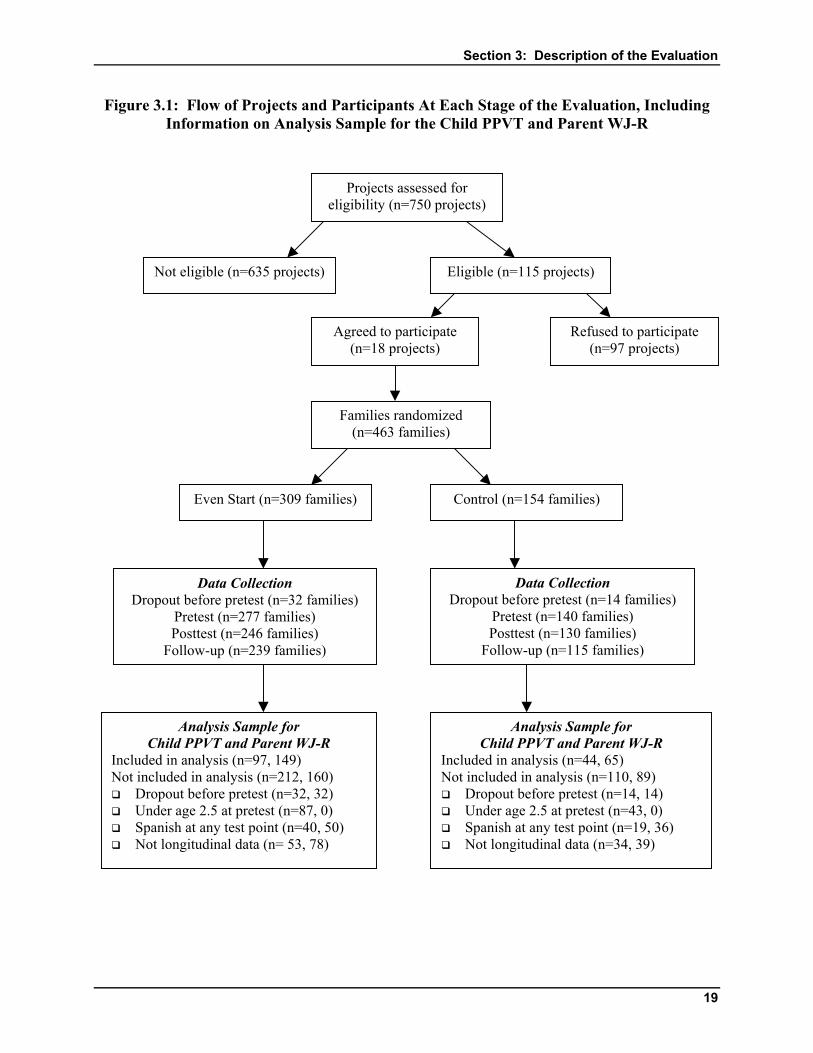
Figure 3.1: Flow of Projects and Participants At Each Stage of the Evaluation, Including Information on Analysis Sample for the Child PPVT and Parent WJ-R
Projects assessed for eligibility (n=750 projects)
Not eligible (n=635 projects) Eligible (n=115 projects)
Refused to participate (n=97 projects)
Agreed to participate (n=18 projects)
Families randomized (n=463 families)
Even Start (n=309 families) Control (n=154 families)
Data Collection Dropout before pretest (n=32 families)
Pretest (n=277 families) Posttest (n=246 families)
Follow-up (n=239 families)
Data Collection Dropout before pretest (n=14 families)
Pretest (n=140 families) Posttest (n=130 families)
Follow-up (n=115 families)
Analysis Sample for Child PPVT and Parent WJ-R
Included in analysis (n=97, 149) Not included in analysis (n=212, 160) Dropout before pretest (n=32, 32) Under age 2.5 at pretest (n=87, 0) Spanish at any test point (n=40, 50) Not longitudinal data (n= 53, 78)
Analysis Sample for Child PPVT and Parent WJ-R
Included in analysis (n=44, 65) Not included in analysis (n=110, 89) Dropout before pretest (n=14, 14) Under age 2.5 at pretest (n=43, 0) Spanish at any test point (n=19, 36) Not longitudinal data (n=34, 39)
Section 3: Description of the Evaluation
20
TABLE 3.1
DISPOSITION OF SAMPLE FOR THE EXPERIMENTAL DESIGN STUDY
SAMPLE GROUP OF FAMILIES
EVEN START N OF FAMILIES (% OF THOSE RANDOMIZED)
CONTROL N OF FAMILIES (% OF THOSE RANDOMIZED)
TOTAL N OF FAMILIES (% OF THOSE RANDOMIZED)
Total (18 projects) Randomized 309 (100%) 154 (100%) 463 (100%) Assessed at pretest 277 (90%) 140 (91%) 417 (90%) Assessed at posttest 246 (80%) 130 (84%) 376 (81%) Assessed at follow-up 239 (77%) 115 (75%) 354 (76%) First Cohort (11 projects) Randomized 201 (100%) 100 (100%) 301 (100%) Assessed at pretest 176 (88%) 88 (88%) 264 (88%) Assessed at posttest 150 (75%) 81 (81%) 231 (77%) Assessed at follow-up 151 (75%) 73 (73%) 224 (74%) Second Cohort (7 projects) Randomized 108 (100%) 54 (100%) 162 (100%) Assessed at pretest 101 (94%) 52 (96%) 153 (94%) Assessed at posttest 96 (89%) 49 (91%) 145 (90%) Assessed at follow-up 88 (81%) 42 (78%) 130 (80%) Note: Percentages are calculated as number tested divided by number randomly assigned. Table reads: In the EDS, a total of 463 families were randomly assigned to Even Start or the control group.
TABLE 3.2 AGE OF EVEN START AND CONTROL GROUP CHILDREN
AT THE TIME OF RANDOM ASSIGNMENT IN THE EDS EVEN START CONTROL CHILD AGE
(YEARS) N PERCENT N PERCENT <1 47 15% 17 11% 1 22 7% 13 8% 2 39 13% 24 16% 3 65 21% 30 20% 4 70 23% 34 22% 5 37 12% 22 14% 6 15 5% 8 5% 7 11 3% 5 3% 8 3 1% 1 1%
Total 309 100% 154 100% Note: Children were assigned through the Even Start age range. Table reads: In the EDS, 15% of Even Start children were less than one year of age at the time of random assignment.
Section 3: Description of the Evaluation
21
TABLE 3.3
PRETEST STATISTICS ON SELECTED VARIABLES FOR EVEN START AND CONTROL FAMILIES IN THE EDS
EXPERIMENTAL DESIGN STUDY
VARIABLE
EDS EVEN START
FAMILIES (N=309)
EDS CONTROL FAMILIES (N=154)
P-VALUE
(EVEN START VS CONTROL)
EVEN START NATIONAL STATISTICS
% Spanish spoken at home 65% 65% .74 37% % English spoken at home 30% 29% .74 58% % Hispanic or Latino 75% 75% .84 46% % parents with HS diploma or GED 16% 19% .43 17% % single parent households 16% 23% .10 26% % employed 27% 23% .37 22% % household income <$9,000 25% 28% .29 39% Note: National statistics are from the ESPIRS data collection. Table reads: In the EDS, 75% of the Even Start families identified themselves as Hispanic or Latino.
Section 3: Description of the Evaluation
22
TABLE 3.4
CHARACTERISTICS OF VARIOUS ANALYTIC SUBSETS OF FAMILIES IN THE EDS (EVEN START AND CONTROL FAMILIES COMBINED)
FAMILY CHARACTERISTIC
SAMPLE
RANDOMIZED (N=463)
SAMPLE ASSESSED AT PRETEST &
POSTTEST (N=364)
SAMPLE ASSESSED AT PRETEST, POSTTEST, & FOLLOW-UP
(N=317) Parent had High School Diploma or GED at Enrollment 20.3% 20.0% 19.7%
Parent Received Public Assistance at Enrollment 59.4% 60.0% 61.0%
Household Structure at Enrollment Single Parent w/ Child & No Other Adult 18.1% 18.8% 18.1%
Couple w/ Child & No Other Adult 51.3% 52.4% 52.6%
Single Parent/Couple w/ Child & Other Adult 26.0% 25.2% 25.5%
Other 4.6% 3.6% 3.9% Child Age at Enrollment (years) 3.3 years 3.3 years 3.3 years Child Race/Ethnicity Hispanic N/A 74.7% 75.4% Not-Hispanic N/A 25.3% 24.6% Language Spoken at Home at Pretest English N/A 29.6% 29.5% Spanish N/A 65.7% 66.7% Both N/A 4.7% 3.8% Household Income at Pretest <$9,000 N/A 25.7% 25.2% $9,000 - $25,000 N/A 66.0% 66.5% >$25,000 N/A 8.3% 8.3% Parent Employed at Pretest N/A 24.8% 24.7% PPVT-III – Child Pretest Standard Score N/A 73.5 (mean) 73.4 (mean)
Note: The number of cases with child direct assessment data is smaller than the number with parent interview data. There were 163 children with pretest and posttest PPVT-III data, and 141 children with pretest, posttest, and follow-up PPVT-III data. Table reads: 20.26% of the families randomized in the EDS had a high school diploma at the time of enrollment.
Section 3: Description of the Evaluation
23
TABLE 3.5 STATISTICAL POWER ANALYSIS FOR THE EDS FOLLOW-UP
EFFECT
SIZE
PPVT (CHILD)
(N=97/44)
WJ-R (CHILD)
(N=96/45)
STORY & PC (CHILD)
(N=123/55)
WJ-R (ADULT)
(N=149/65)
PARENT REPORT (CHILD)
(N=207/91) .80sd
(large) .99 .99 .99 .99 .99
.50sd (medium)
.86 .87 .92 .96 .99
.40sd (medium)
.71 .71 .79 .85 .94
.30sd (small)
.50 .50 .58 .64 .77
.20sd (small)
.29 .29 .34 .38 .48
Note: Assumes one-tail test (Even Start does better than control). The sample sizes reported here have longitudinal data (pretest, posttest and follow-up) for each measure. Table reads: If Even Start children gain .80 standard deviations more than control children on the PPVT between pretest and follow-up, then there is a 99% chance that the EDS sample will allow us to conclude that difference is statistically significant.
Section 3: Description of the Evaluation
24
TABLE 3.6
CHILD OUTCOME MEASURES OUTCOME MEASURE CHILD AGE ANALYSIS VARIABLE(S)
Peabody Picture Vocabulary Test
2.5 years and older
Standard score (mean = 100, sd = 15)
Woodcock-Johnson (Revised) Letter-word identification Dictation Applied problems Incomplete words Sound blending Early development skills
2.5 years and older 2.5 years and older 2.5 years and older 2.5 years and older 4.0 years and older 2.5 years and older
W score (mean of 500 for 5th graders) W score (mean of 500 for 5th graders) W score (mean of 500 for 5th graders) W score (mean of 500 for 5th graders) W score (mean of 500 for 5th graders) W score (average of LWI, DIC, APP)
Story & Print Concepts
2.5 years and older
Total score, range is 0-11
Social Skills Rating System Problem behaviors Social skills Problem behaviors Social skills
Preschool Preschool Elementary Elementary
Standard score (mean = 100, sd = 15) Standard score (mean = 100, sd = 15) Standard score (mean = 100, sd = 15) Standard score (mean = 100, sd = 15)
Vineland Communication Domain Teacher rating Parent rating
2.5 years and older 2.5 years and older
Standard score (mean = 100, sd = 15) Standard score (mean = 100, sd = 15)
Parent Report of Child Literacy Child knows alphabet Child counts to 100 or more Child knows colors Extent to which child reads Extent to which child reads Age appropriate writing skills Child knows print concepts
All children All children All children 2.5 years and younger 2.6 years and older All children All children
Values are 0-1 (no/yes) Values are 0-1 (no/yes) Values are 0-1 (no/yes) Values are 0-4 (high = more reading) Values are 0-9 (high = more reading) Values are 0-2 (high = better writing) Values are 0-9 (high = better knowledge)
School Records Attendance Absences Tardiness Special education Attendance Absences Tardiness Special education
Preschool Preschool Preschool Preschool Elementary Elementary Elementary Elementary
% days attended % days absent tardy any days (no/yes) special ed referral or IEP (no/yes) % days attended % days absent tardy any days (no/yes) special ed referral or IEP (no/yes)
Table reads: The Peabody Picture Vocabulary Test was administered to children 2.5 years of age and older.
Section 3: Description of the Evaluation
25
TABLE 3.7
PARENT AND FAMILY OUTCOME MEASURES OUTCOME MEASURE ANALYSIS VARIABLE(S)
Woodcock-Johnson (Revised) Letter-word identification Passage comprehension Word attack Reading vocabulary Reading comprehension Reading skills
W score (mean of 500 for 5th graders) W score (mean of 500 for 5th graders) W score (mean of 500 for 5th graders) W score (mean of 500 for 5th graders) W score (average of PC, RV) W score (average of LWI, WA)
Economic Self-Sufficiency Parent years of education (ESPIRS items) Parent GED (ESPIRS items) Parent employment (ESPIRS items) Annual household income (ESPIRS items)
Values are 1-18 (years of education) Values are 0-1 (no/yes to HS diploma or GED) Values are 0-1 (no/yes to employed) Values are 1-8 (categorized income)
Parent report of literacy at home Variety of parent reading at home Variety of parent writing at home
Values are 0-12 (high = more reading at home) Values are 0-11 (high = more writing at home)
Parent-child reading Read to child daily Amount of reading to/with child Variety of reading to/with child Quality of reading to/with child
Values are 0-1 (no/yes) Values are 0-3 (high = more reading) Values are 0-5 (high = more variety in reading) Values are 0-5 (high = better reading practices)
Literacy resources at home Number of books child has Variety of non-print resources at home Variety of print resources at home
Values are 0-5 (high = more books) Values are 0-16 (high = more non-print resources) Values are 0-5 (high = more print resources)
Parent support of child’s school Parent participation in school activities Parent opinion about school
Values are 0-12 (high = more participation) Values are 0-14 (high = better opinion)
Notes: For this evaluation, raw scores were converted to W scores, which are a transformation of the Rasch ability scale. W scores are equal-interval scores, centered on a value of 500, which is the approximate average performance of beginning 5th grade students. Table reads: The Woodcock-Johnson letter-word identification subtest was administered to parents; the analysis variable was a W score.
Section 3: Description of the Evaluation
26
TABLE 3.8
PERCENT OF EVEN START AND CONTROL GROUP FAMILIES IN THE EDS, BY TYPE OF SOCIAL AND EDUCATIONAL SERVICE RECEIVED BETWEEN PRETEST, POSTTEST, AND FOLLOW-UP
(BASED ON PARENT REPORT) PERCENT OF
EVEN START FAMILIES (N=215)
PERCENT OF CONTROL FAMILIES
(N=102)
SERVICE PRETEST TO POSTTEST
POSTTEST TO FOLLOW-UP
PRETEST TO POSTTEST
POSTTEST TO FOLLOW-UP
1. Fed/state cash assist. (e.g., TANF) 24% 18% 21% 18% 2. Employment training (e.g., JOBS) 4% 3% 5% 5% 3. Vocational education 3% 1% 3% 0% 4. Vocational rehabilitation 1% 0% 0% 0% 5. Parenting education classes 28%** 17% 17% 20% 6. Beginning ABE (grades 0-4) 5%** 4% 0% 1% 7. Intermediate ABE (grades 5-8) 1% 2% 0% 2% 8. Adult secondary educ (grades 9-12) 4% 5% 2% 3% 9. GED preparation 27%** 21% 16% 18% 10. English-as-a-second language 40%*** 28% 14% 21% 11. Even Start 55%*** 33%** 14% 22% 12. Head Start 8% 13% 5% 11% 13. Title I preschool 19% 13% 15% 13% 14. Early intervention special educ 2% 4% 3% 3% 15. Other preschool 7% 7% 5% 5% 16. Kindergarten 12% 24% 16% 27% 17. Primary school (grades 1-3) 5% 13% 5% 13% Any adult education (6 or 7 or 8 or 9 or 10 above)
59%*** 40% 29% 32%
Any early childhood education (11 or 12 or 13 or 14 or 15 above)
72%*** 57%** 32% 44%
Note: (1) Percentages are based on parent report of services received. (2) Average age of children was 3.2 years at pretest, 4.0 years at posttest and 4.9 years at follow-up. (3) ** ES/C difference, p<.05. *** ES/C difference, p<.01. (4) While some control group parents reported that they participated in Even Start between pretest and posttest, no Even Start project submitted participation data on any control family for that time period. Thus, there is no confirmation that any control group families actually participated in Even Start between pretest and posttest. Table reads: In the EDS, 28% of Even Start parents reported that they participated in parenting education classes between pretest and posttest.
Section 3: Description of the Evaluation
27
TABLE 3.9
CLASSROOM ACTIVITIES FOR CHILDREN AT LEAST AGE THREE WHO WERE IN A CENTER-BASED PRESCHOOL OR KINDERGARTEN CLASSROOM AT THE TIME OF FOLLOW-UP
DATA COLLECTION, BY EVEN START AND CONTROL GROUP STATUS PERCENT OF CHILDREN FOR WHOM THE ACTIVITY WAS OFFERED DAILY OR ALMOST DAILY AT THE FOLLOW-
UP MEASUREMENT POINT EXPERIMENTAL DESIGN STUDY
CLASSROOM ACTIVITIES EVEN START (N=112)
CONTROL (N=53)
HEAD START Number concepts or counting 96% 92% 92% Letters of the alphabet or words 92% 94% 69% Block building or other construction work 78% 77% 97% Visual arts (drawing, painting, play dough, etc) 79% 89% 96% Reading stories 98% 100% 96% Free play including dress up, make believe, etc 71% 74% 96% Performing arts (music, movement, dance, etc) 67% 77% 92% Solving puzzles, playing with geometric forms 77%* 64% 95% Naming colors 87%* 75% 89% Outdoor physical activities 71% 81% 93% Indoor physical activities 46% 49% 90% Health, hygiene or nutrition 57% 53% 93% Science or nature 47% 36% 83% Computer time 38% 42% NA Trips to local library 3% 0% NA Note: EDS data are based on follow-up teacher reports for preschool children in the 18 EDS projects. Head Start data are from U.S. Department of Health and Human Services (2001b, p18). NA = data not reported for Head Start. ES/C difference: * p<.10, ** p<.05, *** p<.001. Table reads: In the EDS, 96% of Even Start children in center-based classrooms were exposed to number concepts or counting on a daily or almost daily basis at the follow-up measurement point.
Section 3: Description of the Evaluation
28
0%
20%
40%
60%
80%
100%
0 4 8 12 16 20Months Enrolled in Even Start
Perc
ent o
f Fam
ilies
Figure 3.2: Percent of Even Start Families that Made it Through the Period of Preparation and Were Enrolled for At Least "N" Months
Figure reads: 48% of Even Start families in the EDS that made it through the period of preparation were enrolled for 10 months or less; the other 52% were enrolled in Even Start for more than 10 months.Note: This figure is based on 120 Even Start families that enrolled in Fall 1999 and had the opportunity to participate for up to 24 months.
100
80
60
40
20
0
Section 4: Evaluation Findings
29
SECTION 4: EVALUATION FINDINGS
This section presents findings about the effectiveness of Even Start at enhancing child and parent literacy skills, based on a comparison of pretest data with follow-up data collected about 18 months later from families in the 18 EDS projects. Tables 4.1, 4.2, and 4.3 summarize the analytic results. In addition, Appendix B to this report contains graphical displays of Even Start and control group means for all outcome measures at pretest, posttest and follow-up. COMPARISON OF FOLLOW-UP DATA WITH PRETEST DATA SHOWED THAT EVEN START CHILDREN AND PARENTS GAINED THE SAME AMOUNT, BUT NOT MORE, THAN CONTROL CHILDREN AND PARENTS Similar to the findings documented in St.Pierre, Ricciuti, Tao, et al (2003), data collected from Even Start families in the EDS at follow-up showed that children and parents made gains on many different literacy measures. However, follow-up data collected from control group families showed that they performed as well as Even Start children and their parents. Follow-up data showed that children and parents in the control group made the same kinds of gains on literacy assessments, on parent reports of child literacy, on parent-child reading, on literacy resources at home, on family economic self sufficiency, and so on, that were seen for Even Start families. Thus, the Even Start projects included in this evaluation did not have any discernable impact on the language and literacy skills of children and parents that participated in the study. As with the pretest-posttest analyses of EDS data reported by St.Pierre, Ricciuti, Tao, et al (2003), Even Start vs. control group follow-up differences were analyzed for almost 50 different outcome measures, and so we expected to observe some significant differences simply by chance. Four significant differences were found when comparing follow-up data to pretest data. These differences are not on the same measures for which we found significant differences in the pretest-posttest analyses. Further, three of the four significant differences would disappear if a less liberal significance criterion had been used (we used p<.10 for this study, to be sure that we identified all possible Even Start impacts). Because of the large number of outcomes assessed, because of inconsistency over time in the outcomes on which significant differences were found, and because of the liberal significance level used for these analyses (p<.10), we do not assign much meaning to the few significant differences that were observed, both when comparing pretest to posttest data and when comparing pretest to follow-up data. Measures on Which Even Start and the Control Group Were No Different. No significant difference between the pretest and follow-up scores of Even Start and control group participants was found on 44 of the 48 outcome measures used in this evaluation. These include all 13 direct child outcomes (PPVT, WJR-Letter Word Identification, WJR-Dictation, WJR-Applied Problems, WJR-Incomplete Words, WJR-Sound Blending, WJR-Early Development Cluster, Story & Print Concepts, SSRS-Social Skills in Preschool, SSRS-Social Skills in
Section 4: Evaluation Findings
30
Elementary School, SSRS-Problem Behaviors in Preschool, SSRS-Problem Behaviors in Elementary School, Vineland Communication Domain), the eight outcomes derived from school records (percent days attended in preschool, percent days absent in preschool, percent children ever tardy in preschool, percent children in special education in preschool, percent days attended in elementary school, percent days absent in elementary school, percent children ever tardy in elementary school, percent children in special education in elementary school), five of seven parent reports of child literacy (percent of children who know the alphabet, percent of children who know colors, percent of children who can count to 100, extent to which children under 2 years, 6 months read, extent to which child knows print concepts), seven of nine direct parent outcomes (WJR-Letter Word ID, WJR-Passage Comprehension, WJR-Reading Vocabulary, WJR-Reading Comprehension, WJR-Basic Reading Skills, percent of employed parents, annual household income), both parent reports of parent literacy at home (variety of parent reading, variety of parent writing), the four parent reports of parent-child reading (percent of parents who read to child daily, amount of reading to child, variety of reading to child, quality of reading to child), the three parent reports of literacy resources at home (number of books child has, variety of non-print resources, variety of print resources), and the two parent reports of parent support of the child’s school (parent participation in school and parent opinion about school).
Measures on Which Even Start Did Better Than The Control Group. Comparing pretest data to follow-up data, there were two parent-report measures on which Even Start children gained more than control children. Parents of Even Start children reported larger gains than parents of control children on the extent to which their children read and on the extent to which their children exhibited age-appropriate writing activities than did parents of control children. The scale measuring extent to which children read has values from 0 to 9. The value of the scale increases by 1 if the child pretends to read, reads for enjoyment, has memorized a book, has a favorite book, can follow written directions, can describe something learned through reading, rereads sentences, reads or pretends to read to someone else, or recognizes own first name in writing/print. The scale measuring age-appropriate writing skills has values from 0 to 2. The value of this scale increases by 1 if the child pretends to write or writes some letters of the alphabet.
The Even Start vs. control group differences on these two variables were deemed statistically significant only by using a liberal significance criterion (p<.10) and did not translate into educationally large differences. At follow-up, Even Start children scored 6.07 on the parent-report scale measuring extent of reading, while control group children scored 6.10 (scale ranges from 0 to 9, sd = 2.22). At follow-up, Even Start children scored 1.53 on the parent-report measure of age-appropriate writing activities, while control group children scored 1.48 (scale ranges from 0-2, sd = 0.66).
At the follow-up, there were two measures on which Even Start parents gained more than control parents: the Woodcock-Johnson Word Attack subscale and attainment of a GED. On the Word Attack subscale, Even Start adults gained an average of 6.38 points between pretest and follow-up, while control adults gained an average of 2.50 points, which corresponds to an effect size of about .29 standard deviations (p<.10). Word Attack measures a parent’s skill in applying phonic and structural analysis skills to the pronunciation of unfamiliar printed words. The parent reads aloud letter combinations that are linguistically logical but that form nonsense words or
Section 4: Evaluation Findings
31
low-frequency words in English. In addition, more Even Start than control group adults attained a GED between pretest and follow-up (9.9% vs. 2.5%, respectively, of those who reported not having a high school diploma or GED at pretest).3 This is the only finding that is statistically significant at a traditional level (p<.05), and is consistent with previous Even Start research showing that the program has a positive effect on GED attainment (St.Pierre, Swartz, Gamse, Murray, Deck & Nickel, 1995).
Changes in Findings From the Pre-Post Analyses. When assessing the evaluation findings based on analyses of pretest vs. follow-up data we see that the only significant effect observed in analyses of pretest vs. posttest data (St.Pierre, Ricciuti, Tao, et al, 2003) is not replicated in the follow-up results. At the first posttest (in elementary school but not in preschool), Even Start children were rated (using the Social Skills Rating System) by their teachers as exhibiting significantly fewer problem behaviors than control group children. At the follow-up, this difference was no longer significant. It is difficult to interpret changes in teacher ratings from the first posttest to the follow-up since children were in different classrooms and were probably rated by different teachers. Further, additional children became old enough to enter preschool, and to have the opportunity to be rated. EVEN START CHILDREN AND PARENTS MADE GAINS BETWEEN PRETEST AND FOLLOW-UP As was seen by comparing pretest to posttest outcomes, Even Start children and parents improved their literacy levels between the pretest and follow-up measurements (Table 4.3). On standardized direct assessments (PPVT, Woodcock-Johnson subtests), children gained between 0.50 and almost 2.0 standard deviations between pretest and the follow-up, depending on the measure. Parent reports of children’s literacy skills also showed an increasing level of skill between pretest and follow-up, in areas such as knowing the alphabet, knowledge of colors, counting ability, extent to which children engage in reading and writing activities, and understand print concepts. Parents also gained over time in their literacy skills, showing significant gains on each of the Woodcock Johnson subtests, and in the variety of the kinds of items they read and write. In addition, more parents attained a GED by the follow-up. Parents’ reports of the quality of their reading activities with their children improved, as did the number and variety of resources parents report providing to their children, and their reported participation in activities at their children’s schools.
With the exceptions noted in the section above, these gains were not greater than those shown by control group children and parents. Hence, in spite of the gains made by children and adults, Even Start did not have a significant impact on these language and literacy skills. Of interest is the fact that between pretest and posttest, the average Even Start child and the average control group child gained about 4.0 standard score points on the PPVT. This is comparable to the average gain of 4.2 standard score points on the PPVT for children who spent a year in Head Start, as reported by Zill, Resnick & O’Donnell (2001) who analyzed data from
3 For this analysis, cases were deleted when the reported GED status was impossible (i.e., if the parent reported having a GED at pretest but not at posttest). This represented 12.8% of controls and 12.2% of Even Start parents.
Section 4: Evaluation Findings
32
the Head Start FACES study (Figure 4.1). This suggests that the observed gains are probably due to some combination of normal development and the effect of being in Even Start, being in Head Start, or, for the control group, being in a mix of preschool interventions. EVEN START CHILDREN AND PARENTS STILL SCORED LOW COMPARED TO NATIONAL NORMS At follow-up, Even Start children and parents scored low relative to national norms. Children scored on average at the 9th percentile on the PPVT-III, at the 25th percentile on the WJR Letter-Word Identification, at the 27th percentile on the WJR Applied Problems subscale, at the 16th percentile on the WJR Dictation subscale, at the 12th percentile on the WJR Incomplete Words subscale, at the 10th percentile on the WJR Sound Blending subscale, and at the 16th percentile on the WJR Early Development Skills scale. Adults also scored low at follow-up, relative to national norms. They scored on average at the 5th percentile on WJR Letter-Word Identification, at the 1st percentile on WJR Passage Comprehension and Reading Comprehension, at the 9th percentile for WJR Basic Reading Skills, at the 1st percentile for WJR Reading Vocabulary, and at the 16th percentile for WJR Word Attack. DOES AMOUNT OF PARTICIPATION MAKE A DIFFERENCE? The EDS is a randomized experiment, and if we examine gains for subgroups that participate a lot or a little, we lose the advantages offered by randomization and open up the findings to competing interpretations. Although cautious about the potential pitfalls of this approach, the previous report from this evaluation (St.Pierre et al, 2003) included analyses of the relationship between amount of participation and outcomes for Even Start children and parents based on pretest and posttest outcome data. Findings from those previous analyses are summarized below (these analyses were not replicated with the follow-up data).
One analysis eliminated all Even Start children whose parents reported that they did not receive early childhood services, as well as all control group children whose parents reported that they did receive early childhood services. The data showed that segmenting the sample in this fashion did not change the evaluation findings.
A second analysis investigated the relationship between child and parent literacy outcomes and a host of variables including monthly hours of child participation in early childhood education, monthly hours of parent participation in adult education and parenting education, and family background factors. We found (1) no relationship between the amount that parents participated in adult education and their scores on literacy outcomes; (2) children who participated more intensively in early childhood education scored higher on literacy outcomes; (3) parents who participated more intensively in parenting education had children who score higher on literacy outcomes; and (4) more intensive participation in adult education is associated with lower scores on some child outcomes. It is important to remember that amount of participation was not manipulated experimentally, and so factors other than participation in Even Start may be responsible for the observed relationships.
Section 4: Evaluation Findings
33
LIMITATIONS AND CONCLUSIONS
The EDS used a random assignment design, the strongest approach for estimating program impacts. However, projects volunteered for this study instead of being randomly selected, so we cannot generalize to the Even Start population on a strict statistical basis. EDS families are more likely than the population of Even Start families to be Hispanic, and EDS projects are more likely than the population of Even Start projects to be in urban areas. Thus, findings from the EDS are most relevant to urban projects that serve large numbers of Hispanic/ESL families. In addition, to be included in the analysis for this study children and parents were required to have a complete set of data for a given outcome variable (i.e., data at pretest, posttest, and follow-up) with all direct assessments administered in English. This limits generalizability to families that are relatively stable over a two-year period as well as children and parents who were comfortable enough with English to be assessed in that language.
As was the case at posttest, Even Start children and parents made gains on a variety of literacy assessments and other measures at follow-up, but they did not gain more than children and parents in the control group. It had been hypothesized that follow-up data might show positive effects because (1) Even Start families had the opportunity to participate for a second school year, and (2) change in some outcomes might require more time than others. However, the follow-up data do not support either of these hypotheses. Several reasons have been advanced for the lack of documented effectiveness of Even Start family literacy projects (St.Pierre, et al, 2003). Some of these include that instructional services may not be sufficiently intensive, the quality of instructional services may be insufficient, and that families do not participate enough.
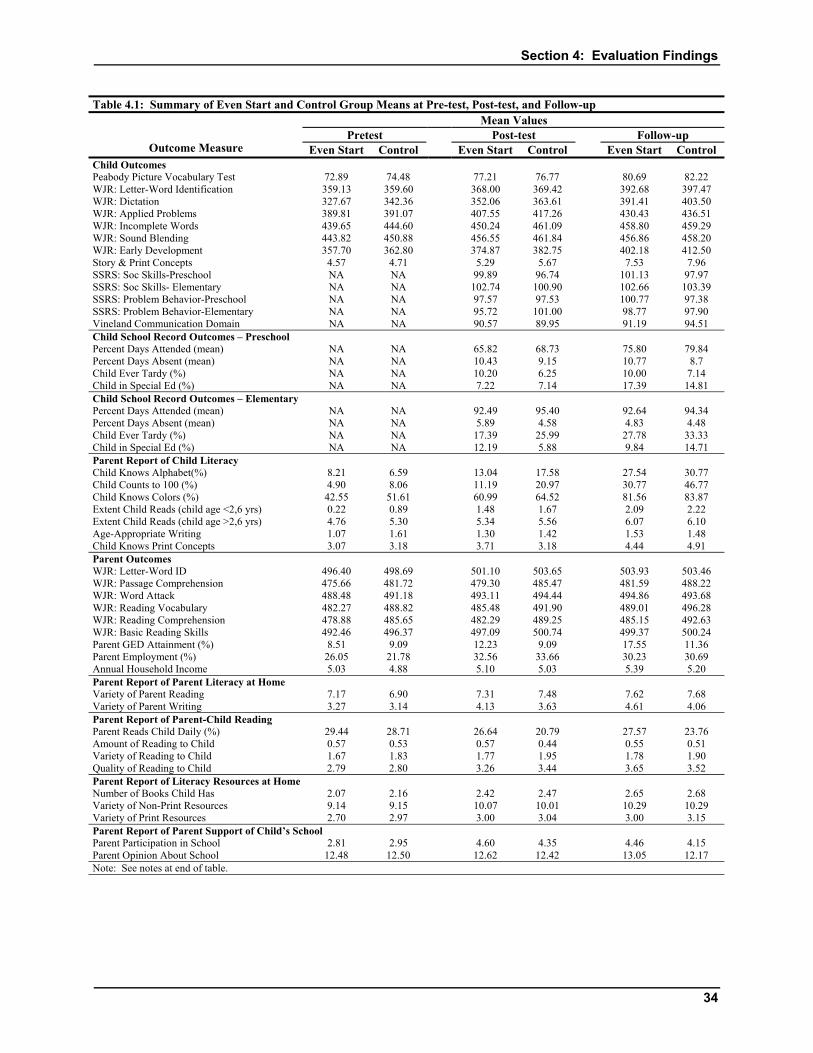
Section 4: Evaluation Findings
34
Table 4.1: Summary of Even Start and Control Group Means at Pre-test, Post-test, and Follow-up Mean Values
Pretest Post-test Follow-up
Outcome Measure Even Start Control Even Start Control Even Start Control Child Outcomes Peabody Picture Vocabulary Test 72.89 74.48 77.21 76.77 80.69 82.22 WJR: Letter-Word Identification 359.13 359.60 368.00 369.42 392.68 397.47 WJR: Dictation 327.67 342.36 352.06 363.61 391.41 403.50 WJR: Applied Problems 389.81 391.07 407.55 417.26 430.43 436.51 WJR: Incomplete Words 439.65 444.60 450.24 461.09 458.80 459.29 WJR: Sound Blending 443.82 450.88 456.55 461.84 456.86 458.20 WJR: Early Development 357.70 362.80 374.87 382.75 402.18 412.50 Story & Print Concepts 4.57 4.71 5.29 5.67 7.53 7.96 SSRS: Soc Skills-Preschool NA NA 99.89 96.74 101.13 97.97 SSRS: Soc Skills- Elementary NA NA 102.74 100.90 102.66 103.39 SSRS: Problem Behavior-Preschool NA NA 97.57 97.53 100.77 97.38 SSRS: Problem Behavior-Elementary NA NA 95.72 101.00 98.77 97.90 Vineland Communication Domain NA NA 90.57 89.95 91.19 94.51 Child School Record Outcomes – Preschool Percent Days Attended (mean) NA NA 65.82 68.73 75.80 79.84 Percent Days Absent (mean) NA NA 10.43 9.15 10.77 8.7 Child Ever Tardy (%) NA NA 10.20 6.25 10.00 7.14 Child in Special Ed (%) NA NA 7.22 7.14 17.39 14.81 Child School Record Outcomes – Elementary Percent Days Attended (mean) NA NA 92.49 95.40 92.64 94.34 Percent Days Absent (mean) NA NA 5.89 4.58 4.83 4.48 Child Ever Tardy (%) NA NA 17.39 25.99 27.78 33.33 Child in Special Ed (%) NA NA 12.19 5.88 9.84 14.71 Parent Report of Child Literacy Child Knows Alphabet(%) 8.21 6.59 13.04 17.58 27.54 30.77 Child Counts to 100 (%) 4.90 8.06 11.19 20.97 30.77 46.77 Child Knows Colors (%) 42.55 51.61 60.99 64.52 81.56 83.87 Extent Child Reads (child age <2,6 yrs) 0.22 0.89 1.48 1.67 2.09 2.22 Extent Child Reads (child age >2,6 yrs) 4.76 5.30 5.34 5.56 6.07 6.10 Age-Appropriate Writing 1.07 1.61 1.30 1.42 1.53 1.48 Child Knows Print Concepts 3.07 3.18 3.71 3.18 4.44 4.91 Parent Outcomes WJR: Letter-Word ID 496.40 498.69 501.10 503.65 503.93 503.46 WJR: Passage Comprehension 475.66 481.72 479.30 485.47 481.59 488.22 WJR: Word Attack 488.48 491.18 493.11 494.44 494.86 493.68 WJR: Reading Vocabulary 482.27 488.82 485.48 491.90 489.01 496.28 WJR: Reading Comprehension 478.88 485.65 482.29 489.25 485.15 492.63 WJR: Basic Reading Skills 492.46 496.37 497.09 500.74 499.37 500.24 Parent GED Attainment (%) 8.51 9.09 12.23 9.09 17.55 11.36 Parent Employment (%) 26.05 21.78 32.56 33.66 30.23 30.69 Annual Household Income 5.03 4.88 5.10 5.03 5.39 5.20 Parent Report of Parent Literacy at Home Variety of Parent Reading 7.17 6.90 7.31 7.48 7.62 7.68 Variety of Parent Writing 3.27 3.14 4.13 3.63 4.61 4.06 Parent Report of Parent-Child Reading Parent Reads Child Daily (%) 29.44 28.71 26.64 20.79 27.57 23.76 Amount of Reading to Child 0.57 0.53 0.57 0.44 0.55 0.51 Variety of Reading to Child 1.67 1.83 1.77 1.95 1.78 1.90 Quality of Reading to Child 2.79 2.80 3.26 3.44 3.65 3.52 Parent Report of Literacy Resources at Home Number of Books Child Has 2.07 2.16 2.42 2.47 2.65 2.68 Variety of Non-Print Resources 9.14 9.15 10.07 10.01 10.29 10.29 Variety of Print Resources 2.70 2.97 3.00 3.04 3.00 3.15 Parent Report of Parent Support of Child’s School Parent Participation in School 2.81 2.95 4.60 4.35 4.46 4.15 Parent Opinion About School 12.48 12.50 12.62 12.42 13.05 12.17 Note: See notes at end of table.
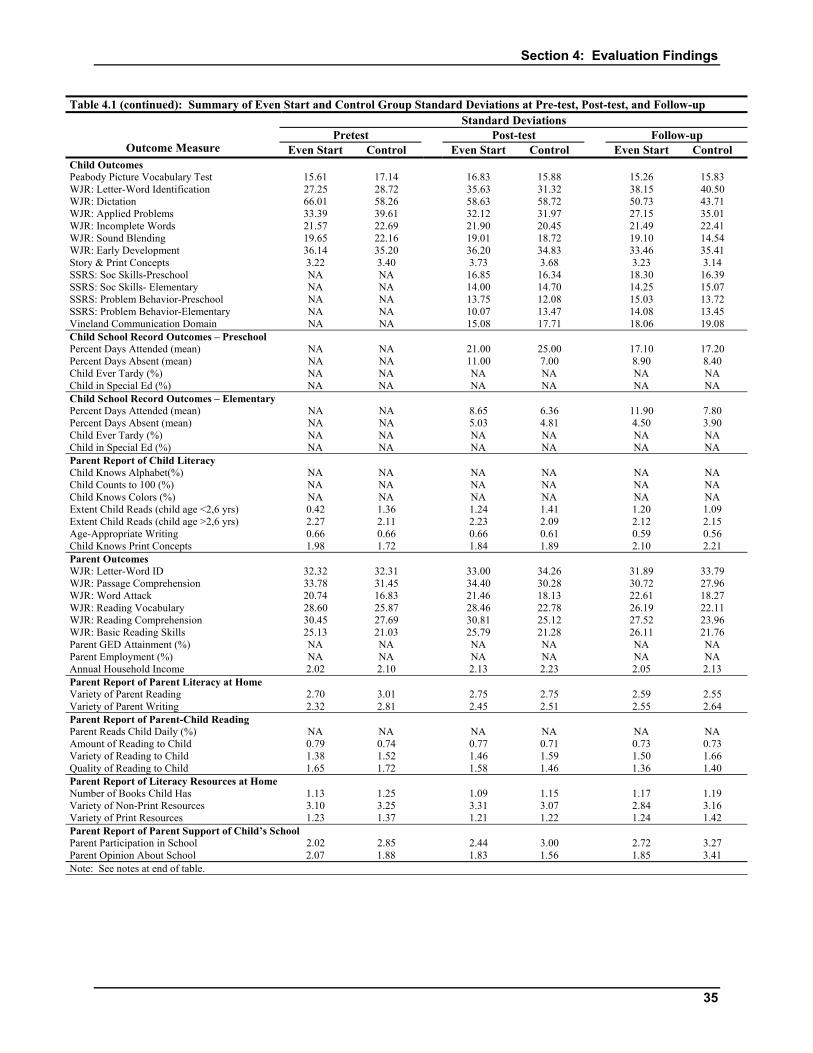
Section 4: Evaluation Findings
35
Table 4.1 (continued): Summary of Even Start and Control Group Standard Deviations at Pre-test, Post-test, and Follow-up Standard Deviations
Pretest Post-test Follow-up
Outcome Measure Even Start Control Even Start Control Even Start Control Child Outcomes Peabody Picture Vocabulary Test 15.61 17.14 16.83 15.88 15.26 15.83 WJR: Letter-Word Identification 27.25 28.72 35.63 31.32 38.15 40.50 WJR: Dictation 66.01 58.26 58.63 58.72 50.73 43.71 WJR: Applied Problems 33.39 39.61 32.12 31.97 27.15 35.01 WJR: Incomplete Words 21.57 22.69 21.90 20.45 21.49 22.41 WJR: Sound Blending 19.65 22.16 19.01 18.72 19.10 14.54 WJR: Early Development 36.14 35.20 36.20 34.83 33.46 35.41 Story & Print Concepts 3.22 3.40 3.73 3.68 3.23 3.14 SSRS: Soc Skills-Preschool NA NA 16.85 16.34 18.30 16.39 SSRS: Soc Skills- Elementary NA NA 14.00 14.70 14.25 15.07 SSRS: Problem Behavior-Preschool NA NA 13.75 12.08 15.03 13.72 SSRS: Problem Behavior-Elementary NA NA 10.07 13.47 14.08 13.45 Vineland Communication Domain NA NA 15.08 17.71 18.06 19.08 Child School Record Outcomes – Preschool Percent Days Attended (mean) NA NA 21.00 25.00 17.10 17.20 Percent Days Absent (mean) NA NA 11.00 7.00 8.90 8.40 Child Ever Tardy (%) NA NA NA NA NA NA Child in Special Ed (%) NA NA NA NA NA NA Child School Record Outcomes – Elementary Percent Days Attended (mean) NA NA 8.65 6.36 11.90 7.80 Percent Days Absent (mean) NA NA 5.03 4.81 4.50 3.90 Child Ever Tardy (%) NA NA NA NA NA NA Child in Special Ed (%) NA NA NA NA NA NA Parent Report of Child Literacy Child Knows Alphabet(%) NA NA NA NA NA NA Child Counts to 100 (%) NA NA NA NA NA NA Child Knows Colors (%) NA NA NA NA NA NA Extent Child Reads (child age <2,6 yrs) 0.42 1.36 1.24 1.41 1.20 1.09 Extent Child Reads (child age >2,6 yrs) 2.27 2.11 2.23 2.09 2.12 2.15 Age-Appropriate Writing 0.66 0.66 0.66 0.61 0.59 0.56 Child Knows Print Concepts 1.98 1.72 1.84 1.89 2.10 2.21 Parent Outcomes WJR: Letter-Word ID 32.32 32.31 33.00 34.26 31.89 33.79 WJR: Passage Comprehension 33.78 31.45 34.40 30.28 30.72 27.96 WJR: Word Attack 20.74 16.83 21.46 18.13 22.61 18.27 WJR: Reading Vocabulary 28.60 25.87 28.46 22.78 26.19 22.11 WJR: Reading Comprehension 30.45 27.69 30.81 25.12 27.52 23.96 WJR: Basic Reading Skills 25.13 21.03 25.79 21.28 26.11 21.76 Parent GED Attainment (%) NA NA NA NA NA NA Parent Employment (%) NA NA NA NA NA NA Annual Household Income 2.02 2.10 2.13 2.23 2.05 2.13 Parent Report of Parent Literacy at Home Variety of Parent Reading 2.70 3.01 2.75 2.75 2.59 2.55 Variety of Parent Writing 2.32 2.81 2.45 2.51 2.55 2.64 Parent Report of Parent-Child Reading Parent Reads Child Daily (%) NA NA NA NA NA NA Amount of Reading to Child 0.79 0.74 0.77 0.71 0.73 0.73 Variety of Reading to Child 1.38 1.52 1.46 1.59 1.50 1.66 Quality of Reading to Child 1.65 1.72 1.58 1.46 1.36 1.40 Parent Report of Literacy Resources at Home Number of Books Child Has 1.13 1.25 1.09 1.15 1.17 1.19 Variety of Non-Print Resources 3.10 3.25 3.31 3.07 2.84 3.16 Variety of Print Resources 1.23 1.37 1.21 1.22 1.24 1.42 Parent Report of Parent Support of Child’s School Parent Participation in School 2.02 2.85 2.44 3.00 2.72 3.27 Parent Opinion About School 2.07 1.88 1.83 1.56 1.85 3.41 Note: See notes at end of table.
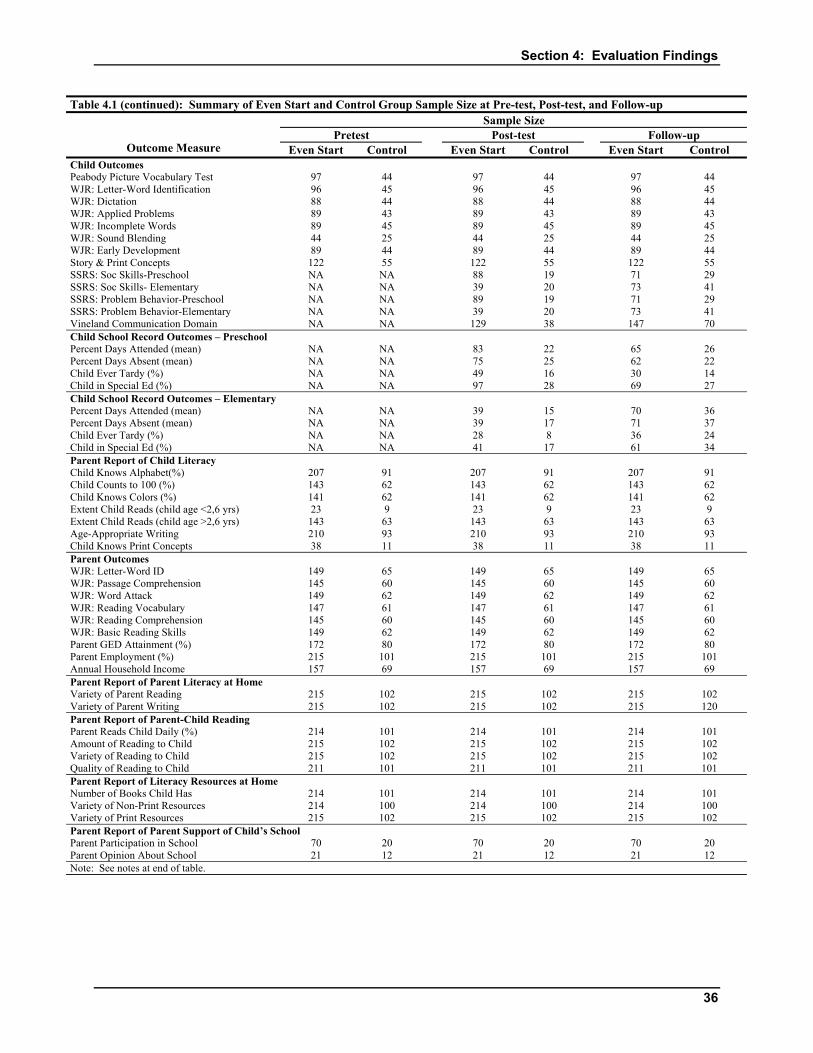
Section 4: Evaluation Findings
36
Table 4.1 (continued): Summary of Even Start and Control Group Sample Size at Pre-test, Post-test, and Follow-up Sample Size
Pretest Post-test Follow-up
Outcome Measure Even Start Control Even Start Control Even Start Control Child Outcomes Peabody Picture Vocabulary Test 97 44 97 44 97 44 WJR: Letter-Word Identification 96 45 96 45 96 45 WJR: Dictation 88 44 88 44 88 44 WJR: Applied Problems 89 43 89 43 89 43 WJR: Incomplete Words 89 45 89 45 89 45 WJR: Sound Blending 44 25 44 25 44 25 WJR: Early Development 89 44 89 44 89 44 Story & Print Concepts 122 55 122 55 122 55 SSRS: Soc Skills-Preschool NA NA 88 19 71 29 SSRS: Soc Skills- Elementary NA NA 39 20 73 41 SSRS: Problem Behavior-Preschool NA NA 89 19 71 29 SSRS: Problem Behavior-Elementary NA NA 39 20 73 41 Vineland Communication Domain NA NA 129 38 147 70 Child School Record Outcomes – Preschool Percent Days Attended (mean) NA NA 83 22 65 26 Percent Days Absent (mean) NA NA 75 25 62 22 Child Ever Tardy (%) NA NA 49 16 30 14 Child in Special Ed (%) NA NA 97 28 69 27 Child School Record Outcomes – Elementary Percent Days Attended (mean) NA NA 39 15 70 36 Percent Days Absent (mean) NA NA 39 17 71 37 Child Ever Tardy (%) NA NA 28 8 36 24 Child in Special Ed (%) NA NA 41 17 61 34 Parent Report of Child Literacy Child Knows Alphabet(%) 207 91 207 91 207 91 Child Counts to 100 (%) 143 62 143 62 143 62 Child Knows Colors (%) 141 62 141 62 141 62 Extent Child Reads (child age <2,6 yrs) 23 9 23 9 23 9 Extent Child Reads (child age >2,6 yrs) 143 63 143 63 143 63 Age-Appropriate Writing 210 93 210 93 210 93 Child Knows Print Concepts 38 11 38 11 38 11 Parent Outcomes WJR: Letter-Word ID 149 65 149 65 149 65 WJR: Passage Comprehension 145 60 145 60 145 60 WJR: Word Attack 149 62 149 62 149 62 WJR: Reading Vocabulary 147 61 147 61 147 61 WJR: Reading Comprehension 145 60 145 60 145 60 WJR: Basic Reading Skills 149 62 149 62 149 62 Parent GED Attainment (%) 172 80 172 80 172 80 Parent Employment (%) 215 101 215 101 215 101 Annual Household Income 157 69 157 69 157 69 Parent Report of Parent Literacy at Home Variety of Parent Reading 215 102 215 102 215 102 Variety of Parent Writing 215 102 215 102 215 120 Parent Report of Parent-Child Reading Parent Reads Child Daily (%) 214 101 214 101 214 101 Amount of Reading to Child 215 102 215 102 215 102 Variety of Reading to Child 215 102 215 102 215 102 Quality of Reading to Child 211 101 211 101 211 101 Parent Report of Literacy Resources at Home Number of Books Child Has 214 101 214 101 214 101 Variety of Non-Print Resources 214 100 214 100 214 100 Variety of Print Resources 215 102 215 102 215 102 Parent Report of Parent Support of Child’s School Parent Participation in School 70 20 70 20 70 20 Parent Opinion About School 21 12 21 12 21 12 Note: See notes at end of table.
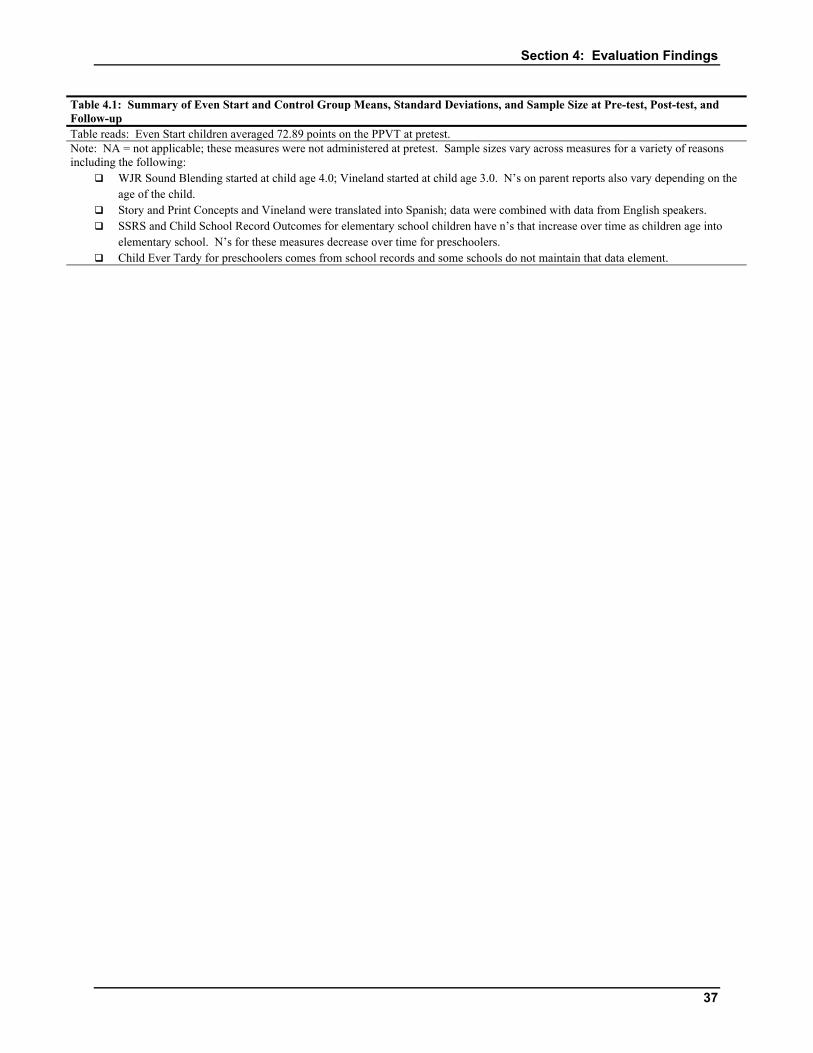
Section 4: Evaluation Findings
37
Table 4.1: Summary of Even Start and Control Group Means, Standard Deviations, and Sample Size at Pre-test, Post-test, and Follow-up Table reads: Even Start children averaged 72.89 points on the PPVT at pretest. Note: NA = not applicable; these measures were not administered at pretest. Sample sizes vary across measures for a variety of reasons including the following:
WJR Sound Blending started at child age 4.0; Vineland started at child age 3.0. N’s on parent reports also vary depending on the age of the child.
Story and Print Concepts and Vineland were translated into Spanish; data were combined with data from English speakers. SSRS and Child School Record Outcomes for elementary school children have n’s that increase over time as children age into
elementary school. N’s for these measures decrease over time for preschoolers. Child Ever Tardy for preschoolers comes from school records and some schools do not maintain that data element.

Section 4: Evaluation Findings
38
TABLE 4.2: SUMMARY OF EDS GAINS AND EFFECT SIZES (PRETEST VS. FOLLOW-UP) GAIN (FOLLOW-UP – PRETEST)
MEASURE EVEN START CONTROL DIFF IN GAIN
(ES-C) STD DEV OF MEASURE
EFFECT SIZE
Child Outcomes PPVT 7.80 7.75 0.05 15.0 .00 WJR: Letter-Word ID 33.55 37.87 -4.31 24.2 -.18 WJR: Dictation 63.74 61.14 2.60 33.5 .08 WJR: Applied Problems 40.62 45.44 -4.82 21.3 -.23 WJR: Incomplete Words 19.15 14.69 4.46 18.9 .24 WJR: Sound Blending 13.05 7.32 5.73 17.2 .33 WJR: Early Development 44.48 49.70 -5.22 22.5 -.23 Story & Print Concepts 2.96 3.25 -0.29 3.2 -.09 SSRS: Soc Skills – Preschool NA NA 3.16 15.0 .21 SSRS: Soc Skills – Elementary NA NA -0.73 15.0 -.05 SSRS: Prob Beh – Preschool NA NA 3.39 15.0 .23 SSRS: Prob Beh – Elementary NA NA 0.87 15.0 .06 Vineland Communication NA NA -3.32 15.0 -.22 School Record Outcomes – Preschool Percent Days Attended (mean) NA NA -4.04 17.08 -.24 Percent Days Absent (mean) NA NA 2.07 8.88 .23 Child Ever Tardy (%) NA NA 2.86 NA 1.44 Child in Special Education (%) NA NA 2.58 NA 1.21 School Record Outcomes – Elementary Percent Days Attended (mean) NA NA -1.70 11.92 -.14 Percent Days Absent (mean) NA NA 0.35 4.48 .08 Child Ever Tardy (%) NA NA -5.55 NA -.77 Child in Special Education (%) NA NA -4.87 NA -.63 Parent Report of Child Literacy Child Knows Alphabet (%) 19.32 24.17 -4.85 NA -.80 Child Counts to 100 (%) 25.87 38.71 -12.84 NA -.51 Child Knows Colors (%) 39.01 32.26 6.75 NA .99 Extent Child Reads (<2,6 yrs) 1.87 1.33 0.54 1.10 .49 Extent Child Reads (>2,6 yrs) 1.31 0.79 0.52 2.22 .23* Age-Appropriate Writing 0.46 0.32 0.13 0.66 .20* Child Knows Print Concepts 1.37 1.73 -0.36 1.93 -.19 Parent Outcomes WJR: Letter-Word ID 7.52 4.77 2.75 21.4 .13 WJR: Passage Comprehension 5.92 6.50 -0.58 16.1 -.04 WJR: Word Attack 6.38 2.50 3.88 13.5 .29* WJR: Reading Vocabulary 6.74 7.46 -0.72 16.3 -.04 WJR: Reading Comprehension 6.28 6.98 -0.71 14.9 -.05 WJR: Basic Reading Skills 6.91 3.87 3.04 15.0 .20 Parent GED Attainment (%) 9.88 2.50 7.38 NA 4.28** Parent Employment (%) 4.18 8.91 -4.73 NA 1.06 Annual Household Income 0.36 0.32 0.04 2.05 .02 Parent Report of Parent Literacy at Home Variety of Parent Reading 0.45 0.77 -0.33 2.73 -.12 Variety of Parent Writing 1.33 0.91 0.42 2.33 .18 Parent Report of Parent-Child Reading Parent Reads Child Daily (%) -1.87 -4.95 3.08 NA 1.23 Amount of Reading to Child -0.02 -0.02 0.00 0.80 .00 Variety of Reading to Child 0.11 0.07 0.04 1.39 .03 Quality of Reading to Child 0.87 0.72 0.14 1.63 .09 Parent Report of Literacy Resources at Home Number of Books Child Has 0.58 0.52 0.05 1.16 .04 Variety of Non-Print Resources 1.15 1.14 0.01 3.11 .00 Variety of Print Resources 0.29 0.18 0.12 1.22 .10 Parent Report of Parent Support of Child’s School Parent Participation in School 1.64 1.20 0.44 1.94 .23 Parent Opinion About School 0.57 -0.33 0.90 2.81 .32 Note: NA = not administered at pretest; effect calculated by comparing follow-up means. Effect for continuous variables calculated as (ES-C)/(sd). WJ-R sd is for children age 4, adults age 30-39, from Examiner’s Manual. PPVT, SSRS, Vineland sd is 15 (norm), for other measures sd is from pretest. Binary variable effect sizes are odds ratios. For binary outcomes measured over time, effect size is adjusted odds ratio, controlling for pretest. * p<.10, ** p<.05, *** p<.01. Table reads: Even Start children gained an average of 7.80 scale score points on the PPVT between pretest and follow-up.
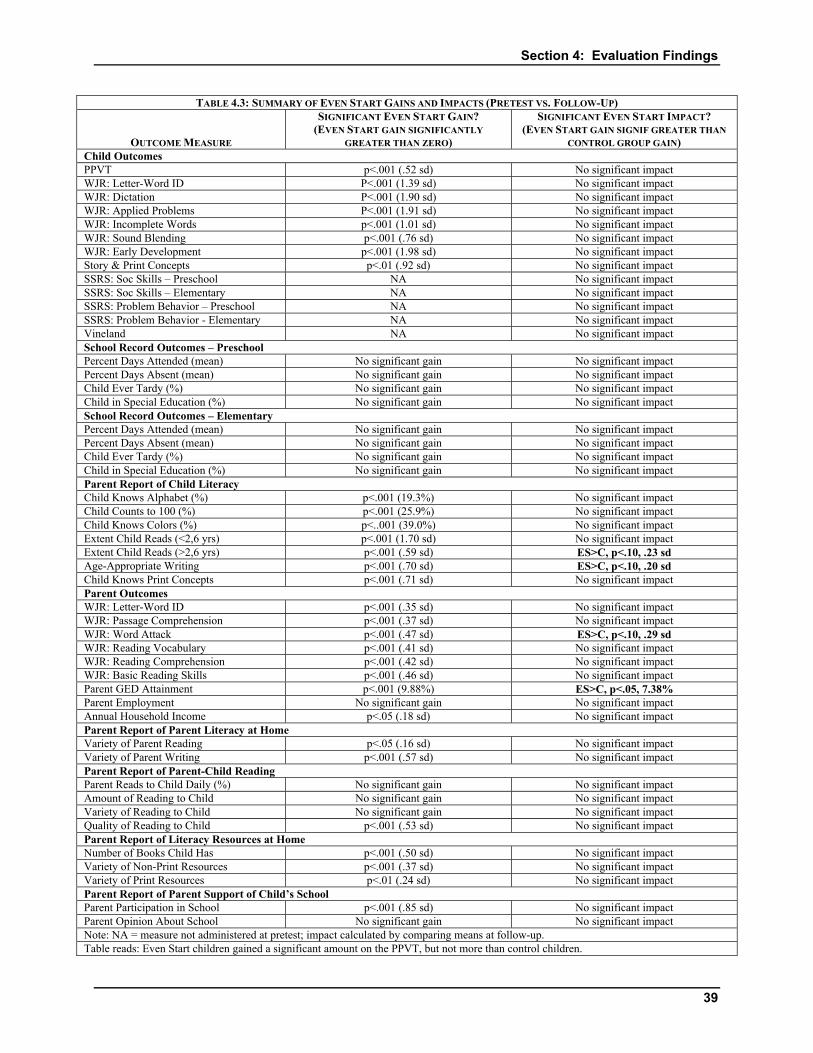
Section 4: Evaluation Findings
39
TABLE 4.3: SUMMARY OF EVEN START GAINS AND IMPACTS (PRETEST VS. FOLLOW-UP)
OUTCOME MEASURE
SIGNIFICANT EVEN START GAIN? (EVEN START GAIN SIGNIFICANTLY
GREATER THAN ZERO)
SIGNIFICANT EVEN START IMPACT? (EVEN START GAIN SIGNIF GREATER THAN
CONTROL GROUP GAIN) Child Outcomes PPVT p<.001 (.52 sd) No significant impact WJR: Letter-Word ID P<.001 (1.39 sd) No significant impact WJR: Dictation P<.001 (1.90 sd) No significant impact WJR: Applied Problems P<.001 (1.91 sd) No significant impact WJR: Incomplete Words p<.001 (1.01 sd) No significant impact WJR: Sound Blending p<.001 (.76 sd) No significant impact WJR: Early Development p<.001 (1.98 sd) No significant impact Story & Print Concepts p<.01 (.92 sd) No significant impact SSRS: Soc Skills – Preschool NA No significant impact SSRS: Soc Skills – Elementary NA No significant impact SSRS: Problem Behavior – Preschool NA No significant impact SSRS: Problem Behavior - Elementary NA No significant impact Vineland NA No significant impact School Record Outcomes – Preschool Percent Days Attended (mean) No significant gain No significant impact Percent Days Absent (mean) No significant gain No significant impact Child Ever Tardy (%) No significant gain No significant impact Child in Special Education (%) No significant gain No significant impact School Record Outcomes – Elementary Percent Days Attended (mean) No significant gain No significant impact Percent Days Absent (mean) No significant gain No significant impact Child Ever Tardy (%) No significant gain No significant impact Child in Special Education (%) No significant gain No significant impact Parent Report of Child Literacy Child Knows Alphabet (%) p<.001 (19.3%) No significant impact Child Counts to 100 (%) p<.001 (25.9%) No significant impact Child Knows Colors (%) p<..001 (39.0%) No significant impact Extent Child Reads (<2,6 yrs) p<.001 (1.70 sd) No significant impact Extent Child Reads (>2,6 yrs) p<.001 (.59 sd) ES>C, p<.10, .23 sd Age-Appropriate Writing p<.001 (.70 sd) ES>C, p<.10, .20 sd Child Knows Print Concepts p<.001 (.71 sd) No significant impact Parent Outcomes WJR: Letter-Word ID p<.001 (.35 sd) No significant impact WJR: Passage Comprehension p<.001 (.37 sd) No significant impact WJR: Word Attack p<.001 (.47 sd) ES>C, p<.10, .29 sd WJR: Reading Vocabulary p<.001 (.41 sd) No significant impact WJR: Reading Comprehension p<.001 (.42 sd) No significant impact WJR: Basic Reading Skills p<.001 (.46 sd) No significant impact Parent GED Attainment p<.001 (9.88%) ES>C, p<.05, 7.38% Parent Employment No significant gain No significant impact Annual Household Income p<.05 (.18 sd) No significant impact Parent Report of Parent Literacy at Home Variety of Parent Reading p<.05 (.16 sd) No significant impact Variety of Parent Writing p<.001 (.57 sd) No significant impact Parent Report of Parent-Child Reading Parent Reads to Child Daily (%) No significant gain No significant impact Amount of Reading to Child No significant gain No significant impact Variety of Reading to Child No significant gain No significant impact Quality of Reading to Child p<.001 (.53 sd) No significant impact Parent Report of Literacy Resources at Home Number of Books Child Has p<.001 (.50 sd) No significant impact Variety of Non-Print Resources p<.001 (.37 sd) No significant impact Variety of Print Resources p<.01 (.24 sd) No significant impact Parent Report of Parent Support of Child’s School Parent Participation in School p<.001 (.85 sd) No significant impact Parent Opinion About School No significant gain No significant impact Note: NA = measure not administered at pretest; impact calculated by comparing means at follow-up. Table reads: Even Start children gained a significant amount on the PPVT, but not more than control children.
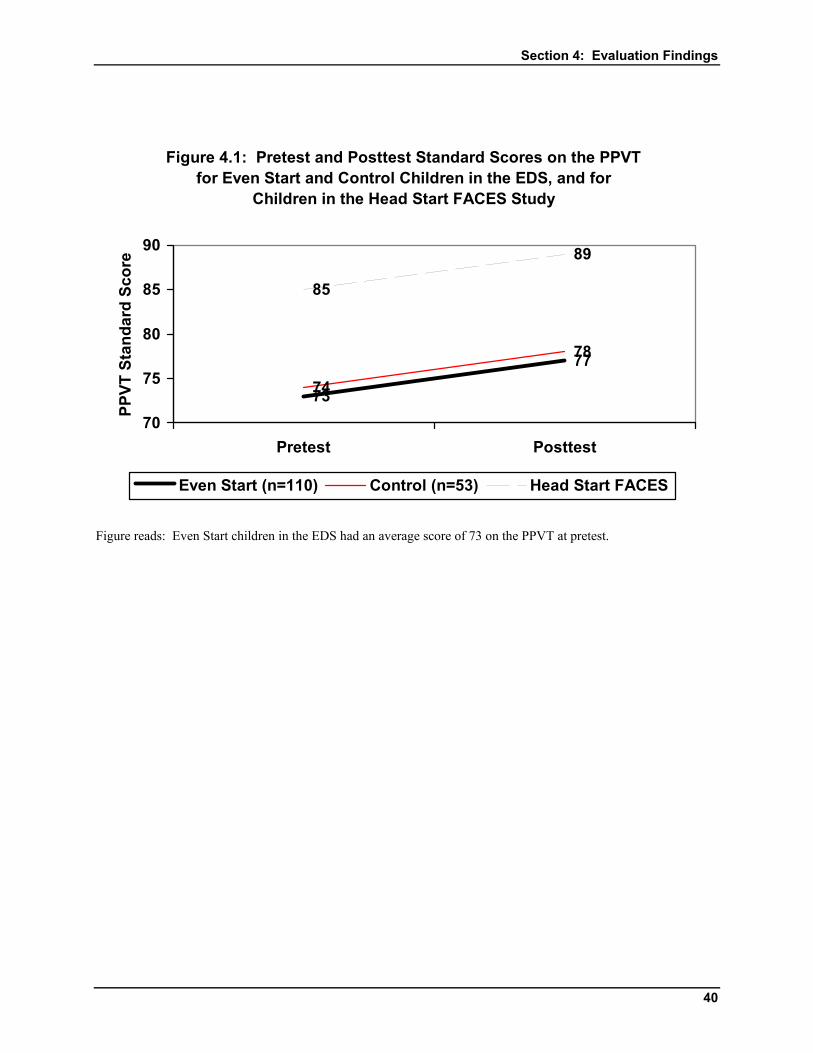
Section 4: Evaluation Findings
40
Figure 4.1: Pretest and Posttest Standard Scores on the PPVT for Even Start and Control Children in the EDS, and for
Children in the Head Start FACES Study
73
7774
78
85
89
70
75
80
85
90
Pretest Posttest
PPVT
Sta
ndar
d Sc
ore
Even Start (n=110) Control (n=53) Head Start FACES
Figure reads: Even Start children in the EDS had an average score of 73 on the PPVT at pretest.
References
41
REFERENCES
Alamprese, J., Tao, F. & Price, C. (2003). Study of adult basic education programs for first level learners -- Volume 1: Study findings. Bethesda, MD: Abt Associates Inc. Prepared for the U.S. Department of Education, Planning and Evaluation Service. Baker, A.J.L., Piotrkowski, C.S. & Brooks-Gunn, J. (1999). The Home Instruction Program for Preschool Youngsters (HIPPY). The Future of Children, 9(1), 116-133. Los Altos, CA: Center for the Future of Children, the David and Lucile Packard Foundation. Barnett, W.S. (1995). Long-term effects of early childhood programs on cognitive and school outcomes. The Future of Children: Long-term Outcomes of Early Childhood Programs, 5(3), 25-50. Los Altos, CA: Center for the Future of Children, the David and Lucile Packard Foundation. Bos, J.M., Scrivener, S., Snipes, J. & Hamilton, G. (2002). National evaluation of welfare-to-work strategies. Improving basic skills: The effects of adult education in welfare-to-work programs. New York: MDRC. Prepared for the U.S. Department of Education and U.S. Department of Health and Human Services. Bredekamp, S. & Rosegrant, T. (1995). Reaching potentials through national standards: Panacea or pipe dream. In Bredekamp, S. & Rosegrant, T. (eds.), Reaching potentials: Transforming early childhood curriculum and assessment (pp.5-14). Washington, DC: National Association for the Education of Young Children. Bus, A.G., van Ijzendoorn, M.H. & Pellagrini, A.D. (1995). Joint book reading makes for success in learning to read: A meta-analysis on intergenerational transmission of literacy. Review of Educational Research, 65(1), 1-21. Clarke-Stewart, A. (1988). Parents’ effects on children’s development: A decade of progress? Journal of Applied Developmental Psychology, 9, 41-84. Darling, S. (March 14, 2000). Testimony before the Committee on Appropriations, Subcommittee on Labor, Health and Human Services, Education and Related Agencies, United States House of Representatives. Datta, L. (1992). Youth interventions: Literacy. In Sticht, T.G., Beeler, M.J. & McDonald, B.A. (Eds.) The intergenerational transfer of cognitive skills, Volume 1: Programs, policy, and research issues, 41-60. Norwood, NJ: Ablex. Development Associates (1994). National evaluation of adult education programs: Final report. Arlington, VA: Development Associates, Inc. Prepared for the U.S. Department of Education, Planning and Evaluation Service.
References
42
Dickinson, D. (2001). The Literacy Checklist. Newton, MA: Education Development Center. Dickinson, D. (2002). The Literacy Checklist, Technical Appendix. Newton, MA: Education Development Center. Dickinson, D.K. & Tabors, P.O. (Eds.) (2001). Beginning literacy with language: Young children learning at home and in school. Baltimore, MD: Brookes. Duffy, T.M. (1992). What makes a difference in instruction. In Sticht, T.G., Beeler, M.J. & McDonald, B.A. (Eds.) The intergenerational transfer of cognitive skills, Volume 1: Programs, policy, and research issues, 61-83. Norwood, NJ: Ablex. Dunn, L.M. & L.M. Dunn (1997). Examiner’s manual for the PPVT-III: Peabody Picture Vocabulary Test, third edition. Circle Pines, MN: American Guidance Service. Fischer, R.L. & Cordray, D.S. (January 1995). Job training and welfare reform: A policy-driven synthesis. Manuscript submitted to the Russell Sage Foundation. Goodson, B.D., Layzer, J.I., St.Pierre, R.G., Bernstein, L.S. & Lopez, M. (2000). Effectiveness of a comprehensive five-year family support program on low-income children and their families: Findings from the Comprehensive Child Development Program. Early Childhood Research Quarterly, 15(1), 5-39. Gresham & Elliott (1990). Social Skills Rating System. Circle Pines, MN: American Guidance Service. Gueron, J. & Pauly, E. (1991). From welfare to work. New York: Russell Sage. Harms, T. & Clifford, R. (1980). Early Childhood Environment Rating Scale. New York: Teachers College Press. Hart, B. & Risley, T.R. (1995). Meaningful differences in the everyday experience of young American children. Baltimore: Brookes. Helburn, S.W. (Ed.) (1995). Cost, quality and child outcomes in child care centers. Technical report. Department of Economics, Center for Research in Economic and Social Policy, University of Colorado at Denver. Karoly, L.A., Greenwood, P.W., Everingham, S.S., Hoube, J., Kilburn, M.R., Rydell, C.P., Sanders, M. & Chiesa, J. (1998). Investing in our children. Santa Monica, CA: The Rand Corporation. Layzer, J.I., Goodson, B.D. & Moss, M.M. (1993). Observational study of early childhood programs: Life in preschool. Cambridge, MA: Abt Associates Inc. Prepared for the U.S. Department of Education, Planning and Evaluation Service.
References
43
Lyon, R. (1999). Overview of reading and literacy initiatives. In Reading research anthology: The why? of reading instruction. California: Arena Press, Consortium on reading excellence (CORE). Mason, J.M. (1992). Reading stories to preliterate children: A proposed connection to reading. In Gough, P.B., L.C. Ehri & R. Treiman (Eds.), Reading acquisition, 215-243. Hillsdale, NJ: Erlbaum. Mikulecky, L. (1992). National adult literacy and lifelong learning goals. Philadelphia, PA: University of Pennsylvania, National Center on Adult Literacy. Moore, M. & Stavrianos, M. (1994). Adult education reauthorization: Background. Washington, DC: Mathematica Policy Research. Prepared for the U.S. Department of Education, Planning and Evaluation Service. NAEYC (1998). Learning to read and write: Developmentally appropriate practices for young children. Young Children, 53(4), 30-46. National Research Council (2001). Eager to learn: Educating our preschoolers. Committee on Early Childhood Pedagogy. Bowman, B.T., Donovan, M.S. & Burns, M.S. (Eds.). Commission on Behavioral and Social Sciences and Education. Washington, DC: National Academy Press. National Research Council and Institute of Medicine (2000). From neurons to neighborhoods. The science of early childhood development. Committee on Integrating the Science of Early Childhood Development. Shonkoff, J.P. & Phillips, D.A. (Eds.). Board on Children, Youth, and Families, Commission on Behavioral and Social Sciences and Education. Washington, DC: National Academy Press. National Research Council (1998). Preventing reading difficulties in young children. Committee on the Prevention of Reading Difficulties in Young Children. Snow, C.E., Burns, M.S. & Griffin, P. (Eds.). Washington, DC: National Academy Press. Powell, D. & D’Angelo, D. (2000). Framework for parenting education in Even Start. Portsmouth, NH: RMC Research Corporation. Prepared for the U.S. Department of Education, Planning and Evaluation Service. Puma, M.J., Karweit, N., Price, C., Ricciuti, A., Thompson, W. & Vaden-Kiernan, M. (1997). Prospects: Final report on student outcomes. Cambridge, MA: Abt Associates. Prepared for the U.S. Department of Education, Planning and Evaluation service. Ramey, C.T., Ramey, S.L., Gaines, R. & Blair, C. (1995). Two-generation early interventions: A child development perspective. In Smith, S. (ed.) Two-generation programs for families in poverty: A new intervention strategy, 199-228. Norwood, NJ: Ablex.
References
44
Ramey, C.T. & Campbell, F.A. (1988). Preventive education for high-risk children: Cognitive consequences of the Carolina Abecedarian project. American Journal of Mental Deficiency, 88(5), 515-523. Ramey, S.L. & Ramey, C.T. (1992). Early educational intervention with disadvantaged children—To what effect? Applied and Preventive Psychology, 1, 130-140. Ramey, C.T., Bryant, D.M., Wasik, B.H., Sparling, J.J., Fendt, K.H. & LaVange, L.M. (1992). Infant Health and Development Program for low birth weight, premature infants: Program elements, family participation, and child intelligence. Pediatrics, 3, 454-465. Ricciuti, A.E., St.Pierre, R.G., Lee, W. & Parsad, A. (2003). Third national Even Start evaluation: Follow-up on the Experimental Design Study. Bethesda, MD: Abt Associates Inc. Prepared for the U.S. Department of Education, Institute of Education Sciences. Schweinhart, L.J., Barnes, H.V. & Weikart, D.P. (1993). Significant benefits: The High/Scope Perry Preschool study through age 27. (Monograph 10). Ypsilanti, MI: High/Scope Educational Research Foundation. Smith, S. (Ed.) (1995). Two generation programs for families in poverty: A new intervention strategy. Norwood, NJ: Ablex. Snow, C.E., M.S. Burns & P. Griffin (1998). Preventing reading difficulties in young children. Washington, DC: National Academy Press. Sparrow, S.S., D.A. Bella & D. Cicchetti (1984). Vineland Adaptive Behavior Scales. Circle Pines, MN: AGS Publishing. St.Pierre, R.G., A.E. Ricciuti, F. Tao, C. Creps, J. Swartz, W. Lee, A. Parsad & T. Rimdzius (2003). Third national Even Start evaluation: Program Impacts and Implications for Improvement. Abt Associates Inc. for the U.S. Department of Education, Planning and Evaluation Service, contract EA97049001. St.Pierre, R.G., A.E. Ricciuti, F. Tao, C. Creps, T. Kumagawa & W. Ross (2001). Third national Even Start evaluation: Description of Projects and Participants. Abt Associates Inc. for the U.S. Dept. of Education, Planning and Evaluation Service, contract EA97049001. St.Pierre, R.G., J.P. Swartz, B. Gamse, S. Murray, D. Deck & P. Nickel (1995). National evaluation of the Even Start Family Literacy Program: Final report. Cambridge, MA: Abt Associates Inc. for the U.S. Dept. of Education, Planning and Evaluation Service, contract LC90062001. St.Pierre, R.G. & Layzer, J.I. (1998). Improving the life chances of children in poverty: Assumptions and what we have learned. Social Policy Report: Society for Research on Child Development, 12(4).
References
45
Teale, W.H. (1986). Home background and young children's literacy development. In W.H. Teale & E. Sulzby (eds.), Emergent literacy: Writing and reading, 173-205. Norwood, N.J.: Ablex. U.S. Department of Education (February 2002). Guidance for the William F. Goodling Even Start Family Literacy Programs. Washington, DC. U.S. Department of Health and Human Services (2001). Head Start FACES: Longitudinal findings on program performances, Third progress report. Washington, DC: Administration on Children, Youth and Families. U.S. Department of Health and Human Services (1998). Head Start program performance measures: Second progress report. Washington, DC: Administration on Children, Youth and Families. Wagner, M. & Clayton, S. (1998). The Parents as Teachers program: Results from two demonstrations. Menlo Park, CA: SRI International. Washington, J. & H. Craig (1999). Performance of at-risk, African American preschoolers on the Peabody Picture Vocabulary Test-III. Language, Speech, and Hearing Services in Schools. 30:75-82. Wasik, B.H., Ramey, C.T., Bryant, D.M. & Sparling, J.J. (1990). A longitudinal study of two early intervention strategies: Project CARE. Child Development, 61, 1682-1696. Woodcock, R.W. & N. Mather (1989, 1990). WJ-R tests of achievement: Examiner’s manual. In R.W. Woodcock & M.B. Johnson, Woodcock-Johnson psycho-educational battery - revised. Itasca, IL: Riverside Publishing. Woodcock, R.W. & N. Mather (1989,1990). WJ-R tests of cognitive ability – Standard and supplemental batteries: Examiner’s manual. In R.W. Woodcock & M.B. Johnson, Woodcock-Johnson psycho-educational battery – revised. Itasca, IL: Riverside Publishing. Zill, N., Resnick, G. & O’Donnell, K. (2001). Growth in children’s literacy skills in Head Start and early elementary school: Implications for preschool curricula. Revision of paper presented at annual meetings of the Society for Research on Child Development, Minneapolis, MN.

47
APPENDIX A
DESCRIPTION OF OUTCOME MEASURES

Appendix A: Description of Outcome Measures
49
APPENDIX A: DESCRIPTION OF OUTCOME MEASURES CHILD OUTCOME MEASURES
Peabody Picture Vocabulary Test. The PPVT-III (Dunn & Dunn, 1997) measures listening comprehension for spoken words and is a good short test of general verbal ability. The word knowledge assessed by the PPVT is called "receptive vocabulary," to differentiate it from the more active vocabulary skills required to formally define a word or use it appropriately in a sentence. The PPVT was administered to all children in the EDS who were 2.5 years of age and older, unless the child’s parent objected and insisted that the TVIP (Spanish version of the PPVT) be administered. The PPVT assesses children's knowledge of the meaning of words by asking them to say or indicate by pointing which of four pictures best shows the meaning of a word that is said aloud by the examiner. A series of words is presented, ranging from easy to difficult for children of a given age, each accompanied by a plate consisting of four line drawings. The test is suitable for ages from 2.5 years through adulthood and has recently established age norms based on a national sample of 2,725 children and adults tested at 240 sites across the nation.
The PPVT-III was extensively revised from earlier versions. Administration procedures were modified to permit easier testing and more accurate scoring. New drawings were added and dated illustrations dropped to achieve better gender and ethnic balance. Test items that showed statistical bias by race or ethnicity, gender, or region were deleted from the item pool prior to standardization. Research by critics of earlier versions of the PPVT shows no racial or economic bias (Washington & Craig, 1999).
Woodcock-Johnson Psycho-Educational Battery (Revised). The most recent edition of the WJ-R (Woodcock & Mather, 1989, 1990) at the time of the EDS data collection is a carefully constructed, newly-normed, individually-administered test battery that is designed to assess the intellectual and academic development of individuals from preschool through adulthood. Each of the 41 WJ-R subtests requires about 5 minutes to complete, is designed to be administered separately or in combination with other subtests, and has an internal consistency reliability of .90 or higher. In the EDS, four subtests of the WJ-R were administered to children who were older than 2.5 but less than 4.0 years of age. These include three subtests used in the Head Start FACES study: the Letter-Word Identification, Dictation and Applied Problems subtests which constitute the “Early Development – Skills” cluster, according to the test developers, and thus provide a quick screening of broad achievement. In addition, the Incomplete Words subtest was administered to provide information on phonemic awareness. Eight subtests were administered to children who were 4.0 years of age and older. These include the four subtests used for younger children, as well as four subtests which focus on reading skills (Sound Blending, Word Attack, Passage Comprehension, and Reading Vocabulary).
Appendix A: Description of Outcome Measures
50
Letter-Word Identification: The first five Letter-Word Identification items involve symbolic learning, or the ability to match a rebus (pictographic representation of a word) with an actual picture of the object. The remaining items measure reading identification skills in identifying isolated letters and words that appear in large type.
Dictation: The first six items in this subtest measure prewriting skills such as drawing lines and copying letters. The remaining items measure the child’s skill in providing written responses when asked to write specific capital or lower-case letters of the alphabet. Later parts of the subtest ask for writing of specific words and phrases, punctuation, and capitalization.
Applied Problems: This subtest measures skill in analyzing and solving practical problems in mathematics. In order to solve the problems, the child must recognize the procedure to be followed and then perform relatively simple counting or addition or subtraction operations. Because many of the problems include extraneous stimuli or information, the child must also decide which data to include in the count or calculation.
Incomplete Words: This is a tape-recorded test that measures auditory closure. After hearing a recorded word that has one or more phonemes missing, the subject identifies the complete word. This test primarily measures auditory processing.
Sound Blending: This test measures the ability to integrate and then say whole words after hearing parts (syllables and/or phonemes) of the words. An audiotape is used to present word parts in their proper order. The test measures auditory processing.
Word Attack: This measures the subject’s skill in applying phonic and structural analysis skills to the pronunciation of unfamiliar printed words. The subject reads aloud letter combinations that are linguistically logical but that form nonsense words or low-frequency words in English (or Spanish).
Passage Comprehension: The first four items in this subtest are presented in a multiple-choice format requiring the subject to point to the picture represented by a phrase. The remaining items measure skill in reading a short passage and identifying a missing key word. The task requires the child to state a word that would be appropriate in the context of the passage. The child exercises a variety of comprehension and vocabulary skills.
Reading Vocabulary: This subtest measures skill in reading words that supply appropriate meanings. In Part A: Synonyms, the subject must state a word similar in meaning to the word presented. In Part B: Antonyms, the subject must state a word that is opposite in meaning to the word presented. Only one-word responses are acceptable.
Story & Print Concepts. The Story & Print Concepts task is an adaptation of earlier
prereading assessment procedures developed by Teale (1986) and Mason (1992). Administered to children in the EDS who were 2.5 years of age and older, the child is handed a children’s storybook upside down and backwards. The assessor notes whether the child turns it around to put the book upright with the front cover on top. Then the child is asked to identify where the name of the book is written and where the material to be read begins, and in what direction the reading proceeds. The assessor reads the story to the child and asks basic questions about both the content of the story and the mechanics of reading. Research has found that children who

Appendix A: Description of Outcome Measures
51
experience frequent story reading by their parents or teachers are more likely to be able to answer such questions.
Vineland Adaptive Behavior Scales -- Communication Domain (Sparrow, Bella & Cicchetti, 1984). The Vineland is a comprehensive set of rating scales designed for use by teachers and parents. The Vineland has national norms. The Communication Domain from the Classroom Edition of the Vineland was used in the EDS. It takes about 10 minutes to administer and consists of 63 items that provide an assessment of literacy functioning in three areas -- expressive, receptive, and written skills. Because teachers need time to become familiar with the children in their classroom, the Vineland was completed only as a posttest measure at the end of the school year. Teachers completed the Vineland for all Even Start and control group children who were 3.0 years of age and older and in a formal preschool or school-based setting.
Parent Report of Child Literacy. The ESPIRS and the EDS parent interview contain items designed to obtain parent ratings of their child’s literacy performance. Available in English and Spanish, these items are based on literacy competencies identified in recent research on reading by the National Research Council (Snow, Burns & Griffin, 1998), the NAEYC (1998), and the NICHD (Lyon, 1999). The items were used to construct the following variables for Even Start and control children:
Child knows alphabet (age 2 years, 7 months and older): Has value of 1 if parent reports that child knows all alphabet letters or can say/sing the entire alphabet; has value of 0 otherwise.
Child counts to 100 or more (age 2 years, 7 months and older): Has value of 1 if parent reports that child can count to 100 or more; has value of 0 otherwise.
Child knows colors (age 2 years, 7 months and older): Has value of 1 if parent reports that child knows colors red, yellow, blue, green by name; has value of 0 otherwise.
Extent to which child reads (age less than 2 years, 6 months): Has values from 0-4. Value increases by 1 if child pretends to read, has memorized book, pretends to read to someone else, has favorite book.
Extent to which child reads (age 2 years, 7 months and older): Has values from 0-9. Value increases by 1 if child pretends to read, reads for enjoyment, has memorized book, has favorite book, can follow written directions, can describe something learned through reading, rereads sentences, reads/pretends to read to someone else, recognizes own first name in writing/print.
Age-appropriate writing skills (all children): Has values from 0-2. Value increases by 1 if child pretends to write, writes some letters of the alphabet.
Child knowledge of print concepts (age 2 years, 7 months – 4 years, 11 months): Has values from 0-9. Value increases by 1 if child shows front of book, page where you start, where to start on page, a picture, a word, last letter in a word, a number, a period, a question mark.
Social Skills Rating System (SSRS). The SSRS (Gresham & Elliot, 1990), available in
English, is designed for teachers to use in rating child competencies and behaviors. Because

Appendix A: Description of Outcome Measures
52
teachers should not complete these scales until they have spent a substantial amount of time with a child, we used the SSRS scales only as a posttest. As with the Vineland scales, we collected the SSRS for all Even Start and control group children who were 3.0 years of age and older and in a formal preschool or school-based setting. The SSRS has been widely used and nationally normed. Standard scores and percentile ranks are available for each scale.
Problem behaviors: This scale consists of 18 items (10 for the preschool version) that ask the teacher to rate the child on a three-point scale (never, sometimes, very often). The items measure internalizing behaviors (acting sad or lonely), externalizing behaviors (acting out) and hyperactivity (not in the preschool version).
Social skills: This scale consists of 30 items that ask the teacher to rate the child on a three-point scale (never, sometimes, very often). The items measure cooperation, assertion and self-control.
School Records. For Even Start and control group children, we asked schools for access
to student records in order to obtain information on attendance, absences, tardiness, and placement in special education. This information was collected at posttest and follow-up. PARENT AND FAMILY OUTCOME MEASURES The EDS measured parent outcomes through direct assessment of literacy and parent self-report.
Woodcock-Johnson Psycho-Educational Battery -- Revised. The WJ-R (Woodcock & Mather, 1989,1990) was described earlier under measures for children. The WJ-R is appropriate for assessing the academic development of individuals into adulthood. In the EDS parent assessment, we used four subtests that measure reading achievement: Letter-Word Identification, Word Attack, Passage Comprehension, and Reading Vocabulary. Each of these subtests was described earlier.
Parent Report of Literacy at Home. The ESPIRS records parent report of literacy skills including reading and writing done at home. We included these items in the parent interview that was administered to parents of all children in the EDS (both in Even Start and in the control group). The following variables were constructed:
Variety of parent reading at home: Has values from 0-12. Value increases by 1 if parent reads letters/bills, advertisements, street signs, books, newspapers, food labels, coupons, notes from teacher/school, magazines, TV Guide, instructions, religious materials.
Variety of parent writing at home: Has values from 0-11. Value increases by 1 if parent writes appointments on calendar, grocery lists, notes/memos, forms/applications, letters, checks/money orders, greeting cards, crosswords, journal/diary, recipes, stories/poems.
Parent Report of Parent-Child Reading. Four variables were constructed to assess
various aspects of parent-child reading including whether the parent reads to the child daily, the

Appendix A: Description of Outcome Measures
53
amount of reading that the parent does with the child, the variety of reading that is done with the child, and the quality of the reading that is done with the child:
Reads to child daily (all children): Has value 1 if parent reads to the child each day; has value of 0 otherwise.
Amount of reading to/with child (all children): Has values from 0-3. Value increases by 1 if parent reads to child every day, someone else reads to child every day, parent tells story to child every day.
Variety of reading to/with child (all children): Has values from 0-5. Value increases by 1 if parent reads the following to/with child: newspapers, magazines, store catalogs, funnies or comic books, TV listings.
Quality of reading to/with child (all children): Has values from 0-5. Value increases by 1 if, when reading to child, parent stops/asks what is in a picture, stops/points out letters, stops/asks what happens next, reads same story over and over, asks child to read.
Parent Report of Literacy Resources at Home. Three variables were constructed to
assess the literacy resources available at home: the number of books that the child has, the variety of non-print resources in the home, and the variety of print resources in the home.
Number of books that child has (all children): Has values from 0-5. 0 = no books, 1 = 1 or 2 books, 2 = 3 to 10 books, 3 = 11 to 25 books, 4 = 26 to 50 books, 5 = 51+ books.
Variety of non-print resources at home (all children): Has values from 0-16. Value increases by 1 if the following are available at home: rattle/squeak toys, pull toys, crayons and paper, scissors, blocks, scotch tape, tinkertoys, puzzles/paint/magic markers, picture catalogs, yarn/thread/cloth, clay/playdough, make-believe toys, plants in pot or garden, pens/pencils, typewriter/computer.
Variety of print resources at home (all children): Has values from 0-5. Value increases by 1 if the following are available at home: books, magazines, newspapers, TV Guide, comic books.
Parent Report of Support of Child’s School. Two variables were constructed to assess
the parent’s support of school: the extent to which parents participate in school activities and parent opinion about school.
Parent participation in school activities (age 2 years, 7 months and older): Has values from 0-12. Value increases by 1 if parent has conference with a teacher, observes classroom activities, attends school event, attends after-school program, meets with PTA, attends parent advisory committee meeting, helps with fundraising activities, volunteers in school office or library, volunteers in child’s classroom, volunteers for school trips, works as paid employee, serves on preschool committee.
Parent opinion about school (age 5 years, 0 months and older): Has values from 0-14. Value increases by 1 if parent agrees with the following: school places priority on learning, school assigns worthwhile homework, child is challenged at school, child is treated fairly at school, school standards are realistic, child is respected by teacher, parent

Appendix A: Description of Outcome Measures
54
is respected by teacher, parent would select this school, child gets needed help at school, school is a safe place, it is important for parents to participate in school, parents have a say in school policy, parents support school policy, school maintains discipline.
Parent Report of Economic Self-Sufficiency. The parent interview includes parent
self-report of years of parent education and annual household income.
Parent education: Number of years of education.
Parent GED attainment: Does parent have a GED or high school diploma? Has value 1 if parent has GED or high school diploma, has value of 0 otherwise.
Parent employment: Was parent employed? Has value 1 if parent was employed, has value of 0 otherwise.
Annual household income: Has values from 1-8. 1 = under $3,000, 2 = $3,000 – $5,999, 3 = %6,000 - $8,999, 4 = $9,000 - $11,999, 5 = $12,000 - $14,999, 6 = $15,000 - $19,999, 7 = $20,000 - $25,000, 8 = more than $25,000.
55
APPENDIX B
GRAPHICAL DISPLAYS OF PRETEST, POSTTEST, AND FOLLOW-UP DATA

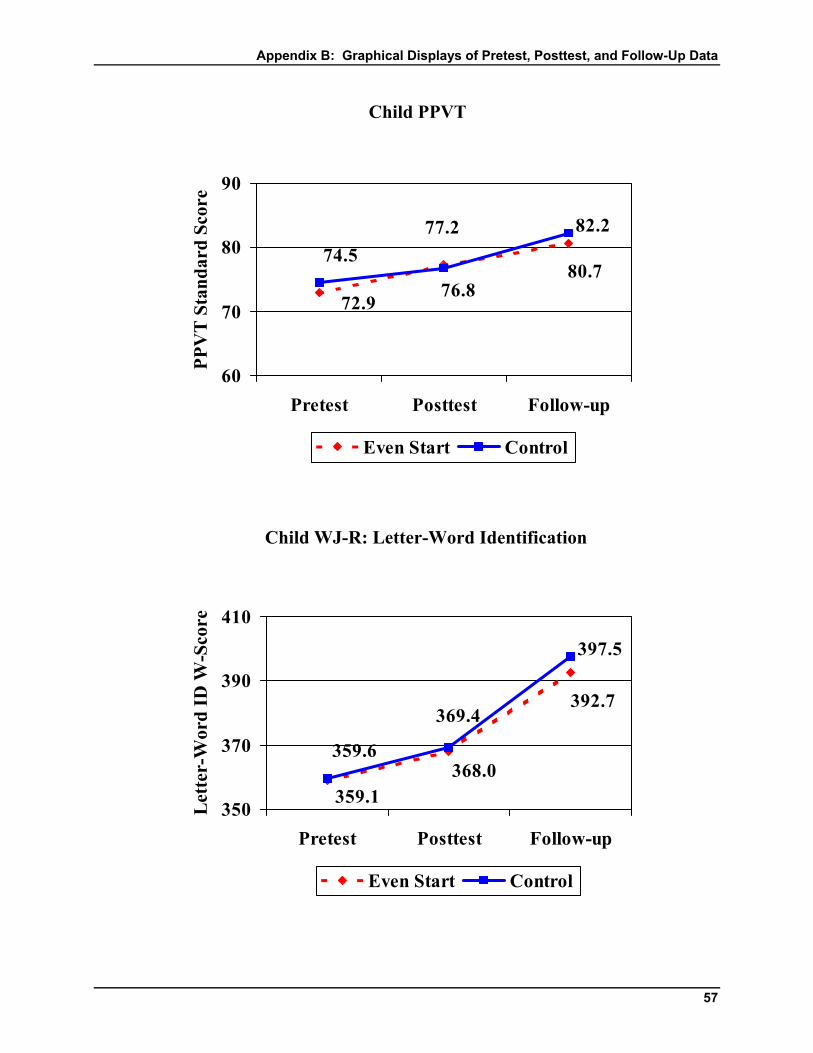
Appendix B: Graphical Displays of Pretest, Posttest, and Follow-Up Data
57
72.9
77.2
80.774.5
76.8
82.2
60
70
80
90
Pretest Posttest Follow-up
PPV
T S
tand
ard
Scor
e
Even Start Control
Child PPVT
359.1368.0
392.7
359.6
369.4
397.5
350
370
390
410
Pretest Posttest Follow-up
Let
ter-
Wor
d ID
W-S
core
Even Start Control
Child WJ-R: Letter-Word Identification
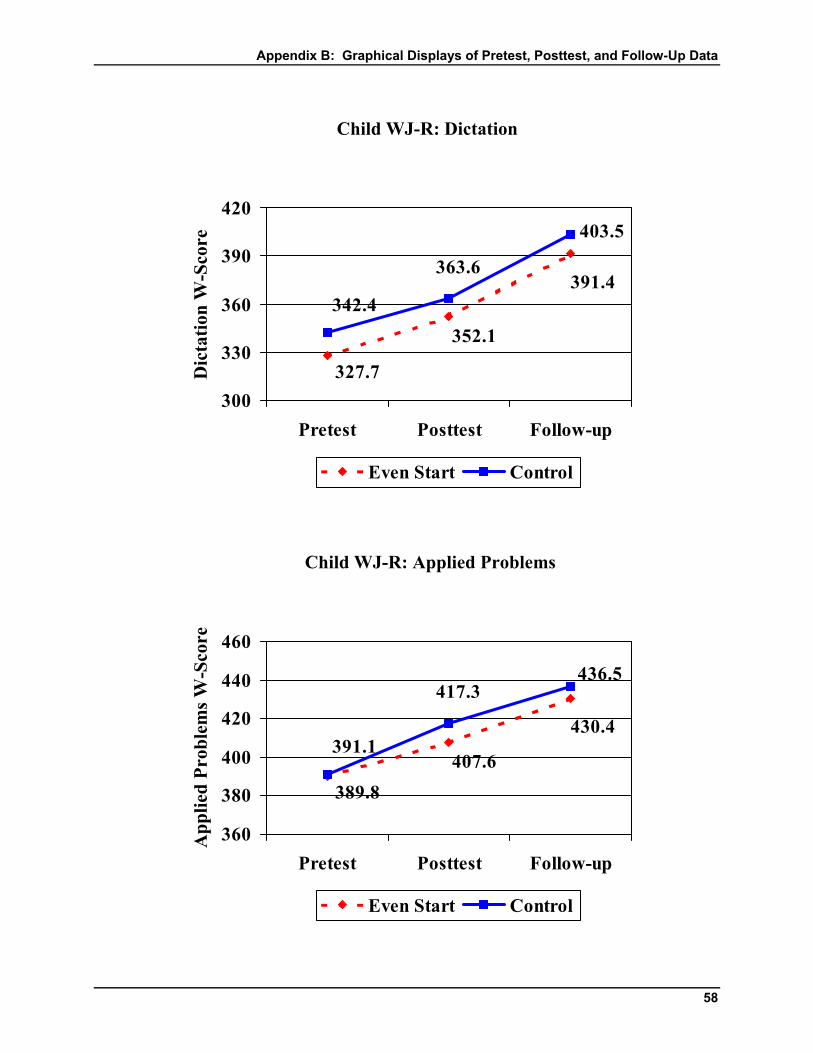
Appendix B: Graphical Displays of Pretest, Posttest, and Follow-Up Data
58
327.7
352.1
391.4342.4
363.6
403.5
300
330
360
390
420
Pretest Posttest Follow-up
Dic
tatio
n W
-Sco
re
Even Start Control
Child WJ-R: Dictation
389.8407.6
430.4391.1
417.3436.5
360
380
400
420
440
460
Pretest Posttest Follow-up
App
lied
Prob
lem
s W-S
core
Even Start Control
Child WJ-R: Applied Problems
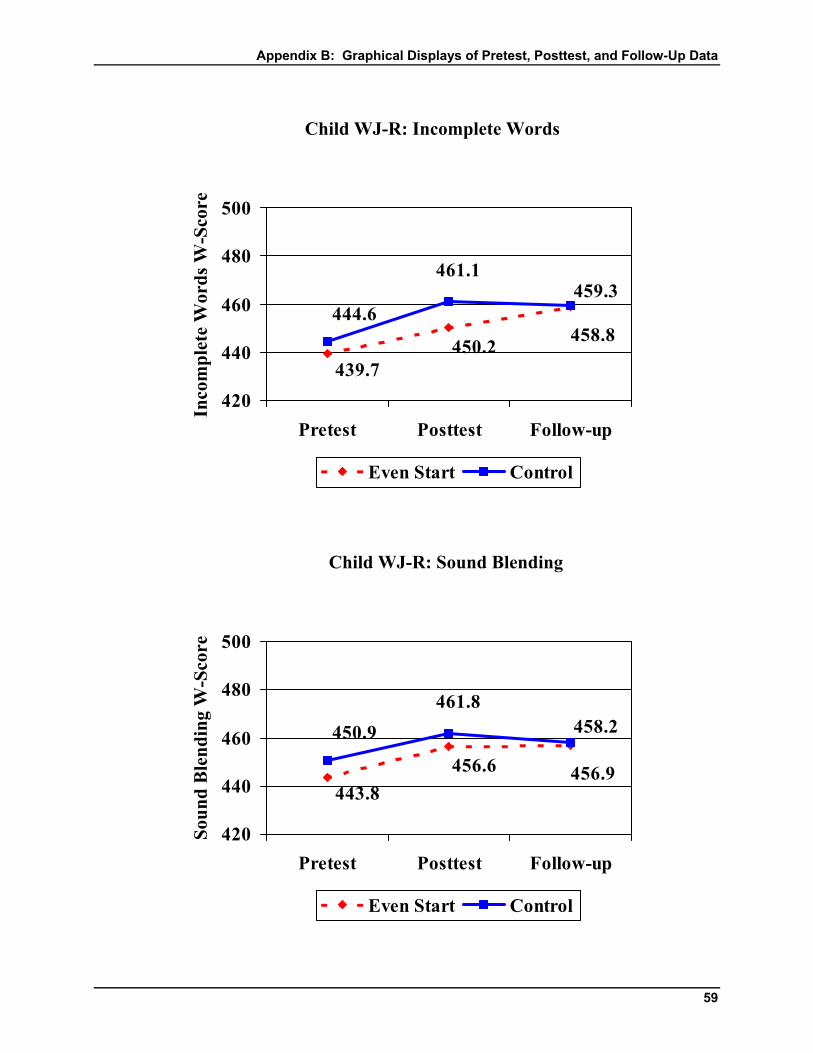
Appendix B: Graphical Displays of Pretest, Posttest, and Follow-Up Data
59
439.7450.2 458.8
444.6
461.1459.3
420
440
460
480
500
Pretest Posttest Follow-up
Inco
mpl
ete
Wor
ds W
-Sco
re
Even Start Control
Child WJ-R: Incomplete Words
443.8456.6 456.9
450.9461.8
458.2
420
440
460
480
500
Pretest Posttest Follow-up
Soun
d B
lend
ing
W-S
core
Even Start Control
Child WJ-R: Sound Blending
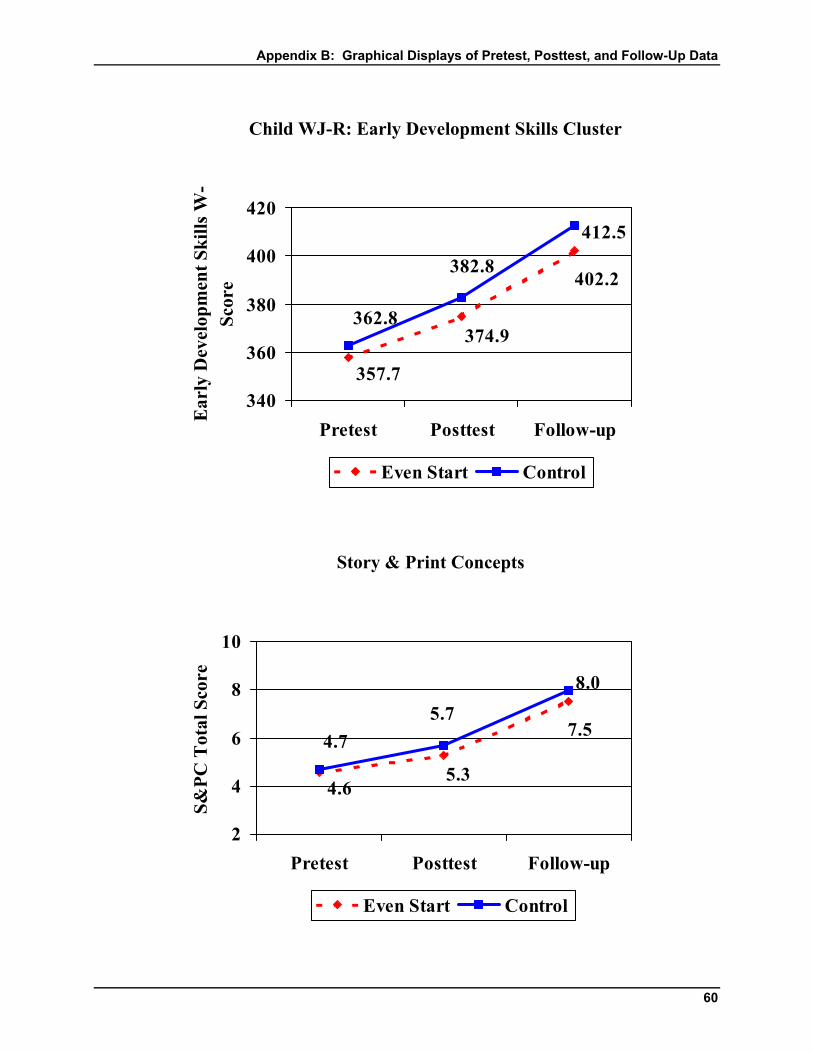
Appendix B: Graphical Displays of Pretest, Posttest, and Follow-Up Data
60
4.65.3
7.54.75.7
8.0
2
4
6
8
10
Pretest Posttest Follow-up
S&PC
Tot
al S
core
Even Start Control
Story & Print Concepts
357.7
374.9
402.2
362.8
382.8
412.5
340
360
380
400
420
Pretest Posttest Follow-up
Ear
ly D
evel
opm
ent S
kills
W-
Scor
e
Even Start Control
Child WJ-R: Early Development Skills Cluster
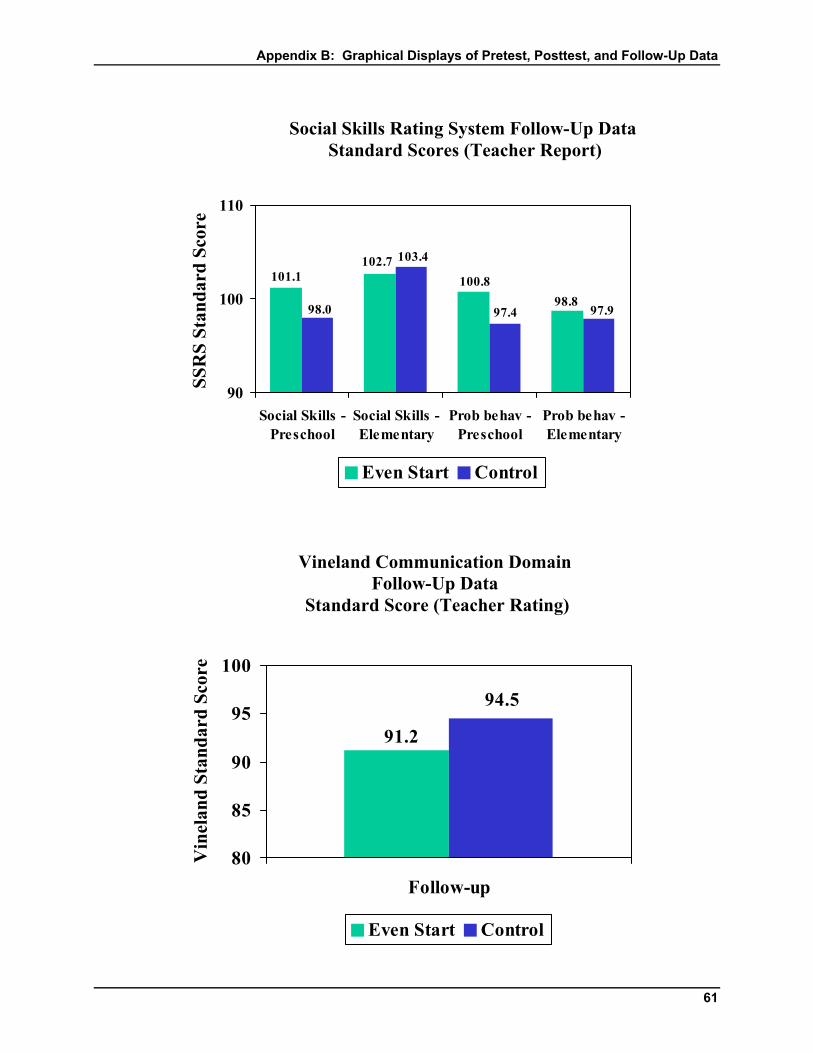
Appendix B: Graphical Displays of Pretest, Posttest, and Follow-Up Data
61
100.8102.7
101.1
98.897.4
103.4
98.0 97.9
90
100
110
Social Skills -Preschool
Social Skills -Elementary
Prob behav -Preschool
Prob behav -Elementary
SSR
S St
anda
rd S
core
Even Start Control
Social Skills Rating System Follow-Up Data Standard Scores (Teacher Report)
91.2
94.5
80
85
90
95
100
Follow-up
Vin
elan
d St
anda
rd S
core
Even Start Control
Vineland Communication Domain Follow-Up Data
Standard Score (Teacher Rating)
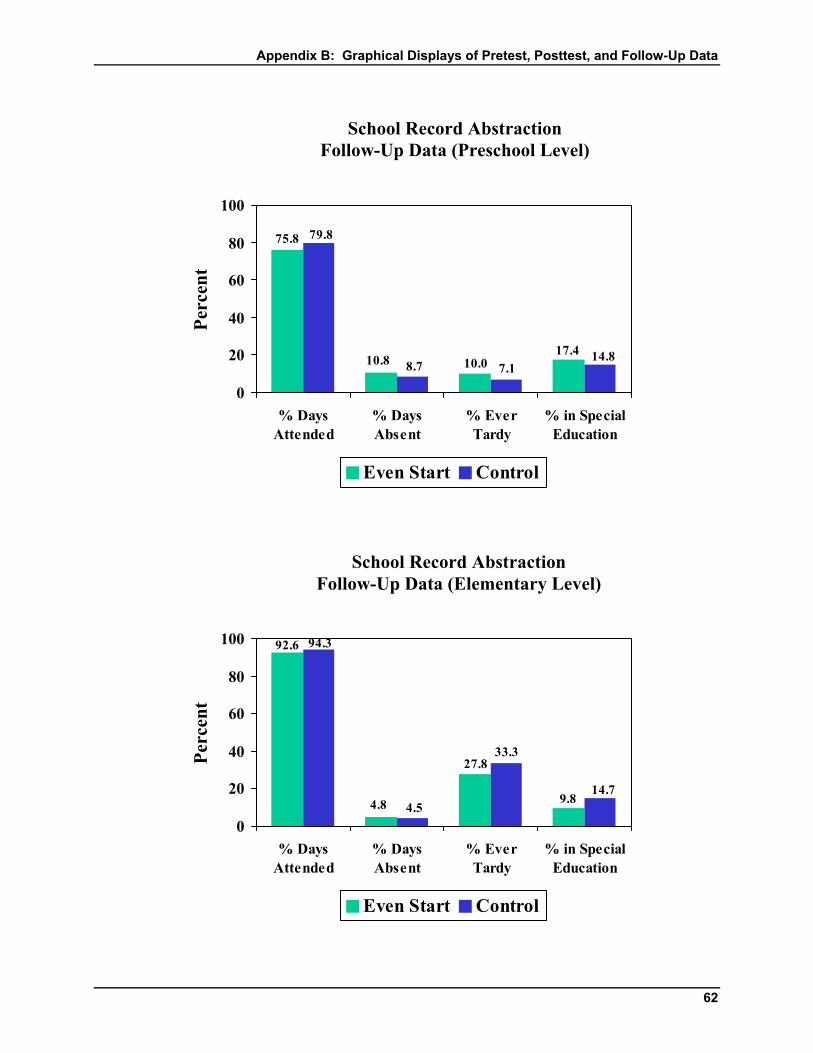
Appendix B: Graphical Displays of Pretest, Posttest, and Follow-Up Data
62
10.010.8
75.8
17.47.18.7
79.8
14.8
0
20
40
60
80
100
% DaysAttended
% DaysAbsent
% EverTardy
% in SpecialEducation
Perc
ent
Even Start Control
School Record Abstraction Follow-Up Data (Preschool Level)
27.8
4.8
92.6
9.8
33.3
4.5
94.3
14.7
0
20
40
60
80
100
% DaysAttended
% DaysAbsent
% EverTardy
% in SpecialEducation
Perc
ent
Even Start Control
School Record Abstraction Follow-Up Data (Elementary Level)
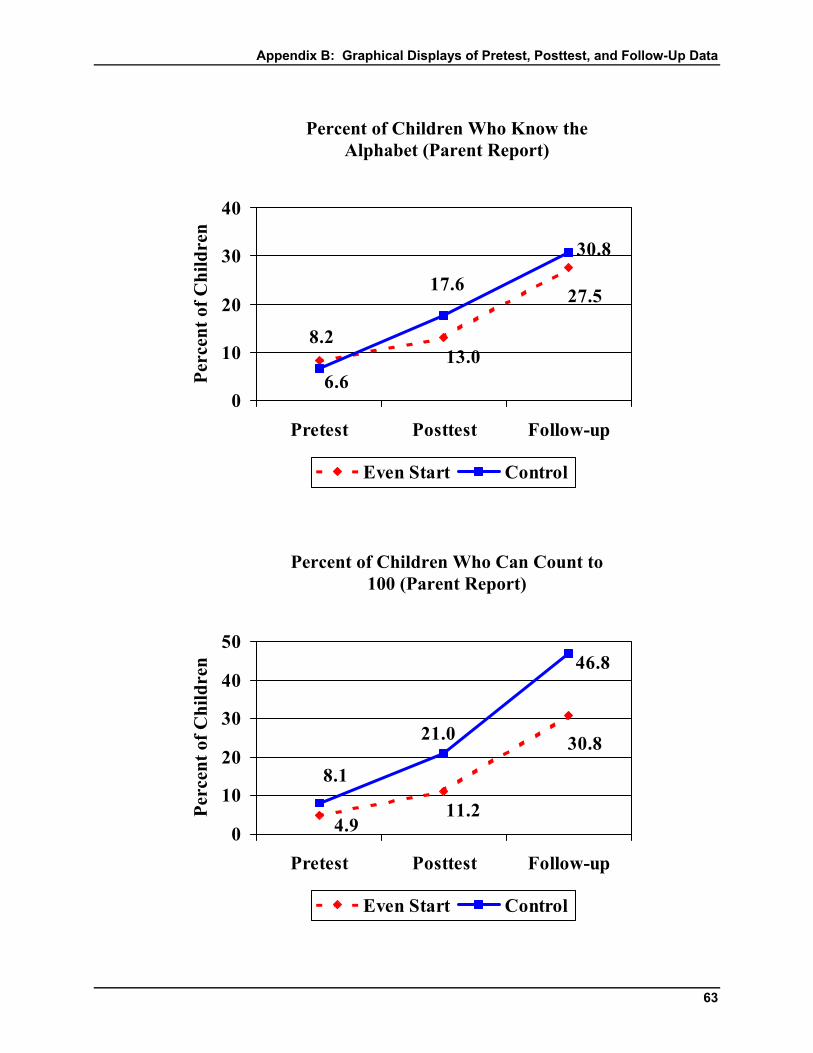
Appendix B: Graphical Displays of Pretest, Posttest, and Follow-Up Data
63
8.213.0
27.5
6.6
17.6
30.8
0
10
20
30
40
Pretest Posttest Follow-up
Perc
ent o
f Chi
ldre
n
Even Start Control
Percent of Children Who Know the Alphabet (Parent Report)
4.911.2
30.8
8.1
21.0
46.8
0
10
20
30
40
50
Pretest Posttest Follow-up
Perc
ent o
f Chi
ldre
n
Even Start Control
Percent of Children Who Can Count to 100 (Parent Report)
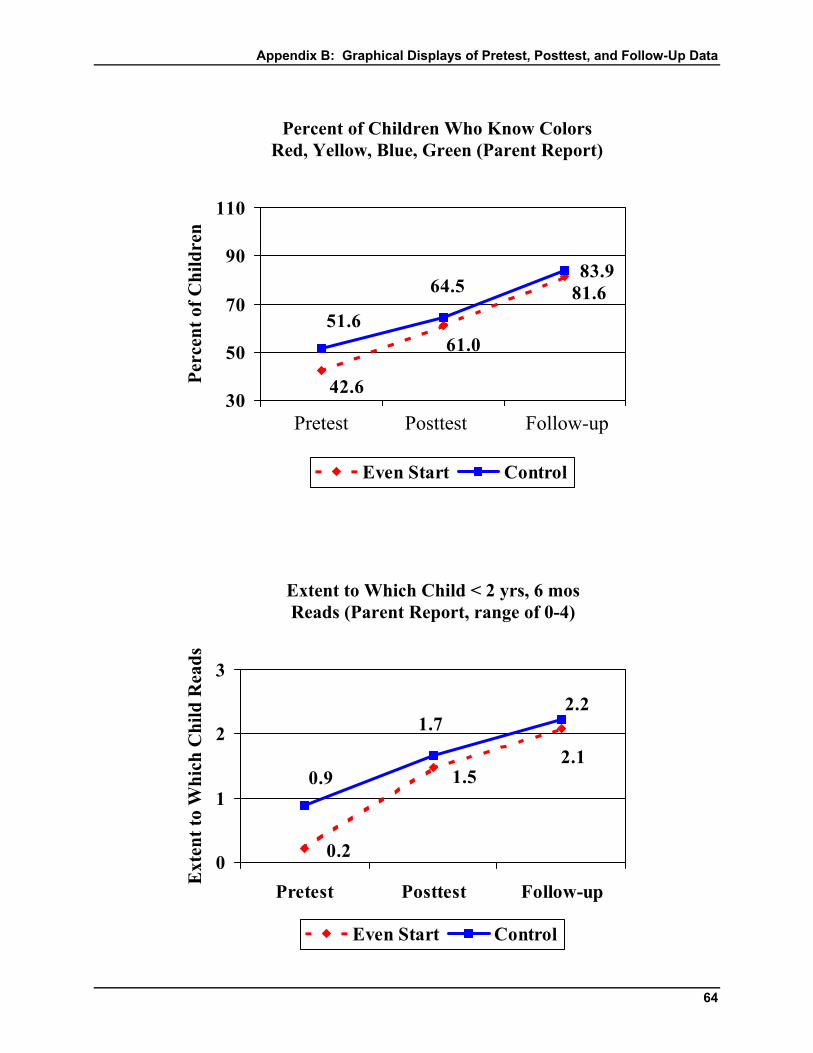
Appendix B: Graphical Displays of Pretest, Posttest, and Follow-Up Data
64
0.2
1.52.1
0.9
1.72.2
0
1
2
3
Pretest Posttest Follow-up
Ext
ent t
o W
hich
Chi
ld R
eads
Even Start Control
Extent to Which Child < 2 yrs, 6 mos Reads (Parent Report, range of 0-4)
42.6
61.0
81.651.6
64.583.9
30
50
70
90
110
Pretest Posttest 1 Posttest 2
Perc
ent o
f Chi
ldre
n
Even Start Control
Percent of Children Who Know Colors Red, Yellow, Blue, Green (Parent Report)
Pretest Posttest Follow-up
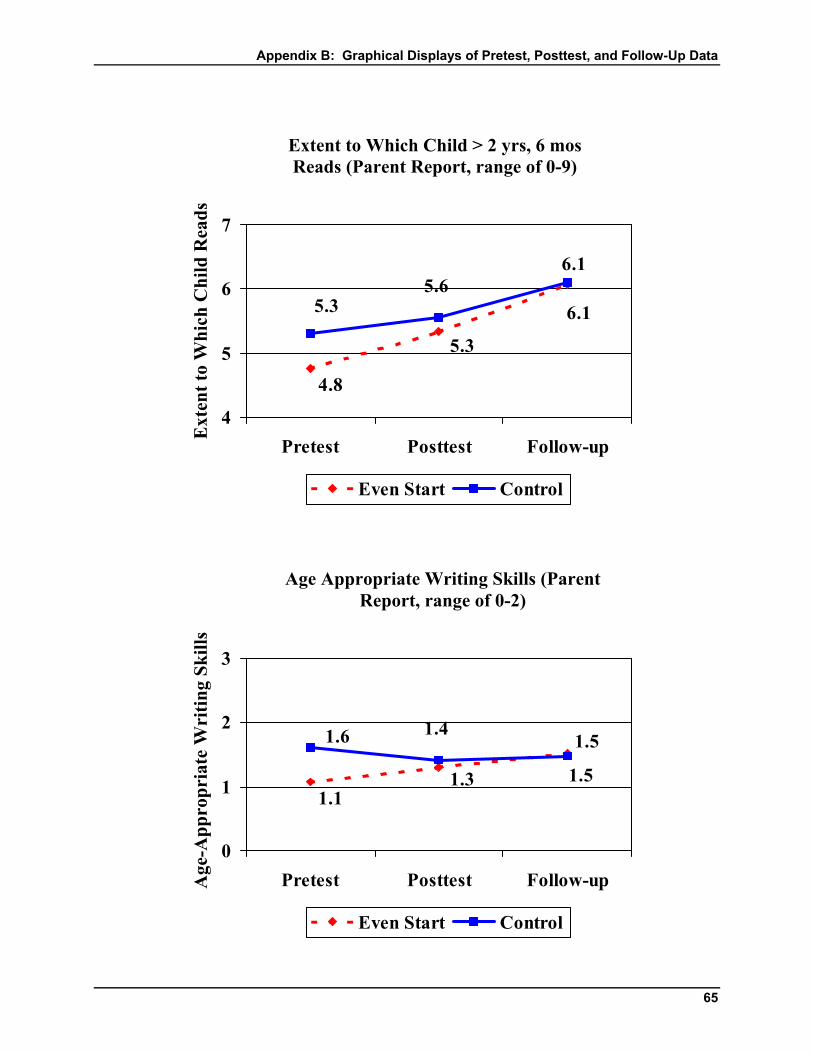
Appendix B: Graphical Displays of Pretest, Posttest, and Follow-Up Data
65
4.8
5.3
6.15.35.6
6.1
4
5
6
7
Pretest Posttest Follow-up
Ext
ent t
o W
hich
Chi
ld R
eads
Even Start Control
Extent to Which Child > 2 yrs, 6 mos Reads (Parent Report, range of 0-9)
1.11.3 1.5
1.6 1.41.5
0
1
2
3
Pretest Posttest Follow-upAge
-App
ropr
iate
Wri
ting
Skill
s
Even Start Control
Age Appropriate Writing Skills (Parent Report, range of 0-2)
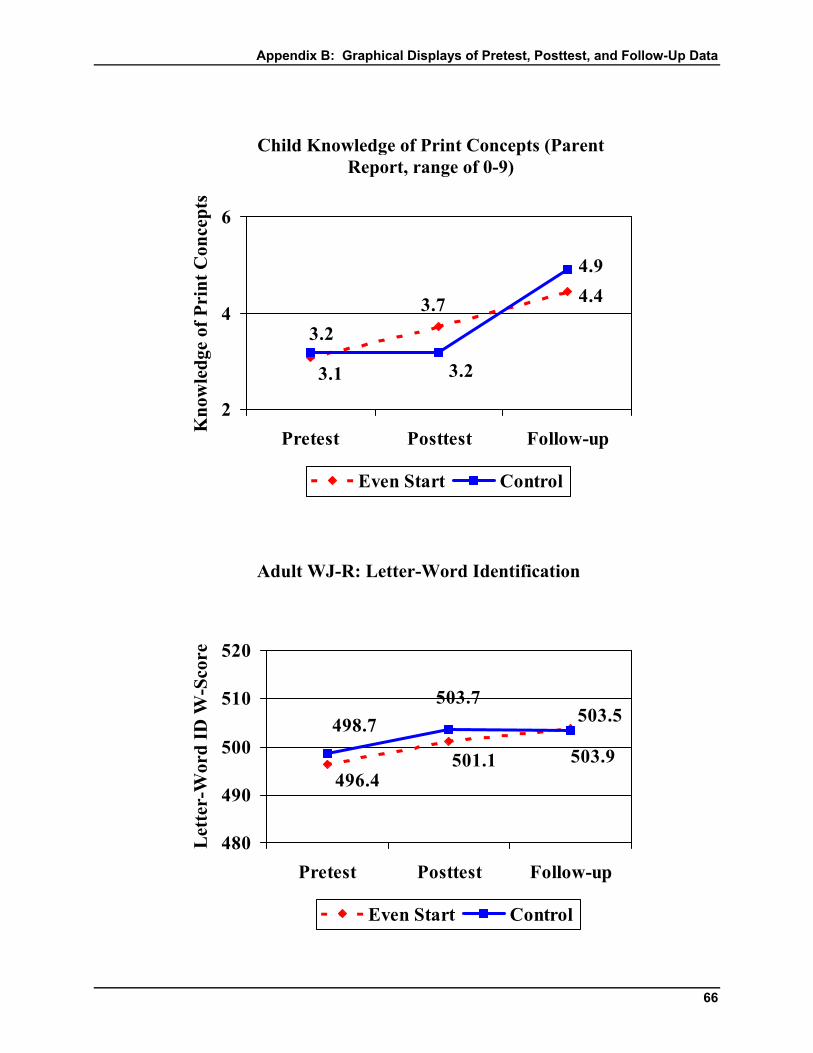
Appendix B: Graphical Displays of Pretest, Posttest, and Follow-Up Data
66
3.1
3.7 4.4
3.2
3.2
4.9
2
4
6
Pretest Posttest Follow-upKno
wle
dge
of P
rint
Con
cept
s
Even Start Control
Child Knowledge of Print Concepts (Parent Report, range of 0-9)
496.4501.1 503.9
498.7503.7
503.5
480
490
500
510
520
Pretest Posttest Follow-up
Let
ter-
Wor
d ID
W-S
core
Even Start Control
Adult WJ-R: Letter-Word Identification
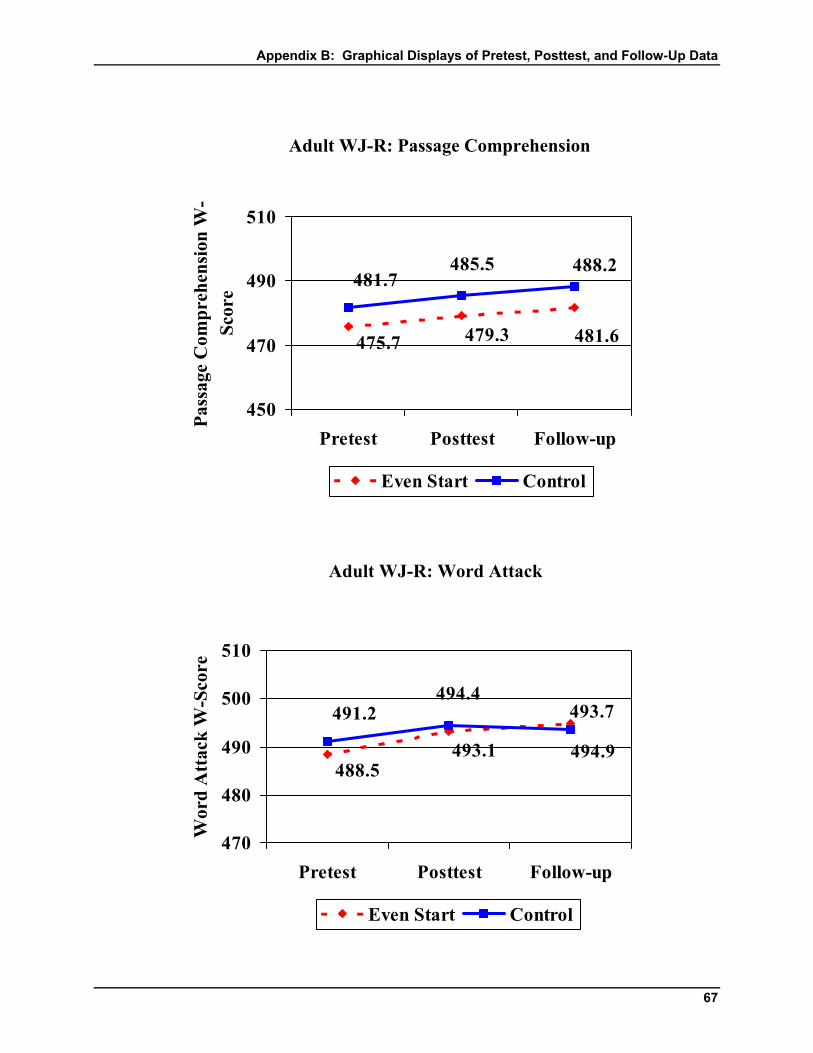
Appendix B: Graphical Displays of Pretest, Posttest, and Follow-Up Data
67
475.7 479.3 481.6
481.7485.5 488.2
450
470
490
510
Pretest Posttest Follow-up
Pass
age
Com
preh
ensi
on W
-Sc
ore
Even Start Control
Adult WJ-R: Passage Comprehension
488.5493.1 494.9
491.2494.4
493.7
470
480
490
500
510
Pretest Posttest Follow-up
Wor
d A
ttac
k W
-Sco
re
Even Start Control
Adult WJ-R: Word Attack
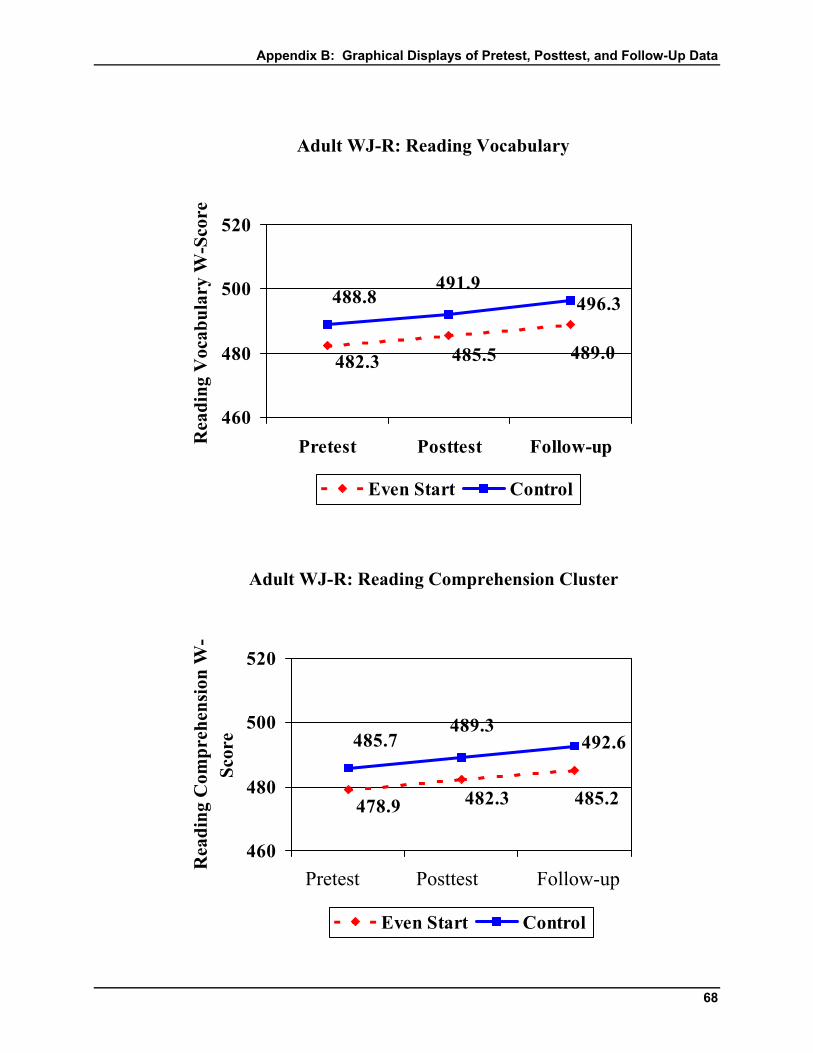
Appendix B: Graphical Displays of Pretest, Posttest, and Follow-Up Data
68
489.0485.5482.3
496.3491.9
488.8
460
480
500
520
Pretest Posttest Follow-upRea
ding
Voc
abul
ary
W-S
core
Even Start Control
Adult WJ-R: Reading Vocabulary
478.9 482.3 485.2
485.7489.3
492.6
460
480
500
520
Pretest Posttest 1 Posttest 2
Rea
ding
Com
preh
ensi
on W
-Sc
ore
Even Start Control
Adult WJ-R: Reading Comprehension Cluster
Pretest Posttest Follow-up
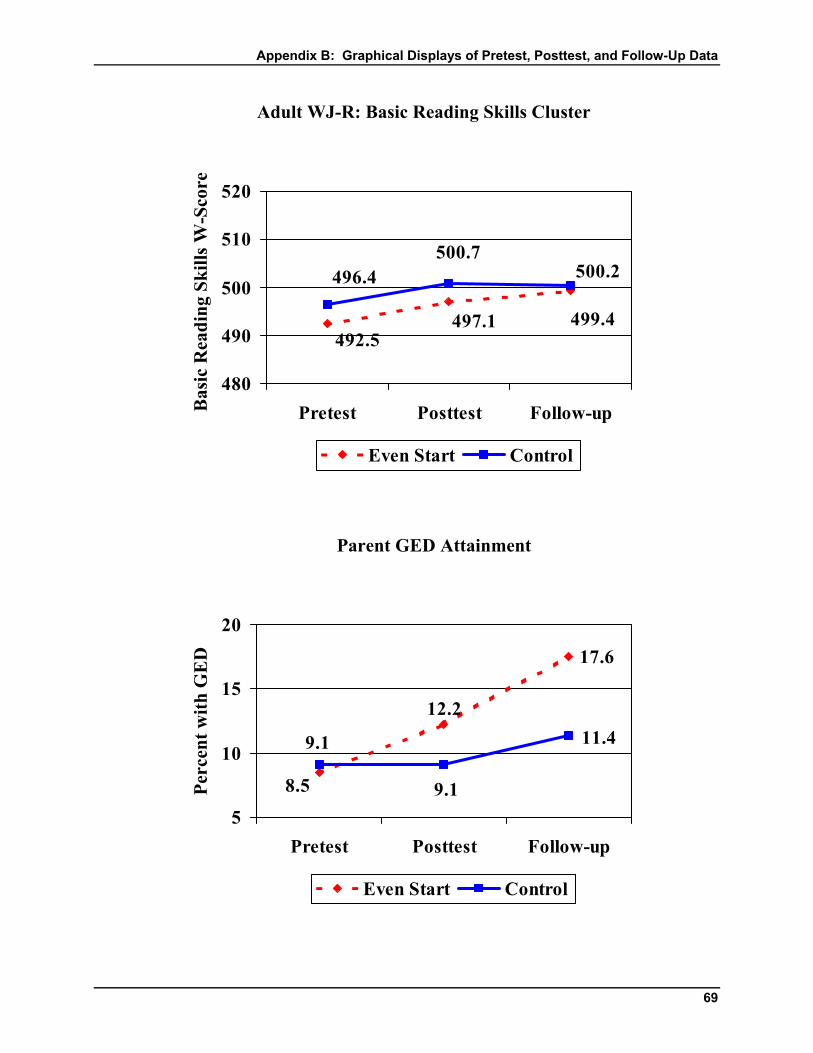
Appendix B: Graphical Displays of Pretest, Posttest, and Follow-Up Data
69
492.5497.1 499.4
496.4500.7
500.2
480
490
500
510
520
Pretest Posttest Follow-upBas
ic R
eadi
ng S
kills
W-S
core
Even Start Control
Adult WJ-R: Basic Reading Skills Cluster
8.5
12.2
17.6
9.1
9.1
11.4
5
10
15
20
Pretest Posttest Follow-up
Perc
ent w
ith G
ED
Even Start Control
Parent GED Attainment
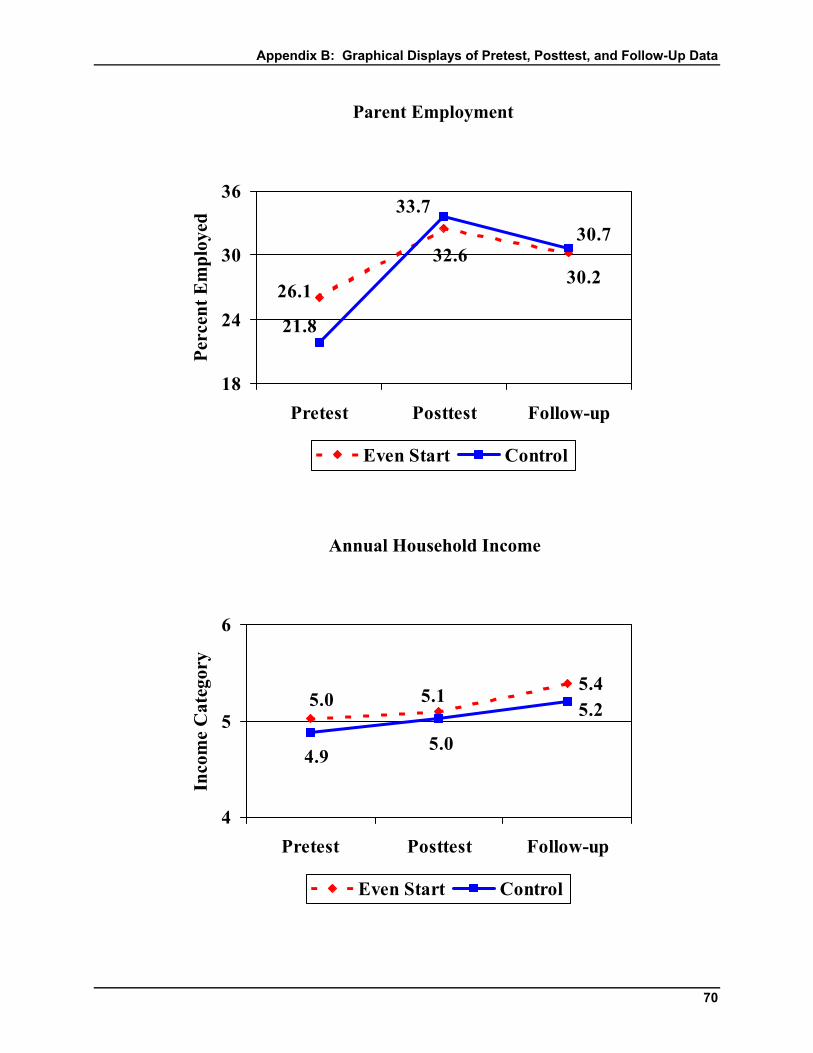
Appendix B: Graphical Displays of Pretest, Posttest, and Follow-Up Data
70
26.1
32.630.2
21.8
33.730.7
18
24
30
36
Pretest Posttest Follow-up
Perc
ent E
mpl
oyed
Even Start Control
Parent Employment
5.0 5.1 5.4
4.95.0
5.2
4
5
6
Pretest Posttest Follow-up
Inco
me
Cat
egor
y
Even Start Control
Annual Household Income

Appendix B: Graphical Displays of Pretest, Posttest, and Follow-Up Data
71
7.67.3
7.27.77.5
6.9
6
7
8
9
Pretest Posttest Follow-up
Pare
nt R
eadi
ng a
t Hom
e
Even Start Control
Variety of Parent Reading at Home (Parent Report, range of 0-12)
3.3
4.14.6
3.13.6
4.1
2
3
4
5
Pretest Posttest Follow-up
Pare
nt W
ritin
g at
Hom
e
Even Start Control
Variety of Parent Writing at Home (Parent Report, range of 0-11)
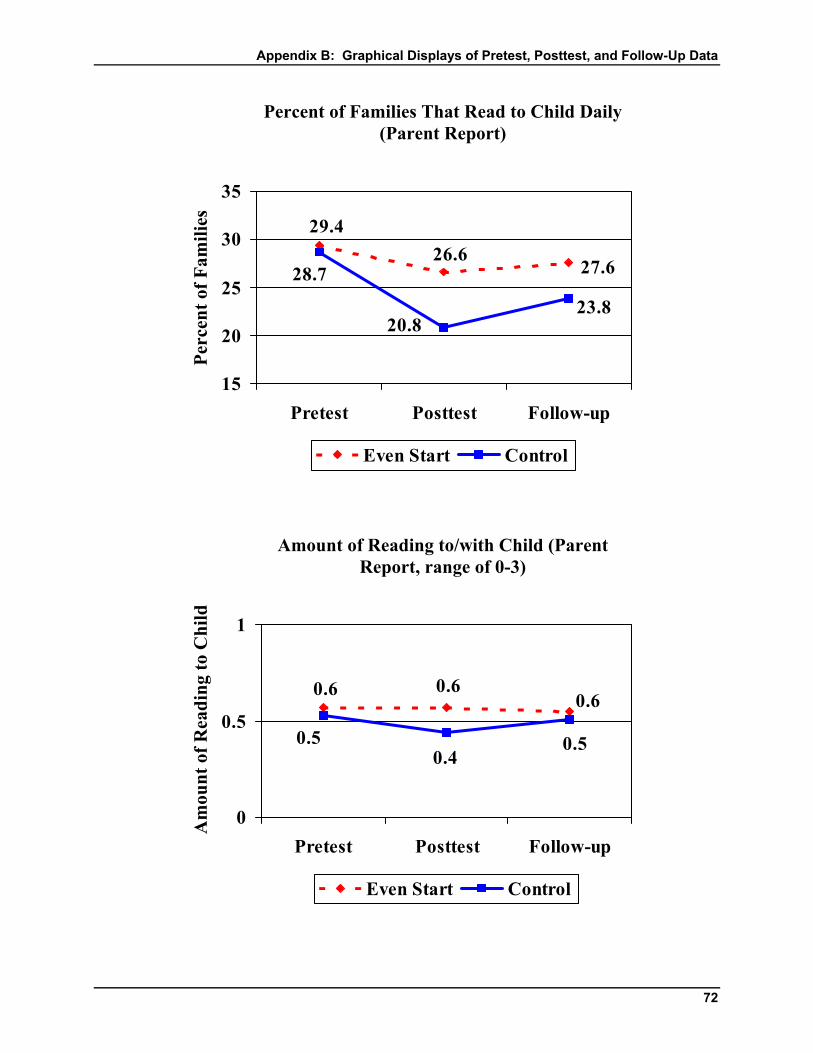
Appendix B: Graphical Displays of Pretest, Posttest, and Follow-Up Data
72
29.426.6
27.628.7
20.823.8
15
20
25
30
35
Pretest Posttest Follow-up
Perc
ent o
f Fam
ilies
Even Start Control
Percent of Families That Read to Child Daily (Parent Report)
0.6 0.60.6
0.50.4
0.5
0
0.5
1
Pretest Posttest Follow-up
Am
ount
of R
eadi
ng to
Chi
ld
Even Start Control
Amount of Reading to/with Child (Parent Report, range of 0-3)
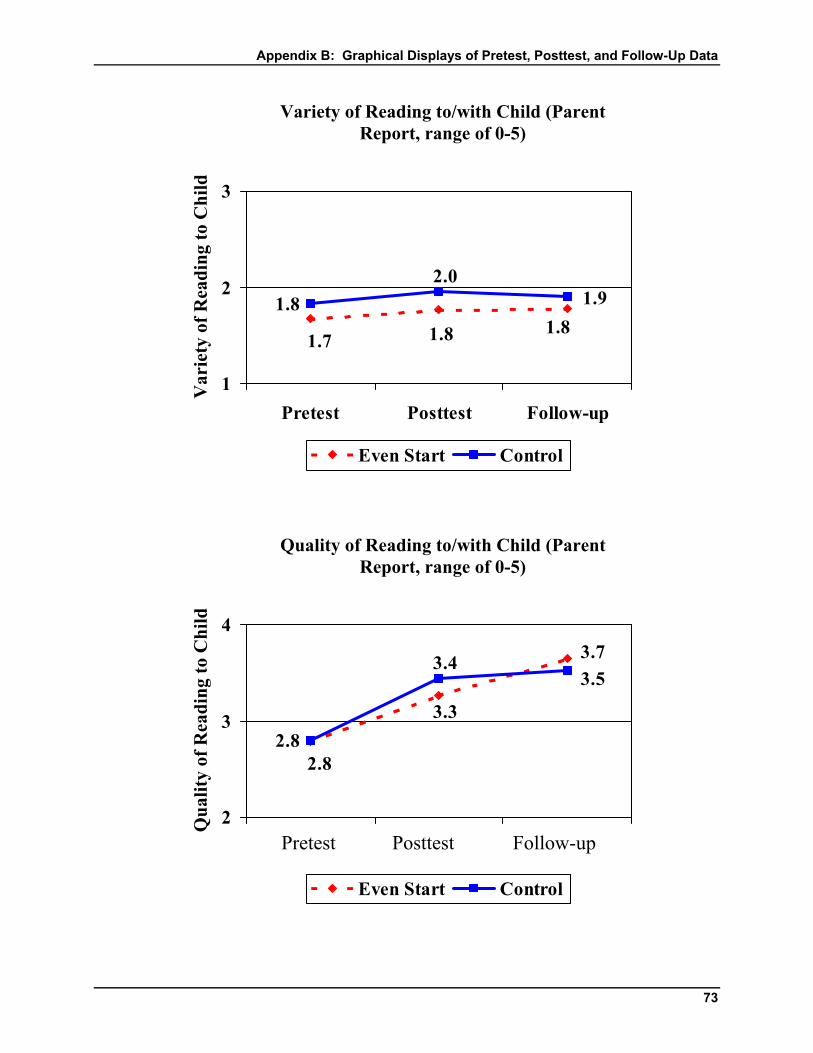
Appendix B: Graphical Displays of Pretest, Posttest, and Follow-Up Data
73
1.7 1.8 1.81.8
2.01.9
1
2
3
Pretest Posttest Follow-up
Var
iety
of R
eadi
ng to
Chi
ld
Even Start Control
Variety of Reading to/with Child (Parent Report, range of 0-5)
2.8
3.3
3.7
2.8
3.43.5
2
3
4
Pretest Posttest 1 Posttest 2
Qua
lity
of R
eadi
ng to
Chi
ld
Even Start Control
Quality of Reading to/with Child (Parent Report, range of 0-5)
Pretest Posttest Follow-up
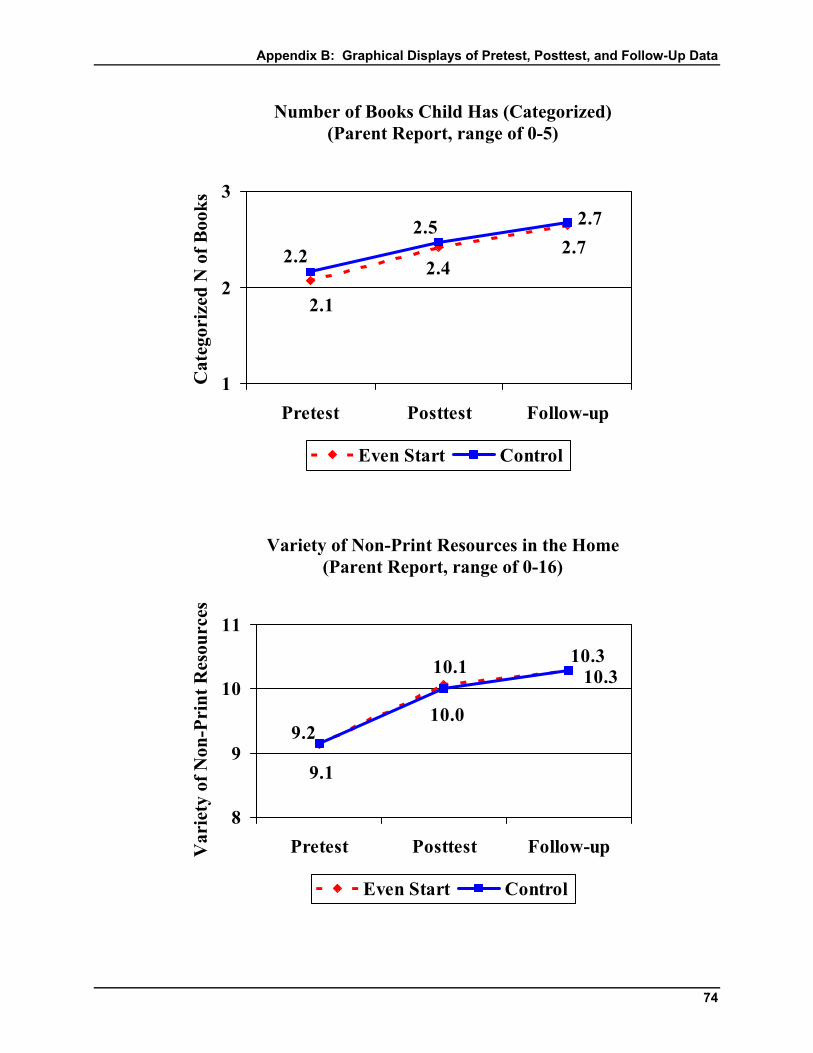
Appendix B: Graphical Displays of Pretest, Posttest, and Follow-Up Data
74
2.1
2.4
2.7
2.22.5
2.7
1
2
3
Pretest Posttest Follow-up
Cat
egor
ized
N o
f Boo
ks
Even Start Control
Number of Books Child Has (Categorized) (Parent Report, range of 0-5)
9.1
10.1 10.3
9.210.0
10.3
8
9
10
11
Pretest Posttest Follow-upVar
iety
of N
on-P
rint
Res
ourc
es
Even Start Control
Variety of Non-Print Resources in the Home (Parent Report, range of 0-16)
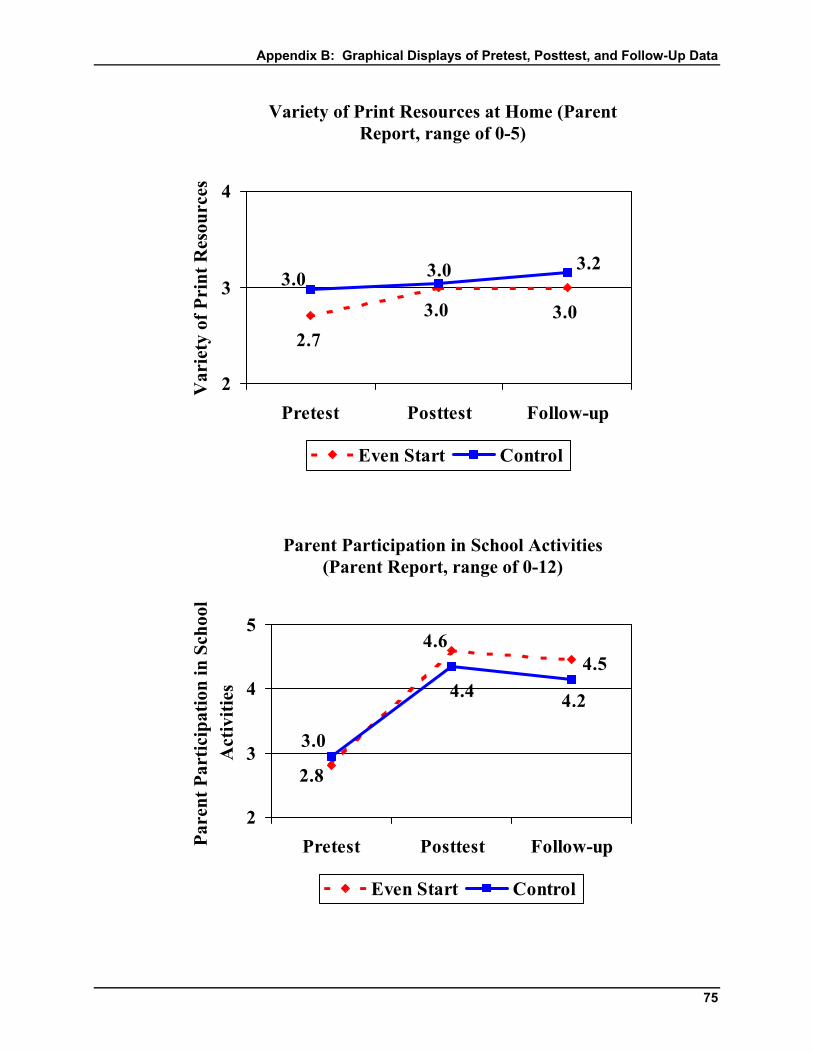
Appendix B: Graphical Displays of Pretest, Posttest, and Follow-Up Data
75
2.7
3.0
3.0
3.03.0
3.2
2
3
4
Pretest Posttest Follow-up
Var
iety
of P
rint
Res
ourc
es
Even Start Control
Variety of Print Resources at Home (Parent Report, range of 0-5)
2.8
4.64.5
3.0
4.4 4.2
2
3
4
5
Pretest Posttest Follow-upPare
nt P
artic
ipat
ion
in S
choo
l A
ctiv
ities
Even Start Control
Parent Participation in School Activities (Parent Report, range of 0-12)
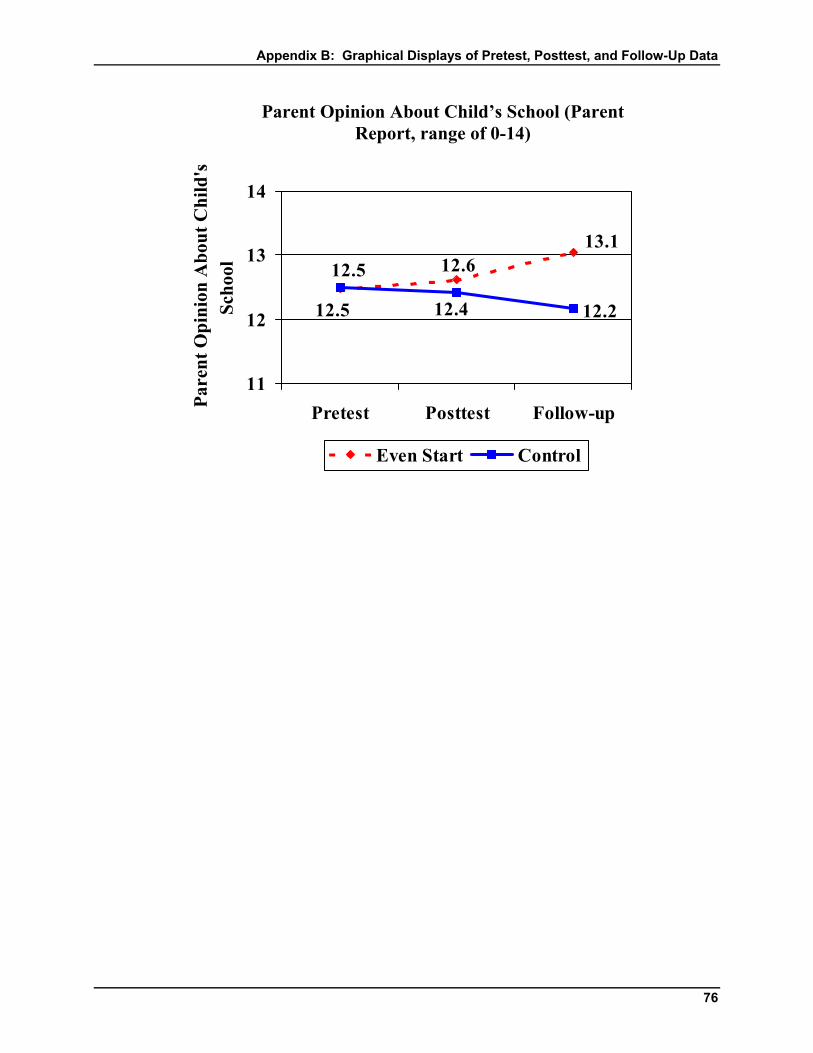
Appendix B: Graphical Displays of Pretest, Posttest, and Follow-Up Data
76
12.5 12.613.1
12.5 12.4 12.2
11
12
13
14
Pretest Posttest Follow-upPare
nt O
pini
on A
bout
Chi
ld's
Sc
hool
Even Start Control
Parent Opinion About Child’s School (Parent Report, range of 0-14)