Embed Size (px)
Citation preview
Experimental Design
Internal Validation
Experimental Design
I. Definition of Experimental Design
II. Simple Experimental Design
III. Complex Experimental Design
IV. Quasi-Experimental Design
V. Threats to Validity
Experimental Design
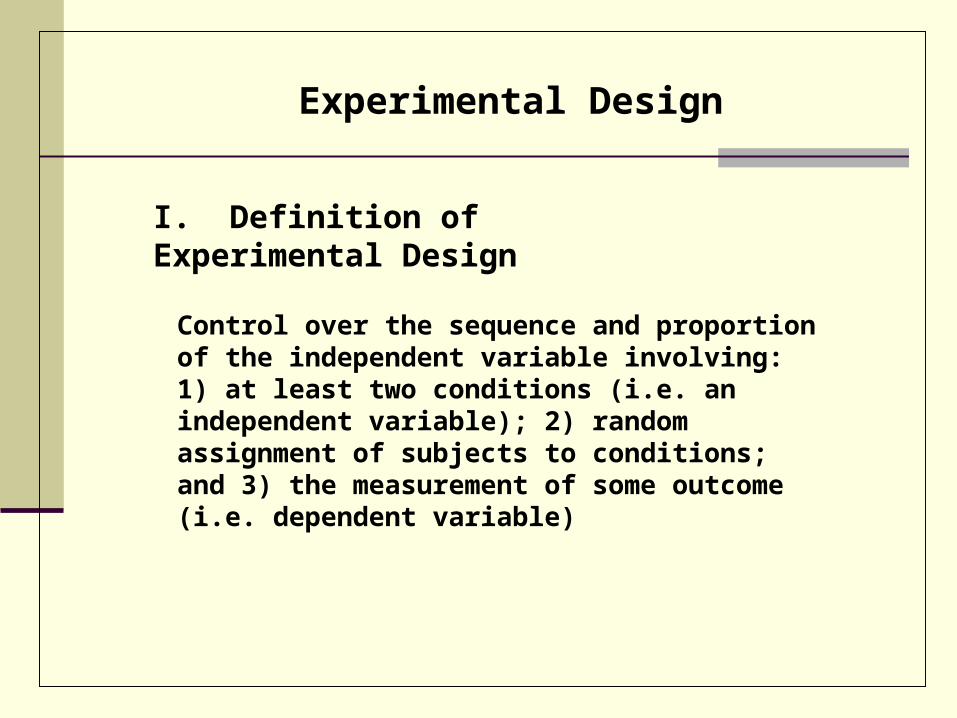
I. Definition of Experimental Design
Control over the sequence and proportion of the independent variable involving: 1) at least two conditions (i.e. an independent variable); 2) random assignment of subjects to conditions; and 3) the measurement of some outcome (i.e. dependent variable)
Experimental Design
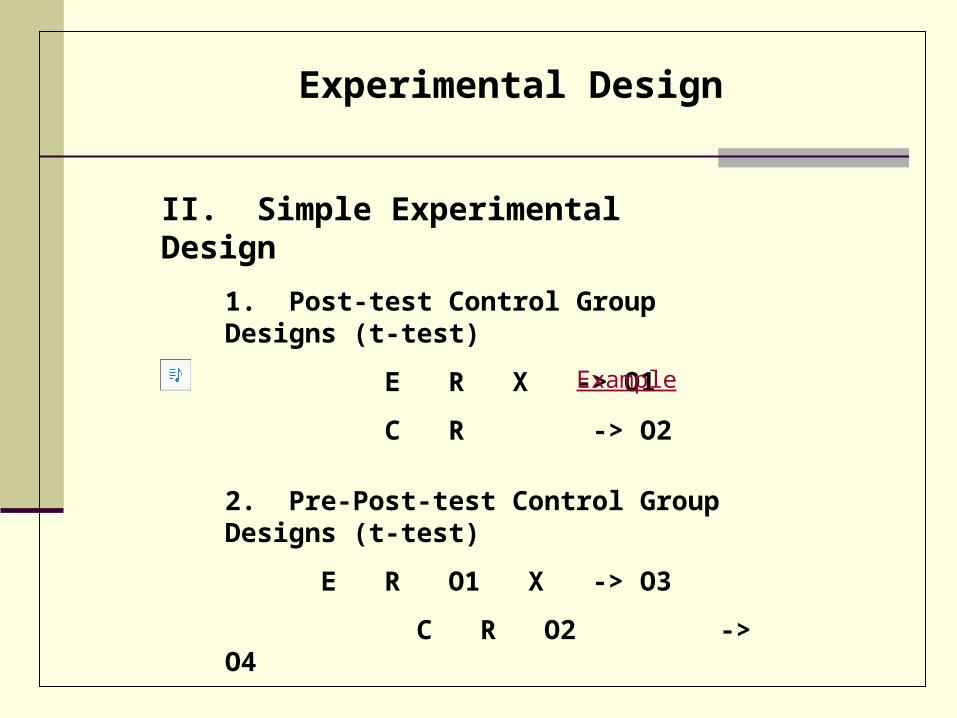
II. Simple Experimental Design
2. Pre-Post-test Control Group Designs (t-test)
E R O1 X -> O3
C R O2 -> O4
1. Post-test Control Group Designs (t-test)
E R X -> O1
C R -> O2 Example
Experimental Design
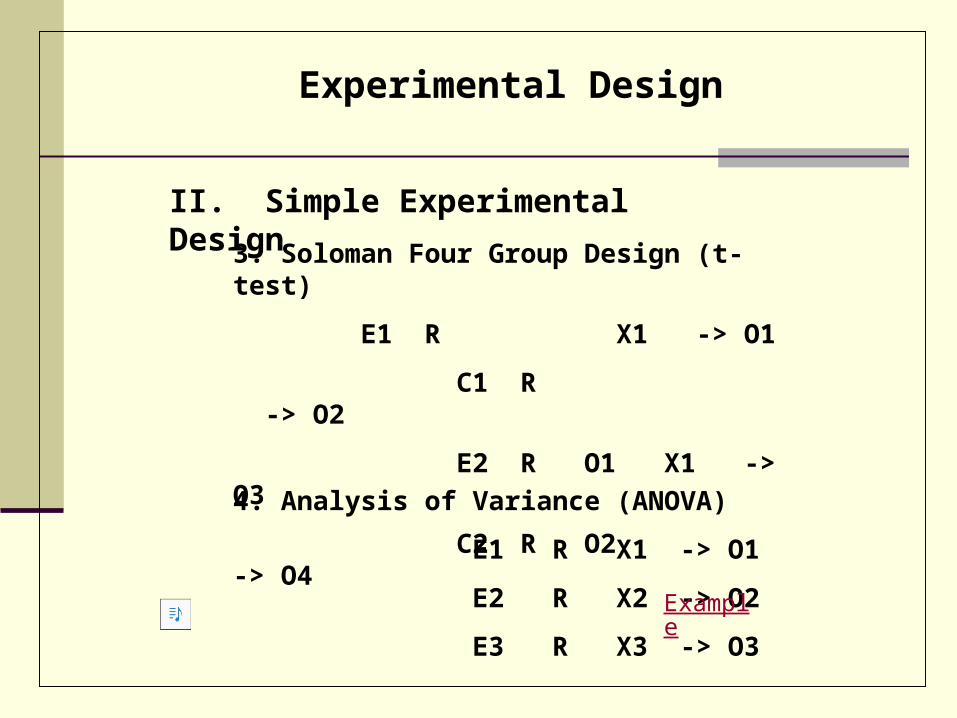
II. Simple Experimental Design
3. Soloman Four Group Design (t-test)
E1 R X1 -> O1
C1 R -> O2
E2 R O1 X1 -> O3
C2 R O2 -> O4
4. Analysis of Variance (ANOVA)
E1 R X1 -> O1
E2 R X2 -> O2
E3 R X3 -> O3
Example
Experimental Design
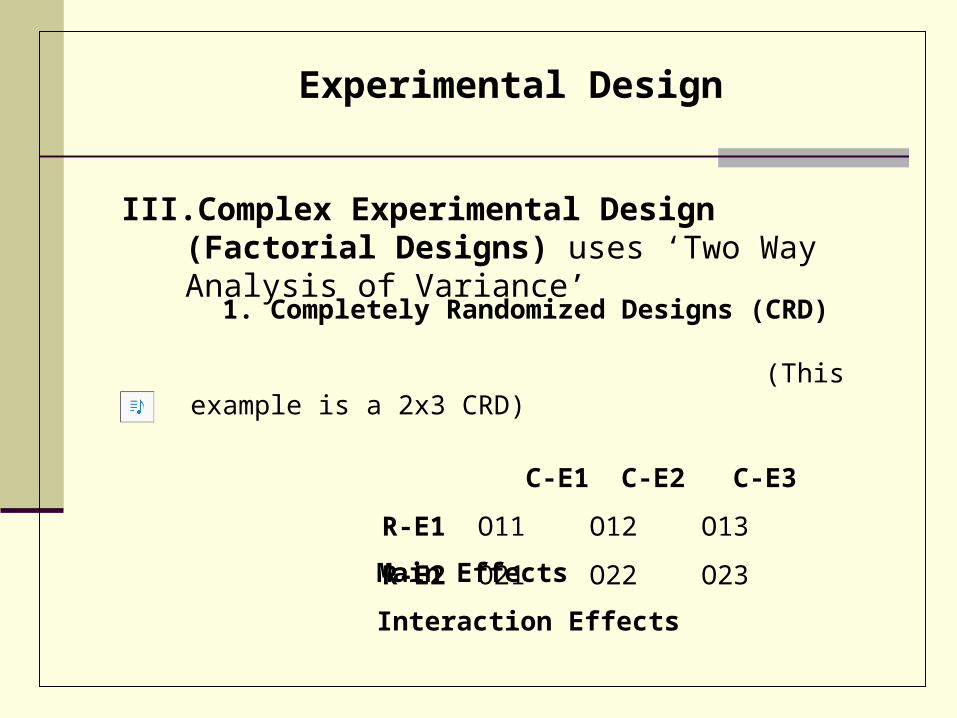
III. Complex Experimental Design (Factorial Designs) uses ‘Two Way Analysis of Variance’
Main Effects
Interaction Effects
1. Completely Randomized Designs (CRD) (This example is a 2x3 CRD)
C-E1 C-E2 C-E3
R-E1 O11 O12 O13
R-E2 O21 O22 O23
Experimental Design
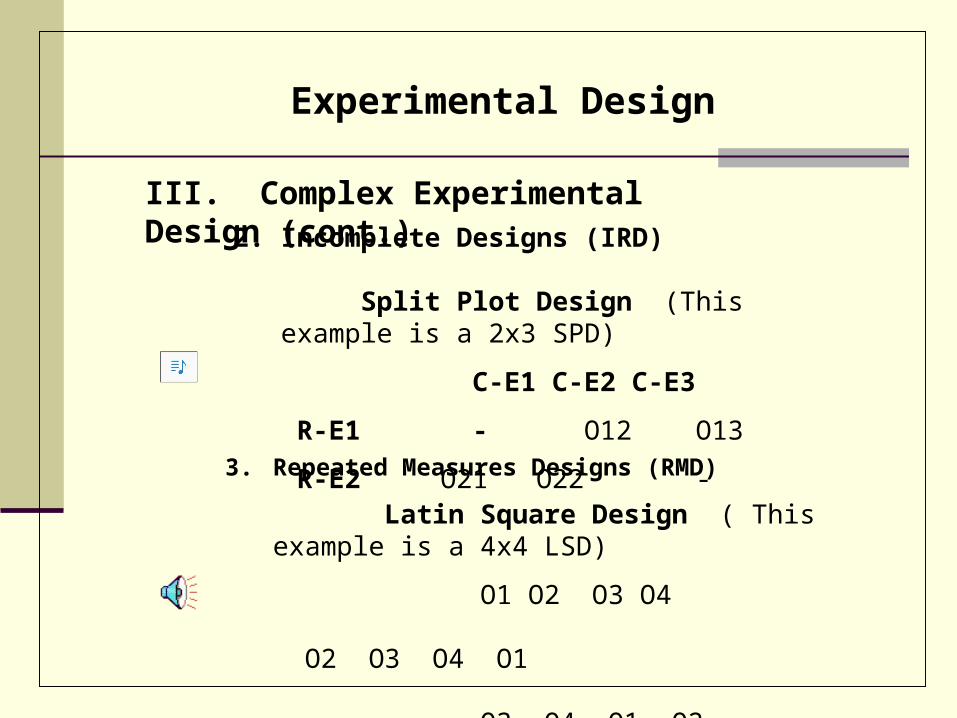
III. Complex Experimental Design (cont.)2. Incomplete Designs (IRD)
Split Plot Design (This example is a 2x3 SPD)
C-E1 C-E2 C-E3
R-E1 - O12 O13
R-E2 O21 O22 -3. Repeated Measures Designs (RMD)
Latin Square Design ( This example is a 4x4 LSD)
O1 O2 O3 O4 O2 O3 O4 O1
O3 O4 O1 O2 O4 O1 O2 O3
Experimental Design
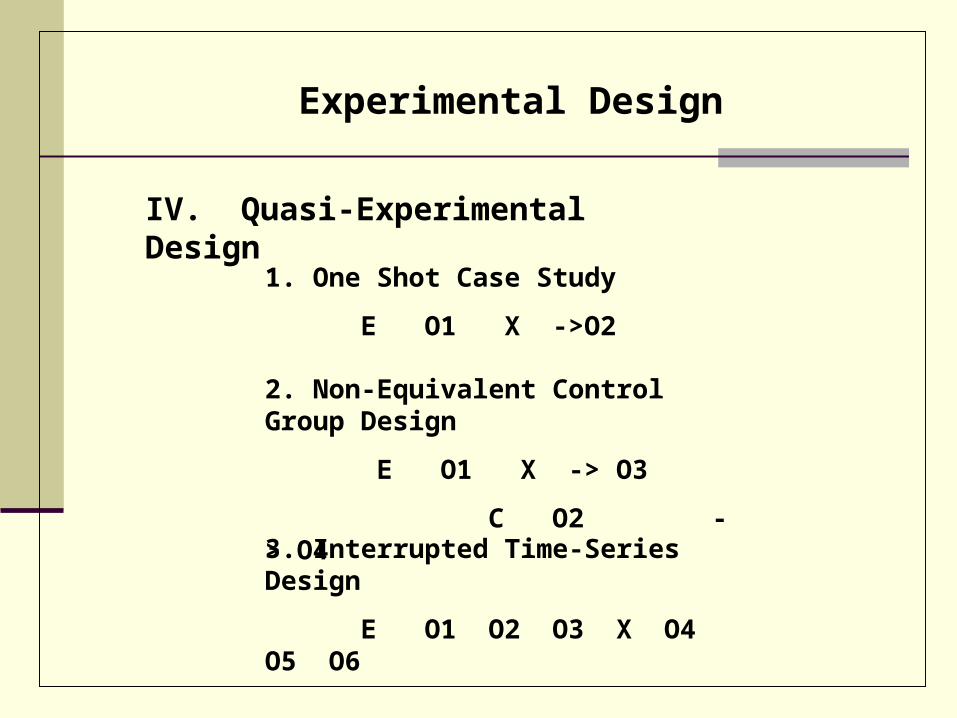
IV. Quasi-Experimental Design
1. One Shot Case Study
E O1 X ->O2
2. Non-Equivalent Control Group Design
E O1 X -> O3
C O2 -> O4 3. Interrupted Time-Series Design
E O1 O2 O3 X O4 O5 O6
Experimental Design
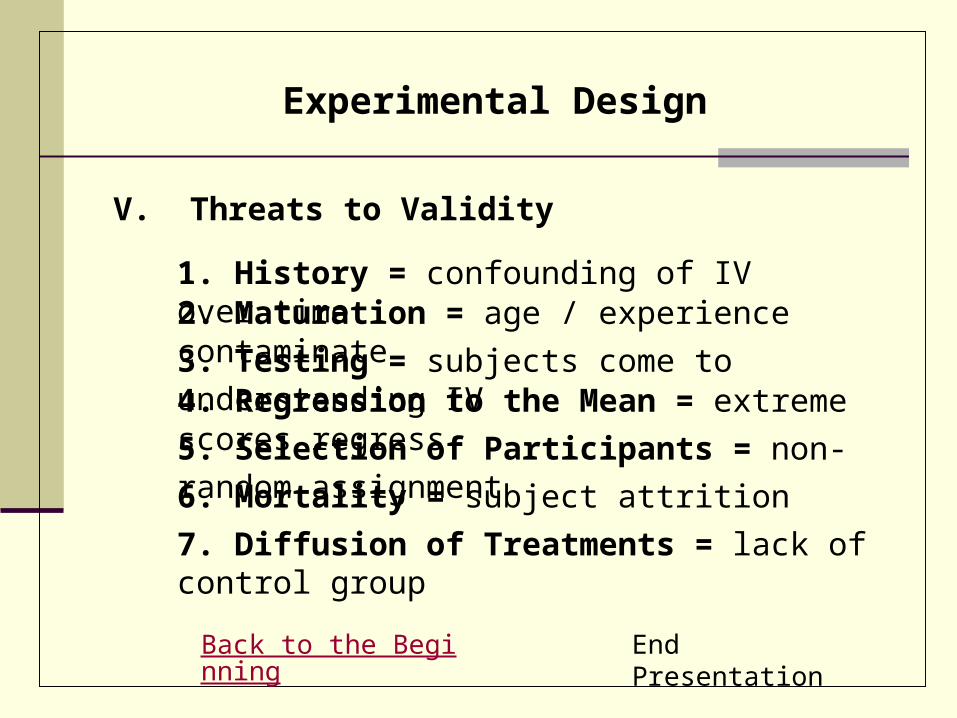
V. Threats to Validity
1. History = confounding of IV over time2. Maturation = age / experience contaminate
3. Testing = subjects come to understanding IV4. Regression to the Mean = extreme scores regress
5. Selection of Participants = non-random assignment
6. Mortality = subject attrition
7. Diffusion of Treatments = lack of control group
Back to the Beginning End Presentation
Two Sample t-test
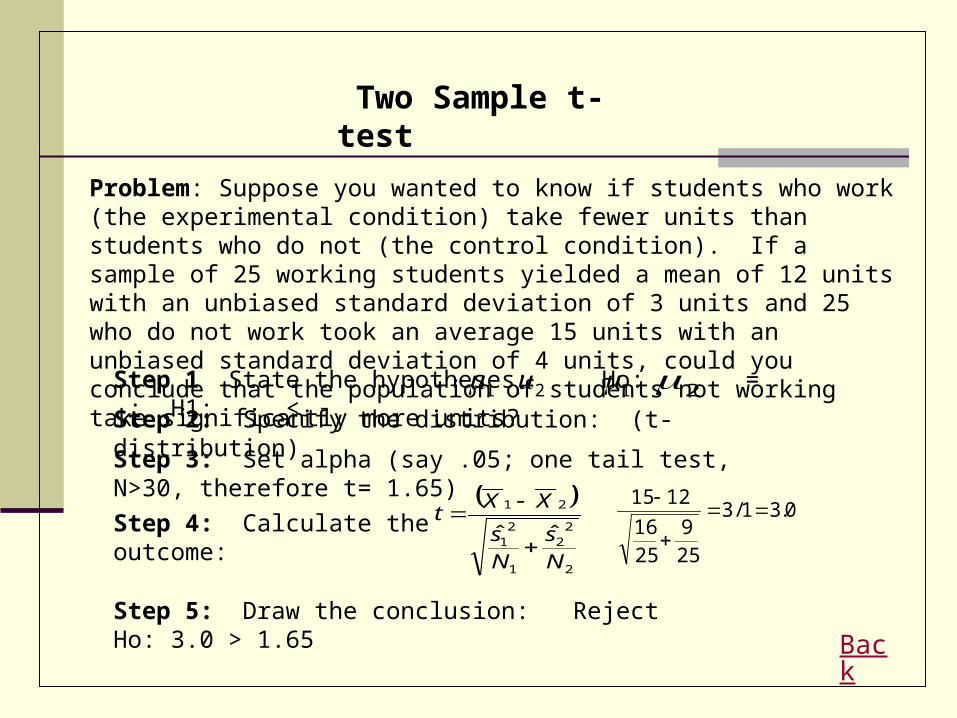
Problem: Suppose you wanted to know if students who work (the experimental condition) take fewer units than students who do not (the control condition). If a sample of 25 working students yielded a mean of 12 units with an unbiased standard deviation of 3 units and 25 who do not work took an average 15 units with an unbiased standard deviation of 4 units, could you conclude that the population of students not working take significantly more units?
Step 2: Specify the distribution: (t-distribution)
Step 3: Set alpha (say .05; one tail test, N>30, therefore t= 1.65)
Step 4: Calculate the outcome:
2
22
1
21
21
ˆˆ
Ns
Ns
XXt
Step 5: Draw the conclusion: Reject Ho: 3.0 > 1.65 Working students take significantly fewer units.
Back
0.31/3
25
9
25
16
1215
Step 1 State the hypotheses: Ho: = ; H1: < 1 2 21
Multiple Sample Test (ANOVA)
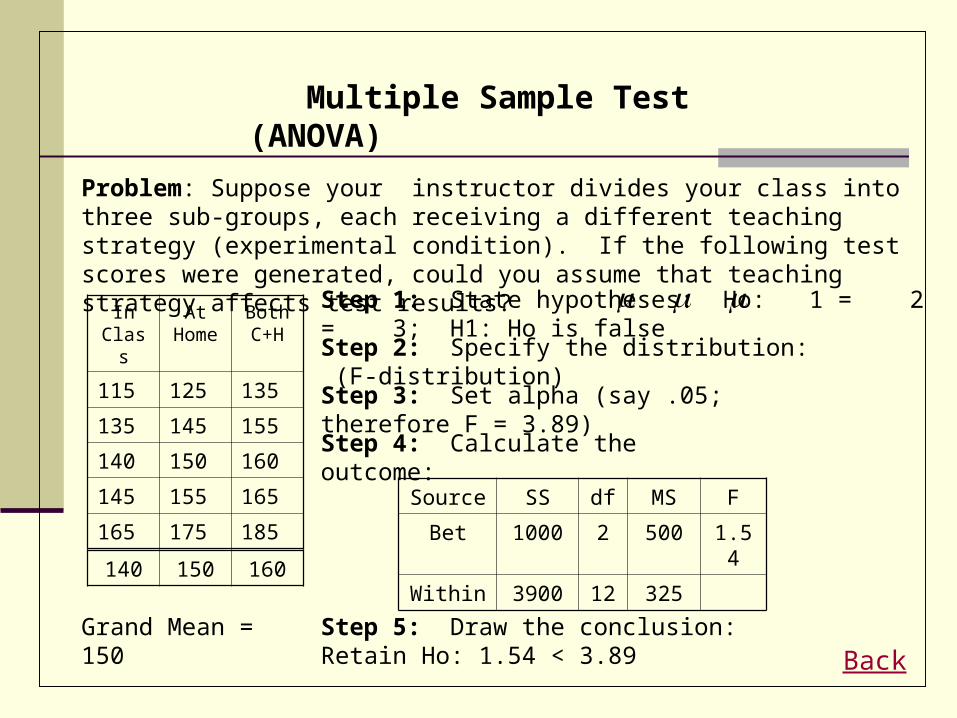
Problem: Suppose your instructor divides your class into three sub-groups, each receiving a different teaching strategy (experimental condition). If the following test scores were generated, could you assume that teaching strategy affects test results?
In Class
At Home
Both C+H
115 125 135
135 145 155
140 150 160
145 155 165
165 175 185
Step 1: State hypotheses: Ho: 1 = 2 = 3; H1: Ho is false
Back
Step 2: Specify the distribution: (F-distribution)
Step 3: Set alpha (say .05; therefore F = 3.89)
Step 4: Calculate the outcome:
Source SS df MS F
Bet 1000 2 500 1.54
Within 3900 12 325
Step 5: Draw the conclusion: Retain Ho: 1.54 < 3.89 Type of instruction does not influence test scores.
Grand Mean = 150
140 150 160