Embed Size (px)
Citation preview

The evolution of the IT industry in India – opportunities for ASIA
Srinath Batni

Indian IT-BPO industry revenue crossesUSD 100 billion
INDIAN IT-BPO INDUSTRY
Note: 1) Exports (IT services, software products, OSPD, ER&D, BPO, hardware); Domestic (Hardware, IT services (incl. ER&D), S/W products, BPO)E: Estimate
Source: World Bank, NASSCOM
•Total revenue: ~USD 101 billion
•Relative to India’s GDP: ~7.5 per cent
•Relative to merchandise exports: ~25%
•Value add: 60-70 per cent
•Exports CAGR: 17 per cent for last 5 years
•Domestic CAGR in USD: ~10 per cent – reflects impact of variable rupee
4147 50
59
69
22 22 2429 32
6.4%6.7% 6.5%
7.1%7.5%
FY2008 FY2009 FY2010 FY2011 FY2012E
Exports Domestic Percentage of GDP
USD billionIT-BPO revenue aggregate1
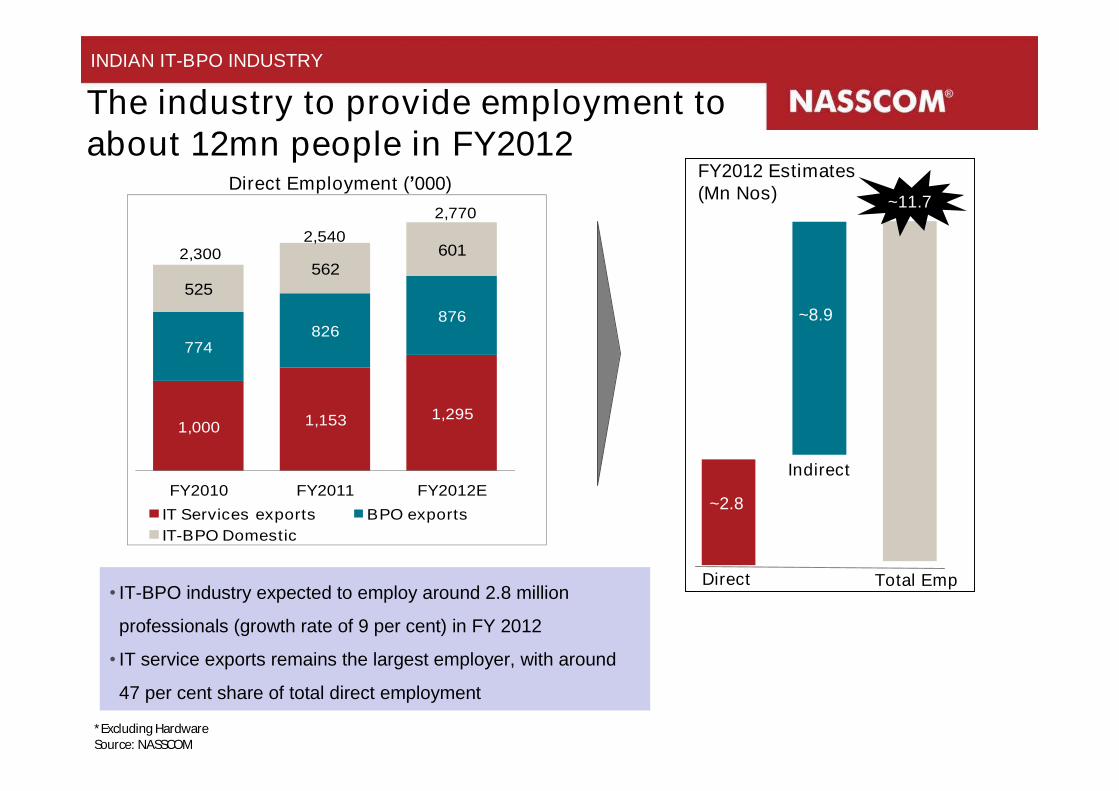
The industry to provide employment to about 12mn people in FY2012
INDIAN IT-BPO INDUSTRY
*Excluding HardwareSource: NASSCOM
1,000 1,153 1,295
774826
876
525562
601
FY2010 FY2011 FY2012EIT Services exports BPO exportsIT-BPO Domestic
2,300
2,7702,540
Direct Employment (’000)
• IT-BPO industry expected to employ around 2.8 million
professionals (growth rate of 9 per cent) in FY 2012
• IT service exports remains the largest employer, with around
47 per cent share of total direct employment
FY2012 Estimates (Mn Nos)
Indirect
Direct Total Emp
~10.2mn
~2.8
~11.7
~8.9
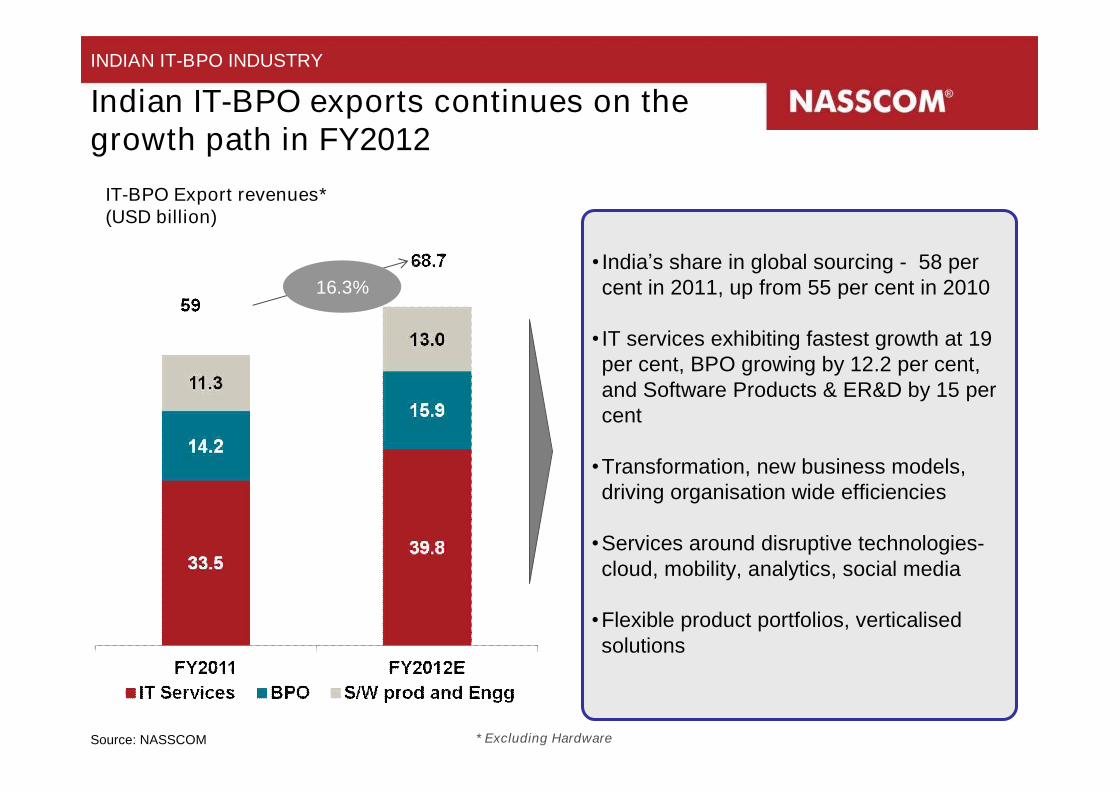
Indian IT-BPO exports continues on the growth path in FY2012
IT-BPO Export revenues*(USD billion)
16.3%
Source: NASSCOM * Excluding Hardware
• India’s share in global sourcing - 58 per cent in 2011, up from 55 per cent in 2010
• IT services exhibiting fastest growth at 19 per cent, BPO growing by 12.2 per cent, and Software Products & ER&D by 15 per cent
•Transformation, new business models, driving organisation wide efficiencies
•Services around disruptive technologies-cloud, mobility, analytics, social media
•Flexible product portfolios, verticalised solutions
INDIAN IT-BPO INDUSTRY
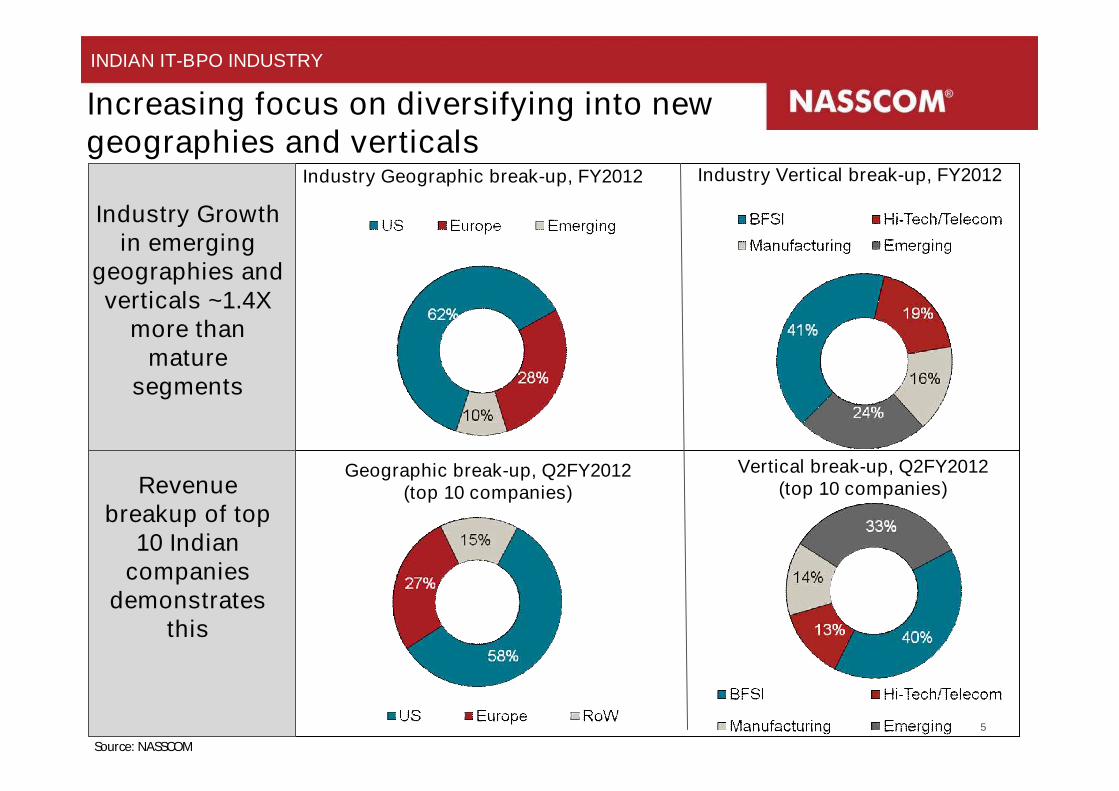
Increasing focus on diversifying into newgeographies and verticals
INDIAN IT-BPO INDUSTRY
Source: NASSCOM
Industry Vertical break-up, FY2012
5
19.5%
17%
21%
Industry Geographic break-up, FY2012
Vertical break-up, Q2FY2012 (top 10 companies)
Geographic break-up, Q2FY2012 (top 10 companies)
Industry Growth in emerging
geographies and verticals ~1.4X
more than mature
segments
Revenue breakup of top
10 Indian companies
demonstrates this

Creating an industry with rapidly evolving capabilities, in sync with customers
INDIAN IT-BPO INDUSTRY
Indian MNC- global talent, international footprint
Growth from new markets
Collaborative Customer relationship
Presence in 70+ countries through onsite, nearshore model, 3-4 per cent foreign employees
Enhanced client relations -vendor to partnerships, augmented sales teams
Partnerships, Alliances and M&A
SMBs as a % of total revenues
Number of global centers
YoY growth of sales personnel
Continued focus on enhancing capability through M&A, global partnerships and alliances
M&A deal value, USD billion
Changing GIC modelGIC model rapidly evolving towards high end services and management roles
Captive centers opened in India
Industry able to expand to new geographies and verticals and customer segments
Source: NASSCOM

7
India’s technology and business services export market in 2020 – scenarios*
USD billion
Industry’s potential in the future
Likely scenario
Growth multiple
CAGR
FY 2020- Focused Initiatives and Innovation - driven growth
225-310 135
•Expedited reforms in tertiary education•10-15 Tier II cities with world class infrastructure•Adoption of new business models by the industry•India among the top 3 innovation hubs of the world•Talent pool of 13.5 million
7.7x 18.6%
FY 2020- Current Initiatives
•Slow pace of reforms in education (talent pool of 10 million)•Limited development of Tier II, III cities•Continued trust as a sourcing hub•Continued government support•Limited lash back from protectionism
4.4x 13%
175
FY 2008
40

Impact of the industry on the Indian economy

Lasting, Sustainable and Phenomenal contribution over the last decade
Contributing to India’s economy
Empowering the diverse human assets
Putting India on the Global map
Socially responsible and inclusive
Driving Balanced Regional Development
Creating Innovation Platform
Multi-fold impact on the
Indian Economy
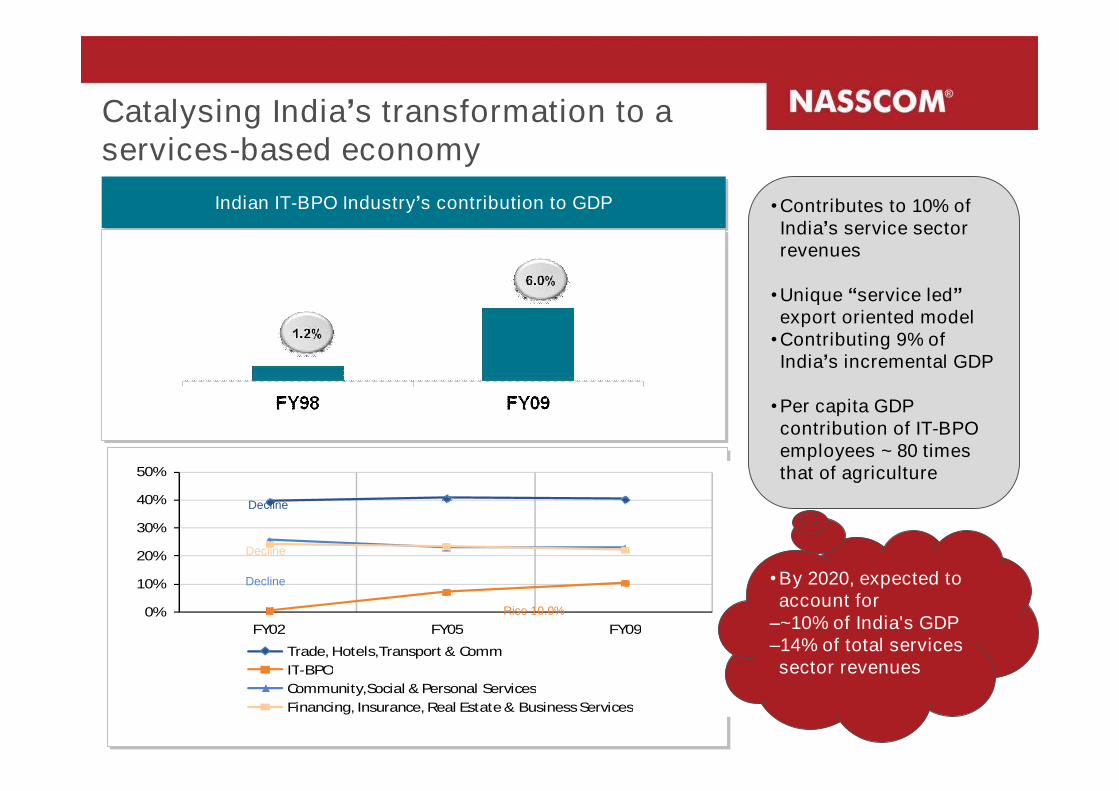
Catalysing India’s transformation to a services-based economy
0%
10%
20%
30%
40%
50%
FY02 FY05 FY09
Trade, Hotels,Transport & CommIT-BPOCommunity,Social & Personal ServicesFinancing, Insurance, Real Estate & Business Services
Decline
Decline
Decline
Rise 10.0%
•Contributes to 10% of India’s service sector revenues
•Unique “service led”export oriented model•Contributing 9% of India’s incremental GDP
•Per capita GDP contribution of IT-BPO employees ~ 80 times that of agriculture
Indian IT-BPO Industry’s contribution to GDPIndian IT-BPO Industry’s contribution to GDP
•By 2020, expected to account for–~10% of India's GDP–14% of total services sector revenues

Contributes 14% to India’s total exports
Modified India’s export mix from traditional commodities to services
Modified India’s export mix from traditional commodities to services
Grown twice as fast as the total Indian exports over the past decade*
Grown twice as fast as the total Indian exports over the past decade*
67.1
331.2
4.147.1
FY00 FY09
Exp
orts
(U
SD
bil
lio
n)
Total Indian Exports Indian IT-BPO Exports
~5x
FY00 FY09
IT-BPO
Primary
Petroleum Products
Manufacturing
others
~11.5x
$332 bn
119.5
107.0
29.4
29.047.1
$67 bn
Expected to account for 18-20% of total India’s exports in 2020
*Includes invisibles, Primary – includes agriculture and mining
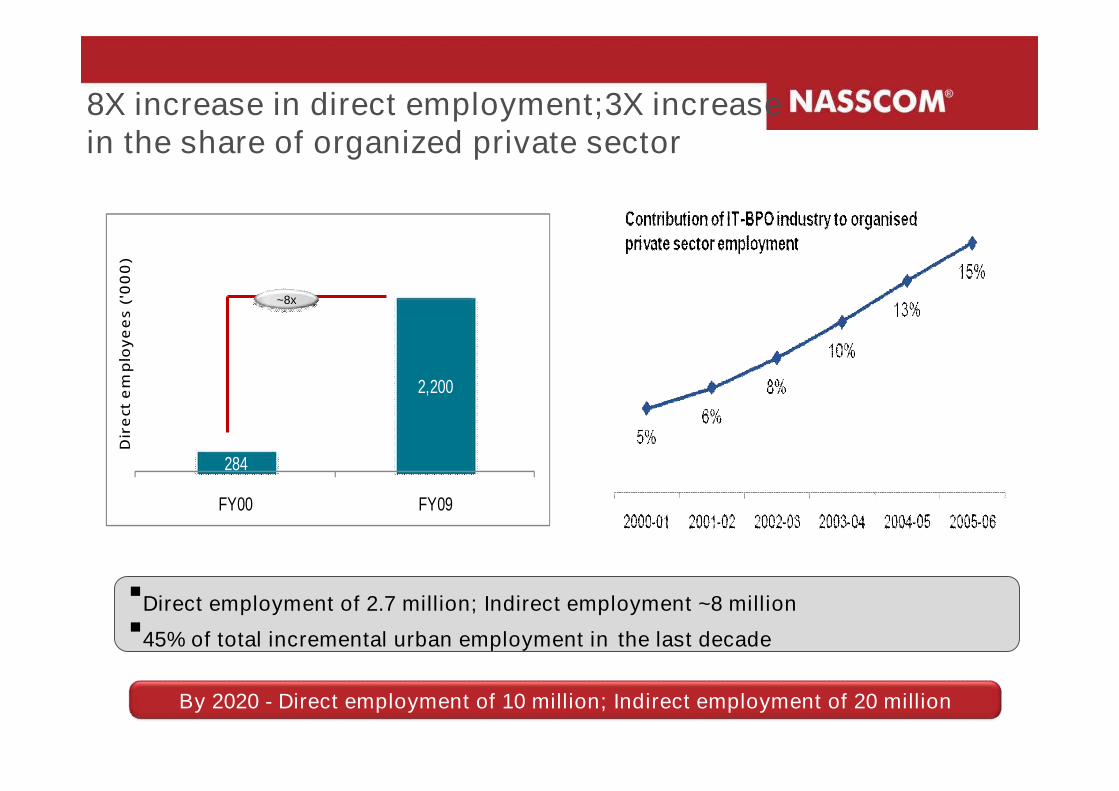
8X increase in direct employment;3X increase in the share of organized private sector
284
2,200
FY00 FY09
Dir
ect
em
plo
ye
es
('0
00
)
Direct employment of 2.7 million; Indirect employment ~8 million45% of total incremental urban employment in the last decade
~8x
By 2020 - Direct employment of 10 million; Indirect employment of 20 million
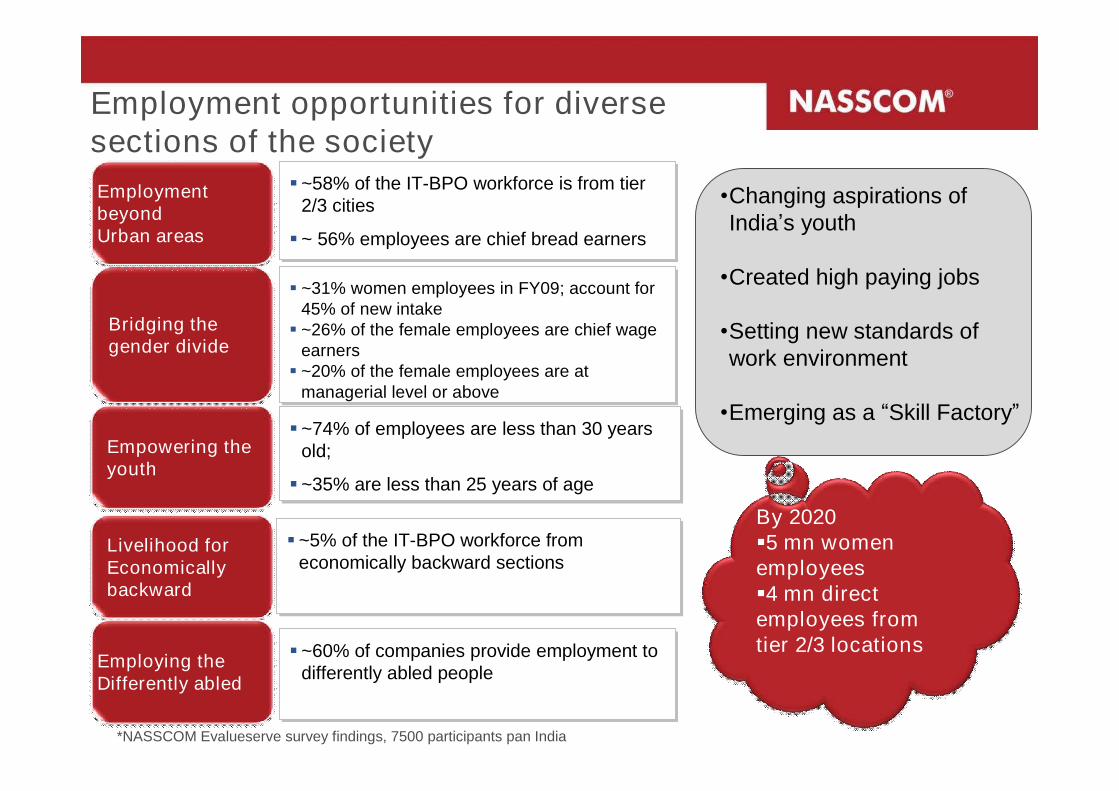
Employment opportunities for diverse sections of the society
Livelihood forEconomically backward
Empowering the youth
Bridging the gender divide
Employment beyondUrban areas
Employing the Differently abled
~5% of the IT-BPO workforce from economically backward sections ~5% of the IT-BPO workforce from
economically backward sections
~74% of employees are less than 30 years old;
~35% are less than 25 years of age
~74% of employees are less than 30 years old;
~35% are less than 25 years of age
~31% women employees in FY09; account for 45% of new intake ~26% of the female employees are chief wage
earners ~20% of the female employees are at
managerial level or above
~31% women employees in FY09; account for 45% of new intake ~26% of the female employees are chief wage
earners ~20% of the female employees are at
managerial level or above
~58% of the IT-BPO workforce is from tier 2/3 cities
~ 56% employees are chief bread earners
~58% of the IT-BPO workforce is from tier 2/3 cities
~ 56% employees are chief bread earners
~60% of companies provide employment to differently abled people ~60% of companies provide employment to
differently abled people
•Changing aspirations of India’s youth
•Created high paying jobs
•Setting new standards of work environment
•Emerging as a “Skill Factory”
By 2020 5 mn women employees4 mn direct employees from tier 2/3 locations
*NASSCOM Evalueserve survey findings, 7500 participants pan India

Significant downstream impact - employees spent ~$14.5Bn
$ .7Bn$ .7Bn
$ 1.4Bn$ 1.4Bn
$ 1.3Bn$ 1.3Bn
$ 1.1Bn$ 1.1Bn
$ .8Bn$ .8Bn
~8% of the revenues of
the Entertainment
industry
~2.5% of the Healthcare
sector revenues
~7% of the Hotel and
Restaurant industry revenues
~3.5% of the consumption in the Textile
sector
Accounts for around 3% of
the revenues in the telecom
industry
~4% of the consumption of the Consumer
Durables sector
Actual value spent in FY09
Actual value spent in FY09
$ .8Bn$ .8Bn

Fuelling India’s Growth - ~ $2.8Bn direct taxes paid in FY09
Employees$ 1.3Bn
Employees$ 1.3Bn
Companies$ 1.5Bn
Companies$ 1.5Bn
$ 1.9Bn$ 1.9Bn
Direct Tax Contribution by IT-BPO Companies
Direct Tax Contribution by IT-BPO Companies
Tax Benefits to Industry
Tax Benefits to Industry
$ 2.8Bn
By 2020: Direct tax contribution of companies ~ $ 7.2Bn; Direct tax contribution of employees ~ $25.6Bn
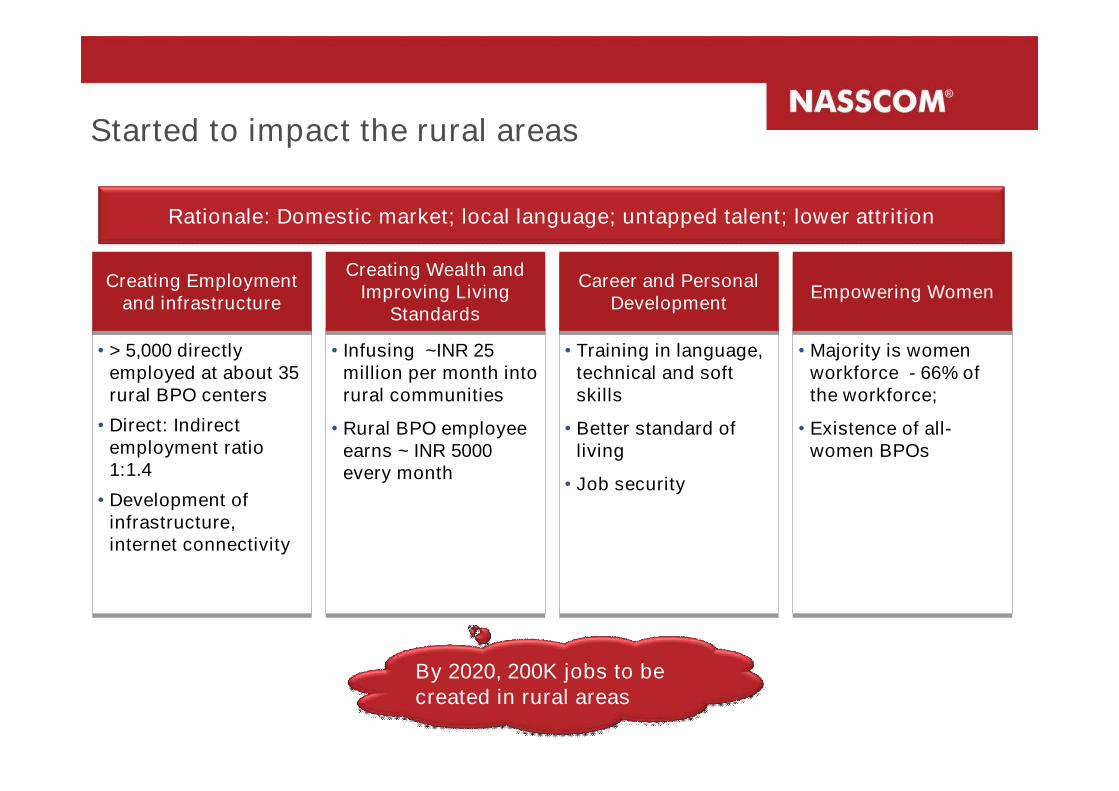
Started to impact the rural areas
• > 5,000 directly employed at about 35 rural BPO centers
• Direct: Indirect employment ratio 1:1.4
• Development of infrastructure, internet connectivity
• > 5,000 directly employed at about 35 rural BPO centers
• Direct: Indirect employment ratio 1:1.4
• Development of infrastructure, internet connectivity
Creating Employment and infrastructure
Creating Employment and infrastructure
• Infusing ~INR 25 million per month into rural communities
• Rural BPO employee earns ~ INR 5000 every month
• Infusing ~INR 25 million per month into rural communities
• Rural BPO employee earns ~ INR 5000 every month
Creating Wealth and Improving Living
Standards
Creating Wealth and Improving Living
Standards
• Training in language, technical and soft skills
• Better standard of living
• Job security
• Training in language, technical and soft skills
• Better standard of living
• Job security
Career and Personal Development
Career and Personal Development
• Majority is women workforce - 66% of the workforce;
• Existence of all-women BPOs
• Majority is women workforce - 66% of the workforce;
• Existence of all-women BPOs
Empowering WomenEmpowering Women
Rationale: Domestic market; local language; untapped talent; lower attrition
By 2020, 200K jobs to be created in rural areas
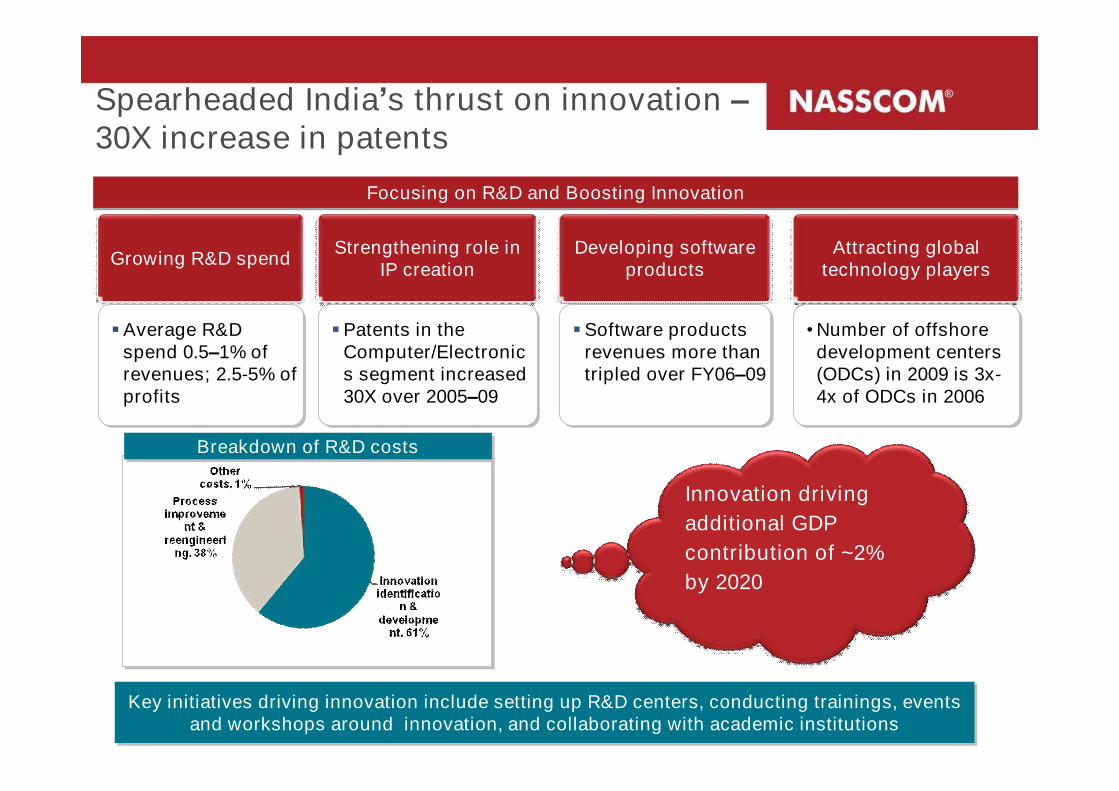
Focusing on R&D and Boosting InnovationFocusing on R&D and Boosting Innovation
Growing R&D spend Strengthening role in IP creation
Developing software products
Attracting global technology players
Average R&D spend 0.5–1% of revenues; 2.5-5% of profits
Average R&D spend 0.5–1% of revenues; 2.5-5% of profits
Patents in the Computer/Electronics segment increased 30X over 2005–09
Patents in the Computer/Electronics segment increased 30X over 2005–09
Software products revenues more than tripled over FY06–09
Software products revenues more than tripled over FY06–09
•Number of offshore development centers (ODCs) in 2009 is 3x-4x of ODCs in 2006
•Number of offshore development centers (ODCs) in 2009 is 3x-4x of ODCs in 2006
Breakdown of R&D costsBreakdown of R&D costs
Spearheaded India’s thrust on innovation –30X increase in patents
Innovation driving additional GDP contribution of ~2% by 2020
Key initiatives driving innovation include setting up R&D centers, conducting trainings, events and workshops around innovation, and collaborating with academic institutions
Key initiatives driving innovation include setting up R&D centers, conducting trainings, events and workshops around innovation, and collaborating with academic institutions
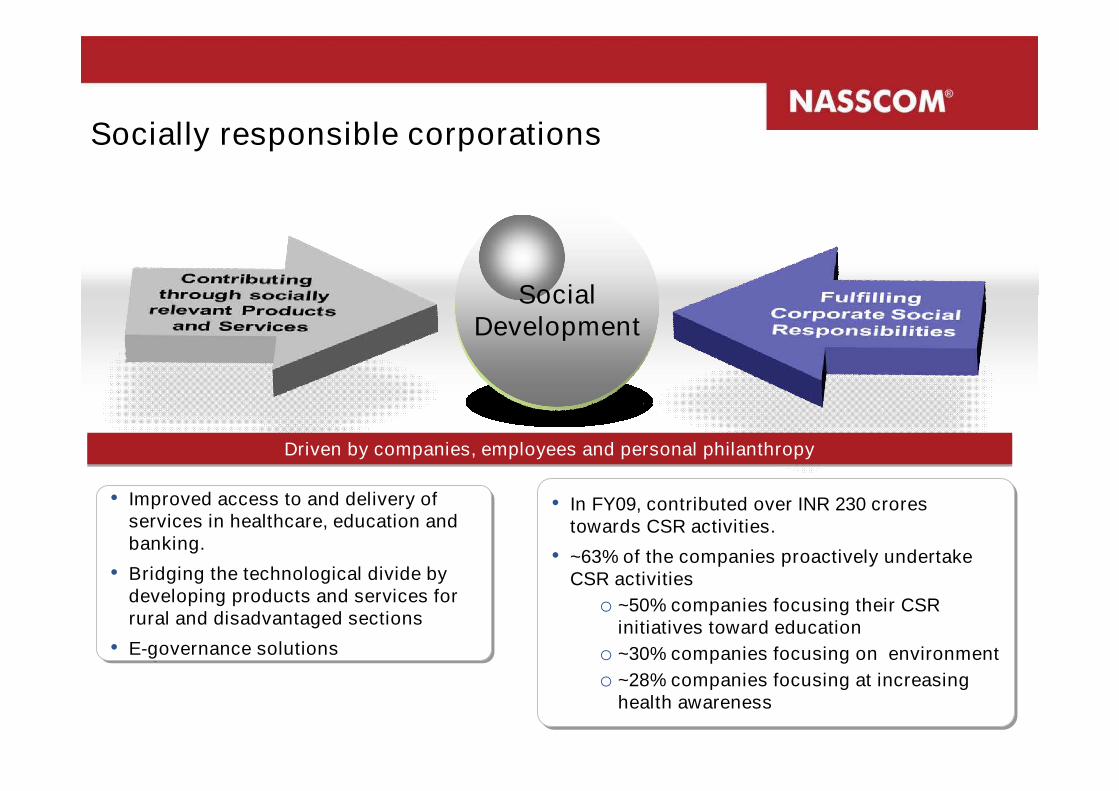
Social Development
• Improved access to and delivery of services in healthcare, education and banking.
• Bridging the technological divide by developing products and services for rural and disadvantaged sections
• E-governance solutions
• Improved access to and delivery of services in healthcare, education and banking.
• Bridging the technological divide by developing products and services for rural and disadvantaged sections
• E-governance solutions
• In FY09, contributed over INR 230 crores towards CSR activities.
• ~63% of the companies proactively undertake CSR activities
o ~50% companies focusing their CSR initiatives toward education
o ~30% companies focusing on environmento ~28% companies focusing at increasing
health awareness
• In FY09, contributed over INR 230 crores towards CSR activities.
• ~63% of the companies proactively undertake CSR activities
o ~50% companies focusing their CSR initiatives toward education
o ~30% companies focusing on environmento ~28% companies focusing at increasing
health awareness
Socially responsible corporations
Driven by companies, employees and personal philanthropyDriven by companies, employees and personal philanthropy
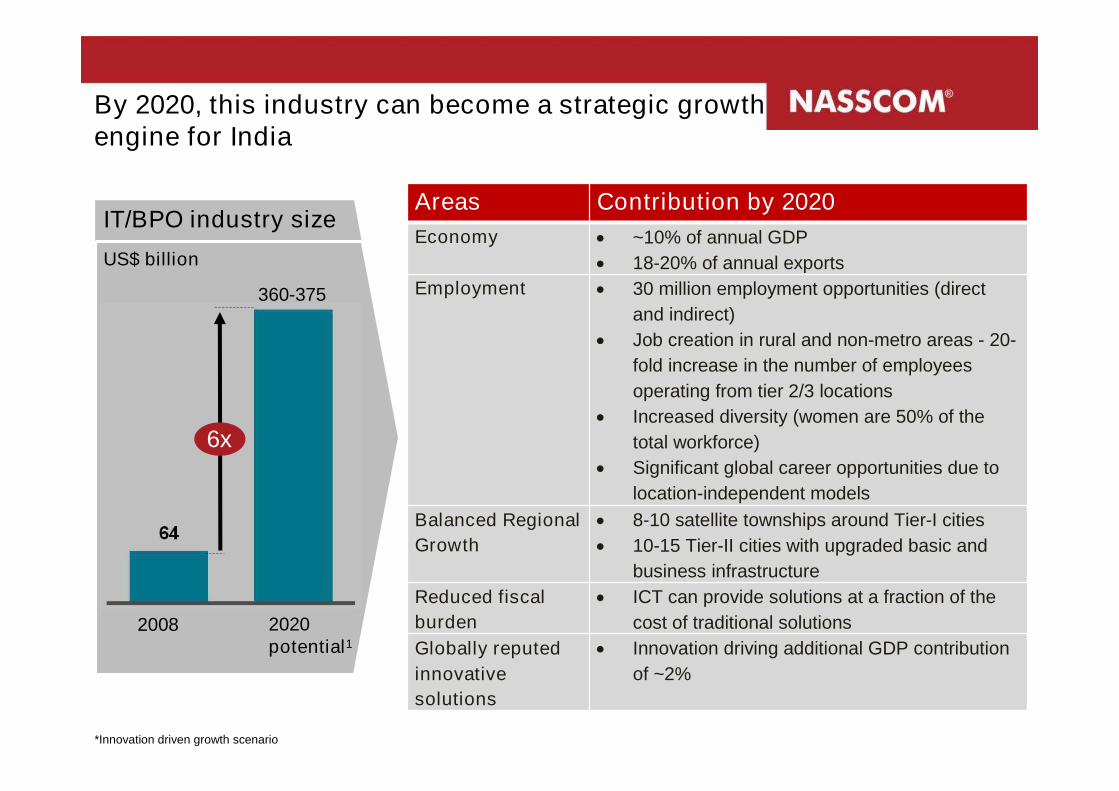
By 2020, this industry can become a strategic growth engine for India
IT/BPO industry sizeUS$ billion
360-375
2020 potential1
2008
6x
*Innovation driven growth scenario
Areas Contribution by 2020Economy ~10% of annual GDP
18-20% of annual exportsEmployment 30 million employment opportunities (direct
and indirect) Job creation in rural and non-metro areas - 20-
fold increase in the number of employees operating from tier 2/3 locations
Increased diversity (women are 50% of the total workforce)
Significant global career opportunities due to location-independent models
Balanced Regional Growth
8-10 satellite townships around Tier-I cities 10-15 Tier-II cities with upgraded basic and
business infrastructureReduced fiscal burden
ICT can provide solutions at a fraction of the cost of traditional solutions
Globally reputed innovative solutions
Innovation driving additional GDP contribution of ~2%

20
NASSCOM agenda going forward
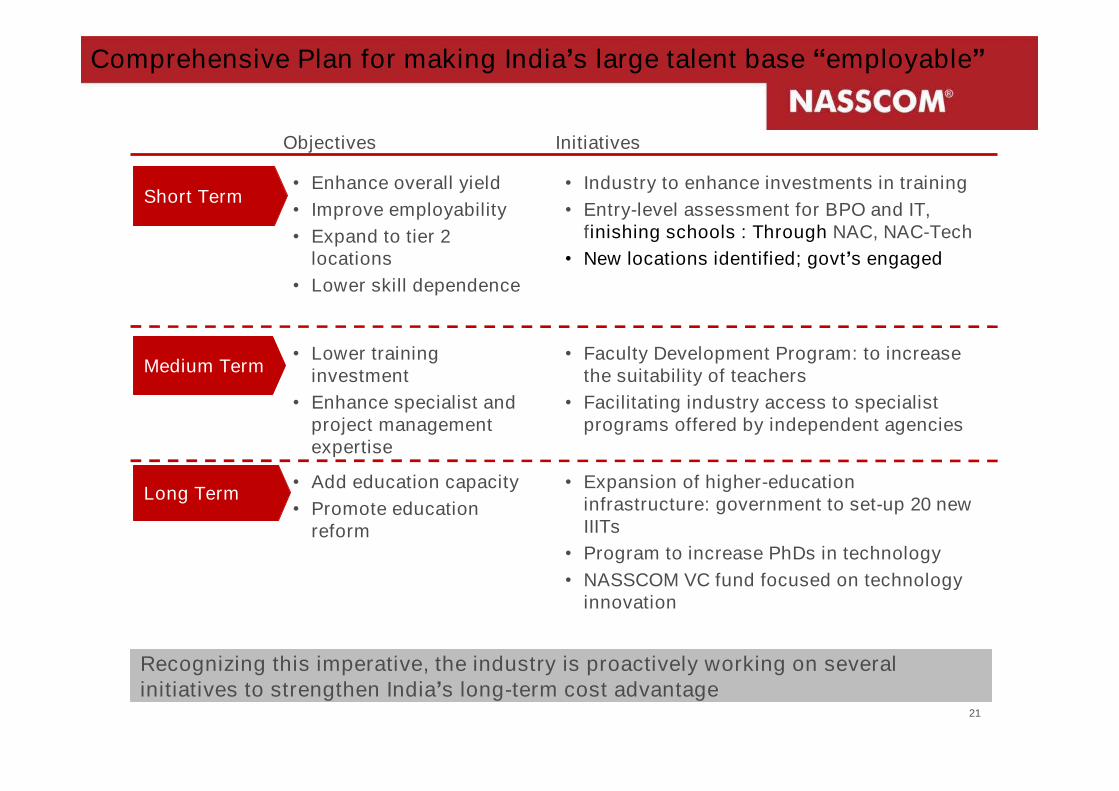
Comprehensive Plan for making India’s large talent base “employable”
Recognizing this imperative, the industry is proactively working on several initiatives to strengthen India’s long-term cost advantage
Short Term
Medium Term
Long Term
• Enhance overall yield• Improve employability• Expand to tier 2
locations• Lower skill dependence
Objectives Initiatives
• Industry to enhance investments in training • Entry-level assessment for BPO and IT,
finishing schools : Through NAC, NAC-Tech• New locations identified; govt’s engaged
• Lower training investment
• Enhance specialist and project management expertise
• Add education capacity• Promote education
reform
• Faculty Development Program: to increase the suitability of teachers
• Facilitating industry access to specialist programs offered by independent agencies
• Expansion of higher-education infrastructure: government to set-up 20 new IIITs
• Program to increase PhDs in technology• NASSCOM VC fund focused on technology
innovation
21
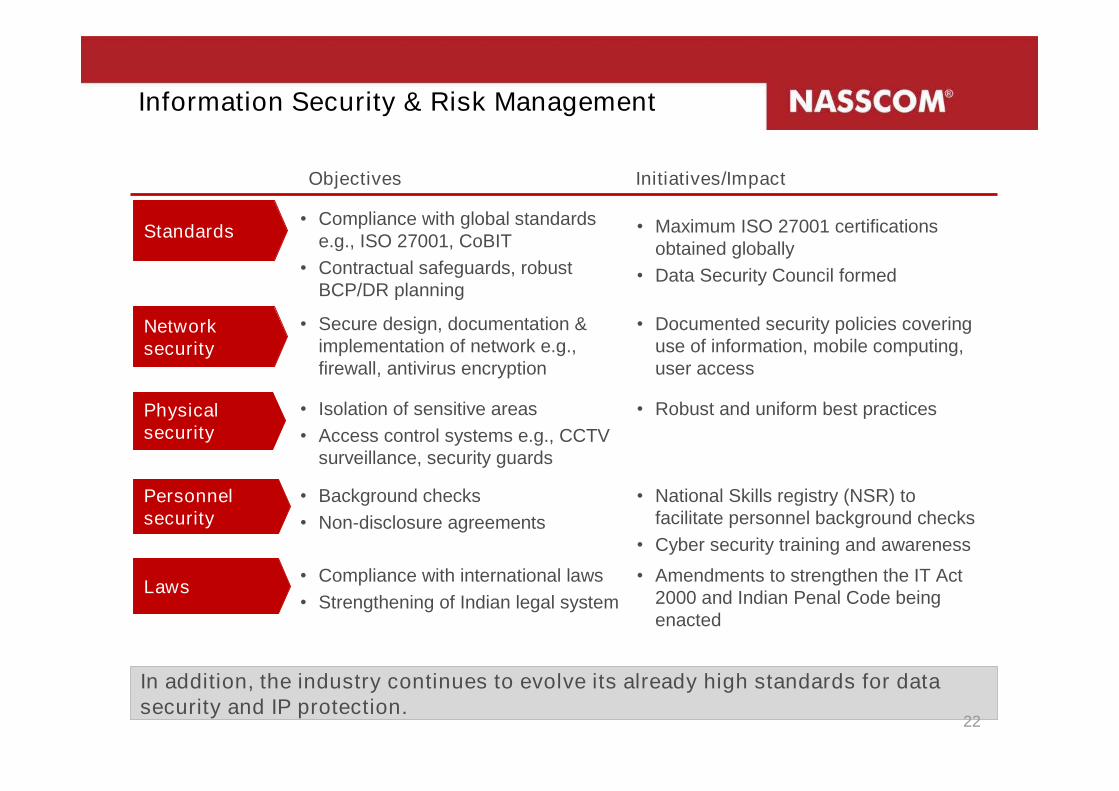
Information Security & Risk Management
Standards
Physical security
Personnel security
• Compliance with global standards e.g., ISO 27001, CoBIT
• Contractual safeguards, robust BCP/DR planning
Network security
Laws
• Secure design, documentation & implementation of network e.g., firewall, antivirus encryption
• Isolation of sensitive areas• Access control systems e.g., CCTV
surveillance, security guards
• Background checks• Non-disclosure agreements
• Compliance with international laws• Strengthening of Indian legal system
• Maximum ISO 27001 certifications obtained globally
• Data Security Council formed
• Documented security policies covering use of information, mobile computing, user access
• Robust and uniform best practices
• National Skills registry (NSR) to facilitate personnel background checks
• Cyber security training and awareness• Amendments to strengthen the IT Act
2000 and Indian Penal Code being enacted
Objectives Initiatives/Impact
In addition, the industry continues to evolve its already high standards for data security and IP protection.
22
How can the industry work for a win-win?
India and Asia
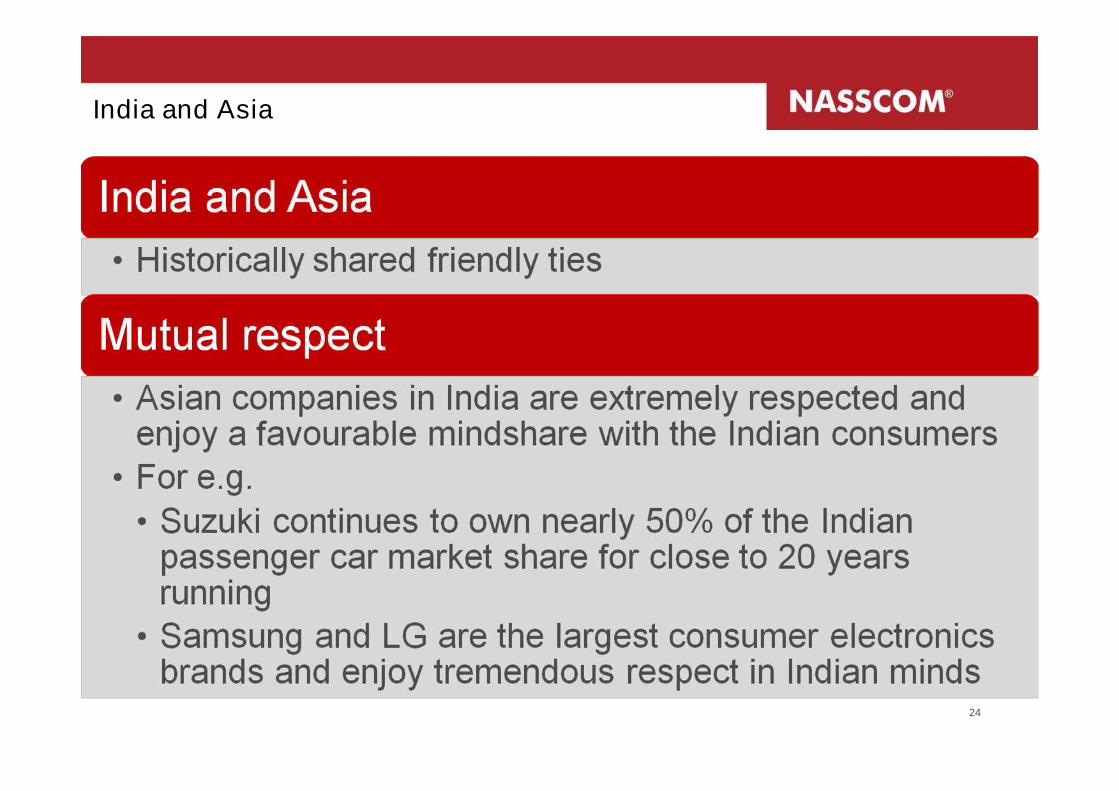
India and Asia
24
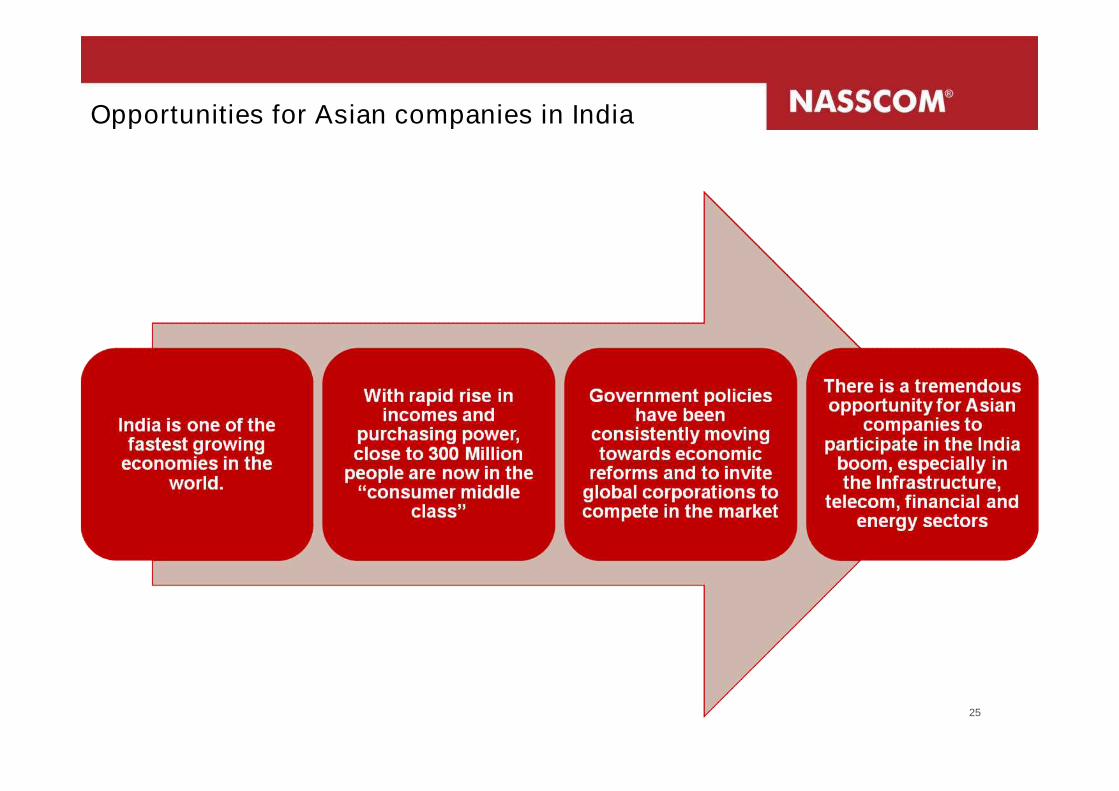
Opportunities for Asian companies in India
25
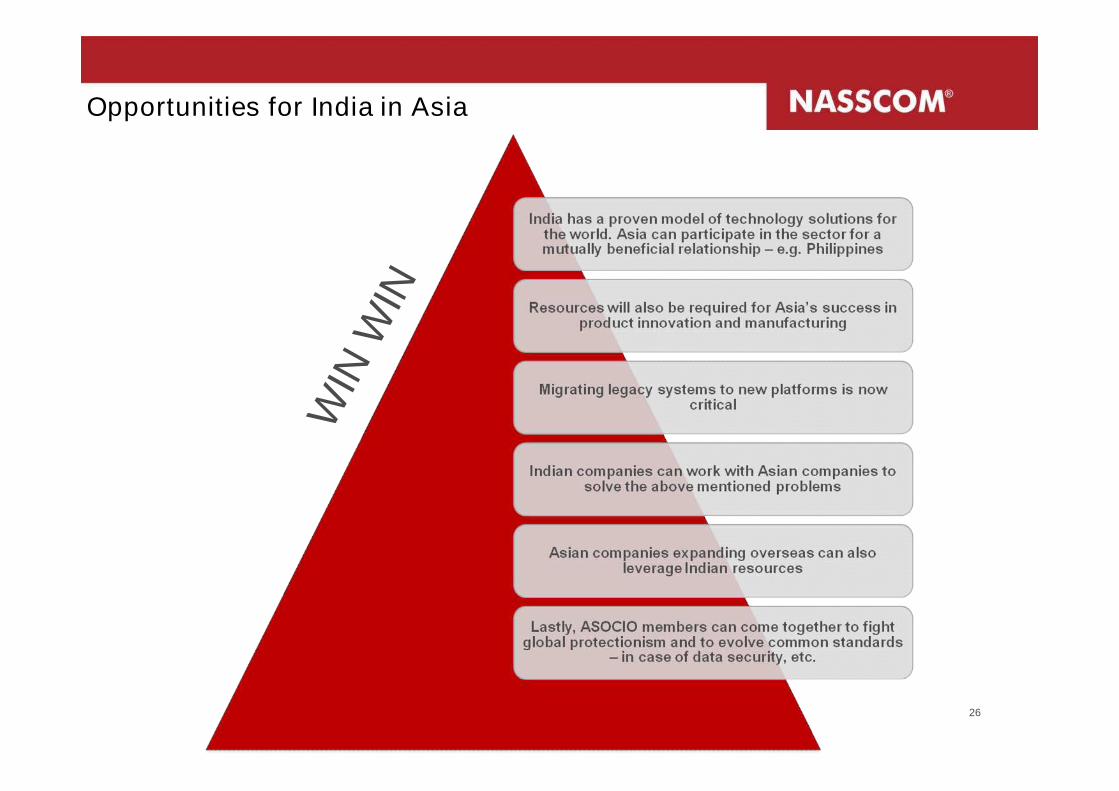
Opportunities for India in Asia
26
WIN
WIN

Thank you