Embed Size (px)
Citation preview

1 1 1 1
Dr. Edward Altman NYU Stern School of Business
The Evolution & Applications of the Altman Z-Score Family of Models & Global Credit Markets Commentary
Global Finance Conference Hofstra University New York May 05, 2017

Scoring Systems
2
• Qualitative (Subjective)
• Univariate (Accounting/Market Measures)
• Multivariate (Accounting/Market Measures) – Discriminant, Logit, Probit Models (Linear, Quadratic) – Non-Linear Models (e.g.., RPA, NN)
• Discriminant and Logit Models in Use
– Consumer Models - Fair Isaacs – Z-Score (5) - Manufacturing – ZETA Score (7) - Industrials – Private Firm Models (eg. Risk Calc (Moody’s), Z” Score) – EM Score (4) - Emerging Markets, Industrial – Other - Bank Specialized Systems

3
Scoring Systems (continued)
• Artificial Intelligence Systems – Expert Systems – Neural Networks (eg. Credit Model (S&P), CBI (Italy))
• Option/Contingent Claims Models
– Risk of Ruin – KMV Credit Monitor Model
• Blended Ratio/Market Value Models – Moody’s Risk Cal – Bond Score (Credit Sights) – Z-Score (Market Value Model)
• Z-Metrics (MSCI) – Blended and Macro Approach

4 4
Major Agencies Bond Rating Categories
Moody's S&P/Fitch
Aaa AAAAa1 AA+Aa2 AAAa3 AA-A1 A+A2 AA3 A-
Baa1 BBB+Baa2 Investment BBBBaa3 Grade BBB-Ba1 High Yield BB+Ba2 ("Junk") BBBa3 BB-B1 B+B2 BB3 B-
Caa1 CCC+Caa CCC
Caa3 CCC-Ca CC
CC D
4

5
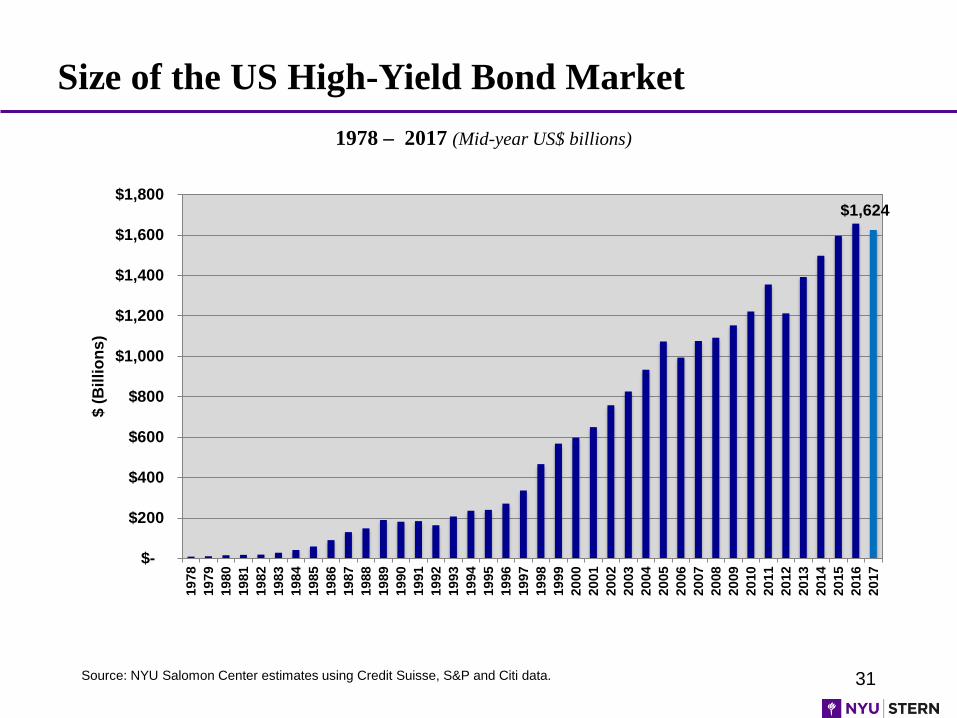
1978 – 2017 (Mid-year US$ billions)
Size of the US High-Yield Bond Market
Source: NYU Salomon Center estimates using Credit Suisse, S&P and Citi data.
$1,624
$-
$200
$400
$600
$800
$1,000
$1,200
$1,400
$1,600
$1,80019
7819
7919
8019
8119
8219
8319
8419
8519
8619
8719
8819
8919
9019
9119
9219
9319
9419
9519
9619
9719
9819
9920
0020
0120
0220
0320
0420
0520
0620
0720
0820
0920
1020
1120
1220
1320
1420
1520
1620
17
$ (B
illio
ns)

6
Key Industrial Financial Ratios (U.S. Industrial Long-term Debt)
Source: Standard & Poor’s, CreditStats: 2011 Industrial Comparative Ratio Analysis, Long-Term Debt – US (RatingsDirect, August 2012).
Medians of Three- Year (2009-2011) Averages AAA AA A BBB BB B CCC*
EBITDA margin (%) 27.9 27.6 20.4 19.7 17.6 16.6
Return on Capital (%) 30.6 23.6 20.7 13.2 10.9 7.8 2.7
EBIT Interest Coverage(x) 33.4 14.2 11.6 5.9 3.0 1.3 0.4
EBITDA Interest Coverage (x) 38.1 19.6 15.3 8.2 4.8 2.3 1.1
Funds from Operations/Total Debt (%) 252.6 64.7 52.6 33.7 24.9 11.7 2.5
Free Operating Cash Flow/Total Debt (%) 208.2 51.3 35.7 19.0 11.1 3.9 (3.6)
Disc. Cash Flow/Debt (%) 142.8 32.0 26.1 13.9 8.8 3.1
Total Debt/EBITDA (x) 0.4 1.2 1.5 2.3 3.2 5.5 8.6
Total Debt/Total Debt + Equity (%) 14.7 29.2 33.8 43.5 52.2 75.2 98.9
No. of Companies 4 14 93 227 260 287
* 2005-2007

7
Key Industrial Financial Ratios (Europe, Middle East & Africa Industrial Long-term Debt)
Source: Standard & Poor’s, CreditStats: 2010 Adjusted Key US & European Industrial and Utility Financial Ratios (RatingsDirect, August 2011).
Medians of Three- Year (2008-2010) Averages AA A BBB BB B
EBITDA margin (%) 24.9 16.6 15.5 17.6 16.3
Return on Capital (%) 20.0 15.3 11.2 9.3 6.7
EBIT Interest Coverage(x) 15.7 7.0 3.9 3.1 1.0
EBITDA Interest Coverage (x) 18.5 9.5 5.7 4.6 2.0
Funds from Operations/Total Debt (%) 83.4 45.7 32.3 22.7 10.5
Free Operating Cash Flow/Total Debt (%) 57.8 23.2 16.0 7.1 1.3
Disc. Cash Flow/Debt (%) 30.5 12.5 8.0 3.4 0.8
Total Debt/EBITDA (x) 0.9 1.6 2.6 3.2 5.8
Total Debt/Total Debt + Equity (%) 25.7 33.8 44.4 51.9 75.8
No. of Companies 8 55 104 58 55

8
Problems With Traditional Financial Ratio Analysis
1 Univariate Technique 1-at-a-time
2 No “Bottom Line”
3 Subjective Weightings
4 Ambiguous
5 Misleading

9
Forecasting Distress With Discriminant Analysis Linear Form
Z = a1x1 + a2x2 + a3x3 + …… + anxn
Z = Discriminant Score (Z Score)
a1 an = Discriminant Coefficients (Weights)
x1 xn = Discriminant Variables (e.g. Ratios)
Example x
x x
x x
x x
x x x
x
x
x x x
x x
x
x x
x
x x
x x
x
x
x
x x
x x
x x
x
x
x x x
EBIT TA
EQUITY/DEBT

10
Z-Score Component Definitions and Weightings
Variable Definition Weighting Factor X1 Working Capital 1.2
Total Assets
X2 Retained Earnings 1.4
Total Assets
X3 EBIT 3.3
Total Assets
X4 Market Value of Equity 0.6
Book Value of Total Liabilities
X5 Sales 1.0
Total Assets

11
Zones of Discrimination: Original Z - Score Model (1968)
Z > 2.99 - “Safe” Zone
1.8 < Z < 2.99 - “Grey” Zone
Z < 1.80 - “Distress” Zone
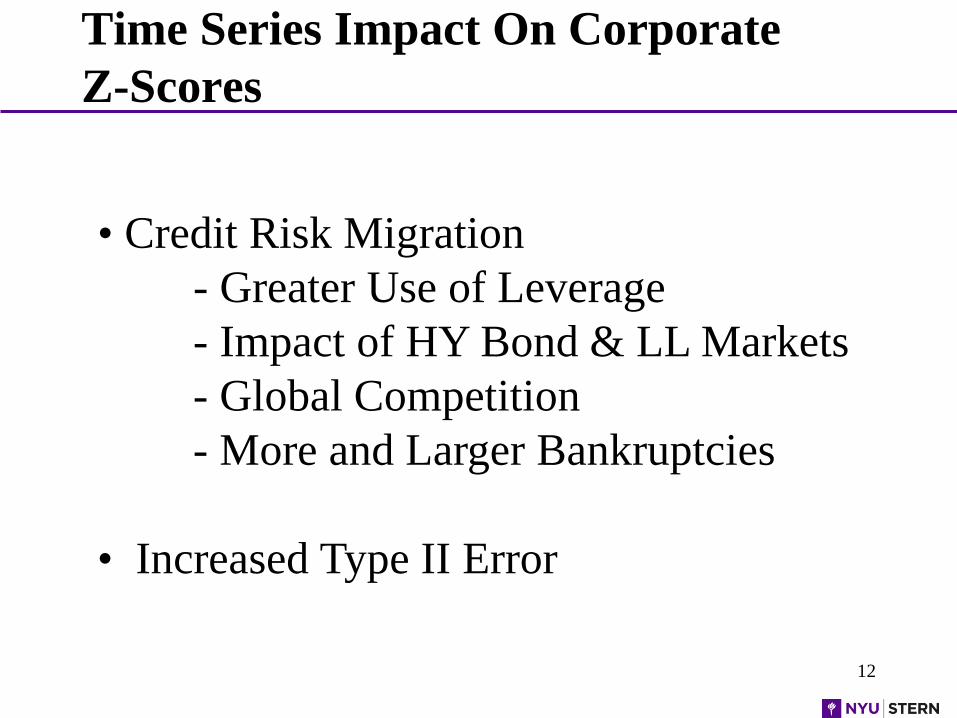
Time Series Impact On Corporate Z-Scores
12
• Credit Risk Migration - Greater Use of Leverage - Impact of HY Bond & LL Markets - Global Competition - More and Larger Bankruptcies • Increased Type II Error

13
Estimating Probability of Default (PD) and Probability of Loss Given Defaults (LGD) Method #1 • Credit scores on new or existing debt • Bond rating equivalents on new issues (Mortality) or
existing issues (Rating Agency Cumulative Defaults) • Utilizing mortality or cumulative default rates to estimate
marginal and cumulative defaults • Estimating Default Recoveries and Probability of Loss
Method #2 • Credit scores on new or existing debt • Direct estimation of the probability of default • Based on PDs, assign a rating
or

14
Median Z-Score by S&P Bond Rating for U.S. Manufacturing Firms: 1992 - 2013
Sources: Compustat Database, mainly S&P 500 firms, compilation by NYU Salomon Center, Stern School of Business.
Rating 2013 (No.) 2004-2010 1996-2001 1992-1995
AAA/AA 4.13 (15) 4.18 6.20* 4.80*
A 4.00 (64) 3.71 4.22 3.87
BBB 3.01 (131) 3.26 3.74 2.75
BB 2.69 (119) 2.48 2.81 2.25
B 1.66 (80) 1.74 1.80 1.87
CCC/CC 0.23 (3) 0.46 0.33 0.40
D 0.01 (33) -0.04 -0.20 0.05
*AAA Only.

15
Marginal and Cumulative Mortality Rate Actuarial Approach
One can measure the cumulative mortality rate (CMR) over a specific time period (1,2,…, T years) by subtracting the product of the surviving
populations of each of the previous years from one (1.0), that is,
MMR(r,t) =
total value of defaulting debt from rating (r) in year (t) total value of the population at the start of the year (t)
MMR = Marginal Mortality Rate
CMR(r,t) = 1 - Π SR(r,t) , t = 1 N
r = AAA CCC here CMR (r,t) = Cumulative Mortality Rate of (r) in (t), SR (r,t) = Survival Rate in (r,t) , 1 - MMR (r,t)

16
All Rated Corporate Bonds* 1971-2016
Mortality Rates by Original Rating
*Rated by S&P at Issuance Based on 3,280 issues
Source: Standard & Poor's (New York) and Author's Compilation
Years After Issuance

17
All Rated Corporate Bonds* 1971-2016
Mortality Losses by Original Rating
*Rated by S&P at Issuance Based on 2,714 issues
Source: Standard & Poor's (New York) and Author's Compilation
Years After Issuance
1 2 3 4 5 6 7 8 9 10
AAA Marginal 0.00% 0.00% 0.00% 0.00% 0.01% 0.01% 0.01% 0.00% 0.00% 0.00%Cumulative 0.00% 0.00% 0.00% 0.00% 0.01% 0.02% 0.03% 0.03% 0.03% 0.03%
AA Marginal 0.00% 0.00% 0.03% 0.02% 0.01% 0.01% 0.00% 0.01% 0.01% 0.01%Cumulative 0.00% 0.00% 0.03% 0.05% 0.06% 0.07% 0.07% 0.08% 0.09% 0.10%
A Marginal 0.00% 0.01% 0.04% 0.05% 0.05% 0.04% 0.02% 0.02% 0.05% 0.03%Cumulative 0.00% 0.01% 0.05% 0.10% 0.15% 0.19% 0.21% 0.23% 0.28% 0.31%
BBB Marginal 0.23% 1.53% 0.70% 0.58% 0.26% 0.16% 0.10% 0.09% 0.10% 0.18%Cumulative 0.23% 1.76% 2.44% 3.01% 3.26% 3.42% 3.51% 3.60% 3.70% 3.87%
BB Marginal 0.55% 1.18% 2.30% 1.11% 1.38% 0.74% 0.78% 0.48% 0.73% 1.09%Cumulative 0.55% 1.72% 3.98% 5.05% 6.36% 7.05% 7.78% 8.22% 8.89% 9.88%
B Marginal 1.92% 5.38% 5.32% 5.20% 3.79% 2.45% 2.34% 1.13% 0.91% 0.53%Cumulative 1.92% 7.20% 12.13% 16.70% 19.86% 21.82% 23.65% 24.52% 25.20% 25.60%
CCC Marginal 5.37% 8.68% 12.49% 11.45% 3.42% 8.61% 2.32% 3.34% 0.40% 2.72%Cumulative 5.37% 13.58% 24.38% 33.04% 35.33% 40.89% 42.27% 44.19% 44.42% 45.93%

18
Classification & Prediction Accuracy Z Score (1968) Failure Model*
1969-1975 1976-1995 1997-1999 Year Prior Original Holdout Predictive Predictive Predictive To Failure Sample (33) Sample (25) Sample (86) Sample (110) Sample (120)
1 94% (88%) 96% (72%) 82% (75%) 85% (78%) 94% (84%)
2 72% 80% 68% 75% 74%
3 48% - - - -
4 29% - - - -
5 36% - - - -
*Using 2.67 as cutoff score (1.81 cutoff accuracy in parenthesis)

19
Z Score Trend - LTV Corp.
-1.5-1
-0.50
0.51
1.52
2.53
3.5
1980 1981 1982 1983 1984 1985 1986
Year
Z Sc
ore
Grey Zone
Bankrupt
July ‘86
Safe Zone
Distress Zone
2.99
1.8
BB+ BBB-
B- B- CCC+
CCC+
D

20
International Harvester (Navistar) Z Score (1974 – 2001)
-0.50
0.51
1.52
2.53
3.5
'74 '76 '78 '80 '82 '84 '86 '88 '90 '92 '94 '96 '98 '00
Year
Z Sc
ore
Safe Zone
Grey Zone
Distress Zone
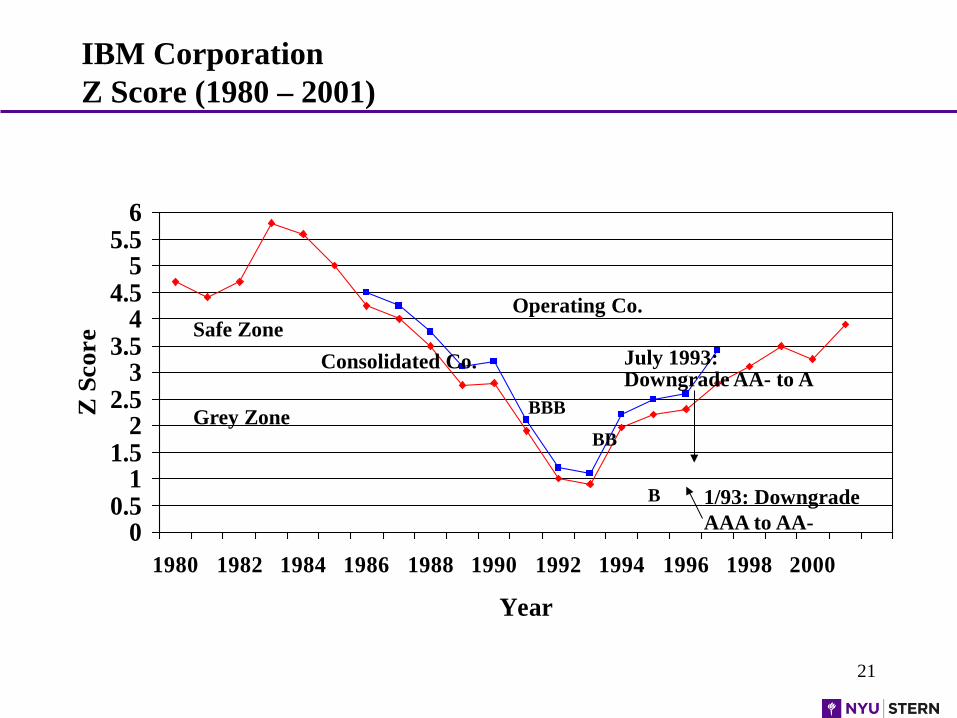
21
IBM Corporation Z Score (1980 – 2001)
00.5
11.5
22.5
33.5
44.5
55.5
6
1980 1982 1984 1986 1988 1990 1992 1994 1996 1998 2000
Year
Z S
core
Operating Co. Safe Zone
Consolidated Co.
Grey Zone BBB
BB
B 1/93: Downgrade AAA to AA-
July 1993: Downgrade AA- to A

22
Z-Score Model Applied to GM (Consolidated Data): Bond Rating Equivalents and Scores from 2005 – 2016
Z- Score: General Motors Co.
CCC+B-
CCC+
D
CCC
B B
D
B B BB B-
-1.50
-1.00
-0.50
0.00
0.50
1.00
1.50
2.00
Dec
-05
Dec
-06
Dec
-07
Dec
-08
Dec
-09
Dec
-10
Dec
-11
Dec
-12
Dec
-13
Dec
-14
Dec
-15
Dec
-16
Z-Sc
ore
Z-Score
Ch. 11 Filing 6/01/09
Upgrade to BBB- by S&P 9/25/14
Full Emergence from Bankruptcy
3/31/11
Emergence, New Co. Only, from Bankruptcy, 7/13/09

23
Applying the Z Score Models to Recent Energy & Mining Company Bankruptcies
Source: CapIQ.
BREs Z Z''
t-1* t-2** t-1* t-2** # % # % # % # %
A BBB+ BBB BBB- BB+ 1 2% BB 0 0% BB- 2 4% B+ 1 2% B 1 4% 3 6% 11 23% B- 1 4% 3 6% 6 13%
CCC+ 4 17% 10 42%
1 2% 7 15% CCC 2 4% 7 15% CCC- 2 4% 9 19%
D 20 83% 12 50% 36 77% 3 6%
Total 24 100% 24 100% 47 100% 47 100%
* One or Two Quarters before Filing ** Five or Six Quarters before Filing
2015-2016

24
Additional Altman Z-Score Models: Private Firm Model
Non-U.S., Emerging Markets Models for Non Financial Industrial Firms e.g. Latin America, China, etc.
SME Models for the U.S. & Europe e.g. Italian Minibonds

25
Z’ Score Private Firm Model
Z’ = .717X1 + .847X2 + 3.107X3 + .420X4 + .998X5
X1 = Current Assets - Current Liabilities
Total Assets
X2 = Retained Earnings
Total Assets
X3 = Earnings Before Interest and Taxes
Total Assets
X4 = Book Value of Equity Z’ > 2.90 - “Safe” Zone
Total Liabilities 1.23 < Z’ < 2.90 - “Grey” Zone
X5 = Sales Z’ < 1.23 - “Distress” Zone
Total Assets

AN EMERGING MARKET CORPORATE MODEL

27
Z” Score Model for Manufacturers, Non-Manufacturer Industrials; Developed and Emerging Market Credits
Z” = 3.25 + 6.56X1 + 3.26X2 + 6.72X3 + 1.05X4
X1 = Current Assets - Current Liabilities
Total Assets
X2 = Retained Earnings
Total Assets
X3 = Earnings Before Interest and Taxes
Total Assets
X4 = Book Value of Equity Z” > 5.85 - “Safe” Zone
Total Liabilities 4.35 < Z” < 5.85 - “Grey” Zone
Z” < 4.35 - “Distress” Zone

28
US Bond Rating Equivalents Based on Z”-Score Model Z”=3.25+6.56X1+3.26X2+6.72X3+1.05X4
aSample Size in Parantheses. bInterpolated between CCC and CC/D. cBased on 94 Chapter 11 bankruptcy filings, 2010-2013. Sources: Compustat, Company Filings and S&P.
Rating Median 1996 Z”-Scorea Median 2006 Z”-Scorea Median 2013 Z”-Scorea
AAA/AA+ 8.15 (8) 7.51 (14) 8.80 (15)
AA/AA- 7.16 (33) 7.78 (20) 8.40 (17)
A+ 6.85 (24) 7.76 (26) 8.22 (23)
A 6.65 (42) 7.53 (61) 6.94 (48)
A- 6.40 (38) 7.10 (65) 6.12 (52)
BBB+ 6.25 (38) 6.47 (74) 5.80 (70)
BBB 5.85 (59) 6.41 (99) 5.75 (127)
BBB- 5.65 (52) 6.36 (76) 5.70 (96)
BB+ 5.25 (34) 6.25 (68) 5.65 (71)
BB 4.95 (25) 6.17 (114) 5.52 (100)
BB- 4.75 (65) 5.65 (173) 5.07 (121)
B+ 4.50 (78) 5.05 (164) 4.81 (93)
B 4.15 (115) 4.29 (139) 4.03 (100)
B- 3.75 (95) 3.68 (62) 3.74 (37)
CCC+ 3.20 (23) 2.98 (16) 2.84 (13)
CCC 2.50 (10) 2.20 (8) 2.57(3)
CCC- 1.75 (6) 1.62 (-)b 1.72 (-)b
CC/D 0 (14) 0.84 (120) 0.05 (94)c

29 29 29
Current Conditions and Outlook in Global Credit Markets

Benign Credit Cycle? Is It Over?
30
• Length of Benign Credit Cycles: Is the Current Cycle Over?
• Default Rates (yes), Default Forecast (no), Recovery Rates (yes), Yields (no)
& Liquidity (no)
• Coincidence with Recessions: U.S. & European Scenarios
• Comparative Health of High-Yield Firms (2007 vs. 2012/2014/3Q16)
• LBO Statistics and Trends
• Possible Timing of the Bubble Burst (Short-term versus Longer-term)
31
1978 – 2017 (Mid-year US$ billions)
Size of the US High-Yield Bond Market
Source: NYU Salomon Center estimates using Credit Suisse, S&P and Citi data.
$1,624
$-
$200
$400
$600
$800
$1,000
$1,200
$1,400
$1,600
$1,80019
7819
7919
8019
8119
8219
8319
8419
8519
8619
8719
8819
8919
9019
9119
9219
9319
9419
9519
9619
9719
9819
9920
0020
0120
0220
0320
0420
0520
0620
0720
0820
0920
1020
1120
1220
1320
1420
1520
1620
17
$ (B
illio
ns)

Quarterly Default Rate and Four-Quarter Moving Average 1989 – 1Q 2017
Source: Author’s Compilations
Default Rates on High-Yield Bonds
32
0.0%
2.0%
4.0%
6.0%
8.0%
10.0%
12.0%
14.0%
16.0%
0.0%
1.0%
2.0%
3.0%
4.0%
5.0%
6.0%
4 -Q
uart
er M
ovin
g A
vera
ge
Qua
rter
ly D
efau
lt R
ate
Quarterly Moving

Historical Default Rates and Recession Periods in the U.S.*
33
Periods of Recession: 11/73 - 3/75, 1/80 - 7/80, 7/81 - 11/82, 7/90 - 3/91, 4/01 – 12/01, 12/07 - 6/09
*All rates annual, except 1Q 2017 which is the LTM
Source: E. Altman (NYU Salomon Center) & National Bureau of Economic Research
High-Yield Bond Market (1972 – 1Q 2017)
0.0%
2.0%
4.0%
6.0%
8.0%
10.0%
12.0%
14.0%
72 74 76 78 80 82 84 86 88 90 92 94 96 98 00 02 04 06 08 10 12 14 16

June 01, 2007 – March 31, 2017
Sources: Citigroup Yieldbook Index Data and Bank of America Merrill Lynch. 34
YTM & Option-Adjusted Spreads Between High Yield Markets & U.S. Treasury Notes
200
400
600
800
1,000
1,200
1,400
1,600
1,800
2,000
2,200
6/1/
2007
9/14
/200
7
12/3
1/20
07
4/15
/200
8
7/29
/200
8
11/1
1/20
08
2/26
/200
9
6/11
/200
9
9/24
/200
9
1/11
/201
0
4/26
/201
0
8/9/
2010
11/2
2/20
10
3/7/
2011
6/20
/201
1
10/3
/201
1
1/18
/201
2
5/2/
2012
8/15
/201
2
11/2
8/20
12
3/15
/201
3
6/28
/201
3
10/1
1/20
13
1/28
/201
4
5/13
/201
4
8/26
/201
4
12/9
/201
4
3/26
/201
5
7/9/
2015
10/2
2/20
15
2/8/
2016
5/23
/201
6
9/5/
2016
12/1
9/20
16
Yield Spread (YTMS) OAS Average YTMS (1981-2016) Average OAS (1981-2016)
6/12/07 (YTMS = 260bp, OAS = 249bp)
12/16/08 (YTMS = 2,046bp, OAS = 2,144bp)
3/31/17 (YTMS = 387p, OAS = 392bp)
YTMS = 539bp, OAS = 544bp

35
Comparative Health of High-Yield Firms (2007 vs. 2012/2014/3Q 2016)

Comparing Financial Strength of High-Yield Bond Issuers in 2007& 2012/2014/3Q 2016
36
Year Average Z-Score/
(BRE)* Median Z-Score/
(BRE)* Average Z”-Score/
(BRE)* Median Z”-Score/
(BRE)*
2007 1.95 (B+) 1.84 (B+) 4.68 (B+) 4.82 (B+)
2012 1.76 (B) 1.73 (B) 4.54 (B) 4.63 (B)
2014 2.03 (B+) 1.85 (B+) 4.66 (B+) 4.74 (B+)
2016 (3Q) 1.97 (B+) 1.70 (B) 4.44 (B) 4.63 (B)
*Bond Rating Equivalent Source: Authors’ calculations, data from Altman and Hotchkiss (2006) and S&P Capital IQ/Compustat.
Number of Firms
Z-Score Z”-Score
2007 294 378
2012 396 486
2014 577 741
2016 (3Q) 581 742
KMV MODEL

38

Financial Distress (Z-Score) Prediction Applications
Comparative Risk Profiles Over Time
Sovereign Default Risk Assessment
Advisors (Assessing Your Client’s Health)
M&A (e.g. Bottom Fishing)
Purchasers, Suppliers Accounts Receivable Management (e.g. NACM)
Researchers Chapter 22 Reduction
Managers
- Managing a Financial Turnaround
Lenders
Investors (e.g. Quality Junk Portfolio) Long/Short Investment Strategy on Stocks
and Bonds
Baskets of Strong Balance Sheet Companies & Indexes (e.g. STOXX)
Security Analysts
Regulators & Gov’t Agencies
Auditors (Audit Risk Model)
Credit Rating Agencies

MANAGING A FINANCIAL TURNAROUND: APPLICATIONS OF THE Z-SCORE MODEL
IN THE US AND CHINA
THE GTI CASE
40
41
Assessing the Credit Worthiness of Italian SMEs and Mini-bond Issuers
Dr. Edward I. Altman Dr. Gabriele Sabato
Maurizio G. Esentato

42
Size of Western European HY Market
Includes non-investment grade straight corporate debt of issuers with assets located in or revenues derived from Western Europe, or the bond is denominated in a Western European currency. Floating-rate and convertible bonds and preferred stock are not included.
Source: Credit Suisse

43
The Italian Mini-bond Market
We believe “Mini-bonds” can be a success in Italy as long as the market supplies an attractive risk/return tradeoff to investors as well as affordable and flexible financing for borrowers.
Europe High-yield bond market is still lagging behind the US one, but the growth has accelerated in the last 3 years.
In Italy, the market for SME bonds is known as Extra-MOT PRO “Mini-bond” market.
The new segment of the Extra-MOT market dedicated to listing of bonds, commercial paper, and project finance bonds started in February 2013.
The total amount of listed issuances since February 2013 is 177, for a total issued amount of about Euro 7,146bn. As of March 2016, there is Euro 4.491bn outstanding, from 130 issues.
In Q2 2016, 13 new issues have been launched.

44
What are the constraints to the success of the Italian ExtraMOT PRO Mini-bond market? All bond investments face three main risks (Market, Liquidity and Credit), but it is credit
risk that is perhaps most critical for relatively unknown, smaller enterprises.
Since the ExtraMOT PRO market is still quite young, there are not as yet aggregate default and recovery statistics. We prefer, therefore, to concentrate on issuer default & return analytics based on Italian SME experience.
The objective of our model is to help:
Italian SMEs to grow and succeed by assessing their risk profile and suggesting what would be the best funding option for them
Lenders and investors to assess the risk-return trade offs in investing in either individual or portfolios of Italian SME mini-bonds

45
SME ZI-Score: Summary of Results
We segmented the Italian SMEs by industrial sectors and developed four default prediction models for Manufacturing, Services, Retail and Real Estate firms.
Models have been developed on a representative sample of more the 14.500 SMEs located in the north of Italy and then certified for their relevance at national level.
Prediction power of the models is significantly high due to the use of informative variables and appropriate techniques applied.
In addition to the Score, Firms/Analysts/Investors also receive an estimated Bond Rating Equivalent and Probability of Default.
The SME ZI-Score improves the matching of demand and supply in the capital markets between SMEs looking for funding options and investors.

46
The Results

47
Risk Profile of Mini-bond issuers (2015)
Source: Firms listed on Borsa Italiana Extra MOT, calculations by the authors
Source: Firms listed on Borsa Italiana Extra MOT, calculations by the authors
Bond Rating Equivalent # SMEs % SMEs Avg. Coupon YieldAA 2 2% 0,057A 4 4% 0,062
BBB 24 25% 0,065BB 18 19% 0,055B 31 32% 0,059
CCC 14 14% 0,065CC 2 2% 0,030C 2 2% 0,060
Applying our SME ZI-Score on the mini-bond issuers as of 2015, we find that:
Risk profile of SMEs doesn’t seem to influence the bond pricing;
Majority of existing mini-bond issuers classified as non-investment grade;
The risk profile of the mini-bond issuers is better (i.e. less risky) than total SME sample.

48
Wiserfunding Ltd.: Helping Italian SMEs to Succeed
Mission is to support small business growth by reducing information asymmetry by providing a common set of information to all market participants.
The SME ZI-Score should not to be used in isolation. Other factor (e.g. debt capacity, cash flow, recovery profile, market outlook, directors’ experience) are assessed when evaluating SMEs’ financial strength.
We believe that by providing lenders/investors and small businesses with the same set of information, we can help them speak the same language.
We are working with Classis Capital, Borsa Italiana, Confindustria, several PMI organizations and SMEs to apply our model effectively.