Embed Size (px)
Citation preview
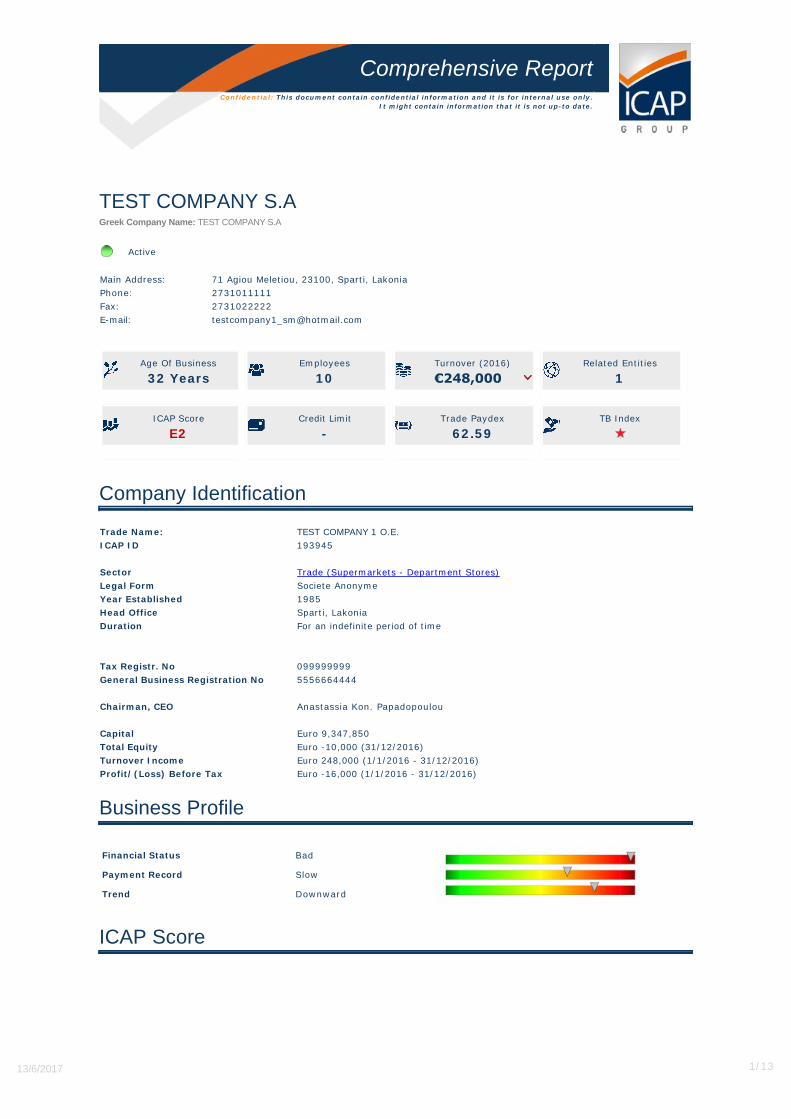
Comprehensive Report
Confidential: This document contain confidential information and it is for internal use only.
It might contain information that it is not up-to date.
TEST COMPANY S.AGreek Company Name: TEST COMPANY S.A
Active
Main Address: 71 Agiou Meletiou, 23100, Sparti, Lakonia
Phone: 2731011111
Fax: 2731022222
E-mail: [email protected]
Age Of Business
32 Years
Employees
10
Turnover (2016)
€248,000Related Entities
1
ICAP Score
E2
Credit Limit
-
Trade Paydex
62.59
TB Index
Company Identification
Trade Name: TEST COMPANY 1 O.E.
ICAP ID 193945
Sector Trade (Supermarkets - Department Stores)
Legal Form Societe Anonyme
Year Established 1985
Head Office Sparti, Lakonia
Duration For an indefinite period of time
Tax Registr. No 099999999
General Business Registration No 5556664444
Chairman, CEO Anastassia Kon. Papadopoulou
Capital Euro 9,347,850
Total Equity Euro -10,000 (31/12/2016)
Turnover Income Euro 248,000 (1/1/2016 - 31/12/2016)
Profit/(Loss) Before Tax Euro -16,000 (1/1/2016 - 31/12/2016)
Business Profile
Financial Status Bad
Payment Record Slow
Trend Downward
ICAP Score
13/6/2017 1/13
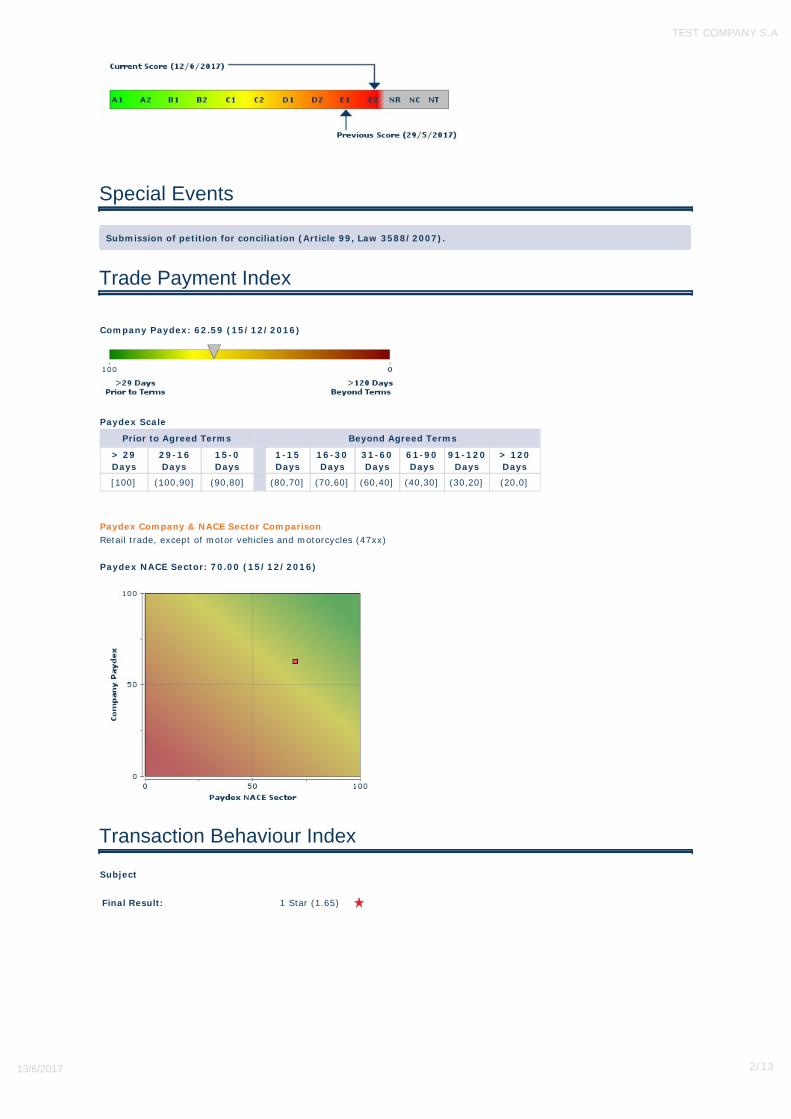
Special Events
Submission of petition for conciliation (Article 99, Law 3588/2007).
Trade Payment Index
Company Paydex: 62.59 (15/12/2016)
Paydex Scale
Prior to Agreed Terms Beyond Agreed Terms
> 29
Days
29-16
Days
15-0
Days
1-15
Days
16-30
Days
31-60
Days
61-90
Days
91-120
Days
> 120
Days
[100] (100,90] (90,80] (80,70] (70,60] (60,40] (40,30] (30,20] (20,0]
Paydex Company & NACE Sector Comparison
Retail trade, except of motor vehicles and motorcycles (47xx)
Paydex NACE Sector: 70.00 (15/12/2016)
Transaction Behaviour Index
Subject
Final Result: 1 Star (1.65)
TEST COMPANY S.A
13/6/2017 2/13
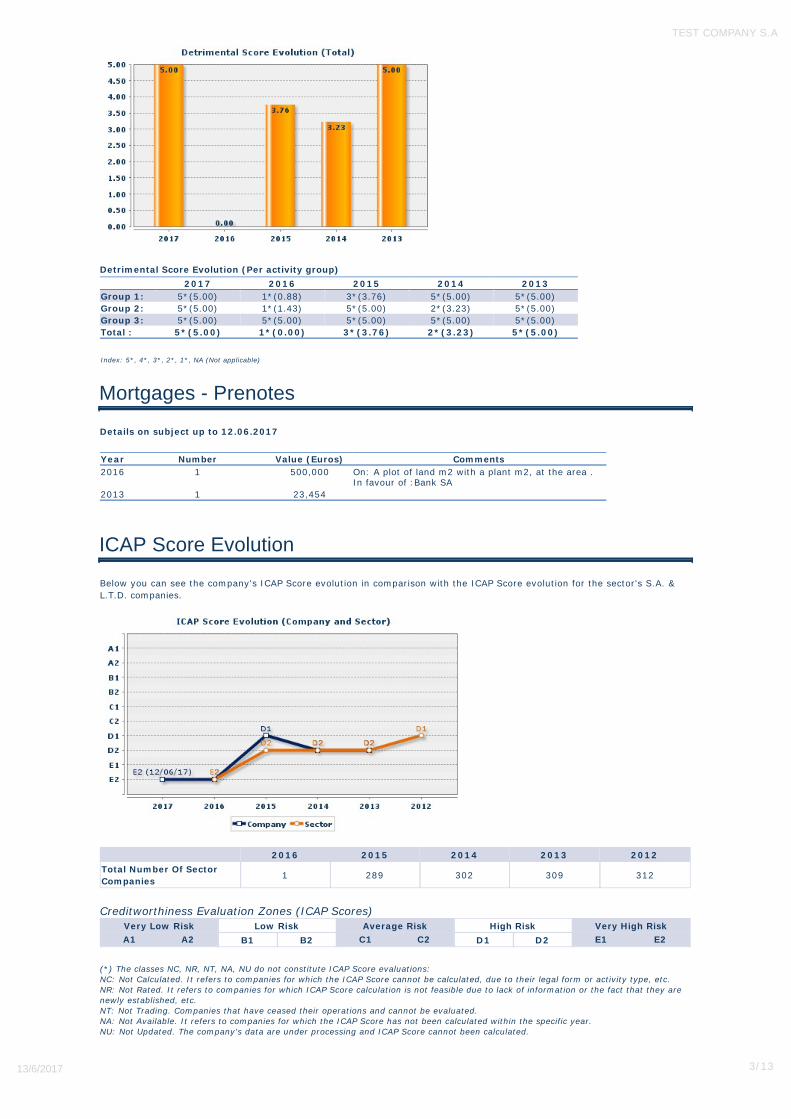
Detrimental Score Evolution (Per activity group)
2017 2016 2015 2014 2013
Group 1: 5*(5.00) 1*(0.88) 3*(3.76) 5*(5.00) 5*(5.00)
Group 2: 5*(5.00) 1*(1.43) 5*(5.00) 2*(3.23) 5*(5.00)
Group 3: 5*(5.00) 5*(5.00) 5*(5.00) 5*(5.00) 5*(5.00)
Total : 5*(5.00) 1*(0.00) 3*(3.76) 2*(3.23) 5*(5.00)
Index: 5*, 4*, 3*, 2*, 1*, NA (Not applicable)
Mortgages - Prenotes
Details on subject up to 12.06.2017
Year Number Value (Euros) Comments
2016 1 500,000 On: A plot of land m2 with a plant m2, at the area .In favour of :Bank SA
2013 1 23,454
ICAP Score Evolution
Below you can see the company's ICAP Score evolution in comparison with the ICAP Score evolution for the sector's S.A. &
L.T.D. companies.
2016 2015 2014 2013 2012
Total Number Of Sector
Companies1 289 302 309 312
Creditworthiness Evaluation Zones (ICAP Scores)
Very Low Risk Low Risk Average Risk High Risk Very High Risk
A1 A2 B1 B2 C1 C2 D1 D2 E1 E2
(*) The classes NC, NR, NT, NA, NU do not constitute ICAP Score evaluations:
NC: Not Calculated. It refers to companies for which the ICAP Score cannot be calculated, due to their legal form or activity type, etc.
NR: Not Rated. It refers to companies for which ICAP Score calculation is not feasible due to lack of information or the fact that they are
newly established, etc.
NT: Not Trading. Companies that have ceased their operations and cannot be evaluated.
NA: Not Available. It refers to companies for which the ICAP Score has not been calculated within the specific year.
NU: Not Updated. The company's data are under processing and ICAP Score cannot been calculated.
TEST COMPANY S.A
13/6/2017 3/13
Recommended Credit Limit
Last Any business transactions must be carried out on a secure basis.
Previous Any business transactions must be carried out on a secure basis. (29/5/2017)
Company History
Established in Athens (6 Al. Soutsou Str.), on 25.11.1979, to undertake the business activities of the firm TEST COMPANY &
CO. E.E., established in Jyly 1969 as a continuation of the firm TEST ETAIREIAS O.E., established in 1959 (pre-existing since
1942). In 1993 subject moved its head office to 50 Anthimou Str., Athens (Gov.Gaz. No. 3729/91) and in 1994 to Argyroupoli
(Gov. Gaz. No. 1931/94). Lately subject's head office was moved to Kifissia.
Premises (as declared)
Head Office - Supermarket • 71 Agiou Meletiou, 231-00 Sparti, Lakonia, owned, plot of land 50 m2, Buildings: 150 m2.
On 26/05/2017 subject's head office was changed. Previous address : 45 Agiou Meletiou, 231-00, Sparti, Lakonia
Personnel
According to the latest data the company employs: 10 persons.
Staff's evolution annually
2016 2015 2014
No of Employees 50 - -
Activity
Supermarket
Activity NACE (Main)
NACE 1 5211 Retail sale in non-specialized stores with food, beverages or tobacco predominating
NACE 2 4711 Retail sale in non-specialised stores with food, beverages or tobacco predominating
Certifications
ISO Certificate ISO 22716:2007
Testifying Company TUV HELLAS (TUV NORD) S.A.
Products - Services
Commercial Supermarkets ET,I
Symbol Interpretation
EM = Exports manufacturing FT = For third parties A = Representation
ET = Exports commerce F = In third party facilities D = Local agent
EY = Exports services I = Import
Imports
Countries Belgium, Germany
Imports percentage 25%
Terms C.A.D.
Exports
Countries France, United Kingdom
Export sales percentage 15%
Terms Bill of exchange
TEST COMPANY S.A
13/6/2017 4/13
Suppliers
• TEST COMPANY & CO LTD, (Nea Filadelfeia, Attiki)
Customers
Subject distributes its goods by retail.
• TEST S.A., Trade (Supermarkets - Department Stores), (Glyka Nera, Attiki)
Banks
Alpha Bank A.E. • Sparti Branch (tel.:2731-023396)
EFG EUROBANK ERGASIAS S.A. • Sparti Branch (tel.:2731-025820-1)
Probank S.A. • Sparti Branch (tel.:27310-89520)
General Comments
Subject is a long established trading firm.
Shareholders (as declared)
By 100.00% Anastassia Kon. Papadopoulou
Board of Directors
Anastassia Kon. Papadopoulou Chairman, CEO
Stefanos Geo. Papadopoulos Member
Management History Review
Subject's main administrators participate in the board of directors of the following firms:
NAME RELATION COMPANY ICAP ID SECTOR
Papadopoulou
Anastassia
CEO, Chairman TEST COMPANY S.A. 236598 Business Services
Administrator TEST COMPANY L.T.D. 704540 Trade (Fuel - Lubricants - Liquefied
Gases)
Participations
Subject participates in the following firm(s):
by 50.00% TEST COMPANY L.T.D.
ICAP ID 0704540
VAT 055555555
Head office Lampsakos, 341 00, Halkida, Evoia
Date established 1973
Sector Trade (Fuel - Lubricants - Liquefied Gases)
Affiliated Companies
Anastassia Kon. Papadopoulou participates in the following firm(s):
TEST COMPANY O.E. by 50,00%
ICAP ID 000193966
VAT 066666666
TEST COMPANY S.A
13/6/2017 5/13
Head office Drosia, 341 00, Halkida, Evoia
Year Established 1970
Sector Trade (Fuel - Lubricants - Liquefied Gases)
TEST COMPANY L.T.D. by 50,00%
(As mentioned before)
Financial Information
The share capital of the company amounts to Euro 9,347,850 divided into 1,869,570,500 shares at EURO 0.00 each.
Recent financial data are not available.
Mid-Term Accounting Statement Data
Accounts 1/1/2017 - 31/3/2017 1/1/2016 - 31/3/2016
Shareholders Equity 180,000 140,000
Total Assets 510,000 340,000
Net Sales 655,000 380,000
Profit Before Income T 258,000 155,000
Values in Euros
The financial data are presented according to the International Financial Reporting Standards.
Financial Comments
2016 balance sheet accounts have been reformed.
Balance Sheet Notes
• Subject's recent financial statements are published according to Greek Financial Standards (GFS). Due to that reason,
comparisons with previous fiscal years in which company published its balance sheets according to Hellenic Financial
Standards or IAS/IFRS, are not presented.
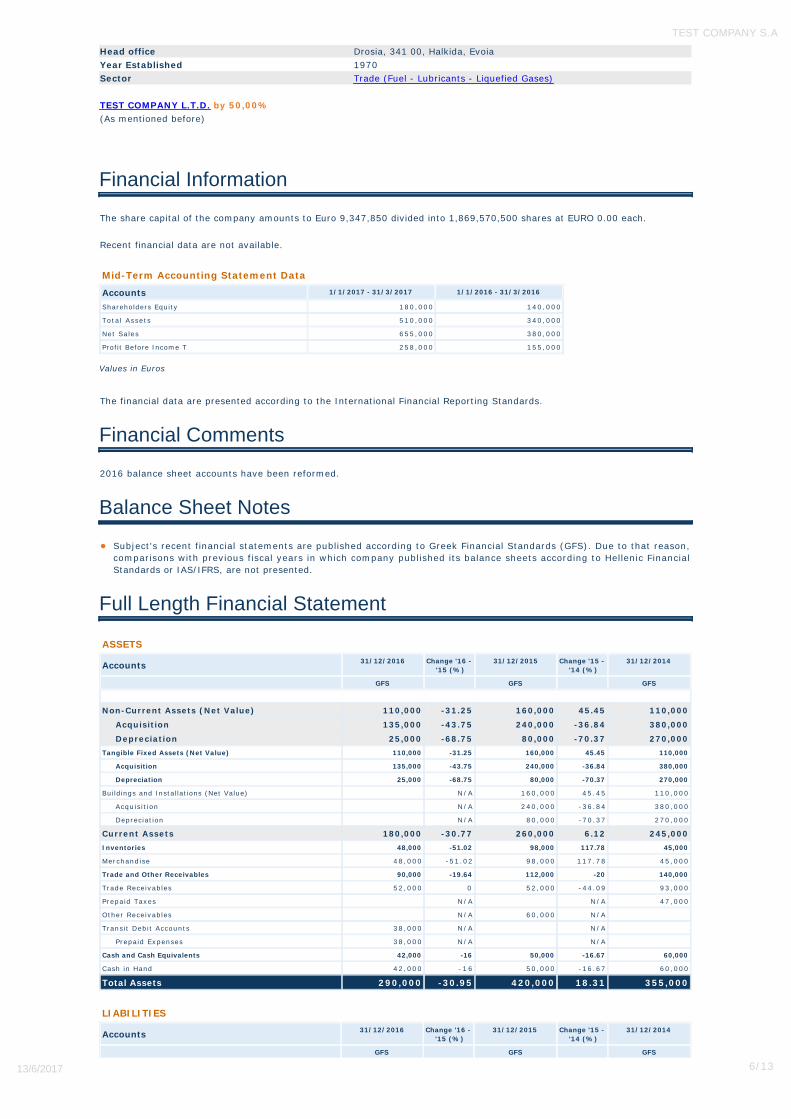
Full Length Financial Statement
ASSETS
Accounts31/12/2016 Change '16 -
'15 (%)
31/12/2015 Change '15 -
'14 (%)
31/12/2014
GFS GFS GFS
Non-Current Assets (Net Value) 110,000 -31.25 160,000 45.45 110,000
Acquisition 135,000 -43.75 240,000 -36.84 380,000
Depreciation 25,000 -68.75 80,000 -70.37 270,000
Tangible Fixed Assets (Net Value) 110,000 -31.25 160,000 45.45 110,000
Acquisition 135,000 -43.75 240,000 -36.84 380,000
Depreciation 25,000 -68.75 80,000 -70.37 270,000
Buildings and Installations (Net Value) N /A 160,000 45.45 110,000
Acquisition N /A 240,000 -36.84 380,000
Depreciation N /A 80,000 -70.37 270,000
Current Assets 180,000 -30.77 260,000 6.12 245,000
Inventories 48,000 -51.02 98,000 117.78 45,000
Merchandise 48,000 -51.02 98,000 117.78 45,000
Trade and Other Receivables 90,000 -19.64 112,000 -20 140,000
Trade Receivables 52,000 0 52,000 -44.09 93,000
Prepaid Taxes N /A N /A 47,000
Other Receivables N /A 60,000 N/A
Transit Debit Accounts 38,000 N/A N /A
Prepaid Expenses 38,000 N/A N /A
Cash and Cash Equivalents 42,000 -16 50,000 -16.67 60,000
Cash in Hand 42,000 - 1 6 50,000 -16.67 60,000
Total Assets 290,000 -30.95 420,000 18.31 355,000
LIABILITIES
Accounts31/12/2016 Change '16 -
'15 (%)
31/12/2015 Change '15 -
'14 (%)
31/12/2014
GFS GFS GFS
TEST COMPANY S.A
13/6/2017 6/13
Accounts31/12/2016 Change '16 -
'15 (%)
31/12/2015 Change '15 -
'14 (%)
31/12/2014
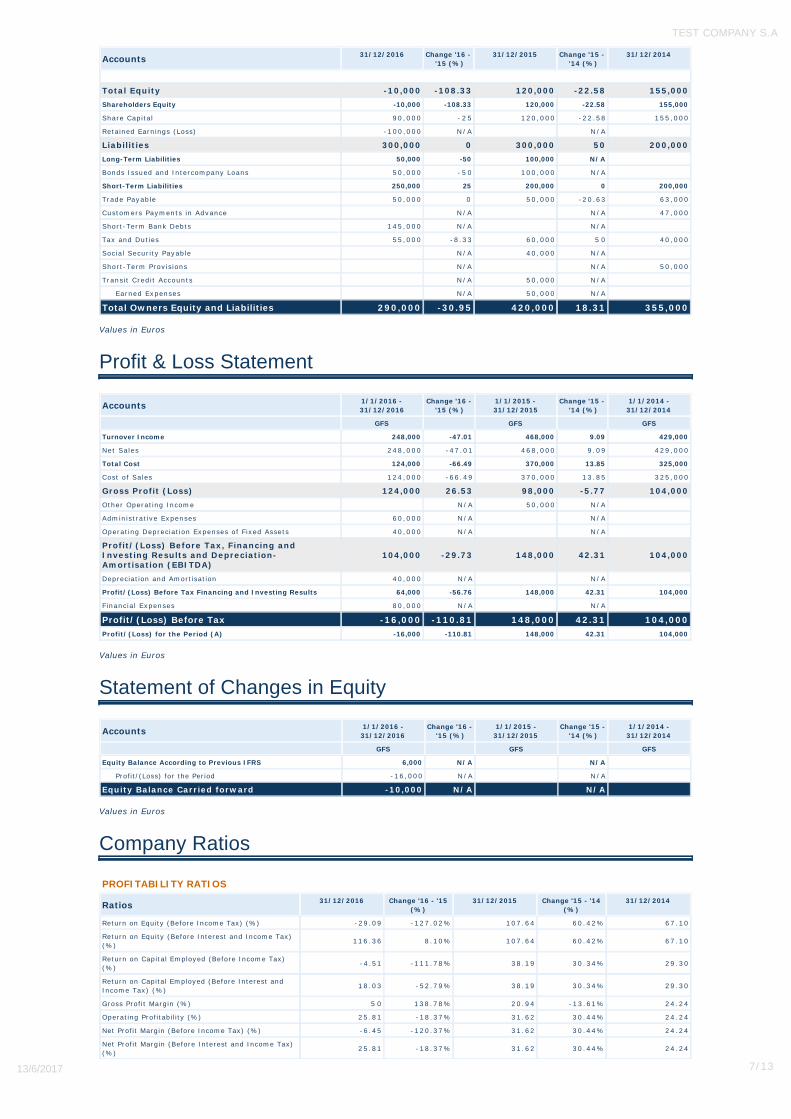
Total Equity -10,000 -108.33 120,000 -22.58 155,000
Shareholders Equity -10,000 -108.33 120,000 -22.58 155,000
Share Capital 90,000 - 2 5 120,000 -22.58 155,000
Retained Earnings (Loss) -100,000 N/A N /A
Liabilities 300,000 0 300,000 50 200,000
Long-Term Liabilities 50,000 -50 100,000 N/A
Bonds Issued and Intercompany Loans 50,000 - 5 0 100,000 N/A
Short-Term Liabilities 250,000 25 200,000 0 200,000
Trade Payable 50,000 0 50,000 -20.63 63,000
Customers Payments in Advance N /A N /A 47,000
Short-Term Bank Debts 145,000 N/A N /A
Tax and Duties 55,000 -8.33 60,000 5 0 40,000
Social Security Payable N /A 40,000 N/A
Short-Term Provisions N /A N /A 50,000
Transit Credit Accounts N /A 50,000 N/A
Earned Expenses N /A 50,000 N/A
Total Owners Equity and Liabilities 290,000 -30.95 420,000 18.31 355,000
Values in Euros
Profit & Loss Statement
Accounts1/1/2016 -
31/12/2016
Change '16 -
'15 (%)
1/1/2015 -
31/12/2015
Change '15 -
'14 (%)
1/1/2014 -
31/12/2014
GFS GFS GFS
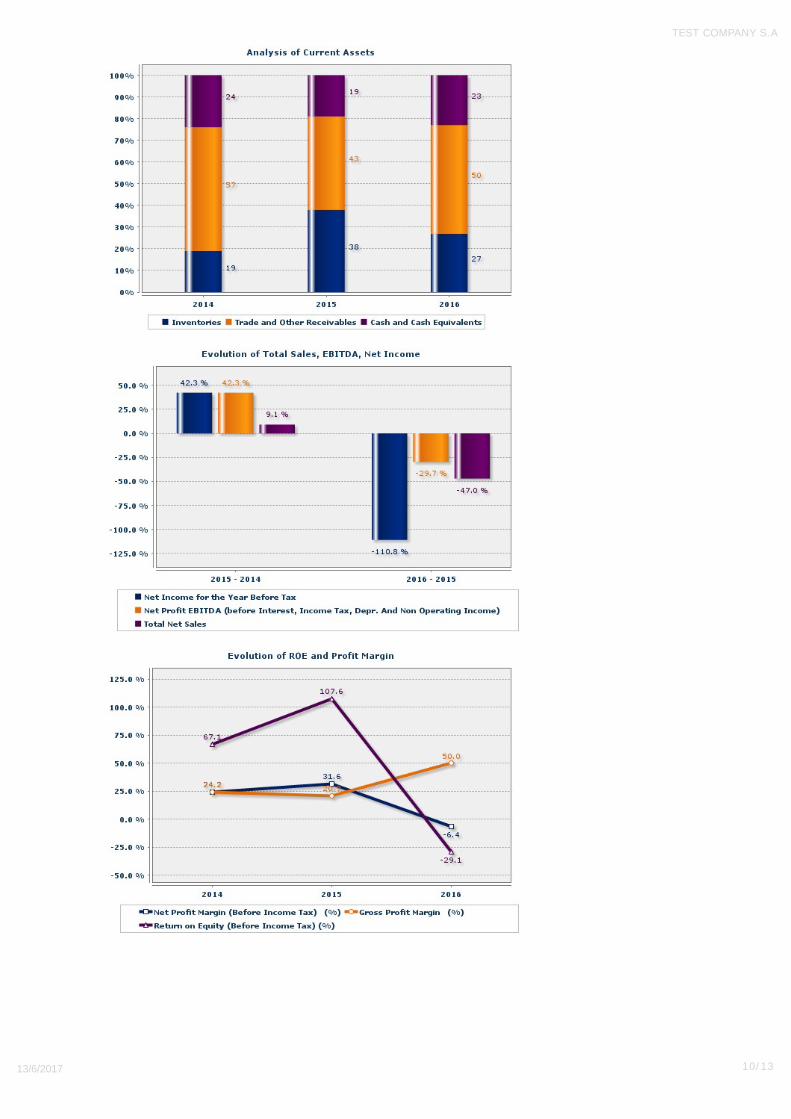
Turnover Income 248,000 -47.01 468,000 9.09 429,000
Net Sales 248,000 -47.01 468,000 9.09 429,000
Total Cost 124,000 -66.49 370,000 13.85 325,000
Cost of Sales 124,000 -66.49 370,000 13.85 325,000
Gross Profit (Loss) 124,000 26.53 98,000 -5.77 104,000
Other Operating Income N /A 50,000 N/A
Administrative Expenses 60,000 N/A N /A
Operating Depreciation Expenses of Fixed Assets 40,000 N/A N /A
Profit/(Loss) Before Tax, Financing andInvesting Results and Depreciation-Amortisation (EBITDA)
104,000 -29.73 148,000 42.31 104,000
Depreciation and Amortisation 40,000 N/A N /A
Profit/(Loss) Before Tax Financing and Investing Results 64,000 -56.76 148,000 42.31 104,000
Financial Expenses 80,000 N/A N /A
Profit/(Loss) Before Tax -16,000 -110.81 148,000 42.31 104,000
Profit/(Loss) for the Period (A) -16,000 -110.81 148,000 42.31 104,000
Values in Euros
Statement of Changes in Equity
Accounts1/1/2016 -
31/12/2016
Change '16 -
'15 (%)
1/1/2015 -
31/12/2015
Change '15 -
'14 (%)
1/1/2014 -
31/12/2014
GFS GFS GFS
Equity Balance According to Previous IFRS 6,000 N/A N/A
Profit/(Loss) for the Period -16,000 N/A N /A
Equity Balance Carried forward -10,000 N/A N/A
Values in Euros
Company Ratios
PROFITABILITY RATIOS
Ratios31/12/2016 Change '16 - '15
(%)
31/12/2015 Change '15 - '14
(%)
31/12/2014
Return on Equity (Before Income Tax) (%) -29.09 -127.02% 107.64 60.42% 67.10
Return on Equity (Before Interest and Income Tax)
(%)116.36 8.10% 107.64 60.42% 67.10
Return on Capital Employed (Before Income Tax)
(%)-4.51 -111.78% 38.19 30.34% 29.30
Return on Capital Employed (Before Interest and
Income Tax) (%)18.03 -52.79% 38.19 30.34% 29.30
Gross Profit Margin (%) 5 0 138.78% 20.94 -13.61% 24.24
Operating Profitability (%) 25.81 -18.37% 31.62 30.44% 24.24
Net Profit Margin (Before Income Tax) (%) -6.45 -120.37% 31.62 30.44% 24.24
Net Profit Margin (Before Interest and Income Tax)
(%)25.81 -18.37% 31.62 30.44% 24.24
TEST COMPANY S.A
13/6/2017 7/13
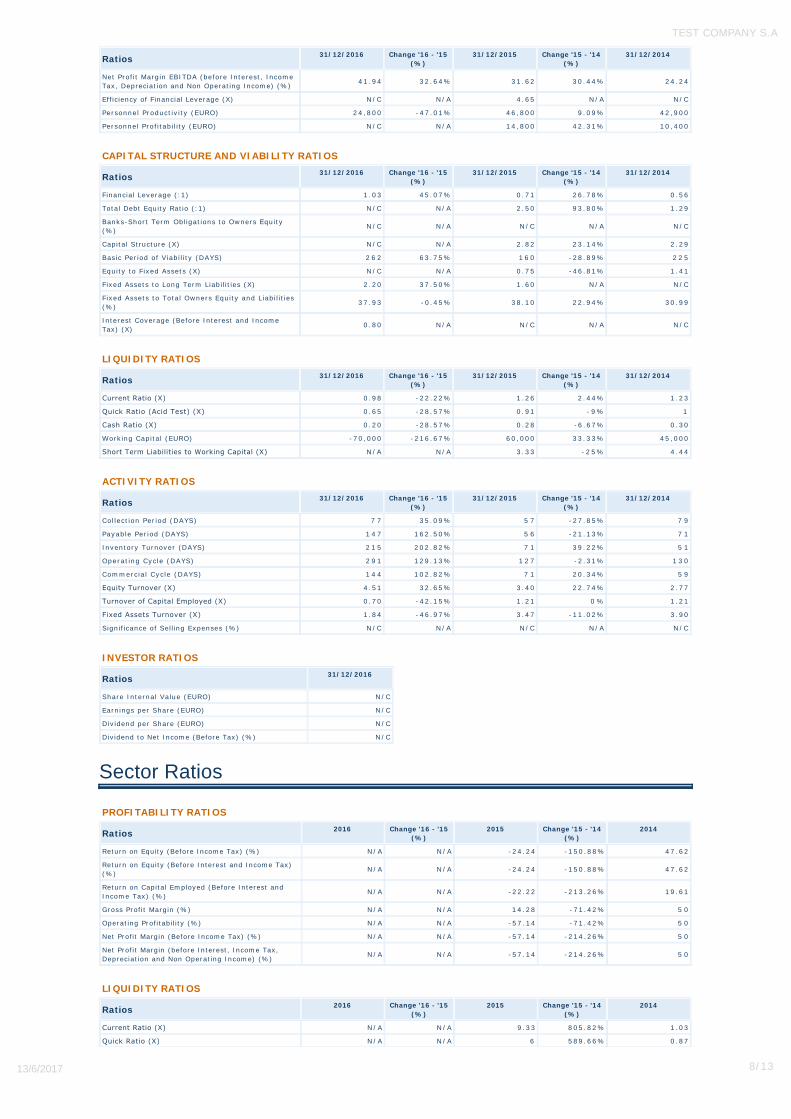
Ratios31/12/2016 Change '16 - '15
(%)
31/12/2015 Change '15 - '14
(%)
31/12/2014
Net Profit Margin EBITDA (before Interest, Income
Tax, Depreciation and Non Operating Income) (%)41.94 32.64% 31.62 30.44% 24.24
Efficiency of Financial Leverage (X) N/C N/A 4.65 N/A N/C
Personnel Productivity (EURO) 24,800 -47.01% 46,800 9.09% 42,900
Personnel Profitability (EURO) N/C N/A 14,800 42.31% 10,400
CAPITAL STRUCTURE AND VIABILITY RATIOS
Ratios31/12/2016 Change '16 - '15
(%)
31/12/2015 Change '15 - '14
(%)
31/12/2014
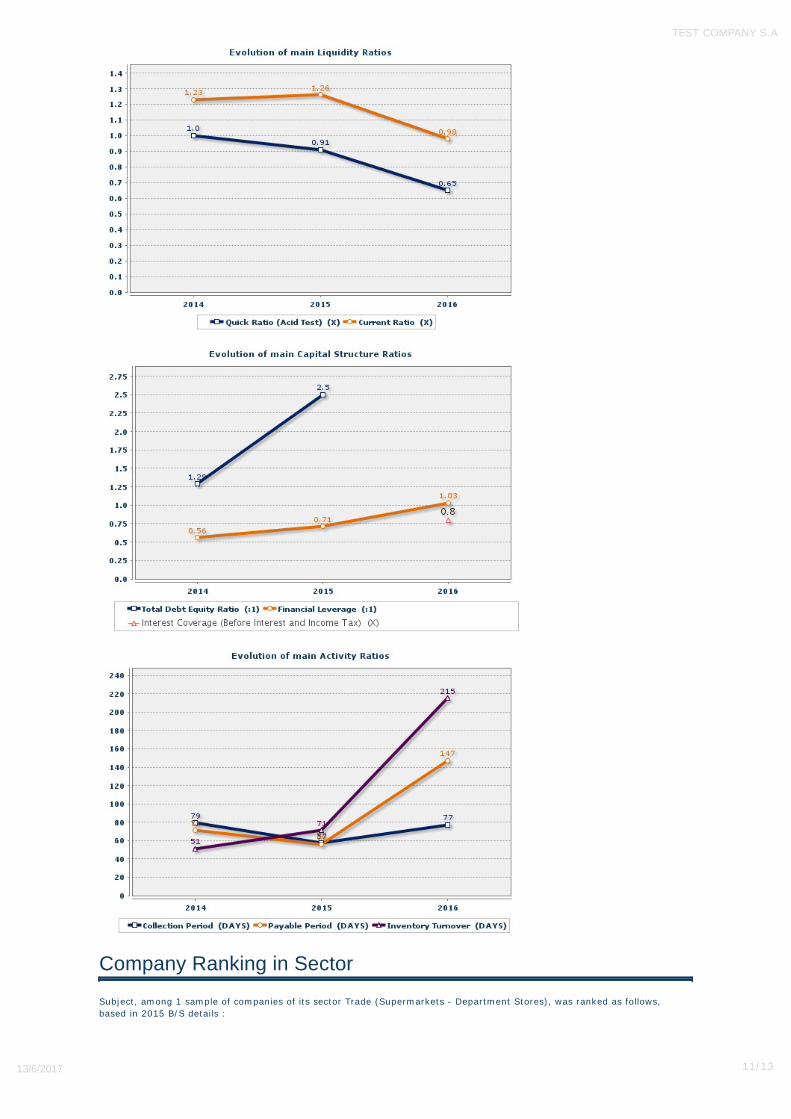
Financial Leverage (:1) 1.03 45.07% 0.71 26.78% 0.56
Total Debt Equity Ratio (:1) N/C N/A 2.50 93.80% 1.29
Banks-Short Term Obligations to Owners Equity
(%)N/C N/A N/C N/A N/C
Capital Structure (X) N/C N/A 2.82 23.14% 2.29
Basic Period of Viability (DAYS) 2 6 2 63.75% 1 6 0 -28.89% 2 2 5
Equity to Fixed Assets (X) N/C N/A 0.75 -46.81% 1.41
Fixed Assets to Long Term Liabilities (X) 2.20 37.50% 1.60 N/A N/C
Fixed Assets to Total Owners Equity and Liabilities
(%)37.93 -0.45% 38.10 22.94% 30.99
Interest Coverage (Before Interest and Income
Tax) (X)0.80 N/A N/C N/A N/C
LIQUIDITY RATIOS
Ratios31/12/2016 Change '16 - '15
(%)
31/12/2015 Change '15 - '14
(%)
31/12/2014
Current Ratio (Χ) 0.98 -22.22% 1.26 2.44% 1.23
Quick Ratio (Acid Test) (Χ) 0.65 -28.57% 0.91 - 9 % 1
Cash Ratio (Χ) 0.20 -28.57% 0.28 -6.67% 0.30
Working Capital (EURO) -70,000 -216.67% 60,000 33.33% 45,000
Short Term Liabilities to Working Capital (Χ) N/A N/A 3.33 - 2 5 % 4.44
ACTIVITY RATIOS
Ratios31/12/2016 Change '16 - '15
(%)
31/12/2015 Change '15 - '14
(%)
31/12/2014
Collection Period (DAYS) 7 7 35.09% 5 7 -27.85% 7 9
Payable Period (DAYS) 1 4 7 162.50% 5 6 -21.13% 7 1
Inventory Turnover (DAYS) 2 1 5 202.82% 7 1 39.22% 5 1
Operating Cycle (DAYS) 2 9 1 129.13% 1 2 7 -2.31% 1 3 0
Commercial Cycle (DAYS) 1 4 4 102.82% 7 1 20.34% 5 9
Equity Turnover (Χ) 4.51 32.65% 3.40 22.74% 2.77
Turnover of Capital Employed (Χ) 0.70 -42.15% 1.21 0 % 1.21
Fixed Assets Turnover (Χ) 1.84 -46.97% 3.47 -11.02% 3.90
Significance of Selling Expenses (%) N/C N/A N/C N/A N/C
INVESTOR RATIOS
Ratios31/12/2016
Share Internal Value (EURO) N/C
Earnings per Share (EURO) N/C
Dividend per Share (EURO) N/C
Dividend to Net Income (Before Tax) (%) N/C
Sector Ratios
PROFITABILITY RATIOS
Ratios2016 Change '16 - '15
(%)
2015 Change '15 - '14
(%)
2014
Return on Equity (Before Income Tax) (%) N/A N/A -24.24 -150.88% 47.62
Return on Equity (Before Interest and Income Tax)
(%)N/A N/A -24.24 -150.88% 47.62
Return on Capital Employed (Before Interest and
Income Tax) (%)N/A N/A -22.22 -213.26% 19.61
Gross Profit Margin (%) N/A N/A 14.28 -71.42% 5 0
Operating Profitability (%) N/A N/A -57.14 -71.42% 5 0
Net Profit Margin (Before Income Tax) (%) N/A N/A -57.14 -214.26% 5 0
Net Profit Margin (before Interest, Income Tax,
Depreciation and Non Operating Income) (%)N/A N/A -57.14 -214.26% 5 0
LIQUIDITY RATIOS
Ratios2016 Change '16 - '15
(%)
2015 Change '15 - '14
(%)
2014
Current Ratio (Χ) N/A N/A 9.33 805.82% 1.03
Quick Ratio (Χ) N/A N/A 6 589.66% 0.87
TEST COMPANY S.A
13/6/2017 8/13
Ratios2016 Change '16 - '15
(%)
2015 Change '15 - '14
(%)
2014
Working Capital (EURO) N/A N/A 150,000 5 0 % 100,000
ACTIVITY RATIOS
Ratios2016 Change '16 - '15
(%)
2015 Change '15 - '14
(%)
2014
Collection Period (DAYS) N /A N/A 52.14 -68.26% 164.25
Payable Period (DAYS) N /A N/A 30.42 -91.66% 3 6 5
Inventory Turnover (DAYS) N /A N/A 304.17 66.67% 182.50
Equity Turnover (Χ) N/A N/A 0.42 -55.79% 0.95
Turnover of Capital Employed (Χ) N/A N/A 0.39 0 % 0.39
CAPITAL STRUCTURE AND VIABILITY RATIOS
Ratios2016 Change '16 - '15
(%)
2015 Change '15 - '14
(%)
2014
Financial Leverage (:1) N /A N/A 0.14 N/A N/C
Total Debt Equity Ratio (:1) N /A N/A 0.17 N/A N/C
Interest Coverage (Before Interest and Income Tax)
(X)N /A N/A N/C N/A N/C
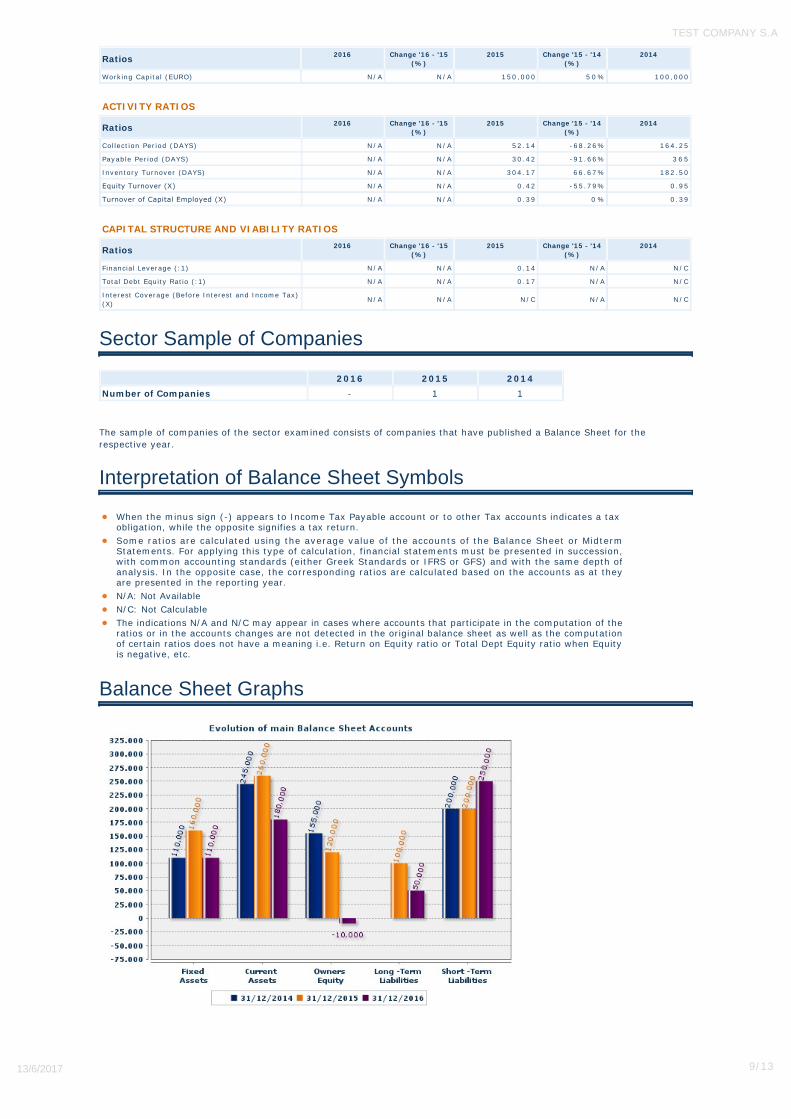
Sector Sample of Companies
2016 2015 2014
Number of Companies - 1 1
The sample of companies of the sector examined consists of companies that have published a Balance Sheet for the
respective year.
Interpretation of Balance Sheet Symbols
• When the minus sign (-) appears to Income Tax Payable account or to other Tax accounts indicates a taxobligation, while the opposite signifies a tax return.
• Some ratios are calculated using the average value of the accounts of the Balance Sheet or MidtermStatements. For applying this type of calculation, financial statements must be presented in succession,with common accounting standards (either Greek Standards or IFRS or GFS) and with the same depth ofanalysis. In the opposite case, the corresponding ratios are calculated based on the accounts as at theyare presented in the reporting year.
• N/A: Not Available
• N/C: Not Calculable
• The indications N/A and N/C may appear in cases where accounts that participate in the computation of theratios or in the accounts changes are not detected in the original balance sheet as well as the computationof certain ratios does not have a meaning i.e. Return on Equity ratio or Total Dept Equity ratio when Equityis negative, etc.
Balance Sheet Graphs
TEST COMPANY S.A
13/6/2017 9/13
TEST COMPANY S.A
13/6/2017 10/13
Company Ranking in Sector
Subject, among 1 sample of companies of its sector Trade (Supermarkets - Department Stores), was ranked as follows,
based in 2015 B/S details :
TEST COMPANY S.A
13/6/2017 11/13
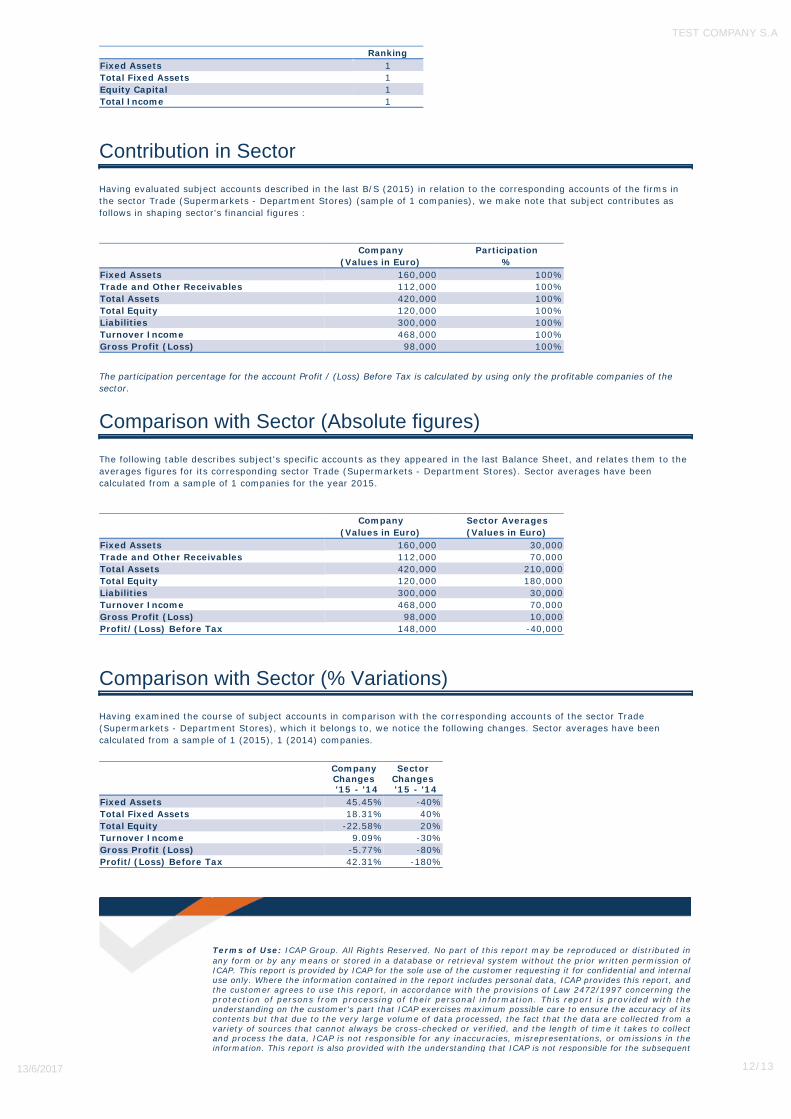
Ranking
Fixed Assets 1
Total Fixed Assets 1
Equity Capital 1
Total Income 1
Contribution in Sector
Having evaluated subject accounts described in the last B/S (2015) in relation to the corresponding accounts of the firms in
the sector Trade (Supermarkets - Department Stores) (sample of 1 companies), we make note that subject contributes as
follows in shaping sector's financial figures :
Company Participation
(Values in Euro) %
Fixed Assets 160,000 100%
Trade and Other Receivables 112,000 100%
Total Assets 420,000 100%
Total Equity 120,000 100%
Liabilities 300,000 100%
Turnover Income 468,000 100%
Gross Profit (Loss) 98,000 100%
The participation percentage for the account Profit / (Loss) Before Tax is calculated by using only the profitable companies of the
sector.
Comparison with Sector (Absolute figures)
The following table describes subject's specific accounts as they appeared in the last Balance Sheet, and relates them to the
averages figures for its corresponding sector Trade (Supermarkets - Department Stores). Sector averages have been
calculated from a sample of 1 companies for the year 2015.
Company Sector Averages
(Values in Euro) (Values in Euro)
Fixed Assets 160,000 30,000
Trade and Other Receivables 112,000 70,000
Total Assets 420,000 210,000
Total Equity 120,000 180,000
Liabilities 300,000 30,000
Turnover Income 468,000 70,000
Gross Profit (Loss) 98,000 10,000
Profit/(Loss) Before Tax 148,000 -40,000
Comparison with Sector (% Variations)
Having examined the course of subject accounts in comparison with the corresponding accounts of the sector Trade
(Supermarkets - Department Stores), which it belongs to, we notice the following changes. Sector averages have been
calculated from a sample of 1 (2015), 1 (2014) companies.
CompanyChanges
'15 - '14
SectorChanges
'15 - '14
Fixed Assets 45.45% -40%
Total Fixed Assets 18.31% 40%
Total Equity -22.58% 20%
Turnover Income 9.09% -30%
Gross Profit (Loss) -5.77% -80%
Profit/(Loss) Before Tax 42.31% -180%
Terms of Use: ICAP Group. All Rights Reserved. No part of this report may be reproduced or distributed in
any form or by any means or stored in a database or retrieval system without the prior written permission ofICAP. This report is provided by ICAP for the sole use of the customer requesting it for confidential and internaluse only. Where the information contained in the report includes personal data, ICAP provides this report, andthe customer agrees to use this report, in accordance with the provisions of Law 2472/1997 concerning theprotection of persons from processing of their personal information. This report is provided with theunderstanding on the customer's part that ICAP exercises maximum possible care to ensure the accuracy of itscontents but that due to the very large volume of data processed, the fact that the data are collected from avariety of sources that cannot always be cross-checked or verified, and the length of time it takes to collectand process the data, ICAP is not responsible for any inaccuracies, misrepresentations, or omissions in theinformation. This report is also provided with the understanding that ICAP is not responsible for the subsequent
TEST COMPANY S.A
13/6/2017 12/13

use interpretation or use of the information in this report.
The Evaluation of Creditworthiness (ICAP Score) is a classification not issued in accordance with therequirements of Regulation 1060/2009 of the European Parliament and of the Council on credit rating agencies,as it applies to ICAP Credit Rating.
For more information please visit www.icap.gr
For any additional information or clarifications regarding this report please contact us at telephone: +30
2107200399, email: [email protected] information regarding pending orders please contact us at telephone +30 2107200349, email:
For any further information regarding ICAP Group services, please contact our Customer Care Department at
telephone: +30 210 7200050, email: [email protected].
TEST COMPANY S.A
13/6/2017 13/13