Embed Size (px)
Citation preview

UNESCO SCIENCE REPORT
In 2004, Professors André Geim and Kostya Novoselov from the University of Manchester in the UK isolated graphene, a material with potentially endless applications. Ultra-light, it is 200 times stronger than steel, yet extremely flexible. It can retain heat, yet is fire-resistant. It can also act as an impenetrable barrier, as not even helium can pass through it. This discovery earned Professors Geim and Novoselov the Nobel Prize in Physics in 2010.Photo: © Bonninstudio/Shutterstock.com
The European Union has adopted an energetic programme to 2020 to conjugate the crisis and foster smart, inclusive and sustainable growth, Europe 2020.Hugo Hollanders and Minna Kanerva
230

European Union
231
Chapter 9
INTRODUCTION
A region in a protracted crisis With the accession of Croatia in 2013, the European Union’s membership swelled to 28 countries, representing a combined population of 507.2 million, or 7.1% of the global population (Table 9.1). The European Union (EU) is expected to expand further: Albania Montenegro, Serbia, the Former Yugoslav Republic of Macedonia and Turkey are all candidate countries that are in the process of integrating EU legislation into their national legal systems, whereas Bosnia
and Herzegovina and Kosovo1 have the status of potential candidates. Between 2004 and 2013, GDP increased by almost 47% in the 10 countries that had joined2 the EU in 2004, compared to close to 20% for the ‘older’ EU15 countries.
1. Reference to Kosovo should be understood to be in the context of United NationsSecurity Council resolution 1244 (1999).
2. The EU was founded in 1957 by six countries: Belgium, France, Germany, Italy,Luxembourg and the Netherlands. Denmark, Ireland and the UK joined in 1973, Greece, Portugal and Spain in 1981 and Austria, Finland and Sweden in 1995. These 15 countries are known as the EU15. In 2004, ten more countries swelled the EU’s ranks: Cyprus, Czech Republic, Estonia, Hungary, Latvia, Lithuania, Malta, Poland, Slovakia and Slovenia. They were followed by Bulgaria and Romania in 2007 and by Croatia in 2013.
Source: Eurostat
Table 9.1: Population, GDP and unemployment rates in the EU, 2013
Population 2013(million)
5-year GDPgrowth rate(PPP €, %)
GDP per capita2013 (PPP €)
Unemployment rate2013 (%)
5-year change in unemployment rate
(%)
Unemployment rate, persons below 25
years 2013 (%)
5-year change in Unemployment rate
– persons below 25 years (%)
EU28 507.2 4.2 26 600 10.8 3.8 23.6 7.8
Austria 8.5 8.3 34 300 4.9 1.1 9.2 1.2
Belgium 11.2 10.4 31 400 8.4 1.4 23.7 5.7
Bulgaria 7.3 4.9 12 300 13.0 7.4 28.4 16.5
Croatia 4.3 -5.2 15 800 17.3 8.7 50.0 26.3
Cyprus 0.9 -1.5 24 300 15.9 12.2 38.9 29.9
Czech Rep. 10.5 3.4 21 600 7.0 2.6 18.9 9.0
Denmark 5.6 4.9 32 800 7.0 3.6 13.0 5.0
Estonia 1.3 7.9 19 200 8.6 3.1 18.7 6.7
Finland 5.4 -1.3 30 000 8.2 1.8 19.9 3.4
France 65.6 6.4 28 600 10.3 2.9 24.8 5.8
Germany 82.0 9.5 32 800 5.2 -2.2 7.8 -2.6
Greece 11.1 -21.0 19 300 27.5 19.7 58.3 36.4
Hungary 9.9 7.4 17 600 10.2 2.4 26.6 7.1
Ireland 4.6 3.9 34 700 13.1 6.7 26.8 13.5
Italy 59.7 -1.0 26 800 12.2 5.5 40.0 18.7
Latvia 2.0 2.4 17 100 11.9 4.2 23.2 9.6
Lithuania 3.0 9.8 19 200 11.8 6.0 21.9 8.6
Luxembourg 0.5 14.1 68 700 5.9 1.0 16.9 -0.4
Malta 0.4 16.3 23 600 6.4 0.4 13.0 1.3
Netherlands 16.8 -0.8 34 800 6.7 3.6 11.0 4.7
Poland 38.5 27.4 17 800 10.3 3.2 27.3 10.1
Portugal 10.5 -2.3 20 000 16.4 7.7 38.1 16.6
Romania 20.0 10.4 14 100 7.1 1.5 23.7 6.1
Slovakia 5.4 8.5 20 000 14.2 4.6 33.7 14.4
Slovenia 2.1 -3.9 21 800 10.1 5.7 21.6 11.2
Spain 46.7 -4.7 24 700 26.1 14.8 55.5 31.0
Sweden 9.6 7.9 34 000 8.0 1.8 23.6 3.4
UK 63.9 1.6 29 000 7.6 2.0 20.7 5.7
9 . European Union Austria, Belgium, Bulgaria, Croatia, Cyprus, Czech Republic, Denmark, Estonia, Finland, France, Germany, Greece,Hungary, Ireland, Italy, Latvia, Lithuania, Luxembourg, Malta, Netherlands, Poland, Portugal, Romania, Spain, Slovakia, Slovenia, Sweden, UK
Hugo Hollanders and Minna Kanerva

UNESCO SCIENCE REPORT
232
The first signs of the economic stagnation that has plagued the EU since 2008 were already visible in the UNESCO Science Report 2010. Over the cumulative five-year period to 2013, real growth in the EU only amounted to 4.2%. Real GDP even declined over this period in Croatia, Cyprus, Finland, Italy, the Netherlands, Portugal, Slovenia and Spain, albeit to a modest extent, and much more severely in Greece. Belgium, Luxembourg, Malta, Poland and Romania, on the other hand, enjoyed real growth of 10% or more. In 2013, average GDP per capita amounted to € 26 600 for the EU28 as a whole but this figure masked wide differences: per capita GDP was lowest in the three newest member states, Bulgaria, Croatia and Romania, at less than € 16 000, close to € 35 000 in Austria, Ireland, the Netherlands and Sweden and as high as € 68 700 in Luxembourg.
The rising average unemployment rate in the EU is cause for concern but even more unsettling are the large differences among member states. In 2013, 11% of the European active
population was unemployed, on average, an increase of nearly four percentage points over 2008. The youth unemployment rate was even higher, at almost 24% in 2013, having risen nearly eight percentage points since 2008. Worst hit were Greece and Spain, where more than one in four were job-seekers. In Austria, Germany and Luxembourg, on the other hand, the unemployment rate was lower than 6%. Germany also stands out for being the only country where the situation improved over the five-year period: from 7.4% in 2008 to 5.2% in 2013. A similar pattern can be observed for youth unemployment, with rates of 50% or more in Croatia, Greece and Spain. This compares with less than 10% in Austria and Germany. Germany and Luxembourg are the only two countries where the situation has improved since 2008.
In many member states, public debt soared between 2008 and 2013 (Figure 9.1). Hardest hit were Cyprus, Greece, Ireland and Portugal. Public debt progressed least in Bulgaria,
Source: Eurostat, April 2015; aggregate debt-to-GDP ratios for non-Eurozone countries based on authors’ calculations
Figure 9.1: Government debt to GDP ratio for selected EU countries, 2008–2013 (%)
0
20
40
60
80
100
120
140
160
180
Greece
Portugal
Italy
Ireland
BelgiumCypru
s
FranceSpain UK
Germany
Slovenia
Netherla
nds
Finland
PolandEU28
Eurozo
ne
Non-Euro co
untries
2008 2009 2010 2011 2012 2013

Chapter 9
233
European Union
Hungary, Luxembourg, Poland and Sweden, all countries (with the notable exception of Luxembourg) which had not adopted the euro as their national currency. In most cases, the increase in public debt resulted from governments bailing out3 banks. Many governments have implemented austerity programmes to reduce their budget deficits but these cuts have actually pushed up levels of public debt relative to GDP, delaying the return to growth. As a result, most member states have experienced one or more periods of recession since 2008, defined as two or more consecutive quarters where GDP declined in comparison to the previous period. Between 2008 and 2014, Greece, Croatia, Cyprus, Italy, Portugal and Spain were all in recession for more than 40 months. The only countries to have escaped recession altogether are Bulgaria, Poland and Slovakia (Figure 9.2).
3. Spain managed to leave the bailout mechanism in 2014.
A serious debt crisis in the Eurozone Nineteen member states4 have adopted the euro as their common currency. In 2013, the countries of the Eurozone accounted for two-thirds of the EU28 population and for more than 73.5% of its GDP. Average GDP per capita was higher in the Eurozone than for the EU28 as a whole. Debt to GDP ratios in the Eurozone are, however, significantly higher than those of non-euro countries, even though these ratios have risen at about the same rate. The notable exceptions are Cyprus, Greece, Portugal, Ireland and Spain, where the debt to GDP ratio has soared.
Greece has been particularly hard hit by the economic crisis. Between 2008 and 2013, it was in recession for 66 out of
4. The euro replaced national currencies on 1 January 2002 in Austria, Belgium, Finland, France, Germany, Greece, Ireland, Italy, Luxembourg, Netherlands, Portugal and Spain. The euro was later adopted also by Slovenia (2007), Cyprus and Malta (2008), Slovakia (2009), Estonia (2011), Latvia (2014) and Lithuania (2015).
Note: For Croatia, data are only available up to the first quarter of 2014. Bulgaria, Poland and Slovakia do not figure here, as they did not experience any recession period. Slovakia is a member of the Eurozone. All other 18 members of the Eurozone are shown in italics.
Source: OECD and Eurostat
Figure 9.2: Recession periods in the European Union, 2008–2014
2008 2009 2010 2011 2012 2013 2014
Austria
Belgium
Croatia
Cyprus
Czech Republic
Denmark
Estonia
Finland
France
Germany
Greece
Hungary
Ireland
Italy
Latvia
Lithuania
Luxembourg
Malta
Netherlands
Portugal
Romania
Slovenia
Spain
Sweden
UK

UNESCO SCIENCE REPORT
234
a 20% increase in energy efficiency (known as the 20:20:20 target);
n School dropout rates should be reduced to below 10% and at least 40% of people between 30 and 34 years of age should have completed tertiary education;
n The number of persons at risk of poverty or social exclusion should be reduced by at least 20 million.
The EU has launched seven flagship initiatives to support the Europe 2020 objectives of fostering smart, sustainable and inclusive growth:
Smart growthn The Digital Agenda for Europe sets out ‘to exploit the
potential of ICTs better by promoting a digital single market;’
n The Innovation Union sets out to create an innovation-friendly environment that makes it easier to transform great ideas into products and services that will generate growth and jobs; and
n Youth on the Move sets out to improve young people’s education and employability, to reduce high youth unemployment by making education and training more relevant to young people’s needs, by encouraging more young people to take advantage of EU grants to study or train in another country and by encouraging member states to simplify the transition from education to work.
Sustainable growthn A Resource-efficient Europe provides a long-term
framework supporting policy agendas for climate change, energy, transport, industry, raw materials, agriculture, fisheries, biodiversity and regional development to promote a shift towards a resource-efficient, low-carbon economy to achieve sustainable growth;
n An Industrial Policy for Globalisation aims to boost growth and jobs by maintaining and supporting a strong, diversified and competitive industrial base that offers well-paid jobs while becoming more resource-efficient.
Inclusive growthn An Agenda for New Skills and Jobs aims to reach the
employment target for 2020 of 75% of the working-age population by stepping up reforms that improve flexibility and security in the labour market by equipping people with the right skills for the jobs of today and tomorrow, improving the quality of jobs, ensuring better working conditions and by improving the conditions for job creation;
n The European Platform against Poverty is designed to help reach the target of lifting 20 million people out of poverty and social exclusion by 2020.
72 months. Whereas the economy of most member states had recovered to at least 95% of its size in 2008 by 2013, Greece managed less than 80%. Unemployment in Greece has increased from 7.8% in 2008 to 27.5% in 2013 and the debt to GDP ratio from 109 to 175. Financial markets’ worries as to whether Greece will be able to repay its debt to the European Central Bank and the International Monetary Fund have had a negative impact on the exchange rate of the euro and on the interest rates of not only Greece but also other Eurozone countries such as Italy, Portugal and Spain. Despite a third bailout being negotiated in July 2015, there remains a real risk of a Greek exit (Grexit) from the Eurozone.
IN SEARCH OF A GROWTH STRATEGY THAT WORKSEurope 2020: a strategy for smart growthUnder José Manuel Barroso, the European Commission’s5 president from November 2004 to October 2014, the EU adopted a ten-year strategy in June 2010 to help the EU emerge from the financial and economic crisis in a stronger position by embracing smart, sustainable and inclusive growth (European Commission, 2010). Dubbed Europe 2020, the strategy6 observed that ‘the crisis has wiped out years of economic and social progress and exposed structural weaknesses in Europe’s economy’ that have created a productivity gap. These structural weaknesses include low levels of investment in research and development (R&D), differences in business structures, market barriers and insufficient use of information and communication technologies (ICTs). The strategy deals with short-term challenges linked to the economic crisis and introduces structural reforms needed to modernize the European economy, at a time when the region is confronted with ageing societies. Five main targets are to be met by the EU as a whole by 2020 in the areas of employment, innovation, climate and energy, education and social inclusion namely:
n At least 75% of people between 20 and 64 years of age should be employed;
n On average, 3% of GDP should be invested in R&D;
n Greenhouse gas emissions should be reduced by at least 20% compared to emission levels in 19907, 20% of energy should come from renewables and there should be
5. Headquartered in Brussels (Belgium), the European Commission is the EU’s executive body. Its main roles are to propose legislation; enforce European law; set objectives and priorities for action; manage and implement EU policies and the budget; and to represent the EU beyond Europe. A new team of 28 commissioners is appointed every five years, one from each member state.
6. Europe 2020 has inspired the Western Balkans’ own strategy to 2020. See Chapter 10.
7. The target for 2020 would be 30%, if conditions at the global level were right.However, the EU recently adopted an even more ambitious target, a 40% reduction in its emissions by 2030, see: http://ec.europa.eu/clima/policies/2030/index_en.htm.

235
Chapter 9
European Union
Juncker’s ambitious investment planShortly after succeeding the Barroso Commission in October 2014, the Juncker Commission – in reference to Jean-Claude Juncker, the Commission’s new president – proposed a three-pronged strategy for inversing the decline in investment to GDP ratios since 2008 even among member states not fighting banking and debt crises. The Juncker Plan for Investment in Europe involves:
n setting up a European Fund for Strategic Investment to support enterprises with fewer than 3 000 employees;
n establishing a European investment project pipeline and European Investment Advisory Hub at EU level to provide investment projects with technical assistance; and
n structural reforms to improve the framework conditions affecting the business environment.
The European Fund for Strategic Investment was approved by the European Commission on 22 July 2015.8 It has attracted mixed reactions. Some consider its ambition of using € 21 billion in public funds to leverage € 294 billion in private investment by 2018 to be unrealistic. The fact that almost the entire € 21 billion from the public purse is being diverted from existing innovation policy instruments delivering relatively high rates of return has sparked an outcry from leading representatives of the EU science establishment (Attané, 2015). The plan to allocate € 5 billion of the € 21 billion to SMEs has also been criticized, on the grounds that firms should be supported according to their potential for growth, rather than their size.
The € 21 billion includes € 5 billion to come from the European Investment Bank, € 3.3 billion from the Connecting Europe Facility and €2.7 billion from Horizon 2020, the EU’s Eighth Framework Programme for Research and Technological Development (2014–2020).
The € 2.7 billion being drawn from Horizon 2020 has already led to cuts to several programmes. The biggest loser is the European Institute of Innovation and Technology (EIT), headquartered in Budapest (Hungary). It was set up in 2008 to foster innovation-driven growth by supporting qualifications (PhD programmes) and projects (through awards) that enhance collaboration between innovation drivers in the education, research and business sectors. EIT is expected to lose € 350 million, or 13% of its budget, between 2015 and 2020. Another casualty is the European Research Council, which was set up in 2007 to fund basic research, it is expected to lose € 221million. This represents a fraction of its € 13 billion budget over the Horizon 2020 period (2014–2020). Other cuts to the Horizon 2020 budget will affect sectorial research projects on ICTs (€ 307 million), nanotechnology and advanced materials (€ 170 million).
8. See: http://europa.eu/rapid/press-release_IP-15-5420_en.htm
The plan excludes thematic or geographic ‘pre-allocations’, even though it designates the following as focus areas: infrastructure, notably broadband, energy networks and transport; education; R&D and energy efficiency and renewable energy. Perhaps a more important weakness lies in the absence of concrete targets and timelines for the third element9 of the Juncker plan concerning reform of the framework conditions for research and innovation, such as researcher mobility or open access to scientific research.
TRENDS IN R&D
Chequered progress towards Europe 2020 targetsThe EU is making progress towards some of Europe 2020’s targets but not all (European Commission, 2014c). For instance, the total employment rate of 68.4% in 2012 was below that of 2008 (70.3%) and, extrapolating current trends, the employment rate is expected to reach 72% by 2020, still three percentage points below the target.
The rate of early school-leavers dropped from 15.7% to 12.7% and the share of 30–34 year olds who had completed tertiary education rose from 27.9% to 35.7% between 2005 and 2012. On the other hand, the number of people at risk of poverty and social exclusion increased between 2009 and 2012 from 114 million to 124 million.
Elusive R&D targetsIn terms of research funding, the Europe 2020 strategy hopes to succeed where the Lisbon Strategy (2000) has failed. The latter had called for the EU’s average gross domestic expenditure on R&D (GERD) to rise to 3% of GDP by 2010. Europe 2020 sets the delivery date for this target back to 2020. Between 2009 and 2013, the EU28 made relatively little progress towards this target, with average R&D intensity increasing only from 1.94% to 2.02%, a feat no doubt facilitated by repeated periods of recession. At this rate, it does not look as if the EU will make the new deadline (Table 9.2).
Some countries are already there, of course. At one end of the spectrum, Denmark, Finland and Sweden already spend 3% or more of GDP on R&D and should soon be joined by Germany. At the other end of the spectrum, many countries still spend less than 1% of GDP on R&D.
There are also large differences in the targets set for 2020, with Finland and Sweden aiming for an R&D intensity of 4%, whereas Cyprus, Greece and Malta are targeting less than 1%. Bulgaria, Latvia, Lithuania, Luxembourg, Poland, Portugal and Romania all aim to at least double their R&D intensity by 2020.
9. The first two elements concerned reform of the banking union and the creation of a single market in energy.

236
UNESCO SCIENCE REPORT
Less high-tech R&D than Japan and the USAThe Lisbon Strategy fixed the target of having business contribute two-thirds of GERD (2% of GDP) by 2010. This target has not been reached either, although the business sector funds more than half of R&D (55%), on average (Figure 9.3). Business is currently the largest source of R&D funding in 20 member states, with shares of 60% or more of GERD in Belgium, Denmark, Finland, Germany and Slovenia. The general pattern in the EU is that the business sector spends more money on performing research than it does on financing it. This is the case in all but Lithuania and Romania. Interestingly, funding from abroad is the most important source for Lithuania, as also for Bulgaria and Latvia. As a group, the first 15 members of the EU lag behind many advanced economies when it comes to the intensity of business R&D (Figure 9.4). This largely reflects the economic structures of some of the larger member states such as Italy,
Spain and the UK that are less focused than other economies on technology-intensive industries.
Company-level R&D intensity (as a share of net sales) tends to be strongly correlated with the productive sector. The EU R&D Scoreboard shows that EU businesses tend to be more heavily concentrated in R&D of medium-to-low and low intensity, in comparison to their principal competitors, the other two members of the Triad, the USA and Japan (Table 9.3 and Figure 9.5).
Moreover, although EU-based companies accounted for 30.1% of total R&D spending by the world’s top 2 500 companies, there are only two EU-based companies in the top ten, both of them German and both in the automotive sector (Table 9.3). Indeed, the top three R&D performers in the EU are the German automotive companies Volkswagen, Daimler and BMW (Tables 9.3 and 9.4). The automotive sector represents one-quarter of R&D spending by EU companies covered in the EU R&D Scoreboard, three-quarters of which is accounted for by German automotive companies.
The EU is largely absent from the arena of internet-based companies active in new and emerging forms of innovation. According to Downes (2015), none of the 15 largest public internet companies today are European. Eleven are US-based and the remainder are Chinese. Indeed, the EU’s attempts to replicate a Silicon Valley-type experience10 have not lived up to expectations. The principal EU giants specializing in hardware within the digital economy (Siemens, Ericsson, Nokia) have even lost a lot of ground in the past decade in global R&D rankings. Nonetheless, the German-based software and IT services company SAP has recently joined the global top 50 R&D performers (Table 9.3).
Business R&D performance in the EU has also been weighed down by the disappointing growth of R&D in sectors such as pharmaceuticals and biotechnology (0.9 % R&D growth in 2013) or technology hardware and equipment (-5.4%), which are typically R&D-intensive. Whereas the EU is almost on a par with the USA in pharmaceuticals, it trails the USA in the area of biotechnology (Tables 9.5 and 9.6).
There are emerging concerns in Europe about the erosion of its science base through takeover bids from competitors. One illustration of this concern is the aborted takeover bid by the US pharmaceutical company Pfizer in 2014. Pfizer found itself obliged to reassure the UK government that its £ 63 billion bid to buy the Anglo-Swedish pharmaceutical company AstraZeneca would not affect research jobs in the UK. Although Pfizer promised that a combined company would
10. One example is the technology cluster in central and east London known as Tech City. See: www.techcityuk.com
* or latest available year** The national target of 2.5% of GNP is estimated as being equal to 2.0% of GDP.
Source: Eurostat, January 2015
Table 9.2: GERD/GDP ratio in the EU28 in 2009 and 2013 and targets to 2020 (%)
GERD/GDP ratio, 2009
GERD/GDP ratio, 2013*
Target for 2020
Industry-financed share of GERD, 2013*
EU28 1.94 2.02 3.00 54.9Austria 2.61 2.81 3.76 44.1Belgium 1.97 2.28 3.00 60.2Bulgaria 0.51 0.65 1.50 19.4Croatia 0.84 0.81 1.40 42.8Cyprus 0.45 0.48 0.50 10.9Czech Rep. 1.30 1.91 – 37.6Denmark 3.07 3.05 3.00 59.8Estonia 1.40 1.74 3.00 41.3Finland 3.75 3.32 4.00 60.8France 2.21 2.23 3.00 55.4Germany 2.73 2.94 3.00 66.1Greece 0.63 0.78 0.67 32.1Hungary 1.14 1.41 1.80 46.8Ireland 1.39 1.58 2.00** 50.3Italy 1.22 1.25 1.53 44.3Latvia 0.45 0.60 1.50 21.8Lithuania 0.83 0.95 1.90 27.4Luxembourg 1.72 1.16 2.30–2.60 47.8Malta 0.52 0.85 0.67 44.3Netherlands 1.69 1.98 2.50 47.1Poland 0.67 0.87 1.70 37.3Portugal 1.58 1.36 3.00 46.0Romania 0.46 0.39 2.00 31.0Slovakia 0.47 0.83 1.20 40.2Slovenia 1.82 2.59 3.00 63.8Spain 1.35 1.24 2.00 45.6Sweden 3.42 3.21 4.00 57.3UK 1.75 1.63 – 46.5

Chapter 9
237
European Union
Figure 9.3: GERD by source of funds and performing sector, 2013 or latest available year (%) By source of funds
-n = data refer to n years before reference year
Source: Eurostat, January 2015
Business enterprise Government Higher education Private non-pro�t Abroad
7772 69 69 69 69 68 68 65 65 65 64 61 61 58 54 54 54 53 50 48 48 46 44
3531 28 25
15
13
515
9 95 4
15
2
137 12
2330
11 1810
15 19 26
9 6
20 27
27
49
29
20
14
10
2314
22 2226 28
17
32
2126
23
159
3227
36 2828
24
42
38
3329
37
20
43
55
57
913
0
10
20
30
40
50
60
70
80
90
100
Slovenia
Irelan
d-1
Hungary
Belgium
Finland
Austria
Sweden
German
y
Denmark
France UK
EU28
Luxem
bourg
Bulgari
a
Netherla
nds
Czech Republic
Malt
aIta
lySpain
Croat
ia
Estonia
Portugal
Slovak
ia
Poland
Greece
Roman
ia
Latv
ia
Lithuan
ia
Cyprus
66 64 61 60 60 57 55 5550 48 47 47 47 46 46 44 44 44 43 41 40 38 37
32 3127
22 1911
2927
2623
2928 35 33
27 31 34 36
27
43 43
3443
39 4048
39
35
4751 52
35
24 32
66
49 12 13
711 8 10
21 2014 17
21
5 7
20
916 15
1018
27
13 13 16
37
52 48
17
0
10
20
30
40
50
60
70
80
90
100
German
y-1
Slovenia
Finland
Belgium
-2
Denmark
Sweden-2
France-
1
EU28-1
Irelan
d-1
Luxem
bourg-2
Netherla
nds
Hungary UK
Portugal
-1
Spain-1
Malt
aIta
ly-1
Austria
Croat
ia
Estonia
Slovak
ia
Czech Republic
Poland
Greece
Roman
ia
Lithuan
ia
Latv
ia
Bulgari
a
Cyprus-1
By performing sector

238
UNESCO SCIENCE REPORT
employ one-fifth of its research staff in the UK and complete AstraZeneca’s planned £ 300 million hub in Cambridge, Pfizer was forced to admit that research spending would be cut in the combined company. Ultimately, AstraZeneca’s board rejected Pfizer’s offer, concluding that it was motivated by a desire for cost savings and tax minimization in the USA rather than the optimization of drug delivery (Roland, 2015).
The sanctions imposed on the Russian Federation by the EU in 2014 may also have repercussions for EU companies installed in the Russian Federation. Large European multinationals such as Alstom, Ericsson, Nokia, Siemens and SAP have all set up R&D centres in technoparks like Sistema-Sarov, or are participating in the flagship Skolkovo research facility (see Box 13.1).
Only a handful of innovation leadersThe EU’s innovation performance has been monitored since 2001 by the annual European Innovation Scoreboard, which was restyled and renamed the Innovation Union Scoreboard in 2010. The latest Innovation Union Scoreboard uses a measurement framework distinguishing between three main types of indicators (enablers, firm activities and output) and eight innovation dimensions, capturing in total 25
indicators (European Commission, 2015a). Overall innovation performance is measured by the Summary Innovation Index on a scale from 0 (the worst-performing country) to 1 (the best-performing country). On the basis of this index, EU regions can be divided into four different groups: innovation leaders, with an innovation performance well above the EU average, innovation followers, with an innovation performance close to the EU average, moderate innovators slightly below the EU average and modest innovators well below the EU average (Figure 9.6).
The innovation performance of most member states improved between 2007 and 2014, notable exceptions being Cyprus, Romania and Spain. Of note is that growth has been positive but very modest for Finland, Greece and Luxembourg. Over time, the innovative performance of countries is converging. However, the innovation performance did weaken for as many as 13 member states between 2013 and 2014, particularly for Cyprus, Estonia, Greece, Romania and Spain but also for the more innovative countries of Austria, Belgium, Germany, Luxembourg and Sweden. The declining share of enterprises active in innovation, coupled with the drop in public–private co-publications and lower venture capital investment, all signal a possible (delayed) repercussion of the economic crisis on businesses.
Figure 9.4: BERD as a share of GDP in the EU, 2005 and 2013 (%)Other economies are given for comparison
Source: OECD’s Main Science and Technology Indicators, July 2015
Korea, Rep.
Japan
USA
Germany
China
France
EU–15
EU–28 UK
CanadaIta
lySpain
Poland
20132005
0.5
0.0
1.0
1.5
2.0
2.5
3.0
3.5
239
Chapter 9
European Union
Table 9.3: The global top 50 companies by R&D volume, 2014
Rank in 2014 Company Country Field
R&D (€ millions)
Change in rank for R&D 2004-2007
R&D intensity*
1 Volkswagen Germany Automobiles & parts 11 743 +7 6.02 Samsung Electronics Korea, Rep. Electronics 10 155 +31 6.53 Microsoft USA Computer hardware & software 8 253 +10 13.14 Intel USA Semiconductors 7 694 +10 20.15 Novartis Switzerland Pharmaceuticals 7 174 +15 17.16 Roche Switzerland Pharmaceuticals 7 076 +12 18.67 Toyota Motors Japan Automobiles & parts 6 270 -2 3.58 Johnson & Johnson USA Medical equipment, pharmaceuticals, consumer goods 5 934 + 4 11.59 Google USA Internet-related products & services 5 736 + 173 13.2
10 Daimler Germany Automobiles & parts 5 379 -7 4.611 General Motors USA Automobiles & parts 5 221 -5 4.612 Merck USA USA Pharmaceuticals 5 165 +17 16.213 BMW Germany Automobiles & parts 4 792 +15 6.314 Sanofi-Aventis France Pharmaceuticals 4 757 +8 14.415 Pfizer USA Pharmaceuticals 4 750 -13 12.716 Robert Bosch Germany Engineering & electronics 4 653 +10 10.117 Ford Motors USA Automobiles & parts 4 641 -16 4.418 Cisco Systems USA Networking equipment 4 564 +13 13.419 Siemens Germany Electronics & electrical equipment 4 556 -15 6.020 Honda Motors Japan Automobiles & parts 4 367 - 4 5.421 Glaxosmithkline UK Pharmaceuticals & biotechnology 4 154 -10 13.122 IBM USA Computer hardware, middleware & software 4 089 -13 5.723 Eli Lilly USA Pharmaceuticals 4 011 +18 23.924 Oracle USA Computer hardware & software 3 735 +47 13.525 Qualcomm USA Semiconductors, telecommunications equipment 3 602 +112 20.026 Huawei China Telecommunications equipment & services 3 589 up > 200 25.627 Airbus Netherlands** Aeronautics 3 581 +8 6.028 Ericsson Sweden Telecommunications equipment 3 485 -11 13.629 Nokia Finland Technology hardware & equipment 3 456 - 9 14.730 Nissan Motors Japan Automobiles & parts 3 447 +4 4.831 General Electric USA Engineering, electronics & electric equipment 3 444 +6 3.332 Fiat Italy Automobiles & parts 3 362 +12 3.933 Panasonic Japan Electronics & electrical equipment 3 297 -26 6.234 Bayer Germany Pharmaceuticals & biotechnology 3 259 -2 8.135 Apple USA Computer hardware & software 3 245 +120 2.636 Sony Japan Electronics & electrical equipment 3 209 -21 21.337 AstraZeneca UK Pharmaceuticals & biotechnology 3 203 -12 17.238 Amgen USA Pharmaceuticals & biotechnology 2 961 +18 21.939 Boehringer Ingelheim Germany Pharmaceuticals & biotechnology 2 743 +23 19.540 Bristol–Myers Squibb USA Pharmaceuticals & biotechnology 2 705 +2 22.841 Denso Japan Automobile parts 2 539 +12 9.042 Hitachi Japan Technology hardware & equipment 2 420 -18 3.743 Alcatel–Lucent France Technology hardware & equipment 2 374 +4 16.444 EMC USA Computer software 2 355 +48 14.045 Takeda Pharmceuticals Japan Pharmaceuticals & biotechnology 2 352 +28 20.246 SAP Germany Software & computer services 2 282 +23 13.647 Hewlett–Packard USA Technology hardware & equipment 2 273 -24 2.848 Toshiba Japan Computer hardware 2 269 -18 5.149 LG Electronics Korea, Rep. Electronics 2 209 +61 5.550 Volvo Sweden Automobiles & parts 2 131 +27 6.9
* R&D intensity is defined as R&D expenditure divided by net sales.** Although incorporated in the Netherlands, Airbus’s principal manufacturing facilities are located in France, Germany, Spain and the UK.
Source: Hernández et. al (2014), Table 2.2

240
UNESCO SCIENCE REPORT
Table 9.5: EU’s relative position in the global top 2 500 R&D companies, 2013
EU USA Japan Other countries
Number of companies 633 804 387 676R&D (€ billions) 162.3 193.6 85.6 96.8Growth in 2010–2013 (%) 5.8 7.0 3.0 9.8World share in 2013 (%) 30.1 36.0 15.9 18.0R&D as a share of net sales (%) 2.7 5.0 3.2 2.2Net sales (€ billions) 5 909.0 3 839.5 2 638.6 4 335.9
Source: Extracted from Hernández et al. (2014), Table 1.2
Table 9.4: Top 40 EU companies for R&D, 2011–2013
Company Base ActivityR&D intensity
( 3-year growth)Sales
(3-year growth)
Volkswagen Germany Automobiles & parts 23.3 15.8Daimler Germany Automobiles & parts 3.5 6.5BMW Germany Automobiles & parts 20.0 7.9Sanofi-Aventis France Pharmaceuticals & biotechnology 2.7 2.7Robert Bosch Germany Automobiles & parts 6.8 -0.8Siemens Germany Electronic & electrical equipment 2.4 3.2Glaxosmithkline UK Pharmaceuticals & biotechnology -2.5 -2.3Airbus Netherlands Aerospace & defence 5.1 9.0Ericsson Sweden Technology hardware & equipment 0.1 3.8Nokia Finland Technology hardware & equipment -11.2 -18.0Fiat Italy Automobiles & parts 20.2 34.3Bayer Germany Pharmaceuticals & biotechnology 0.5 4.6AstraZeneca UK Pharmaceuticals & biotechnology 0.9 -8.2Boehringer Ingelheim Germany Pharmaceuticals & biotechnology 3.8 3.8Alcatel-Lucent France Technology hardware & equipment -3.6 -3.4SAP Germany Software & computer services 9.7 10.5Volvo Sweden Industrial engineering 5.2 1.0Peugeot (PSA) France Automobiles & parts -6.5 -1.2Continental Germany Automobiles & parts 8.0 8.6BASF Germany Chemicals 7.1 5.0Philips The Netherlands General industrials 2.5 3.1Renault France Automobiles & parts 1.2 1.6Finmeccanica Italy Aerospace & defence -3.9 -5.0Novo Nordisk Denmark Pharmaceuticals & biotechnology 8.6 11.2Merck DE Germany Pharmaceuticals & biotechnology 2.5 6.1Stmicroelectronics Netherlands Technology hardware & equipment -6.4 -7.9Banco Santander Spain Banking -2.8 -1.7Safran France Aerospace & defence 31.2 9.5Royal Bank of Scotland UK Banking 6.9 -9.2Telefonica Spain Fixed line telecommunications 5.1 -2.1Unilever The Netherlands Food, cleaning and personal hygiene products 3.9 4.0Alstom France Industrial engineering 0.8 -1.1Telecomitalia Italy Fixed line telecommunications 11.9 -5.3Royal Dutch Shell UK Oil & gas producers 9.0 7.0Total France Oil & gas producers 9.9 6.9Delphi UK Automobiles & parts 9.1 6.0CNH Industrial The Netherlands Industrial engineering 12.7 6.5Servier France Pharmaceuticals & biotechnology 9.0 5.9Seagate Technology Ireland Technology hardware & equipment 11.9 7.3L'Oréal France Personal goods (beauty products, etc) 8.8 5.6
Source: European Commission

European Union
Chapter 9
241
Making it easier for companies to innovateEurope has been a major producer of new knowledge but it has performed less well in turning new ideas into commercially successful products and processes. Science and innovation face a more fragmented market than large economies comprised of only one nation state, such as the USA or Japan (Figure 9.6). The EU thus needs a common research policy to avoid duplicating research efforts in different member states.
EU research policy has had a strong focus on innovation since 2010, thanks to the introduction of the Innovation Union flagship project and the launch, in 2014, of Horizon 2020, the biggest EU research and innovation framework programme ever (European Commission, 2014b). The Innovation Union is one of the EU’s seven flagship projects for reaching its Europe 2020 targets (Table 9.7). This name covers 34 commitments and related deliverables designed to remove the obstacles to innovation –
Table 9.6: EU and US companies in selected R&D-intensive sectors, 2013
Industry Number of companies R&D (€ millions) R&D intensity (%)*
EU USA EU USA EU USA
Health
Pharmaceuticals 47 46 26781.9 29150.0 13.2 14.0
Biotechnology 20 98 1238.4 12287.3 16.0 27.2
Health care equipment & services 23 54 2708.2 7483.5 4.4 3.8
Software & services
Software 33 86 4797.2 22413.9 14.8 15.0
Computer services 15 46 1311.1 6904.8 5.2 6.9
Internet 2 20 97.6 8811.5 6.3 14.3
* R&D intensity is defined as R&D expenditure divided by net sales.
Source: Extracted from Hernández et al. (2014), Table 4.5
Figure 9.5: Employment by R&D intensity, 2005 and 2013 (%)
Note: The data concern 476 EU companies, 525 US companies and 362 Japanese companies out of the world’s top 2 500 companies according to the EU R&D Scoreboard.
Source: Hernández et. al (2014), Figure S3
0
1
2
2005
High R&D density Medium-high Medium-low & low
EU USA Japan EU USA Japan EU USA Japan
2013 2005 2013 2005 2013 2005 2013 2005 2013 2005 2013 2005 2013 2005 2013 2005 2013
3
4
5
6
Num
ber o
f em
ploy
ees
(mill
ions
)
1.5
2.0
2.8
3.7
0.80.9
4.3
5.4
3.2 3.2 3.2
4.0
4.85.0
1.2 1.2
0.9 1.0

Commitments 14 to 18 all serve to promote the single innovation market by making it easier for companies to innovate and to protect their intellectual property rights. European companies filing for patent protection currently need to do so in all 28 member states, piling on additional administrative requirements and translation costs. The ‘unitary patent package’ agreed upon by 25 EU member states (all but Croatia, Italy and Spain) between 2012 and 2013 includes regulations creating a unitary patent and establishing a translation regime applicable to the unitary patent, as well as the establishment of a single and specialized patent jurisdiction, the Unified Patent Court. The costs of a unitary patent related to procedural fees and translations are expected to fall considerably for all 25 member states, leading to savings of an estimated 85%. The Unified Patent Court is expected to start functioning in 2015 and should result in annual savings of between € 148 million and € 289 million (European Commission, 2014c).
To meet its ambitions for research, the EU will need to augment the number of researchers in the EU, a significant share of whom will have to come from third countries. For the EU to be able to compete with the USA in attracting research talent, for instance, EU legislation will need to be applied to the letter. Member states have already reformed their higher education sectors as part of the Bologna Process11 and special scientific visas have been designed to help researchers obtain authorization to live and work in any member state more easily.
11. On the Bologna Process, see the UNESCO Science Report 2010, p. 150.
such as expensive patenting, market fragmentation, slow standard-setting and skills shortages – and revolutionize the way in which the public and private sectors work together, notably through innovation partnerships between European institutions, national and regional authorities and businesses. By 2015, considerable progress had been made for all but one commitment (Table 9.7).
Commitment 5 focuses on building world-class research and innovation infrastructure to attract global talent and foster the development of key enabling technologies. The European Strategy Forum on Research Infrastructures has identified 44 key new research facilities (or major upgrades to existing ones). The construction and operation of this infrastructure requires the pooling of resources by several member states, associated countries and also third countries. The target is for 60% of this research infrastructure to have been completed or launched by 2015.
Commitment 7 stresses the key role of SMEs in driving innovation as catalysts for knowledge spillovers. Tapping the full innovation potential of SMEs requires favourable framework conditions but also efficient support mechanisms. SME access to EU funding is hampered by the fragmentation of support instruments and administrative procedures ill-adapted to SMEs. With Horizon 2020, a new dedicated SME Instrument has been designed for highly innovative SMEs with the ambition of ensuring that a significant share of funding is reserved for SMEs.
UNESCO SCIENCE REPORT
Figure 9.6: Innovation performance of EU regions, 2004 and 2010
Source: European commission (2014c), Regional Innovation Union Scoreboard 2014; maps created using Region Map Generator
20102004
242
Innovation leadersInnovation followersModerate innovatorsModest innovators

Chapter 9
Table 9.7: Progress by EU member states on Innovation Union commitments as of 2015
Commitment Deliverables Examples of implementation/remaining gaps
1 Put in place national strategies to train a critical mass of researchers
3 n Most countries have put strategies in place
n The European Commission has put tools in place to favour this process
n New innovative doctoral training opportunities available in some member states
n Launch of EURAXESS, an information tool fostering mobility and collaboration among researchers across 40 pan-European countries, such as by publishing job offers online
2a Test the feasibility of an independent university ranking
3 n Feasibility of the ranking tested n U-Multirank launched in 2014 to compare universities in new ways;
n The first U-Multirank results were published in May 2014 for 500 institutions offering higher education and 1 272 disciplines;
n The tool is available for students and researchers wishing to use it
2b Create knowledge alliances between business and academia
3 n Knowledge alliances piloted and scaled up within the Erasmus+ programme for international university student exchanges
Follow-up:
n 150+ new knowledge alliances foreseen in the programming period 2014–2020
n Universities and businesses took part in the first knowledge alliances and new ones were launched in 2014;
n The results of the first knowledge alliance pilots are available
3 Propose an integrated framework for e-skills
3 n Grand coalition for digital jobs
n E-competence framework 3.0 released
n Roadmap for the promotion of ICT
n professionalism and e-leadership 2014–2020 released
n E-competence framework adopted as a standard by some member states
4 Propose a European Framework for Research Careers and supporting measures
3 n European Framework for Research Careers proposed in 2012, measures to be in place by 2014;
n European Framework for Research Careers created;
n Principles for innovative doctoral training defined, disseminated, verified and supported;
n The Pan-European Pension fund established as a consortium, with funding foreseen in Horizon 2020
n European Framework for Research Careers widely used for recruitment by universities, companies, etc.;
n Joint programming initiatives
Remaining gaps:
Some member states still have to align their systems on the principles of the European Framework for Research Careers;
n Pan-European Pension fund expected to be operational by late 2015
5 Construct priority European research infrastructure
3 n So far, 56% of the infrastructure has been implemented, the target is for 60% by 2015
n 14 types of infrastructure are providing services to their user
6 Simplify EU research and innovation programmes and focus future ones on the Innovation Union
3 n Horizon 2020 launched in 2014 with a focus on the Innovation Union
n First calls for research project proposals launched within Horizon 2020
7 Ensure stronger involvement of SMEs in future EU research and innovation programmes
3 n SMEs instrument integrated in Horizon 2020 n SMEs instrument ready to be used in Horizon 2020
8 Strengthen the science base for policy-making through the Joint Research Centre and create European Forum for Forward Looking Activities
3 n Better connections with the Joint Research Centre developed; the latter has scientific institutes in Belgium (2), Germany, Italy, the Netherlands and Spain;
n European Forum for Forward Looking Activities established
n Work of the Joint Research Centre and the European Forum for Forward Looking Activities influencing Commission policy-making and strategic programming
continued overleaf...
European Union
243
244
UNESCO SCIENCE REPORT
Table 9.7: (continued)
Commitment Deliverables Examples of implementation/remaining gaps
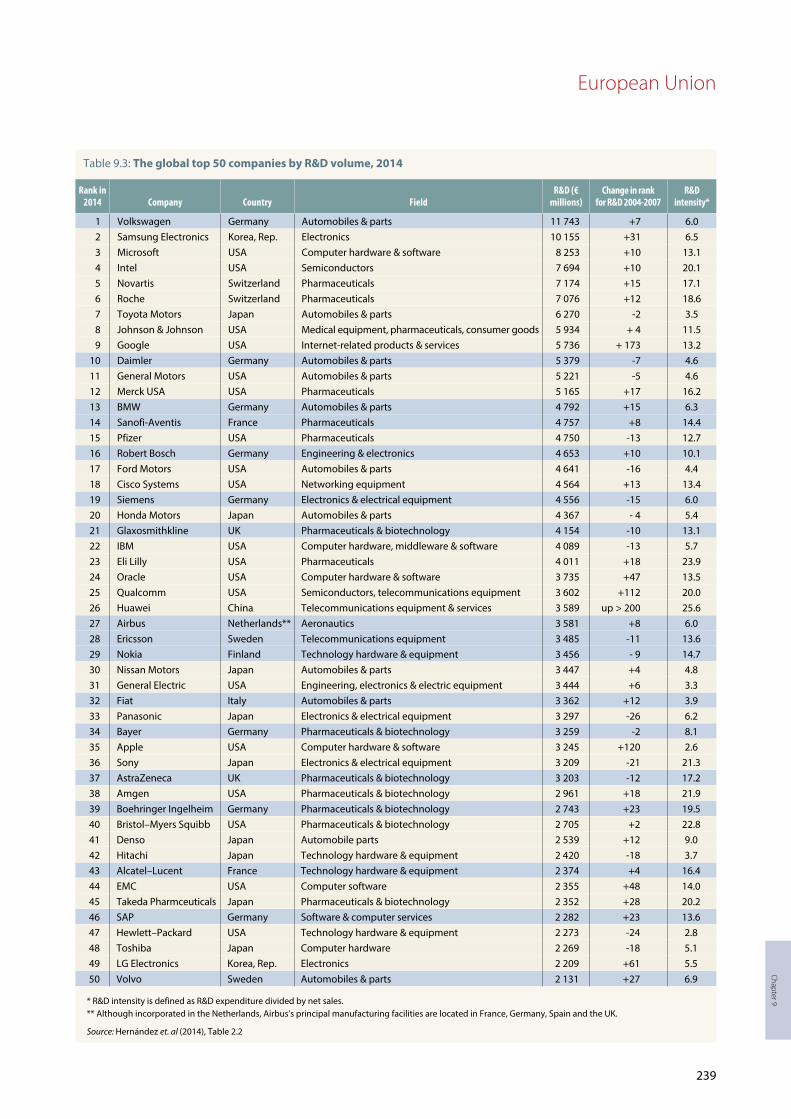
9 Set out a strategic agenda for the European Institute of Innovation and Technology (EIT) set up in 2008
3 n Strategic Innovation Agenda implemented with a budget of € 2.7 billion within Horizon 2020;
n Existing knowledge and innovation communities (KICs) in climate, ICT labs and InnoEnergy to be expanded;
n New KICs launched in innovation for healthy living and active ageing and in the sustainable use of raw materials;
n Three other KICs to be launched in 2016 (food4future and added-value manufacturing) and 2018 (urban mobility);
n Activities of the EIT Foundation expanded
n 35 master’s degree courses created with the EIT label;
n More than 1 000 students enrolled in EIT courses;
n More than 100 start-ups created ;
n More than 400 ideas incubated ;
n 90 new products and services launched
10 Put in place EU-level financial instruments to attract private finance
3 n ‘Access to Risk finance’ available under Horizon 2020
11 Ensure cross-border operation of venture capital funds
3 n The European Venture Capital Regulation entered into force in July 2013
n At least two applications have been presented to member states
12 Strengthen cross-border matching of innovative firms with investors
3 n Expert group delivered recommendations to the Commission
n These recommendations have been taken into account in the delivery of the financial instruments within Horizon 2020
13 Review State Aid Framework for R&D and innovation
3 n State Aid Framework for R&D and innovation reviewed
n State Aid Modernisation rules ready for use as of July 2014
14 Deliver the EU Patent 3 n Unitary patent package agreed upon by 25 member states (excl. Italy, Spain and Croatia);
n Machine translations available since 2013;
n Implementing rules approved by the Select Committee in December 2014
Remaining gaps:
n 13 member states still to ratify the Unitary Patent Court agreement for it to enter into force (six ratifications so far: Austria, Belgium, Denmark, France, Malta and Sweden
n Implementing rules for the Unitary Patent Court are being discussed within the Preparatory Committee, which is due to start functioning in 2015
15 Screen the regulatory framework in key areas
3 n Regulatory screening methodology developed and applied to regulations relating to eco-innovation and European Innovation Partnerships
n Methodology applied to water directive and regulation on raw materials
16 Accelerate and modernize standard-setting
3 n Communication setting out a strategic vision for European standards adopted in 2011;
n Regulation implemented since 2012
n 37% faster standardization process
17a Set aside national procurement budgets for innovation
5 n Commitment not taken up by the European Council
n Some member states have introduced measures to use public procurement as an instrument for innovation policy, including Finland, Italy, Spain, Sweden and Denmark
17b Set up an EU-level support mechanism and facilitate joint procurement
3 n Financial support for transnational co-operation being provided by the European Commission;
n Revised Public Procurement directives facilitating the procurement of innovation adopted by Parliament and Council in 2014;
n Guidance and awareness raising activities carried out by the Commission
n Joint procurement under calls within the Seventh Framework Programme
Remaining gaps:
n Member states yet to transpose these directives into national law

Chapter 9
245
European Union
Table 9.7: (continued)
Commitment Deliverables Examples of implementation/remaining gaps
18 Present an eco-innovation action plan
3 n Action Plan adopted in 2011 n Strategic Implementation Plan agreed in 2012 and currently under implementation;
19a Establish a European Creative Industries Alliance
3 n European Creative Industries Alliance established in 2011
n More than € 45 million mobilized on top of € 6.75 million in EU support for the European Creative Industries Alliance
n More than 3 500 SMEs have benefited from the activities of the European Creative Industries Alliance and an additional 2 460 stakeholders participated in its activities
19b Set up a European Design Leadership Board
3 n European Design Leadership Board established. It has delivered proposals on how to enhance the role of design in innovation
n Staff working document on Implementing an Action Plan for Design-driven Innovation
n European Design Innovation Platform established
n European Design Innovation Initiative call
20 Promote open access; support smart research information services
3 n Communication diffused entitled Towards Better Access to Scientific Information: boosting the Benefits of Public Investment in Research, including recommendations for member states
n Open access in Horizon 2020
n Search tools developed
n ODIN project launched, an open access website providing lessons on web development
21 Facilitate collaborative research and knowledge transfer
3 n Clear and easy participation rules for Horizon 2020
n Analysis of impact on innovation of consortium agreements carried out
n Analysis of knowledge transfer and open innovation
n European Technology Transfer Offices established;
n Guidance on the use of consortium agreements produced and integrated into the Horizon 2020 online grants manual
22 Develop a European knowledge market for patents and licensing
3 n Staff working document Towards Enhanced Patent Valorisation for Growth and Jobs published in 2012
n Expert groups established on intellectual property valuation and on patent valorization;
n Results of the expert group on patent valorization to be delivered
23 Safeguard against the use of IPRs for anti-competitive purposes
3 n Guidelines on horizontal agreements adopted in 2010
n These rules now apply to national competition authorities, the European Commission, companies and national courts
24 –25
Improve the use of structural funds for research and innovation
3 n Research and Innovation Strategies for Smart Specialisation introduced in the strategic planning of member states and country regions;
n Smart specialization strategies introduced as an ex ante conditionality for access to finance from the European Regional Development Fund for research, technological development and innovation;
n National and regional smart specialization strategies defined in most member states/regions within countries;
n Smart Specialisation Platform launched in 2012
26 Launch a Social Innovation pilot and promote social innovation through the European Social Fund
3 n Social Innovation Europe platform launched in 2011;
n Bigger role for social innovation incorporated in the European Social Fund
n European Social Innovation Competition established;
n Support given to networks of incubators for social innovation
27 Support a research programme on social innovation in the public sector and pilot a European Public Sector Innovation Scoreboard
3 n Social and public sector innovation included in Horizon 2020 topics;
n European Public Sector Innovation Scoreboard piloted
n European Prize for Innovation in the Public Sector launched;
n Expert group on public sector innovation set up
n First European Capital of Innovation Award (iCapital) awarded to Barcelona in 2014
continued overleaf...

UNESCO SCIENCE REPORT
246
Table 9.7: (continued)
Commitment Deliverables Examples of implementation/remaining gaps
28 Consult social partners on interaction between the knowledge economy and market
3 n First consultations with EU social partners took place in 2013;
n Further consultations are planned beyond 2014
n European Workplace Innovation Network set up
29 Pilot and present proposals for European Innovation Partnerships
3 n European Innovation Partnerships launched, piloted and evaluated
n More than 700 commitments to action
n Reference sites for sharing lessons and replicating transferable results
n Web-based marketplaces with well over 1 000 registered users for each
n First results emerging: collections of good practices and toolkits for their replication, compilations of evidence on impact, etc.
30 Put in place integrated policies to attract global talent
3 n National measures being deployed to foster researcher mobility, including EURAXESS, an information tool for researchers wishing to pursue their career in Europe or stay connected to it;
n Scientific visa;
n Marie Skłodowska Curie Actions;
n Destination Europe Events
n EURAXESS and EURAXESS links;
n New scientific visa to take effect in 2016, after transposition by member states
31 Propose priorities and approaches for scientific co-operation with third countries involving the EU and member states
3 n Communication adopted in 2012 on enhancing and focusing EU international co-operation in research and innovation
n Strategic Forum for International Cooperation initiatives targeting China, Brazil, India and the USA
n On-going work of the Strategic Forum for International Cooperation to identify common priorities and implement joint actions. Roadmaps completed by end of 2014
n Ongoing dialogue with third countries and other regions of the world
32 Roll-out global research infrastructure
3 n New framework for co-operation agreed in 2013 at G8 level;
n Report on list of existing infrastructure and priorities expected in 2015
33 Self-assess national research and innovation systems and identify challenges and reforms
3 n Commission support made available to member states;
n Four out of 28 member states have requested peer review: Belgium, Estonia, Denmark, Spain;
n Progress monitored through European Semester, leading to country-specific recommendations
n Peer review carried out for Belgium, Estonia, Denmark, Spain and Iceland;
n Three countries have confirmed use of Self-Assessment Tool: Belgium, Estonia, Denmark;
n New tool launched under Horizon 2020
34a Develop an innovation headline indicator
3 n Communication adopted in 2013 on Measuring Innovation Output in Europe: Towards a New Indicator
n Indicator used for country-specific recommendations in 2014
34b Monitor progress using Innovation Union Scoreboard
3 n Innovation Union Scoreboard updated annually since 2010
n Innovation Union Scoreboard published most recently in 2015
Source: adapted from European Commission (2014e)

European Union
247
Chapter 9
MONITORING THE LATEST FRAMEWORK PROGRAMMES FOR RESEARCH
Horizon 2020: the EU’s biggest research programme everThe funding levels of the EU’s successive framework programmes for research and development have grown consistently over time from € 4 billion for the first one from 1984 to 1988 to € 53 billion for the Seventh Framework Programme for Research and Technological Development (2007–2013) and nearly € 80 billion for Horizon 2020, the biggest EU research programme ever. Horizon 2020 was proposed by the European Commission in November 2011 and adopted by the European Parliament and European Council in December 2013.
Horizon 2020 focuses on implementing Europe 2020, in general, and the Innovation Union, in particular, by bringing together all existing EU research and innovation funding and providing support in a seamless way from idea to market, through streamlined funding instruments and a simpler programme architecture and rules for participation. The bulk of the € 80 billion will promote excellent science (32%) and address societal challenges (39%) [Table 9.8].
Green growth main societal challenge Many of the societal challenges covered by Horizon 2020 relate to green growth areas, such as sustainable agriculture and forestry, climate action, green transportation or resource efficiency. Some of Europe 2020’s most positive results so far concern reductions in greenhouse gas emissions. By 2012, the
Final breakdown
(%)
Estimated final amount in € millions
(in current prices)
Excellent science, of which 31.7 24 441
European Research Council 17.0 13 095
Future and Emerging Technologies 3.5 2 696
Marie-Skłodowska-Curie Actions 8.0 6 162
European research infrastructures (including Infrastructures) 3.2 2 488
Industrial leadership, of which 22.1 17 016
Leadership in enabling and industrial technologies 17.6 13 557
Access to risk finance 3.7 2 842
Innovation in SMEs 0.8 616
Societal challenges, of which 38.5 29 679
Health, demographic change and well-being 9.7 7 472
Food security, sustainable agriculture and forestry, marine maritime and inland water research and the bio-economy 5.0 3 851
Secure, clean and efficient energy 7.1 5 931
Smart, green and integrated transport 8.2 6 339
Climate action, environment, resource efficiency and raw materials 4.0 3 081
Europe in a changing world – Inclusive innovative and reflective societies 1.7 1 309
Secure societies – Protecting freedom and security of Europe and its citizens 2.2 1 695
Science with and for society 0.6 462
Spreading excellence and widening participation 1.1 816
European Institute of Innovation and Technology (EIT) 3.5 2 711
Non-nuclear direct actions of the Joint Research Centre 2.5 1 903
TOTAL EU REGULATION 100.0 77 028
Fusion indirect actions 45.4 728
Fission indirect actions 19.7 316
Nuclear direct actions of the Joint Research Centre 34.9 560
TOTAL Euratom regulation 2014–2018 100.0 1 603
Note: Owing to Euratom’s different legal base, its budgets are fixed for five years. For the years 2014–2018, the budget is estimated to be € 1 603 million and for the years 2019–2020 an amount of € 770 million is foreseen.
Source: European Commission: http://ec.europa.eu/research/horizon2020/pdf/press/fact_sheet_on_horizon2020_budget.pdf
Table 9.8: Structure and budget of Horizon 2020, 2014–2020

UNESCO SCIENCE REPORT
248
Note: The total for the Seventh Framework Programme includes non- thematic cooperation projects.
Source: CORDIS (www.cordis.europa.eu), data downloaded on 4 March 2015
Table 9.9: Number of projects within Seventh Framework Programme related to sustainable development, 2007–2013
Agriculture Environment Energy Health Materials All projects
Share of sustainability
projects (%)
Austria 145 157 71 191 188 2 993 25.1
Belgium 331 214 140 295 355 4 552 29.3
Bulgaria 43 45 18 23 19 590 25.1
Croatia 25 23 14 21 9 351 26.2
Cyprus 15 21 15 10 11 436 16.5
Czech Republic 85 63 22 77 111 1 216 29.4
Denmark 197 130 97 200 186 2 275 35.6
Estonia 29 21 11 54 13 502 25.5
Finland 148 83 55 166 232 2 089 32.7
France 419 275 198 551 530 8 909 22.1
Germany 519 425 285 776 970 11 404 26.1
Greece 147 140 72 117 165 2 340 27.4
Hungary 87 57 23 96 75 1 350 25.0
Ireland 108 55 35 109 117 1 740 24.4
Italy 460 296 183 509 659 8 471 24.9
Latvia 24 11 13 17 14 267 29.6
Lithuania 24 19 12 24 27 358 29.6
Luxembourg 7 10 4 19 15 233 23.6
Malta 9 9 3 4 5 177 16.9
Netherlands 467 298 169 558 343 6 191 29.6
Poland 100 76 53 96 166 1 892 26.0
Portugal 123 94 69 68 125 1 923 24.9
Romania 41 69 17 48 81 898 28.5
Slovakia 26 19 15 18 41 411 29.0
Slovenia 55 55 23 48 81 771 34.0
Spain 360 291 211 388 677 8 462 22.8
Sweden 145 135 88 255 258 3 210 27.4
UK 508 379 191 699 666 12 591 19.4
EU had already achieved an 18% reduction in greenhouse gas emissions over 1990 levels and is, thus, expected to meet its 2020 target of a 20% reduction.
Europe needs to embrace sustainable development to overcome a range of challenges that include overdependence on fossil fuels, environmental degradation, natural resource depletion and the impact of climate change. The EU is also convinced that environmentally sustainable (green) growth will increase its competitiveness.
Indeed, according to the latest State of the Environment Synthesis Report published by the European Environment Agency (2015), the environment industry had been one of the few European economic sectors to flourish in terms of revenue, trade and jobs, despite the 2008 financial crisis. The report emphasizes the role of research and innovation in furthering sustainability goals, including social innovation.
The EU has partly supported its ambitions with regard to energy sustainability and climate change, for example, by funding relevant research projects within its Seventh Framework Programme (2007–2013) and, furthermore, by emphasizing responsible research and innovation across its new framework programme for research, Horizon 2020. Europe is in a historically unique position to usher in a more sustainable society through research and innovation. In order to fulfil its potential, however, a shift in focus might be required to ensure that innovation is viewed more as a means to an end, rather than as an end in itself. (See, for example, van den Hove et al., 2012.)
In the Seventh Framework Programme, the following five themes for co-operation projects focused particularly on sustainability and environmental protection: agriculture; energy; environment; health; and materials (Table 9.9). More than 75% of the topics under these themes can

European Union
249
Chapter 9
be considered as contributing positively to the EU’s sustainable development targets. About one in four projects implemented under the Seventh Framework Programme concern these five themes. They are a priority for Denmark, Finland and Slovenia, in particular. For Cyprus, Malta and the UK, on the other hand, they represent fewer than one in five projects (Table 9.9).
The data for the Seventh Framework Programme can also be compared to those for patent applications in environment-related technologies, greenhouse gas emissions and the share of renewable energy in gross final energy consumption (Table 9.10). In 2011, Denmark, Finland, Germany and Sweden
had the highest number of patent applications in environment-related technologies per billion PPP euro GDP; moreover, the absolute number of patent applications in this area also increased most in these four countries between 2005 and 2011. Denmark and Finland also figure prominently in ‘high sustainability’ research projects under the Seventh Framework Programme.
Greenhouse gas emissions downBy 2012, greenhouse gas emissions had declined for 20 EU countries in comparison to 1990 levels but, compared to 2005, they had actually increased in four member states: Estonia, Latvia, Malta and Poland. This said, many factors influence greenhouse gas emissions, including changes in energy
Table 9.10: Key indicators for measuring progress towards Europe 2020 objectives for societal challenges
Environment-related technologies: patent applications to the EPO per billion GDP
in current PP€
Greenhouse gas emissions:
1990 = 100Share of renewable energy in gross final energy
consumption (%)
2005 2011 Change 2005 2012 Change (%) 2005 2012 Change (ratio)EU28 0.31 0.46 0.15 93.2 82.1 -11.1 8.7 14.1 1.6Austria 0.47 0.72 0.25 119.7 104.0 -15.7 24.0 32.1 1.3Belgium 0.27 0.40 0.13 99.7 82.6 -17.1 2.3 6.8 3.0Bulgaria 0.00 0.02 0.02 58.5 56.0 -2.5 9.5 16.3 1.7Croatia 0.00 0.00 0.00 95.8 82.7 -13.1 12.8 16.8 1.3Cyprus 0.00 0.02 0.02 158.1 147.7 -10.4 3.1 6.8 2.2Czech Rep. 0.06 0.07 0.01 74.7 67.3 -7.4 6.0 11.2 1.9Denmark 0.69 1.87 1.18 94.7 76.9 -17.8 15.6 26.0 1.7Estonia 0.00 0.30 0.30 45.6 47.4 1.8 17.5 25.8 1.5Finland 0.39 0.91 0.52 98.0 88.1 -9.9 28.9 34.3 1.2France 0.33 0.43 0.10 101.5 89.5 -12.1 9.5 13.4 1.4Germany 0.74 1.05 0.31 80.8 76.6 -4.2 6.7 12.4 1.9Greece 0.01 0.05 0.04 128.2 105.7 -22.5 7.0 13.8 2.0Hungary 0.11 0.12 0.01 80.7 63.7 -17.0 4.5 9.6 2.1Ireland 0.09 0.16 0.07 128.2 107.0 -21.1 2.8 7.2 2.6Italy 0.19 0.22 0.03 111.5 89.7 -21.8 5.9 13.5 2.3Latvia 0.04 0.06 0.03 42.5 42.9 0.4 32.3 35.8 1.1Lithuania 0.00 0.03 0.03 47.8 44.4 -3.3 17.0 21.7 1.3Luxembourg 0.61 0.35 -0.26 108.3 97.5 -10.8 1.4 3.1 2.2Malta 0.13 0.00 -0.13 147.8 156.9 9.2 0.3 2.7 9.0Netherlands 0.33 0.50 0.17 101.8 93.3 -8.6 2.3 4.5 2.0Poland 0.03 0.04 0.01 85.6 85.9 0.3 7.0 11.0 1.6Portugal 0.04 0.08 0.04 144.5 114.9 -29.7 19.5 24.6 1.3Romania 0.01 0.02 0.01 57.0 48.0 -9.1 17.6 22.9 1.3Slovakia 0.04 0.03 -0.01 68.7 58.4 -10.3 5.5 10.4 1.9Slovenia 0.03 0.10 0.08 110.2 102.6 -7.6 16.0 20.2 1.3Spain 0.06 0.13 0.07 153.2 122.5 -30.8 8.4 14.3 1.7Sweden 0.67 1.03 0.36 93.0 80.7 -12.3 40.5 51.0 1.3UK 0.17 0.26 0.09 89.8 77.5 -12.3 1.4 4.2 3.0
Note: The term ‘environment-related technologies’ refers to patent applications in the following thematic areas: general environmental management; energy generation from renewable and non-fossil sources; combustion technologies with mitigation potential; technologies specific to climate change mitigation; technologies with a potential or indirect contribution to mitigating emissions; emissions abatement and fuel efficiency in transportation; and energy efficiency in buildings and lighting.
Source: for greenhouse gas emissions, the share of renewable energy in gross final energy consumption and GDP in current PP€: Eurostat; for the numberof patent applications in environment-related technologies: OECD

UNESCO SCIENCE REPORT
250
demand and fuel use, growth in particular economic sectors (or the collapse of others), economic downturns or recessions, changes in the means of transport and demand, technological developments like the deployment of renewable energy technologies and demographic changes (European Environment Agency, 2015). Some of these influences are the result of government policies, others intervene beyond the short-term influence of governments. As an example of the latter, the collapse of the Soviet Union had a knock-on effect on the economies of former Soviet bloc countries such as Estonia, Latvia and Poland and, thus, on their greenhouse gas emissions. Most former Soviet states have managed to sustain these lower emission levels. Similarly, the economic downturn since 2008 has impacted positively on European greenhouse gas emissions.
Lastly, the share of renewable energy in gross final energy consumption in 2012 was highest (30% or more) in Austria, Finland, Latvia and Sweden. However, many of these countries have a strong hydropower sector and the data do not show the contribution from newer technologies such as wind or solar power. Therefore, it is also interesting
to look at the changes in these shares since 2005. For the EU as a whole, the share of renewable energy in gross final energy consumption has increased by a factor of 1.6. For Malta, starting from a very low share in 2005, this share has increased nine-fold, for Bulgaria and the UK it has tripled and, for another seven countries, it has at least doubled. Relatively minor improvements can be seen in Finland and Latvia but these countries are already among the best performers.
More for countries with modest research funding The Seventh Framework Programme (2007–2013) identified four main objectives within programmes targeting co-operation, ideas, people and capacities:
n The Specific Programme for Co-operation provided project funding for collaborative, transnational research. This programme was broken down into several themes, including health, energy and transportation.
n The Specific Programme for Ideas provided project funding for individuals and their teams engaged in frontier research. This programme was implemented by the European Research Council (Box 9.1).
The European Research Council (ERC) was created in 2007 under the Seventh Framework Programme. Through peer-reviewed competitions, the best researchers receive funding to perform their frontier research in Europe. The ERC is currently part of the first pillar (Excellent science) of Horizon 2020, with a budget of € 13.1 billion representing 17% of the overall budget for Horizon 2020.
Since 2007, more than 5 000 projects have been selected for funding from more than 50 000 applications. The ERC counts eight Nobel laureates and three Fields medalists among its grant holders. Over 40 000 scientific articles acknowledging ERC-funding appeared in peer-reviewed high-impact journals between 2008 and 2013 and one-third of all ERC grantees have published in articles listed among the top 1% most highly cited publications worldwide.
Within the ERC, there are three core funding schemes and one additional scheme:
n ERC Starting Grants provide funding for young post-docs with 2–7 years of experience. Funding is available for up to five years, with a maximum amount of € 1.5 million, and the research must take place in public or private research institutions.
n ERC Consolidator Grants focus on researchers with 7–12 years of experience who are about to move from being supervised to being an independent researcher. Funding is also for five years but with a maximum allocation of € 2 million.
n ERC Advanced Grants fund excellent researchers of any age or nationality to pursue groundbreaking high-risk projects. Funding is for five years and up to € 2.5 million.
n Proof of Concept Grants were launched in 2011 to promote the innovation potential of ideas resulting from ERC-funded research. Funding is for 18 months and up to € 150 000.
ERC grants can be seen as proxy for scientific excellence. Almost 600 research institutions from 29 countries – both EU member states and countries associated with the Seventh Framework Programme – have hosted at least one ERC grantee after the completed calls of 2007–2013. The great majority of the ERC grantees are hosted by institutions located in the EU (86 %). Most of the ERC grantees are nationals from the country of their host institution, with the notable exception of Switzerland and Austria (Figure 9.7). In absolute numbers, the UK hosts the largest group of foreign grantees (426), followed by Switzerland (237). Among EU members, the share of foreign grant-holders is very small in Greece (3 %), Hungary (8 %) and Italy (9 %). Some nationalities seem to prefer to work abroad rather than at home: around 55 % of the Greek, Austrian and Irish grantees are based in foreign countries. The absolute numbers are particularly high for Germany and Italy, with 253 and 178 nationals respectively hosted by institutions abroad (ERC, 2014).
Box 9.1: The European Research Council: the first pan-European funding body for frontier research

European Union
251
Chapter 9
n The Specific Programme for People funded the training, career development and mobility of researchers between sectors and countries worldwide. It was implemented through the Marie-Skłodowska-Curie Actions12 and Specific Actions to Support European Research Area policies.
n The Specific Programme for Capacities funded research infrastructure for SMEs. It also hosted the following smaller programmes: Science in Society, Regions of Knowledge, Research Potential, International Co-operation and the Coherent Development of Research Policies.
By December 2014, almost half of all research projects within the Seventh Framework Programme had been completed. More than 43 000 scientific publications has been reported from 7 288 projects, almost half of which had appeared in high-impact journals. Germany and the UK had the largest number of applicants for project funding, about 17 000 over
12. The Marie Skłodowska-Curie Actions provide researchers with grants at all stages of their career and encourage transnational, intersectorial and inter-disciplinary mobility. Between 2007 and 2014, more than 32 500 EU researchers received this type of funding.
2007–2013, whereas the much smaller Luxembourg and Malta each had less than 200 (Table 9.11).
When it comes to measuring the success rate, defined as the number of proposals retained, a different ranking emerges. Belgium, the Netherlands and France stand out here, with a success rate of at least 25%. If we take population size into account, it is the smaller countries that have been the most successful, with Cyprus and Belgium both having more than 500 retained proposals per million inhabitants.
In financial terms, the largest countries received the bulk of funding in absolute terms and France, Belgium and the Netherlands the greatest shares. However, if we compare Seventh Framework Programme funding with national levels of research funding, it transpires that framework funding is relatively higher for those countries with modest levels of national funding. This is the case for Cyprus, for instance, where framework funding amounted to almost 14% of GERD, as well as for Greece (just over 9%) and Bulgaria (more than 6%).
A successful model The ERC has been widely acknowledged as a highly successful model for competitive research funding. Its existence has had a strong impact at the national level. Since the ERC was created in 2007, 11 member states have set up national research councils, bringing the total to 23. Funding schemes inspired by the ERC structure have been launched by 12 member states: Denmark, France, Germany, Greece, Hungary, Italy, Ireland, Luxembourg, Poland, Romania, Spain and Sweden.
The ERC calls for proposals are very competitive: in 2013, the success rate was just 9% for Starting and Consolidator Grants and 12% for Advanced Grants. Consequently, 17 European countries* have developed national funding schemes to support their ‘finalists’ in the ERC competitions who were not awarded a grant (ERC, 2015).
A scheme open to researchers everywhereThe ERC is open to top researchers from anywhere in the world. To raise awareness and forge closer ties with counterparts abroad, the ERC has toured all continents since 2007. The ERC also offers young researchers the opportunity to come to Europe to join the research teams of ERC grantees, an initiative supported by
non-European funding agencies. Agreements have been signed with the National Science Foundation in the USA (2012), the Government of the Republic of Korea (2013), the National Scientific and Technical Research Council (CONICET) in Argentina (2015) and with the Japan Society for the Promotion of Science (2015).Source: compiled by authors
* Belgium, Cyprus, Czech Republic, Finland, France, Greece, Hungary, Ireland, Italy, Luxembourg, Norway, Poland, Romania, Slovenia, Spain, Sweden and Switzerland
Figure 9.7: Grants by the European Research Council, 2013Top 23 grantees by country of host institution and origin of grantee
Source: ERC (2014)
Nationals in host country
Non-nationals in host country
Nationals away from country
-200
0
200
400
600
800
1 000
UK
Germ
any
Fran
ce
Neth
erlan
ds
Switz
erlan
d
Italy
Israe
l
Spain
Swed
en
Belg
ium
Austr
ia
Denm
ark
Finlan
d
Norw
ay
Gree
ce
Hung
ary
Portu
gal
Irelan
d
Polan
d
Czec
h Re
p.
Cypr
us
Turk
ey
Esto
nia

UNESCO SCIENCE REPORT
252
Table 9.11: EU member states’ performance in calls for research proposals within Seventh Framework Programme, 2007–2013
Applicants in retained proposals European Commission contribution to retained proposals
TotalNumber
Successrate (%) Rank
Per millionInhabitants Rank
Total(€ millions)
Successrate (%) Rank
Share of R&D (%) Rank
Austria 3 363 22.3 8 402.3 10 1114.9 20.9 6 2.0 21
Belgium 5 664 26.3 1 521.0 2 1806.3 23.8 2 3.4 9
Bulgaria 672 16.4 24 90.5 24 95.2 10.2 26 6.6 3
Croatia 388 16.9 23 90.3 25 74.2 11.1 24 3.0 14
Cyprus 443 15.0 27 542.3 1 78.9 9.7 27 13.8 1
Czech Rep. 1 377 20.3 13 132.1 22 249.3 14.8 15 1.5 25
Denmark 2 672 24.2 4 483.1 4 978.2 22.5 5 2.0 22
Estonia 495 20.6 12 371.6 12 90.2 16.3 10 4.7 5
Finland 2 620 21.3 11 489.6 3 898.1 15.9 11 1.9 23
France 11 975 25.1 3 185.2 19 4653.7 24.7 1 1.5 26
Germany 17 242 24.1 5 210.3 16 6967.4 23.3 4 1.4 27
Greece 3 535 16.4 24 317.2 13 924.0 13.2 19 9.3 2
Hungary 1 498 20.3 13 149.8 20 278.9 15.0 14 3.4 8
Ireland 1921 21.9 9 425.4 8 533.0 17.2 9 2.9 15
Italy 11 257 18.3 20 190.6 18 3457.1 15.1 13 2.5 18
Latvia 308 21.6 10 145.4 21 40.7 13.3 18 4.6 6
Lithuania 411 20.0 15 131.9 23 55.1 14.2 16 3.0 13
Luxembourg 192 18.5 18 380.8 11 39.8 13.7 17 1.0 28
Malta 183 18.9 17 442.9 7 18.6 11.0 25 5.9 4
Netherlands 7 823 25.5 2 472.1 5 3152.5 23.6 3 4.0 7
Poland 2 164 18.5 18 56.5 27 399.4 11.9 21 2.2 20
Portugal 2 188 18.1 21 207.5 17 470.9 13.1 20 2.7 16
Romania 1 005 14.6 28 49.3 28 148.7 9.0 28 3.3 10
Spain 10 591 19.0 16 229.2 15 2947.9 15.3 12 3.0 12
Slovenia 858 15.6 26 421.0 9 164.3 11.2 23 3.1 11
Slovakia 467 17.9 22 86.6 26 72.3 11.6 22 2.5 19
Sweden 4 370 23.6 6 468.1 6 1595.0 19.7 7 1.8 24
UK 16 716 22.6 7 267.4 14 5984.7 19.6 8 2.6 17
Source: European Commission (2015b)
Structural funds: narrowing the innovation gap between regionsAt the regional level, the innovation divide mirrors that of countries. Most of the regional innovation leaders and followers are located in the countries defined as innovation leaders and followers. However, some regions fall into a higher performance group than the country as a whole. These regions tend to encircle the capital and to be endowed with a high level of services and universities. This is the case for the Île de France region, for instance, which includes Paris but also happens to be surrounded by an ‘innovation desert.’ Other examples are the capital cities of Lisbon (Portugal), Bratislava (Slovakia) and Bucharest (Romania).
Between 2004 and 2010, about half of the regions in the EU moved into a higher performance group, nearly two-thirds of which were located in less innovative countries. Countries
have benefited economically from the development of a single internal market, with the less advanced member states receiving an additional boost from the European Commission’s structural funds which transfer money from the more advanced regions of the EU to the less advanced ones.
Between 2007 and 2013, € 42.6 billion in structural funds was committed to narrowing the innovation gap between European regions in research and innovation, almost 16.3% of all available funds. The bulk of this amount went to regions with a per-capita income that was 75% below the EU average.
An analysis by the European Commission (2014a) of regions’ performance in the Seventh Framework Programme and their use of structural funds for R&D shows that those regions receiving more than 20% above the average amount of framework programme funding also perform well in

European Union
253
Chapter 9
innovation, with the majority being regional innovation leaders and followers, including capitals such as the greater Berlin area (Germany), Brussels (Belgium), London (UK), Stockholm (Sweden) and Vienna (Austria). None of the regional modest innovators attract above-average shares of framework programme funding or structural funds, with the notable exception of the Portuguese Autonomous Region of Madeira. More than half of the regions that attract neither type of funding are regional moderate or modest innovators, suggesting that these regions do not consider innovation a priority area for investment.
A drop in government spending on defence R&DAt this point, we shall examine the national priorities for research in 2005 with those at the end of the Seventh Framework Programme in 2013. Government research spending can be broken down into 14 socio-economic objectives by using government budget appropriations or outlays for R&D (GBAORD). On average, the largest share of total government spending is earmarked for the general advancement of knowledge, a category that includes all university R&D financed by general purpose grants from Ministries of Education – so-called General University Funds – and funds from other sources, there being a lot of variation between countries in the way they classify research expenditure (Table 9.12). On average, 52% of GBAORD is spent on the general advancement of knowledge but shares range from just 23% in Latvia to more than 90% in Croatia and Malta.
A comparison with the data for GBAORD in 2005 presented in the UNESCO Science Report 2010 shows that the EU as a whole is spending less on defence research, including that for military purposes13 and basic, nuclear and space-related R&D financed by Ministries of Defence. This drop is apparent for all four major spenders on defence in 2005 (France, Spain, Sweden and the UK) and parallels the trend observed in the USA regarding defence R&D (see Chapter 5). The UK was the only EU country in 2013 to devote a two-digit share (16%) of the government budget to defence R&D and, even then, it was down from 31% in 2005.
Less industrial research may reflect declining role of manufacturingThe EU is also spending less on education and on industrial production and technology, although Luxembourg spends much more on research in education than any other member state. Relative spending on R&D in industrial production and technology has declined in half of member states but particularly in Greece, Luxembourg, Portugal, Slovenia and Spain. This trend possibly reflects the decreasing share of manufacturing in the economy and the growing
13. According to the Stockholm International Peace Research Institute, the five top EU spenders on defence in 2014 were France, Greece and the UK (2.2% of GDP), Estonia (2.0%) and Poland (1.90%).
sophistication of R&D in the services sector, such as financial services.
Research spending up in energy, health and infrastructure Spending levels are up, on the other hand, in the fields of energy, health, transportation, telecommunications and other infrastructure. Spending on health research has increased most in Latvia, Luxembourg and Poland, reflecting growing concern about health issues and whether the EU can maintain an affordable health care system for its ageing societies. The rise in spending on research in energy reflects growing concern among the public and policy-makers as to the sustainability of modern economies, a trend foreseen in the UNESCO Science Report 2010. Among the major economies, spending shares on R&D in energy have increased in France, Germany and the UK and remained stable in Italy. Relative spending on R&D in transportation, telecommunications and other infrastructure has increased in about half of member states, especially in France, Slovenia and the UK.
Space research a strategic investmentSpace research is considered an increasingly crucial area of science within the EU. The governments of Belgium, France and Italy devote a relatively large share of their budget appropriations to the exploration and exploitation of (civil) space. Greece and Italy both spend about 5% on the exploration and exploitation of the Earth. Space research is expected to generate knowledge and new products, including new technologies for combating climate change and improving security, while contributing to the EU’s economic and political independence (European Commission, 2011). Thanks to the European Space Agency, it is a field of research in which Europeans can pursue a common purpose. The European Space Agency chalked up a world first in November 2014, with the successful landing of the small robotic probe Philae on a comet, 11 years after the Rosetta spacecraft left Earth. Box 9.2 discusses another important product of European space research in the past decade, the Galileo navigation system.
The newer member states have progressed There has been a marked improvement in the volume of R&D conducted by the ten countries which joined the EU in 2004. Their share of total R&D spending increased from less than 2% in 2004 to almost 3.8% by 2013 and their R&D intensity from 0.76 in 2004 to 1.19 in 2013. Although their R&D intensity remains well below that of the EU15 countries, the gap has been narrowing consistently since 2004 (Figure 9.8).
For Bulgaria, Croatia and Romania, on the other hand, which joined the EU in 2007 and 2013 respectively, the situation has deteriorated. All three contributed less to EU28 GERD in 2013 than in 2007 and their R&D intensity has shrunk over the
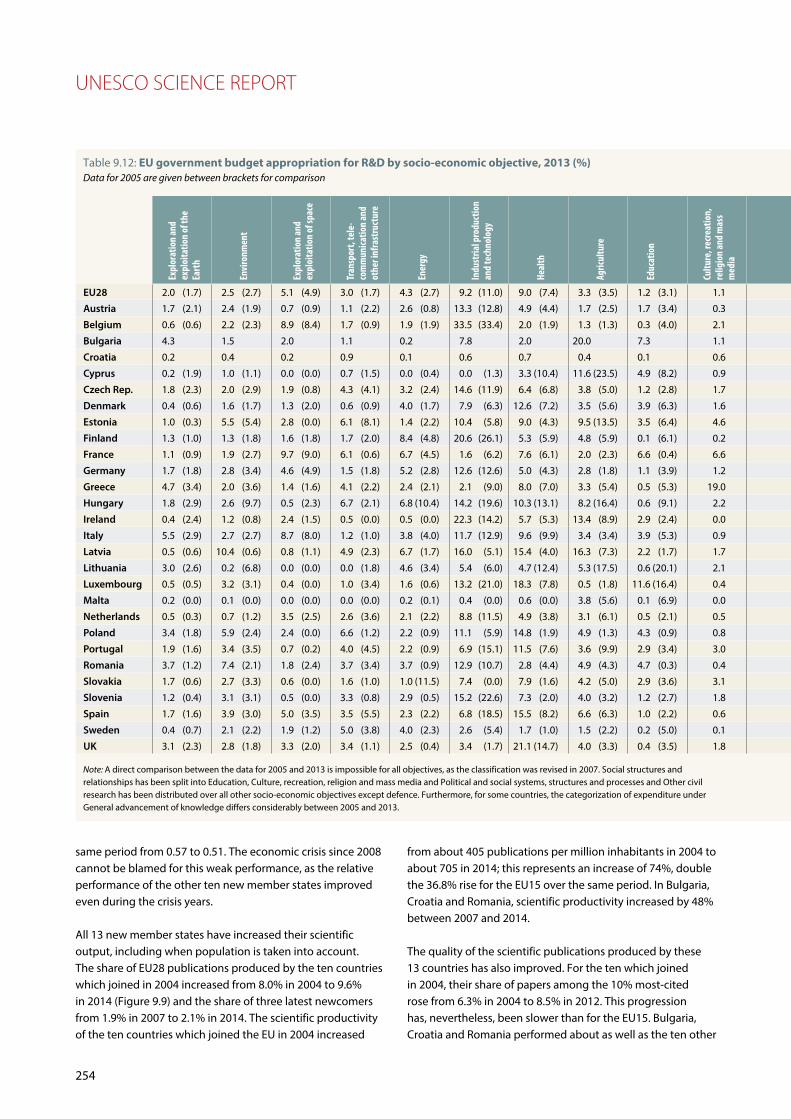
UNESCO SCIENCE REPORT
254
Table 9.12: EU government budget appropriation for R&D by socio-economic objective, 2013 (%)Data for 2005 are given between brackets for comparison
Expl
orat
ion
and
expl
oita
tion
of th
e Ea
rth
Envi
ronm
ent
Expl
orat
ion
and
expl
oita
tion
of sp
ace
Tran
spor
t, te
le-
com
mun
icatio
n an
d
othe
r inf
rast
ruct
ure
Ener
gy
Indu
stria
l pro
duct
ion
an
d te
chno
logy
Heal
th
Agric
ultu
re
Educ
atio
n
Cultu
re, r
ecre
atio
n,
relig
ion
and
mas
s m
edia
Polit
ical a
nd so
cial
syst
ems,
stru
ctur
es
and
proc
esse
s
Gene
ral a
dvan
cem
ent
of kn
owle
dge:
shar
e of
R&D
fina
nced
from
Ge
nera
l Uni
vers
ity
Fund
s
Gene
ral a
dvan
cem
ent
of kn
owle
dge:
R&D
fin
ance
d fro
m so
urce
s ot
her t
han
GUF
Defe
nce
Tota
l R&D
ap
prop
riatio
ns
(€ m
illio
ns)
EU28 2.0 (1.7) 2.5 (2.7) 5.1 (4.9) 3.0 (1.7) 4.3 (2.7) 9.2 (11.0) 9.0 (7.4) 3.3 (3.5) 1.2 (3.1) 1.1 2.8 34.6 (31.4) 17.3 (15.1) 4.6 (13.3) 92 094
Austria 1.7 (2.1) 2.4 (1.9) 0.7 (0.9) 1.1 (2.2) 2.6 (0.8) 13.3 (12.8) 4.9 (4.4) 1.7 (2.5) 1.7 (3.4) 0.3 1.2 56.1 (55.0) 12.3 (13.1) 0.0 (0.0) 2 589
Belgium 0.6 (0.6) 2.2 (2.3) 8.9 (8.4) 1.7 (0.9) 1.9 (1.9) 33.5 (33.4) 2.0 (1.9) 1.3 (1.3) 0.3 (4.0) 2.1 3.2 17.1 (17.8) 25.1 (24.2) 0.2 (0.3) 2 523
Bulgaria 4.3 1.5 2.0 1.1 0.2 7.8 2.0 20.0 7.3 1.1 1.7 9.1 40.5 1.4 102
Croatia 0.2 0.4 0.2 0.9 0.1 0.6 0.7 0.4 0.1 0.6 0.7 64.1 31.0 0.0 269
Cyprus 0.2 (1.9) 1.0 (1.1) 0.0 (0.0) 0.7 (1.5) 0.0 (0.4) 0.0 (1.3) 3.3 (10.4) 11.6 (23.5) 4.9 (8.2) 0.9 0.0 40.1 (28.7) 37.3 (22.9) 0.0 (0.0) 60
Czech Rep. 1.8 (2.3) 2.0 (2.9) 1.9 (0.8) 4.3 (4.1) 3.2 (2.4) 14.6 (11.9) 6.4 (6.8) 3.8 (5.0) 1.2 (2.8) 1.7 1.4 22.9 (25.4) 33.4 (27.3) 1.5 (2.5) 1 028
Denmark 0.4 (0.6) 1.6 (1.7) 1.3 (2.0) 0.6 (0.9) 4.0 (1.7) 7.9 (6.3) 12.6 (7.2) 3.5 (5.6) 3.9 (6.3) 1.6 2.6 47.8 (45.3) 11.8 (20.6) 0.3 (0.7) 2 612
Estonia 1.0 (0.3) 5.5 (5.4) 2.8 (0.0) 6.1 (8.1) 1.4 (2.2) 10.4 (5.8) 9.0 (4.3) 9.5 (13.5) 3.5 (6.4) 4.6 2.0 0.0 (0.0) 43.8 (49.2) 0.5 (1.0) 154
Finland 1.3 (1.0) 1.3 (1.8) 1.6 (1.8) 1.7 (2.0) 8.4 (4.8) 20.6 (26.1) 5.3 (5.9) 4.8 (5.9) 0.1 (6.1) 0.2 4.7 28.4 (26.1) 19.5 (15.2) 1.9 (3.3) 2 018
France 1.1 (0.9) 1.9 (2.7) 9.7 (9.0) 6.1 (0.6) 6.7 (4.5) 1.6 (6.2) 7.6 (6.1) 2.0 (2.3) 6.6 (0.4) 6.6 5.1 25.3 (24.8) 19.8 (17.8) 6.3 (22.3) 14 981
Germany 1.7 (1.8) 2.8 (3.4) 4.6 (4.9) 1.5 (1.8) 5.2 (2.8) 12.6 (12.6) 5.0 (4.3) 2.8 (1.8) 1.1 (3.9) 1.2 1.8 40.0 (40.6) 17.1 (16.3) 3.7 (5.8) 25 371
Greece 4.7 (3.4) 2.0 (3.6) 1.4 (1.6) 4.1 (2.2) 2.4 (2.1) 2.1 (9.0) 8.0 (7.0) 3.3 (5.4) 0.5 (5.3) 19.0 2.6 41.3 (42.2) 8.1 (17.0) 0.4 (0.5) 859
Hungary 1.8 (2.9) 2.6 (9.7) 0.5 (2.3) 6.7 (2.1) 6.8 (10.4) 14.2 (19.6) 10.3 (13.1) 8.2 (16.4) 0.6 (9.1) 2.2 1.4 9.3 (9.1) 35.4 (5.0) 0.2 (0.1) 663
Ireland 0.4 (2.4) 1.2 (0.8) 2.4 (1.5) 0.5 (0.0) 0.5 (0.0) 22.3 (14.2) 5.7 (5.3) 13.4 (8.9) 2.9 (2.4) 0.0 1.0 17.8 (64.3) 31.9 (0.1) 0.0 (0.0) 733
Italy 5.5 (2.9) 2.7 (2.7) 8.7 (8.0) 1.2 (1.0) 3.8 (4.0) 11.7 (12.9) 9.6 (9.9) 3.4 (3.4) 3.9 (5.3) 0.9 5.7 39.4 (40.3) 2.6 (5.8) 0.8 (3.6) 8 444
Latvia 0.5 (0.6) 10.4 (0.6) 0.8 (1.1) 4.9 (2.3) 6.7 (1.7) 16.0 (5.1) 15.4 (4.0) 16.3 (7.3) 2.2 (1.7) 1.7 0.9 0.0 (74.6) 22.9 (0.0) 1.2 (0.0) 32
Lithuania 3.0 (2.6) 0.2 (6.8) 0.0 (0.0) 0.0 (1.8) 4.6 (3.4) 5.4 (6.0) 4.7 (12.4) 5.3 (17.5) 0.6 (20.1) 2.1 1.4 50.9 (0.0) 21.6 (0.0) 0.1 (0.2) 126
Luxembourg 0.5 (0.5) 3.2 (3.1) 0.4 (0.0) 1.0 (3.4) 1.6 (0.6) 13.2 (21.0) 18.3 (7.8) 0.5 (1.8) 11.6 (16.4) 0.4 13.4 11.2 (16.4) 24.7 (25.6) 0.0 (0.0) 310
Malta 0.2 (0.0) 0.1 (0.0) 0.0 (0.0) 0.0 (0.0) 0.2 (0.1) 0.4 (0.0) 0.6 (0.0) 3.8 (5.6) 0.1 (6.9) 0.0 0.1 94.4 (89.9) 0.0 (0.0) 0.0 (0.0) 22
Netherlands 0.5 (0.3) 0.7 (1.2) 3.5 (2.5) 2.6 (3.6) 2.1 (2.2) 8.8 (11.5) 4.9 (3.8) 3.1 (6.1) 0.5 (2.1) 0.5 2.3 52.4 (49.0) 16.9 (10.8) 1.2 (2.2) 4 794
Poland 3.4 (1.8) 5.9 (2.4) 2.4 (0.0) 6.6 (1.2) 2.2 (0.9) 11.1 (5.9) 14.8 (1.9) 4.9 (1.3) 4.3 (0.9) 0.8 0.7 1.6 (5.3) 36.2 (76.9) 5.2 (1.3) 1 438
Portugal 1.9 (1.6) 3.4 (3.5) 0.7 (0.2) 4.0 (4.5) 2.2 (0.9) 6.9 (15.1) 11.5 (7.6) 3.6 (9.9) 2.9 (3.4) 3.0 2.4 40.2 (38.8) 17.2 (10.4) 0.2 (0.6) 1 579
Romania 3.7 (1.2) 7.4 (2.1) 1.8 (2.4) 3.7 (3.4) 3.7 (0.9) 12.9 (10.7) 2.8 (4.4) 4.9 (4.3) 4.7 (0.3) 0.4 2.4 0.0 (0.0) 50.0 (40.9) 1.4 (1.7) 297
Slovakia 1.7 (0.6) 2.7 (3.3) 0.6 (0.0) 1.6 (1.0) 1.0 (11.5) 7.4 (0.0) 7.9 (1.6) 4.2 (5.0) 2.9 (3.6) 3.1 1.7 48.2 (25.6) 15.6 (35.9) 1.4 (8.3) 289
Slovenia 1.2 (0.4) 3.1 (3.1) 0.5 (0.0) 3.3 (0.8) 2.9 (0.5) 15.2 (22.6) 7.3 (2.0) 4.0 (3.2) 1.2 (2.7) 1.8 2.2 0.3 (0.0) 56.4 (59.7) 0.7 (4.9) 175
Spain 1.7 (1.6) 3.9 (3.0) 5.0 (3.5) 3.5 (5.5) 2.3 (2.2) 6.8 (18.5) 15.5 (8.2) 6.6 (6.3) 1.0 (2.2) 0.6 1.0 29.4 (17.8) 21.3 (11.0) 1.4 (16.4) 5 682
Sweden 0.4 (0.7) 2.1 (2.2) 1.9 (1.2) 5.0 (3.8) 4.0 (2.3) 2.6 (5.4) 1.7 (1.0) 1.5 (2.2) 0.2 (5.0) 0.1 2.4 49.9 (46.1) 22.0 (12.7) 4.0 (17.4) 3 640
UK 3.1 (2.3) 2.8 (1.8) 3.3 (2.0) 3.4 (1.1) 2.5 (0.4) 3.4 (1.7) 21.1 (14.7) 4.0 (3.3) 0.4 (3.5) 1.8 1.5 23.6 (21.7) 13.3 (16.0) 15.9 (31.0) 11 305
Note: A direct comparison between the data for 2005 and 2013 is impossible for all objectives, as the classification was revised in 2007. Social structures andrelationships has been split into Education, Culture, recreation, religion and mass media and Political and social systems, structures and processes and Other civil research has been distributed over all other socio-economic objectives except defence. Furthermore, for some countries, the categorization of expenditure under General advancement of knowledge differs considerably between 2005 and 2013.
same period from 0.57 to 0.51. The economic crisis since 2008 cannot be blamed for this weak performance, as the relative performance of the other ten new member states improved even during the crisis years.
All 13 new member states have increased their scientific output, including when population is taken into account. The share of EU28 publications produced by the ten countries which joined in 2004 increased from 8.0% in 2004 to 9.6% in 2014 (Figure 9.9) and the share of three latest newcomers from 1.9% in 2007 to 2.1% in 2014. The scientific productivity of the ten countries which joined the EU in 2004 increased
from about 405 publications per million inhabitants in 2004 to about 705 in 2014; this represents an increase of 74%, double the 36.8% rise for the EU15 over the same period. In Bulgaria, Croatia and Romania, scientific productivity increased by 48% between 2007 and 2014.
The quality of the scientific publications produced by these 13 countries has also improved. For the ten which joined in 2004, their share of papers among the 10% most-cited rose from 6.3% in 2004 to 8.5% in 2012. This progression has, nevertheless, been slower than for the EU15. Bulgaria, Croatia and Romania performed about as well as the ten other

European Union
255
Chapter 9
Table 9.12: EU government budget appropriation for R&D by socio-economic objective, 2013 (%)Data for 2005 are given between brackets for comparison
Expl
orat
ion
and
expl
oita
tion
of th
e Ea
rth
Envi
ronm
ent
Expl
orat
ion
and
expl
oita
tion
of sp
ace
Tran
spor
t, te
le-
com
mun
icatio
n an
d
othe
r inf
rast
ruct
ure
Ener
gy
Indu
stria
l pro
duct
ion
an
d te
chno
logy
Heal
th
Agric
ultu
re
Educ
atio
n
Cultu
re, r
ecre
atio
n,
relig
ion
and
mas
s m
edia
Polit
ical a
nd so
cial
syst
ems,
stru
ctur
es
and
proc
esse
s
Gene
ral a
dvan
cem
ent
of kn
owle
dge:
shar
e of
R&D
fina
nced
from
Ge
nera
l Uni
vers
ity
Fund
s
Gene
ral a
dvan
cem
ent
of kn
owle
dge:
R&D
fin
ance
d fro
m so
urce
s ot
her t
han
GUF
Defe
nce
Tota
l R&D
ap
prop
riatio
ns
(€ m
illio
ns)
EU28 2.0 (1.7) 2.5 (2.7) 5.1 (4.9) 3.0 (1.7) 4.3 (2.7) 9.2 (11.0) 9.0 (7.4) 3.3 (3.5) 1.2 (3.1) 1.1 2.8 34.6 (31.4) 17.3 (15.1) 4.6 (13.3) 92 094
Austria 1.7 (2.1) 2.4 (1.9) 0.7 (0.9) 1.1 (2.2) 2.6 (0.8) 13.3 (12.8) 4.9 (4.4) 1.7 (2.5) 1.7 (3.4) 0.3 1.2 56.1 (55.0) 12.3 (13.1) 0.0 (0.0) 2 589
Belgium 0.6 (0.6) 2.2 (2.3) 8.9 (8.4) 1.7 (0.9) 1.9 (1.9) 33.5 (33.4) 2.0 (1.9) 1.3 (1.3) 0.3 (4.0) 2.1 3.2 17.1 (17.8) 25.1 (24.2) 0.2 (0.3) 2 523
Bulgaria 4.3 1.5 2.0 1.1 0.2 7.8 2.0 20.0 7.3 1.1 1.7 9.1 40.5 1.4 102
Croatia 0.2 0.4 0.2 0.9 0.1 0.6 0.7 0.4 0.1 0.6 0.7 64.1 31.0 0.0 269
Cyprus 0.2 (1.9) 1.0 (1.1) 0.0 (0.0) 0.7 (1.5) 0.0 (0.4) 0.0 (1.3) 3.3 (10.4) 11.6 (23.5) 4.9 (8.2) 0.9 0.0 40.1 (28.7) 37.3 (22.9) 0.0 (0.0) 60
Czech Rep. 1.8 (2.3) 2.0 (2.9) 1.9 (0.8) 4.3 (4.1) 3.2 (2.4) 14.6 (11.9) 6.4 (6.8) 3.8 (5.0) 1.2 (2.8) 1.7 1.4 22.9 (25.4) 33.4 (27.3) 1.5 (2.5) 1 028
Denmark 0.4 (0.6) 1.6 (1.7) 1.3 (2.0) 0.6 (0.9) 4.0 (1.7) 7.9 (6.3) 12.6 (7.2) 3.5 (5.6) 3.9 (6.3) 1.6 2.6 47.8 (45.3) 11.8 (20.6) 0.3 (0.7) 2 612
Estonia 1.0 (0.3) 5.5 (5.4) 2.8 (0.0) 6.1 (8.1) 1.4 (2.2) 10.4 (5.8) 9.0 (4.3) 9.5 (13.5) 3.5 (6.4) 4.6 2.0 0.0 (0.0) 43.8 (49.2) 0.5 (1.0) 154
Finland 1.3 (1.0) 1.3 (1.8) 1.6 (1.8) 1.7 (2.0) 8.4 (4.8) 20.6 (26.1) 5.3 (5.9) 4.8 (5.9) 0.1 (6.1) 0.2 4.7 28.4 (26.1) 19.5 (15.2) 1.9 (3.3) 2 018
France 1.1 (0.9) 1.9 (2.7) 9.7 (9.0) 6.1 (0.6) 6.7 (4.5) 1.6 (6.2) 7.6 (6.1) 2.0 (2.3) 6.6 (0.4) 6.6 5.1 25.3 (24.8) 19.8 (17.8) 6.3 (22.3) 14 981
Germany 1.7 (1.8) 2.8 (3.4) 4.6 (4.9) 1.5 (1.8) 5.2 (2.8) 12.6 (12.6) 5.0 (4.3) 2.8 (1.8) 1.1 (3.9) 1.2 1.8 40.0 (40.6) 17.1 (16.3) 3.7 (5.8) 25 371
Greece 4.7 (3.4) 2.0 (3.6) 1.4 (1.6) 4.1 (2.2) 2.4 (2.1) 2.1 (9.0) 8.0 (7.0) 3.3 (5.4) 0.5 (5.3) 19.0 2.6 41.3 (42.2) 8.1 (17.0) 0.4 (0.5) 859
Hungary 1.8 (2.9) 2.6 (9.7) 0.5 (2.3) 6.7 (2.1) 6.8 (10.4) 14.2 (19.6) 10.3 (13.1) 8.2 (16.4) 0.6 (9.1) 2.2 1.4 9.3 (9.1) 35.4 (5.0) 0.2 (0.1) 663
Ireland 0.4 (2.4) 1.2 (0.8) 2.4 (1.5) 0.5 (0.0) 0.5 (0.0) 22.3 (14.2) 5.7 (5.3) 13.4 (8.9) 2.9 (2.4) 0.0 1.0 17.8 (64.3) 31.9 (0.1) 0.0 (0.0) 733
Italy 5.5 (2.9) 2.7 (2.7) 8.7 (8.0) 1.2 (1.0) 3.8 (4.0) 11.7 (12.9) 9.6 (9.9) 3.4 (3.4) 3.9 (5.3) 0.9 5.7 39.4 (40.3) 2.6 (5.8) 0.8 (3.6) 8 444
Latvia 0.5 (0.6) 10.4 (0.6) 0.8 (1.1) 4.9 (2.3) 6.7 (1.7) 16.0 (5.1) 15.4 (4.0) 16.3 (7.3) 2.2 (1.7) 1.7 0.9 0.0 (74.6) 22.9 (0.0) 1.2 (0.0) 32
Lithuania 3.0 (2.6) 0.2 (6.8) 0.0 (0.0) 0.0 (1.8) 4.6 (3.4) 5.4 (6.0) 4.7 (12.4) 5.3 (17.5) 0.6 (20.1) 2.1 1.4 50.9 (0.0) 21.6 (0.0) 0.1 (0.2) 126
Luxembourg 0.5 (0.5) 3.2 (3.1) 0.4 (0.0) 1.0 (3.4) 1.6 (0.6) 13.2 (21.0) 18.3 (7.8) 0.5 (1.8) 11.6 (16.4) 0.4 13.4 11.2 (16.4) 24.7 (25.6) 0.0 (0.0) 310
Malta 0.2 (0.0) 0.1 (0.0) 0.0 (0.0) 0.0 (0.0) 0.2 (0.1) 0.4 (0.0) 0.6 (0.0) 3.8 (5.6) 0.1 (6.9) 0.0 0.1 94.4 (89.9) 0.0 (0.0) 0.0 (0.0) 22
Netherlands 0.5 (0.3) 0.7 (1.2) 3.5 (2.5) 2.6 (3.6) 2.1 (2.2) 8.8 (11.5) 4.9 (3.8) 3.1 (6.1) 0.5 (2.1) 0.5 2.3 52.4 (49.0) 16.9 (10.8) 1.2 (2.2) 4 794
Poland 3.4 (1.8) 5.9 (2.4) 2.4 (0.0) 6.6 (1.2) 2.2 (0.9) 11.1 (5.9) 14.8 (1.9) 4.9 (1.3) 4.3 (0.9) 0.8 0.7 1.6 (5.3) 36.2 (76.9) 5.2 (1.3) 1 438
Portugal 1.9 (1.6) 3.4 (3.5) 0.7 (0.2) 4.0 (4.5) 2.2 (0.9) 6.9 (15.1) 11.5 (7.6) 3.6 (9.9) 2.9 (3.4) 3.0 2.4 40.2 (38.8) 17.2 (10.4) 0.2 (0.6) 1 579
Romania 3.7 (1.2) 7.4 (2.1) 1.8 (2.4) 3.7 (3.4) 3.7 (0.9) 12.9 (10.7) 2.8 (4.4) 4.9 (4.3) 4.7 (0.3) 0.4 2.4 0.0 (0.0) 50.0 (40.9) 1.4 (1.7) 297
Slovakia 1.7 (0.6) 2.7 (3.3) 0.6 (0.0) 1.6 (1.0) 1.0 (11.5) 7.4 (0.0) 7.9 (1.6) 4.2 (5.0) 2.9 (3.6) 3.1 1.7 48.2 (25.6) 15.6 (35.9) 1.4 (8.3) 289
Slovenia 1.2 (0.4) 3.1 (3.1) 0.5 (0.0) 3.3 (0.8) 2.9 (0.5) 15.2 (22.6) 7.3 (2.0) 4.0 (3.2) 1.2 (2.7) 1.8 2.2 0.3 (0.0) 56.4 (59.7) 0.7 (4.9) 175
Spain 1.7 (1.6) 3.9 (3.0) 5.0 (3.5) 3.5 (5.5) 2.3 (2.2) 6.8 (18.5) 15.5 (8.2) 6.6 (6.3) 1.0 (2.2) 0.6 1.0 29.4 (17.8) 21.3 (11.0) 1.4 (16.4) 5 682
Sweden 0.4 (0.7) 2.1 (2.2) 1.9 (1.2) 5.0 (3.8) 4.0 (2.3) 2.6 (5.4) 1.7 (1.0) 1.5 (2.2) 0.2 (5.0) 0.1 2.4 49.9 (46.1) 22.0 (12.7) 4.0 (17.4) 3 640
UK 3.1 (2.3) 2.8 (1.8) 3.3 (2.0) 3.4 (1.1) 2.5 (0.4) 3.4 (1.7) 21.1 (14.7) 4.0 (3.3) 0.4 (3.5) 1.8 1.5 23.6 (21.7) 13.3 (16.0) 15.9 (31.0) 11 305
Source: Eurostat, June 2015; for 2005 data between brackets: Eurostat data cited in UNESCO Science Report 2010
By early 2015, the first 31 projects had been selected (out of 169 proposals) for funding of € 500 000. One of these projects is developing the Wroclaw Centre of Excellence in new materials, nanophotonics, additive laser-based technologies and new management organization systems. Within this project, the Wroclaw University of Technology and the Polish National Centre for Research and Development are collaborating with the German Fraunhofer Institute for Material and Beam Technology and the University of Würzburg in Germany to develop this centre of excellence.
Programmes of mutual benefit to the EU and its partnersThe EU’s framework programmes invite countries beyond the EU to participate, including developing countries. Some are associated with the framework programmes through a formal agreement. For Horizon 2020, this includes Iceland, Norway and Switzerland (see Chapter 11), Israel (see Chapter 16) and countries at various stages of negotiations regarding their future accession to the EU, as in the case of several Southeast European countries (see Chapter 10) and both Moldova and Turkey (see Chapter 12). As part of its Association Agreement concluded with the EU in 2014, Ukraine has also formally become a Horizon 2020 partner (see Chapter 12). There is some doubt as to Switzerland’s continued participation in Horizon 2020 after 2016, in light of the anti-immigration vote in a popular referendum in 2014 which flies in the face of one of the EU’s key principles, the free movement of people (see Chapter 11).
A wider list of countries, including numerous developing ones, are in principle automatically eligible to submit research proposals through Horizon 2020 programmes. Association with the EU’s framework programmes can represent a significant contribution to the partner country’s research volume and help it develop linkages with international networks of excellence. In turn, the EU has derived substantial benefit from the scientific talent of countries from the former Soviet bloc and elsewhere (e.g. Israel) through its framework programmes.
Russian research centres and universities are participating in Horizon 2020 within international consortia (see Chapter 13). Moreover, in 2014, at the height of tensions over Ukraine, the Agreement on Co-operation in Science and Technology was renewed for another five years by the European Commission and the Russian government. A roadmap for establishing the EU–Russia Common Space for Research and Education is also currently being implemented, involving, inter alia, the stepping up of collaboration in space research and technologies.
China has enjoyed extensive co-operation with the EU ever since the signing of the EU–China Science and Technology Agreement in 1999. Relations have deepened, in particular,
newcomers, their share of the 10% most-cited papers rising from 6.3% in 2007 to 8.2% in 2012.
Twinning institutions to narrow the research gapWithin Horizon 2020, the EU launched the Teaming action in 2013 to help narrow the research gap with the newest EU members and specific non-EU countries. Universities and other research institutions from these countries can apply for competitive funding from the Research Executive Agency to execute a project in partnership with internationally leading institutions from all over Europe.

UNESCO SCIENCE REPORT
256
since the creation of the EU–China Comprehensive Strategic Partnership in 2003. During the Seventh Framework Programme, China was the EU’s third-largest partner country (after the USA and the Russian Federation) for the number of participating organizations (383) and collaborative research projects (274), particularly those focusing on health, environment, transportation, ICTs and the bio-economy (European Commission, 2014b).
Co-operation with China is significant for qualitative reasons, as many projects focus on frontier technologies, such as clean and efficient carbon capture. In addition to facilitating a convergence of views between researchers of different backgrounds, this co-operation has had some positive spillovers to other regions in in complex cross-disciplinary areas, one example being the project for Advancing
Universal Health Coverage in Asia over 2009–2013).14 The EU and China are also co-operating within Euratom15 via its fission programme and construction of the International Thermonuclear Experimental Reactor in France to further research into nuclear fusion.16 Between 2007 and 2013, nearly 4 000 Chinese researchers received funding through the Marie Curie Actions (European Commission, 2014b).
The EU intends for China to remain an important partner of Horizon 2020, even though China is no longer eligible for funding from the European Commission, meaning that EU
14. See: http://ec.europa.eu/research/infocentre/all_headlines_en.cfm
15. The European Atomic Energy Community (Euratom) was founded in 1957 with the purpose of creating a common market for nuclear power in Europe to ensure a regular and equitable supply of nuclear fuel to EU users.
16. For details, see the UNESCO Science Report 2010, p. 158.
The European Galileo navigation system is potentially a serious rival for the US Global Positioning System (GPS). Equipped with the best atomic clocks ever used for navigation, the European system will have the precision of one second for every three million years. Its more inclined orbit will give it greater coverage than GPS, particularly over northern Europe.
Another difference between GPS and Galileo is that Galileo has always been a civil project, whereas GPS was designed by the US Department of Defense and only later adapted to civil use, in recognition of the potential for commercial spin-offs and the prospect of competitive systems being developed.
Once operational, Galileo will not only facilitate road, maritime and air traffic flows but should also help to develop services like e-ecommerce and mobile phone applications. It can also be used by scientists for atmospheric studies and environmental management. In 2014, an article published in Science reported that a GPS system had detected an elevation of land in Western USA caused by the prolonged
drought in this region; satellite navigation systems could thus be used around the world to detect changes in the amount of water stored in the subsoil. Galileo should be able to offer these services once the first ten satellites out of 22 have been placed in orbit, alternately by the Russian Soyouz and European Ariane 5 launchers.
On 22 August 2014, satellites five and six were launched by Soyouz from French Guyana. However, they ended up in an elliptical orbit 17 000 km above the Earth rather than in their intended circular orbit 23 000 km above the Earth. An investigation into the mishap found that the fuel had frozen in the upper section of Soyouz.
The project has been plagued with problems since its inception in 1999. Initially, European countries were divided as to the project’s usefulness, some considering Galileo superfluous, given the existence of GPS, others stressing the advantages of an independent navigation system for Europe.
The conclusion of an agreement with the USA in 2004 guaranteed the compatibility of the dual systems but
the costs of Galileo then began to skyrocket: from € 3.3 billion initially to € 5.5 billion by 2014. This inflation put paid to the initial public–private partnership, two-thirds funded by the private sector; the partnership was abandoned in 2007 when the project was entrusted to the European Space Agency.
From this point on, the project took off. However, the German company entrusted with building the 22 satellites, OHB, proved incapable of delivering them on time. This forced the European Space Agency to appeal for help to OHB’s competitors, Airbus and the French company Thales. Ultimately, the launch of satellites five and six was delayed a year, until August 2014. If all goes according to plan, all the remaining satellites will have been deployed by 2017.
In the meantime, other countries have launched their own programmes. These include the Russian navigation system Glonasa, the Chinese Beidou, the Japanese QZSS system and India’s INRSS project.
Source: adapted from Gallois (2014)
Box 9.2: Galileo: a future rival for GPS

European Union
257
Chapter 9
and Chinese participants will be expected to secure funding themselves for their joint project proposals. The initial work programme (2014–2015) under Horizon 2020 will most likely focus on food, agriculture and biotechnology; water; energy; ICTs; nanotechnology; space; and polar research.17 China’s co-operation with the Euratom Work Programme on topics related to fusion and fission is also expected to continue.
Initially framed within the Cotonou Agreement (2000) covering sub-Saharan, Caribbean and Pacific countries but excluding South Africa, the EU’s co-operation with Africa is increasingly being organized in partnership with Africa’s own frameworks for co-operation, in particular the African Union, as well as within the Joint Africa–EU Strategy adopted by African and European Heads of State at the Lisbon Summit in 2007.18
The ERAfrica initiative (2010–2014) funded by the Seventh Framework Programme has enabled European and African countries to launch joint calls for proposals in three thematic fields: Renewable Energy; Interfacing Challenges; and New Ideas; this has resulted in 17 collaborative research projects being backed by € 8.3 million. Meanwhile, the Network for the Coordination and Advancement of sub-Saharan Africa–EU Science and Technology Cooperation Plus (CAAST-Net Plus, 2013–2016) focuses on food security, climate change and
17. See: https://ec.europa.eu/programmes/horizon2020/horizon-2020-whats-it-china
18. http://ec.europa.eu/research/iscp/index.cfm?lg=en&pg=africa#policydialogue
health, with the participation of 26 research organizations across both continents.19
South Africa is the only African country to participate in the EU’s Erawatch programme. One out of four of South Africa’s almost 1 000 applications to the Seventh Framework Programme for research project funding was successful, representing a total of more than € 735 million, according to the 2012 Erawatch report on South Africa.
African countries are expected to participate in Horizon 2020 through similar arrangements to those for the Seventh Framework Programme. By mid-2015, institutions from 16 African countries had reportedly obtained € 5 million from Horizon 2020 in the form of 37 individual grants, the majority of which are related to climate change and health research. However, African involvement in Horizon 2020 so far is below expectations (and lower than for the Seventh Framework Programme); according to the EU, this primarily reflects the need to set up national contact points in more African countries and to increase their capacity through supportive EU projects.20 Between 2008 and 2014, several EU countries figured among the closest collaborators of African scientists (see Figures 18.6, 19.8 and 20.6).
19. http://www.caast-net-plus.org
20. See Ralphs, G. (2015) African participation drops in Horizon 2020. Research, 18 May: www.researchresearch.com
Figure 9.8: Uptake of STI activities by new EU member states, 2004–2013
0.0
0.5
1.0
1.5
2.0
2.5
3.0
3.5
4.0
94.5
95.0
95.5
96.0
96.5
97.0
97.5
98.0
98.5Share in EU28 R&D spending (%)
Share in EU28 scientific publications (%)
R&D intensity as a share of GDP (%)
Scientific publications per million inhabitants
2004
2005
2006
2007
2008
2009
2010
2011
2012
2013
2004
2005
2006
2007
2008
2009
2010
2011
2012
2013
0.40
0.50
0.60
0.70
0.80
0.90
1.00
1.10
1.20
1.30
1.40
1.20
1.30
1.40
1.50
1.60
1.70
1.80
1.90
2.00
2.10
2.20
0.0
2.0
4.0
6.0
8.0
10.0
90.0
90.5
91.0
91.5
92.0
92.5
EU15(lef t axis)
10 new member
states(right axis)
Bulgaria, Croatia
& Romania(right axis)
0
100
200
300
400
500
600
700
800
0
200
400
600
800
1,000
1,200
Source: for top two graphs: Eurostat, January 2015; for bottom two graphs: computed by Science–Metrix using Thomson Reuters’ Web of Science
Note: Shares for
the EU25 for 2004–2006 do not take
into account the R&D
spending by Bulgaria,
Croatia and Romania.

UNESCO SCIENCE REPORTFigure 9.9: Scientific publication trends in the European Union, 2005–2014
Growth is generally stronger in the newer EU member states but Austria, Denmark and Portugal have also made great strides
0
20 000
40 000
60 000
80 000
100 000
2005 2006 2007 2008 2009 2010 2011 2012 2013 2014
0
3 000
6 000
9 000
12 000
15 000
Germany 91 631
UK 87 948
France 65 086
Italy 57 472
Spain 49 247
Netherlands 31 823
Poland 23 498
Sweden 21 854
Belgium 18 208
Austria 13 108
Portugal 11 855
Czech Rep. 10 781
Greece 9 427
Ireland 6 576
Hungary 6 059
73 573
70 201
52 476
40 111
29 667
22 225
13 843
16 445
12 572
8 747
8 644
5 245
5 799
7 987
7 597
2 543
3 941
4 864
Denmark14 820
Finland 10 758
Romania 6 651
258

European Union
259
0
500
1 000
1 500
2 000
2 500
3 000
3 500
2005 2006 2007 2008 2009 2010 2011 2012 2013 2014
Slovenia 3 301
Croatia 2 932
Bulgaria 2 065
Lithuania 1 827
Estonia 1 567
Luxembourg 854
Cyprus 814
Latvia 586
Malta 207
2 025
1 931
1 624
1 756
885
745
175258319
61
Slovakia 3 144
EU28
USA
China
Japan
0
450 000
400 000
350 000
300 000
250 000
200 000
150 000
100 000
50 000
2005 2006 2007 2008 2009 2010 2011 2012 2013 2014
With a 34% share of world publications in 2014, the EU is still the largest bloc for absolute authorship
Chapter 9
Figure 9.9 (continued)

260
Life sciences dominate but the wide research base includes chemistry, physics, engineering and geosciences. French authors contribute to a fifth of the EU’s scientific output in mathematicsBritish authors contribute to a third of the EU’s scientific output in psychology and social sciencesCumulative totals by field, 2008–2014
1 3681 559 15 412 6 154 1 807 6 131 5 404 3 033 23 153 183 8 692 606
669
3 0822 324
22 939 9 709 2 105 8 779 6 525 3 213 32 846 728 11 249 1 044979
461 327 2 018 2 318 158 1 089 733 621 1 321 18 2 386 2923
775 259 2 992 1 842 230 1 816 1 612 896 3 830 95 2 074 2363
91 24 463 407 224 617 379 285 675 69 796 2650
2 083 952 12 839 9 457 1 423 5 333 4 345 2 925 9 117 65 8 800 203393
2 820 1 580 19 017 5 227 1 018 5 263 6 483 1 272 26 659 519 6 806 533764
221 150 2 172 683 103 734 1 022 190 1 109 39 1 285 6646
1 479 1 159 13 943 4 830 1 520 6 094 4 681 1 689 16 759 710 7 271 604
586
7 841 10 966 75 369 44 619 9 656 39 415 32 324 21 288 92 457 621 60 405 2 6712 411
10 378 15 611 108 639 65 285 8 746 45 728 35 883 18 035 156 096 1 337 83 344 4 5703 975
1 986 901 8 987 4 881 2 683 7 470 5 225 2 190 19 732 249 7 086 254579
883 685 7 925 4 454 696 2 202 1 838 2 427 8 055 77 5 343 272
163
2 260 826 7 991 3 581 1 011 3 255 2 510 1 101 11 068 655 4 295 327388
9 382 9 300 60 142 28 458 7 274 31 294 22 666 13 449 103 792 1 040 40 718 1 8342 219
71 41 475 444 72 624 139 77 418 4 661 1310
532 135 1 092 824 361 2 311 689 502 1 061 35 1 900 1154
66 5
867 272 199 447 322 223 698 6 366 2737
10 9 145 16 27 101 126 43 307 18 55 4 4
3 952 4 980 39 350 11 618 3 315
12 300 11 779 3 069 73 103 2 075 14 3093 051
2 379
4 926 2 229 21 502 20 385 1 983 15 914 9 076 6 215 22 235 145 21 462 306343
2 312 935 12 294 8 602 1 553 8 425 6 736 2 782 9 474 234 7 398 393565
529239 2 754 5 240 1 002 4 780 2 291 3 976 3 613 218 6 311
29361
566 392 3 414 2 594 470 1 949 1 173 840 2 160 32 3 510 45109
577 152 3 075 2 184 619 2 979 1 030 1 092 3 070 106 3 042 64107
13 638 7 299 56 015 35 461 9 859 28 830 22 076 11 063 62 076 1 131 30 082
2 1552 410
1 976 1 949 28 255 9 447 1 786 11 601 9 242 2 664 40 199 2 249 12 706 9741 116
6 785 14 815 117 924 40 948 10 916 43 647 39 273 14 301 168 147 7 146 53 003 7 8517 524
Agriculture Astronomy Biological sciences Chemistry Computer science Engineering Geosciences
Mathematics Medical sciences Physics PsychologyOther life sciences Social sciences
Austria
UK
Sweden
Spain
Slovenia
Slovakia
Romania
Portugal
Poland
Netherlands
Malta
Luxembourg
Lithuania
Latvia
Italy
Ireland
Hungary
Greece
Germany
France
Finland
Estonia
Denmark
Czech Rep.
Cyprus
Croatia
Bulgaria
Belgium
Figure 9.10: Publication profiles in the European Union, 2008–2014
Note: Totals exclude 286 742 unclassified papers.

261
Figure 9.11: Publication performance in the European Union, 2008–2014
The Nordic EU members have the highest publication intensitiesPublications per million inhabitants in 2014
Den
mar
k
Swed
en
Finl
and
Net
herla
nds
Belg
ium
Luxe
mbo
urg
Slov
enia
Aust
ria
Irela
nd UK
Esto
nia
Port
ugal
Ger
man
y
EU28
ave
rage
Spai
n
Fran
ce
Czec
h Re
p.
Italy
Gre
ece
Cypr
us
Croa
tia
Pola
nd
Hun
gary
Lith
uani
a
Slov
akia
Mal
ta
Rom
ania
Bulg
aria
Latv
ia
For comparison
Cana
da
USA
Japa
n
Chin
a
2 62
8
2 26
9
1 97
6
1 89
4
1 63
4
1 59
1
1 59
0
1 53
7
1 40
6
1 38
5
1 22
1
1 11
7
1 10
9
1 08
5
1 04
6
1 00
7
1 00
4
941
847
706
686
615
610
607
576
481
307
288
287
1 53
8
998
576
184
OECD average 1.08
Den
mar
k
Net
herla
nds
Belg
ium UK
Irela
nd
Swed
en
Aus
tria
Finl
and
Cypr
us
Ger
man
y
Luxe
mbo
urg
Spai
n
Italy
Esto
nia
Mal
ta
Gre
ece
Slov
enia
Hun
gary
Czec
h Re
p.
Bulg
aria
Rom
ania
Croa
tia
Slov
akia
Pola
nd
Lith
uani
a
Latv
ia
1.50
1.48
1.39
1.36
1.34
1.34
1.30
1.28
1.27
1.26
Fran
ce1.
201.24
1.24
1.17
1.16
EU28
ave
rage
1.09
Port
ugal
1.12
1.06
1.04
1.01
1.00
0.97
0.91
0.83
0.83
0.81
0.75
0.74
0.72
OECD average 11.1%
Net
herla
nds
Den
mar
k
Belg
ium UK
Irela
nd
Swed
en
Aus
tria
Cypr
us
Ger
man
y
Luxe
mbo
urg
Esto
nia
Fran
ce
Finl
and
Italy
Spai
n
Mal
ta
EU28
ave
rage
Port
ugal
Gre
ece
Hun
gary
Slov
enia
Czec
h Re
p.
Rom
ania
Bulg
aria
Slov
akia
Croa
tia
Latv
ia
Lith
uani
a
Pola
nd
16.8
16.6
15.3
15.1
14.3
14.1
14.0
13.5
13.5
13.3
13.0
12.7
12.7
12.0
11.8
11.8
11.3
11.2
10.3
9.4
9.4
8.8
7.5
7.1
7.0
7.0
6.7
5.8
5.7
The Netherlands tops the EU for quality, Cyprus and Estonia lead among the newcomersShare of papers among 10% most-cited, 2008–2012
Among the large EU members, the UK has the highest average citation rate, followed by GermanyAverage citation rate for publications, 2008–2012
39%EU’s share of global authorship in medical sciences between 2008 and 2014
29.6%Growth in EU publications between 2005 and 2014
Chapter 9

Figure 9.11 (continued)
262
The USA is the top partner for 14 EU members, including all six most-populous onesMain foreign partners, 2008–2014 (number of papers)
1st collaborator 2nd collaborator 3rd collaborator 4th collaborator 5th collaborator
Austria Germany (21 483) USA (13 783) UK (8 978) Italy (7 678) France (7 425)
Belgium USA (18 047) France (17 743) UK (15 109) Germany (14 718) Netherlands (14 307)
Bulgaria Germany (2 632) USA (1 614) Italy (1 566) France (1 505) UK (1 396)
Croatia Germany (2 383) USA (2 349) Italy (1 900) UK (1 771) France (1 573)
Cyprus Greece (1 426) USA (1 170) UK (1 065) Germany (829) Italy (776)
Czech Rep. Germany (8 265) USA (7 908) France (5 884) UK (5775) Italy (4 456)
Denmark USA (15 933) UK (12 176) Germany (11 359) Sweden (8 906) France (6 978)
Estonia Finland (1 488) UK (1 390) Germany (1 368) USA (1 336) Sweden (1 065)
Finland USA (10 756) UK (8 507) Germany (8 167) Sweden (7 244) France (5 109)
France USA (62 636) Germany (42 178) UK (40 595) Italy (32 099) Spain (25 977)
Germany USA (94 322) UK (54 779) France (42 178) Switzerland (34 164) Italy (33 279)
Greece USA (10 374) UK (8 905) Germany (7 438) Italy (6 184) France (5 861)
Hungary USA (6 367) Germany (6 099) UK (4 312) France (3 740) Italy (3 588)
Ireland UK (9 735) USA (7 426) Germany (4 580) France (3 541) Italy (2 751)
Italy USA (53 913) UK (34 639) Germany (33 279) France (32 099) Spain (24 571)
Latvia Germany (500) USA (301) Lithuania (298) Russian Fed. (292) UK (289)
Lithuania Germany (1 214) USA (1 065) UK (982) France (950) Poland (927)
Luxembourg France (969) Germany (870) Belgium (495) UK (488) USA (470)
Malta UK (318) Italy (197) France (126) Germany (120) USA (109)
Netherlands USA (36 295) Germany (29 922) UK (29 606) France (17 549) Italy (15 190)
Poland USA (13 207) Germany (12 591) UK (8 872) France (8 795) Italy (6 944)
Portugal Spain (10 019) USA (8 107) UK (7 524) France (6054) Germany (5 798)
Romania France (4 424) Germany (3 876) USA (3 533) Italy (3 268) UK (2530)
Slovakia Czech Rep. (3 732) Germany (2 719) USA (2 249) UK (1750) France (1744)
Slovenia USA (2 479) Germany (2 315) Italy (2 195) UK (1889) France (1666)
Spain USA (39 380) UK (28 979) Germany (26 056) France (25 977) Italy (24571)
Sweden USA (24 023) UK (17 928) Germany (16 731) France (10 561) Italy (9371)
UK USA (100 537) Germany (54 779) France (40 595) Italy (34 639) Netherlands (29 606)
Source: Thomson Reuters’ Web of Science, Science Citation Index Expanded; data treatment by Science–Metrix
All EU members are well above the OECD average for the intensity of international co-operationShare of papers with foreign co-authors, 2008–2014
83.0
76.1
66.3
65.6
64.8
61.7
61.7
60.8
59.1
58.3
57.9
57.5
56.9
55.9
55.8
55.0
54.8
54.3
52.6
51.1
50.3
47.8
46.1
46.0
43.8
41.4
38.0
37.9
34.0
Luxe
mbo
urg
Cypr
us
Mal
ta
Aust
ria
Belg
ium
Den
mar
k
Swed
en
Esto
nia
Irela
nd
Net
herla
nds
Finl
and
Slov
akia
Hun
gary UK
Latv
ia
Port
ugal
Bulg
aria
Fran
ce
Ger
man
y
Czec
h Re
p.
Slov
enia
Spai
n
Gre
ece
Italy
Croa
tia
EU28
ave
rage
Rom
ania
Lith
uani
a
Pola
nd
OECD average 29.4%
38.2%Share of EU papers in medical sciences with foreign co-authors in 2014
45.5%Share of all EU papers with foreign co-authors in 2014

Chapter 9
263
COUNTRY PROFILESGiven the sheer size of the EU, the following country profiles are necessarily brief and limited to those countries with a population of more than 10 million. Moreover, the European Commission regularly publishes detailed country profiles of EU member states via its Erawatch series. For a profile of Croatia and Slovenia, see Chapter 10.
BELGIUM
A steep rise in R&D intensityBelgium has a high-quality research system. There is a general consensus on the need to foster innovation-based competitiveness. R&D expenditure in both the public and private sectors has climbed steeply since 2005, placing Belgium among the EU leaders for R&D intensity (2.3% of GDP in 2013).
In Belgium, it is the regions and communities which are mostly responsible for research and innovation, the federal government’s role being circumscribed to providing tax incentives and funding specific areas like space research.
Belgium experienced a period of political instability between 2007 and 2011, with the Dutch-speaking Flemish community advocating a devolution of power to the regions, whereas the French-speaking Walloon community preferred to maintain the status quo. The election of a new federal government in December 2011 put an end to the political stalemate, with the agreed partition of the Brussels – Halle – Vilvoorde region and the adoption of policies to tackle the country’s economic downturn.
In the Dutch-speaking region of Flanders, science and innovation policy focuses on six thematic areas addressing societal challenges. In the French-speaking Walloon region, the focus is on a cluster approach, with the launch of transsectorial innovation platforms and new tools targeting SMEs. The French-speaking Brussels region, which also hosts the European Commission, has adopted a smart specialization approach.
CZECH REPUBLIC
Reforms to develop innovationThe Czech Republic has a strong presence of R&D-performing foreign affiliates. However, there is insufficient co-operation and knowledge transfer between science and the business world. This has led to a weak domestic private base for R&D and explains the Czech Republic’s average commitment to R&D by EU standards (1.9% of GDP in 2013).
Since 2007, the government has made an effort to reform the national innovation system, through the National Policy for Research, Development and Innovation covering 2009–2015 and the National Innovation Strategy (2011). These documents focus on infrastructure development, support for innovative firms and fostering partnerships between the public and private sectors. The EU’s structural funds have also supported this reform of public research. The governance of the Czech innovation system remains very complex but it is expected that the new government Council for Research, Development and Innovation will help improve co-ordination.
FRANCE
Towards the Industry of the FutureFrance has a large science base but the level of business R&D is lower than in similar countries. The government estimates21 that ‘dis-industrialization’ over the past decade has cost France 750 000 jobs and 6% of the GDP earned from industry.
France has substantially reformed its research and innovation system in recent years. Under President Sarkozy (2007–2012), the existing system of tax credits for co mpany research was recalculated on the basis of the volume of research spending rather than the size of the increase in spending over the previous two years. As a result, companies became entitled to a rebate of about 30% on their research expenditure for the first € 100 million and 5% thereafter. Between 2008 and 2011, the number of enterprises benefiting from this tax rebate doubled to 19 700. By 2015, the cost of this tax rebate was ten times higher (circa € 6 billion) than in 2003. A report published in 2013 by the Cour des comptes, France’s watchdog for public finances, questioned the efficacy of an increasingly costly measure, while acknowledging that it had helped to preserve innovation and research jobs during the crisis of 2008–2009. It has also been suggested that larger companies ended up benefiting more from the tax credits than SMEs. In September 2014, President Hollande affirmed his intention of preserving the tax rebate, which is thought to project a positive image of France abroad (Alet, 2015).
A ‘New Deal for Innovation’Since the election of President Hollande in May 2012, the government has oriented its industrial policy towards supporting economic development and job creation, in a context of stubbornly high unemployment (10.3% in 2013), particularly among the young (24.8% in 2013). A total of 34 sectorial industrial plans have been introduced with a strong focus on innovation, as well as a New Deal for Innovation designed to ‘promote innovation for all,’ which
21.See (in French): www.gouvernement.fr/action/la-nouvelle-france-industrielle
European Union

UNESCO SCIENCE REPORT
264
comprises a package of 40 measures to foster innovative public procurement, entrepreneurship and venture capital availability.
In April 2015, the government announced its Industry of the Future project. This project launches the second phase of the government’s New Industrial France initiative, which aims to modernize industrial infrastructure and embrace the digital economy to tear down the barriers between services and industry. The Industry of the Future project focuses on nine priority markets: New Resources; Sustainable Cities; Ecological Mobility; Transportation of Tomorrow; Medicine of the Future; The Data Economy; Intelligent Objects; Digital Confidence; and Intelligent Food.
A first call for project proposals in future-oriented fields (3D printing, augmented reality, connected objects, etc.) is due to be launched in September 2015. Companies which modernize will be entitled to tax cuts and advantageous loans. The Industry of the Future project has been designed in partnership with Germany’s Industry 4.0 project (Box 9.3). Germany will thus be a key partner, with both countries planning to develop joint projects.
GERMANY
Digitalizing industry: a priorityGermany is the EU’s most populous member state and biggest economy. Manufacturing is one of the economy’s strengths, particularly in medium-to-high-tech sectors such as automotive, machinery and chemicals, but its dominance of high-tech manufacturing, such as in pharmaceuticals and optical industries, has eroded over time. The Federal Ministry for Education and Research has developed a High-tech Strategy to improve co-operation between science and industry, in order to maintain Germany’s international competitiveness. Launched in 2006, the strategy was updated in 2010, with a focus on public–private partnerships in forward-looking projects, including some oriented towards tackling the following societal challenges: health, nutrition, climate and energy security, communication and mobility. One key focus of the High-tech Strategy since 2011 has been the digitalization of industry (Box 9.3).
In 2005, the Pact for Research and Innovation was introduced. Within this pact, the federal government and the regions
The German government has taken a distinctly forward-looking approach to what Germans call Industry 4.0 or, in other words, the fourth industrial revolution; this entails bringing the internet of things and the internet of services to industry, estimated by Accenture to add € 700 billion to the German economy by 2030.
Germany’s high-tech strategy since 2011 has had a strong focus on Industry 4.0. The German government has a dual plan. If Germany can manage to become a leading supplier of smart manufacturing technologies, such as cyber-physical systems, this should give a huge boost to German machinery and plant manufacturing, as well as to the automation engineering and software sectors. The hope is that a successful Industry 4.0 strategy will help Germany’s manufacturing industry retain its dominant position in global markets.
Based on a literature review, Hermann et al. (2015) define six design principles of Industry 4.0, namely, interoperability (between cyber-physical systems and humans), virtualization (through which cyber-physical systems monitor production), decentralization (with cyber-physical systems making independent decisions), real-time capability (to analyse production data), service orientation (internally but also by offering individualized products) and modularity (adapting to changing requirements).
In addition to modernizing industry, customizing production and generating smart products, Industry 4.0 will address issues such as resource and energy efficiency and demographic change, while promoting a better work–life balance, according to Kagermann et al. (2013). Some trade unions, however, fear an increase in job insecurity, such as via cloud workers, and job losses.
A new Industry 4.0 platform called Made in Germany was launched in April 2015. It is operated by the federal government (economic affairs and research ministries), firms, business associations, research institutes (in particular, the Fraunhofer institutes) and trade unions.
Although some Industry 4.0 technologies are already becoming a reality, with some smart factories like that of Siemens already in existence, a lot of research remains to be done.
According to the 2013 recommendations from the Industry 4.0 working group, the main research focus areas in the German strategy are (Kagermann et al., 2013):
n Standardization and reference architecture;
n Managing complex systems;
n A comprehensive broadband infrastructure for industry;
Box 9.3: Germany’s strategy for the fourth industrial revolution

265
Chapter 9
European Union
n Safety and security;
n Work organization and design;
n Training and ongoing professional development;
n Regulatory framework; and
n Resource efficiency.
Since 2012, the German Ministry of Education and Research has provided funding of more than € 120 million for Industry 4.0 projects so far. Furthermore, the Ministry for Economic Affairs and Energy is currently providing funds of nearly € 100 million through two programmes, Autonomics for Industry 4.0 and Smart Service World.
The Industry 4.0 strategy has a strong focus on SMEs. Although much of Germany’s industry is buzzing from the Industry 4.0 talk, many German SMEs are not prepared for the structural changes that it implies, either because they lack
the necessary specialist staff or because they are reluctant to initiate major technological change.
The German government hopes to overcome some barriers through pilot applications and best practice examples, by expanding the high speed broadband infrastructure further and by providing training. Other major challenges relate to data security and the creation of a digital single market at the European level.
Germany’s competitors have also been investing in research on the digitalization of industry in recent years, such as through the Advanced Manufacturing Partnership in the USA (see Chapter 5), the Chinese Internet of Things Centre or the Indian Cyber-physical Systems Innovation Hub. According to Kagermann et al. (2013), this research may not be as strategically focused as in Germany.
The EU has also funded research on the topic through its Seventh Framework Programme, such as within the public–private partnership dubbed Factories of the Future, and is continuing to do so within Horizon 2020.
Moreover, France’s Industry of the Future project has been designedin partnership with Germany’s Industry 4.0 project with a view to developing joint projects.
See also: plattform-i40.de: www.euractive.com/sections/innovation-enterprise; www.euractive.com/sections/industrial-policy-europe
(Länder) agreed to increase their joint funding of the major public research institutes regularly, such as the Fraunhofer Society or the Max Planck Society. In 2009, it was agreed to increase the annual growth rate of institutional funding from 3% to 5% for the period 2011–2015, in order to give the research output of Germany’s public research institutes a further boost. In addition, the Central Innovation Programme for SMEs introduced in 2008 funds more than 5 000 projects annually.
FAIR: a major facility for basic research in physicsGermany is to host one of the world’s largest centres for basic research in physics, the Facility for Antiproton and Ion Research (FAIR). The particle accelerator is being built in the city of Darmstadt and should be completed by 2018. Some 3 000 scientists from more than 50 countries are collaborating on the project design, in order to reduce costs and broaden the pool of expertise. In addition to Germany, the project involves seven EU partners (Finland, France, Poland, Romania, Sweden, Slovenia and the UK), plus India and the Russian Federation. The lion’s share of the budget is being provided by Germany and the State of Hesse and the remainder by international partners.
Key targets for the coalition governmentThe coalition agreement signed by the Conservatives and Social Democrats three months after the federal election in September 2013 establishes the following targets, inter alia:
n raising GERD to 3% of GDP by the end of the legislature (2.9% in 2013);
n raising the share of renewable energy to 55–60% of the energy mix by 2035;
n reducing national greenhouse gas emissions by at least 40% by 2020 over 1990 levels;
n concluding Germany’s nuclear phase-out by 2022 (decided in 2012 after the Fukushima nuclear disaster);
n introducing a nationwide minimum wage of € 8.50 (US$ 11.55) per hour in 2015, with industry being able to negotiate exceptions until 2017; and
n introducing a 30% quota for women on company boards of directors.

UNESCO SCIENCE REPORT
266
GREECE
Aligning research with societal challengesGreece has a low R&D intensity (0.78% in 2013) by EU standards, despite a modest increase in recent years that may be tied to its economic woes, since Greece lost about one-quarter of its GDP in six years of recession. The structural problems of the Greek economy, which have led to a series of financial and debt crises over the past five years, have further weakened the Greek innovation system and science base. Greece performs poorly in technological innovation and has few high-tech exports. There is little exploitation of research results by the business sector, no integrated legal framework for those which perform research and a weak articulation of research policy with other policies.
Since 2010, the economic adjustment programme for Greece has focused on structural reforms to make the Greek economy more resilient to future shocks. These reforms are meant to foster growth by strengthening competitiveness and stimulating exports, for instance.
Since 2013, the General Secretariat for Research and Technology has embarked upon an ambitious reform of the Greek innovation system. Measures announced include the completion of the National Strategy for Research, Technological Development and Innovation 2014–2020. The emphasis is on developing research infrastructure and making research centres more efficient by aligning their mandate with societal challenges facing Greece. Greece is expected to benefit from a considerable amount of EU cohesion funding for research and innovation over the 2014–2020 period.
ITALY
A focus on partnerships and knowledge transferItaly devotes a smaller share of GDP to R&D than many of its larger neighbours (1.3% of GDP in 2013). This makes it difficult for Italy to move towards a more efficient research system and reduce its specialization in low-tech sectors.
In 2013, the Ministry of Education, the University and Research launched a strategic document, the Horizon 2020 Italia, to boost the Italian innovation system, by aligning national research programmes with European ones and by reforming the governance of the research system, such as through new competitive procedures, evaluation mechanisms and impact assessment of public funding. A year later, the government introduced the National Research Programme 2014–2020, which proposes strengthening the Italian research system by fostering public–private partnerships, knowledge transfer and better working conditions for researchers.
Business innovation is being supported by the design of new legal frameworks for innovative start-ups and by simplifying access to finance for SMEs. Innovative start-ups are:
n exempt from the costs of setting up their business;
n entitled to 12 months more than other firms to recover their losses;
n allowed to raise capital using crowdfunding;
n given easier access to government funding (Central Guarantee Fund for Small and Medium-Sized Enterprises);
n entitled to benefit from special labour law provisions which do not require them to justify entering into a fixed-term agreement; and
n the beneficiaries of several tax incentives, such as the possibility for personal income taxpayers who invest in innovative start-ups to obtain a tax credit equal to 10% of the amount invested up to a maximum of € 500 000.22
NETHERLANDS
Improving public–private co-ordination The Netherlands is a strong performer in both science and innovation. In terms of both quantity and quality, scientific output is among the highest in the EU, when population is taken into account. Although R&D expenditure remains low (2.0% of GDP in 2013) in comparison with the other more advanced member states, it is increasing (1.7% of GDP in 2009).
The Netherlands’ innovation policy aims to provide a favourable environment for all firms and targeted support for nine so-called top sectors; the top sectors approach was introduced in 2011 and helps businesses, the government and research institutes co-ordinate their activities (OECD, 2014). The nine top sectors are: agriculture and food; horticulture and propagation materials; high-tech systems and materials; energy; logistics; creative industry; life sciences; chemicals; and water. These nine sectors account for more than 80% of business R&D; over the 2013–2016 period, they are expected to generate more than € 1 billion (OECD, 2014).
22. See Latham and Watkins (2012) Boosting Innovative Start-ups in Italy: the New Framework. Client Alert no. 1442.

European Union
267
Chapter 9
POLAND
A shift towards competitive research fundingFor Poland, the benefit of accession to the EU was most visible in 2004–2008 when the risk of doing business dropped, Poland’s attractiveness for investment and financial credibility improved and barriers to capital flows were eliminated. Poland took advantage of these years to modernize its economy, in part by investing in better quality education (Polish Ministry of Economic Affairs, 2014, p.60).
During the wider economic crisis of 2009–2013, the flow of investment to Poland and private consumption slowed but this only mildly affected Poland’s economy, for several reasons. For one thing, Poland had used EU structural funds to develop its infrastructure. In addition, the Polish economy was less open than that of most other countries, so was less exposed to international turbulence. In addition, unlike in most other countries, foreign investment had been geared much more towards modernizing the industrial sector than towards the services sector. Poland also had low levels of private and public debt at the start of the crisis. Last but not least, Poland benefits from a flexible exchange rate (Polish Ministry of Economic Affairs, 2014, p.61–62).
R&D expenditure has been rising consistently since 2007. This said, Poland’s R&D intensity remains well below the EU average, at 0.9% of GDP in 2013, and less than half of GERD is performed by the business sector. The need to make Polish companies more innovative and strengthen science–industry co-operation has been a long-standing challenge for Poland. Among the policy responses proposed in recent years, a series of major reforms to the science and higher education systems in 2010–2011 have shifted the focus towards competitive bidding for funding and a greater number of public–private partnerships. By 2020, half of the country’s science budget should be distributed through competitive funding.
More recently, the 2013 Strategy for Innovation and Effectiveness of the Economy 2020 aims to stimulate private-sector research and innovation. In parallel, the Enterprise Development Programme foresees, among other things, the introduction of tax incentives for innovative firms; the Smart Growth Operational Programme adopted in 2014 will be implementing the Enterprise Development Programme with a budget of € 8.6 million for R&D that focuses on the development ofin-house innovation and funding business R&D.
The role of public procurement in supporting innovation has been stressed by a project implemented since 2013 by the National Centre for Research and Development. The project has selected 30 ‘brokers of innovation’ who will deal with the commercialization of research and the creation of spin-off companies.
PORTUGAL
Technology transfer for smart specializationOver the past decade, Portugal has largely enjoyed a political consensus and continuity in its policy for research and innovation. The focus has been on expanding the national innovation system, increasing public and private investment in research and training more researchers.
The economic recession had an impact on this drive but not overwhelmingly so. Despite this drive, however, Portugal remains below the EU average when it comes to public–private partnerships, knowledge transfer and employment in knowledge-intensive industries. One of the main challenges concerns the weak in-house technological organizational and marketing capabilities of SMEs.
In 2013, the government adopted a new Strategy for Smart Specialization and undertook an analysis of the strengths and weaknesses of the national innovation system. This led to a revision of the regulations governing the financing of research institutions and a re-orientation of indirect R&D funding towards international co-operation. The latter reform will ensure that the Portuguese innovation agency remains autonomous. It has already given rise to an evaluation of the national clustering strategy (providing support to 19 identified clusters), the creation of new advisory bodies and the launch of a Programme for Applied Research and Technology Transfer to Companies.
ROMANIA
Raising business R&D to 1% of GDP by 2020 Romania’s innovation system is primarily based in the public sector: only 30% of the country’s R&D is performed by the business sector. Romania’s scientific output is among the lowest in the EU but it has improved significantly over the past five years. The National Strategy for Research and Innovation 2007–2013 has encourged Romanian scientists to publish in international journals, increased the share of competitive funding, promoted public–private co-operation by providing grants for projects involving industrial partners and promoted business innovation by introducing innovation vouchers and tax incentives.
The new National Strategy for Research and Innovation 2014–2020 is expected to introduce a shift from support for research and its corresponding infrastructure to support for innovation. It should include additional measures to orient research towards practical goals, by developing a partnership for innovation. This partnership is expected to boost business R&D spending to 1% of GDP by 2020.

UNESCO SCIENCE REPORT
268
SPAIN
Making investment go furtherInvestment in R&D has suffered in Spain from the impact of the economic crisis. Fiscal constraints caused a cut in public R&D expenditure from 2011 onwards and business R&D expenditure began declining as early as 2008.
To minimize the impact of this financial drought, the government has taken a number of steps to improve the effectiveness of investment in R&D. The Law for Science, Technology and Innovation adopted in 2011 simplifies the allocation of competitive funding for research and innovation. The rationale behind this scheme is that legal reform will encourage foreign researchers to move to Spain and stimulate the mobility of researchers between the public and private sectors. The Spanish Strategy for Science, Technology and Innovation and the State Plan for Scientific and Technical Research and Innovation, adopted in 2013, follow a similar rationale.
New policies are being designed to facilitate technology transfer from the public to the private sector to promote business R&D. In 2013, several programmes were launched to provide risk and equity funding for innovative firms, one example being the European Angels Fund (Fondo Isabel La Católica) providing equity funding to business angels.
UNITED KINGDOM OF GREAT BRITAIN AND NORTHERN IRELAND
Innovation a priority investmentThe UK is known for having a strong science base, a rich supply of high-level skilled professionals and for being a pole of attraction for globally mobile talents. The business world is adept at creating intangible assets and the country counts a large services sector, including financial services.
Policies focus on strengthening the UK’s ability to innovate and commercialize new technologies. In 2013, research and innovation joined the list of priority areas for investment detailed in the National Infrastructure Plan.
Regional development agencies were dissolved in 2012, after the government decided that all programmes and funding for research and innovation should be co-ordinated henceforth at the national level. It is the ministerial Department for Business, Innovation and Skills which manages science and innovation policies at the national level, sponsoring the seven UK research councils, the Higher Education Funding Council (HEFCE) and the Technology Strategy Board.
Research funding can either be competitive and project-based for researchers from universities and public research institutes, through the country’s research councils, or it can be disbursed through the HEFCE for England and its counterparts in Northern Ireland, Scotland and Wales. HEFCE provides annual grants for research, knowledge transfer and infrastructure development. These annual grants are conditional on the institution’s research being of a minimum quality. HEFCE does not stipulate how the grant for research should be used by each institution.
The Technology Strategy Board is responsible for funding business innovation and technological development and for a range of programmes targeting innovation, such as the use of tax credits to fund business R&D. SMEs are entitled to a deduction of 125% in corporate tax for qualifying expenditure and large companies to a 30% deduction. In 2013, a Patent Box scheme was launched which offers a reduced rate of tax to profits from patents.
A pole of attraction for studentsThe UK has generally been an attractive destination for students and researchers. As of 2013, it not only hosted the largest number of ERC grantees of any EU country but also the largest number of non-nationals conducting ERC-funded research (Figure 9.7). Exports of education services were worth an estimated £ 17 billion in 2013, representing a key source of funding for the UK’s university system. This system has come under pressure in recent years. In an effort to reduce the public deficit, the coalition government tripled student fees in 2012 to about £ 9 000 per year. To sweeten the pill, it introduced student loans but there is some concern that part
The Ogden Trust was set up in 1999 by Sir Peter Ogden with £ 22.5 million of his personal wealth. The Trust originally provided high-achievers from state schools with scholarships and bursaries to attend leading private schools. In 2003, it broadened its scope to students wishing to study physics or an associated degree at a leading
British university up to the completion of their master’s degree.
The Trust also runs a programme which allows alumni to secure paid internships at UK universities for the purpose of conducting research in physics or to gain work experience in physics-related companies.
To address the shortage of school physics teachers with qualifications in physics, the Trust has launched the Scientists in Schools programme to provide funding for postgraduate, PhD and postdoctoral students to gain experience teaching physics before entering teacher training.
Source: Adam Smith, master’s student in physics and Ogden Trust scholar
Box 9.4: The Ogden Trust: philanthropy fostering physics in the UK

European Union
269
Chapter 9
of these loans may never be repaid. The steep rise in tuition fees may also deter students from pursuing their education to graduate level and discourage international students (British physics students from a modest background can apply for a scholarship from the Ogden Trust, see Box 9.4). In July 2015, the Chancellor of the Exchequer (Minister of Finance) placed the university system under renewed pressure by proposing cuts to government subsidies for tuition fees paid by UK and other EU nationals.
Despite the attractiveness of the UK and its reputation for quality – it produces 15.1% of the world’s most highly cited articles for a share of just 4.1% of the global research pool –,
its persistently low R&D intensity has been of concern to the country’s scientific establishment (Royal Society et al., 2015).
The country’s openness to international flows of knowledge may also be at risk. The general election in May 2015 returned the Conservative government to power with a solid majority. In the run-up to the election, the prime minister had promised voters that the Conservatives would hold a referendum on whether or not the UK should remain a member of the EU by the end of 2017. This referendum will thus be held within the next two years and perhaps as soon as 2016. A British exit (Brexit) from the EU would have far-reaching repercussions for both British and European science (Box 9.5).
The cornerstones of the EU’s single market are what are known as the four freedoms: the free movement of people, goods, services and capital. It is the free movement of people which has cristallized discontent in the UK. The government would like to restrict this freedom and is planning to consult the population on a possible exit from the EU by the end of 2017, if it does not obtain satisfaction from its European partners concerning its demand for a revision of relevant treaties.
The UK is one of the largest net contributors to the EU budget, so its departure from the EU would have far-reaching repercussions for both the UK and the EU. The negotiations over the various options for a post-withdrawal relationship would be complex. There exist several ‘model relationships’ for European countries situated outside the EU. The ‘Norwegian model’ or the ‘Swiss model’ are the options currently seen as being the most applicable to the UK. Were the UK’s future relationship with the EU to be modelled on Norway, which is a member of the European Economic Area, the UK would continue to make a significant financial contribution to the EU – potentially even close to the level of its current net contribution of about € 4.5 billion. In this case, the UK would be subject to much of the body of EU law and policy, yet its future influence on the EU would be limited.
If, on the other hand, the UK opted for the Swiss model, it would not remain a member of the European Economic Area. The UK would have to pay less attention to EU legislation and make a smaller financial contribution but it would have to negotiate separate agreements in many different areas, including trade in goods and services, or the movement of people between the UK and the EU (see Chapter 11).
The impact of a Brexit on science and innovation in both the UK and in the EU would depend heavily on the post-withdrawal relationship between the UK and the EU. It is likely that the UK would wish to remain an associated member of the European Research Area, like Norway and Iceland, in order to continue participating in the EU framework programmes. These are considered increasingly important in the UK for funding research, training PhDs and exchanging ideas and people. However, the co-operation agreement for each framework programme would have to be negotiated separately, especially if the UK were not a member of the European Economic Area. This could be a difficult negotiation, as Switzerland has discovered since the likely tightening of its own immigration laws in 2014, following a popular referendum, prompted the EU to grant Switzerland only limited rights to participation in Horizon 2020 (see Chapter 11).
The EU’s structural funds would also be out of reach for the UK, were it to leave the EU. A withdrawal from the EU might also incite international firms to scale down their plans to invest in R&D in the UK. The country would no longer be a gateway to EU markets, nor would its probably stricter immigration laws be particularly supportive of such investment. Lastly, a Brexit would be likely to make the international movement of university researchers between the UK and the rest of Europe, or the world, more complicated and less appealing, owing to the greater anti-immigration sentiment in the country.
In its public discourse, the research community in the UK seems to be clearly against a Brexit. Within days of the May 2015 parliamentary elections, a campaign website entitled Scientists for the EU had been set up. A letter signed by prominent scientists was also published by the Times on 22 May 2015 and articles appeared in The Guardian newspaper on 12 May and in Nature News on 8 May 2015. According to an article published in the Economist on 29 April, whatever the British public decides, the referendum itself is likely to create ‘political and economic turmoil’ in Britain.
Were the Brexit to become a reality, whatever the post-withdrawal relationship, the UK would lose its driving seat for research and innovation within the EU, which would be a loss for both sides.
Source: Böttcher and Schmithausen (2014); The Economist (2015)
Box 9.5: What impact would a Brexit have on European research and innovation?

UNESCO SCIENCE REPORT
270
CONCLUSIONInnovation performance down for half of EUThe EU, in general, and the 19 members of the Eurozone, in particular, have been hard hit by the economic crisis. Unemployment rates have spiralled upwards, with one out of four EU citizens below the age of 25 years being without a job in 2013. This economic hardship has created political instability, with some countries questioning their place in the EU and the UK even contemplating a Brexit.
The Eurozone countries have had to bail out several banks over the past five years. Today, they face additional problems, as the growing public debt burden of some members sows doubts as to their financial credibility. Eurozone countries, the European Central Bank and the International Monetary Fund have all had to lend substantial amounts of money to Ireland, Italy, Portugal, Spain and, above all, Greece. Whereas the other countries have managed to restore their economy by implementing structural reforms, the Greek economy is still convalescent. Despite Greece having adopted a new austerity package in July 2015, there is still a risk that it may have to leave the Eurozone as a result of what increasingly appears to be an unbearable public debt burden.
The EU has adopted an energetic programme to 2020 to conjugate the crisis and foster smart, inclusive and sustainable growth, Europe 2020. One of the key strategies is the Innovation Union, a compilation of more than 30 commitments for improving the capacity of countries to innovate. The EU’s eighth framework programme for research and technological development, Horizon 2020, is endowed with by far the greatest budget ever, € 80 billion. With almost one-third of this amount to be spent on promoting research excellence, Horizon 2020 should raise the EU’s scientific output considerably.
Scientific excellence is being fostered by the European Research Council, which is responsible for 17% of the overall budget of Horizon 2020 in the form of grants to researchers at different stages of their career. The European Research Council has had a profound impact on scientific output and on national research funding, with many member states having created similar institutions and funding schemes.
Despite the framework programmes, EU funding makes up only a modest share of total funding for R&D. The lion’s share comes from national governments and businesses. The EU has formulated an ambitious goal of spending 3% of GDP on R&D by 2020 but progress has been slow in many countries.
Although the gap between the least and most innovative countries has narrowed, the innovation performance of almost half of member states has worsened. This worrying
trend is a consequence of the drop in the share of innovative companies, public–private scientific collaboration and the availability of risk capital. This calls for further support of innovation at both the EU and national levels by making access to finance easier for SMEs, facilitating the inflow of researchers from beyond the EU, by promoting collaboration within but also between the private and public sectors and by harmonizing national support programmes and even replacing them with EU support programmes to increase the scale of EU research and avoid overlap between national activities.
There is support for business innovation in the new Horizon 2020 programme but, even more importantly, member states are taking the initiative in this area. Several countries are re-emphasizing the importance of technology-intensive manufacturing, including France and Germany, and acknowledging the special role that SMEs play in this area by making funds more accessible to smaller companies. Knowledge and technology transfer are being reinforced through the promotion of public–private partnerships.
Only time will tell whether this intensified support for research and innovation has had a positive, marked impact on innovation in Europe. That analysis will have to wait for the next UNESCO Science Report in five years’ time.
KEY TARGETS FOR THE EUROPEAN UNION
n At least 75% of people between 20 and 64 years of age should be employed by 2020;
n On average, 3% of GDP should be invested in research and development (R&D) by 2020;
n By 2020, greenhouse gas emissions should be limited by at least 20% compared to emission levels in 1990, 20% of energy should come from renewables and there should be a 20% increase in energy efficiency (known as the 20:20:20 target);
n School dropout rates should be reduced to below 10% and at least 40% of people between 30 and 34 years of age should have completed tertiary education by 2020;
n The number of persons at risk of poverty or social exclusion should be reduced by at least 20 million by 2020.

European Union
271
Chapter 9
REFERENCESAlet, C. (2015) Pourquoi le Sénat a passé son rapport sur le
crédit impôt recherche à la déchiqueteuse. Alterécoplus online, 17 June.
Attané, M. (2015) The Juncker plan risks making innovation an afterthought. Research Europe, 5 March.
Böttcher, B. and E. Schmithausen (2014) A future in the EU? Reconciling the ‘Brexit’ debate with a more modern EU, EU Monitor - European Integration, Deutsche Bank Research.
Downes, L. (2015) How Europe can create its own Silicon Valley. Harvard Business Review, 11 June.
European Commission (2015a) Innovation Union Scoreboard 2015. European Commission: Brussels.
European Commission (2015b) Seventh FP7 Monitoring Report. European Commission: Brussels.
European Commission (2014a) Research and Innovation performance in the EU – Innovation Union progress at country level. European Commission: Brussels.
European Commission (2014b) Report on the Implementation of the Strategy for International Co-operation in Research and Innovation. European Commission: Brussels.
European Commission (2014c) Research and Innovation - Pushing boundaries and improving the quality of life. European Commission: Brussels.
European Commission (2014d) Regional Innovation Scoreboard 2014, European Commission: Brussels.
European Commission (2014e) State of the Innovation Union - Taking Stock 2010-2014. European Commission: Brussels.
European Commission (2014f) Taking stock of the Europe 2020 strategy for smart, sustainable and inclusive growth. COM(2014) 120 final/2. European Commission: Brussels.
European Commission (2011) Towards a space strategy for the European Union that benefits its citizens. COM (2011) 152 final. European Commission: Brussels.
European Commission (2010) Communication from the Commission - Europe 2020: A strategy for smart, sustainable and inclusive growth. COM (2010) 2020. European Commission: Brussels.
European Environment Agency (2015) The European environment - state and outlook 2015: Synthesis report. European Environment Agency: Copenhagen.
European Research Council (2014) Annual Report on the ERC activities and achievements in 2013. Publications Office of the European Union: Luxembourg.
European Research Council (2015) ERC in a nutshell.
Gallois, D. (2014) Galileo, le futur rival du GPS, enfin sur le pas de tir. Le Monde, 21 August.
Hermann, M., T. Pentek and O. Boris (2015) Design principles for Industrie 4.0 scenarios: A literature review, Working Paper No. 01/2015, Technische Universitaet Dortmund.
Hernández, H.; Tübke, A.; Hervas, F.; Vezzani, A.; Dosso, M.; Amoroso, S. and N. Grassano (2014) EU R&D Scoreboard: the 2014 EU Industrial R&D Investment Scoreboard. European Commission: Brussels.
Hove, S. van den, J. McGlade, P. Mottet and M.H. Depledge (2012) The Innovation Union: a perfect means to confused ends? Environmental Science and Policy, 16: 73–80.
Kagermann, H., W. Wahlster and J. Helbig (2013) Recommendations for implementing the strategic initiative Industrie 4.0: Final report of the Industrie 4.0 Working Group.
OECD (2014) OECD Reviews of Innovation Policy: Netherlands. Organisation for Economic Co-operation and Development: Paris.
Oliver, T. (2013) Europe without Britain: assessing the Impact on the European Union of a British withdrawal. Research Paper. German Institute for International and Security Affairs: Berlin.
MoFA (2014) Poland’s 10 years in the European Union. Polish Ministry of Foreign Affairs: Warsaw.
Roland, D. (2015) AstraZeneca Pfizer: timeline of an attempted takeover. Daily Telegraph, 19 May.
Royal Society et al. (2015). Building a Stronger Future: Research, Innovation and Growth. February.
Technopolis (2012) Norway’s affiliation with European Research Programmes – Options for the future. Final report, 1 March.
The Economist (2015) Why, and how, Britain might leave the European Union. The Economist, 29 April.
Hugo Hollanders (b. 1967: Netherlands) is an economist and researcher at UNU-MERIT (Maastricht University) in the Netherlands. He has over 15 years of experience in innovation studies and innovation statistics. He is primarily involved in research projects funded by the European Commission, including as lead author of its innovation scoreboard report.
Minna Kanerva (b. 1965: Finland) shares her time between the Sustainability Research Centre (artec) in Germany and UNU-MERIT in Maastricht (Netherlands). Her research interests include sustainable consumption, climate change, eco-innovation, nanotechnologies and measuring innovation. She is currently completing her PhD.