Embed Size (px)
Citation preview
The European LeasingThe European Leasing& Automotive Rental Markets & Automotive Rental Markets ––
State of PlayState of Play
Jurgita BucyteJurgita BucyteAdviser in Statistics and Economic Affairs,Adviser in Statistics and Economic Affairs,
LeaseuropeLeaseurope
LeaseuropeLeaseurope’’ss 2011 Seminar for2011 Seminar forLessors in Central, Eastern and SouthLessors in Central, Eastern and South--Eastern EuropeEastern Europe
15 April 2011, 15 April 2011, LjubljanaLjubljana
Agenda
Evolution of the European Leasing MarketEvolution of the European Leasing MarketEuropean Leasing Market in 2010 European Leasing Market in 2010
-- Leased AssetsLeased Assets-- Leasing ClientsLeasing Clients-- Regional PerformanceRegional Performance
Evolution of the Leasing Market in CEE Evolution of the Leasing Market in CEE CEE Leasing Market in 2010CEE Leasing Market in 2010
-- Individual Country PerformanceIndividual Country Performance-- Leased AssetsLeased Assets
European Leasing Penetration European Leasing Penetration
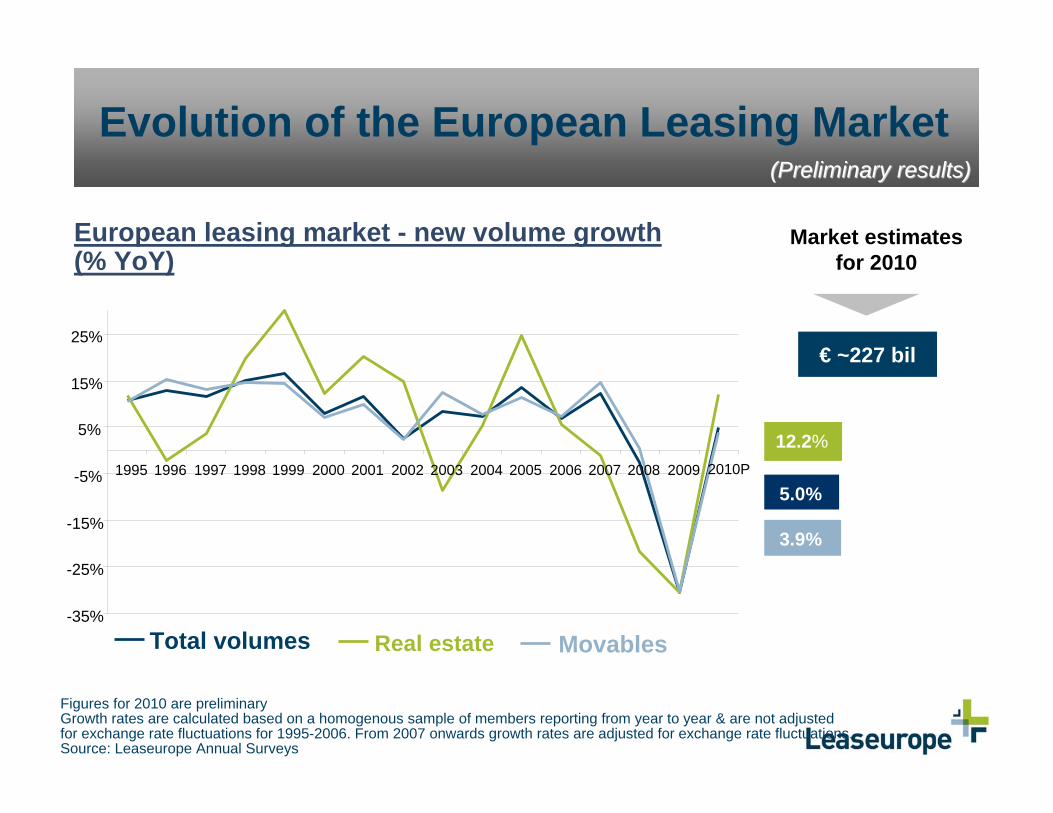
Evolution of the European Leasing Market
3.9%
12.2%
5.0%
European leasing market - new volume growth(% YoY)
€ ~227 bil
Figures for 2010 are preliminaryGrowth rates are calculated based on a homogenous sample of members reporting from year to year & are not adjusted for exchange rate fluctuations for 1995-2006. From 2007 onwards growth rates are adjusted for exchange rate fluctuations. Source: Leaseurope Annual Surveys
Market estimates for 2010
-35%
-25%
-15%
-5%
5%
15%
25%
1995 1996 1997 1998 1999 2000 2001 2002 2003 2004 2005 2006 2007 2008 2009 2010P
Total volumes Real estate Movables
(Preliminary results)(Preliminary results)
-5%
0%
5%
10%
15%
0%
5%Equipment Vehicles
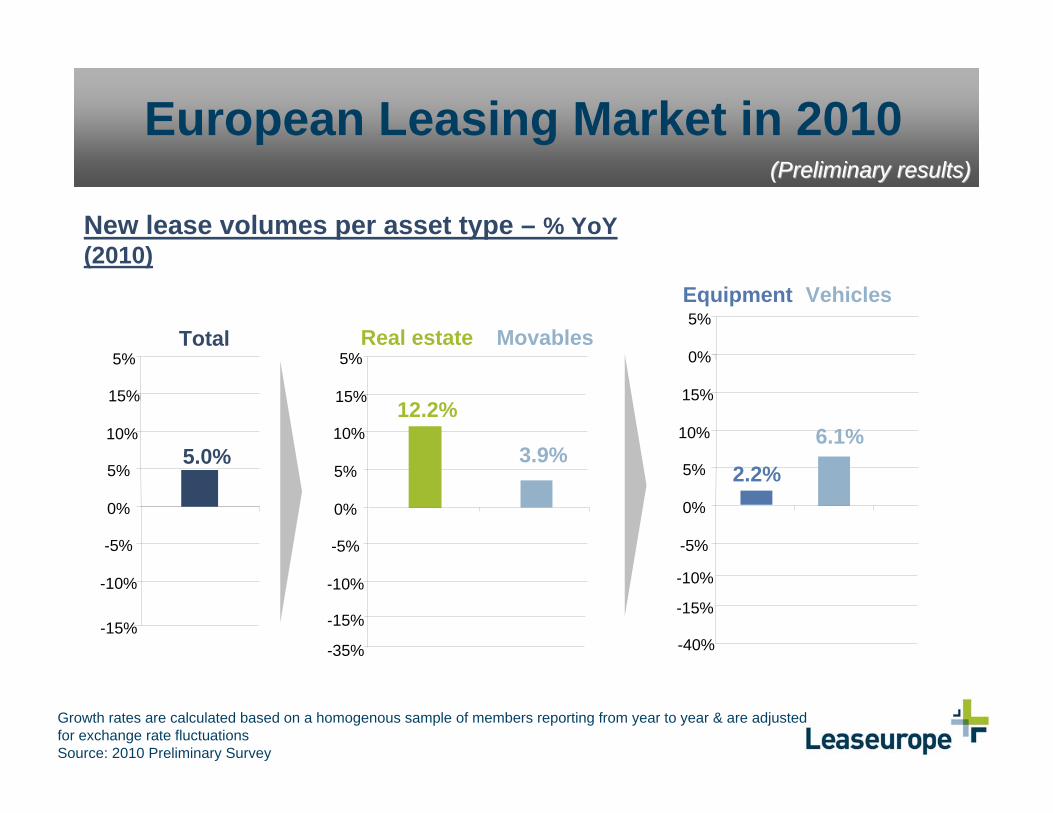
2.2%
6.1%
-10%
-15%
-40%
European Leasing Market in 2010
-10%
-5%
0%
5%
10%
15%
5%Total
New lease volumes per asset type – % YoY(2010)
5.0%
-15%
-10%
-5%
0%
5%
10%
15%
5%Real estate Movables
12.2%
3.9%
-15%
-35%
Growth rates are calculated based on a homogenous sample of members reporting from year to year & are adjusted for exchange rate fluctuationsSource: 2010 Preliminary Survey
(Preliminary results)(Preliminary results)
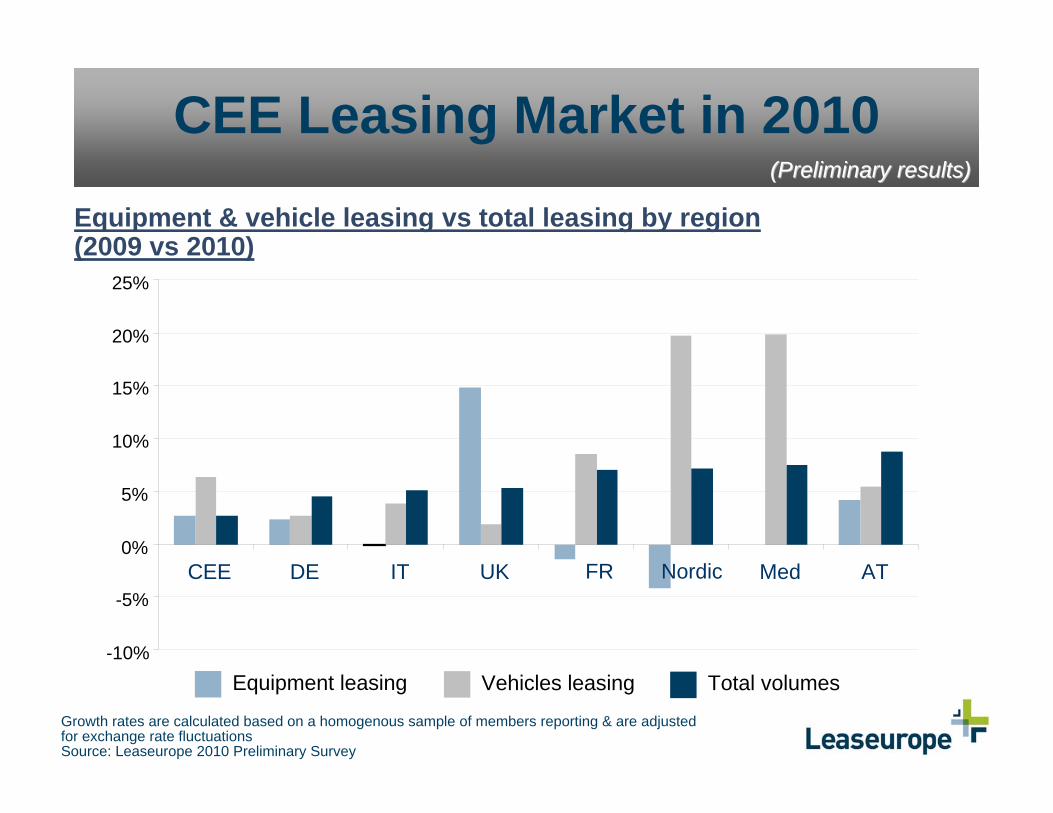
CEE Leasing Market in 2010
Equipment & vehicle leasing vs total leasing by region (2009 vs 2010)
Equipment leasing Total volumesVehicles leasing
Growth rates are calculated based on a homogenous sample of members reporting & are adjusted for exchange rate fluctuationsSource: Leaseurope 2010 Preliminary Survey
-10%
-5%
0%
5%
10%
15%
20%
25%
CEE DE IT UK FR Nordic Med AT
(Preliminary results)(Preliminary results)
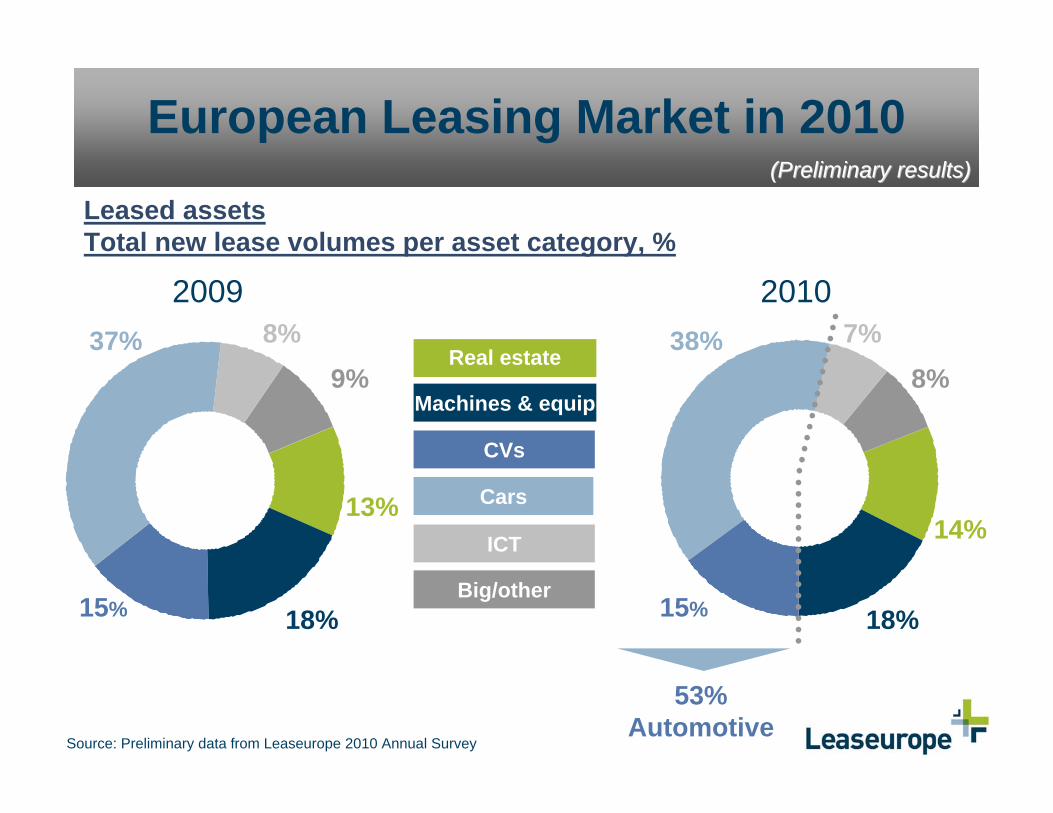
European Leasing Market in 2010
Leased assetsTotal new lease volumes per asset category, %
Source: Preliminary data from Leaseurope 2010 Annual Survey
Machines & equip
Cars
CVs
ICT
Big/other
Real estate
20102009
9%
13%
18%15%
37% 8%8%
14%
18%15%
38% 7%
53% Automotive
(Preliminary results)(Preliminary results)
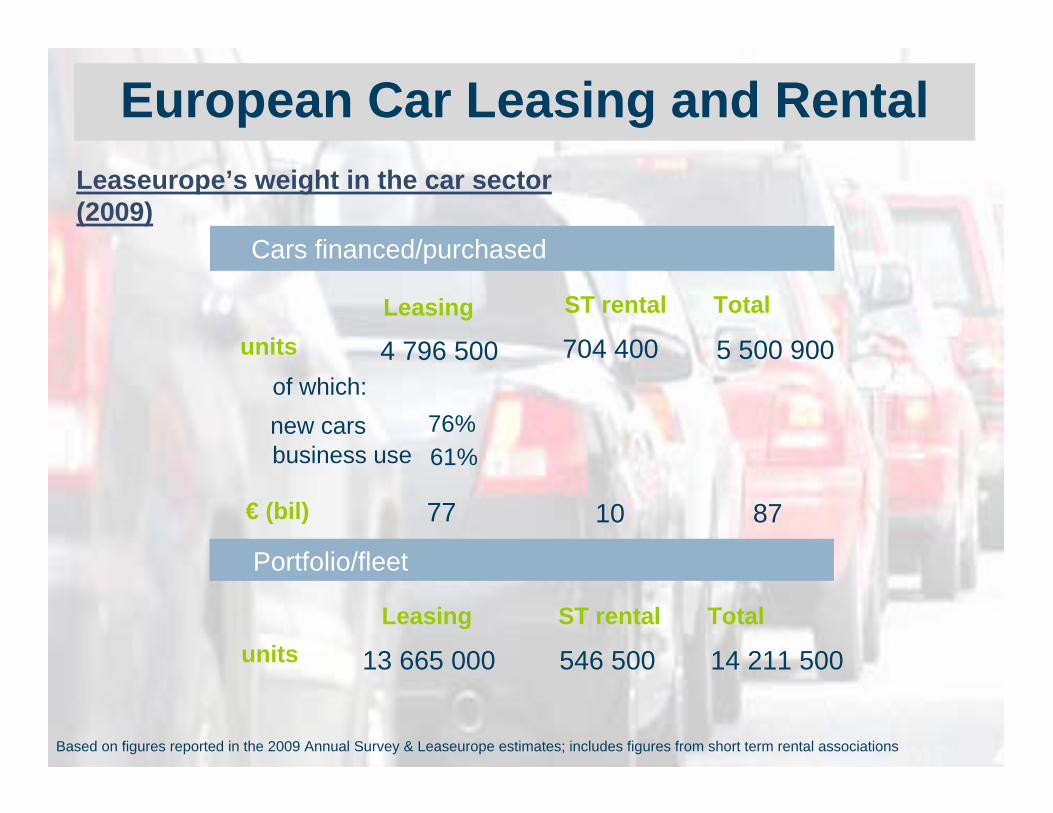
Based on figures reported in the 2009 Annual Survey & Leaseurope estimates; includes figures from short term rental associations
Leaseurope’s weight in the car sector (2009)
European Car Leasing and Rental
14 211 500546 500unitsTotal ST rentalLeasing
Portfolio/fleet
13 665 000
871077€ (bil)
5 500 900704 4004 796 500units
Total ST rentalLeasing
Cars financed/purchased
new carsbusiness use
76%61%
of which:
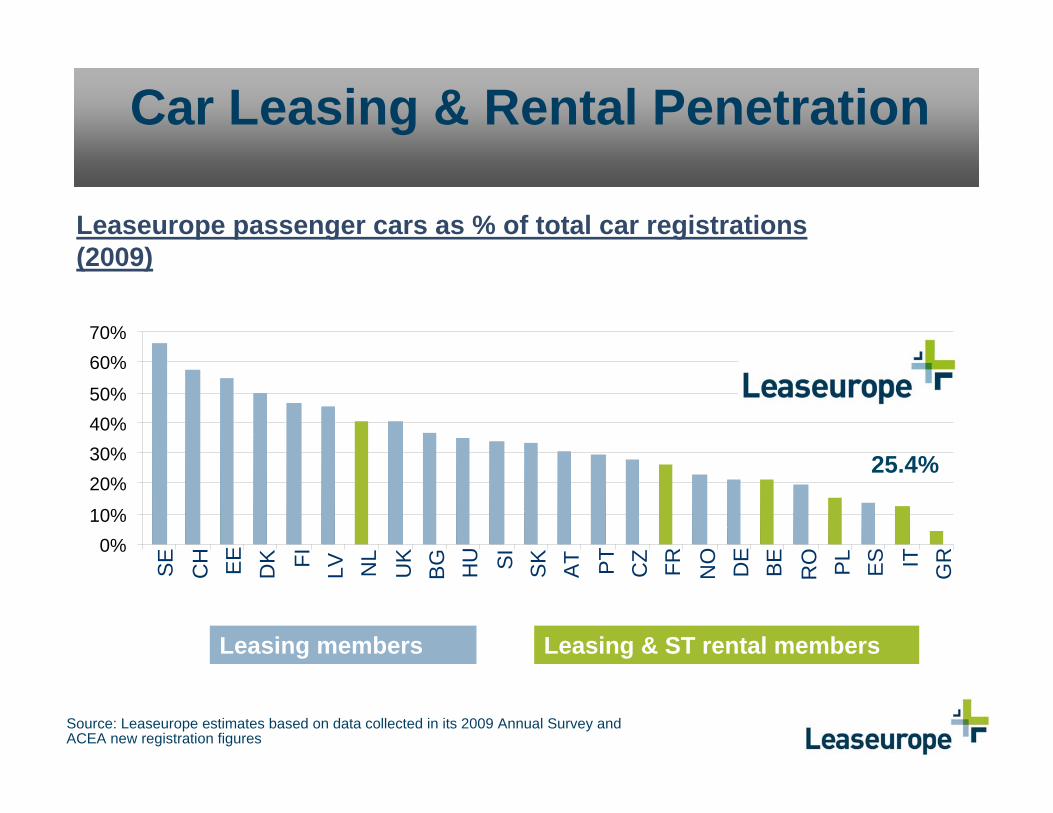
Car Leasing & Rental Penetration
Source: Leaseurope estimates based on data collected in its 2009 Annual Survey and ACEA new registration figures
Leaseurope passenger cars as % of total car registrations (2009)
0%10%
20%30%40%50%
60%70%
SE CH EE DK FI LV NL
UK
BG HU SI
SK AT PT
CZ FR NO DE
BE RO PL
ES IT GR
Leasing & ST rental membersLeasing members
25.4%
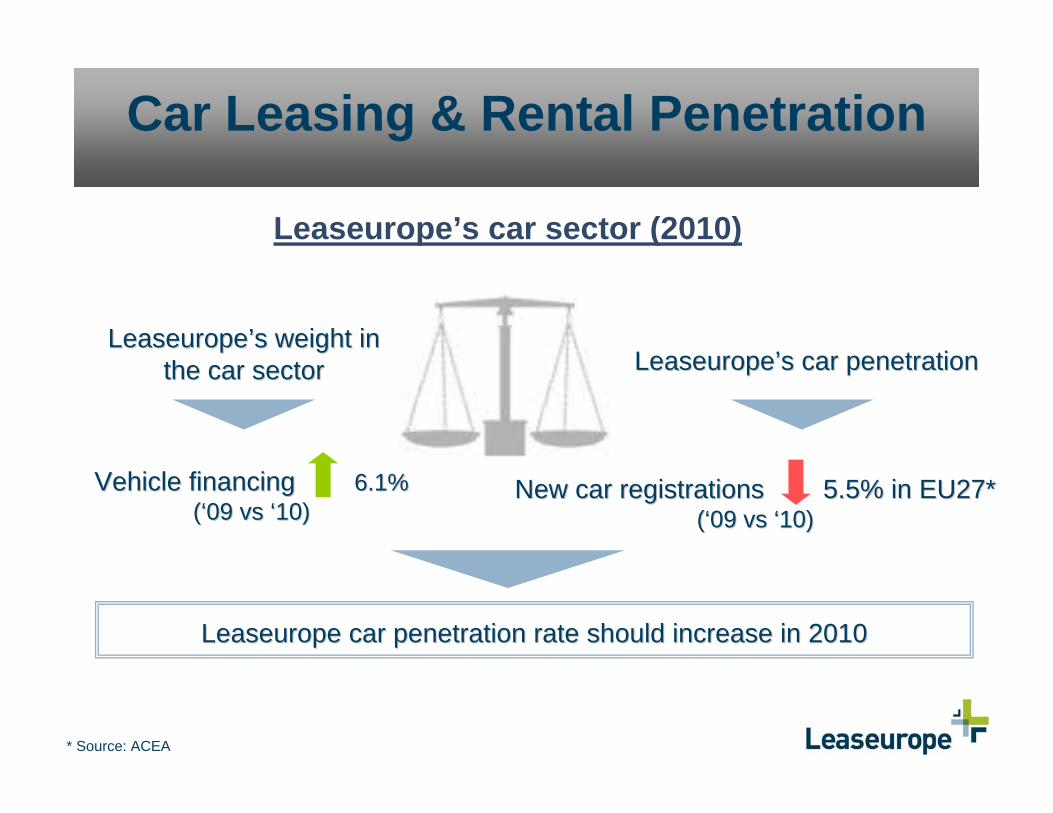
Car Leasing & Rental Penetration
Leaseurope’s car sector (2010)
Vehicle financing Vehicle financing 6.1%6.1%((‘‘09 09 vsvs ‘‘10) 10)
Leaseurope car penetration rate should increase in 2010 Leaseurope car penetration rate should increase in 2010
* Source: ACEA
New car registrations 5.5% in EU27*New car registrations 5.5% in EU27*((‘‘09 09 vsvs ‘‘10)10)
LeaseuropeLeaseurope’’ss weight in weight in the car sectorthe car sector LeaseuropeLeaseurope’’ss car penetrationcar penetration
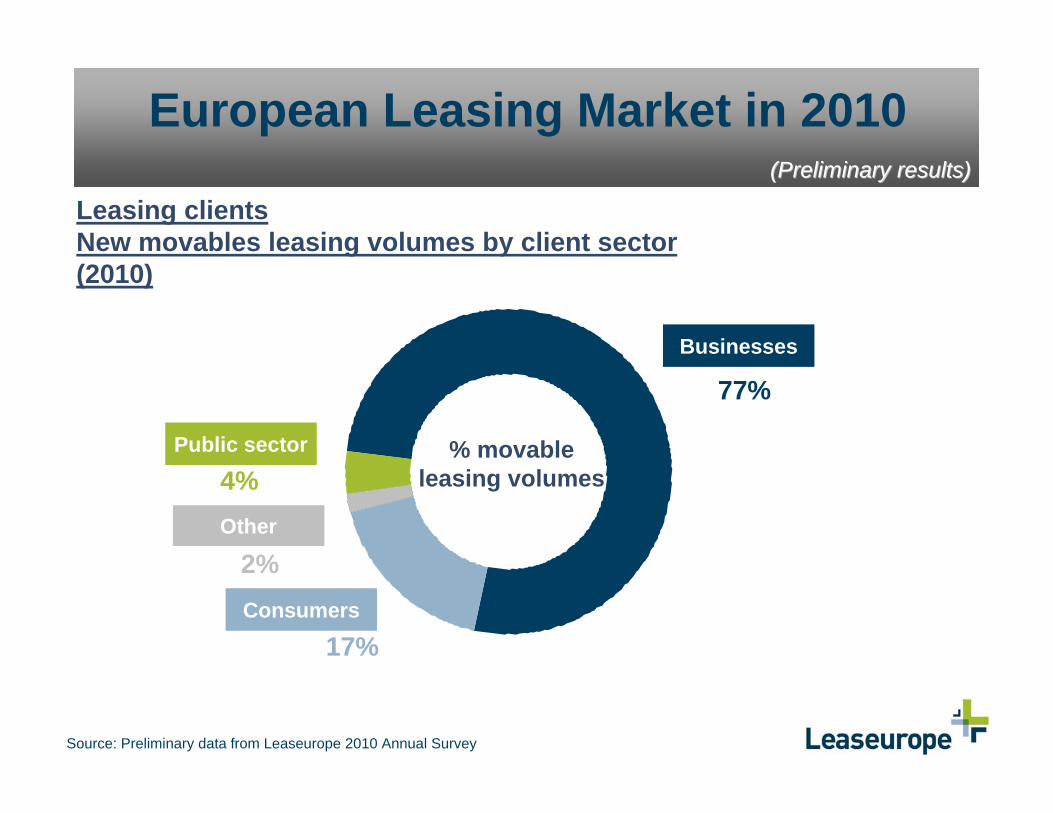
European Leasing Market in 2010
Leasing clientsNew movables leasing volumes by client sector (2010)
Businesses
Public sector
Other
Consumers
2%
77%
17%
4%
Source: Preliminary data from Leaseurope 2010 Annual Survey
% movable leasing volumes
(Preliminary results)(Preliminary results)
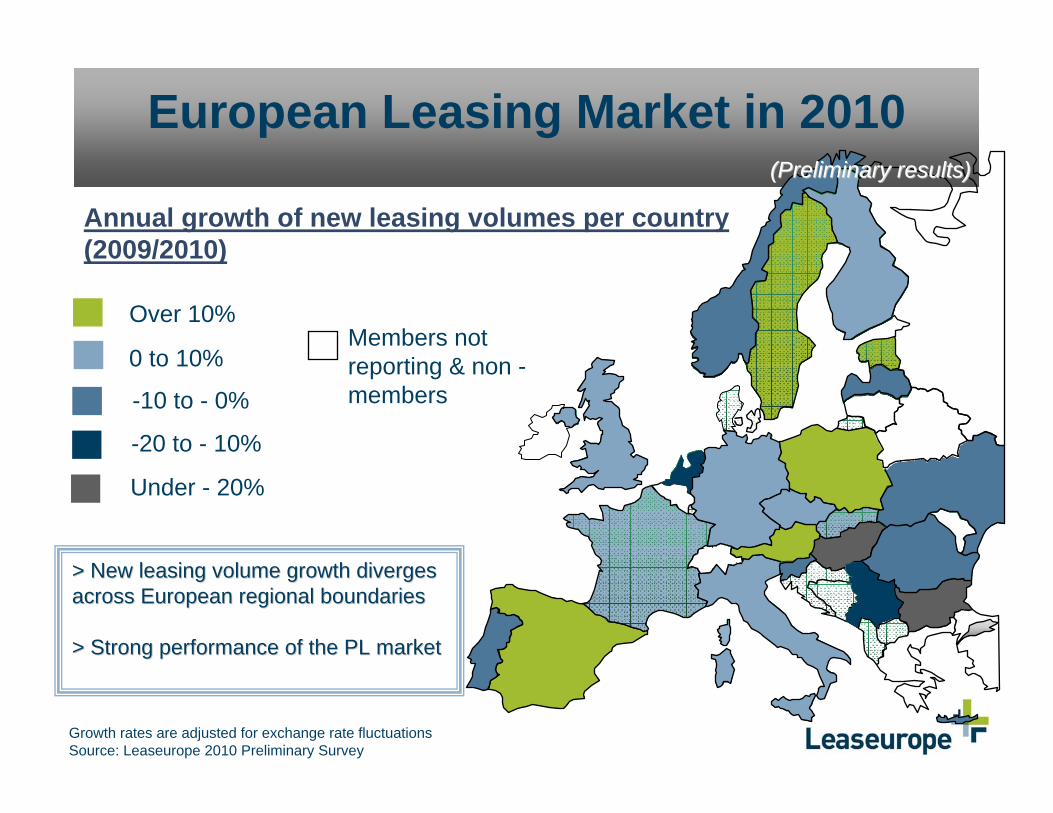
European Leasing Market in 2010
Annual growth of new leasing volumes per country (2009/2010)
Members not reporting & non -members
Growth rates are adjusted for exchange rate fluctuationsSource: Leaseurope 2010 Preliminary Survey
0 to 10%
Over 10%
-20 to - 10%
> New leasing volume growth diverges > New leasing volume growth diverges across European regional boundaries across European regional boundaries
> Strong performance of the PL market > Strong performance of the PL market
-10 to - 0%
Under - 20%
(Preliminary results)(Preliminary results)
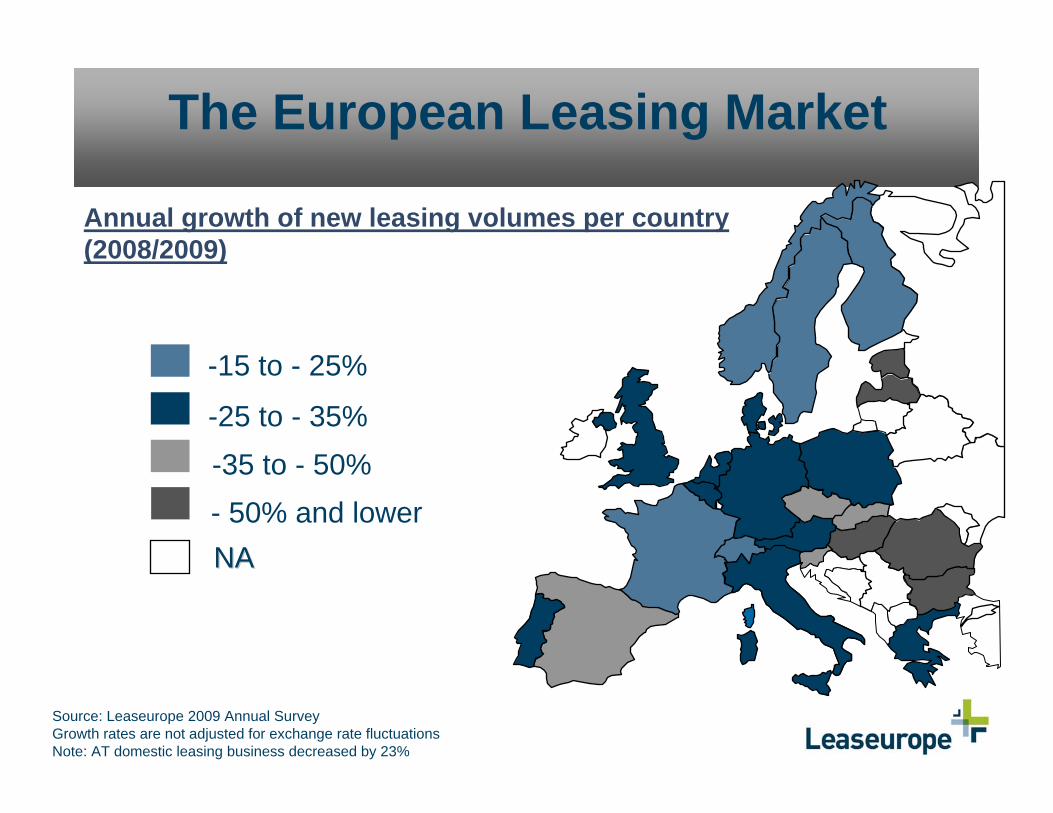
The European Leasing Market
Source: Leaseurope 2009 Annual SurveyGrowth rates are not adjusted for exchange rate fluctuationsNote: AT domestic leasing business decreased by 23%
NANA
-25 to - 35%
-15 to - 25%
- 50% and lower-35 to - 50%
Annual growth of new leasing volumes per country (2008/2009)
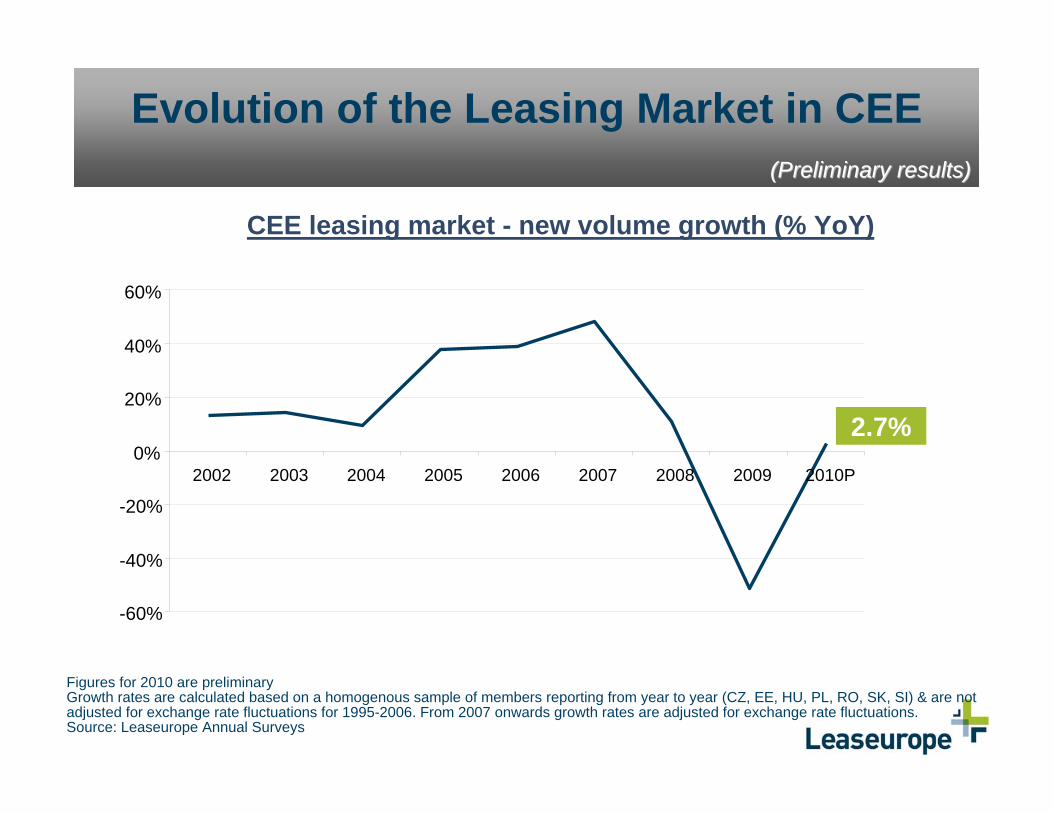
Evolution of the Leasing Market in CEE
CEE leasing market - new volume growth (% YoY)
Figures for 2010 are preliminaryGrowth rates are calculated based on a homogenous sample of members reporting from year to year (CZ, EE, HU, PL, RO, SK, SI) & are not adjusted for exchange rate fluctuations for 1995-2006. From 2007 onwards growth rates are adjusted for exchange rate fluctuations. Source: Leaseurope Annual Surveys
-60%
-40%
-20%
0%
20%
40%
60%
2002 2003 2004 2005 2006 2007 2008 2009 2010P
2.7%
(Preliminary results)(Preliminary results)
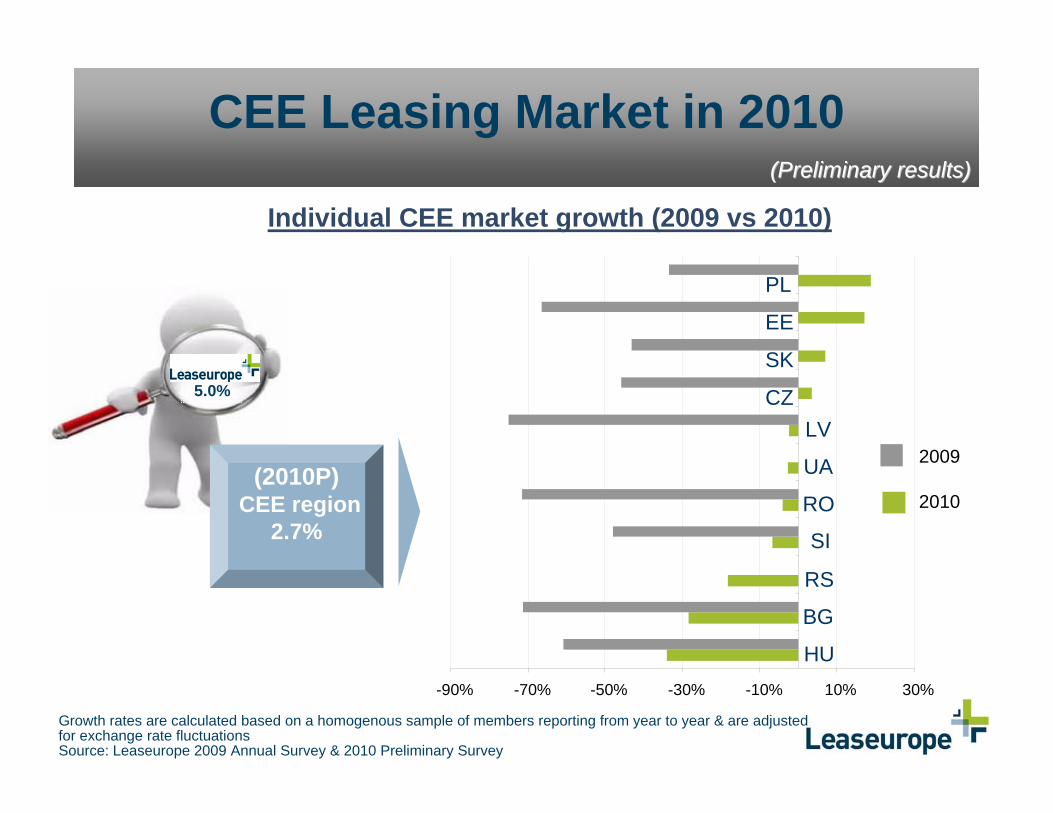
CEE Leasing Market in 2010
Individual CEE market growth (2009 vs 2010)
Growth rates are calculated based on a homogenous sample of members reporting from year to year & are adjusted for exchange rate fluctuationsSource: Leaseurope 2009 Annual Survey & 2010 Preliminary Survey
-90% -70% -50% -30% -10% 10% 30%
HU
BG
RS
SI
RO
UA
LVCZ
SK
EE
PL
2010
2009(2010P)
CEE region2.7%
5.0%
(Preliminary results)(Preliminary results)
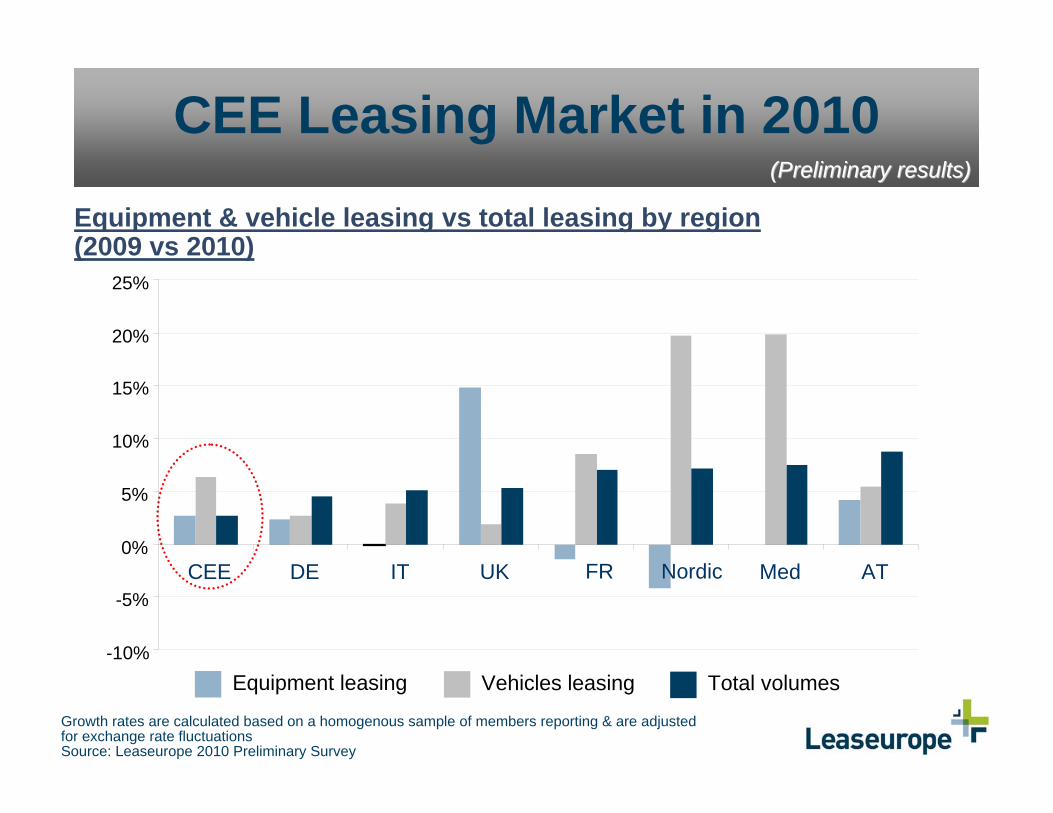
CEE Leasing Market in 2010
Equipment & vehicle leasing vs total leasing by region (2009 vs 2010)
Equipment leasing Total volumesVehicles leasing
Growth rates are calculated based on a homogenous sample of members reporting & are adjusted for exchange rate fluctuationsSource: Leaseurope 2010 Preliminary Survey
-10%
-5%
0%
5%
10%
15%
20%
25%
CEE DE IT UK FR Nordic Med AT
(Preliminary results)(Preliminary results)
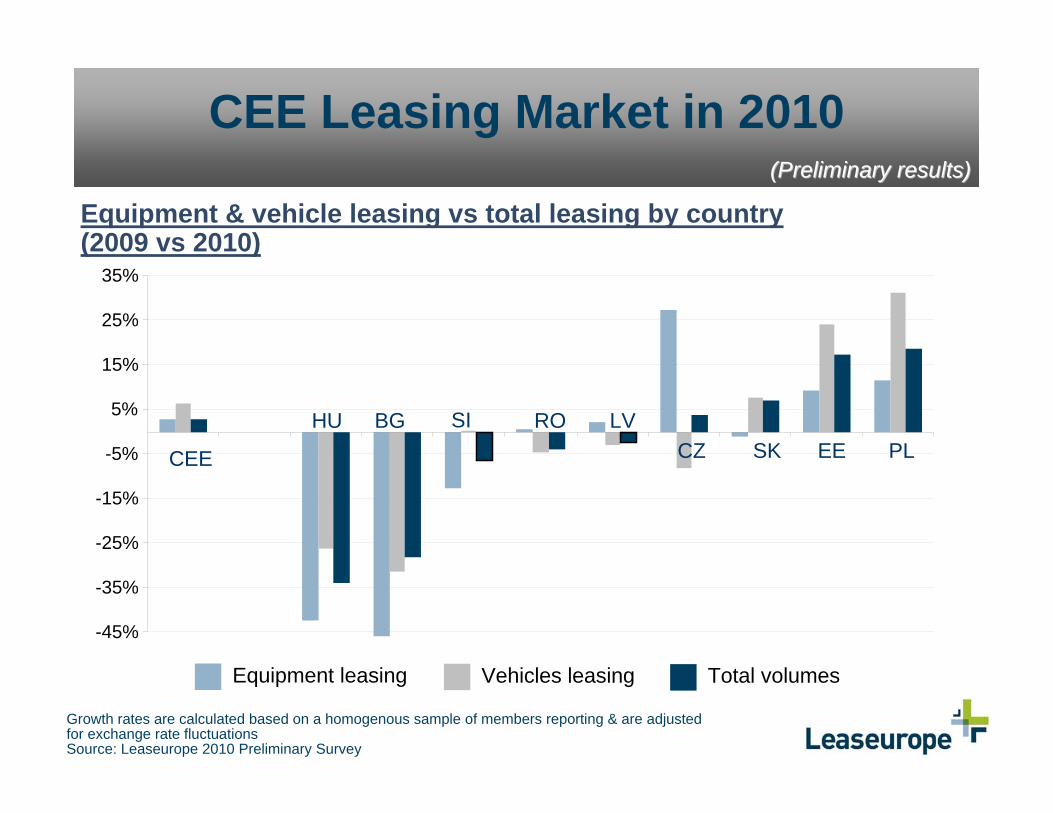
CEE Leasing Market in 2010
Equipment & vehicle leasing vs total leasing by country(2009 vs 2010)
Growth rates are calculated based on a homogenous sample of members reporting & are adjusted for exchange rate fluctuationsSource: Leaseurope 2010 Preliminary Survey
Equipment leasing Total volumesVehicles leasing
-45%
-35%
-25%
-15%
-5%
5%
15%
25%
35%
CEE
HU BG SI RO LVCZ SK EE PL
(Preliminary results)(Preliminary results)
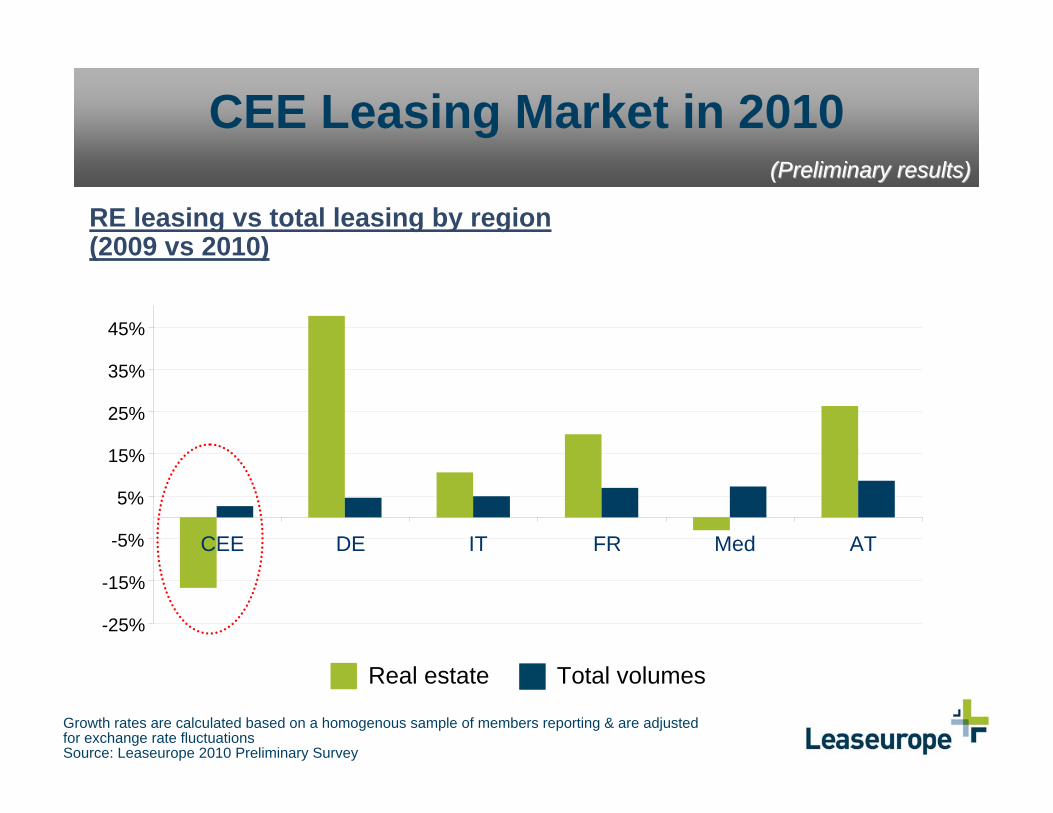
CEE Leasing Market in 2010
RE leasing vs total leasing by region (2009 vs 2010)
Growth rates are calculated based on a homogenous sample of members reporting & are adjusted for exchange rate fluctuationsSource: Leaseurope 2010 Preliminary Survey
Real estate Total volumes
-25%
-15%
-5%
5%
15%
25%
35%
45%
CEE DE IT FR Med AT
(Preliminary results)(Preliminary results)
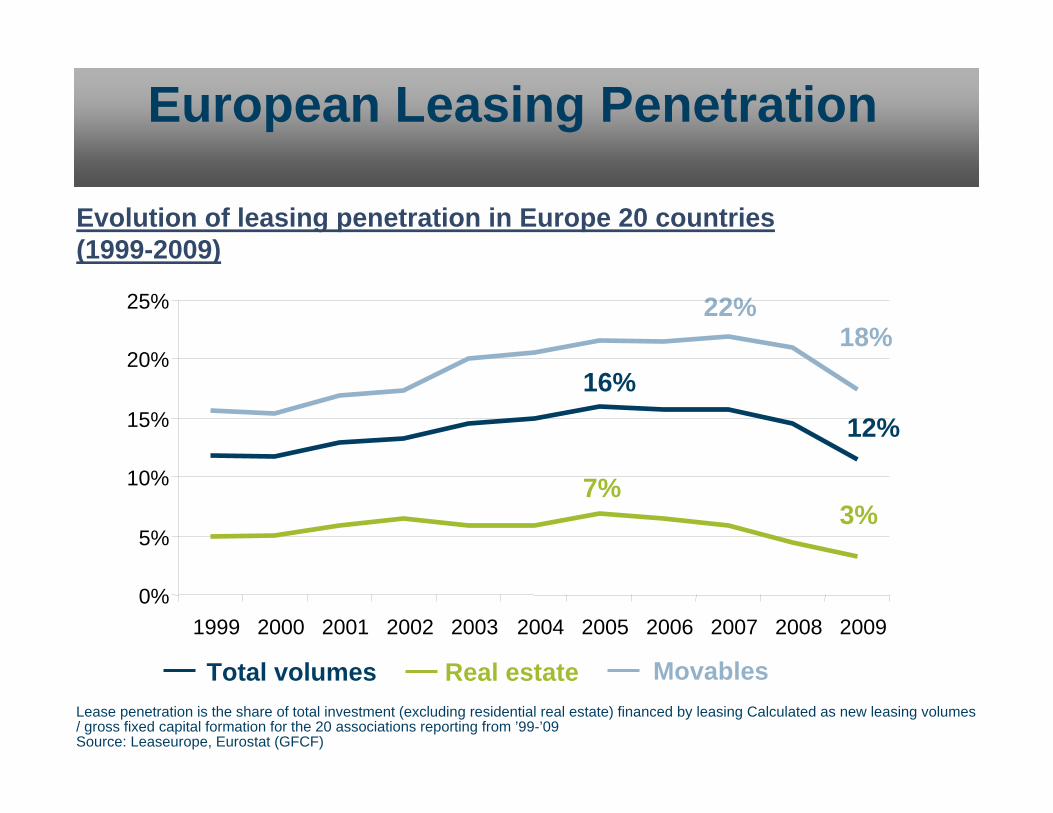
European Leasing Penetration
Total volumes Real estate MovablesLease penetration is the share of total investment (excluding residential real estate) financed by leasing Calculated as new leasing volumes / gross fixed capital formation for the 20 associations reporting from ’99-’09Source: Leaseurope, Eurostat (GFCF)
Evolution of leasing penetration in Europe 20 countries (1999-2009)
16%
7%
22%18%
12%
3%
0%
5%
10%
15%
20%
25%
1999 2000 2001 2002 2003 2004 2005 2006 2007 2008 2009
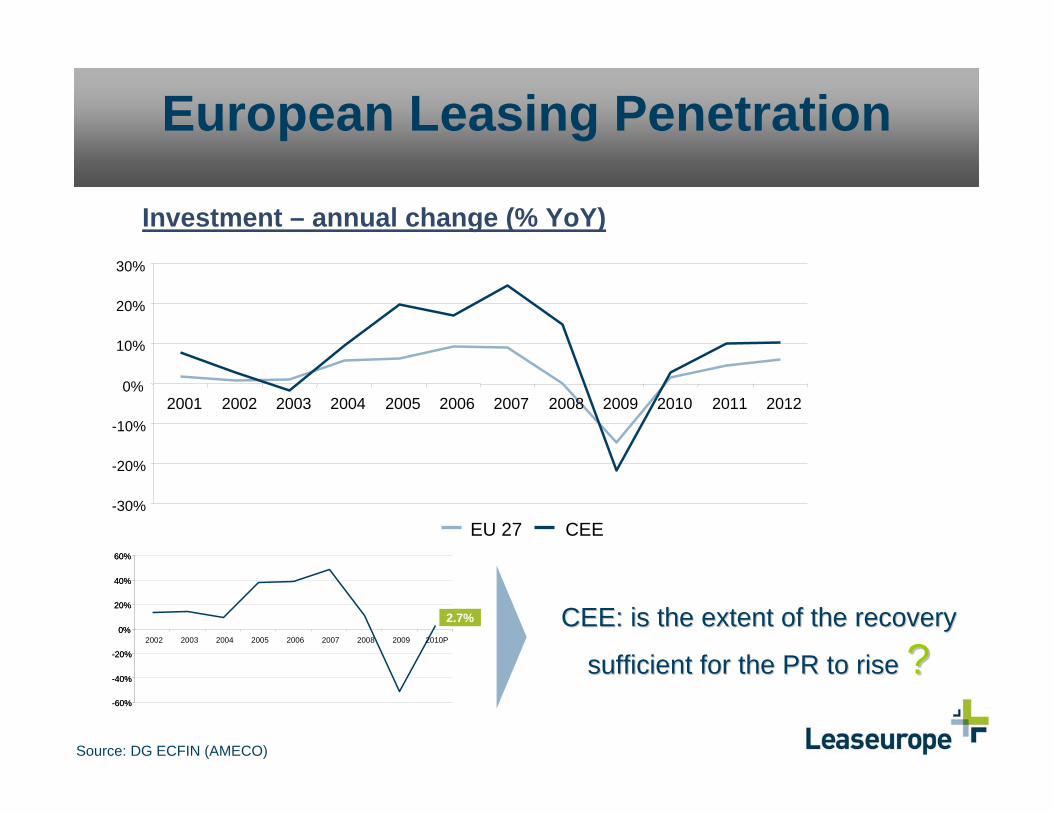
European Leasing Penetration
Source: DG ECFIN (AMECO)
Investment – annual change (% YoY)
-30%
-20%
-10%
0%
10%
20%
30%
2001 2002 2003 2004 2005 2006 2007 2008 2009 2010 2011 2012
EU 27 CEE
CEE: is the extent of the recovery CEE: is the extent of the recovery
sufficient for the PR to rise sufficient for the PR to rise ??-60%
-40%
-20%
0%
20%
40%
60%
2002 2003 2004 2005 2006 2007 2008 2009 2010P
2.7%
-60%
-40%
-20%
0%
20%
40%
60%
2002 2003 2004 2005 2006 2007 2008 2009 2010P
2.7%
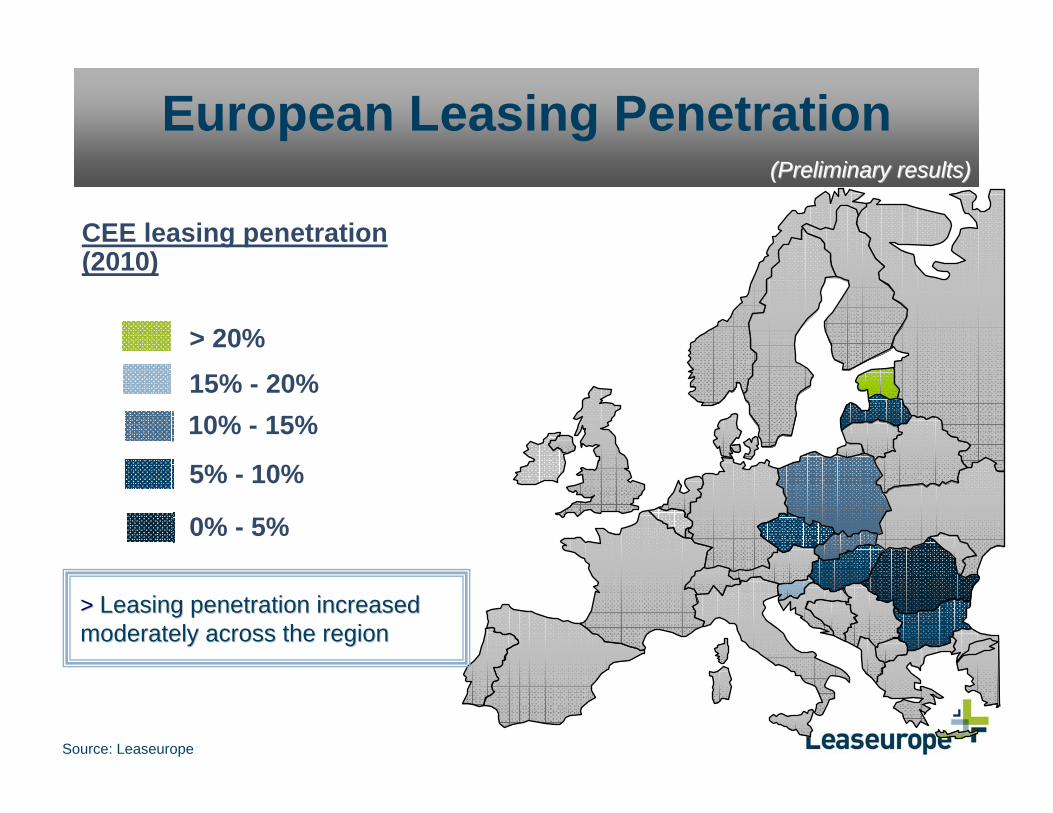
European Leasing Penetration
Source: Leaseurope
CEE leasing penetration (2010)
> > Leasing penetration increased Leasing penetration increased moderately across the regionmoderately across the region
5% - 10%
10% - 15%15% - 20%> 20%
0% - 5%
(Preliminary results)(Preliminary results)
Concluding Remarks
Leasing regained new ground …
…however the situation diverges across different European leasing markets.
The cautious optimism expressed by the European leasing firms last year in Hamburg hasbeen confirmed.
The most important factors which helped to bring us out of the downturn were improved added-value services & higher profitability followed by the increased asset & channel specialisation.
The overall positive trends in the European leasing market and improved prospects for the EU economy suggests that leasing industry will remain an attractive business proposition for its shareholders over the coming years.
2010 in short
Concluding Remarks
Source: Invigors Business Confidence Survey
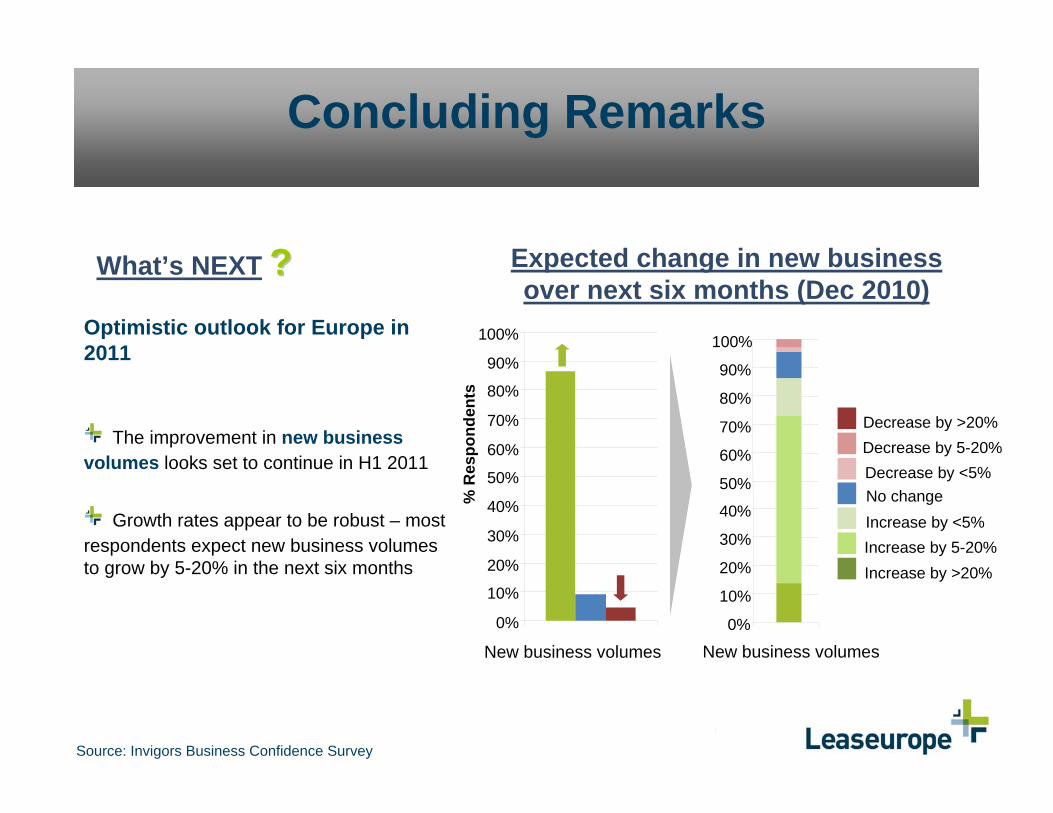
What’s NEXT ?? Expected change in new business over next six months (Dec 2010)
% R
espo
nden
ts
0%
10%
20%
30%
40%
50%
60%
70%
80%
90%
100%
New business volumes
Optimistic outlook for Europe in 2011
The improvement in new business volumes looks set to continue in H1 2011
Growth rates appear to be robust – most respondents expect new business volumes to grow by 5-20% in the next six months
0%
10%
20%
30%
40%
50%
60%
70%
80%
90%
100%
Decrease by >20%Decrease by 5-20%Decrease by <5%No changeIncrease by <5%Increase by 5-20%Increase by >20%
New business volumes
Concluding Remarks
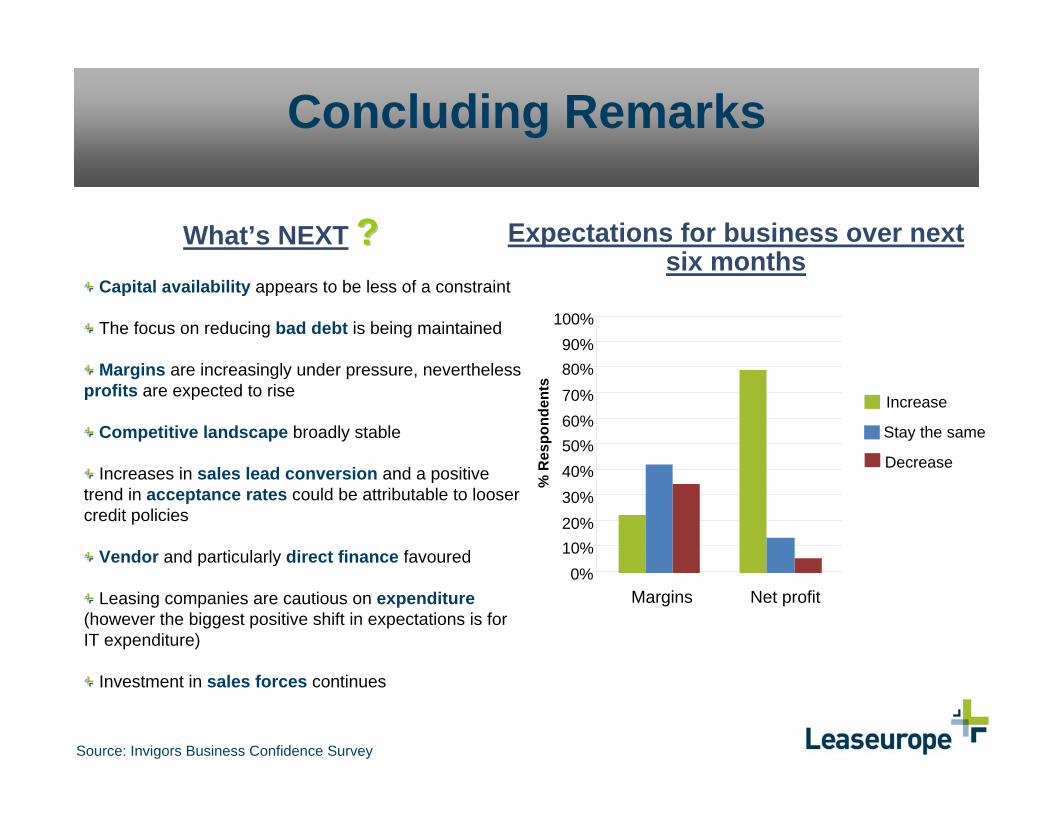
Source: Invigors Business Confidence Survey
Expectations for business over next six months
Capital availability appears to be less of a constraint
The focus on reducing bad debt is being maintained
Margins are increasingly under pressure, nevertheless profits are expected to rise
Competitive landscape broadly stable
Increases in sales lead conversion and a positive trend in acceptance rates could be attributable to looser credit policies
Vendor and particularly direct finance favoured
Leasing companies are cautious on expenditure (however the biggest positive shift in expectations is for IT expenditure)
Investment in sales forces continues
What’s NEXT ??
% R
espo
nden
ts
Stay the same
0%10%20%30%40%50%60%70%80%90%
100%
Margins Net profit
Increase
Decrease
Leaseurope Market Research
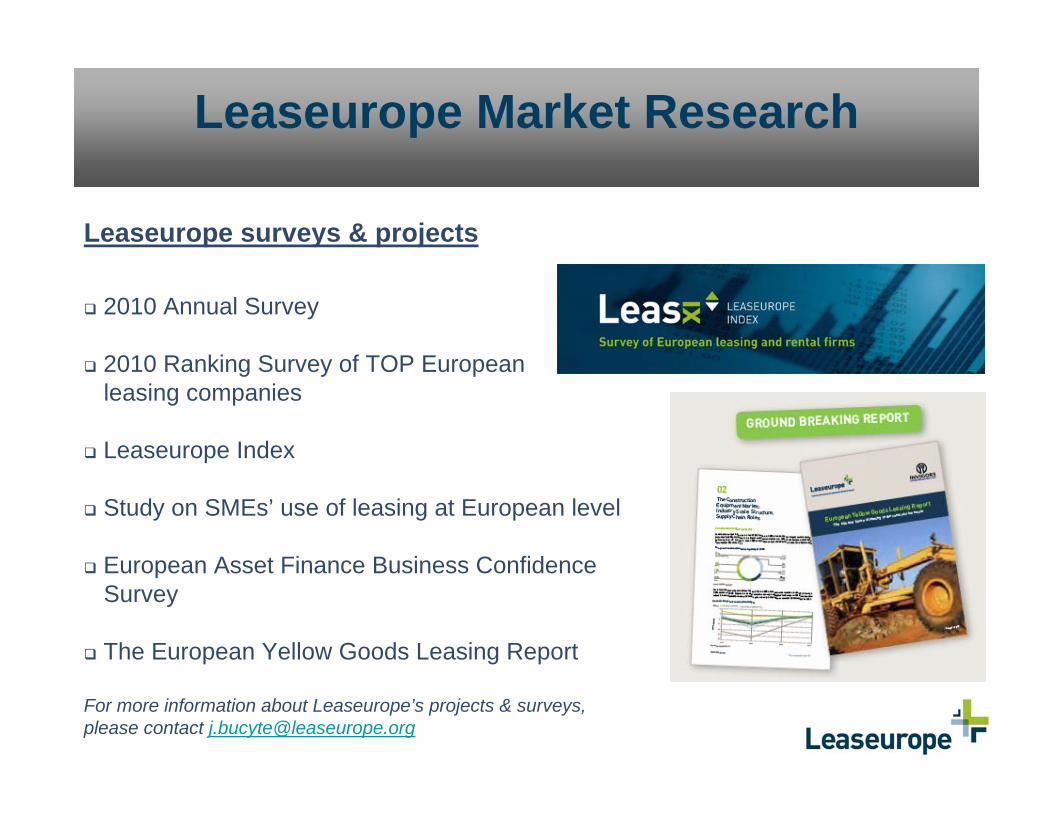
Leaseurope surveys & projects
2010 Annual Survey
2010 Ranking Survey of TOP European leasing companies
Leaseurope Index
Study on SMEs’ use of leasing at European level
European Asset Finance Business Confidence Survey
The European Yellow Goods Leasing Report
For more information about Leaseurope’s projects & surveys, please contact [email protected]

The European LeasingThe European Leasing& Automotive Rental Markets & Automotive Rental Markets ––
State of PlayState of Play
Jurgita BucyteJurgita [email protected]@leaseurope.org
LeaseuropeLeaseurope’’ss 2011 Seminar for2011 Seminar forLessors in Central, Eastern and SouthLessors in Central, Eastern and South--Eastern EuropeEastern Europe
15 April 2011, 15 April 2011, LjubljanaLjubljana