Embed Size (px)
Citation preview

2 Water Finance Fundamentals Examining Traditional Sources of Funding for U.S. Water Infrastructure
(and Their Limitations)
6 Partnerships & Innovative Approaches P3s & Emerging Trends That Significantly Impact Financing and Project Delivery
14 Investing Smart Smart Water Infrastructure & Its Global Market Outlook
22 Financing & Implementing Smart Water Projects Benefits, Challenges & Misconceptions
Table of Contents

Water Finance FundamentalsExamining Traditional Sources of Funding for U.S. Water Infrastructure & The Investment Gap
Water Finance Fundamentals | 3
Municipalities around the globe are pouring money into enhancing the Internet of Things (IoT) across their infrastructure systems. For water and wastewater utilities in the United States, the trend of integrating “smart water” technology to improve operational efficiencies, conserve water and save money is real and evolving rapidly. According to recent industry reports, investment in smart water technology will reach well into the tens of billions in just the next decade. Funding these critical projects will be necessary to help bring utilities into a new era of strategic water management where they are ahead of the game, applying data and analytics to solve water challenges.
But before examining the task of implementing these critical projects, it’s worth examining the broader state of water infrastructure financing in the United States.
Funding critical infrastructure projects, let alone water or wastewater, is already an
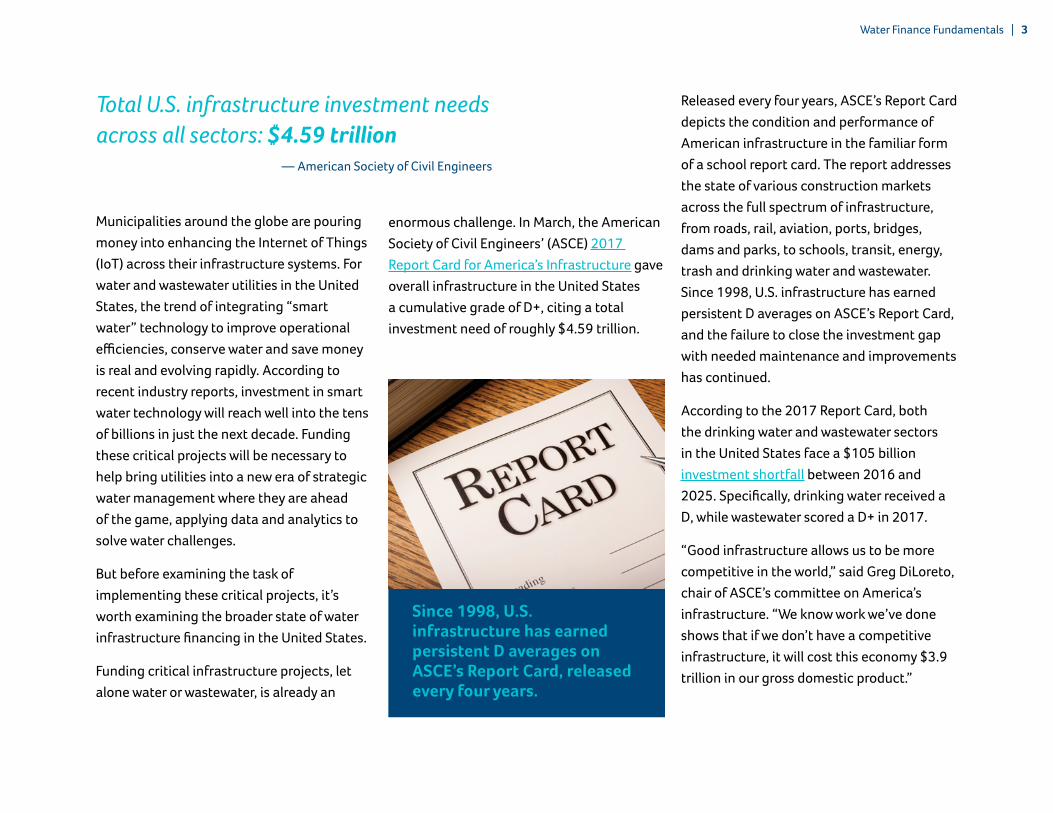
enormous challenge. In March, the American Society of Civil Engineers’ (ASCE) 2017 Report Card for America’s Infrastructure gave overall infrastructure in the United States a cumulative grade of D+, citing a total investment need of roughly $4.59 trillion.
Total U.S. infrastructure investment needs across all sectors: $4.59 trillion
— American Society of Civil Engineers
Released every four years, ASCE’s Report Card depicts the condition and performance of American infrastructure in the familiar form of a school report card. The report addresses the state of various construction markets across the full spectrum of infrastructure, from roads, rail, aviation, ports, bridges, dams and parks, to schools, transit, energy, trash and drinking water and wastewater. Since 1998, U.S. infrastructure has earned persistent D averages on ASCE’s Report Card, and the failure to close the investment gap with needed maintenance and improvements has continued.
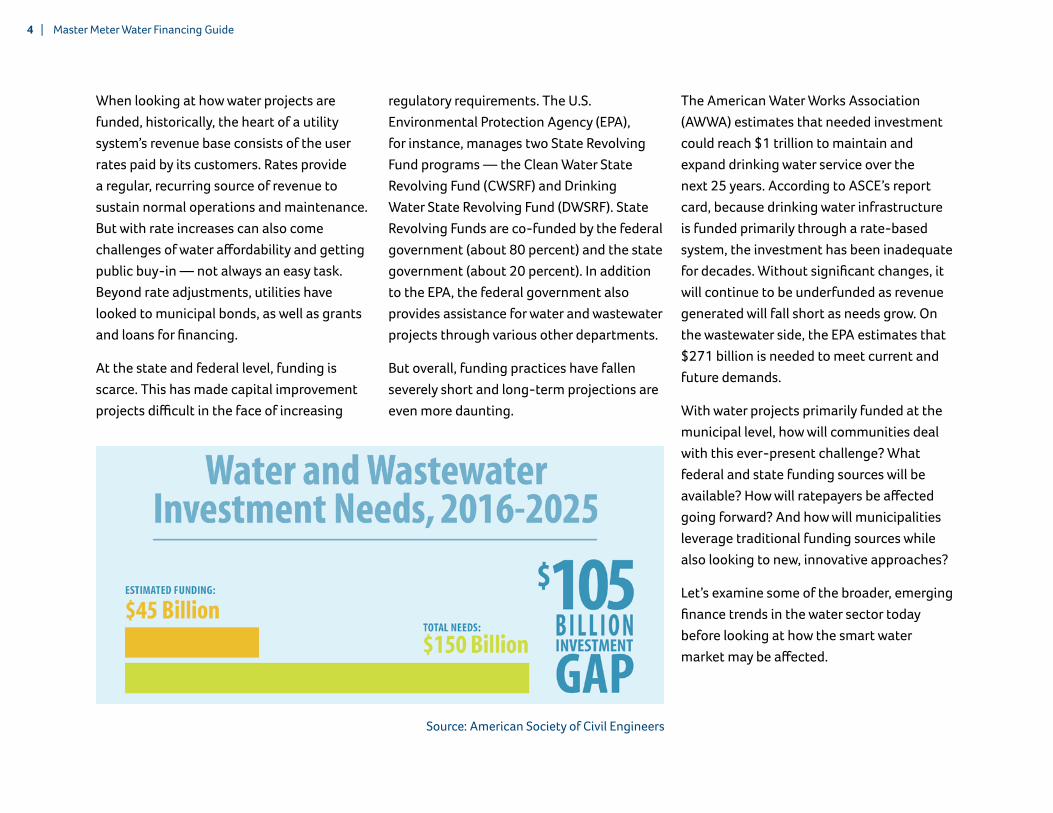
According to the 2017 Report Card, both the drinking water and wastewater sectors in the United States face a $105 billion investment shortfall between 2016 and 2025. Specifically, drinking water received a D, while wastewater scored a D+ in 2017.
“Good infrastructure allows us to be more competitive in the world,” said Greg DiLoreto, chair of ASCE’s committee on America’s infrastructure. “We know work we’ve done shows that if we don’t have a competitive infrastructure, it will cost this economy $3.9 trillion in our gross domestic product.”
Since 1998, U.S. infrastructure has earned persistent D averages on ASCE’s Report Card, released every four years.
When looking at how water projects are funded, historically, the heart of a utility system’s revenue base consists of the user rates paid by its customers. Rates provide a regular, recurring source of revenue to sustain normal operations and maintenance. But with rate increases can also come challenges of water affordability and getting public buy-in — not always an easy task. Beyond rate adjustments, utilities have looked to municipal bonds, as well as grants and loans for financing.
At the state and federal level, funding is scarce. This has made capital improvement projects difficult in the face of increasing
regulatory requirements. The U.S. Environmental Protection Agency (EPA), for instance, manages two State Revolving Fund programs — the Clean Water State Revolving Fund (CWSRF) and Drinking Water State Revolving Fund (DWSRF). State Revolving Funds are co-funded by the federal government (about 80 percent) and the state government (about 20 percent). In addition to the EPA, the federal government also provides assistance for water and wastewater projects through various other departments.
But overall, funding practices have fallen severely short and long-term projections are even more daunting.
4 | Master Meter Water Financing Guide
The American Water Works Association (AWWA) estimates that needed investment could reach $1 trillion to maintain and expand drinking water service over the next 25 years. According to ASCE’s report card, because drinking water infrastructure is funded primarily through a rate-based system, the investment has been inadequate for decades. Without significant changes, it will continue to be underfunded as revenue generated will fall short as needs grow. On the wastewater side, the EPA estimates that $271 billion is needed to meet current and future demands.
With water projects primarily funded at the municipal level, how will communities deal with this ever-present challenge? What federal and state funding sources will be available? How will ratepayers be affected going forward? And how will municipalities leverage traditional funding sources while also looking to new, innovative approaches?
Let’s examine some of the broader, emerging finance trends in the water sector today before looking at how the smart water market may be affected.
Source: American Society of Civil Engineers
Water Finance Fundamentals | 5
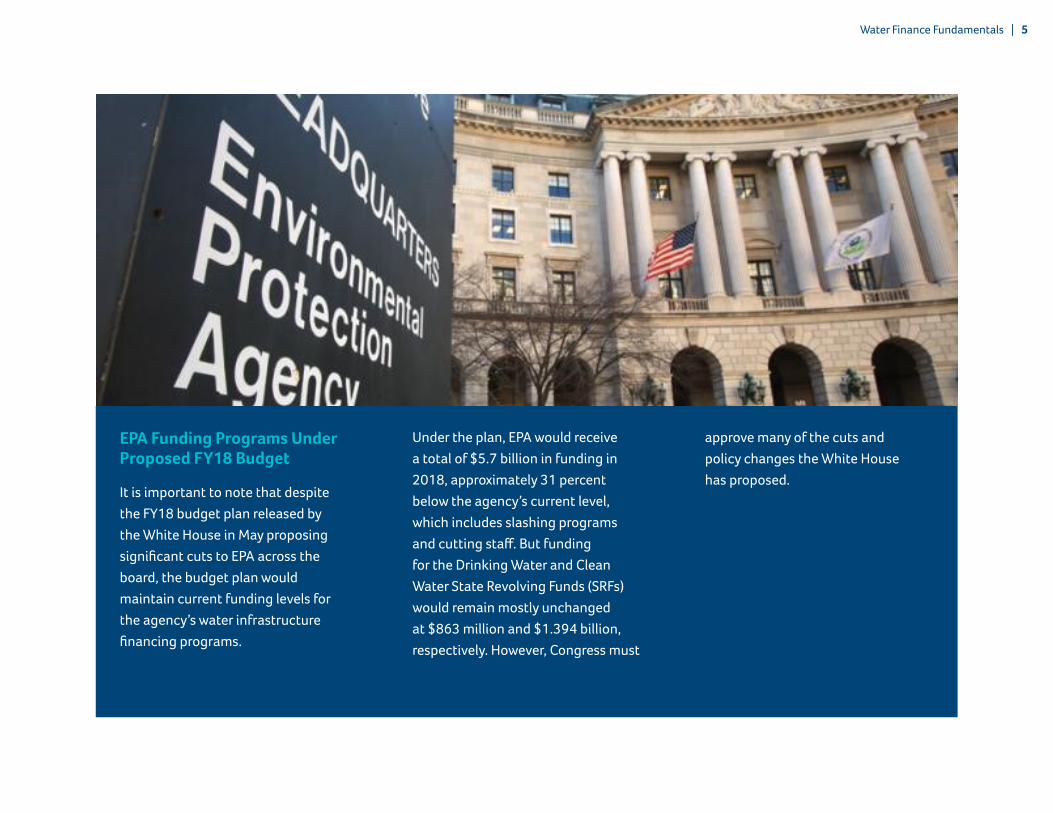
EPA Funding Programs Under Proposed FY18 Budget
It is important to note that despite the FY18 budget plan released by the White House in May proposing significant cuts to EPA across the board, the budget plan would maintain current funding levels for the agency’s water infrastructure financing programs.
Under the plan, EPA would receive a total of $5.7 billion in funding in 2018, approximately 31 percent below the agency’s current level, which includes slashing programs and cutting staff. But funding for the Drinking Water and Clean Water State Revolving Funds (SRFs) would remain mostly unchanged at $863 million and $1.394 billion, respectively. However, Congress must
approve many of the cuts and policy changes the White House has proposed.
Partnerships & Innovative ApproachesP3s & Emerging Trends That Significantly Impact Financing and Project Delivery
In a recent column for Water Finance & Management, Cindy Wallis-Lage, president of Black & Veatch’s global water business, writes that two of the most notable emerging innovations in the water sector that impact financing and program and project delivery, are the growing use of public-private partnerships (P3s) and performance contracting. Let’s take a look at how these, along with some other innovative approaches, are impacting broader funding practices for water infrastructure.
P3sPublic-private partnerships are nothing new. But projections suggest the global P3 market for water is growing. Private water companies have a history of providing water service to homes and businesses for more than 100 years. According to Michael Deane, executive director of the National Association of Water Companies (NAWC), private water companies have a well-documented history of doing things right when it comes to water quality and water service.
According to NAWC, private water companies deliver water services to more than 73 million people each day. The five largest private water companies in the United States invest $2 billion annually to improve community tap water systems across the country.
Through P3s, private water companies also have a solid resume of delivering strategic
solutions to the water challenges facing municipalities. More than 2,000 water and wastewater facilities across the country depend on P3s. P3s can provide ready access to capital, expertise, technology and operational acumen. Perhaps the best evidence of P3s solving municipal water challenges comes from the cities and towns that rely on them.
According to Public Works Financing’s 20th annual Water Outsourcing Report from 2016, nine out of 10 municipalities renew their contracts with private partners. Additionally, P3s have been shown to lower operating costs by 24 percent on average. According to an Oct. 13, 2014, Standard & Poor’s Capital IQ report, “… the number of infrastructure P3s in the U.S. increased in 2013” and “in the U.S., interest in the P3 approach is growing, and several states are developing programs.”
Total investment in the global water P3 market is expected to surpass $58 billion by 2020.
— Bluefield Research
Partnerships & Innovative Approaches | 7

Huge Market Growth ProjectionsAccording to a recent report from water market analyst Bluefield Research, the market for P3 water projects was set to nearly triple between 2016 and 2020. In that timeframe, total investment is expected to surpass $58 billion (USD), of which 80 percent will target new seawater desalination and wastewater treatment plants.
According to the report, many countries across the globe are facing a perfect storm of financing constraints and water infrastructure shortfalls. Dramatic declines in oil and commodity prices, low water tariffs, groundwater overdrafts and untreated wastewater discharges are prompting governments to tap the private sector through public-private partnership programs.
The report also states that the global adoption of the water P3 model will come to the forefront over the next five years through a combination of continued growth in
markets where the model is well-established (China, Brazil), resurgence in markets that have stalled (Indonesia, Philippines, Mexico, Egypt), and new markets opening up (Persian Gulf countries, Vietnam, Peru and the United States).
“Particularly in emerging markets, led by China, municipalities are hard pressed to match the financial capacity and operational expertise that the private sector can provide,” says Phuong Pham, senior analyst at Bluefield Research. “National governments aim to de-risk their water sectors for private investment with new PPP laws and more attractive contract tenders, while preserving long-term control over assets.”
An increasingly diverse group of private and semi-private firms are responding to new tender opportunities for P3 contracts. Bluefield’s analysis of the portfolio strategies of the 50 largest global water players indicated that the water P3 market is in transition, with a cast of new players emerging.
The global P3 market is led by integrated water players Veolia and Suez who have sustained their positions in recent years, followed by semi-private local utilities (SABESP, COPASA), rapidly scaling Chinese players (BEWG, China Everbright), emerging utility concessionaires (Manila Water, AEGEA) and integrated water players (Aqualia).
“Many players turned their backs on PPP opportunities during the recent recession because of their capital intensity, while they deleveraged and reviewed their value chain positions overall,” says Keith Hays, vice president of Bluefield Research. “This market shakeout has left a field of players with clearer strategies to navigate continued macroeconomic uncertainty and address new opportunities.”
8 | Master Meter Water Financing Guide
The Motive Is FundingMany challenges exist for publicly-owned water utilities. The enormity of these challenges can be daunting for many water utilities with budgets already stretched to just repair systems when they fail, much less updating the water systems.
The EPA projects it will take $384 billion of investment in drinking water infrastructure over the next two decades to keep the nation’s most precious natural resource flowing safely and reliably out of the tap. While there’s no dispute about the need to address the country’s failing water infrastructure, the question remains as to how quickly improvements can be made.
Some municipalities’ water department budgets attract only a fraction of the investment needed for proper maintenance and replacement of aging water infrastructure. P3s can help reduce
costs, shift debt burdens and manage risk. With P3s, private water companies and local governments can share the financial requirements for a time, while ownership of the system remains with the public sector and decreases costs for the community.
Milwaukee, Wisconsin
For example, Veolia North America partnered with the Milwaukee Metropolitan Sewerage District (MMSD) to provide new asset management practices, serve as a technical and operational provider and manage its environmental compliance all while generating potential cost savings. On June 29, 2016, the MMSD announced an extension of their agreement with Veolia North America to continue managing and operating its collection and wastewater treatment system under a 10-year, $500 million contract.
Since March 2008, Veolia has managed the MMSD facilities, cleaning billions of gallons of wastewater every year at two water reclamation facilities that serve 1.1 million people in 28 communities. Milwaukee is home to Veolia’s largest project in North America, employing approximately 250 people.
Bayonne, New Jersey
The Bayonne Municipal Utilities Authority (BMUA) in New Jersey signed a 40-year concession agreement with SUEZ North America and investment firm KKR for its water and wastewater systems. In this concession agreement, the BMUA retains ownership of assets and responsibility for setting rates, while the private entity operates the system, invests $107 million and retires $130 million of debt for the community.
Partnerships & Innovative Approaches | 9
P3s can help reduce costs, shift debt burdens and manage risk.
Fillmore, California
When the Los Angeles Regional Water Quality Control Board implemented stricter regulations to improve the quality of treated wastewater discharges to the Santa Clara River, the City of Fillmore, Calif., had a decision to make. Its wastewater treatment plant, built in 1955, needed significant upgrades to comply with increased standards and meet the demands of a growing population. The city took the initiative to develop a new, state-of-the-art water recycling facility that eliminates river discharges and enables a full-scale water reuse system to benefit the community. The city chose to contract with American Water in a P3 to design, build and operate a facility to produce high-quality disinfected water to meet the stringent standards required for surface and sub-surface irrigation of public and private facilities.
Today, the Fillmore plant produces up to 1 million gallons per day (MGD) of water that meets the standards for unrestricted reuse irrigation purposes, operates an irrigation system providing 200,000 gallons per day to two public schools, the new Two Rivers
Park and other green areas in Fillmore. Additionally, the current 200,000 gallons per day used for irrigation has reduced the use of potable water sufficiently to allow the city to postpone drilling a new well thereby preserving its limited supply of high-quality potable water.
P3s can certainly provide communities with a broad base of expertise and new technologies. Private water companies offer a vast national network of experienced utility management professionals with extensive knowledge in solving water infrastructure challenges. Many also invest heavily every year in research and development to advance water service innovation. New innovations in water reuse, desalination and leak detection, to name a few, are helping solve water supply challenges across the country.
The water challenges facing the country’s water systems require a strategic solution and P3s can be part of that strategic solution.
10 | Master Meter Water Financing Guide
WIFIAThe Environmental Protection Agency (EPA) has made approximately $1 billion in credit assistance for water infrastructure projects available under its Water Infrastructure Finance and Innovation Act (WIFIA) program.
The WIFIA program provides long-term, low-cost credit assistance in the form of direct loans and loan guarantees to creditworthy water projects. WIFIA provides another option for financing large infrastructure projects — generally at least $20 million — in addition to the State Revolving Funds and municipal bond market. WIFIA is available to state, local and tribal governments; private entities; partnerships; and State Revolving Fund programs.
EPA estimates that funds appropriated to the WIFIA program can be leveraged at a ratio greater than 50 to one, which means the $17 million program budget could allow EPA to make approximately $1 billion in loans and stimulate about $2 billion in total infrastructure investment.
The American Water Works Association is the chief architect of the WIFIA program. Modeled after the successful Transportation Infrastructure Finance and Innovation Act, WIFIA leverages federal dollars so that for every dollar Congress appropriates, $50 to $60 are expected to be loaned out. Some of the projects that WIFIA enables EPA to provide assistance for include:
» Drinking water treatment and distribution projects;
» Wastewater conveyance and treatment projects;
» Enhanced energy efficiency projects at drinking water and wastewater facilities;
» Desalination, aquifer recharge, alternative water supply and water recycling projects; and
» Drought prevention, reduction or mitigation projects.
EPA will evaluate projects using criteria such as the extent to which the project is nationally or regionally significant, helps maintain or protect public health or the environment, protects against extreme weather and serves regions with significant water resource challenges. EPA will make selections on a competitive basis.
“As a federal-local-private partnership, this program will help expand water infrastructure systems to meet the needs of growing communities,” EPA Administrator Scott Pruitt said recently, discussing the initial popularity of WIFIA loans. “This investment will empower states, municipalities, companies, and public-private partnerships to solve real environmental problems in our communities, like the need for clean and safe water.”
Partnerships & Innovative Approaches | 11
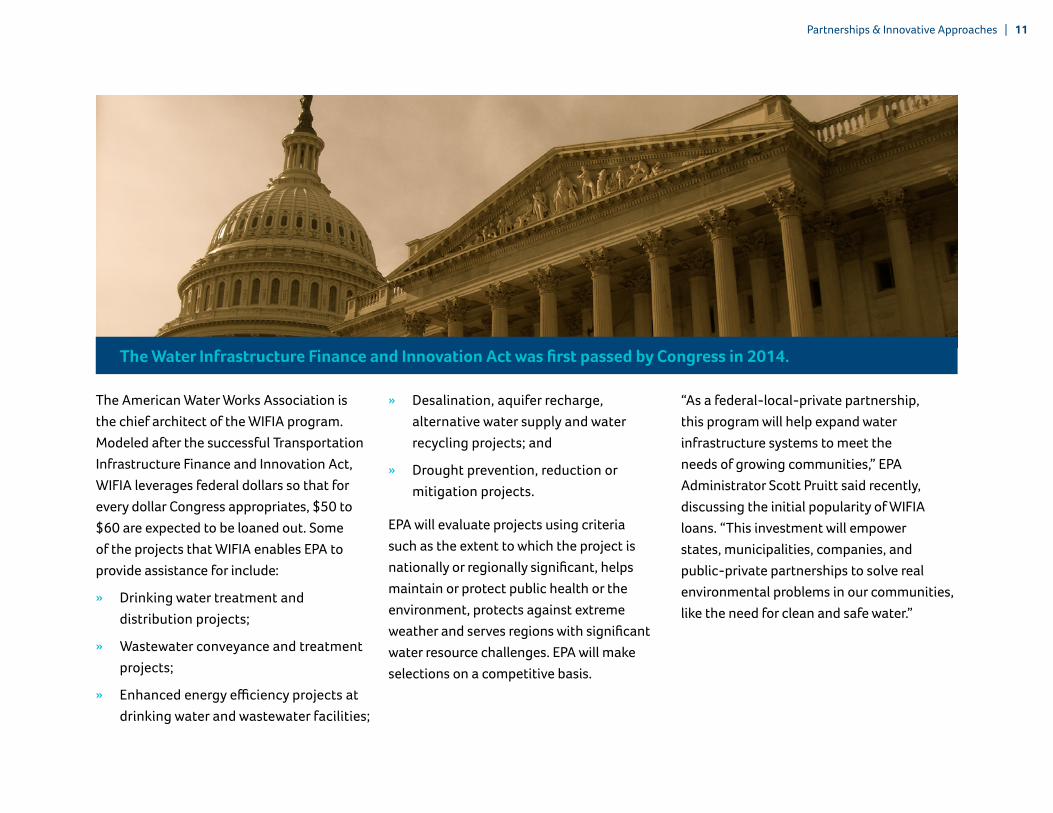
The Water Infrastructure Finance and Innovation Act was first passed by Congress in 2014.
Recent Developments
The EPA solicited letters of interest for 2017 WIFIA loans beginning in January 2017. As of May, more than 40 entities had expressed interest in the loans.
The $1.017 trillion omnibus appropriations bill signed in May finalized federal agency budgets for the remainder of the 2017 fiscal year. The bill also included an additional $10 million for the WIFIA program, $2 million of which will support EPA administrative activities and $8 million that will be leveraged to subsidize water infrastructure loans.
Combined with the $20 million that Congress initially set aside for WIFIA in an earlier FY17 spending measure ($17 million of which was required to subsidize loans and $3 million that supported administrative activities), WIFIA’s total FY17 appropriation will come to $30 million.
In a report issued in early May, Fitch Ratings, a global leader in credit ratings and research, observed that “WIFIA may play an important role accelerating investment fostering capital access for small municipalities and
encouraging the best solutions (public, private or both) to the country’s water infrastructure challenges.”
“WIFIA-funded projects can potentially reduce the magnitude of increased costs to end users and temper the need to obtain rate increases related to capital,” says Fitch Ratings Director Stacey Mawson. “WIFIA can also spur partnerships between the public and private sectors, creating a forum for eliciting innovative proposals and problem solving.”
According to Fitch, more infrastructure spending brought on by WIFIA means loans will be available at more appealing terms than the financial market, which can help support an investment grade rating on a project that would otherwise be non-investment grade. WIFIA has the potential to fund larger projects for which State Revolving Fund (SRF) loans are hard to procure, and for projects at smaller municipal utilities that may not have market access.
SWIFT Program An example of an innovative funding approach at the state level worth noting is with the SWIFT program in Texas. The State Water Implementation Fund for Texas (SWIFT) program was established by the Texas Legislature and voters in 2013 to fund projects in the state water plan. SWIFT was created through the transfer of a one-time, $2 billion appropriation from the state’s Rainy Day Fund. The $2 billion will be leveraged with revenue bonds over the next 50 years to finance approximately $27 billion in water supply projects.
Energy Efficiency = Cost SavingsEnergy Savings Performance Contracting (ESPC, or performance contracting) is generally understood as a delivery approach to improve operating efficiency and address capital needs while minimizing financial impact to the utility. But it also delivers flexibility for those who understand it. Although it isn’t a panacea, an Energy Savings Performance Contract that is properly applied can be a powerful way to address the issues facing the modern utility.
12 | Master Meter Water Financing Guide
ESPC Components
An ESPC is an agreement with an energy service company (ESCO) for the scope development, design and construction of system and infrastructure improvements that will result in annual energy and operational cost savings sufficient to cover the cost of the project.
According to Johnson Controls, performance contracting provides a number of advantages that are important elements of a successful energy and climate policy. This programmatic approach to building retrofits and water utility upgrades results in energy reductions and lower long-term operating costs.
Performance contracting is a turnkey service, sometimes compared to progressive design-build delivery, with the addition of a long-term project savings guarantee. The phases of a typical ESPC project are as follows.
» The utility and the ESCO enter into an agreement to execute an Investment Grade Audit. At the outset of this phase of work, staff members of both organizations meet and the ESCO personnel tour the facilities, gather data, and develop a list of potential upgrades. They work with utility staff to refine the list and develop preliminary estimates of construction cost and operational savings. This is usually an iterative process and can take significant time and effort.
» Once the utility and the ESCO agree on a set of upgrades that are technically feasible and meet the utility’s financial requirements, the ESCO performs preliminary engineering and cost estimating to develop a guaranteed maximum price, then completes the Investment Grade Audit. The audit consists of four major deliverables: the preliminary
design, the guaranteed maximum price, the savings that the ESCO guarantees the utility will achieve after executing the upgrades, and a plan for measurement and verification of the savings annually for the duration of the contract.
» If the utility elects to move forward with the work and signs the ESPC, the ESCO completes the design, purchases the equipment, and constructs the upgrades. At that point, the utility pays the ESCO the guaranteed maximum price for the construction. A utility that elects not to sign the contract pays the ESCO a pre-negotiated fee to compensate the ESCO for the work completed, and the two part ways.
» Once the upgrades are complete, the project enters the measurement-and- verification phase of the work. In this phase, which can extend as long as 20 years, the ESCO annually assesses the performance of the upgrades and, following a pre-approved methodology, calculates the actual savings achieved each year. If the actual savings exceed the guaranteed savings, the utility pockets 100 percent of the savings. If the actual savings fall short of the guaranteed savings, the ESCO must make up the difference to the utility.
Partnerships & Innovative Approaches | 13
Performance contracting provides a number of advantages that are important elements of a successful energy and climate policy. This programmatic approach to building retrofits and water utility upgrades results in energy reductions and lower long-term operating costs.
— Johnson Controls
Investing SmartSmart Water Infrastructure & Its Global Market Outlook
Smart water infrastructure has quickly become an important urban infrastructure solution in both the United States and around the world. This is because cities and countries are struggling to handle a growing number of water management challenges compounded by aging infrastructure, water loss, water scarcity, population growth and more.
The implementation of smart water technologies can significantly impact a water utility’s asset management practices. Automated meter reading (AMR) or advanced metering infrastructure (AMI) systems, for example, can not only improve meter data management, but can also allow a utility to apply data to improve areas like pressure management and leak detection. Other software systems such as SCADA, GIS, CMMS and hydraulic models are also helping deliver accurate
data about a system’s operating condition while providing real-time, actionable information on which utility managers can base decision making. In essence, smart water systems are all about letting the technology do the work.
All signs indicate that the water infrastructure challenges of today will only continue to grow more severe. Likewise, all signs point to a massive increase in smart water technology investment over the next eight to 10 years.
According to a recent report from Bluefield Research, the global water industry will spend more than $20 billion on software, data and analytics solutions over the next decade. The report, “U.S. Smart Water: Defining the Opportunity, Competitive Landscape and Market Outlook,” indicates that the trend will position technology
providers to deploy state-of-the-art solutions to enable more advanced levels of system intelligence, real-time network visibility, energy efficiency and customer service.
“Historically, utilities have been hobbled by their inability to generate actionable insights from disparate network and water usage data, but this is changing with more advanced data management and cloud-based solutions,” says Will Maize, senior analyst at Bluefield Research. “Early adopting utilities, including American Water and East Bay Municipal Water District, are leading the shift towards smart water technology adoption.”
“Smart water infrastructure has the potential to save $27.5 billion per year, globally. This is a conservative estimate and potential savings could be much higher.”
— Northeast Group LLC
Investing Smart | 15
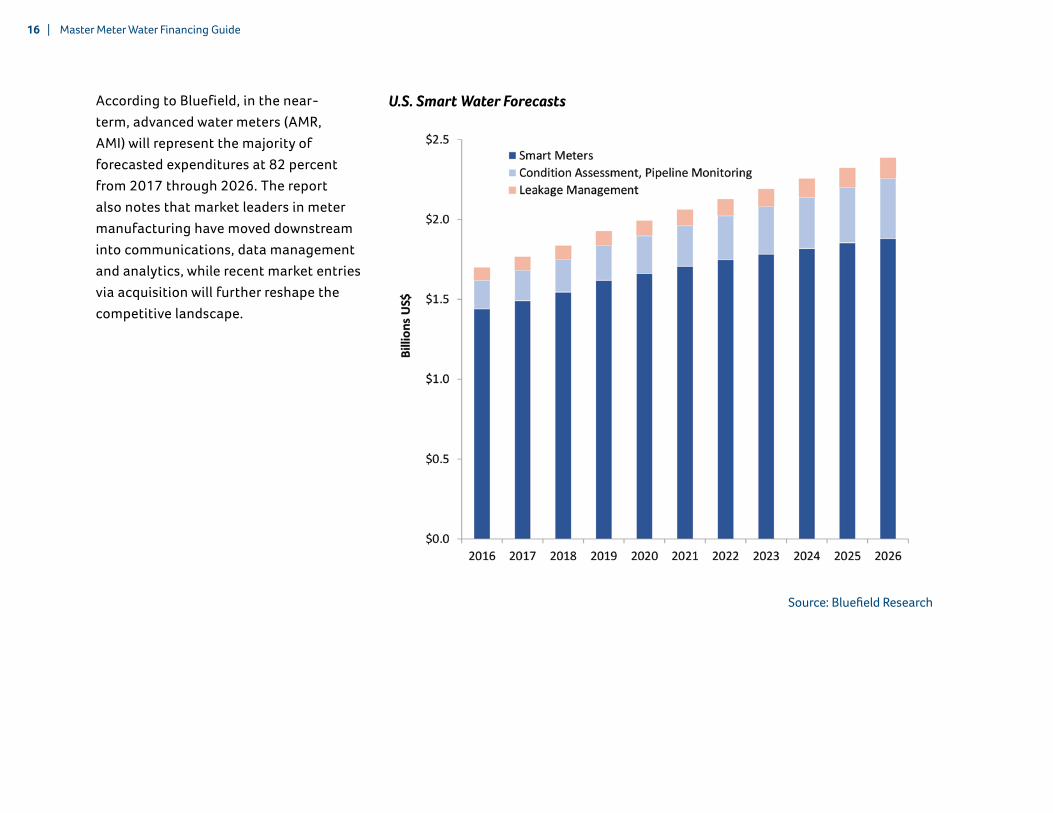
According to Bluefield, in the near-term, advanced water meters (AMR, AMI) will represent the majority of forecasted expenditures at 82 percent from 2017 through 2026. The report also notes that market leaders in meter manufacturing have moved downstream into communications, data management and analytics, while recent market entries via acquisition will further reshape the competitive landscape.
U.S. Smart Water Forecasts
16 | Master Meter Water Financing Guide
Source: Bluefield Research
“While smart meters garnered the most attention, asset intelligence and visibility into real-time network conditions offer significant benefits,” says Maize. “Water companies can now go from being reactive to proactive.”
Seizing on this burgeoning demand for solutions is an outside group of venture-backed start-ups seeking to leverage their data expertise, much of which draws from other industry applications. These data and analytics companies are looking to integrate disparate sources of data to optimize networks, track water quality, and generate insights for asset performance management. Their primary challenge, however, will be overcoming a credibility gap with demonstrated pilot projects and buy-in from municipal utilities. A select group of companies from more mature smart water markets, Europe and Israel, are also beginning to make headway in the U.S. market, says Bluefield.
Even Bigger ProjectionsWhile the Bluefield report presents some fascinating evidence of the smart water trend, it’s final figures differ slightly from a report issued by Northeast Group LLC in late 2015. Between 2015 and 2025, the world will invest $35.9 billion in smart water infrastructure, according the study published the Washington, D.C.-based smart infrastructure market intelligence firm.
“Increasing water scarcity and poor distribution infrastructure are major challenges for water utilities across the globe,” according to Ben Gardner, president of Northeast Group. “Smart water infrastructure has the potential to save $27.5 billion per year globally. This is a conservative estimate and potential savings could be much higher.”
The study, “Global Smart Water Infrastructure: Market Forecast (2015-2025),” notes that water is a commodity that is underpriced in many parts of the world. Northeast Group calculated a “full cost of water” for various countries based on water scarcity, capital costs and electricity costs to pump water. Few utilities directly account for the scarcity costs of water, which can be very significant. The study included case studies from diverse geographies (California, Australia, Israel and Sao Paulo, Brazil) that demonstrated the costs of water scarcity challenges. In most of these cases, smart water infrastructure was more cost effective compared with alternative solutions. Northeast Group found that about half of the world’s countries fail to achieve cost recovery through their water tariffs, depriving utilities of much needed funds for infrastructure investment.
Investing Smart | 17
Confronting Global ChallengesEven as countries scramble to build water treatment and desalination plants and impose consumption restrictions, countries globally are still on average losing 28 percent of their water due to real and apparent losses, such as leakage, theft or inaccurate metering. This non-revenue water (NRW) creates additional needs for costly treatment
plants, increases the demand for energy from pumping stations and puts added stress on already strained infrastructure, communities and environments. Meanwhile, lost revenue from this water only increases the need for government subsidies, which already are necessary to cover a significant portion of the costs of water in many countries.
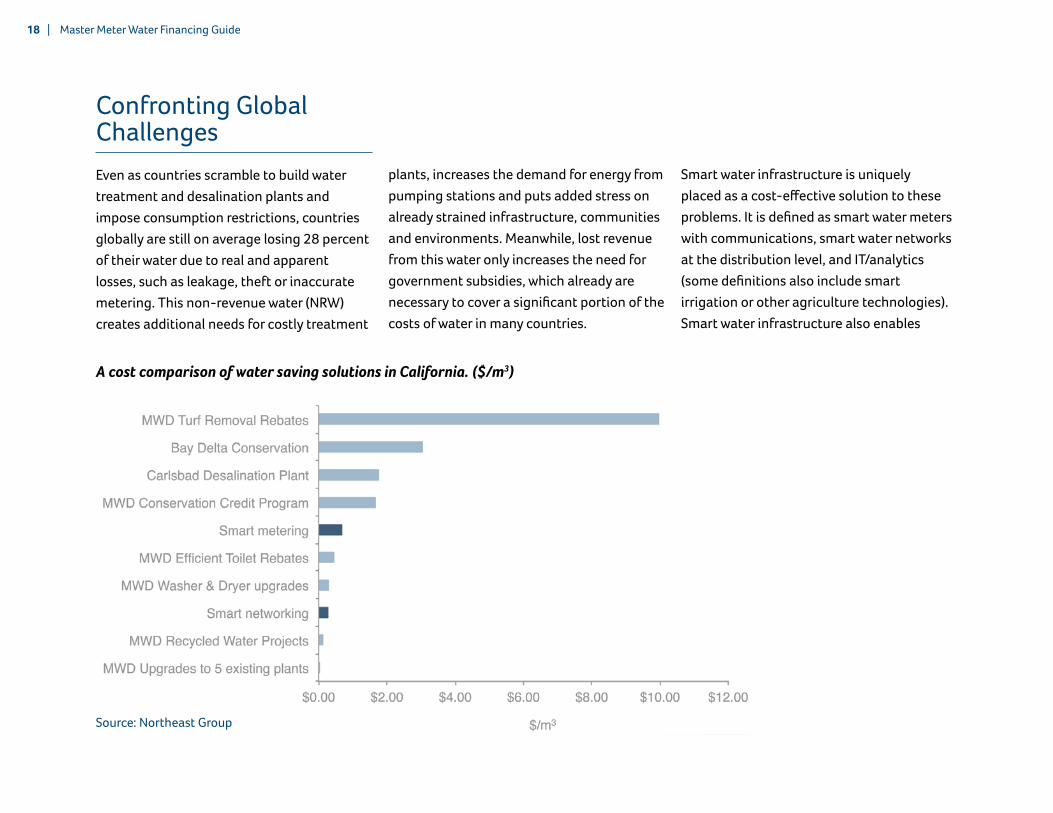
A cost comparison of water saving solutions in California. ($/m3)
Smart water infrastructure is uniquely placed as a cost-effective solution to these problems. It is defined as smart water meters with communications, smart water networks at the distribution level, and IT/analytics (some definitions also include smart irrigation or other agriculture technologies). Smart water infrastructure also enables
18 | Master Meter Water Financing Guide
Source: Northeast Group
real-time monitoring and detailed analysis of water usage patterns previously unavailable. This allows utilities to reduce waste and lower costs. Compared with other water conservation solutions — both large infrastructure projects such as desalination plants and demand-side conservation programs — smart water infrastructure typically has one of the lowest costs per cubic meter of water saved, according to Northeast Group.
For example, in California, smart metering and networking projects are estimated to cost between $0.25 and $0.75 per cubic meter of water saved. This is calculated based on current elevated rates for water usage, current leakage and waste (i.e. non-revenue water), and current consumption patterns. Meanwhile, larger infrastructure projects in the state cost $2 to $3 per cubic meter saved, and some conservation efforts — like a rebate for removing lawns — can be more 10 ten times more expensive.
Many water utilities in the United States and throughout the world are taking note. In California, the City of San Francisco has deployed smart water meters to most of
its customers. Other western states have also been active, with much of New Mexico now using smart water meters and a degree of smart water networking. Overall, the Northeast Group report found that North American water utilities are expected to invest roughly $7.7 billion in smart water infrastructure between 2015 and 2025. This represents the second largest market (behind Europe) in the world.
Around the world, activity has been primarily focused in the developed regions, with Japan, Germany and France among the leaders. Smart water infrastructure can have high upfront costs that smaller water utilities in emerging market countries may not be prepared to invest in. But in water scarce regions, this may quickly change. Middle Eastern countries are already at the forefront of smart water meter deployments, with large-scale deployments in countries such as Israel, Turkey and United Arab Emirates, among others.
In many of these countries — particularly in the Gulf region — the price paid for water is extremely low, or in some cases, practically free. But government-owned utilities are
Investing Smart | 19
still investing in smart water infrastructure, as they realize the implicit cost of water scarcity and the related economic cost. Similar to California, large water infrastructure projects that will be needed to address rising scarcity will cost billions of dollars, implying a much higher “full cost of water.” For example, in Kuwait, Bahrain and Qatar, Northeast Group has calculated that the full cost of water — including energy costs for pumping water, labor and capital costs, and most critically, the cost of necessary infrastructure to address scarcity — is more than $10 per cubic meter. Yet, Bahrain charges just $0.67 per cubic meter, Saudi Arabia charges a token $0.03 per cubic meter and Kuwait offers water free to Kuwaiti citizens.
Generally, water utilities tend to be conservative and less willing to make major new investments without outside impetus. Awareness of the benefits of smart water infrastructure can help overcome this hurdle.
20 | Master Meter Water Financing Guide
Hurdles to Investment The disparity between the full cost of water and existing tariffs is most extreme in the Middle East, but plays out throughout the world, where approximately half of the countries globally do not have tariffs that properly account for the costs of producing and treating water. This creates a major hurdle to smart water infrastructure investment.
When using existing tariffs, the “cost” of leaked, wasted and stolen water may not appear high, and may not be sufficient to justify investment in smart water infrastructure. Yet, eventually someone must pay these costs. In California, water scarcity has led to higher tariffs for residential customers, while in Middle Eastern countries, the costs are borne by governments already suffering from low oil prices. In all cases, using a proper metric for the full cost of water more accurately shows the benefits of smart water infrastructure.
In addition to not properly valuing the commodity of water, there are other hurdles to smart water infrastructure investment, with some variation by region. For example,
in North America, smart water networks are harder to implement as these often rely on district metering areas (DMAs), which are less common in the United States and Canada. These DMAs allow utilities to measure water demand within neighborhoods or districts in real time and reduce water pressure during periods of low demand, therefore reducing leakage. This can also be accomplished through smart metering, but at higher cost.
Developing countries such as Chile and Malaysia have drastically reduced water waste through these projects at a much lower cost than through smart metering.
Meanwhile, in most regions, but especially in emerging market countries where it can be politically challenging to raise water tariffs, financing for smart water infrastructure is a major hurdle.
Finally, there are often few regulatory drivers for water, with the exception of the California drought in recent years in the United States, as well as the highly-publicized water crisis in Flint, Michigan. Generally, water utilities tend to be conservative and less willing to make major new investments without outside impetus. Awareness of the benefits of smart water infrastructure can help overcome this hurdle. Notably, one of the key indicators for predicting which utilities will invest in smart water infrastructure is whether or not another utility nearby has already made these investments.

Investing Smart | 21
Financing & Implementing Smart Water ProjectsBenefits, Challenges & MisconceptionsBy Andrew Farr
There is much to consider when implementing smart water infrastructure, such as a new AMI program or upgrading existing metering infrastructure. Because water meters are such an important component of a utility’s revenue stream, many factors go into successful metering and implementing a successful program.
Today, most water utilities across the United States have implemented at least some form of “smart” technology for distribution system management, but often at varying degrees of adoption. But as the technology for smart metering has evolved, utilities have begun to apply the data they collect in new ways, looking beyond automated meter reads and improved billing systems.
In some cases, the discussion about smart water technology has evolved to a broader discussion about smart cities. While there may be a long way to go until that concept is fully realized, smart cities are an eventual goal for many municipalities around the globe that are pouring millions — and
even billions — of dollars into enhancing the “Internet of Things” across buildings, infrastructure, city departments, transit, public utilities and more.
There are numerous aspects of community life that can be impacted by enhancing operational efficiency. City departments such as public utilities, and in particular, water utilities, are one of many areas already being affected by the technology revolution.
While the business case for smart water networks may be compelling, funding can often be the biggest hindrance to implementation. In fact, some of the reasons smart water networks may not by fully adopted by utilities.
The Business Case for AMIWater utilities need accurate data for a number of reasons. First and foremost, utilities need data from meters for billing. They also need data to measure non-revenue water (NRW). Water utilities are encouraged by the American Water Works Association (AWWA) to audit for NRW, but these audits are only as good as the data on which they are based. AMI provides the data foundation for accurate audits. In addition, customers are demanding better service and more information from utilities on how they are using water. AMI technologies provide utilities with timely information about water use and the data necessary to, in turn, help their end users view and manage water use to save money and resources.
Yet, many utilities place more emphasis on the cost of meters rather than the long-term returns of collecting data from them. In fact, many utilities making decisions on how to collect data from meters rely on historic preferences as well the short-term capital costs related to acquiring and deploying meters.
Financing & Implementing Smart Water Projects | 23
To get an accurate picture of the total cost of ownership (TCO) of any system for collecting meter data, utilities should also consider the long-term capital and operating expenses related to their meter-reading solutions. These expenses vary considerably depending on the method used — whether manually by meter readers, by drive-by systems that wirelessly read devices from service vehicles, or via a fixed network that collects data automatically. As a result, evaluation of new systems needs to be based on a macro, long-term view to assess the greatest return on investment and the potential
for system and service improvements. Water utilities looking to understand the true costs of a meter-reading system should evaluate the long-term expenses and benefits related to systems.
Financing AMI through a P3Funding can be one of the major hindrances to implementing an AMI program, which can have several costs beyond just meter installation or replacement. Sometime
24 | Master Meter Water Financing Guide
Know the Benefits
Utilities should be careful not to view AMI as only benefiting meter reading. Remember, AMI can be integrated with other systems, such as a hydraulic model to help predict system performance. Data can also be incorporated into a utility’s CMMS. Therefore, meter data can essentially impact capital improvement planning and improve customer service. Some common — including long-term —
meter installation programs need to include additional improvements, such as relocating or replacing water mains for which additional funding may be required.
Financing AMI projects though P3s is one approach that offers several benefits based on the guaranteed revenue stream that will be available once a utility charges the new metered rate for customers. It should be noted, however, that there are different types of P3s that can be applied based on situation, circumstance and contracting method desired.
benefits of implementing AMI can include:
» Better meter accuracy, which can impact replacement of aging, inaccurate meters;
» Efficient meter reading and re-reads;
» Reduced truck rolls and staff time for manual reads;
» Reduced staff time for billing exceptions and estimations;
» Self-Service — AMI provides tools
to assist end-users with near-real-time alerts and improved understanding of consumption and ability to view and manage their water use;
» Ability to perform remote disconnect;
» Eliminate door tags and physical visits including non-pay disconnects; and
» Theft — near-real-time theft/tamper alerts
Feasibility Studies & Understanding Revenue
Before implementing an AMI project, a feasibility study should be conducted to determine the accuracy of current meters and determine a projected revenue goal for new meters. A feasibility study should also be conducted to determine where business processes need to change due to the implementation of new technology.
“Doing a feasibility study of the age and performance of the meters is critical,” says Antonio Cabrera, managing director for U.S. operations at IBT Group, a construction company that serves as prime contractor and program manager on a number of metering and AMI projects. IBT specializes in strategic partnerships for AMI project implementation. “The new revenue stream is dependent on which meters are changed and how many are changed,” adds Cabrera.
Cabrera also says metering projects are in a unique category when it comes to major capital improvement projects that utilities can implement because the meters are directly tied to how much revenue a system is generating.
Without accurate meters, a utility’s water measurement — and therefore its revenue — can be severely impacted. With an AMI system, there’s also no longer a need for work orders or truck roll-outs in the meter reading process because everything is done electronically. This is one area where the business process of a utility will be impacted, and it needs to be taken into account.
“You have to refine the business process,” adds Joe Testa, division director for AMI at IBT Group. “Utilities must have a comfort level about how much revenue the utility will generate. So our goal is to have the most accurate feasibility study possible.”
Financing & Implementing Smart Water Projects | 25
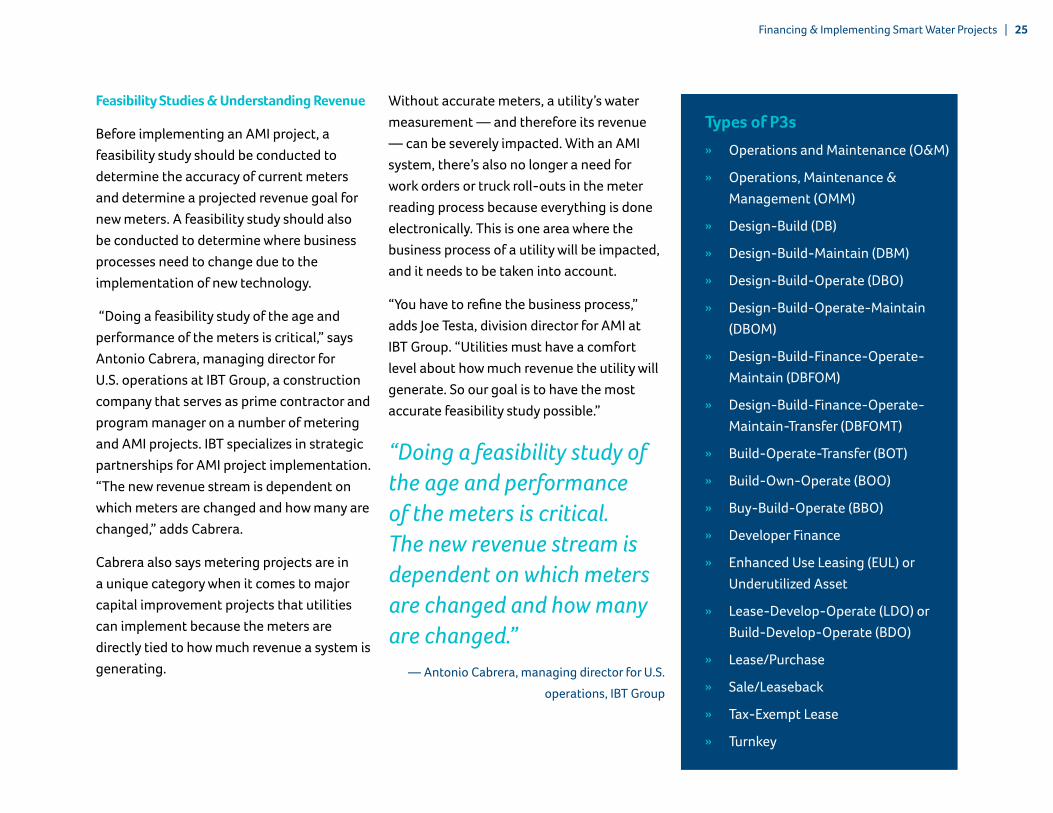
Types of P3s » Operations and Maintenance (O&M)
» Operations, Maintenance & Management (OMM)
» Design-Build (DB)
» Design-Build-Maintain (DBM)
» Design-Build-Operate (DBO)
» Design-Build-Operate-Maintain (DBOM)
» Design-Build-Finance-Operate-Maintain (DBFOM)
» Design-Build-Finance-Operate-Maintain-Transfer (DBFOMT)
» Build-Operate-Transfer (BOT)
» Build-Own-Operate (BOO)
» Buy-Build-Operate (BBO)
» Developer Finance
» Enhanced Use Leasing (EUL) or Underutilized Asset
» Lease-Develop-Operate (LDO) or Build-Develop-Operate (BDO)
» Lease/Purchase
» Sale/Leaseback
» Tax-Exempt Lease
» Turnkey
“Doing a feasibility study of the age and performance of the meters is critical. The new revenue stream is dependent on which meters are changed and how many are changed.”
— Antonio Cabrera, managing director for U.S. operations, IBT Group
Testa, who oversees proposals for IBT’s AMI division including teaming up with distributors such as Master Meter to help utilities finance and implement AMI programs, says another important component of managing an AMI program is assuring the utility that smart water infrastructure will be financially viable.
“We always want to make sure a customer understands the revenue impact upfront,” he says. “If somebody is going to spend $5 million on a system and only realize savings of $10,000 a year, that’s not a good return on investment.”
Misconceptions
According to Cabrera, every financing structure is unique and P3s are often an effective mode of financing for metering programs because water meters give insight into the revenue that utilities can
gain, as well as the long-term savings they can realize.
“We have found that what is happening in the P3 arena here in the United States is that there are a lot of people who have seen the opportunities in P3s, and in my opinion, have abused and misused P3s in too many municipalities that we have approached,” says Cabrera. “There is a lot of misconception out there. You will always hear people say P3s are all unique. You must have a number of things to make them work.”
Cabrera lists some factors that should exist before entering a P3:
» The municipality must be open to the idea of using a P3 and see the value in it.
» The program manager and the city must work together.
» The municipality must have a defined revenue stream around which to structure financing.
“The bottom line is, once a meter hits the 7- to 15-year mark, it does not calibrate consumption as well as it did before,” Cabrera says. “So, when you go into a city and replace 10- to 15-year-old water meters
26 | Master Meter Water Financing Guide
with a brand new one, you’re looking at a 10 to 15 percent new revenue stream that you didn’t have before. That is probably sufficient to finance AMI implementation over an 8- to 10-year period.”
Cabrera also adds that knowing specifics about the revenue generated from various types of meters will also give insight into how the system will be affected once an AMI system is implemented.
“With a P3 for water AMI, most of the time when you’re calculating revenue stream, the commercial meters in a system are many times a financing force that is unmatchable by the residential side,” he says. “Commercial meters will probably provide financing for 80 percent of the entire AMI implementation cost. But that will vary by municipality depending on the meter sizes.
“Whenever you have commercial meters and you want to implement AMI, it is critical that commercial meters be taken into consideration because they are incredibly positive for the revenue stream.”
Another misconception that exists in a P3 contract for an AMI project, Testa adds, is that utilities oftentimes hear ‘P3’ and think
“It is critical that commercial meters be taken into consideration because they are incredibly positive for the revenue stream.”
it refers to a public-private partnership in which a private water company takes operational control of the utility and is paid a concession by the public entity.
“It takes us a little while to help them understand that we are not going to take control of their utility, we are not running their water department and treating it like a concession,” says Testa. “That’s one of the hurdles we face now and again.”
Value-for-Money
The benefits of using a P3 to finance AMI come in many forms. The specific financing part is one of the more important considerations of a P3 because its typically handled on the private side, although private sector entities often try to work with consultants to obtain public funding.
“In the case of the financing on the private side, it’s typically more expensive,” says Francis Garcia-Pages, project manager for the AMI division of IBT Group.
In order to show the value of the increased difference in financing, a value-for-money analysis is performed to show the sum of all the costs that the utility has to consider for
either traditional public finance vs. using the same process on the private side.
“Although the cost of financing may be a little higher with a P3, the quantitative value of risk transfer in the design, build, operate or maintain phase is now on the side of the private sector,” says Garcia-Pages. “That risk mitigation has its value.”
One part of that value, Garcia-Pages adds, is that it eliminates bureaucracy and large-scale coordination that can exist in a metering program and allows decisions to be made quicker than what might occur on the public side.
With a P3, the risk of performance is also now incumbent on the private side.
“The public sector is no longer concerned about if they can manage the process or get the value out of the system by managing it themselves,” says Garcia-Pages. “They’re basically just defining what it is they want out of the system in very clear terms. And if the private sector fails to implement that, then there are liquidated damages similar to the construction side. There’s a very clear-cut understanding of what needs to be done.”
Financing & Implementing Smart Water Projects | 27
Andrew Farr is the associate editor of Water Finance & Management.
Conclusion
Smart metering technology is constantly evolving, and it seems the water utilities have come to a point where they are now capitalizing on its full capability and managing systems based on that capability. The enhanced clarity of information from AMI networks, and the ability to better track water use and consumption, is having – and will continue to have – a significant impact on customer service.