Embed Size (px)
Citation preview
Journal of Ecological Anthropology Journal of Ecological Anthropology
Volume 18 Issue 1 Volume 18, Issue 1 (2016) Article 4
June 2016
The Environmental Heritage and Wellness Assessment: Applying The Environmental Heritage and Wellness Assessment: Applying
Quantitative Techniques to Traditional Ecological Knowledge and Quantitative Techniques to Traditional Ecological Knowledge and
Wellness Relationships Wellness Relationships
Kristina Baines CUNY, Guttman Community College
Follow this and additional works at: https://scholarcommons.usf.edu/jea
Part of the Social and Cultural Anthropology Commons
Recommended Citation Recommended Citation Baines, Kristina. "The Environmental Heritage and Wellness Assessment: Applying Quantitative Techniques to Traditional Ecological Knowledge and Wellness Relationships." Journal of Ecological Anthropology 18, no. 1 (2016): .
Available at: https://scholarcommons.usf.edu/jea/vol18/iss1/4
This Data Notes is brought to you for free and open access by the Anthropology at Scholar Commons. It has been accepted for inclusion in Journal of Ecological Anthropology by an authorized editor of Scholar Commons. For more information, please contact [email protected].
Baines / Environmental Heritage and Wellness
The Environmental Heritage and Wellness Assessment: Applying Quantitative Techniques to Traditional Ecological Knowledge and Wellness Relationships
INTRODUCTION
Maya (both Mopan and Q’eqchi’) communities in southern Belize are primarily located within a tropical lowland rainforest ecosystem, and have historically practiced slash and burn subsistence agriculture with the planting of corn as central to the shifting cultivation of milpa plots (corn typically interplanted with other species). The community surveyed in this study (population ~450) was the focus of two major, recent developments: an extended land-rights claim and series of court proceedings focusing on the traditional land tenure system, and the paving of the road through the community, connecting the Caribbean coastal town with the Guatemalan border. In the context of the wider research (described below),
Kristina Baines
ABSTRACT
This paper examines health and traditional ecological knowledge/practices in a Mopan Maya community in southern Belize, illuminating how changes in daily practices might be related to changes in wellness. These data were collected using a Likert survey designed based on previously collected ethnographic and pile sort data related to health and heritage, and then administered to households in the community (n=64). The paper concludes that the data, while exploratory, show links between higher scores on both the health and heritage indices and warrant further engagement with these connections when considering how we define both health and ecological heritage in indigenous, and broader, communities.
Data Notes
these events made this community of particular interest in looking at intersections of wellness and traditional ecological knowledge and practice.
My objective was to further understand how health and wellness are conceptualized in this community, and how these concepts are connected to concepts of heritage. The research presented here was part of both a larger, collaborative, interdisciplinary project documenting changing land-use practices in the study community from the ancient Maya settlements through to the present day Maya communities using data from ethnographers, archaeologists, ecologists and climate scientists (see Prufer et al. 2015; Baines and Zarger 2012), and, particularly, part of an extensive 12-month ethnographic study over three
Journal of Ecological Anthropology Vol. 18 No. 1 2016
years, which looked at ways in which members of the community defined health and wellness in addition to its relationship to land, land use, and traditional ecological knowledge and practices (Baines 2016). It was conceptually and theoretically informed by studies relating embodiment and enskillment in addition to those related to traditional ecological knowledge and practice as they relate to daily activities (Ingold 2000; Vermonden 2009; Zarger 2011).
METHODOLOGY
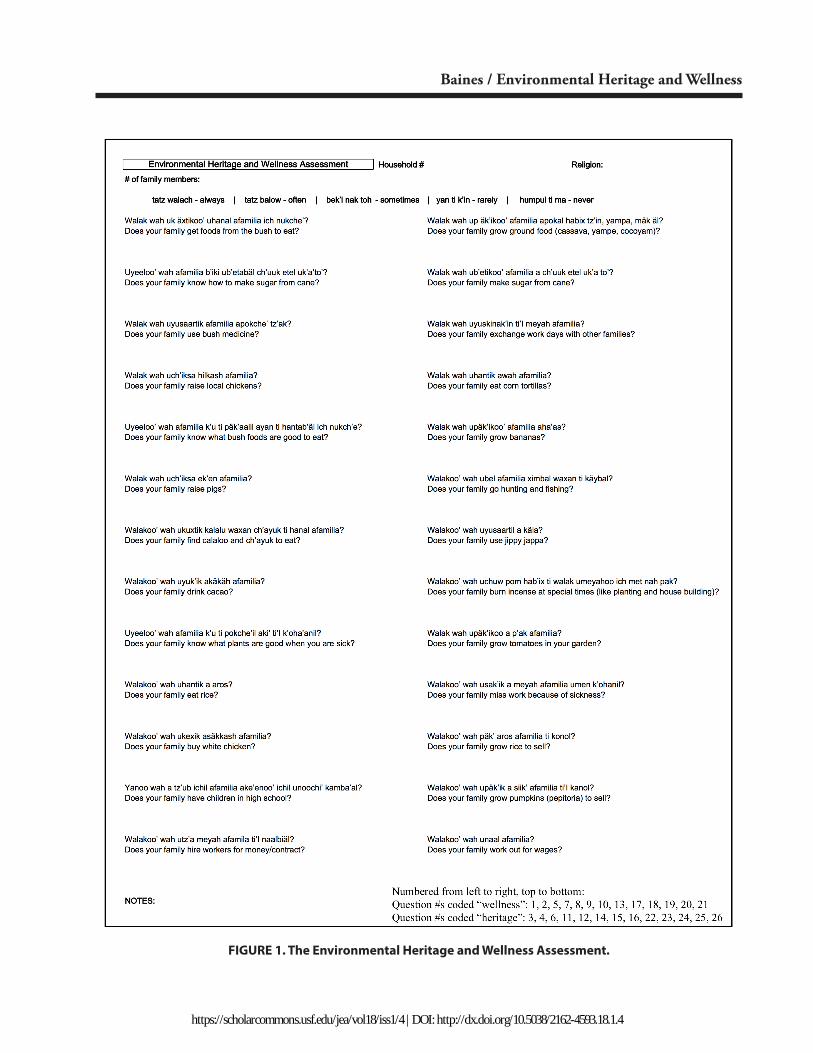
I developed a 26-question assessment of wellness and heritage (Figure 1). The question topics were selected using the most frequent responses from constrained pile sorts (n=30) in the context of the ethnographic observation of those response items in practice. While administering the constrained pile sorts, I asked participants to choose the ten cards (generated from a previous free-listing activity (n=50) using the same questions), which they felt were the most important “to be healthy” and ten cards, which they felt were the most important “to have a good Maya life.” The latter question generated the responses that would form the “heritage” index.
Heritage is used here to describe a connection to traditional ecological knowledge but in recognition that this knowledge is not static and is conceptualized most often in the study community through practice. The term “heritage” was not used explicitly in the data collection process as it is understood as a more abstract concept and this research sought to ground this survey in everyday practice. The term “tradition” was often used by the participants, however, was not used in this analysis because many of the practices, such as the use of the jippy jappa palm (Cardulovica palamata) for baskets (which was brought to Maya communities by American volunteers in the 1980s), may not considered “traditional” by readers.
Health was defined and conceptualized broadly, to include wellness and happiness, and the Mopan word selection for this concept was also fully explored
before the completion of the survey. In the design of the questions, constrained pile sort frequencies were triangulated with data from informal interviews (n= >50) and field notes from 11 months of participant observation. The resultant environmental heritage and wellness assessment survey (Figure 1), therefore, is a community-driven instrument designed using ground-up methods. The 26 questions designed to measure participation in healthy practices (13) and those designed to measure levels of heritage practices (13) were comingled in the survey and are indicated at the bottom of Figure 1. I, who am well known to the research participants, orally administered the survey, primarily in Mopan Maya, with some questions in English at the participants’ request. I visited each household available over the course of one month in November 2011 (n=64) and administered the survey only if at least the female head of household was present, concluding from extensive ethnographic observation and previous informal interviewing that she would be the most likely to have knowledge of entirety of the family practices.
Typically, women are more knowledgeable about household activities because the men are out of the home. The men in the village frequently relay information about agricultural and work practices when they return but women generally do not provide to men all of the details taking place in the home environment. Thus, women had a clear, and arguably more complete, understanding of both household and farming/labor practices. Respondents were given the choice of reporting the frequency with which they did or used the various practices/items: always, often, sometimes, rarely or never. While this Likert-style scale was not very familiar to the respondents, with some explanation, they were able to make selections. While marking responses, additional information regarding the specifics and qualifications of certain responses was recorded.
In order to measure each household’s overall wellness and “heritage” score, each response was coded by number, with 5 being the most “healthy” or the most important in terms of heritage constructions. For 18
Baines / Environmental Heritage and Wellness
FIGURE 1. The Environmental Heritage and Wellness Assessment.
https://scholarcommons.usf.edu/jea/vol18/iss1/4 | DOI: http://dx.doi.org/10.5038/2162-4593.18.1.4
Journal of Ecological Anthropology Vol. 18 No. 1 2016
questions, a code of “5” was given for the “always” response and for eight questions a code of “5” was given for the “never” response, if that activity/item was considered to have a negative relationship to health/heritage. Households were given “wellness” scores and “heritage” scores in addition to overall scores. To systematically determine how different activities and items might be correlated with one another across households, the scores for each question and each household were entered in SPSS 20 and multiple analyses conducted.
While the data here, like all Likert data, are ordinal in the sense that respondents chose one of five distinct responses, it is justifiable to consider them interval data because the choices represent points on a continuous scale of frequency and the five choices are interpretive rather than distinct. For example, “sometimes” is assigned the numerical value of “3” but indicates a range of frequency that may be reasonably represented with an interval scale. Additionally, all questions use this same scale, another justification for the consideration of these data as interval for the purposes of these analyses. The use of data collected in this way as both ordinal and/or interval for the multiple analyses and purposes is widely discussed and practiced, if notably controversial (Norman 2010; Jamieson 2004). For these reasons outlined above, and because these analyses are intended to be exploratory, both non-parametric and parametric tests were conducted.
RESULTS
Descriptive Statistics
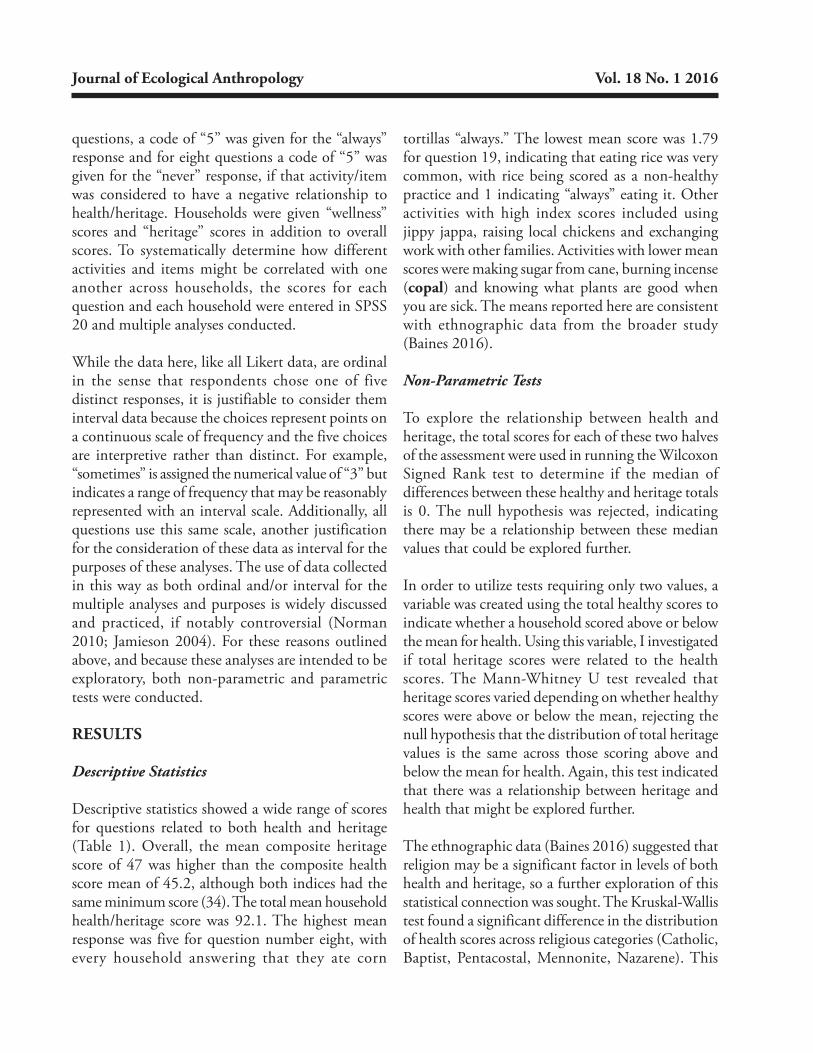
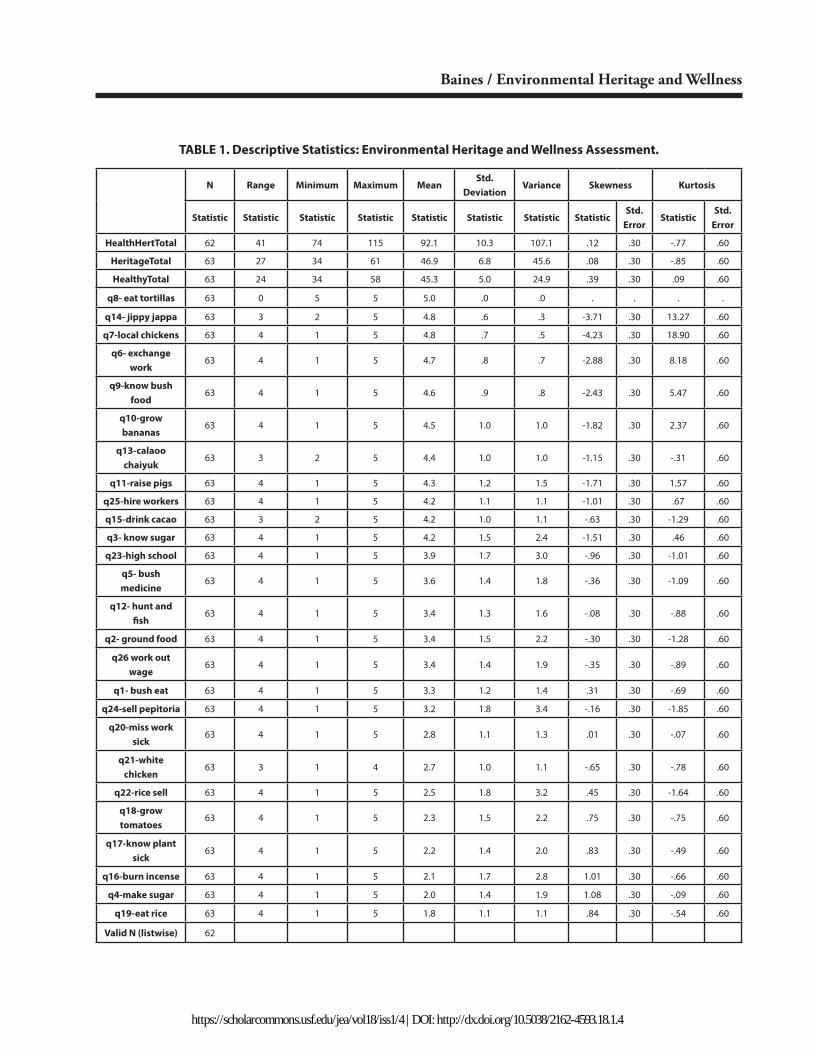
Descriptive statistics showed a wide range of scores for questions related to both health and heritage (Table 1). Overall, the mean composite heritage score of 47 was higher than the composite health score mean of 45.2, although both indices had the same minimum score (34). The total mean household health/heritage score was 92.1. The highest mean response was five for question number eight, with every household answering that they ate corn
tortillas “always.” The lowest mean score was 1.79 for question 19, indicating that eating rice was very common, with rice being scored as a non-healthy practice and 1 indicating “always” eating it. Other activities with high index scores included using jippy jappa, raising local chickens and exchanging work with other families. Activities with lower mean scores were making sugar from cane, burning incense (copal) and knowing what plants are good when you are sick. The means reported here are consistent with ethnographic data from the broader study (Baines 2016).
Non-Parametric Tests
To explore the relationship between health and heritage, the total scores for each of these two halves of the assessment were used in running the Wilcoxon Signed Rank test to determine if the median of differences between these healthy and heritage totals is 0. The null hypothesis was rejected, indicating there may be a relationship between these median values that could be explored further.
In order to utilize tests requiring only two values, a variable was created using the total healthy scores to indicate whether a household scored above or below the mean for health. Using this variable, I investigated if total heritage scores were related to the health scores. The Mann-Whitney U test revealed that heritage scores varied depending on whether healthy scores were above or below the mean, rejecting the null hypothesis that the distribution of total heritage values is the same across those scoring above and below the mean for health. Again, this test indicated that there was a relationship between heritage and health that might be explored further.
The ethnographic data (Baines 2016) suggested that religion may be a significant factor in levels of both health and heritage, so a further exploration of this statistical connection was sought. The Kruskal-Wallis test found a significant difference in the distribution of health scores across religious categories (Catholic, Baptist, Pentacostal, Mennonite, Nazarene). This
Baines / Environmental Heritage and Wellness
TABLE 1. Descriptive Statistics: Environmental Heritage and Wellness Assessment.
N Range Minimum Maximum MeanStd.
DeviationVariance Skewness Kurtosis
Statistic Statistic Statistic Statistic Statistic Statistic Statistic StatisticStd.
ErrorStatistic
Std. Error
HealthHertTotal 62 41 74 115 92.1 10.3 107.1 .12 .30 -.77 .60
HeritageTotal 63 27 34 61 46.9 6.8 45.6 .08 .30 -.85 .60
HealthyTotal 63 24 34 58 45.3 5.0 24.9 .39 .30 .09 .60
q8- eat tortillas 63 0 5 5 5.0 .0 .0 . . . .
q14- jippy jappa 63 3 2 5 4.8 .6 .3 -3.71 .30 13.27 .60
q7-local chickens 63 4 1 5 4.8 .7 .5 -4.23 .30 18.90 .60
q6- exchange work
63 4 1 5 4.7 .8 .7 -2.88 .30 8.18 .60
q9-know bush food
63 4 1 5 4.6 .9 .8 -2.43 .30 5.47 .60
q10-grow bananas
63 4 1 5 4.5 1.0 1.0 -1.82 .30 2.37 .60
q13-calaoo chaiyuk
63 3 2 5 4.4 1.0 1.0 -1.15 .30 -.31 .60
q11-raise pigs 63 4 1 5 4.3 1.2 1.5 -1.71 .30 1.57 .60
q25-hire workers 63 4 1 5 4.2 1.1 1.1 -1.01 .30 .67 .60
q15-drink cacao 63 3 2 5 4.2 1.0 1.1 -.63 .30 -1.29 .60
q3- know sugar 63 4 1 5 4.2 1.5 2.4 -1.51 .30 .46 .60
q23-high school 63 4 1 5 3.9 1.7 3.0 -.96 .30 -1.01 .60
q5- bush medicine
63 4 1 5 3.6 1.4 1.8 -.36 .30 -1.09 .60
q12- hunt and fish
63 4 1 5 3.4 1.3 1.6 -.08 .30 -.88 .60
q2- ground food 63 4 1 5 3.4 1.5 2.2 -.30 .30 -1.28 .60
q26 work out wage
63 4 1 5 3.4 1.4 1.9 -.35 .30 -.89 .60
q1- bush eat 63 4 1 5 3.3 1.2 1.4 .31 .30 -.69 .60
q24-sell pepitoria 63 4 1 5 3.2 1.8 3.4 -.16 .30 -1.85 .60
q20-miss work sick
63 4 1 5 2.8 1.1 1.3 .01 .30 -.07 .60
q21-white chicken
63 3 1 4 2.7 1.0 1.1 -.65 .30 -.78 .60
q22-rice sell 63 4 1 5 2.5 1.8 3.2 .45 .30 -1.64 .60
q18-grow tomatoes
63 4 1 5 2.3 1.5 2.2 .75 .30 -.75 .60
q17-know plant sick
63 4 1 5 2.2 1.4 2.0 .83 .30 -.49 .60
q16-burn incense 63 4 1 5 2.1 1.7 2.8 1.01 .30 -.66 .60
q4-make sugar 63 4 1 5 2.0 1.4 1.9 1.08 .30 -.09 .60
q19-eat rice 63 4 1 5 1.8 1.1 1.1 .84 .30 -.54 .60
Valid N (listwise) 62
https://scholarcommons.usf.edu/jea/vol18/iss1/4 | DOI: http://dx.doi.org/10.5038/2162-4593.18.1.4
Journal of Ecological Anthropology Vol. 18 No. 1 2016
is consistent with ethnographic reports that some “Maya traditions” are more likely to be supported by the Catholic Church.
Linear Regression
In light of my ethnographic observations (Baines 2016), I was most interested to explore the relationship between health and heritage, particularly whether the individual household’s composite heritage scores or any of the heritage variables, were good predictors of healthy composite scores. Using the composite “healthy” score as the dependent variable, I performed an exploratory linear regression to see if heritage scores could predict how a household would score in health. The initial model that included the variable for total heritage score was significant but explained only 25 percent of the variation in healthy scores. In an attempt to find a stronger model to explain more of the variation in healthy scores, I entered the heritage variables separately. The ANOVA for this model was significant so I selected the three variables with significant p-values in the model and was able to find a stronger model to predict the variation in the total healthy scores, explaining 43 percent, using the responses to these three questions:
• Does your family make sugar from cane?• Does your family know what bush foods are
good to eat?• Does your family work out [of the community]
for wages?
Again, the inclusion of these variables supports my ethnographic findings (Baines 2016). Working out of the community for wages contrasts with participating in a traditional labor exchange within the community. This exchange of labor, or usk’inak’in, is often pointed to as critical in the maintenance of heritage traditions. The making of sugar has emerged as a critical heritage practice, both from the perspective of an example of a waning tradition, but also from a practical standpoint as shop-bought sugar becomes scarce and expensive. It is worthwhile noting here
that “natural” sugar made from cane locally is also thought to be “healthier” and its reduced level of processing would support this claim and support the assertion that its consumption in place of shop-bought sugar may contribute to a reduced diabetes risk. As a heritage practice to perpetuate the “learning by doing” of traditional knowledge (described by Zarger 2011), a practical endeavor to reduce the stress of sourcing and buying sugar and a natural and more nutritionally sound choice by biomedical parameters, making sugar can be defined as a healthier practice than buying it for consumption.
An analysis of the predictive value of the knowledge of bush foods in relation to healthy scores follows a similar three-pronged model, with this knowledge having heritage value, practical value and being biomedically sanctioned in terms of promoting health. Of note in a consideration of these two variables is that one is practice-related and one is knowledge-related. The environmental heritage and wellness assessment survey included both a practice and a knowledge variable for both of these items. Clearly, knowledge and practice both contribute to heritage and health supporting an interconnected consideration of both. The inclusion of the final variable expresses the importance of work practice to the health/heritage relationship, again supporting both the ethnographic data and the relationships found in my pile sort analysis (Baines 2016).
Further exploration was undertaken to explain more of both the variation in health and the relationship between other variables. It is significant to this study to note that question 8, “does your family eat corn tortillas?” was omitted by SPSS in all the linear regression models because it was a constant variable. Every household responded that they “always” ate corn tortillas.
While religion was not significant in predicting health scores, it emerged as a statistically significant predictor for total heritage score, with being Catholic a predictor for a higher heritage score and identifying as Baptist and other Evangelical religions predictor
Baines / Environmental Heritage and Wellness
a lower heritage score. The model is weak, however, explaining just 15 percent of the variation. A similar statistically significant but weak model exists using religion to predict overall heritage/health scores. To predict heritage scores, I entered both religion and whether healthy scores were above or below the mean as dummy variables into the linear regression model- the model was significant, with an R-squared of 40 percent.
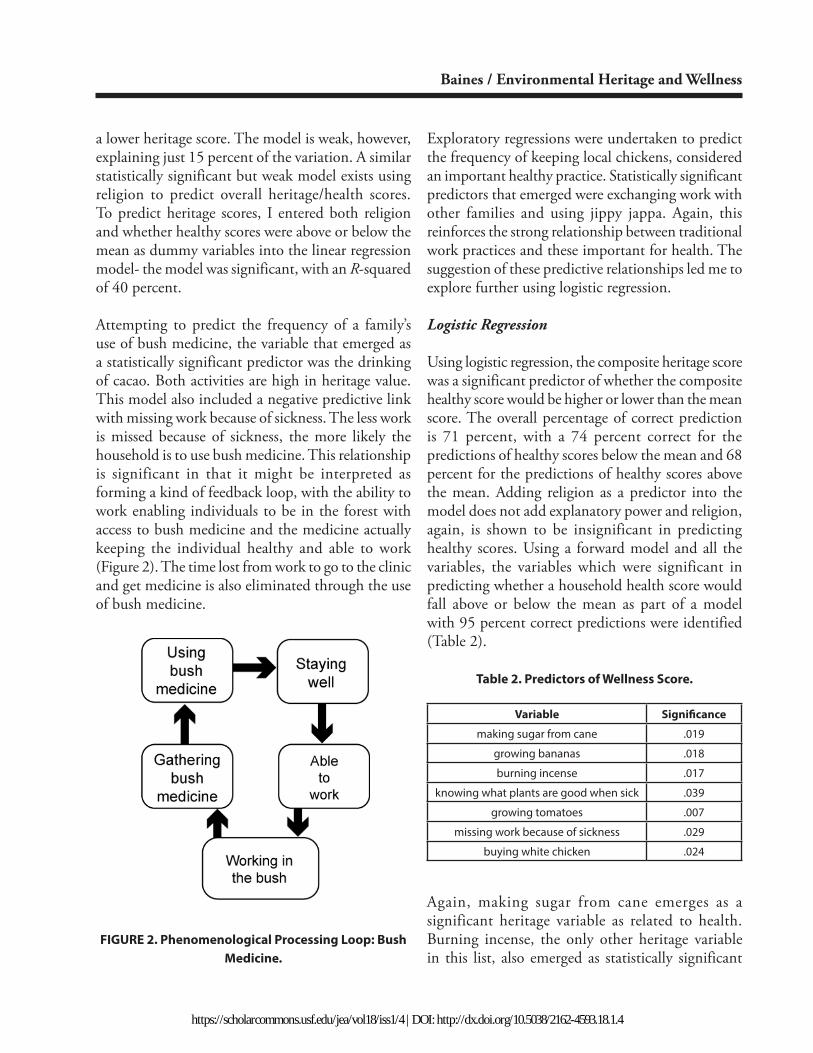
Attempting to predict the frequency of a family’s use of bush medicine, the variable that emerged as a statistically significant predictor was the drinking of cacao. Both activities are high in heritage value. This model also included a negative predictive link with missing work because of sickness. The less work is missed because of sickness, the more likely the household is to use bush medicine. This relationship is significant in that it might be interpreted as forming a kind of feedback loop, with the ability to work enabling individuals to be in the forest with access to bush medicine and the medicine actually keeping the individual healthy and able to work (Figure 2). The time lost from work to go to the clinic and get medicine is also eliminated through the use of bush medicine.
Exploratory regressions were undertaken to predict the frequency of keeping local chickens, considered an important healthy practice. Statistically significant predictors that emerged were exchanging work with other families and using jippy jappa. Again, this reinforces the strong relationship between traditional work practices and these important for health. The suggestion of these predictive relationships led me to explore further using logistic regression.
Logistic Regression
Using logistic regression, the composite heritage score was a significant predictor of whether the composite healthy score would be higher or lower than the mean score. The overall percentage of correct prediction is 71 percent, with a 74 percent correct for the predictions of healthy scores below the mean and 68 percent for the predictions of healthy scores above the mean. Adding religion as a predictor into the model does not add explanatory power and religion, again, is shown to be insignificant in predicting healthy scores. Using a forward model and all the variables, the variables which were significant in predicting whether a household health score would fall above or below the mean as part of a model with 95 percent correct predictions were identified (Table 2).
FIGURE 2. Phenomenological Processing Loop: Bush Medicine.
Variable Significance
making sugar from cane .019
growing bananas .018
burning incense .017
knowing what plants are good when sick .039
growing tomatoes .007
missing work because of sickness .029
buying white chicken .024
Table 2. Predictors of Wellness Score.
Again, making sugar from cane emerges as a significant heritage variable as related to health. Burning incense, the only other heritage variable in this list, also emerged as statistically significant
https://scholarcommons.usf.edu/jea/vol18/iss1/4 | DOI: http://dx.doi.org/10.5038/2162-4593.18.1.4
Journal of Ecological Anthropology Vol. 18 No. 1 2016
in predicting total health scores in the exploratory linear regression analysis, however it explained only a small percentage (7 percent) of the variation. This variable is interesting in its significance in the light of the ethnographic data related to the phenomenological experience of burning the incense copal and its relationship to health (Baines 2016:63). Of the “healthy” variables listed, it is of note that white chicken emerged as significant in light of the ethnographic data, which supports the understanding of hybrid chicken bought in the shop, known as white chicken, as less healthy than local, free-roaming chicken raised in the village.
Reliability of Scale
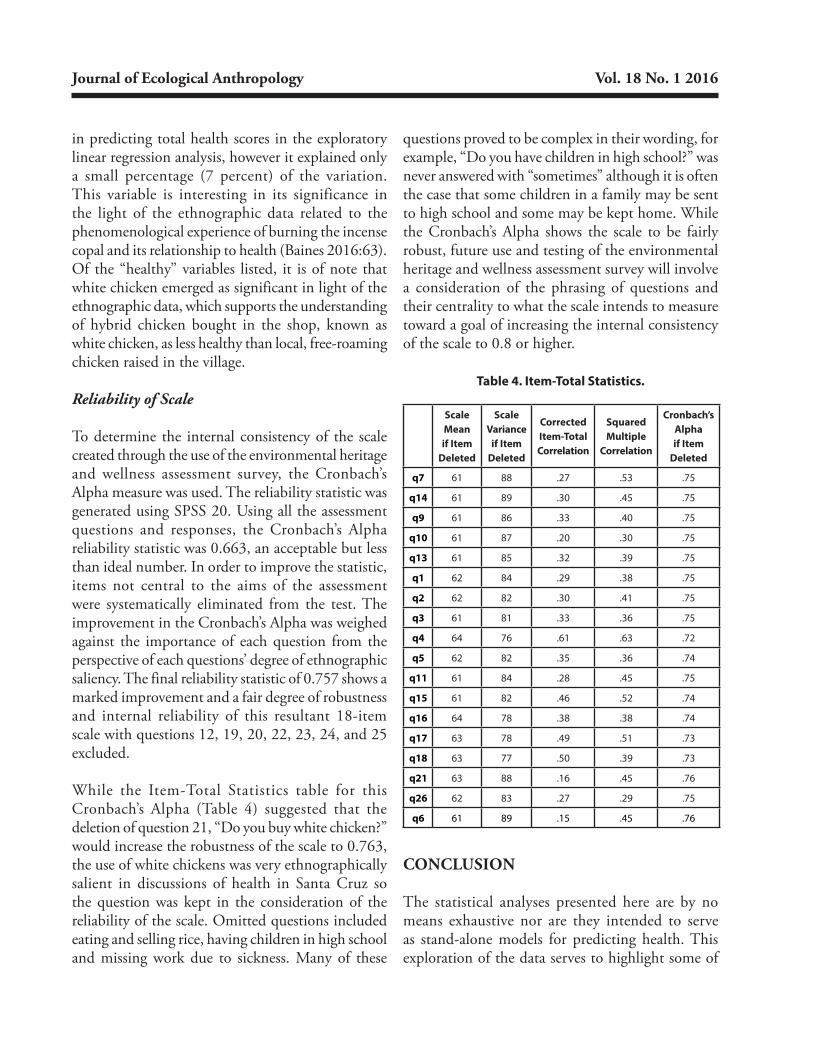
To determine the internal consistency of the scale created through the use of the environmental heritage and wellness assessment survey, the Cronbach’s Alpha measure was used. The reliability statistic was generated using SPSS 20. Using all the assessment questions and responses, the Cronbach’s Alpha reliability statistic was 0.663, an acceptable but less than ideal number. In order to improve the statistic, items not central to the aims of the assessment were systematically eliminated from the test. The improvement in the Cronbach’s Alpha was weighed against the importance of each question from the perspective of each questions’ degree of ethnographic saliency. The final reliability statistic of 0.757 shows a marked improvement and a fair degree of robustness and internal reliability of this resultant 18-item scale with questions 12, 19, 20, 22, 23, 24, and 25 excluded.
While the Item-Total Statistics table for this Cronbach’s Alpha (Table 4) suggested that the deletion of question 21, “Do you buy white chicken?” would increase the robustness of the scale to 0.763, the use of white chickens was very ethnographically salient in discussions of health in Santa Cruz so the question was kept in the consideration of the reliability of the scale. Omitted questions included eating and selling rice, having children in high school and missing work due to sickness. Many of these
questions proved to be complex in their wording, for example, “Do you have children in high school?” was never answered with “sometimes” although it is often the case that some children in a family may be sent to high school and some may be kept home. While the Cronbach’s Alpha shows the scale to be fairly robust, future use and testing of the environmental heritage and wellness assessment survey will involve a consideration of the phrasing of questions and their centrality to what the scale intends to measure toward a goal of increasing the internal consistency of the scale to 0.8 or higher.
Table 4. Item-Total Statistics.
Scale Mean if Item
Deleted
Scale Variance
if Item Deleted
Corrected Item-Total Correlation
Squared Multiple
Correlation
Cronbach’s Alpha if Item
Deleted
q7 61 88 .27 .53 .75
q14 61 89 .30 .45 .75
q9 61 86 .33 .40 .75
q10 61 87 .20 .30 .75
q13 61 85 .32 .39 .75
q1 62 84 .29 .38 .75
q2 62 82 .30 .41 .75
q3 61 81 .33 .36 .75
q4 64 76 .61 .63 .72
q5 62 82 .35 .36 .74
q11 61 84 .28 .45 .75
q15 61 82 .46 .52 .74
q16 64 78 .38 .38 .74
q17 63 78 .49 .51 .73
q18 63 77 .50 .39 .73
q21 63 88 .16 .45 .76
q26 62 83 .27 .29 .75
q6 61 89 .15 .45 .76
CONCLUSION
The statistical analyses presented here are by no means exhaustive nor are they intended to serve as stand-alone models for predicting health. This exploration of the data serves to highlight some of
Baines / Environmental Heritage and Wellness
the significant linkages between important elements of health and heritage as defined by this Mopan Maya community in the Toledo District, Belize. Significant connections were found and predictive models suggested, however, it is important not to overstate the predictive value of these variables. These data reflect the complex nature of the construction of both heritage and health and how these variables reflect the interactions and negotiations community members make daily within a consistently changing environment.
Kristina Baines, Guttman Community College, City University of New York, [email protected]
ACKNOWLEDGEMENTS
I would like to thank the members of the community of Santa Cruz, Toledo, Belize for making it possible to conduct this research. I am also grateful for the support of this research through the “Development and resilience of complex socioeconomic systems: A theoretical model and case study from the Maya Lowlands” National Science Foundation (0827281; D Kennett-PI, K Prufer, R Zarger, and B Winterhalder-CoPIs). Two anonymous reviewers provided very valuable feedback on an earlier version of this manuscript.
REFERENCES CITED Baines, K. 2016 Embodying ecological heritage in a Maya
community: Health, happiness, and identity. Lanham, MD: Lexington Books.
Baines, K, and R.K. Zarger. 2012 “Circles of value: Integrating Maya
environmental knowledge in Belizean schools,” in The Anthropology of environmental education. Edited by Helen Kopnina, pp. 65-86. New York: Nova Science Pub, Inc.
Prufer, K.M., A.E. Thompson, and D.J. Kennett.2015 Evaluating airborne LiDAR for detecting
settlements and modified landscapes in disturbed tropical environments at Uxbenka, Belize. Journal of Archaeological Science 57:1-13. http://dx.doi.org/10.1016/j.jas.2015.02.013
Ingold, T. 2000 The perception of the environment:
Essays on livelihood, dwelling and skill. London: Routledge. http://dx.doi.org/10.4324/9780203466025
Jamieson, S.2004 Likert scales: How to (ab)use them.
Medical Education 38(12):1212–1218. http://dx.doi.org/10.1111/j.1365-2929.2004.02012.x
Norman, G. 2010 Likert scales, levels of measurement and
the ‘‘laws’’ of statistics. Advances in Health Science Education 15(5):625-632. http://dx.doi.org/10.1007/s10459-010-9222-y
Vermonden, D. 2009 “Reproduction and development
of expertise within communities of practice,” in Landscape, process and power: A re-evaluating traditional environmental knowledge. Edited by S. Heckler, pp. 205-229. New York: Berghahn Books.
Zarger, R.K. 2011 “Learning ethnobiology: Creating
knowledge and skills about the living world,” in Ethnobiology. Edited by E.N. Anderson, D. Pearsall, E. Hunn, and N. Turner, pp. 371-387. Wiley-Blackwell: Hoboken, New Jersey. http://dx.doi.org/10.1002/9781118015872.ch22
https://scholarcommons.usf.edu/jea/vol18/iss1/4 | DOI: http://dx.doi.org/10.5038/2162-4593.18.1.4