Embed Size (px)
Citation preview
THE ENERGY ENVIRONMENT REVIEW (EER)IN THE
ISLAMIC REPUBLIC OF IRAN (IRI)and
IN THE ARAB REPUBLIC OF EGYPT(ARE)
BYSHERIF ARIF
REGIONAL ENVIRONMENTAL AND SAFEGUARD ADVISOR, MNA
PRESENTED AT THE Strategic Environment Assessment in
the Energy SectorThursday, March 9, 2006
Structure of the Presentation
The Fuel for Thought Strategy and the EERThe Energy Sector in Iran and EgyptDamage Costs due to Air Pollution Policy Options for Reducing Damage CostsOutcome
The EER Concept
The Energy and Environment Review (EER) is a specific tool proposed in Fuel for Thought: An Environmental Strategy for the Energy Sector as an instrument to help set operational priorities for mainstreaming the environment
Fuel for Thought - PrinciplesFuel for Thought identifies three basic
principles:1. “We will create a framework for
environmentally sound energy sector development” To assess the problem we will create a grant-funded technical assistance product, Energy-Environment Review, closely integrated with the CAS
2. “We will address local and regional environmental and social impacts as a first priority” – health damage, shortened life-expectancy, especially from respiratory diseases; environmentally sound investment decisions; small-source pollution from vehicles; indoor air-pollution
3. “We will help tackle climate change”.
Why the Energy Sector in Iran and Egypt
Generates a large share of foreign currency receipt.Has major impact on the balance of payments.Manages key natural resources (oil and natural gas reserves both for the present and the future.Is a major source of pollution.Is an important sector for environmental mainstreaming
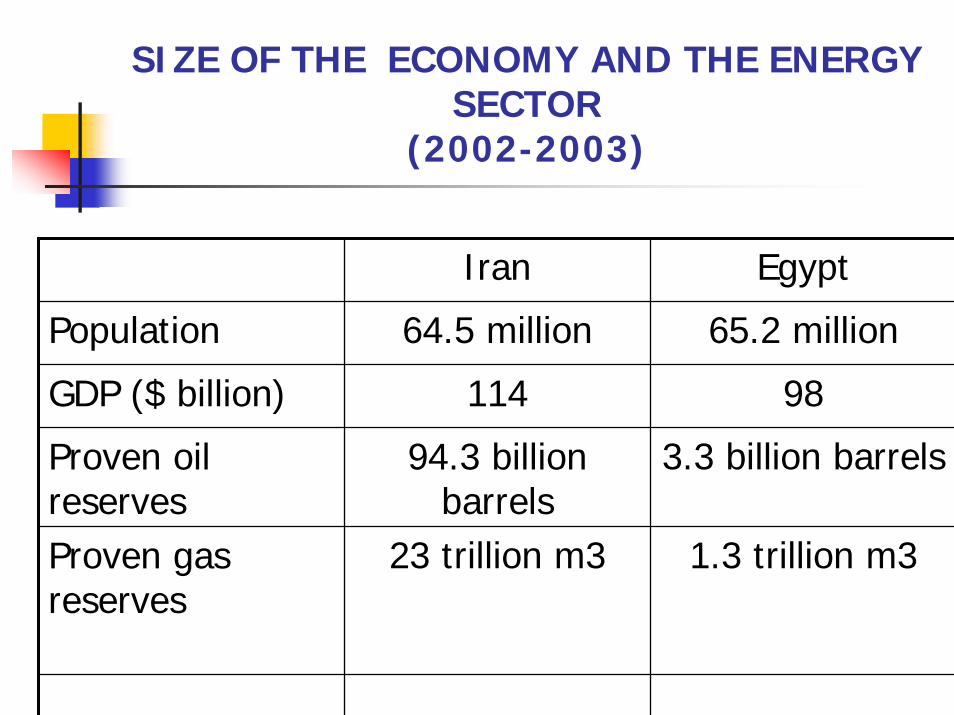
SIZE OF THE ECONOMY AND THE ENERGY SECTOR
(2002-2003)
Iran Egypt
Population 64.5 million 65.2 million
GDP ($ billion) 114 98
Proven oil reserves
94.3 billion barrels
3.3 billion barrels
Proven gas reserves
23 trillion m3 1.3 trillion m3
CONTENT OF THE EER STUDY
The study consisted of:An analysis of the current situation with regards to energy generation and use; An evaluation of the growth prospects with regards to energy generation and use; The identification of the environmental issues induced by the generation and use of energy and estimation of the costs of the damages; The evaluation of the extent of contribution to the climate-change phenomenon through emission of greenhouse gases;The evaluation of the proposed mitigating measures for the previously identified environmental problems; and Conclusions and recommendations, and a proposal for an action plan.
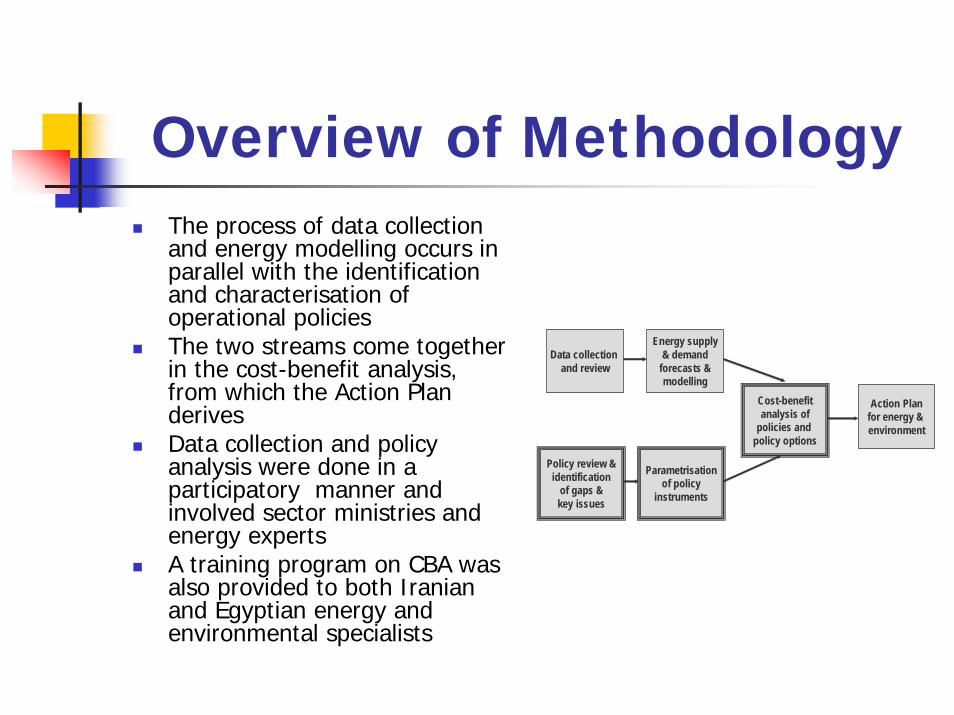
Overview of MethodologyThe process of data collection and energy modelling occurs in parallel with the identification and characterisation of operational policiesThe two streams come together in the cost-benefit analysis, from which the Action Plan derivesData collection and policy analysis were done in a participatory manner and involved sector ministries and energy expertsA training program on CBA was also provided to both Iranian and Egyptian energy and environmental specialists
Data collection and review
Energy supply& demand
forecasts &modelling
Action Planfor energy & environment
Policy review &identification
of gaps & key issues
Parametrisationof policy
instruments
Cost-benefitanalysis of
policies and policy options
Damage costs
Damage costs were based on Western European estimates supplemented where possible with local studiesThe assessment of damage from air pollution was based on ExternE, a methodology used by the EU member states applied for power generation and transport, Results have been used to support EU legislation concerning:
incineration, the Large Combustion Plant Directive, the EU strategy to combat acidification, the National Air Quality Strategies
Limitations of the Methodology
The physical, social and economic character of the MNA region is different from the EUThe is much inherent uncertainty in the ExternE estimatesThe EER applications are rather simple and aggregated – with more time the methodology could be better adaptedFull details of the methodology of ExternE, the results for all fuel-cycles and the applications to Member States can be found on www.externe.jrc.es.
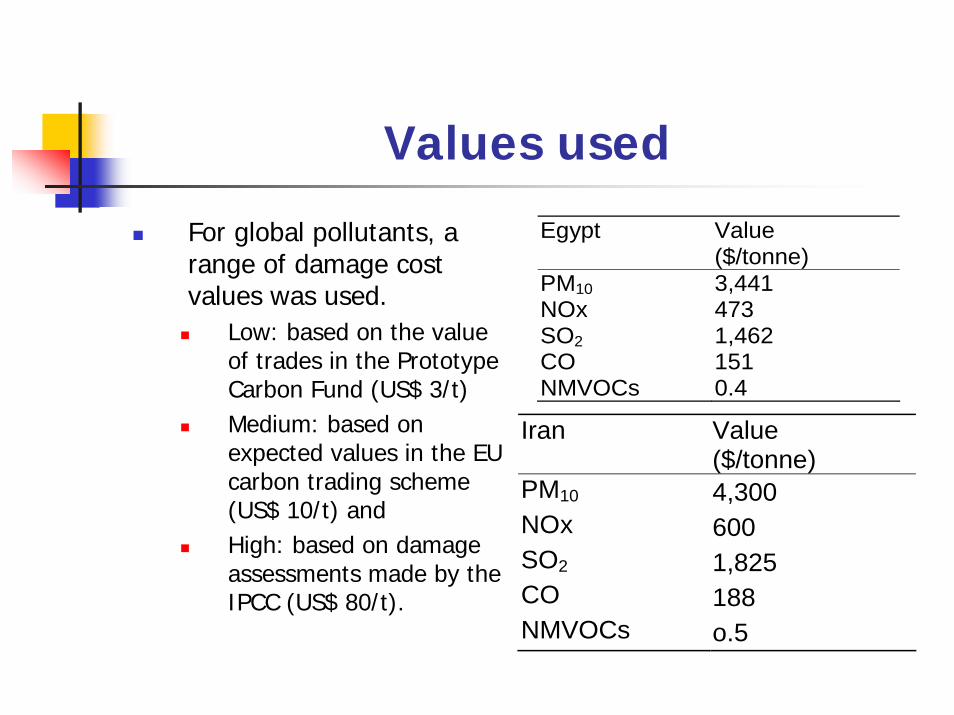
Values used
For global pollutants, a range of damage cost values was used.
Low: based on the value of trades in the Prototype Carbon Fund (US$ 3/t)Medium: based on expected values in the EU carbon trading scheme (US$ 10/t) and High: based on damage assessments made by the IPCC (US$ 80/t).
Egypt Value ($/tonne)
PM10 3,441 NOx 473 SO2 1,462 CO 151 NMVOCs 0.4
Iran Value ($/tonne)
PM10 4,300 NOx 600 SO2 1,825 CO 188 NMVOCs o.5
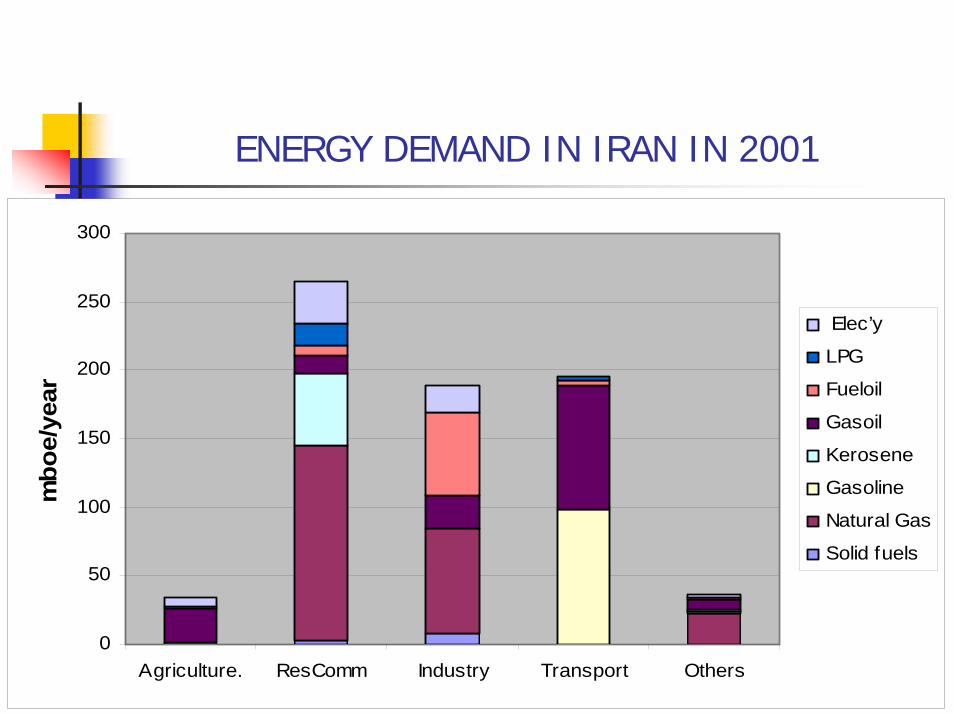
ENERGY DEMAND IN IRAN IN 2001
0
50
100
150
200
250
300
Agriculture. ResComm Industry Transport Others
mbo
e/ye
ar
Elec’y
LPG
Fueloil
Gasoil
Kerosene
Gasoline
Natural Gas
Solid fuels
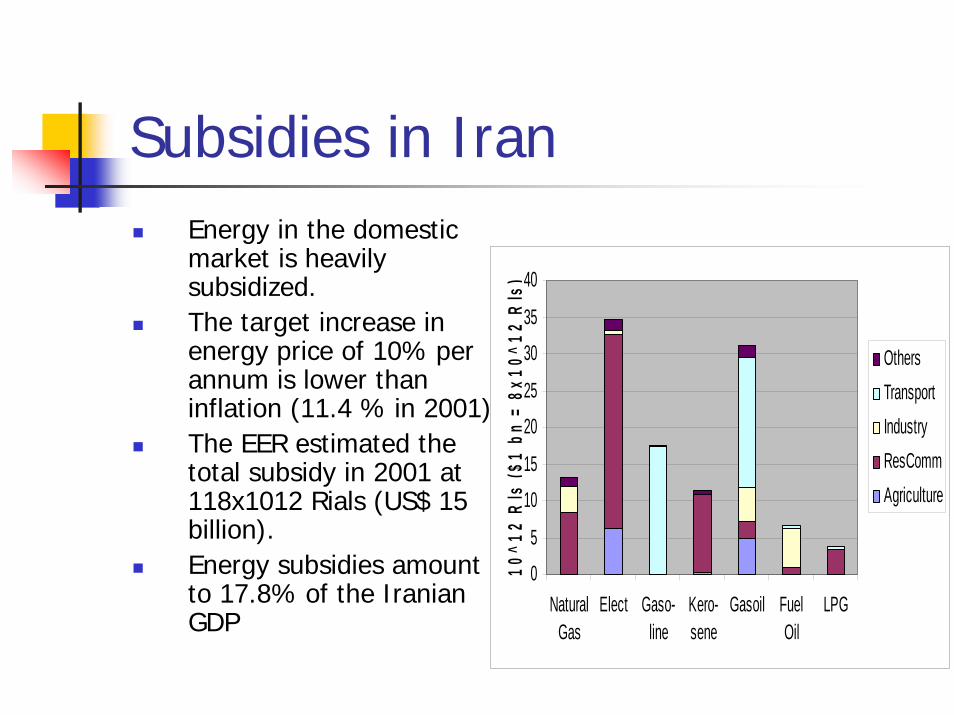
Subsidies in IranEnergy in the domestic market is heavily subsidized. The target increase in energy price of 10% per annum is lower than inflation (11.4 % in 2001). The EER estimated the total subsidy in 2001 at 118x1012 Rials (US$ 15 billion). Energy subsidies amount to 17.8% of the Iranian GDP
0
5
10
15
20
25
30
35
40
NaturalGas
Elect Gaso-line
Kero-sene
Gasoil FuelOil
LPG
10^1
2 R
ls ($
1 bn
= 8
x10^
12 R
ls)
OthersTransportIndustryResCommAgriculture
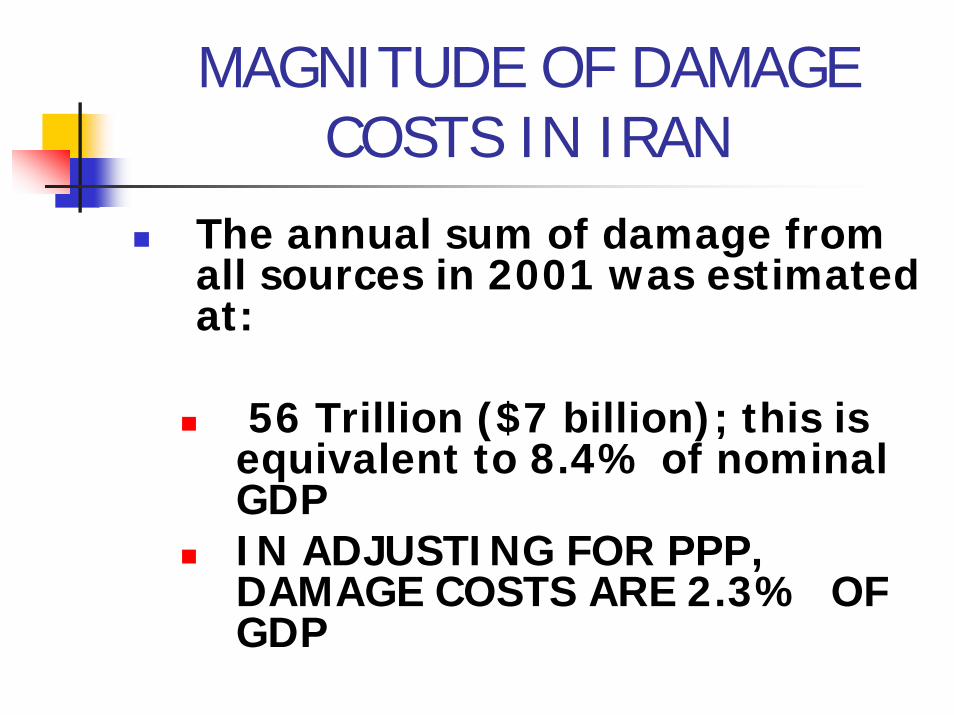
MAGNITUDE OF DAMAGE COSTS IN IRAN
The annual sum of damage from all sources in 2001 was estimated at:
56 Trillion ($7 billion); this is equivalent to 8.4% of nominal GDPIN ADJUSTING FOR PPP, DAMAGE COSTS ARE 2.3% OF GDP
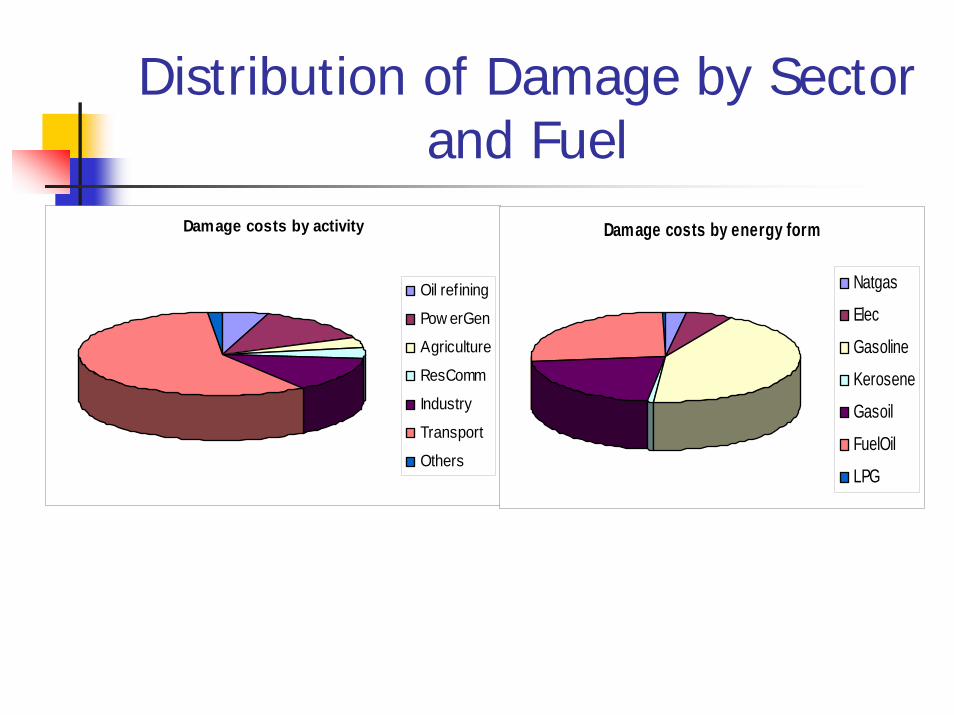
Distribution of Damage by Sector and Fuel
Damage costs by activity
Oil refining
Pow erGen
Agriculture
ResComm
Industry
Transport
Others
Damage costs by energy form
Natgas
Elec
Gasoline
Kerosene
Gasoil
FuelOil
LPG
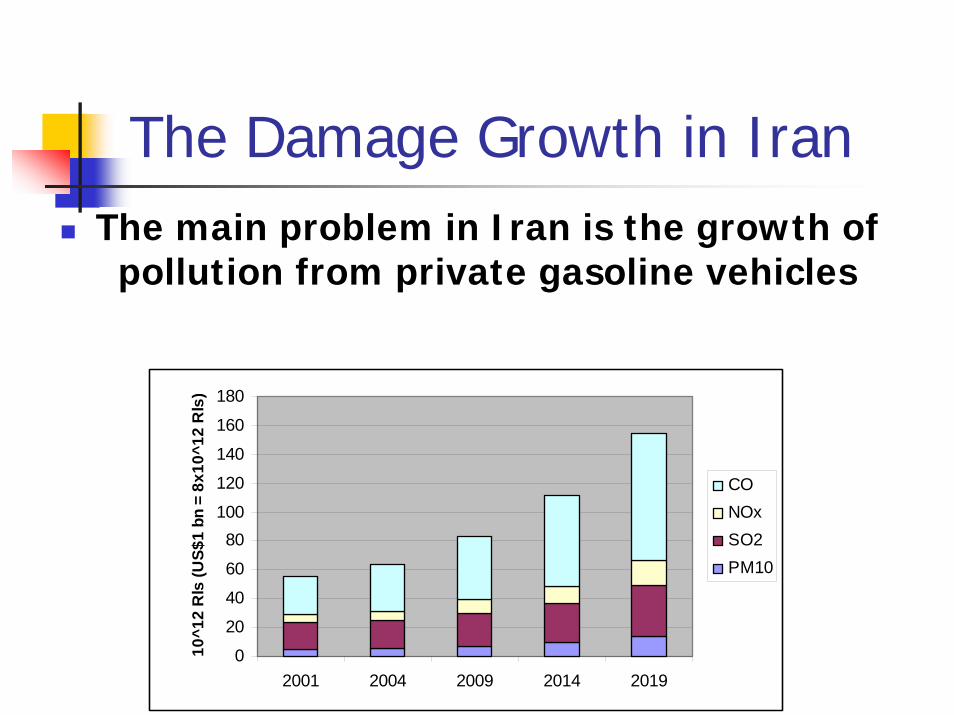
The Damage Growth in IranThe main problem in Iran is the growth of
pollution from private gasoline vehicles
0
20
40
60
80100
120
140
160
180
2001 2004 2009 2014 2019
10^1
2 R
ls (U
S$1
bn =
8x1
0^12
Rls
)
CONOxSO2PM10
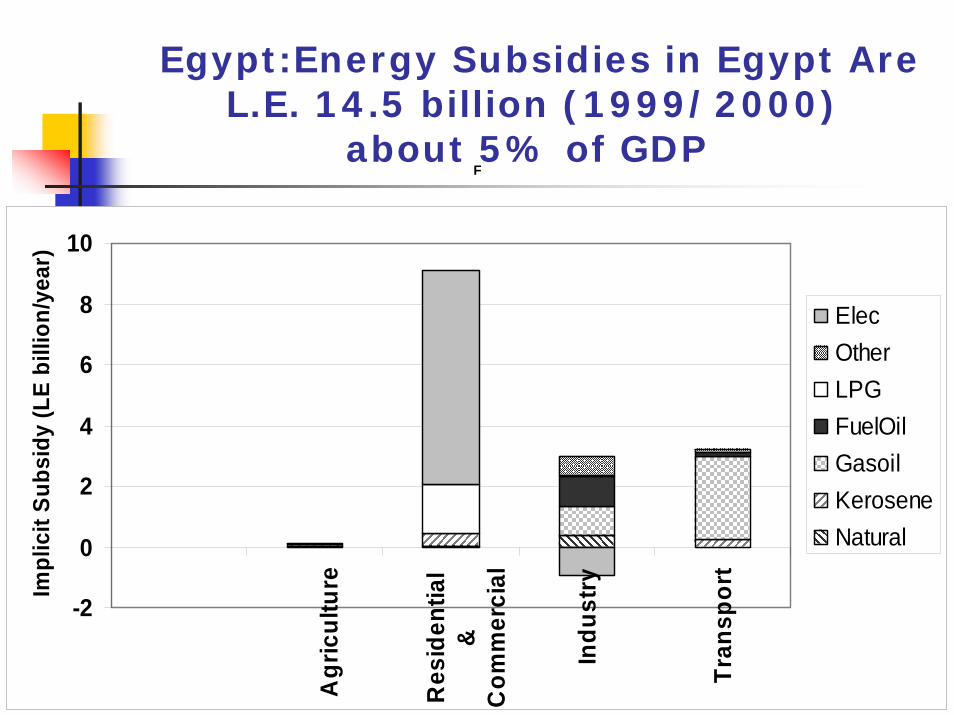
Egypt:Energy Subsidies in Egypt Are L.E. 14.5 billion (1999/2000)
about 5% of GDPF
-2
0
2
4
6
8
10
A
gric
ultu
re
R
esid
entia
l&
Com
mer
cial
In
dust
ry
Tr
ansp
ort
Impl
icit
Subs
idy
(LE
billi
on/y
ear)
ElecOtherLPGFuelOilGasoilKeroseneNatural
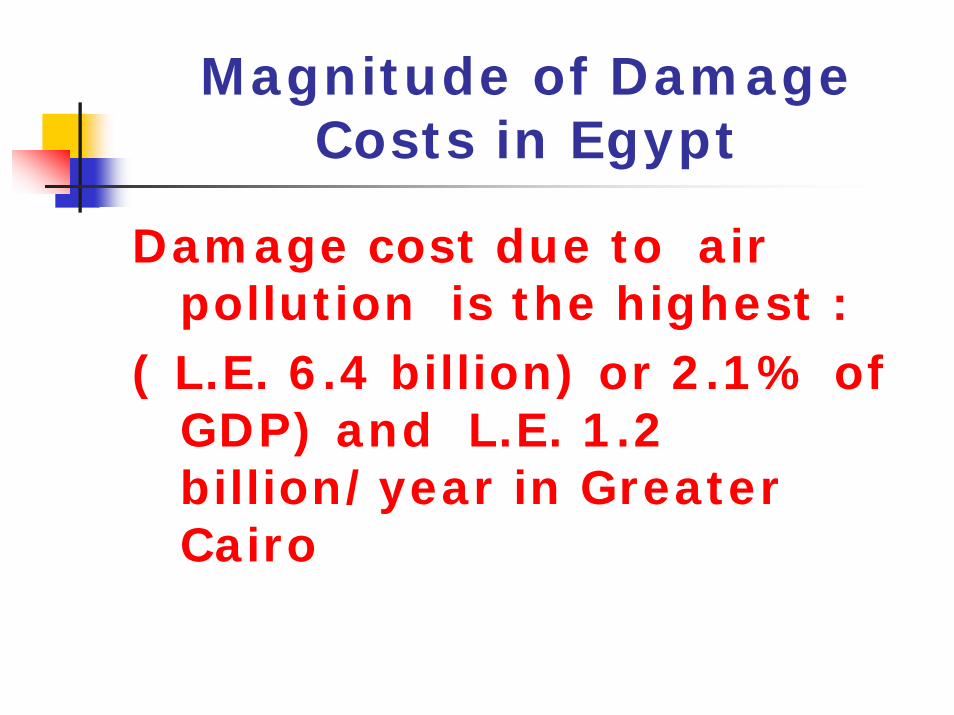
Magnitude of Damage Costs in Egypt
Damage cost due to air pollution is the highest :
( L.E. 6.4 billion) or 2.1% of GDP) and L.E. 1.2 billion/year in Greater Cairo
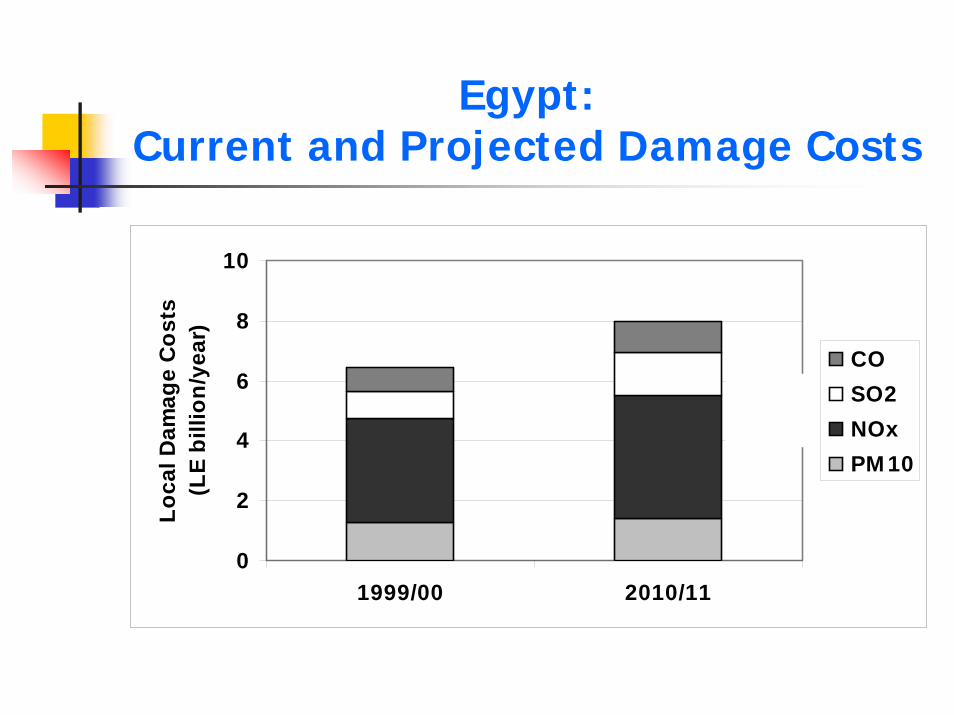
Egypt:Current and Projected Damage Costs
0
2
4
6
8
10
1999/00 2010/11
Loca
l Dam
age
Cos
ts
(LE
billi
on/y
ear)
COSO2NOxPM 10
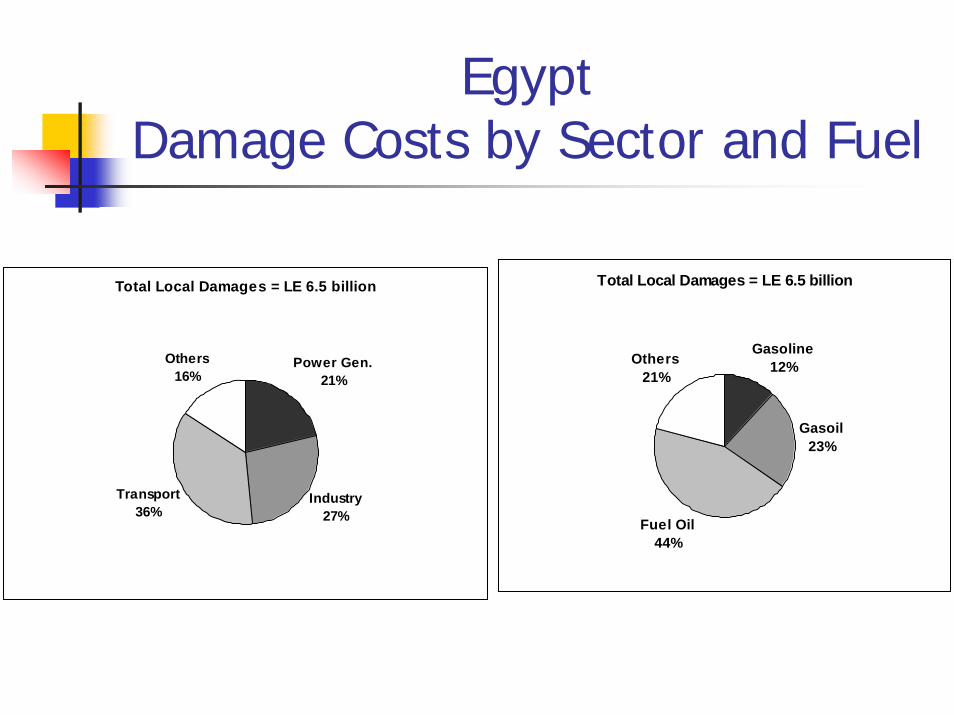
Total Local Damages = LE 6.5 billion
Industry27%
Others16%
Transport36%
Power Gen.21%
Total Local Damages = LE 6.5 billion
Gasoline12%
Gasoil23%
Fuel Oil44%
Others21%
EgyptDamage Costs by Sector and Fuel
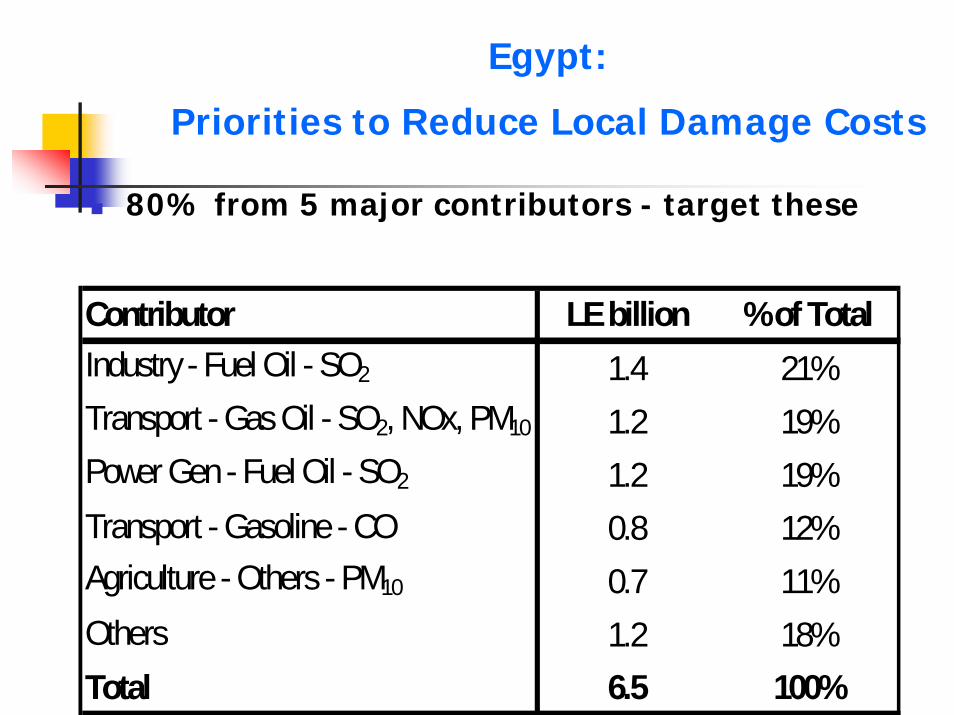
Egypt:
Priorities to Reduce Local Damage Costs
80% from 5 major contributors - target these
Contributor LE billion % of Total1.4 21%1.2 19%1.2 19%0.8 12%0.7 11%1.2 18%
Total 6.5 100%
Agriculture - Others - PM10
Others
Industry - Fuel Oil - SO2
Transport - Gas Oil - SO2, NOx, PM10
Power Gen - Fuel Oil - SO2
Transport - Gasoline - CO
Damage in the future
Damage from air pollution in Iran increased faster than GDP because of the large expected growth in private vehiclesDamage increased also in Egypt, but more slowly than GDPTransport in both countries is the major contributor to damageDamage increase with time despite the penetration of natural gas into power generation and industryCost-effective penetration of gas is limited by low prices and distorted differentials
POLICY OPTIONS
The EER examined the consequences of:price reform policies ;andsectoral measures, separately and in combination.
By a sectoral measure is meant an intervention that aim to cause a specific behavioural change, e.g. through targeted financial incentives and standards for equipment and appliances.
Sectoral measures
The EERs in both countries made detailed cost-benefit analyses of sectoral measures to reduce the environmental impacts The CBA valued energy at opportunity costs and included local and global damage costs. Where sectoral measures save energy, there is a financial benefit to the state budget from avoided subsidies. The cost-benefit analysis in these cases has been used to estimate the net cash-flow to the state. The short-list of sectoral measures was derived in discussion with local experts, workshops and review of other TA
Classification of measuresSectoral measures were classified as follows:
A: Measure is win-winB: Measure is cost-effective if local damage savings are includedC: Measure is cost-effective only when global damage savings are incorporated; suitable for CDM activitiesD: Measure is not cost-effective X: Either insufficient data is available to conduct a CBA or the topic does not lend itself to the methodology
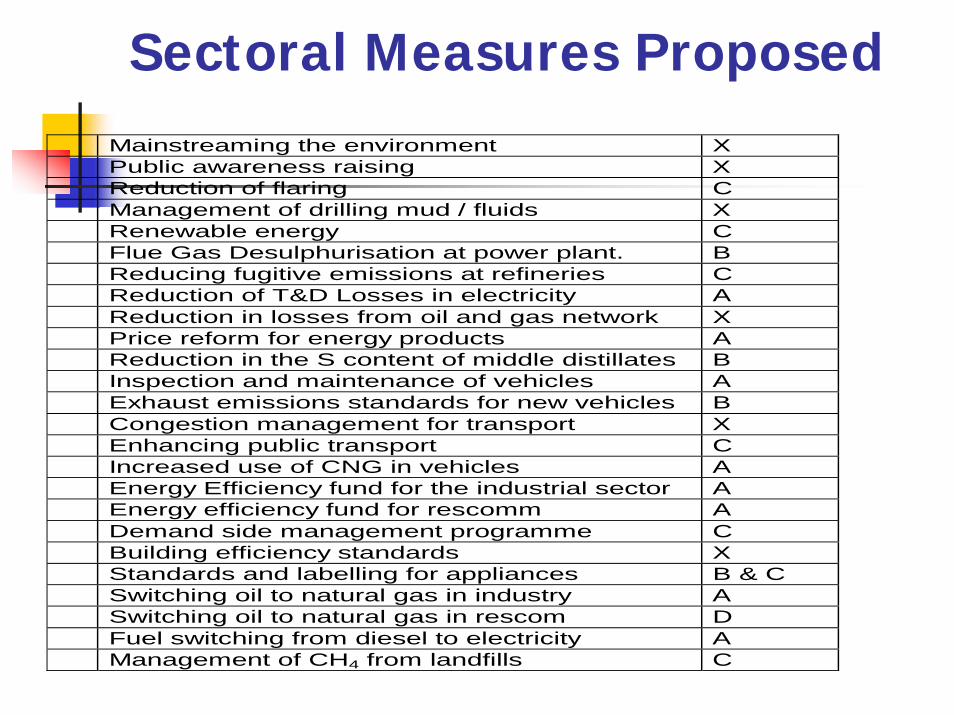
Sectoral Measures Proposed Mainstreaming the environment X Public awareness raising X Reduction of flaring C Management of drilling mud / fluids X Renewable energy C Flue Gas Desulphurisation at power plant. B Reducing fugitive emissions at refineries C Reduction of T&D Losses in electricity A Reduction in losses from oil and gas network X Price reform for energy products A Reduction in the S content of middle distillates B Inspection and maintenance of vehicles A Exhaust emissions standards for new vehicles B Congestion management for transport X Enhancing public transport C Increased use of CNG in vehicles A Energy Efficiency fund for the industrial sector A Energy efficiency fund for rescomm A Demand side management programme C Building efficiency standards X Standards and labelling for appliances B & C Switching oil to natural gas in industry A Switching oil to natural gas in rescom D Fuel switching from diesel to electricity A Management of CH4 from landfills C
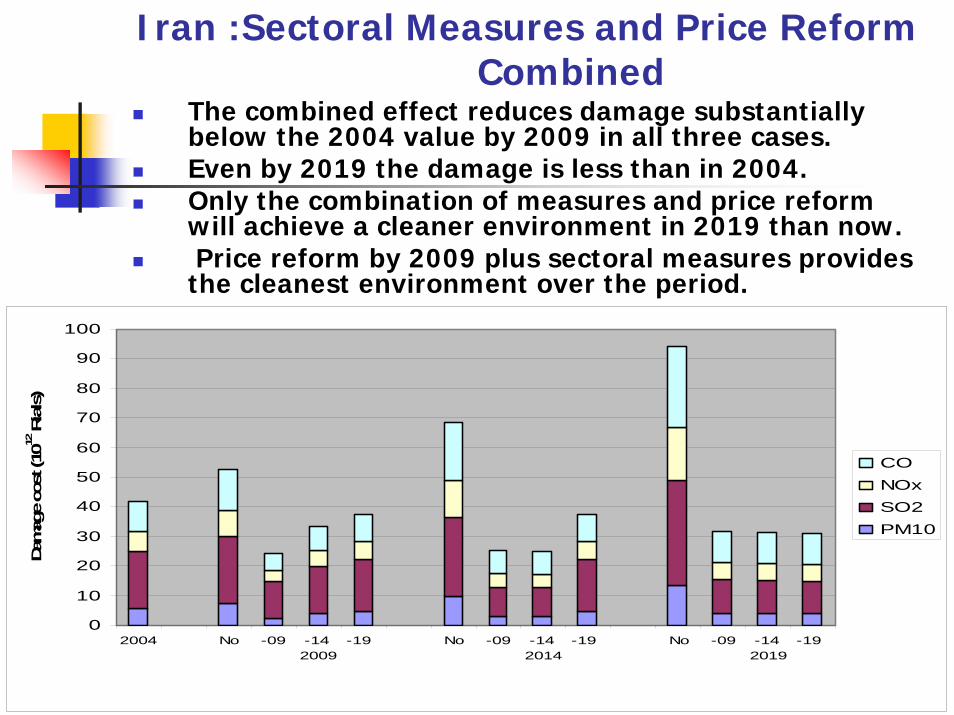
Iran :Sectoral Measures and Price ReformCombined
The combined effect reduces damage substantially below the 2004 value by 2009 in all three cases. Even by 2019 the damage is less than in 2004. Only the combination of measures and price reform will achieve a cleaner environment in 2019 than now. Price reform by 2009 plus sectoral measures provides
the cleanest environment over the period.
0
10
20
30
40
50
60
70
80
90
100
2004 No -09 -14 2009
-19 No -09 -14 2014
-19 No -09 -14 2019
-19
Dam
age
cost
(1012
Ria
ls)
CONOxSO2PM10

Egypt: Damage Costs 2010/2011 with
Price Reform & Sector MeasuresCompared with Business as Usual
0
2000
4000
6000
8000
10000
Actual(1999/2000)
BAU Price reform Sectormeasures
Combined
mn
LEL.E
. M
illio
n
Options for Partial Price Reform
Political constraints and the inflationary impacts of price reform could prevent the introduction of cost-effective prices . Which energy prices should be addressed in a partial reform process? Which would give the most environmental benefit?
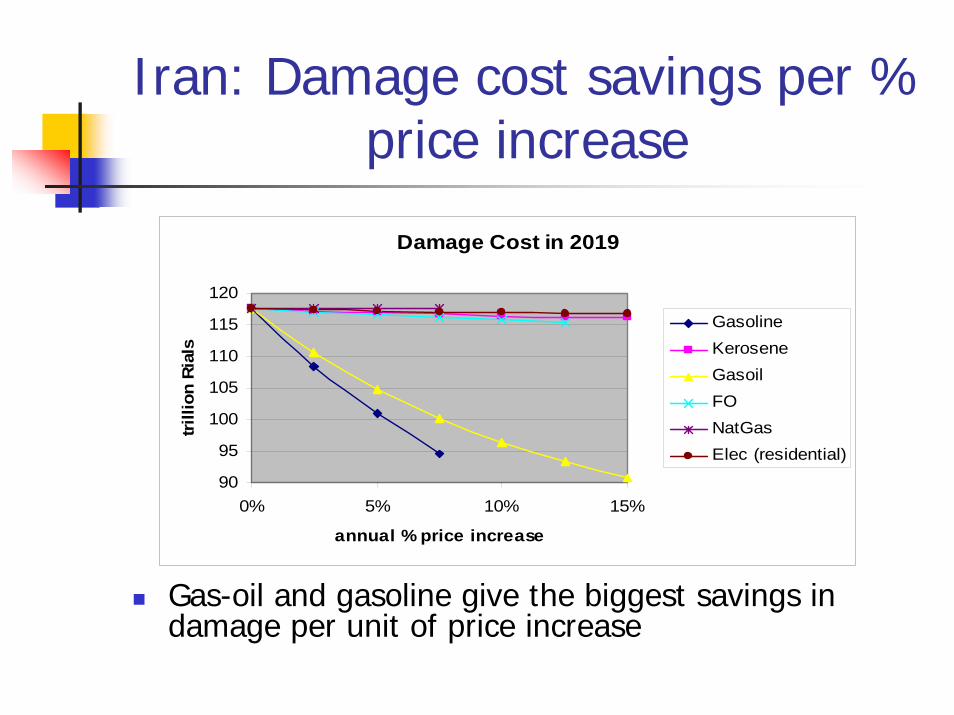
Iran: Damage cost savings per % price increase
Gas-oil and gasoline give the biggest savings in damage per unit of price increase
Damage Cost in 2019
90
95
100
105
110
115
120
0% 5% 10% 15%
annual % price increase
trill
ion
Rial
s
GasolineKeroseneGasoilFONatGasElec (residential)
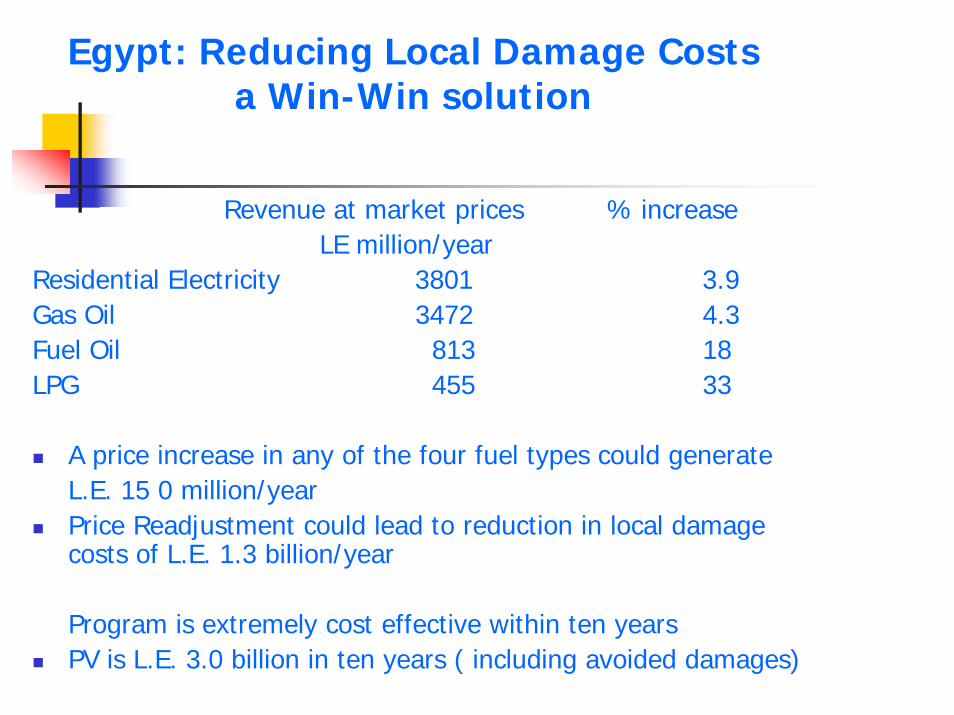
Egypt: Reducing Local Damage Costsa Win-Win solution
Revenue at market prices % increaseLE million/year
Residential Electricity 3801 3.9Gas Oil 3472 4.3Fuel Oil 813 18LPG 455 33
A price increase in any of the four fuel types could generate L.E. 15 0 million/yearPrice Readjustment could lead to reduction in local damage costs of L.E. 1.3 billion/year
Program is extremely cost effective within ten yearsPV is L.E. 3.0 billion in ten years ( including avoided damages)
Major EER Output- Increased Awareness for
Management of Climate Change
FFT identifies a need to “Evaluate Climate Change Externalities as a Matter of Routine”, make a “Bigger push for New Technologies –sector reform, renewables and EE, Develop a Market for Carbon EmissionsThe EERs have demonstrated the possibility of bring all these issues together within a single frameworkThe CBA framework is relevant to the climate change issue: only with systematic CBA can proper baselines be established and additionality demonstrated
DIRECT OUTCOME OF THE EER in Iran
Major recommendations will be included in the CAS ( under preparation)EER report was used by the Carbon Business Finance Unit for considering carbon emission reduction opportunities during a WB mission in September 2004The Bank’s funded Environment Management Support Project is providing TA and air quality monitoring equipment in four cities
INDIRECT OUTCOME OF THE EER in Iran
The EER assisted in the policy formulation in the forthcoming fourth year development plan as follows:
Increase of the energy fuels ( gasoline, diesel, and electricity should reach their real market values by 2009;The gasoline price was increased from 600 Rials per liter ( 7 cents/liter) to 850 Rialsper year (10 cents/liter).Diesel fuel was increased by 15 percent from 120 Rials/liter ( 1.4 cents/liter) to 165 Rials/liter ( 1.9 cents/liter);Electricity price increased by 20%.
Direct Outcome of EER in Egypt
Used by the Bank for advancing its policy dialogue in the Energy SectorEnabled the Carbon Business Finance Unit to commit to the purchase of US$ 50 million of carbon emission reductionsHelped the Bank in convincing the GOE to ratify the Kyoto ProtocolIncluded in the Country Environmental Analysis of Egypt
Direct Outcome of EER in Egypt
The Egypt-Pollution Abatement Project II (EPAP II) to be submitted to the Board in March 23 2006, used the EER to justify investments in the amount of US$ 20 million from IBRD and US$ 140 million from JBIC (Japan), EIB and Agence Francaise de Développment(AfD)
Indirect Outcome of the EER in Egypt
Increased penetration of natural gas in industrial sectors as well as CNG in taxisImproved efficiency of electrical transmissions and distribution systemsIncreasing the price of dieselVehicle Emission Testing (VET) in Greater Cairo
How much SEA costs and How long it takes
In Egypt: US$ 250,000 from the TFESSD for
consultants and training 2 years
In IranUS$ 350,000 from TFESSD for consultants and training30 months.

THANK YOU VERY MUCH FOR YOUR KIND ATTENTION