Embed Size (px)
Citation preview

The Benefits and Costs of Net Energy Metering in New York
Prepared for: New York State Energy Research and Development Authority and New York State Department of Public Service
December 11, 2015


© 2015 Copyright. All Rights Reserved.
Energy and Environmental Economics, Inc.
101 Montgomery Street, Suite 1600
San Francisco, CA 94104
415.391.5100
www.ethree.com
The Benefits and Costs of Net Energy Metering in New York:
Prepared for: New York State Energy Research and Development Authority and New York State Department of Public Service
December 11, 2015

This report is prepared by:
Kush Patel
Zachary Ming
Luke Lavin
Gerrit De Moor
Brian Horii
Snuller Price

Table of Contents
Executive Summary ........................................................................................... 1
ES.1. Introduction and Background ................................................................... 1
ES.2. Methodology.............................................................................................. 2
ES.3. Results ........................................................................................................ 3
ES.4. Conclusions ................................................................................................ 6
1 Introduction .............................................................................................. 10
1.1 Background of Study .............................................................................. 10
1.2 General Study Approach........................................................................ 12
1.3 Analysis Overview .................................................................................. 12
1.4 NEM in New York ................................................................................... 13
1.4.1 What is NEM? ........................................................................ 14
1.4.2 Evolution of NEM .................................................................. 14
1.4.3 How NEM Works ................................................................... 14
1.4.4 NEM Eligible Technologies .................................................... 15
1.5 Context for NEM and Supporting Programs ......................................... 19
1.5.1 NY-Sun Program .................................................................... 19
1.5.2 New York State Energy Plan .................................................. 20
2 Methodology ............................................................................................ 23
2.1 Analysis................................................................................................... 23
2.1.1 Literature Review .................................................................. 24
2.1.2 Cost Effectiveness Perspectives ............................................ 27

2.1.3 Value of Solar Analysis .......................................................... 29
2.1.4 Costs and Benefits Evaluated ................................................ 30
2.2 Income Analysis of Residential NEM Customers .................................. 37
3 Results ...................................................................................................... 38
3.1 Current New York NEM Installations .................................................... 38
3.2 Solar PV Block Assumptions .................................................................. 40
3.3 Scenario Assumptions ........................................................................... 40
3.4 Results .................................................................................................... 42
3.4.1 ‘Value of Solar’ Results .......................................................... 42
3.4.2 Benefit-Cost Analysis Results ................................................ 51
3.5 Residential NEM Income Analysis Results ............................................ 62
3.6 Public Purpose Charges and Cost of Service Discussion ....................... 66
3.7 Non-Solar PV NEM Results .................................................................... 66
4 Conclusions ............................................................................................... 70
Figure 1: Example of NEM Stakeholders .................................................................. 11
Figure 2: Dimensions of Analysis .............................................................................. 13
Figure 3: How Net Metering Works ......................................................................... 15
Figure 4: Technologies Eligible for NEM in New York .............................................. 17
Figure 5: Historical NEM Caps by Utility vs. Currently Installed Capacity of NEM
Systems as of September 2015 ................................................................................ 18
Figure 6: Historical NEM Caps by Utility vs. Currently Installed and Pipeline
Capacity of NEM Systems as of September 2015 .................................................... 18
Figure 7: ConEd Residential Block Structure ............................................................ 20

Figure 8: New York Market and Regulatory Reform Timeline ................................ 21
Figure 9: REV Initiative Transition ............................................................................ 22
Figure 10: Multiple Perspectives Should be Examined when Constructing a
Benefit-Cost Analysis ................................................................................................ 24
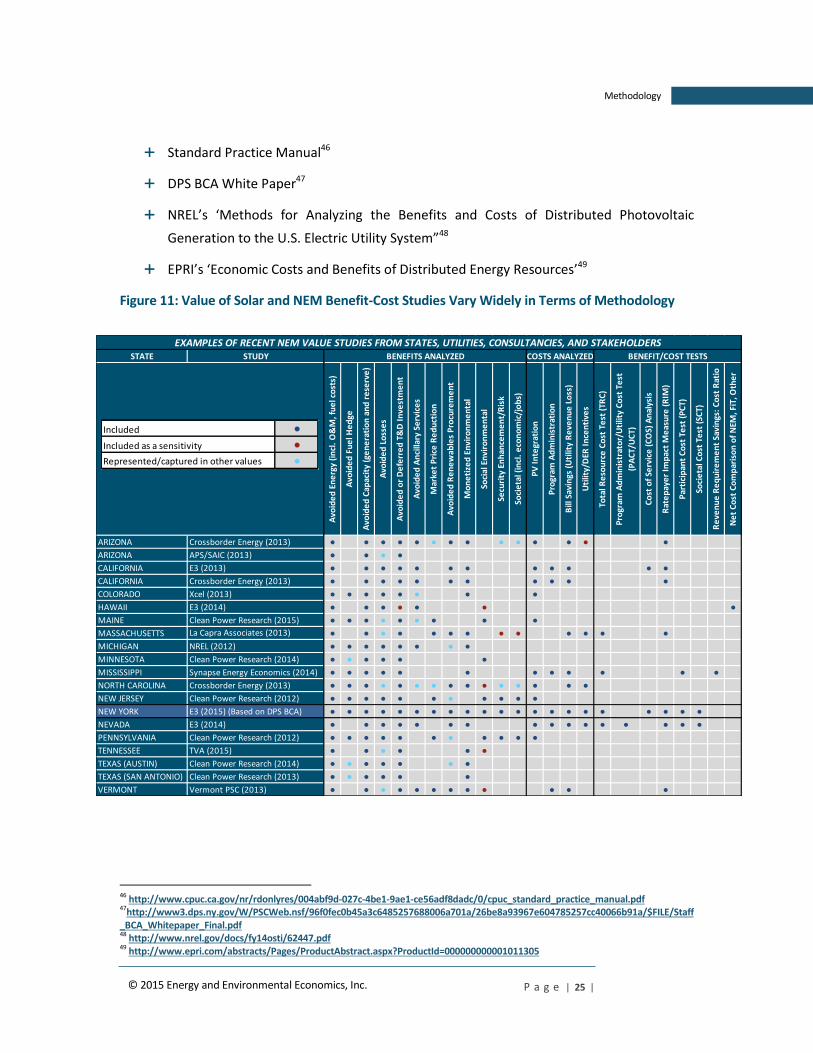
Figure 11: Value of Solar and NEM Benefit-Cost Studies Vary Widely in Terms of
Methodology ............................................................................................................. 25
Figure 12: Value of Solar and NEM Benefit-Cost Studies Vary Widely in Terms of
Results based on Methodology, Jurisdiction, and Study Sponsors* ....................... 26
Figure 13: Benefit and Cost Components of the Standard ‘Cost Tests’ .................. 28
Figure 14: Cost Test Result Interpretations ............................................................. 29
Figure 15: The Benefits, Costs, and Perspectives Examined in this BCA ................. 31
Figure 16: Detailed Description of the NEM Financial Benefit-Cost Components . 32
Figure 17: Detailed Description of the NEM Non-financial Benefit-Cost
Components .............................................................................................................. 34
Figure 18: Cumulative Residential Solar PV Installations by NYISO Zone in 2013 vs.
2015 ........................................................................................................................... 38
Figure 19: Cumulative Solar PV Installations in 2015 by NYISO Zone (Residential vs.
Non-Residential) ....................................................................................................... 39
Figure 20: Solar PV Installations either Currently Installed or Installations that have
Applied for MW Block Incentives and are in the Queue to be Built ....................... 39
Figure 21: Proposed Buildup Based on MW Block Targets with Upstate Targets
Allocated to Each Utility Based on Existing Distribution of Solar PV Installations . 40
Figure 22: High Level Scenario Descriptions ............................................................ 41
Figure 23: Summary of Scenario Input Assumptions .............................................. 42

Figure 24: ‘Value of Solar’, Untargeted NEM Scenario, Statewide, All Classes, Solar
PV............................................................................................................................... 43
Figure 25: ‘Value of Solar’, Targeted NEM Scenario, Statewide, All Classes, Solar PV
................................................................................................................................... 43
Figure 26: Levelized Value of Solar and NEM Benefit-Cost Studies Including
Untargeted NEM or ‘Business as Usual’ Scenario Results Including Both Financial
and Non-Financial Benefits ....................................................................................... 44
Figure 27: Levelized Value of Solar and NEM Benefit-Cost Studies Including
Targeted NEM Scenario Results Including Both Direct and Non-Financial Benefits
................................................................................................................................... 45
Figure 28: Layered ‘Value of Solar’ Perspective of NEM Ratepayer Expense vs.
Total Financial and Non-Financial Benefits, Lower NEM Value Scenario, 2015
Vintage, Statewide, All Classes, Solar PV ................................................................. 46
Figure 29: Layered ‘Value of Solar’ Perspective of NEM Ratepayer Expense vs.
Total Financial and Non-Financial Benefits, Untargeted NEM Scenario, 2015
Vintage, Statewide, All Classes, Solar PV ................................................................. 47
Figure 30: Layered ‘Value of Solar’ Perspective of NEM Ratepayer Expense vs.
Total Financial and Non-Financial Benefits, Targeted NEM Scenario, 2015 Vintage,
Statewide, All Classes, Solar PV ................................................................................ 47
Figure 31: Layered ‘Value of Solar’ Perspective of NEM Ratepayer Expense vs.
Total Financial and Non-Financial Benefits, Higher NEM Value Scenario, 2015
Vintage, Statewide, All Classes, Solar PV ................................................................. 48

Figure 32: Layered ‘Value of Solar’ Perspective of NEM Ratepayer Expense vs.
Total Financial and Non-Financial Benefits, Upstate Utilities-Untargeted NEM
Scenario, 2015 Vintage, All Classes, Solar PV .......................................................... 49
Figure 33: Layered ‘Value of Solar’ Perspective of NEM Ratepayer Expense vs.
Total Financial and Non-Financial Benefits, Downstate Utilities-Untargeted NEM
Scenario, 2015 Vintage, All Classes, Solar PV .......................................................... 49
Figure 34: Layered ‘Value of Solar’ Perspective of NEM Ratepayer Expense vs.
Total Financial and Non-Financial Benefits, Non-Residential Class -Untargeted
NEM Scenario, 2015 Vintage, Statewide, All Classes, Solar PV ............................... 50
Figure 35: Layered ‘Value of Solar’ Perspective of NEM Ratepayer Expense vs.
Total Financial and Non-Financial Benefits, Residential Class-Untargeted NEM
Scenario, 2015 Vintage, Statewide, All Classes, Solar PV ........................................ 51
Figure 36: Levelized Costs and Benefits, Lower NEM Value Scenario, 2015 Vintage,
Statewide, All Classes, Solar PV ................................................................................ 52
Figure 37: Levelized Costs and Benefits, Untargeted NEM Scenario, 2015 Vintage,
Statewide, All Classes, Solar PV ................................................................................ 53
Figure 38: Levelized Costs and Benefits, Targeted NEM Scenario, 2015 Vintage,
Statewide, All Classes, Solar PV ................................................................................ 53
Figure 39: Levelized Costs and Benefits, Higher NEM Value Scenario, 2015 Vintage,
Statewide, All Classes, Solar PV ................................................................................ 54
Figure 40: Levelized Costs and Benefits Comparison for Downstate vs. Upstate
Utilities, Untargeted NEM Scenario, 2015 Vintage, All Classes, Solar PV ............... 55
Figure 41: Levelized Costs and Benefits Comparison for Downstate vs. Upstate
Utilities, Targeted NEM Scenario, 2015 Vintage, All Classes, Solar PV ................... 56
Figure 42: Levelized Costs and Benefits Comparison for 2015 vs. 2025 Vintages,
Untargeted NEM Scenario, Statewide, All Classes, Solar PV ................................... 57
Figure 43: Levelized Costs and Benefits Comparison for 2015 vs. 2025 Vintages,
Targeted NEM Scenario, Statewide, All Classes, Solar PV ....................................... 58
Figure 44: Levelized Costs and Benefits, Residential Class, Untargeted NEM
Scenario, 2015 Vintage, Statewide, Solar PV ........................................................... 59
Figure 45: Levelized Costs and Benefits, Small Non-Residential Class, Untargeted
NEM Scenario, 2015 Vintage, Statewide, Solar PV .................................................. 59
Figure 46: Levelized Costs and Benefits, Large Non-Residential Class, Untargeted
NEM Scenario, 2015 Vintage, Statewide, Solar PV .................................................. 60
Figure 47: All-Generation vs. Export-Only Ratepayer Impact Measure Results,
Untargeted NEM Scenario, Statewide, All Classes, 2015 Vintage, Solar PV ........... 61
Figure 48: Ratepayer Impact Measure Benefit-Cost Ratio by Scenario and
Customer Class, Statewide, 2015 Vintage, Solar PV ................................................ 62
Figure 49: Residential Monthly Bill Impact, 500 MW of Statewide Solar PV, 2015
Vintage ...................................................................................................................... 62
Figure 50. Evolution of Household Income of NEM Customers Compared to NY
Average Median Income .......................................................................................... 63
Figure 51. Dotted Line Represents NEM Customer Average Median Income
without Long Island Customers ................................................................................ 64
Figure 52: Household Income by NYISO Zone ......................................................... 64
Figure 53. Cumulative Residential Solar PV Installations in 2015 by NYISO Zone .. 65
Figure 54: Heat Map of Income Distribution of Residential Solar PV Adopters ..... 65
Figure 55: Residential NEM Customer Demographic Information ......................... 66

Figure 56: Levelized Costs and Benefits, Untargeted NEM Scenario, 2015 Vintage,
Statewide, All Classes, Wind ..................................................................................... 67
Figure 57: Levelized Costs and Benefits, Untargeted NEM Scenario, 2015 Vintage,
Statewide, All Classes, Small Hydro.......................................................................... 68
Figure 58: Levelized Costs and Benefits, Untargeted NEM Scenario, 2015 Vintage,
Statewide, All Classes, Anaerobic Digester Gas ....................................................... 68
Figure 59: Levelized Costs and Benefits, Untargeted NEM Scenario, 2015 Vintage,
Statewide, All Classes, Micro Combined Heat and Power (<10 kW Residential) ... 69

P a g e | 1 |
Executive Summary
© 2015 Energy and Environmental Economics, Inc.
Executive Summary
ES.1. Introduction and Background
Energy and Environmental Economics, Inc. (E3 or “we”) was retained by the New York State
Energy and Research Development Authority (NYSERDA) to perform a study on the behalf of the
Department of Public Service (DPS) in response to specific New York state legislation.1 This
study performs the following tasks as outlined by that legislation:
“Analyze the economic and environmental benefits2 from and the economic cost
burden, if any, of the net energy metering program.”
“Analyze the extent to which ratepayers receiving service under the net energy
metering program are paying the full cost of services provided to them by combined
electric and gas corporations and gas corporations, and the extent to which their
customers pay a share of costs of public purpose programs through assessments on
their electric and/or gas bills.”
“The study shall also quantify the economic costs and benefits of net energy metering to
participants and non-participants and shall further disaggregate the results by utility.”
“The study shall also gather and present data on the income distribution of residential
net metering participants that is publicly available and aggregated by zip code and
county.”
1 See the study Appendix or http://open.nysenate.gov/legislation/bill/S5149A-2013 2 The legislation specifically states that “As it relates to the environmental benefits, the study shall quantify the approximate avoided level of harmful emissions including, but not limited to, information concerning: nitrogen dioxide, sulfur dioxide and carbon dioxide, as well as other air pollutants deemed necessary and appropriate for study by the commission.”

P a g e | 2 |
Executive Summary
© 2015 Energy and Environmental Economics, Inc.
ES.2. Methodology
E3 in consultation with a project management team made up of relevant staff at NYSERDA and
DPS made several assumptions and analytical methodology choices in order to perform the
specific tasks called for in the legislation. One of the major choices was to examine and analyze
the current net metering policy without explicitly addressing community solar or remote net
metering. These policies were in flux during the period that this study was being performed3.
Another major choice was to focus the study on the benefits and costs of distributed solar
photovoltaics (PV) as this technology constitutes the vast majority of net energy metered
(NEM4) technologies currently installed, which is a trend that is expected to continue. That
being said, the benefits and costs of other NEM-eligible technologies are also examined in this
study and those results are presented.
An appropriate range of benefits and costs for net metered systems in New York is constructed
and analyzed for all utilities5 and three customer class groupings (residential, small non-
residential, and large non-residential). This analysis is performed from multiple perspectives
(i.e., participating NEM and non-participating ratepayers plus society) both now and in the
future consistent with industry standard practices and the DPS Benefit-Cost Analysis (BCA)
White Paper for evaluating distributed energy resource (DER) cost-effectiveness.6 The
methodology and analysis presented in this study are also compared to a number of other NEM
or ‘value of solar’ studies nationwide for contextual purposes.
Further, it is worth noting that there are a number of uncertainties inherent in any assumption-
driven and forward-looking analysis such as this and other similar types of studies that should be
3 We do acknowledge that community solar and remote net metering can result in lower cost installations, which may result in lower total resource costs as compared to the benefits it offers to participants and society. This may result in this analysis being conservative with all else being equal if we are not fully capturing this effect. We also acknowledge that community net metering and remote net metering could accelerate adoption among certain customer segments so the market should be monitored for impact. Further, we do not address the Reforming the Energy Vision (REV) Proceeding which is ongoing and may result in changes to the current net metering policy and structure. 4 When we refer to ‘NEM’ throughout this study such as “NEM installations” or “NEM generation” we mean net metered solar PV installations or generation unless otherwise explicitly stated. 5 These are the six investor owned utilities in New York: Consolidated Edison Company of New York (ConEd), National Grid (Nat Grid or NiMo), New York State Electric and Gas (NYSEG), Rochester Gas and Electric (RG&E), Orange and Rockland Utilities (ORU), and Central Hudson Gas and Electric (CHG&E or Central Hudson) plus PSEG Long Island (LIPA). 6http://www3.dps.ny.gov/W/PSCWeb.nsf/96f0fec0b45a3c6485257688006a701a/26be8a93967e604785257cc40066b91a/$FILE/Staff_BCA_Whitepaper_Final.pdf

P a g e | 3 |
Executive Summary
© 2015 Energy and Environmental Economics, Inc.
considered. Some of these uncertainties are captured in four predefined study scenarios:7 a
“business-as-usual” case (‘Untargeted NEM’), a case where resources are potentially sited at
higher value locations on the distribution grid (without assuming any change to the current net
metering policy) (‘Targeted NEM’), and two bookend cases showing a lower (‘Lower NEM Value’)
and higher value (‘Higher NEM Value’) of net metered systems due to changes in various
assumptions.
Lastly, not only is there uncertainty with regards to the quantified benefits and costs of New
York’s net metering policy both now and over time, it is important to note that the policy itself
may change and evolve, i.e., see the Reforming the Energy Vision (REV) Track 2 White Paper8
and the recent October 15, 2015 Order issued by the New York Public Service Commission
(PSC).9 It is premature, however, at this point to make assumptions about the outcome of the
REV regulatory process with regards to net metering as it is still an ongoing proceeding.
ES.3. Results
As part of this study, we determine that the vast majority of NEM systems installed in New York
are distributed solar PV systems. From this perspective we believe that the NEM policy has
been successful in encouraging a significant number of New York electric customers to invest in
NEM installations, which are expected to grow to at least 500 MW on a cumulative statewide
basis by the end of 2015.10
The results11 presented in this study are based on a 500 MW penetration level of net metered
solar PV systems12 allocated to specific utilities and customer classes. This assumed allocation is
7 These scenarios are meant to reflect a range of outcomes that could occur based on sensitivities to the underlying benefit-cost component assumptions, e.g. in the ‘Untargeted NEM’ and ‘Targeted NEM’ scenario future energy prices are assumed to conform to the 2015 CARIS I LBMP forecast, with these prices being +/- 10% in the ‘Higher NEM Value’ vs. ‘Lower NEM Value’ scenarios. Similarly other value components are varied across the scenarios to create a range of outcomes and potential values to reflect inherent forecast uncertainty. 8http://documents.dps.ny.gov/public/Common/ViewDoc.aspx?DocRefId=%7B48954621-2BE8-40A8-903E-41D2AD268798%7D 9http://documents.dps.ny.gov/public/Common/ViewDoc.aspx?DocRefId=%7B6D51E352-B4C8-48F9-9354-2B64B14546DC%7D 10 As of September 2015 there was approximately 340 MW of net metered generation connected to the six IOU systems in New York with another 1,050 MW proposed to be interconnected. In Long Island we estimate that approximately 155 MW were net metered through the end of September. 11 For brevity individual utility results are grouped together in this study, with utility by utility specific results presented in the Appendix.
P a g e | 4 |
Executive Summary
© 2015 Energy and Environmental Economics, Inc.
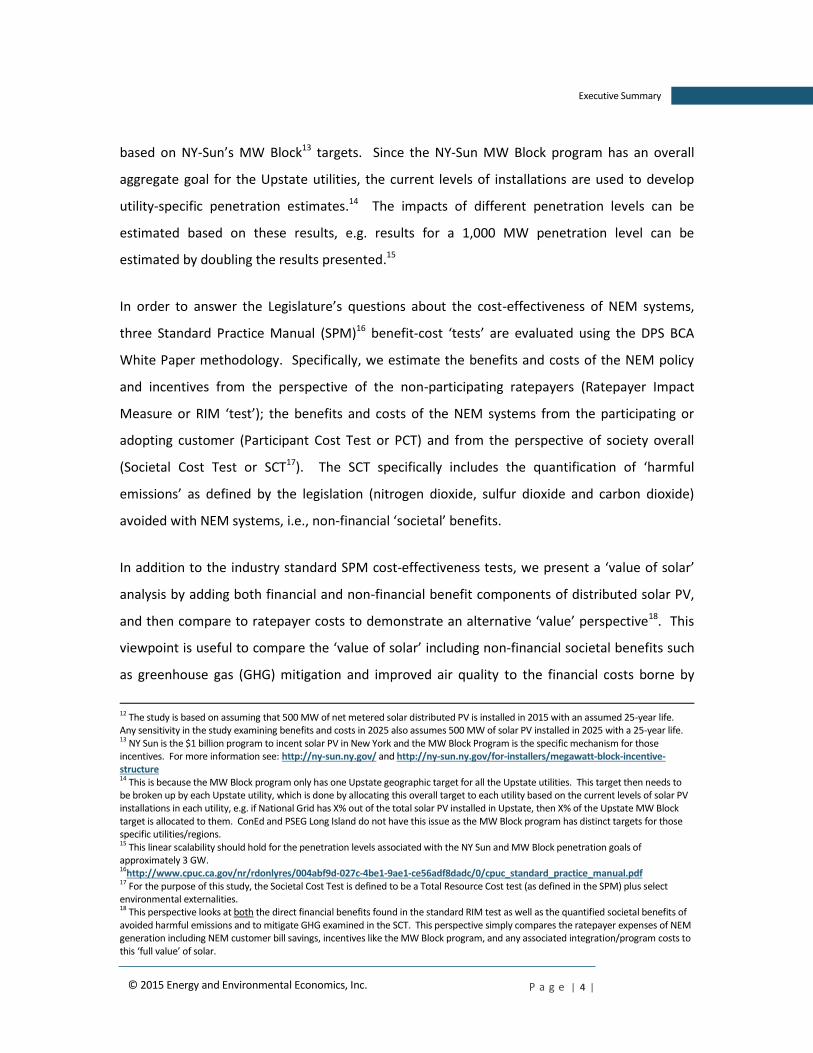
based on NY-Sun’s MW Block13 targets. Since the NY-Sun MW Block program has an overall
aggregate goal for the Upstate utilities, the current levels of installations are used to develop
utility-specific penetration estimates.14 The impacts of different penetration levels can be
estimated based on these results, e.g. results for a 1,000 MW penetration level can be
estimated by doubling the results presented.15
In order to answer the Legislature’s questions about the cost-effectiveness of NEM systems,
three Standard Practice Manual (SPM)16 benefit-cost ‘tests’ are evaluated using the DPS BCA
White Paper methodology. Specifically, we estimate the benefits and costs of the NEM policy
and incentives from the perspective of the non-participating ratepayers (Ratepayer Impact
Measure or RIM ‘test’); the benefits and costs of the NEM systems from the participating or
adopting customer (Participant Cost Test or PCT) and from the perspective of society overall
(Societal Cost Test or SCT17). The SCT specifically includes the quantification of ‘harmful
emissions’ as defined by the legislation (nitrogen dioxide, sulfur dioxide and carbon dioxide)
avoided with NEM systems, i.e., non-financial ‘societal’ benefits.
In addition to the industry standard SPM cost-effectiveness tests, we present a ‘value of solar’
analysis by adding both financial and non-financial benefit components of distributed solar PV,
and then compare to ratepayer costs to demonstrate an alternative ‘value’ perspective18. This
viewpoint is useful to compare the ‘value of solar’ including non-financial societal benefits such
as greenhouse gas (GHG) mitigation and improved air quality to the financial costs borne by
12 The study is based on assuming that 500 MW of net metered solar distributed PV is installed in 2015 with an assumed 25-year life. Any sensitivity in the study examining benefits and costs in 2025 also assumes 500 MW of solar PV installed in 2025 with a 25-year life. 13 NY Sun is the $1 billion program to incent solar PV in New York and the MW Block Program is the specific mechanism for those incentives. For more information see: http://ny-sun.ny.gov/ and http://ny-sun.ny.gov/for-installers/megawatt-block-incentive-structure 14 This is because the MW Block program only has one Upstate geographic target for all the Upstate utilities. This target then needs to be broken up by each Upstate utility, which is done by allocating this overall target to each utility based on the current levels of solar PV installations in each utility, e.g. if National Grid has X% out of the total solar PV installed in Upstate, then X% of the Upstate MW Block target is allocated to them. ConEd and PSEG Long Island do not have this issue as the MW Block program has distinct targets for those specific utilities/regions. 15 This linear scalability should hold for the penetration levels associated with the NY Sun and MW Block penetration goals of approximately 3 GW. 16http://www.cpuc.ca.gov/nr/rdonlyres/004abf9d-027c-4be1-9ae1-ce56adf8dadc/0/cpuc_standard_practice_manual.pdf 17 For the purpose of this study, the Societal Cost Test is defined to be a Total Resource Cost test (as defined in the SPM) plus select environmental externalities. 18 This perspective looks at both the direct financial benefits found in the standard RIM test as well as the quantified societal benefits of avoided harmful emissions and to mitigate GHG examined in the SCT. This perspective simply compares the ratepayer expenses of NEM generation including NEM customer bill savings, incentives like the MW Block program, and any associated integration/program costs to this ‘full value’ of solar.

P a g e | 5 |
Executive Summary
© 2015 Energy and Environmental Economics, Inc.
non-participating ratepayers. The results are presented in ranges that span our four predefined
scenarios.
Based on a 500 MW penetration level, the annual net costs19 to non-participating ratepayers for
the NEM policy20 (as it is currently structured and administered) is $38 million for the
Untargeted Case in 2015 and ranges between $10 million to $60 million in 201521 on a
statewide basis (levelized22 $0.02 to $0.10 per kWh of solar PV production). This translates to
potential estimated rate impacts in 2015 for non-participants between $0.0001 and $0.0004 per
kWh23 across the four defined scenarios we examine24 (aggregated across each utility and
customer class).
The value of distributed solar PV, i.e., the ‘value of solar’, based on direct financial benefits
ranges from $0.08 to $0.16 per kWh of assumed solar PV production on a levelized basis across
the study’s four defined scenarios. When adding in the quantified non-financial societal benefits
(these range from $0.02 to $0.07 per kWh of solar PV production) then the ‘value of solar’
ranges from $0.10 to $0.23 per kWh.
The levelized net benefits to participating ratepayers for installing NEM resources across the
four defined scenarios (averaged across each utility and customer class) are between $0.02 and
$0.03 per kWh of assumed solar PV production for systems installed in 2015.
If NEM customer installations were to be sited or ‘targeted’ to higher value locations on the
distribution grid versus being random or untargeted (i.e., current business-as-usual) then the
19 When looking at ratepayer impacts and cost-effectiveness, the net benefits to non-participating ratepayers are defined as benefits (utility avoided costs and market price effects) minus costs (NEM customer bill savings/utility lost revenues + NEM program/integration costs + MW Block Incentives). MW Block incentives are assumed to be at current levels in 2015 and zero by 2025. Net costs are defined as the opposite. 20 In 2015, the net costs to non-participating ratepayers include both the costs of the MW Block Incentive program and NEM. Both factors have an effect on rates. For the Untargeted case, if we exclude the MW Block Incentive from net costs, the net impact to non-participants in 2015 is $16 million and $0.03 per kWh of solar production. Across the 4 scenarios, the net impact to non-participants ranges from a net cost of $36 million to a net benefit of $13 million, or from a net cost of $0.06 per kWh of solar production to a net benefit of $0.02 per kWh of solar production. 21 This means only costs and benefits accrued in the single snapshot year of 2015. 22 The benefits and costs of NEM systems are levelized on a real basis assuming a 2% inflation rate over an assumed 25-year life over the entire solar kWh production associated with the assumed 500 MW of NEM installations. The actual effect on rates is much less than these levelized figures. 23 For reference electric retail rates in New York generally range between $0.10-0.25/kWh across utilities/classes so this rate impact is on the order of ~0.1% to ~0.5% assuming the New York State overall average retail rate is $0.185/kWh. 24 From the highest NEM value to lowest NEM value scenarios.
P a g e | 6 |
Executive Summary
© 2015 Energy and Environmental Economics, Inc.
net costs of NEM (as it is currently structured and administered) to non-participating ratepayers
in 2015 would be lower by $16 million ($22 million ‘targeted’ net costs vs. $38 million
‘untargeted’ net costs) in 2015 (levelized $0.04 vs. $0.07 per kWh of assumed solar PV
production).
The societal perspective shows that NEM systems installed in 2015 result in either net costs or
net benefits depending on the scenario. There are net costs25 over the life26 of these systems
(benefits being 27% to 5% less than the costs) in the ‘Lower NEM Value’ and ‘Untargeted NEM’
scenarios. In the ‘Targeted NEM’ and ‘Higher NEM Value’ scenarios there is a net benefit to
society that ranges from the benefits being 6% to 27% greater than the costs. Based on forecast
trends in NEM installation costs and NEM value over time it is expected that the societal net
benefits of NEM installations will increase over time.
Lastly, our analysis of income demographics indicates that those residential customers in New
York that have installed NEM systems have higher annual median household incomes on
average (approximately $80,000 per year) than the median New Yorker (approximately $60,000
per year) based on census tract data. This difference is primarily driven by the higher incomes
of NEM adopter census tracts in Downstate vs. Upstate locations, as well as a large recent uptick
in adoptions by customers in Long Island, who generally have higher than statewide average
incomes; and the inability of renter households, who may have lower than average incomes, to
participate in NEM prior to the introduction of the community distributed generation program
in late 2015.
ES.4. Conclusions
A range of reasonable input assumptions and results affect the cost-effectiveness of net
metered resources. There are also significant differences in results across utilities, the NEM
25When looking at societal impacts and cost-effectiveness, the net benefits to society are defined as benefits (utility avoided costs + federal incentives + societal environmental benefits (SO2, Nox, and CO2 impacts)) minus costs (NEM resource costs + program/integration costs). Net costs are defined as the opposite. 26 Assumed to be 25-years, this is the levelization period.

P a g e | 7 |
Executive Summary
© 2015 Energy and Environmental Economics, Inc.
installation vintage,27 the customer class, and other key inputs that are captured in the four
defined scenarios used in the study. However, several key conclusions can be reached, which
are as follows:
Conclusion 1: NEM is a key component of the policy to encourage distributed renewable
generation in New York, most especially solar PV. However, while NEM offers a simple and
understandable tool for consumers, it is an imprecise instrument with no differentiation in
pricing for either higher or lower locational values or higher or lower value technology
performance (e.g. peak coincident energy production). The costs and benefits of NEM should be
monitored given the fast evolution of this market as contemplated in the recent PSC October 15,
2015 Order.28
Conclusion 2: After installing a NEM system, a customer experiences electric bill savings due to
reduced consumption, which means the utility is receiving less revenue from that customer
including reduced revenues for public purpose programs.29
Conclusion 3: The results from cost-effectiveness analysis estimate how much non-participating
customers may be paying to enable 500 MW of NEM achievements. Direct financial net costs
are borne by non-participating ratepayers across most scenarios and most years of the analysis,
especially in the residential customer classes. This analysis shows that potential rate impacts in
2015 for non-participants range between $0.0001 and $0.0004 per kWh across the four defined
scenarios (aggregated across each utility and customer class). Unless forecasted NEM adoptions
increase much more than expected (i.e., based on the current NY-Sun policy goals), the direct
27 This refers to the year the NEM systems are installed. It is expected that NEM system costs will decline over time. 28 http://documents.dps.ny.gov/public/Common/ViewDoc.aspx?DocRefId=%7B6D51E352-B4C8-48F9-9354-2B64B14546DC%7D 29 These public purpose charges range between $0.007 and $0.009 per kWh (or about $4 to $5 per month for the typical New York residential customer) and exist, largely, to reduce the pollution caused by electricity consumption and generation. These charges are collected on a per kWh basis since these program costs and benefits are caused by kWh consumption and production. NEM customers who now consume less kWh compared to non-NEM customers therefore lower their payment on these charges on a kWh per kWh basis, i.e., every kWh they generate, they avoid paying $0.007 to $0.009 per kWh. Alternatively every kWh NEM customers generate is one kWh that does not produce the harmful emissions. This prevention of harmful emissions is one of the reasons these programs were created.

P a g e | 8 |
Executive Summary
© 2015 Energy and Environmental Economics, Inc.
financial net costs of the NEM program will remain relatively modest from a statewide
perspective, i.e., result in less than an approximately 0.3% annual rate impact in 2015.
Conclusion 4: In some cases the non-financial societal benefits of NEM systems, i.e., GHG
mitigation and improved air quality, when added to the financial benefits, may be greater than
the direct financial costs of NEM.
Conclusion 5: Depending on the underlying rate design of a NEM customer and their specific
consumption pattern, there will be variations around whether an individual customer was
underpaying or overpaying its utility cost of service before and after installing a NEM system,
which may result in that customer paying less than its cost of service30.
Conclusion 6: For NEM systems installed in 2015, there is a net cost to society (financial and
non-financial benefits are approximately 5% less than costs) over the lifetime of these systems
in the baseline scenario. However, with a reasonable assumption of forecasted capital cost
declines and increases in benefits it was found that there is a net benefit to society for NEM
systems installed in 2025 over the lifetime of these systems (financial and non-financial benefits
are approximately 25% higher than costs). If NEM systems can be targeted to higher value
locations on the distribution grid, then there is a net benefit to society for both systems installed
in 2015 (financial and non-financial benefits higher than costs by 6%) as well as in 2025 (financial
and non-financial benefits higher than costs by 43%).
Conclusion 7: Current NEM customers tend to have higher incomes than average statewide
customers, although not necessarily higher incomes than households in their immediate
geographic regions (e.g. Long Island). Furthermore, NEM customers live in census tracts with
slightly more expensive houses, a slightly older population, a younger housing infrastructure, a
higher fraction of owner-occupied housing, and in much denser areas than the State’s overall
average.
30 Rate design for customers varies significantly by utility and by type of customer class. Generally speaking, residential customer retail rates are designed to recover the utility’s cost to serve that class based on average usage and consumption, with over 90% of all variable and fixed costs collected volumetrically on a per kWh basis. However, many customers are not average and by definition any below average or above average customer may not pay the actual cost the utility incurs to serve that specific type of customer. These considerations are inherent and accepted in utility ratemaking.

P a g e | 9 |
Executive Summary
© 2015 Energy and Environmental Economics, Inc.
It is expected that New York’s new community distributed generation program should help
address the disproportionate participation of home-owners and single-family homes in the NEM
program, which should make solar more accessible to more New Yorkers.

P a g e | 10 |
Introduction
© 2015 Energy and Environmental Economics, Inc.
1 Introduction
1.1 Background of Study
On December 17, 2014, Governor Andrew Cuomo signed into law Chapter 510 of the Laws of
2014, which directed New York’s Department of Public Service (DPS) to conduct a “net metering
study” to perform the following tasks:
“Analyze the economic and environmental benefits31 from and the economic cost
burden, if any, of the net energy metering program.”
“Analyze the extent to which ratepayers receiving service under the net energy
metering program are paying the full cost of services provided to them by combined
electric and gas corporations and gas corporations, and the extent to which their
customers pay a share of costs of public purpose programs through assessments on
their electric and/or gas bills.”
“The study shall also quantify the economic costs and benefits of net energy metering to
participants and non-participants and shall further disaggregate the results by utility.”
“The study shall also gather and present data on the income distribution of residential
net metering participants that is publicly available and aggregated by zip code and
county.”
Energy and Environmental Economics, Inc. (E3 or “we”) was retained by the New York State
Energy Research and Development Authority (NYSERDA) to conduct this study on the behalf of
DPS. A project management team consisting of key members of NYSERDA and DPS staff was
formed and consulted with regarding the methodology, analysis approach, and results
throughout the entire study process.
31 The legislation specifically states that “As it relates to the environmental benefits, the study shall quantify the approximate avoided level of harmful emissions including, but not limited to, information concerning: nitrogen dioxide, sulfur dioxide and carbon dioxide, as well as other air pollutants deemed necessary and appropriate for study by the commission.”

P a g e | 11 |
Introduction
© 2015 Energy and Environmental Economics, Inc.
This study looks at a range of possible future outcomes in four defined scenarios32 to reflect the
uncertainty inherent in each of the projected benefit and cost components of net metered
resources. This study also looks at the stand alone ‘value of solar’ perspective from both a
direct financial benefits standpoint and a standpoint that includes the non-financial
environmental benefits of greenhouse gas (GHG) mitigation and improved air quality.
It is important to note that the net energy metering (NEM33) policy is a program designed to
encourage distributed energy resources. Further, the NEM issue is a complex one, given its
overall success in encouraging distributed energy resources and the wide number of different
stakeholders it impacts. There are a number of different stakeholders in the net metering
context, some of which may have different and even opposing viewpoints and concerns.
Figure 1: Example of NEM Stakeholders
32 These scenarios are meant to reflect a range of outcomes that could occur based on sensitivities to the underlying benefit-cost component assumptions, e.g. in the ‘Untargeted NEM’ and ‘Targeted NEM’ scenario future energy prices are assumed to conform to the 2015 CARIS I LBMP forecast, with these prices being +/- 10% in the ‘Higher NEM Value’ vs. ‘Lower NEM Value’ scenarios. Similarly other value components are varied across the scenarios to create a range of outcomes and potential values to reflect inherent forecast uncertainty. 33 When we refer to ‘NEM’ throughout this study such as “NEM installations” or “NEM generation” we mean net metered solar PV installations or generation unless otherwise explicitly stated.

P a g e | 12 |
Introduction
© 2015 Energy and Environmental Economics, Inc.
1.2 General Study Approach
1.3 Analysis Overview
The table below summarizes the analysis approach used in this study highlighting the key
dimensions and major assumptions analyzed.
Study Goals Chapter 510
•Define framework to answer the questions in Chapter 510, using an industry standard approach consistent with the DPS BCA White Paper and other national studies, to evaluate New York's existing NEM policy.
•Consult with Project Management Team throughout the study process.
Benefit-Cost Analysis
•Complete benefit cost analysis of the NEM policy key perspectives: participating ratepayers, non-participating ratepayers, and society.
Other Analyses
•Complete an analysis of the household income distribution of residential net metering customers using census tract data and compare to New York median household income overall.
•Examine the 'value of solar' (both financial and non-financial societal benefits).
Results
•Summarize the overall results for existing NEM customers, and highlight differences across key dimensions including time. Use specific differences between customer classes, utilities, and scenarios to highlight key insights.
Conclusions
•Draw several high-level generall conclusions regarding the study results and answer key questions enumerated by the legislation.

P a g e | 13 |
Introduction
© 2015 Energy and Environmental Economics, Inc.
Figure 2: Dimensions of Analysis
Dimension Overview
Location Each of the seven (7) New York utilities34 (6 investor
owned utilities and PSEG Long Island)
Timeframe Specific years of 2015 vs. 2025
Lifetime of NEM installations (25-years)
Customer Type
Residential
Small Non-Residential
Large Non-Residential
Scenarios
Lower NEM Value
Untargeted NEM
Targeted NEM
Higher NEM Value
Adoption Levels
Estimated 2015 solar PV installations
All other NEM technologies and analyses reported on a per kWh of assumed NEM generation basis
NEM Generation All generation or total production
Export-only (generation not consumed on-site)
Perspective ‘Value of Solar’ examination
Income Analysis Income demographic analysis of residential customers
Standard Practice Cost Tests
Participant Cost Test (PCT)
Ratepayer Impact Measure (RIM)
Societal Cost Test (SCT)
1.4 NEM in New York
34 These are the six investor owned utilities in New York: Consolidated Edison Company of New York (ConEd), National Grid (NiMo), New York State Electric and Gas (NYSEG), Rochester Gas and Electric (RG&E), Orange and Rockland Utilities (ORU), and Central Hudson Gas and Electric (CHG&E or Central Hudson) plus PSEG Long Island (LIPA).

P a g e | 14 |
Introduction
© 2015 Energy and Environmental Economics, Inc.
1.4.1 WHAT IS NEM?
In a conventional NEM situation in New York a customer-sited renewable energy system is
connected to the utility grid through a customer’s utility meter. This is known as “behind-the-
meter (BTM) generation.” At any given moment, if the site is using more electricity than the
BTM system is producing, all the electricity produced by the system is used on-site and the site’s
electricity needs are supplemented from the grid. If the site is using less electricity than the
system is producing, the excess electricity is exported to the grid and the customer receives a
credit35.
1.4.2 EVOLUTION OF NEM
NEM is working to encourage ’market transformation’ in New York and grow distributed
renewable generation like solar, but it is an imprecise tool tied to the retail rate that does not
compensate for actual value delivered to the electric grid and/or society, which can vary by
location and/or type of NEM technology performance.
1.4.3 HOW NEM WORKS
35 This credit is generally based on the volumetric or “variable” electric retail rate of the customer, i.e., it does not include any charges that are fixed and do not vary with per kilowatt-hour (kWh) usage. This credit is typically recorded as negative use and is commonly referred to as “spinning the meter backwards.” At the end of the billing cycle, the grid-supplied electricity and the credits for any exported electricity are reconciled, and any surplus credits can be carried forward to the next billing cycle. For commercial and industrial accounts in New York, overages are monetized to allow application against non-volumetric charges and then carried forward indefinitely on a kWh basis. Residential and small commercial accounts are maintained as kWh credits and annually, “cashed out” at a utility’s existing “avoided cost” rates for residential accounts. The specifics of net energy metering are dependent on the customer’s service classification as well as each utility’s specific tariff.
P a g e | 15 |
Introduction
© 2015 Energy and Environmental Economics, Inc.
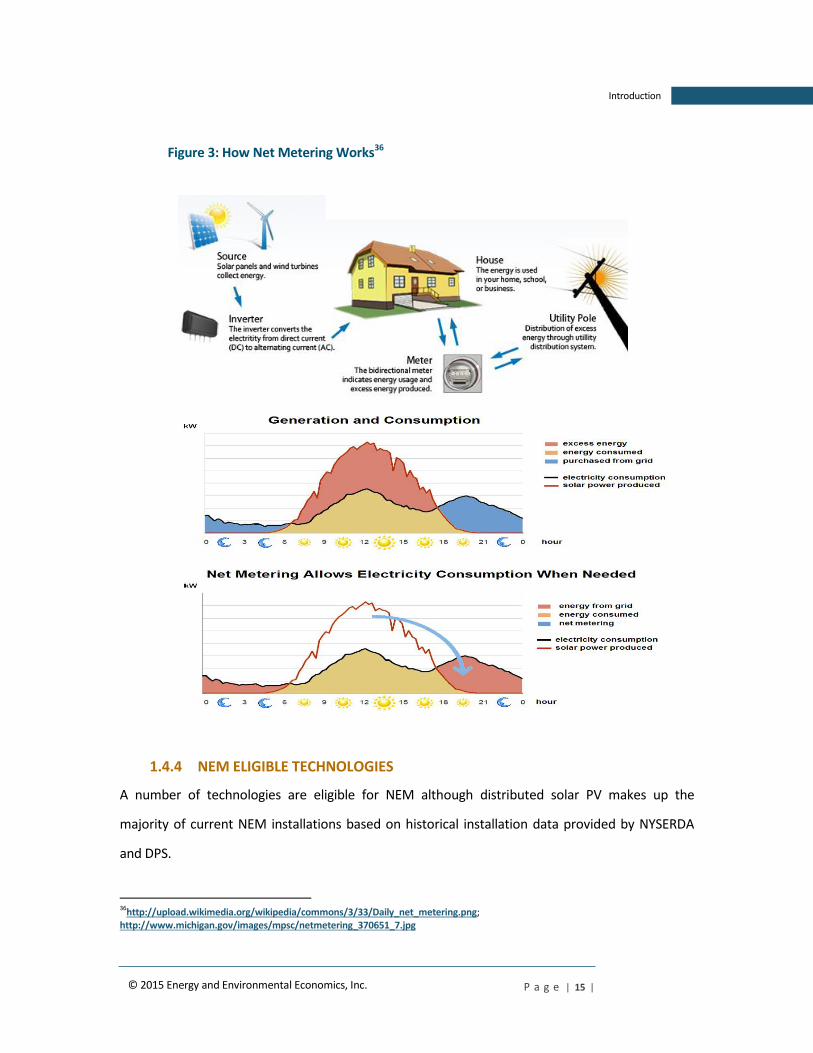
Figure 3: How Net Metering Works36
1.4.4 NEM ELIGIBLE TECHNOLOGIES
A number of technologies are eligible for NEM although distributed solar PV makes up the
majority of current NEM installations based on historical installation data provided by NYSERDA
and DPS.
36http://upload.wikimedia.org/wikipedia/commons/3/33/Daily_net_metering.png; http://www.michigan.gov/images/mpsc/netmetering_370651_7.jpg

P a g e | 16 |
Introduction
© 2015 Energy and Environmental Economics, Inc.
It is important to note that there has been a large increase in NEM eligible installations and for
certain utilities the historical net metering limits may be reached shortly. In fact for certain utilities
the amount of NEM eligible installations in the interconnection queue, i.e., pipeline, exceeds the
historical NEM limits or caps. The New York Public Service Commission (PSC) issued an Order on
October 15, 201537 suspending the historical NEM caps on an interim basis until a valuation for
distributed energy resources is complete as part of the Reforming the Energy (REV) Proceeding38.
37 http://documents.dps.ny.gov/public/Common/ViewDoc.aspx?DocRefId=%7B6D51E352-B4C8-48F9-9354-2B64B14546DC%7D 38 http://www3.dps.ny.gov/W/PSCWeb.nsf/All/CC4F2EFA3A23551585257DEA007DCFE2?OpenDocument

P a g e | 17 |
Introduction
© 2015 Energy and Environmental Economics, Inc.
Figure 4: Technologies Eligible for NEM in New York39
Overview
Eligible Renewable/Other Technologies:
Solar Photovoltaics, Wind (All), Biomass, Combined Heat & Power, Fuel Cells using Non-Renewable Fuels, Wind (Small), Hydroelectric (Small), Anaerobic Digestion, Fuel Cells using Renewable Fuels, Microturbines
Applicable Sectors: Commercial, Industrial, Local Government, Nonprofit, Residential, Schools, State Government, Federal Government, Agricultural, Institutional
NEM System Capacity Limit:
Solar: 25 kW for residential; 100 kW for farms; 2 MW for non-residential
Wind: 25 kW for residential; 500 kW for farm-based; 2 MW for non-residential
Micro-hydroelectric: 25 kW for residential; 2 MW for non-residential
Fuel Cells: 10 kW for residential; 1.5 MW for non-residential
Biogas: 1 MW (farm-based only)
Micro-Combined Heat and Power (CHP): 10 kW (residential only)
Aggregate NEM Capacity Limit:
(Limits are Currently Floating)
6% of utility's 2005 demand for solar, farm-based biogas, fuel cells, micro-hydroelectric, and residential micro-CHP
0.3% of utility's 2005 demand for wind
Net Excess Generation:
Generally credited to customer's next bill at retail rate (except avoided-cost rate for micro-CHP and fuel cells); excess for residential PV and wind and farm-based biogas is reconciled annually at avoided-cost rate; excess for micro-hydro, non-residential wind and solar, and residential micro-CHP and fuel cells carries over indefinitely
Ownership of Renewable Energy Credits:
Not addressed
Meter Aggregation or Remote Net Metering:
Allowed for non-residential and farm-based customers with solar, wind, farm-based biogas, and micro-hydroelectric systems
39 http://programs.dsireusa.org/system/program/detail/453

P a g e | 18 |
Introduction
© 2015 Energy and Environmental Economics, Inc.
Figure 5: Historical NEM Caps by Utility vs. Currently Installed Capacity of NEM Systems as of September 2015
Figure 6: Historical NEM Caps by Utility vs. Currently Installed and Pipeline Capacity of NEM Systems as of September 2015
0% 10% 20% 30% 40% 50% 60%
ORU
CHG&E
RG&E
NYSEG
PSEG Long Island*
National Grid
ConEd
Statewide
% of NEM Cap Filled (Solar PV & Non-Wind) % of NEM Cap Filled (Small Wind)
*The solar PV & non-wind NEM cap for PSEG Long Island is 3% of 2005 utility peak demand vs. 6% for the other NY utilities. The small wind NEM cap is 0.3% of 2005 peak demand for all utilities. Note, there is no reported data on the amount of net metered small wind for PSEG Long Island.
0% 25% 50% 75% 100% 125% 150% 175% 200%
ORU
CHG&E
RG&E
NYSEG
PSEG Long Island*
National Grid
ConEd
Statewide
% of NEM Cap Filled (Solar PV & Non-Wind) % of NEM Cap Filled (Small Wind)
*The solar PV & non-wind NEM cap for PSEG Long Island is 3% of 2005 utility peak demand vs. 6% for the other NY utilities. The small wind NEM cap is 0.3% of 2005 peak demand for all utilities. Note, there is no reported data on the amount of net metered small wind for PSEG Long Island.

P a g e | 19 |
Introduction
© 2015 Energy and Environmental Economics, Inc.
1.5 Context for NEM and Supporting Programs
1.5.1 NY-SUN PROGRAM
Governor Andrew Cuomo launched the New York Sun (NY-Sun) Initiative during his 2012 State of
the State Address. In 2014, Governor Cuomo announced $1 billion in investment in the NY-Sun
initiative, concomitant with a goal of adding more than 3,000 megawatts (MW) of solar capacity
in the State by 2023. This initiative consolidates efforts at NYSERDA, Long Island Power
Authority (LIPA) (now operated by PSEG Long Island), and the New York Power Authority (NYPA)
under a single incentive structure with Megawatt Block targets (see below). The ultimate goal
of the program is to “spur development of a market-driven, sustainable, subsidy-free solar
industry.”40
1.5.1.1 MW Block Incentive Program
The MW Block Incentive program is the means for disbursing the aforementioned
~$1 billion incentive budget to qualifying solar electric generation built in New York from 2014-
2023. The MW Block system allocates targets to three areas – Long Island, Con Edison territory,
and Upstate – with three sectors comprising each regional block. The sectors are:
1) Residential systems up to 25 kilowatts (kW);
2) Small non-residential systems up to 200 kW; and
3) Large non-residential systems larger than 200 kW and up to 2 MW.
The <200 kW residential and small non-residential blocks opened in August 2014 with
retroactive funding for projects installed beginning January 1, 2014, while the >200 kW to 2 MW
large non-residential block opened on May 4, 2015. The general structure of the block incentives
is to have declining incentive levels for each tranche of solar PV contracts. For example, the
ConEd residential incentive starts at $1.00/Watt-DC for the first 14 MW contracted and
40 See NY-Sun Initiative Fact Sheet. Available online at http://ny-sun.ny.gov/About/About-NY-Sun.aspx
P a g e | 20 |
Introduction
© 2015 Energy and Environmental Economics, Inc.
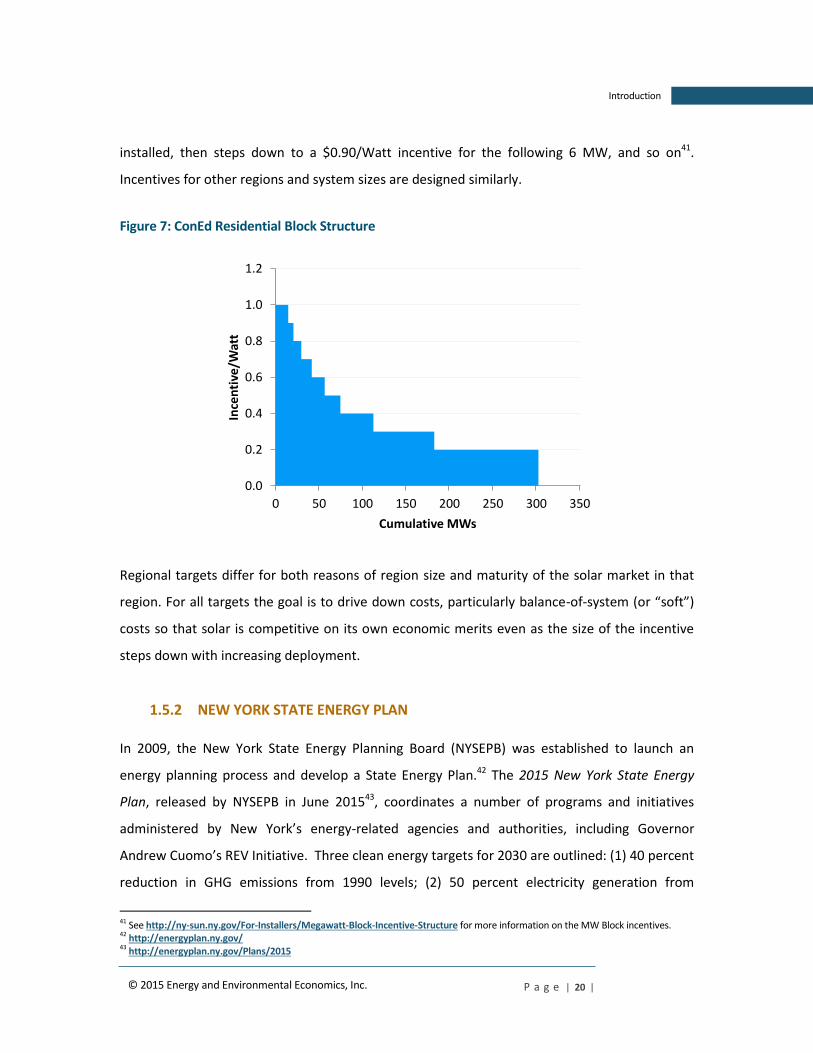
installed, then steps down to a $0.90/Watt incentive for the following 6 MW, and so on41.
Incentives for other regions and system sizes are designed similarly.
Figure 7: ConEd Residential Block Structure
Regional targets differ for both reasons of region size and maturity of the solar market in that
region. For all targets the goal is to drive down costs, particularly balance-of-system (or “soft”)
costs so that solar is competitive on its own economic merits even as the size of the incentive
steps down with increasing deployment.
1.5.2 NEW YORK STATE ENERGY PLAN
In 2009, the New York State Energy Planning Board (NYSEPB) was established to launch an
energy planning process and develop a State Energy Plan.42 The 2015 New York State Energy
Plan, released by NYSEPB in June 201543, coordinates a number of programs and initiatives
administered by New York’s energy-related agencies and authorities, including Governor
Andrew Cuomo’s REV Initiative. Three clean energy targets for 2030 are outlined: (1) 40 percent
reduction in GHG emissions from 1990 levels; (2) 50 percent electricity generation from
41 See http://ny-sun.ny.gov/For-Installers/Megawatt-Block-Incentive-Structure for more information on the MW Block incentives. 42 http://energyplan.ny.gov/ 43 http://energyplan.ny.gov/Plans/2015
0.0
0.2
0.4
0.6
0.8
1.0
1.2
0 50 100 150 200 250 300 350
Ince
nti
ve/W
att
Cumulative MWs

P a g e | 21 |
Introduction
© 2015 Energy and Environmental Economics, Inc.
renewables; and (3) 600 trillion Btu increase in energy efficiency. These are interim targets
along the state’s ultimate pathway to 80% GHG emission reductions by 2050.
The range of regulatory reforms and initiatives currently underway in the market is illustrated
the figure below.
Figure 8: New York Market and Regulatory Reform Timeline
1.5.2.1 Reforming the Energy Vision (REV)
New York’s Reforming the Energy Vision (REV) Initiative44 is the state’s comprehensive energy
policy to meet its policy objectives of sustainability, reliability and affordability. The REV
Initiative includes a transition of existing clean energy programs and regulatory reforms, many
of which are underway and still being formed. The 2015 New York State Energy Plan, released in
June 2015, coordinates the REV Initiative among state agencies and outlines three strategic
pillars:
44 http://www3.dps.ny.gov/W/PSCWeb.nsf/All/CC4F2EFA3A23551585257DEA007DCFE2?OpenDocument

P a g e | 22 |
Introduction
© 2015 Energy and Environmental Economics, Inc.
PSC’s REV Regulatory Docket, which includes regulatory reforms to provide customers
greater choice and value, expand the use of distributed energy resources (DER) and
redesign the investor-owned utility business model;
NYSERDA’s Clean Energy Fund (CEF), which will serve as the funding vehicle for
NYSERDA’s ongoing and future clean energy investment programs; and
NYPA, in their role as a state power authority, will “lead by example” through public
investment in energy efficiency and renewable energy
As shown in the figure below, the REV Initiative organizes a number of disparate programs and
initiatives into the pillars outlined above. The CEF replaces the programs supported by the
system benefits charge (SBC), including the energy efficiency (EE) and renewable portfolio
standards (RPS) programs, and continues the existing NY-Sun and New York Green Bank
initiatives.
Figure 9: REV Initiative Transition

P a g e | 23 |
Methodology
© 2015 Energy and Environmental Economics, Inc.
2 Methodology
2.1 Analysis
The following section describes the specific analytical methodology used in this study, which
primarily consists of using a Benefit-Cost Analysis (BCA). One key aspect of any kind of BCA
should be evaluating cost-effectiveness from multiple perspectives. This is consistent with DPS
BCA White Paper45. In addition a BCA should be transparent about its assumptions as well as be
clear on the benefits and costs being evaluated as well as those not being evaluated, which
again is consistent with the DPS BCA White Paper. A BCA should evaluate lifecycle economics,
but can also report impacts for specific years. In addition a BCA should also consider uncertainty
given long term projections under lifecycle economics. For example, a key benefit of NEM
installations are avoided utility energy purchases or costs over the lifetime of these installations,
which has a great deal of associated forecast uncertainty. Lastly, a BCA should look at both
participating customer incentives such as MW Block Incentives and bill savings when looking at
total non-participating ratepayer impacts or costs.
45http://www3.dps.ny.gov/W/PSCWeb.nsf/96f0fec0b45a3c6485257688006a701a/26be8a93967e604785257cc40066b91a/$FILE/Staff_BCA_Whitepaper_Final.pdf

P a g e | 24 |
Methodology
© 2015 Energy and Environmental Economics, Inc.
Figure 10: Multiple Perspectives Should be Examined when Constructing a Benefit-Cost Analysis
2.1.1 LITERATURE REVIEW
We believe that this study is in line with how other jurisdictions have examined the costs and
benefits of NEM and distributed solar PV (both from a direct financial and non-financial
standpoint) although the results of various studies do exhibit a wide range of potential values
depending on the purpose of the study and its analytical rigor. In addition, results vary by
location and can be significantly different depending on state policies. Therefore, a result based
on the unique aspects of a specific jurisdiction does not usually translate to another jurisdiction.
Further, not all jurisdictions have examined cost-effectiveness of distributed solar PV and/or
NEM systems using industry standard practices. Furthermore, only a subset of studies examines
both the costs and benefits, as most studies are primarily focused on examining the benefits
(financial and non-financial), i.e., the ‘value of solar’.
There are industry standard methodologies that have been used in multiple jurisdictions for a
number of years when examining the benefits and costs of distributed energy resource
programs and technologies as well as methodologies that have been tailored specifically for
distributed energy resources in New York, which are as follows:
Benefitsvs.
Costs
Ratepayers?
Net Metering
Customers?
Society ?
P a g e | 25 |
Methodology
© 2015 Energy and Environmental Economics, Inc.
Standard Practice Manual46
DPS BCA White Paper47
NREL’s ‘Methods for Analyzing the Benefits and Costs of Distributed Photovoltaic
Generation to the U.S. Electric Utility System”48
EPRI’s ‘Economic Costs and Benefits of Distributed Energy Resources’49
Figure 11: Value of Solar and NEM Benefit-Cost Studies Vary Widely in Terms of Methodology
46 http://www.cpuc.ca.gov/nr/rdonlyres/004abf9d-027c-4be1-9ae1-ce56adf8dadc/0/cpuc_standard_practice_manual.pdf 47http://www3.dps.ny.gov/W/PSCWeb.nsf/96f0fec0b45a3c6485257688006a701a/26be8a93967e604785257cc40066b91a/$FILE/Staff_BCA_Whitepaper_Final.pdf 48 http://www.nrel.gov/docs/fy14osti/62447.pdf 49 http://www.epri.com/abstracts/Pages/ProductAbstract.aspx?ProductId=000000000001011305
STATE STUDY
Avo
ide
d E
ne
rgy
(in
cl.
O&
M, f
ue
l co
sts)
Avo
ide
d F
ue
l He
dge
Avo
ide
d C
apac
ity
(ge
ne
rati
on
an
d r
ese
rve
)
Avo
ide
d L
oss
es
Avo
ide
d o
r D
efe
rre
d T
&D
In
vest
me
nt
Avo
ide
d A
nci
llary
Se
rvic
es
Mar
ket
Pri
ce R
ed
uct
ion
Avo
ide
d R
en
ew
able
s P
rocu
rem
en
t
Mo
ne
tize
d E
nvi
ron
me
nta
l
Soci
al E
nvi
ron
me
nta
l
Secu
rity
En
han
cem
en
t/R
isk
Soci
eta
l (in
cl.
eco
no
mic
/jo
bs)
PV
In
tegr
atio
n
Pro
gram
Ad
min
istr
atio
n
Bill
Sav
ings
(U
tilit
y R
eve
nu
e L
oss
)
Uti
lity/
DER
In
cen
tive
s
Tota
l Re
sou
rce
Co
st T
est
(TR
C)
Pro
gram
Ad
min
istr
ato
r/U
tilit
y C
ost
Te
st
(PA
CT/
UC
T)
Co
st o
f Se
rvic
e (
CO
S) A
nal
ysis
Rat
ep
aye
r Im
pac
t M
eas
ure
(R
IM)
Par
tici
pan
t C
ost
Te
st (
PC
T)
Soci
eta
l Co
st T
est
(SC
T)
Re
ven
ue
Re
qu
ire
me
nt
Savi
ngs
: C
ost
Rat
io
Ne
t C
ost
Co
mp
aris
on
of
NEM
, FiT
, Oth
er
ARIZONA Crossborder Energy (2013) ● ● ● ● ● ● ● ● ● ● ● ● ● ●
ARIZONA APS/SAIC (2013) ● ● ● ●
CALIFORNIA E3 (2013) ● ● ● ● ● ● ● ● ● ● ● ●
CALIFORNIA Crossborder Energy (2013) ● ● ● ● ● ● ● ● ● ● ●
COLORADO Xcel (2013) ● ● ● ● ● ● ● ●
HAWAII E3 (2014) ● ● ● ● ● ● ●
MAINE Clean Power Research (2015) ● ● ● ● ● ● ● ● ●
MASSACHUSETTS La Capra Associates (2013) ● ● ● ● ● ● ● ● ● ● ● ● ●
MICHIGAN NREL (2012) ● ● ● ● ● ● ● ●
MINNESOTA Clean Power Research (2014) ● ● ● ● ● ●
MISSISSIPPI Synapse Energy Economics (2014) ● ● ● ● ● ● ● ● ● ● ● ●
NORTH CAROLINA Crossborder Energy (2013) ● ● ● ● ● ● ● ● ● ● ● ● ● ● ●
NEW JERSEY Clean Power Research (2012) ● ● ● ● ● ● ● ● ● ● ●
NEW YORK E3 (2015) (Based on DPS BCA) ● ● ● ● ● ● ● ● ● ● ● ● ● ● ● ● ● ● ● ● ●
NEVADA E3 (2014) ● ● ● ● ● ● ● ● ● ● ● ● ● ● ● ●
PENNSYLVANIA Clean Power Research (2012) ● ● ● ● ● ● ● ● ● ● ●
TENNESSEE TVA (2015) ● ● ● ● ● ●
TEXAS (AUSTIN) Clean Power Research (2014) ● ● ● ● ● ● ●
TEXAS (SAN ANTONIO) Clean Power Research (2013) ● ● ● ● ● ●
VERMONT Vermont PSC (2013) ● ● ● ● ● ● ● ● ● ● ● ●
EXAMPLES OF RECENT NEM VALUE STUDIES FROM STATES, UTILITIES, CONSULTANCIES, AND STAKEHOLDERSBENEFITS ANALYZED COSTS ANALYZED BENEFIT/COST TESTS
Included ●
Included as a sensitivity ●
Represented/captured in other values ●

P a g e | 26 |
Methodology
© 2015 Energy and Environmental Economics, Inc.
Figure 12: Value of Solar and NEM Benefit-Cost Studies Vary Widely in Terms of Results based on Methodology, Jurisdiction, and Study Sponsors*
*Note, this chart is not meant to represent a benefit-cost test, but merely serves as a comparison of how the various potential benefits both direct (energy, generation capacity, losses, ancillary services, fuel hedge, T&D, environmental, avoided renewables, and market price effect) and non-financial (social environmental, societal, economic development, security enhancement, and other) have been calculated in each study which is then compared against the average state residential retail rate as reported by the U.S. Energy Information Administration (EIA). This average rate is an aggregate number that includes both fixed and variable charges. As can be seen there are many types of benefits examined across the studies surveyed, some reflect direct cost avoidance, while many others reflect the monetization of non-pecuniary societal benefits. It is important to note that these benefits are not consistent in methodologies, perspectives, or analytical rigor across studies. To that end we categorized various benefits into a smaller number of subcategories for ease of comparison across studies. For example, the ‘Social Environmental’ category can include non-financial health impacts from SO2 and NOx along with Social Carbon Costs depending on the study. The ‘Environmental’ categories can include financial CO2 impacts along with other potential benefits. Given these caveats we believe that this comparison serves as useful context for this study and the results presented, but each study’s results are unique and may or may not be useful as a direct comparison.

P a g e | 27 |
Methodology
© 2015 Energy and Environmental Economics, Inc.
2.1.2 COST EFFECTIVENESS PERSPECTIVES
This analysis evaluates the benefits and costs of the NEM systems from three perspectives
originally established in the Standard Practice Manual (SPM), and later adapted for use in the New
York context. The most recent adaptation can be found in the DPS July 1, 2015 BCA White Paper.
These perspective based analyses have been used for decades in a number of jurisdictions to
determine the cost-effectiveness of a variety of consumer distributed energy resource programs.
Each perspective is defined by a ‘cost test’ and collectively they define a broad assessment of cost-
effectiveness. These industry standard tests provide a holistic analytical and methodological
structure to examine the benefits and costs of energy resources from a variety of perspectives.
There is not a single correct cost test to use in general, each ‘test’ aims to answer a different
question as follows:
The Participant Cost Test (PCT) analyzes the financial proposition of purchasing and
installing a NEM system from a participant’s perspective. If a customer’s bill savings
including NEM compensation are greater than the customer’s post-incentive capital
costs paid, then the customer experiences a monetary financial gain from installing a
NEM system.
o Note, this test is highly dependent on a number of variables like each individual
customer’s specific electric retail rate schedule, the NEM system financing
mechanism, tax status, location, etc.
The Ratepayer Impact Measure (RIM) measures the impact of NEM generation on non-
participating utility customers. The RIM test compares the utility avoided costs from not
having to provide the energy generated by the NEM system (reduction in revenue
requirement) to the incremental utility system costs such as program administration
and the lost utility revenue due to reductions in NEM adopter customer bills. If there is a
net shortfall, over time the utility would be allowed to increase customer rates to make
up for the shortfall, which results in non-participants bearing those costs. In New York,
where the utilities have revenue decoupling mechanisms (RDM),50 this assumption is
reasonable as utility revenues are normally reconciled or ‘trued up’ on an annual basis.
50 http://www3.dps.ny.gov/W/PSCWeb.nsf/All/A0227F4885E1769485257687006F38C2?OpenDocument

P a g e | 28 |
Methodology
© 2015 Energy and Environmental Economics, Inc.
The Societal Cost Test (SCT51) captures the total impact of NEM on the state of New York
including non-financial societal benefits or externalities that are not currently paid for
by ratepayers. The test includes the net impacts of participants, non-participants, and
utility/program administrators. Net costs between parties within New York and benefits
that are not directly financial are excluded from this analysis.
Some of these standard cost test components, such as customer bill “savings,” are transfers from
participants to non-participants. This occurs because lower bills for participants reduce the
revenue the utility collects, and to the extent these bill reductions are greater than any utility cost-
savings, the next utility rate case or decoupling adjustment would increase rates to make up the
shortfall, increasing bills of non-participants. Note that these transfers may be treated as a cost in
some tests and a benefit in others due to differences in the cost test perspectives.
Figure 13: Benefit and Cost Components of the Standard ‘Cost Tests’
Benefits Costs
Participant Cost Test (PCT)
Customer Bill Reductions + State Incentives
52
+ State Tax Credits/Incentives + Federal Tax Credits
NEM System Costs
Ratepayer Impact Measure (RIM)
Utility Avoided Costs
+ Market Price Effects
Customer Bill Reductions + State Incentives
+ Utility Integration Costs + Utility Administration Costs
Societal Cost Test
(SCT)*
Utility Avoided Costs + Federal Tax Credits
+ Societal Benefits + Health Benefits
NEM Generation System Costs + Utility Integration Costs
+ Utility Administration Costs
*Based on the DPS BCA interpretation of the Standard Practice Manual’s SCT, the Market Price Effect was not included as a benefit in the SCT as in New York this is viewed as a transfer payment from producers to consumers with no net “societal” benefit53. It is however included in the RIM test.
51 For the purpose of this study, the Societal Cost Test is defined to be a Total Resource Cost test (as defined in the SPM) plus select environmental externalities. 52 This consists of the MW Block Incentive program for distributed solar PV. Both the PCT and RIM tests assume that the MW Block Incentive program is funded entirely by ratepayers in the year that the incentives are disbursed. 53 See footnote on p.66 of “The Renewable Portfolio Standard: Mid Course Report” that was filed by Staff on October 26, 2009 in Case 03-E-0188. See: http://documents.dps.ny.gov/public/Common/ViewDoc.aspx?DocRefId=230CE88F-60A5-475B-A24A-6FC9B2780DEF.

P a g e | 29 |
Methodology
© 2015 Energy and Environmental Economics, Inc.
Future benefits and costs are discounted to their installation date and reported in 2015 dollars.
The PCT, RIM, and SCT54 cost-tests all use the a 5.5% real discount rate as representative of a
generic utility’s weighted average cost of capital (WACC) and a 2% inflation forecast to determine
the nominal discount rate for any net present value (NPV) calculation.
For any calculations of levelized costs, i.e., on a $ per kWh basis, a real economic or constant real
approach is used rather than a nominal levelization. The total NPV is the same under either
approach. The constant real levelized cost-effectiveness provides a better comparison of the cost-
effectiveness over time since the results are comparable between different vintages of
installations.
Figure 14: Cost Test Result Interpretations
Benefits GREATER than Costs Benefits LESS than Costs
Participant Cost Test (PCT)
Net metered customers save money by installing NEM systems
Net metered customers spend more on electricity after installing
NEM systems
Ratepayer Impact Measure (RIM)
Average utility rates decrease, decreasing bills of non-
participants
Average utility rates increase, increasing bills of non-participants
Societal Cost Test
(SCT)
There is a net benefit to the state of New York when accounting for
health/social externalities
There is an net cost to the state of New York even accounting for
health/social externalities
2.1.3 VALUE OF SOLAR ANALYSIS
In addition to the three standard cost tests enumerated above we examine a ‘value of solar’
perspective. We look at both the direct financial benefits in the standard RIM test as well as
54 Note, the societal components of SO2 and NOx health impacts and the Social Cost of Carbon are based on EPA forecasts that assume different damage values at different discount rates. While these values are calculated with different discount rates that result in different values, the analysis takes these discounted values and then applies a constant 5.5% discount rate. For example, the EPA uses a 3.0% discount rate to determine one value of the Social Cost of Carbon. The analysis then takes this discounted value and applies the 5.5% discount rate assumed. Different scenarios have different values assumed for these EPA forecasts.

P a g e | 30 |
Methodology
© 2015 Energy and Environmental Economics, Inc.
non-financial societal benefits examined in the SCT55 in order to construct a total ‘value’ metric
for NEM systems. This is one perspective in comparing non-participating ratepayer expenses,
which consist of compensation paid to NEM customers (i.e., bill savings) plus any NEM
incentives (i.e., MW Block incentives) and integration/program costs to this total ‘value’.
2.1.4 COSTS AND BENEFITS EVALUATED There are two primary types of benefits associated with NEM systems that are examined in this
study:
1. Direct financial benefits such as utility avoided energy costs; and,
2. Non-financial societal benefits such as GHG mitigation and improved air quality.
In this study we examine a number of benefits and costs in an explicit and quantitative fashion.
There are, however, several other potential benefits that are qualitatively discussed in line with
guidance from the DPS BCA White Paper. The figure below describes the specific benefits and
costs examined in each BCA perspective.
55There is a clear distinction between indirect benefits that accrue to society vs. ratepayers. In this study we are equating indirect benefits that accrue to society as being equally applicable to non-participating ratepayers. There is uncertainty if this assumption is appropriate especially with regards to the Social Cost of Carbon which is a worldwide pollutant with worldwide costs. The Social Cost of Carbon may understate or overstate the cost to both New York state and its ratepayers. This uncertainty is reflected in part in the various sensitivities assigned to this value component across the four defined scenarios in this study.

P a g e | 31 |
Methodology
© 2015 Energy and Environmental Economics, Inc.
Figure 15: The Benefits, Costs, and Perspectives Examined in this BCA
2.1.4.1 Direct Financial Benefits and Costs Currently Affecting New York and New York Ratepayers
We examine each NEM system over a 25-year assumed life. In order to perform this lifecycle
analysis each benefit and cost component must be forecast over that lifetime. It is important to
note that each benefit and cost component has an associated forecast uncertainty associated
with it, especially given each NEM system’s long lifetime. A summary description of each benefit
and cost component is provided in the table below, with more details provided in the study’s
Appendix.
Participant Cost Societal Cost
Test TestEnergy (LBMP)
(No Carbon)------ (Benefit) (Benefit)
T&D Losses ------ (Benefit) (Benefit)
Monetized Carbon Costs ------ (Benefit) (Benefit)
Ancillary Services ------ (Benefit) (Benefit)
Reactive Power ------
System Capacity (ICAP) ------ (Benefit) (Benefit)
Transmission Capacity ------
Sub-Transmission Capacity ------ (Benefit) (Benefit)
Distribution Capacity ------ (Benefit) (Benefit)
Market Price Effect ------ (Benefit) ------
Resiliency/Restoration ------
Social Cost of Carbon ------ ------ (Benefit)
Health Benefits
(SO2 and Nox)
Customer Bill Savings (Benefit) (Cost) ------
Integration Costs ------ (Cost) (Cost)
Program Costs ------ (Cost) (Cost)
Tax Incentives (Federal) (Benefit) ------ (Benefit)
Tax Incentives (State) (Benefit) ------ ------
Direct Incentives (State) (Benefit) (Cost) ------
NEM Capital Costs (Cost) ------ (Cost)
Benefit-Cost
Components
Ratepayer Impact
Measure
Quantifiable, but value assumed to be low based on new
inverter technologies and current utility costs
Assumed to be reflected in the ICAP and LBMP Values
Assumed to be reflected in utility distribution costs;
difficult to calculate as these values differ greatly
between customers/locations
------ ------ (Benefit)

P a g e | 32 |
Methodology
© 2015 Energy and Environmental Economics, Inc.
Figure 16: Detailed Description of the NEM Financial Benefit-Cost Components
Cost Test Criteria
Component General Description Initial Study Calculation Methodology/Proxy Value
Uti
lity
Avo
ided
Co
sts
Energy
Reduction of costs due to reduction in production from the marginal conventional wholesale generating resource associated with the adoption of distributed NEM.
The value of energy for each utility is derived from a forecast based on production simulation modeling per the NYISO’s Congestion Assessment and Resource Integration Study (CARIS). This includes generation energy losses and compliance costs for criteria pollutants but does not include any financial CO2 emission costs.
Energy Losses
Reduction of electricity losses from the points of generation to the points of delivery associated with the adoption of distributed NEM.
Utility transmission, and distribution loss factors, i.e., expansion factors, as reported in their respective approved Tariffs. Generation losses are already accounted for in the energy costs.
Capacity
Reduction in the fixed costs of building and maintaining new conventional generation resources associated with the adoption of distributed NEM.
The DPS ICAP model attached to the July 1, 2015 DPS BCA White Paper was used to forecast future installed capacity (ICAP) prices appropriate under a load modification approach applicable to each utility. These capacity costs are also adjusted for the appropriate energy T&D losses as well as adjusted by the expected system peak load reduction value realized by each type of NEM technology.
Ancillary Services
Reduction of the costs of services like operating reserves, voltage control, reactive power, and frequency regulation needed for grid stability associated with the adoption of distributed NEM.
A proxy value of 1% assigned. The NYISO procures ancillary services on a fixed rather than load following basis based on a largest single contingency measure, which means the amount of ancillary services procured would not likely decrease in any appreciable way due to the adoption of distributed NEM. There could be some benefit from voltage/reactive power control or power factor correction with newly enabled smart inverter technology.
Transmission Capacity
Reduction or deferral of costs associated with expanding/replacing/upgrading transmission capacity associated with the adoption of distributed NEM.
The value of transmission capacity is captured in the NYISO CARIS zonal production simulation modeling results and is represented as congestion, i.e., energy price differentials, between the NYISO modeled zones. It is also likely captured to some extent in the various zonal NYISO capacity prices, i.e., more transmission and generation constrained capacity zones would likely have a higher zonal capacity price all else being equal.
Sub-Transmission Capacity
Reduction or deferral of costs associated with expanding/replacing/upgrading sub-transmission capacity such as substations, lines, transformers, etc. with the adoption of distributed NEM generation.
Costs based on existing estimates for marginal sub-transmission capacity costs as provided by each utility in their Marginal Cost of Service Studies. These costs are adjusted by the expected sub-transmission system peak load reduction value realized by each type of NEM technology based on NYISO zonal load data.
Distribution Capacity
Reduction or deferral of costs associated with expanding/replacing/upgrading distribution capacity such as lines, transformers, etc. with the adoption of distributed NEM generation.
Costs based on existing estimates for marginal distribution capacity costs as provided by each utility in their Marginal Cost of Service Studies. These costs are adjusted by the expected distribution system peak load reduction value realized by each type of NEM technology based on utility sample substation load data.

P a g e | 33 |
Methodology
© 2015 Energy and Environmental Economics, Inc.
Cost Test Criteria
Component General Description Initial Study Calculation Methodology/Proxy Value
Criteria Pollutants
Reduction of SO2, ad NOx emissions due to reduction/increase in production from the marginal wholesale generating resources associated with the adoption of distributed NEM generation.
The compliance costs associated with these criteria pollutants is included in the zonal energy cost NYISO CARIS forecasts.
Financial CO2
Emissions Cost
Reduction of CO2 emissions due to reduction in production from the marginal wholesale generating resources associated with the adoption of distributed NEM generation.
The financial value of carbon as determined by the NYISO in its CARIS forecast.
Market Price Effect
Potential reduction of system wide wholesale energy costs due to reduced system load attributable to distributed NEM generation.
There are many factors that affect this component including how much the current and forecast NY wholesale energy market is at spot vs. hedged or under long-term contracts. Additionally information on the underlying market and operational characteristics are needed to see how much if any supply can be affected and for how long due to distributed NEM PV generation now and in the future. E3 identifies this component explicitly as one requiring further study but a proxy value was calculated using the NYISO high solar PV case as part of its CARIS I study
56. An average LBMP market
price effect was calculated to be approximately $15.0/MWh for each incremental MWh of solar generation on a statewide basis after adjusting for the amount of the day-ahead market assumed to be hedged (~40%). This effect is assumed to decrease by 50% in the following year to $7.5/MWh and then to zero in the 3
rd
year as per the guideline in the DPS BCA.
Uti
lity
or
Rat
ep
ayer
Co
sts
Utility Integration Costs
Increase of costs borne by the utility to interconnect and integrate distributed NEM including increases in ancillary services like operating reserves, voltage control, etc.
This can be examined most easily based on detailed studies and/or literature reviews
57 that have examined the costs of
integration and interconnection associated with the adoption of NEM. An assumed value of $1-$3/MWh is used in this analysis depending on the scenario.
Program Costs Increase of costs borne by the utility to administer NEM customers.
Incremental costs associated with NEM such as billing of net metering customers as well as other administrative costs. An assumed value of $1-$3/MWh is used in this analysis depending on the scenario.
State Incentive Costs
Costs borne by the ratepayers to incent the NEM-eligible technologies.
All MW Block Incentive costs are assumed to be paid for by all ratepayers through the current/future System Benefit/RPS/Public Purpose Charges in the year the incentives are disbursed. These revenues are based on volumetric rates and customer usage. In this analysis this value is assumed to be the planned MW Block Incentives applied 2015-2023.
56http://www.nyiso.com/public/webdocs/markets_operations/committees/bic/meeting_materials/2015-08-12/agenda%203%20Market%20Operations%20Report_%20BIC_08.12.15.pdf 57 A topical report is a Duke Energy/US Department of Energy study of solar integration in the Carolinas available at http://www.duke-energy.com/pdfs/carolinas-photovoltaic-integration-study.pdf.

P a g e | 34 |
Methodology
© 2015 Energy and Environmental Economics, Inc.
Cost Test Criteria
Component General Description Initial Study Calculation Methodology/Proxy Value
Bill Savings (Utility Revenue Loss)
NEM Customer Bill Savings
These are the direct savings on a customer’s bill which also represent the utility’s lost revenue as a result of installing net metered solar PV onsite.
E3 estimated these values based on publicly available marginal customer billing data from NYSERDA’s Clean Power Research Tool for average residential, commercial, and industrial customers
58.
Federal/State Tax Credits
Federal/State Tax Credits
The federal investment tax credit along with any in state tax credits used to incentivize distributed solar.
The federal investment tax credit along with any other state tax credits will be modeled as incentives for solar PV systems over the analysis forecast period.
NEM Generation Costs
NEM System Costs
The costs to build and/or finance distributed NEM generation systems over time.
E3 created New York specific NEM installation and cost forecasts based on current pricing and future expected technology and cost declines. All NEM system costs from 2015-2025 were modeled with an E3 financial pro formal model as a third party owned system under a PPA/lease if appropriate.
Discount Rate and Levelization Approach
Annual rate used to discount various types of future value or cost streams to present values.
A 5.5% real discount rate is used for all benefits and cost streams with an assumed long-term inflation rate of 2%. A real economic, i.e., constant real, levelization approach is used rather than a nominal levelization to better allow for annual snapshot comparisons of NEM benefits and costs.
2.1.4.2 Non-Financial Benefits and Costs Affecting New York and New York Ratepayers (Societal Externalities)
The following table describes the non-financial societal benefits of GHG mitigation and
improved air quality.
Figure 17: Detailed Description of the NEM Non-financial Benefit-Cost Components
Cost Test Criteria
Component General Description Initial Study Calculation Methodology/Proxy Value
Societal Benefits
Social Carbon (Societal Benefits)
Changes in agricultural productivity, human health impacts, property and infrastructure damages from increased flood risk, and the value of ecosystem service losses due to climate change.
E3 identifies this component explicitly as one requiring further study in order to establish the appropriate New York specific social carbon or societal benefit applicable in this analysis. For the purpose of this study the EPA social cost of carbon was relied upon
59 minus the financial CO2 emission cost forecast
from the NYISO CARIS. This EPA forecast assumes different levels of discount rates to determine the cost of carbon. The emission rate was determined by using EPA eGrid data
60
for NY specific generators to determine average annual marginal emission rates for natural gas, oil, and coal plants
58 http://ny-sun.ny.gov/Get-Solar/Clean-Power-Estimator 59 http://www.epa.gov/climatechange/EPAactivities/economics/scc.html 60 http://www.epa.gov/cleanenergy/energy-resources/egrid/

P a g e | 35 |
Methodology
© 2015 Energy and Environmental Economics, Inc.
Cost Test Criteria
Component General Description Initial Study Calculation Methodology/Proxy Value
along with information on which of these fuels were on the margin based on the NYISO State of the Market report
61.
Health Benefits
Reduction of non-emission related health benefits such as decreased mortality rates, reduced asthma attacks, etc. associated the adoption of distributed solar.
These externalities are often difficult to estimate. E3 identifies this component explicitly as one requiring further study in order to establish the appropriate New York specific externalities that should be examined. For the purpose of this study high level estimates from the EPA for the costs of SO2 and NOx related health impacts are used. These estimates assume different levels of discount rates to determine the damage values, which are used in conjunction with the marginal emission rates of SO2 and NOx derived from the EPA’s eGrid data similar to the methodology described above for CO2 emissions.
2.1.4.3 Other Potential Benefits and Costs
There are some categories of benefits and costs that exist in the literature as well as mentioned
in the DPS BCA White Paper that were not quantified for a variety of reasons:
They are very small and uncertain;
They are included in other components; or,
They are outside the scope of this analysis.
The following are potential additional benefits and costs in addition to what was explicitly
examined in this study:
RPS Value
o In many jurisdictions there is often a benefit with NEM installations that can
reduce the obligation of the utility to purchase renewables to meet state RPS
compliance requirements, which is a potential avoided cost benefit.
o In New York the RPS program is structured uniquely compared to other states
where in New York funds are used to procure renewables and the RPS targets
are non-binding with no financial penalty or costs for non-compliance. 61http://www.nyiso.com/public/webdocs/markets_operations/documents/Studies_and_Reports/Reports/Market_Monitoring_Unit_Reports/2014/NYISO2014SOMReport__5-13-2015_Final.pdf

P a g e | 36 |
Methodology
© 2015 Energy and Environmental Economics, Inc.
o Therefore no savings are assumed to occur due to NEM system adoptions.
Fuel Hedge
o Reduction in costs of locking in future price of fuel associated with the adoption
of distributed NEM.
o There are many factors that affect this component including how much
exposure the current and forecast New York generation fleet has to natural gas
or other fuels on a marginal basis as well as determining how much of New
York’s energy requirements are hedged with long-term contracts.
o Additional information on the underlying market differentials between spot and
future fuel/electricity prices needs to be determined.
Net Economic Impacts
o Any incentives paid to particular programs are expected to generate economic
activity, which should be balanced against the costs of those programs.
o Given the likely adoption of NEM systems it is expected that this will lead to net
economic benefits62.
o These benefits may inform policy and be an ancillary consideration, but are not
typically directly included in any industry standard ‘cost tests’.
Security/Resiliency
o Benefits based on increasing system resiliency or security by reducing
restoration and/or outage costs.
o Some portion of restoration costs are already included in the avoided sub-
transmission and distribution capacity costs directly financial and paid for by
ratepayers.
Other
o Other benefits include, but are not necessarily limited to, such things, employee
productivity, property values, reduction of the effects of termination of service
and avoidance of uncollectible bills for utilities.
62 Please see an earlier NYSERDA study (http://www.nyserda.ny.gov/-/media/Files/Publications/Energy-Analysis/NY-Solar-Study-Report.pdf) looking at job and employment impacts of solar PV deployment. Specifically the study looked at installing 5,000 MW by 2025. The Low Cost scenario, which corresponds most closely with the observed level of actual solar PV cost declines state the creation of 700 net jobs economy-wide through 2049, which includes both an increase and decrease in jobs.

P a g e | 37 |
Methodology
© 2015 Energy and Environmental Economics, Inc.
o As per the DPS BCA it is not expected that these other values will be directly
assigned a financial value at this time.
2.2 Income Analysis of Residential NEM Customers
A granular geographic information system (GIS) and census tract63 income analysis was conducted
using a database of approximately 30,000 solar PV installations. In this analysis, we look at the
demographics and geography of residential NEM customers using NYSERDA’s database of
customers that have installed solar PV through a New York State incentive program, which
includes installation size, installation cost, installation year, NYISO zone, and customer census
tract, combined with American Census Survey (ACS) data from the US Census Bureau64. Census
tracts are much smaller geographic areas than zip codes (3,000-6,000 households), and they are
selected to have more homogenous demographics. Therefore, the use of census tracts allows for
more accurate estimates of NEM customer demographics compared to using zip codes.
As the majority of solar PV installations have taken place in the last five-years, the focus in this
income analysis focuses on the period between 2010 and 2015. For household income, unless
mentioned otherwise, the median income in the corresponding census tract at the year of
installation (2010-2015) was assigned to the NEM customer.
63 https://www.census.gov/geo/reference/gtc/gtc_ct.html 64 For 2010-2013, ACS 5-year estimates were used; for 2014 and 2015 the ESRI Demographic Updated Database was used (http://www.esri.com/data/esri_data).

P a g e | 38 |
Results
© 2015 Energy and Environmental Economics, Inc.
3 Results
3.1 Current New York NEM Installations
The following section presents the results from our study analysis. As can be seen in the figures
below NEM has been an important driver of increased adoption of distributed renewable
generation in New York. There have been significant increases in NEM system installations
recently as well as a queue, i.e., ‘pipeline’ of future projects.
Figure 18: Cumulative Residential Solar PV Installations by NYISO Zone in 2013 vs. 2015

P a g e | 39 |
Results
© 2015 Energy and Environmental Economics, Inc.
Figure 19: Cumulative Solar PV Installations in 2015 by NYISO Zone (Residential vs. Non-Residential)
Figure 20: Solar PV Installations either Currently Installed or Installations that have Applied for MW Block Incentives and are in the Queue to be Built
10
Residential Cumulative Installed Capacity (kW) - 2015
Non-Residential Cumulative Installed Capacity (kW) - 2015
0
50,000
100,000
150,000
200,000
250,000
300,000
350,000
Re
sid
en
tial
Smal
l No
n-R
esi
de
nti
al
Larg
e N
on
-Re
sid
en
tial
Tota
l
Re
sid
en
tial
Smal
l No
n-R
esi
de
nti
al
Tota
l
Re
sid
en
tial
Smal
l No
n-R
esi
de
nti
al
Larg
e N
on
-Re
sid
en
tial
Tota
l
Re
sid
en
tial
Smal
l No
n-R
esi
de
nti
al
Larg
e N
on
-Re
sid
en
tial
Tota
l
Re
sid
en
tial
Smal
l No
n-R
esi
de
nti
al
Larg
e N
on
-Re
sid
en
tial
Tota
l
Re
sid
en
tial
Smal
l No
n-R
esi
de
nti
al
Larg
e N
on
-Re
sid
en
tial
Tota
l
Re
sid
en
tial
Smal
l No
n-R
esi
de
nti
al
Larg
e N
on
-Re
sid
en
tial
Tota
l
Consolidated Edison PSEG LongIsland
National Grid NYSEG Orange and RocklandUtilities
Central Hudson Gasand Electric
Rochester Gas andElectric
Tota
l kW
-dc
In the Pipeline Actual Installed

P a g e | 40 |
Results
© 2015 Energy and Environmental Economics, Inc.
3.2 Solar PV Block Assumptions
To evaluate the statewide costs and benefits of NEM, we examine 500 MW of NEM systems
adopted in 2015, proportional to the MW Bock Targets between regions, utilities and customer
classes.
Figure 21: Proposed Buildup Based on MW Block Targets with Upstate Targets Allocated to Each Utility Based on Existing Distribution of Solar PV Installations
Utility/Class Residential Small-Non-Residential
Large Non-Residential
TOTAL
ConEd 8.2% 8.2% 11.5% 27.9%
PSEG Long Island 3.3% 1.6% 0.0% 4.9%
National Grid 4.8% 7.7% 27.1% 39.6%
NYSEG 2.4% 2.3% 8.6% 13.3%
ORU 1.9% 0.4% 2.5% 4.8%
Central Hudson 2.7% 1.2% 2.0% 5.9%
RG&E 0.3% 0.6% 2.7% 3.6%
TOTAL 23.5% 22.0% 54.5% 100.0%
3.3 Scenario Assumptions
We developed four scenarios for evaluating the benefits and costs of the NEM system
installations. These four scenarios are designed to capture the range of potential values of the
underlying benefit and cost components given the inherent uncertainty with quantifying these
values. Specific assumptions are presented below.
One thing to note is that the middle two scenarios only differ in the treatment of targeting NEM
systems to higher value locations on the distribution grid, i.e., if NEM systems were simply
placed in higher value locations its value would be higher, all else being equal.

P a g e | 41 |
Results
© 2015 Energy and Environmental Economics, Inc.
Figure 22: High Level Scenario Descriptions
NEM Scenarios
Lower NEM Value
Untargeted and Expensive Solar, Low Utility Avoided Costs, Less Value for GHG Mitigation and Improved Air Quality, and Higher T&D Delivery Rates
Untargeted NEM (Business as Usual)
‘Distribution Value’65 is Under Lock and Key and NEM is Untargeted = Lower Benefits to the Grid
Targeted NEM ‘Distribution Value' is Unlocked and NEM is 'Smarter' and Targeted to Maximize Value to the Grid
Higher NEM Value
Better 'Distribution Value’ than Expected with 'Smarter' and Cheaper Solar, Higher Utility Avoided Costs, More Value for GHG Mitigation and Improved Air Quality, and Lower T&D Delivery Rates
65 Defined as the distribution level benefits of distributed energy resources like NEM-eligible systems.

P a g e | 42 |
Results
© 2015 Energy and Environmental Economics, Inc.
Figure 23: Summary of Scenario Input Assumptions
3.4 Results
3.4.1 ‘VALUE OF SOLAR’ RESULTS
The total ‘value’ or benefits from distributed solar PV increases over time (2015 vs. 2025) in all
scenarios as both the direct financial and non-financial environmental or societal benefits from
solar PV increase from current levels, i.e., utility avoided costs and social carbon costs are
forecast to increase over time, although in the Targeted NEM Scenario more distribution and
sub-transmission avoided cost benefits are achieved by assuming that NEM systems are sited at
higher value locations on the distribution grid.
Lower NEM ValueUntargeted
NEMTargeted NEM Higher NEM Value
Energy & Losses -10% Base Base +10%Monetized Carbon -15% Base Base +15%Ancillary Services Base Base Base Base
Generation Capacity Prices Low Base Base HighGeneration Capacity Value -10% Base Base +10%
Transmission Capacity None None None NoneSub-Transmission Capacity Avoided Costs None Base Base Base
Sub-Transmission Capacity Demand Reduction Realization 0% 20% 100% 120%Distribution Capacity Avoided Costs None Base Base Base
Distribution Capacity Demand Reduction Realization 0% 20% 100% 120%Integration Costs High Base Base Low
Program Costs High Base Base LowNEM Capital Costs High Base Base Low
T&D Retail Rate High Base Base LowCO2, SO2, and Nox Emission Rates -5% Base Base +5%
Social Cost of Carbon Low Base Base HighHealth Benefits (SO2 and Nox) Low Base Base High
Market Price Effect None Base Base BaseReactive Power None None None None
Resiliency/Restoration None None None NoneOther None None None None
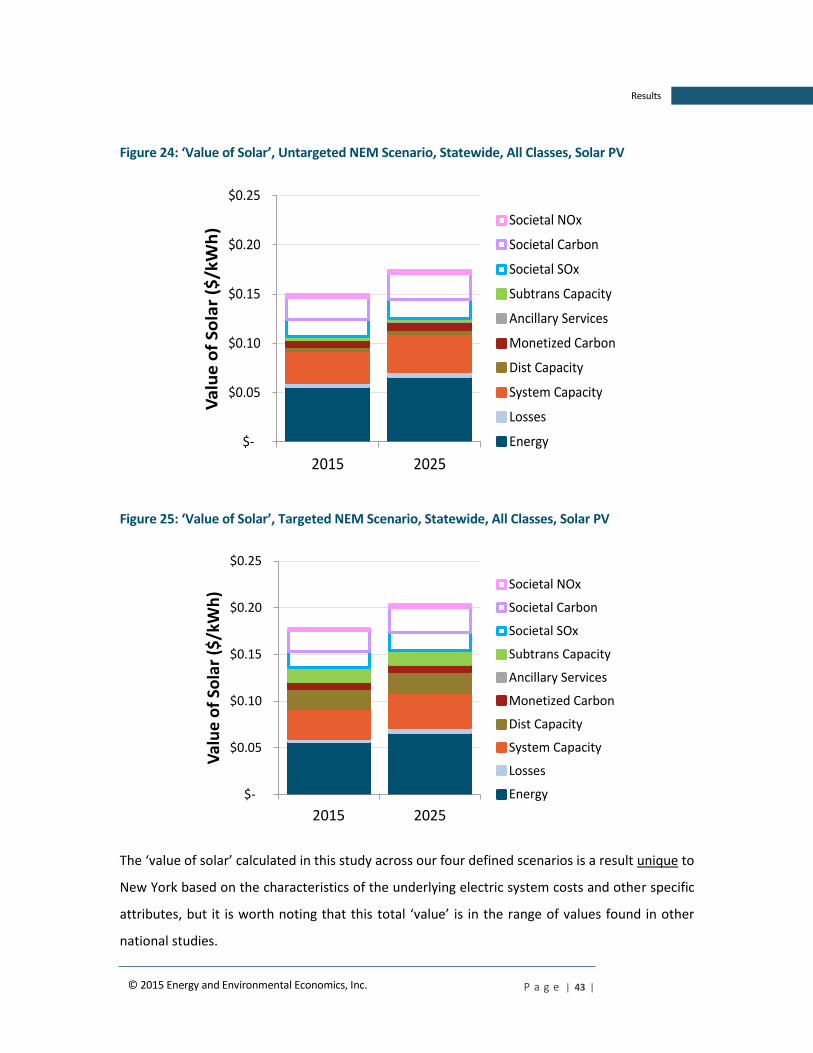
P a g e | 43 |
Results
© 2015 Energy and Environmental Economics, Inc.
Figure 24: ‘Value of Solar’, Untargeted NEM Scenario, Statewide, All Classes, Solar PV
Figure 25: ‘Value of Solar’, Targeted NEM Scenario, Statewide, All Classes, Solar PV
The ‘value of solar’ calculated in this study across our four defined scenarios is a result unique to
New York based on the characteristics of the underlying electric system costs and other specific
attributes, but it is worth noting that this total ‘value’ is in the range of values found in other
national studies.
$-
$0.05
$0.10
$0.15
$0.20
$0.25
2015 2025
Va
lue
of
So
lar
($/k
Wh
)Societal NOx
Societal Carbon
Societal SOx
Subtrans Capacity
Ancillary Services
Monetized Carbon
Dist Capacity
System Capacity
Losses
Energy
$-
$0.05
$0.10
$0.15
$0.20
$0.25
2015 2025
Va
lue
of
Sola
r ($
/kW
h) Societal NOx
Societal Carbon
Societal SOx
Subtrans Capacity
Ancillary Services
Monetized Carbon
Dist Capacity
System Capacity
Losses
Energy

P a g e | 44 |
Results
© 2015 Energy and Environmental Economics, Inc.
Figure 26: Levelized66 Value of Solar and NEM Benefit-Cost Studies Including Untargeted NEM or ‘Business as Usual’ Scenario Results67 Including Both Financial and Non-Financial Benefits
66 Solar benefits, i.e., ‘value of solar’ are levelized over an assumed 25-year system life. The levelization period in other studies can vary. 67 Distribution and sub-transmission avoided capacity cost benefits are grouped together in the ‘T&D’ category. Financial carbon costs are assigned to the ‘Environmental’ category. Non-financial quantified environmental impacts from SO2 and NOx along with Social Carbon Costs are assigned into the ‘Societal’ category.

P a g e | 45 |
Results
© 2015 Energy and Environmental Economics, Inc.
Figure 27: Levelized Value of Solar and NEM Benefit-Cost Studies Including Targeted NEM Scenario Results Including Both Direct and Non-Financial Benefits
We present below another ‘value of solar’ perspective that is ‘layered’ by comparing any
monetary net expenses of NEM to non-participants against both the direct financial benefits and
the non-financial societal benefits to create another ‘value of solar’ perspective. It is worth
noting that this perspective is not a ‘cost test’ to examine the financial impacts to non-
participating ratepayers, which could be performed under a Ratepayer Impact Measure per
industry standard practice.
The value of distributed solar PV, i.e., the ‘value of solar’, based on direct financial benefits
ranges from $0.08 to $0.16 per kWh of assumed solar PV production on a real68 levelized basis
for NEM systems installed in 2015 across our four defined scenarios (Lower NEM Value to
Higher NEM Value). When adding in the quantified non-financial societal benefits (these range
from $0.02 to $0.07 per kWh of assumed solar PV production) then the total ‘value of solar’
ranges from $0.10 to $0.23 per kWh.
68 A 2% inflation rate is assumed when determining the real economic levelization over the 25-year lifetime of the NEM systems.

P a g e | 46 |
Results
© 2015 Energy and Environmental Economics, Inc.
The difference between the ‘value of solar’ and the ratepayer expenses of NEM generation
(including bill savings, state incentives and NEM integration/program costs) ranges from -$0.08
to $0.05 per kWh of assumed solar PV production on a levelized basis for NEM systems installed
in 2015 across the four defined scenarios examined (Lower NEM Value to Higher NEM Value).
Figure 28: Layered ‘Value of Solar’ Perspective of NEM Ratepayer Expense vs. Total Financial and Non-Financial Benefits, Lower NEM Value Scenario, 2015 Vintage, Statewide, All Classes, Solar PV
$0.00
$0.02
$0.04
$0.06
$0.08
$0.10
$0.12
$0.14
$0.16
$0.18
$0.20
NEM RatepayerExpense
Direct FinancialBenefits
SO2 and Nox(Non-Financial
Benefits)
Social Cost of Carbon(Non-Financial
Benefit)
Total Value(Financial and Non-Financial Benefits)
Leve
lize
d C
ost
s/B
en
efit
s ($
20
15
/kW
h)
Customer Bill Savings Energy System Capacity LossesDistribution Capacity Monetized Carbon Ancillary Services Subtransmission CapacityMarket Price Effect State Incentives Integration Costs Program Costs

P a g e | 47 |
Results
© 2015 Energy and Environmental Economics, Inc.
Figure 29: Layered ‘Value of Solar’ Perspective of NEM Ratepayer Expense vs. Total Financial and Non-Financial Benefits, Untargeted NEM Scenario, 2015 Vintage, Statewide, All Classes, Solar PV
Figure 30: Layered ‘Value of Solar’ Perspective of NEM Ratepayer Expense vs. Total Financial and Non-Financial Benefits, Targeted NEM Scenario, 2015 Vintage, Statewide, All Classes, Solar PV
$0.00
$0.02
$0.04
$0.06
$0.08
$0.10
$0.12
$0.14
$0.16
$0.18
$0.20
NEM RatepayerExpense
Direct FinancialBenefits
SO2 and Nox(Non-Financial
Benefits)
Social Cost of Carbon(Non-Financial
Benefit)
Total Value(Financial and Non-Financial Benefits)
Leve
lize
d C
ost
s/B
en
efit
s ($
20
15
/kW
h)
Customer Bill Savings Energy System Capacity LossesDistribution Capacity Monetized Carbon Ancillary Services Subtransmission CapacityMarket Price Effect State Incentives Integration Costs Program Costs

P a g e | 48 |
Results
© 2015 Energy and Environmental Economics, Inc.
Figure 31: Layered ‘Value of Solar’ Perspective of NEM Ratepayer Expense vs. Total Financial and Non-Financial Benefits, Higher NEM Value Scenario, 2015 Vintage, Statewide, All Classes, Solar PV
Ratepayer expenses of NEM generation (including bill savings, state incentives and NEM
integration and program costs) range between $0.05 to $0.08 per kWh higher than the ‘value of
solar’ between Upstate (National Grid, ORU, RG&E, NYSEG, Central Hudson) and Downstate
(ConEd and PSEG Long Island) for NEM systems installed in 2015 in the Untargeted NEM
Scenario. These results do improve over time when looking at installations in 2025 due to lower
NEM installation costs and higher NEM value.
$0.00
$0.05
$0.10
$0.15
$0.20
$0.25
NEM RatepayerExpense
Direct FinancialBenefits
SO2 and Nox(Non-Financial
Benefits)
Social Cost of Carbon(Non-Financial
Benefit)
Total Value(Financial and Non-Financial Benefits)
Leve
lize
d C
ost
s/B
en
efit
s ($
20
15
/kW
h)
Customer Bill Savings Energy System Capacity LossesDistribution Capacity Monetized Carbon Ancillary Services Subtransmission CapacityMarket Price Effect State Incentives Integration Costs Program Costs

P a g e | 49 |
Results
© 2015 Energy and Environmental Economics, Inc.
Figure 32: Layered ‘Value of Solar’ Perspective of NEM Ratepayer Expense vs. Total Financial and Non-Financial Benefits, Upstate Utilities-Untargeted NEM Scenario, 2015 Vintage, All Classes, Solar PV
Figure 33: Layered ‘Value of Solar’ Perspective of NEM Ratepayer Expense vs. Total Financial and Non-Financial Benefits, Downstate Utilities-Untargeted NEM Scenario, 2015 Vintage, All Classes, Solar PV
$0.00
$0.02
$0.04
$0.06
$0.08
$0.10
$0.12
$0.14
$0.16
NEM RatepayerExpense
Direct FinancialBenefits
SO2 and Nox(Non-Financial
Benefits)
Social Cost of Carbon(Non-Financial
Benefit)
Total Value(Financial and Non-Financial Benefits)
Leve
lize
d C
ost
s/B
en
efit
s ($
20
15
/kW
h)
Customer Bill Savings Energy System Capacity LossesDistribution Capacity Monetized Carbon Ancillary Services Subtransmission CapacityMarket Price Effect State Incentives Integration Costs Program Costs
$0.00
$0.05
$0.10
$0.15
$0.20
$0.25
$0.30
NEM RatepayerExpense
Direct FinancialBenefits
SO2 and Nox(Non-Financial
Benefits)
Social Cost of Carbon(Non-Financial
Benefit)
Total Value(Financial and Non-Financial Benefits)
Leve
lize
d C
ost
s/B
en
efit
s ($
20
15
/kW
h)
Customer Bill Savings Energy System Capacity LossesDistribution Capacity Monetized Carbon Ancillary Services Subtransmission CapacityMarket Price Effect State Incentives Integration Costs Program Costs

P a g e | 50 |
Results
© 2015 Energy and Environmental Economics, Inc.
The difference between the ratepayer expenses of NEM generation (including bill savings, state
incentives and NEM integration/program costs) and the ‘value of solar’ from $0.01 to $0.09 per
kWh of assumed solar PV production on a levelized basis between non-residential and
residential customers for NEM systems installed in 2015 in the Untargeted NEM Scenario.
Figure 34: Layered ‘Value of Solar’ Perspective of NEM Ratepayer Expense vs. Total Financial and Non-Financial Benefits, Non-Residential Class -Untargeted NEM Scenario, 2015 Vintage, Statewide, All Classes, Solar PV
$0.00
$0.02
$0.04
$0.06
$0.08
$0.10
$0.12
$0.14
$0.16
$0.18
NEM RatepayerExpense
Direct FinancialBenefits
SO2 and Nox(Non-Financial
Benefits)
Social Cost of Carbon(Non-Financial
Benefit)
Total Value(Financial and Non-Financial Benefits)
Leve
lize
d C
ost
s/B
en
efit
s ($
20
15
/kW
h)
Customer Bill Savings Energy System Capacity LossesDistribution Capacity Monetized Carbon Ancillary Services Subtransmission CapacityMarket Price Effect State Incentives Integration Costs Program Costs
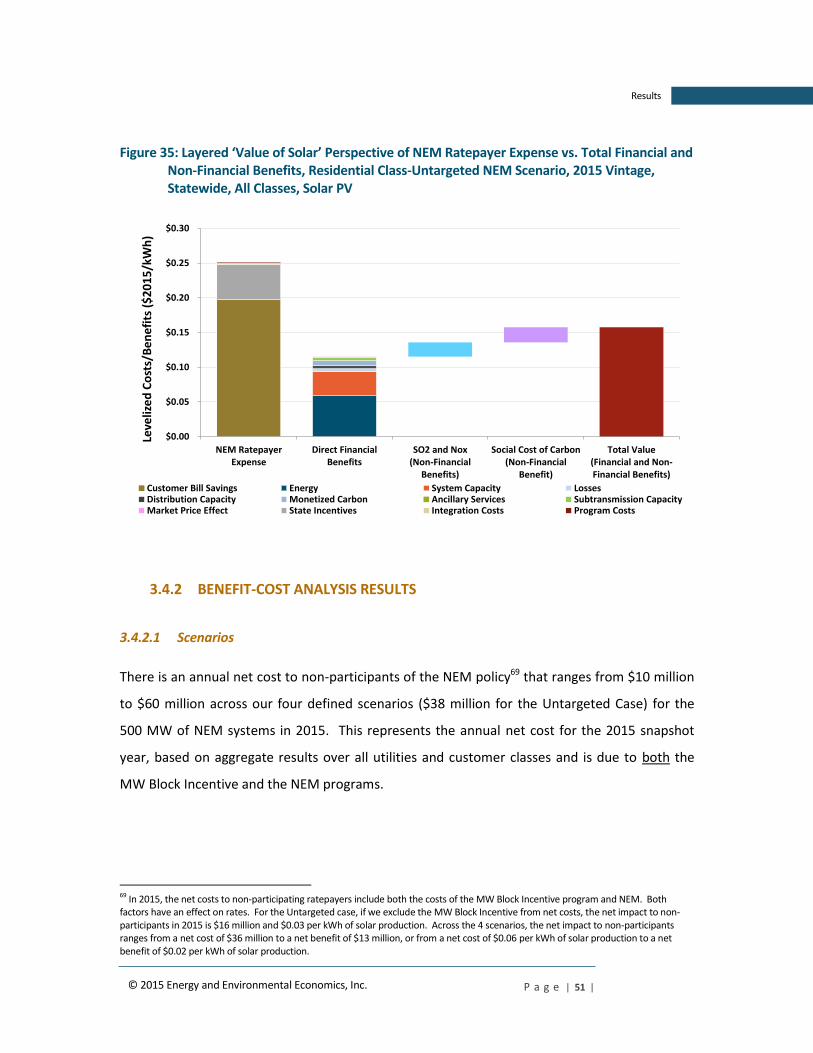
P a g e | 51 |
Results
© 2015 Energy and Environmental Economics, Inc.
Figure 35: Layered ‘Value of Solar’ Perspective of NEM Ratepayer Expense vs. Total Financial and Non-Financial Benefits, Residential Class-Untargeted NEM Scenario, 2015 Vintage, Statewide, All Classes, Solar PV
3.4.2 BENEFIT-COST ANALYSIS RESULTS
3.4.2.1 Scenarios
There is an annual net cost to non-participants of the NEM policy69 that ranges from $10 million
to $60 million across our four defined scenarios ($38 million for the Untargeted Case) for the
500 MW of NEM systems in 2015. This represents the annual net cost for the 2015 snapshot
year, based on aggregate results over all utilities and customer classes and is due to both the
MW Block Incentive and the NEM programs.
69 In 2015, the net costs to non-participating ratepayers include both the costs of the MW Block Incentive program and NEM. Both factors have an effect on rates. For the Untargeted case, if we exclude the MW Block Incentive from net costs, the net impact to non-participants in 2015 is $16 million and $0.03 per kWh of solar production. Across the 4 scenarios, the net impact to non-participants ranges from a net cost of $36 million to a net benefit of $13 million, or from a net cost of $0.06 per kWh of solar production to a net benefit of $0.02 per kWh of solar production.
$0.00
$0.05
$0.10
$0.15
$0.20
$0.25
$0.30
NEM RatepayerExpense
Direct FinancialBenefits
SO2 and Nox(Non-Financial
Benefits)
Social Cost of Carbon(Non-Financial
Benefit)
Total Value(Financial and Non-Financial Benefits)
Leve
lize
d C
ost
s/B
en
efit
s ($
20
15
/kW
h)
Customer Bill Savings Energy System Capacity LossesDistribution Capacity Monetized Carbon Ancillary Services Subtransmission CapacityMarket Price Effect State Incentives Integration Costs Program Costs

P a g e | 52 |
Results
© 2015 Energy and Environmental Economics, Inc.
Statewide levelized70 results for all cost tests are shown below.
Figure 36: Levelized Costs and Benefits, Lower NEM Value Scenario, 2015 Vintage, Statewide, All Classes, Solar PV
PCT RIM SCT
Benefit-Cost Ratio 1.10 0.45 0.73
70 The benefits and costs of NEM systems are levelized over the entire kWh production of these systems over an assumed 25-year life. The actual impacts on non-participant rates are much less, on the order of 0.1-0.5% impacts across scenarios, utilities, and customer classes.
Cost Benefit Cost Benefit Cost Benefit
Participant Cost Test Ratepayer Impact Measure Societal Cost Test
$0.00
$0.05
$0.10
$0.15
$0.20
$0.25
$0.30
Leve
lize
d C
ost
s/B
en
efit
s ($
/kW
h, $
20
15
)
Utility Avoided Costs Customer Bill Savings State Incentives Residential State Incentive
Integration Costs Capital Cost Federal Incentives Program Costs
Market Price Effect SOx Social Carbon NOx
$0.10/kWh net cost

P a g e | 53 |
Results
© 2015 Energy and Environmental Economics, Inc.
Figure 37: Levelized Costs and Benefits, Untargeted NEM Scenario, 2015 Vintage, Statewide, All Classes, Solar PV
PCT RIM SCT
Benefit-Cost Ratio 1.11 0.60 0.95
Figure 38: Levelized Costs and Benefits, Targeted NEM Scenario, 2015 Vintage, Statewide, All Classes, Solar PV
PCT RIM SCT
Benefit-Cost Ratio 1.11 0.76 1.06
Cost Benefit Cost Benefit Cost Benefit
Participant Cost Test Ratepayer Impact Measure Societal Cost Test
$0.00
$0.05
$0.10
$0.15
$0.20
$0.25
$0.30
Leve
lize
d C
ost
s/B
en
efit
s ($
/kW
h, $
20
15
)
Utility Avoided Costs Customer Bill Savings State Incentives Residential State Incentive
Integration Costs Capital Cost Federal Incentives Program Costs
Market Price Effect SOx Social Carbon NOx
$0.07/kWh net cost
$0.04/kWh net cost

P a g e | 54 |
Results
© 2015 Energy and Environmental Economics, Inc.
Figure 39: Levelized Costs and Benefits, Higher NEM Value Scenario, 2015 Vintage, Statewide, All Classes, Solar PV
PCT RIM SCT
Benefit-Cost Ratio 1.13 0.90 1.27
3.4.2.2 Downstate vs. Upstate
The net cost is higher for downstate utilities given their higher rates and ranges from $16 million
for upstate utilities71 to $23 million for downstate utilities across all customer classes for NEM
systems installed in 2015 in the Untargeted NEM Scenario.
71 More detailed utility-by-utility results can be found in the Appendix.
Cost Benefit Cost Benefit Cost Benefit
Participant Cost Test Ratepayer Impact Measure Societal Cost Test
$0.00
$0.05
$0.10
$0.15
$0.20
$0.25
$0.30
$0.35
Leve
lize
d C
ost
s/B
en
efit
s ($
/kW
h, $
20
15
)
Utility Avoided Costs Customer Bill Savings State Incentives Residential State Incentive
Integration Costs Capital Cost Federal Incentives Program Costs
Market Price Effect SOx Social Carbon NOx
$0.02/kWh net cost

P a g e | 55 |
Results
© 2015 Energy and Environmental Economics, Inc.
Figure 40: Levelized Costs and Benefits Comparison for Downstate vs. Upstate Utilities, Untargeted NEM Scenario, 2015 Vintage, All Classes, Solar PV
PCT RIM SCT
Downstate Upstate Downstate Upstate Downstate Upstate
Benefit-Cost Ratio 1.23 1.03 0.51 0.68 0.91 0.98
Cost Benefit Cost Benefit Cost Benefit Cost Benefit Cost Benefit Cost Benefit
Downstate Upstate Downstate Upstate Downstate Upstate
Participant Cost Test Ratepayer Impact Measure Societal Cost Test
$0.00
$0.05
$0.10
$0.15
$0.20
$0.25
$0.30
$0.35
$0.40
Leve
lize
d C
ost
s/B
en
efit
s ($
/kW
h)
Utility Avoided Costs State Incentives Residential State Incentive Customer Bill Savings
Integration Costs Capital Cost Federal Incentives Program Costs
Market Price Effect SOx Social Carbon NOx
$0.05/kWh net cost
$0.12/kWh net cost

P a g e | 56 |
Results
© 2015 Energy and Environmental Economics, Inc.
Figure 41: Levelized Costs and Benefits Comparison for Downstate vs. Upstate Utilities, Targeted NEM Scenario, 2015 Vintage, All Classes, Solar PV
PCT RIM SCT
Downstate Upstate Downstate Upstate Downstate Upstate
Benefit-Cost Ratio 1.23 1.03 0.67 0.84 1.04 1.08
3.4.2.3 2015 vs. 2025 Vintages
The economics for NEM systems are forecasted to improve across the board over time given
anticipated increases in technology performance and increases in forecast utility avoided costs
from 2015 to 2025.
Cost Benefit Cost Benefit Cost Benefit Cost Benefit Cost Benefit Cost Benefit
Downstate Upstate Downstate Upstate Downstate Upstate
Participant Cost Test Ratepayer Impact Measure Societal Cost Test
$0.00
$0.05
$0.10
$0.15
$0.20
$0.25
$0.30
$0.35
$0.40
Leve
lize
d C
ost
s/B
en
efit
s ($
/kW
h)
Utility Avoided Costs State Incentives Residential State Incentive Customer Bill Savings
Integration Costs Capital Cost Federal Incentives Program Costs
Market Price Effect SOx Social Carbon NOx
$0.02/kWh net cost
$0.08/kWh net cost

P a g e | 57 |
Results
© 2015 Energy and Environmental Economics, Inc.
Figure 42: Levelized Costs and Benefits Comparison for 2015 vs. 2025 Vintages, Untargeted NEM Scenario, Statewide, All Classes, Solar PV
PCT RIM SCT
2015 2025 2015 2025 2015 2025
Benefit-Cost Ratio 1.11 1.29 0.60 0.75 0.95 1.25
Cost Benefit Cost Benefit Cost Benefit Cost Benefit Cost Benefit Cost Benefit
2015 2025 2015 2025 2015 2025
Participant Cost Test Ratepayer Impact Measure Societal Cost Test
$0.00
$0.05
$0.10
$0.15
$0.20
$0.25
$0.30
Leve
lize
d C
ost
s/B
en
efit
s ($
/kW
h)
Utility Avoided Costs State Incentives Residential State Incentive Customer Bill Savings
Integration Costs Capital Cost Federal Incentives Program Costs
Market Price Effect SOx Social Carbon NOx
$0.07/kWh net cost
$0.04/kWh net cost

P a g e | 58 |
Results
© 2015 Energy and Environmental Economics, Inc.
Figure 43: Levelized Costs and Benefits Comparison for 2015 vs. 2025 Vintages, Targeted NEM Scenario, Statewide, All Classes, Solar PV
PCT RIM SCT
2015 2025 2015 2025 2015 2025
Benefit-Cost Ratio 1.11 1.29 0.76 0.93 1.06 1.43
3.4.2.4 Customer Classes
NEM systems are most cost effective for participants in the residential and small non-residential
classes, but these systems also impose the largest levelized net costs to non-participants which
is estimated to be $5 million for large non-residential, $15 million for small non-residential, and
$18 million for residential classes in the Untargeted NEM Scenario.
Cost Benefit Cost Benefit Cost Benefit Cost Benefit Cost Benefit Cost Benefit
2015 2025 2015 2025 2015 2025
Participant Cost Test Ratepayer Impact Measure Societal Cost Test
$0.00
$0.05
$0.10
$0.15
$0.20
$0.25
$0.30
Leve
lize
d C
ost
s/B
en
efit
s ($
/kW
h)
Utility Avoided Costs State Incentives Residential State Incentive Customer Bill Savings
Integration Costs Capital Cost Federal Incentives Program Costs
Market Price Effect SOx Social Carbon NOx
$0.04/kWh net cost
$0.01/kWh net cost

P a g e | 59 |
Results
© 2015 Energy and Environmental Economics, Inc.
Figure 44: Levelized Costs and Benefits, Residential Class, Untargeted NEM Scenario, 2015 Vintage, Statewide, Solar PV
PCT RIM SCT
Benefit-Cost Ratio 1.19 0.46 0.81
Figure 45: Levelized Costs and Benefits, Small Non-Residential Class, Untargeted NEM Scenario, 2015 Vintage, Statewide, Solar PV
PCT RIM SCT
Benefit-Cost Ratio 1.18 0.47 0.88
Cost Benefit Cost Benefit Cost Benefit
Participant Cost Test Ratepayer Impact Measure Societal Cost Test
$0.00
$0.05
$0.10
$0.15
$0.20
$0.25
$0.30
$0.35
$0.40
$0.45
Leve
lize
d C
ost
s/B
en
efit
s ($
/kW
h, $
20
15
)
Utility Avoided Costs Customer Bill Savings State Incentives Residential State Incentive
Integration Costs Capital Cost Federal Incentives Program Costs
Market Price Effect SOx Social Carbon NOx
Cost Benefit Cost Benefit Cost Benefit
Participant Cost Test Ratepayer Impact Measure Societal Cost Test
$0.00
$0.05
$0.10
$0.15
$0.20
$0.25
$0.30
$0.35
$0.40
Leve
lize
d C
ost
s/B
en
efit
s ($
/kW
h, $
20
15
)
Utility Avoided Costs Customer Bill Savings State Incentives Residential State Incentive
Integration Costs Capital Cost Federal Incentives Program Costs
Market Price Effect SOx Social Carbon NOx
$0.14/kWh net cost
$0.13/kWh net cost
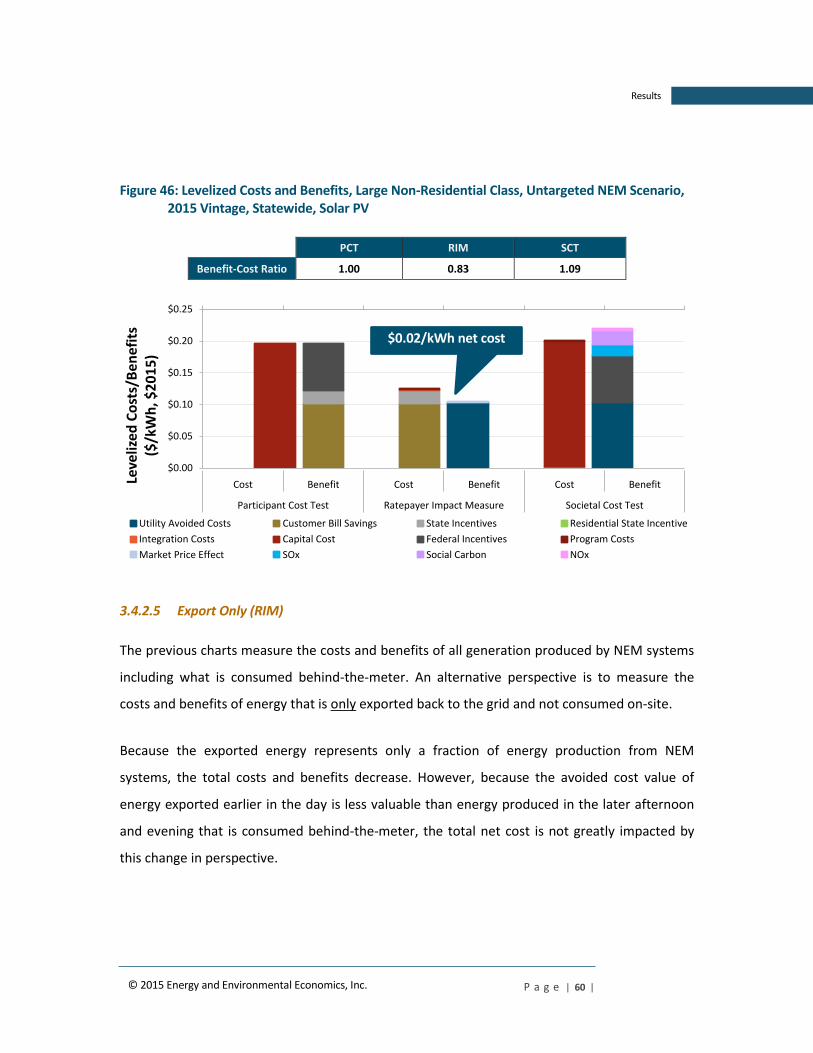
P a g e | 60 |
Results
© 2015 Energy and Environmental Economics, Inc.
Figure 46: Levelized Costs and Benefits, Large Non-Residential Class, Untargeted NEM Scenario, 2015 Vintage, Statewide, Solar PV
PCT RIM SCT
Benefit-Cost Ratio 1.00 0.83 1.09
3.4.2.5 Export Only (RIM)
The previous charts measure the costs and benefits of all generation produced by NEM systems
including what is consumed behind-the-meter. An alternative perspective is to measure the
costs and benefits of energy that is only exported back to the grid and not consumed on-site.
Because the exported energy represents only a fraction of energy production from NEM
systems, the total costs and benefits decrease. However, because the avoided cost value of
energy exported earlier in the day is less valuable than energy produced in the later afternoon
and evening that is consumed behind-the-meter, the total net cost is not greatly impacted by
this change in perspective.
Cost Benefit Cost Benefit Cost Benefit
Participant Cost Test Ratepayer Impact Measure Societal Cost Test
$0.00
$0.05
$0.10
$0.15
$0.20
$0.25
Leve
lize
d C
ost
s/B
en
efit
s ($
/kW
h, $
20
15
)
Utility Avoided Costs Customer Bill Savings State Incentives Residential State Incentive
Integration Costs Capital Cost Federal Incentives Program Costs
Market Price Effect SOx Social Carbon NOx
$0.02/kWh net cost

P a g e | 61 |
Results
© 2015 Energy and Environmental Economics, Inc.
Figure 47: All-Generation vs. Export-Only Ratepayer Impact Measure Results, Untargeted NEM Scenario, Statewide, All Classes, 2015 Vintage, Solar PV
3.4.2.6 Ratepayer Impacts
Impacts to non-participating ratepayers vary between scenario assumptions and customer
classes. It is important to note that the NEM program does create a net cost in the residential
class across all scenarios.
Cost Benefit Cost Benefit
All Generation Export-Only
$ MM
$200 MM
$400 MM
$600 MM
$800 MM
$1000 MM
$1200 MM
$1400 MM
$1600 MM
NP
V C
ost
s/B
en
efi
ts (
$2
01
5)
Utility Avoided Costs Customer Bill Savings State Incentives
Integration Costs Program Costs Market Price Effect

P a g e | 62 |
Results
© 2015 Energy and Environmental Economics, Inc.
Figure 48: Ratepayer Impact Measure Benefit-Cost Ratio by Scenario and Customer Class, Statewide, 2015 Vintage, Solar PV
Overall, the bill impacts of NEM net costs are relatively modest given the policy benefits. The
table below shows the estimated residential customer monthly bill impacts for 500 MW of solar
PV by scenario. This analysis assumes that any avoided revenues attributable to residential NEM
systems are fully collected within the residential customer class.
Figure 49: Residential Monthly Bill Impact, 500 MW of Statewide Solar PV, 2015 Vintage
Lower NEM Value Untargeted NEM Targeted NEM Higher NEM Value
+$0.35 +$0.27 +$0.20 +$0.15
3.5 Residential NEM Income Analysis Results
We find that residential NEM customers live in census tracts with a median household income that
has risen from an average of $65,704 in 2010 to $80,674 in 2015 (nominal $). In comparison, New
York’s median household rose from $55,603 to $59,568 during the same period. The average
Re
sid
en
tial
Smal
l No
n-R
es
Larg
e N
on
-Re
s
Re
sid
en
tial
Smal
l No
n-R
es
Larg
e N
on
-Re
s
Re
sid
en
tial
Smal
l No
n-R
es
Larg
e N
on
-Re
s
Re
sid
en
tial
Smal
l No
n-R
es
Larg
e N
on
-Re
s
Lower NEM Value Untargeted NEM Targeted NEM Higher NEM Value
0.00
0.20
0.40
0.60
0.80
1.00
1.20
1.40
Laye
red
RIM
Be
ne
fit-
Co
st R
ati
o
cost effective

P a g e | 63 |
Results
© 2015 Energy and Environmental Economics, Inc.
household income of customers installing NEM systems was 15-35% higher over this period than
the median New York State household income. The relative gap rose from a low of 15% in 2012 to
35% in 2015 in large part because of the increase in NEM adoptions by customers on Long Island.
We can conclude that NEM customers live in census tracts with slightly more expensive houses, a
slightly older population, a younger housing infrastructure, a higher fraction of owner-occupied
housing, and in much denser areas than the State’s overall average.
It is expected that New York’s new community distributed generation program should help
address the disproportionate participation of home-owners and single-family homes in the NEM
program which should make solar more accessible to more New Yorkers72.
Figure 50. Evolution of Household Income of NEM Customers Compared to NY Average Median Income
72 http://documents.dps.ny.gov/public/Common/ViewDoc.aspx?DocRefId={76520435-25ED-4B84-8477-6433CE88DA86}
40,000
50,000
60,000
70,000
80,000
90,000
100,000
through 2010 2011 2012 2013 2014 2015
Ho
use
ho
ld In
com
e ($
/yr
no
min
al)
Installation Year
NEM Customer Box Plot NEM Customer Average NY Average (ACS/ESRI)

P a g e | 64 |
Results
© 2015 Energy and Environmental Economics, Inc.
Figure 51. Dotted Line Represents NEM Customer Average Median Income without Long Island Customers
Figure 52: Household Income by NYISO Zone
A B C D E F G H I J K
Average NEM Customer Household Income (ESRI 2015) 61,640 60,865 60,703 58,672 53,441 68,744 81,617 102,263 98,996 76,549 94,645
Average Non-NEM Customer Household Income(estimate, ESRI 2015)
54,801 53,059 54,058 51,794 49,041 62,526 74,943 106,307 84,668 59,441 94,626
$0
$10,000
$20,000
$30,000
$40,000
$50,000
$60,000
$70,000
$80,000
$90,000
$100,000
$110,000
$120,000
20
15
$ A
nn
ua
l In
com
e

P a g e | 65 |
Results
© 2015 Energy and Environmental Economics, Inc.
Figure 53. Cumulative Residential Solar PV Installations in 2015 by NYISO Zone
Figure 54: Heat Map of Income Distribution of Residential Solar PV Adopters

P a g e | 66 |
Results
© 2015 Energy and Environmental Economics, Inc.
Figure 55: Residential NEM Customer Demographic Information
3.6 Public Purpose Charges and Cost of Service Discussion
After installing a NEM system, a customer experiences electric bill savings due to reduced
consumption, which means the utility is receiving less revenue from that customer including
reduced Public Purpose Charge revenues.
Depending on the underlying rate design of a NEM customer and how much that customer was
underpaying or overpaying its utility cost of service before installing a NEM system that
customer may end up paying less or more than its cost of service.
3.7 Non-Solar PV NEM Results
This study is focused on solar PV as the predominant technology that is net metered. This is
consistent with what has been observed in New York historically, which is a trend that is
expected to continue indefinitely in the future under the current NEM policy. Other non-solar
technologies are examined in this study, but cost information is less reliable, and resource
availability is much more localized (particularly for small hydro systems). The number of
adoptions of non-solar NEM generation is expected to remain low compared distributed solar
Based on ESRI Updated Demographic Data (2015). NY State Residential NEM Customers Avg.
Median Value of Owner-Occupied Housing Units ($) 297,946 335,923
Median Age 38.6 42.4
Average Year Housing Unit Built 1959 1966
Population Density (#/sq. mile) 419 5,311
Owner Occupied Housing Units / Housing Units 49% 67%
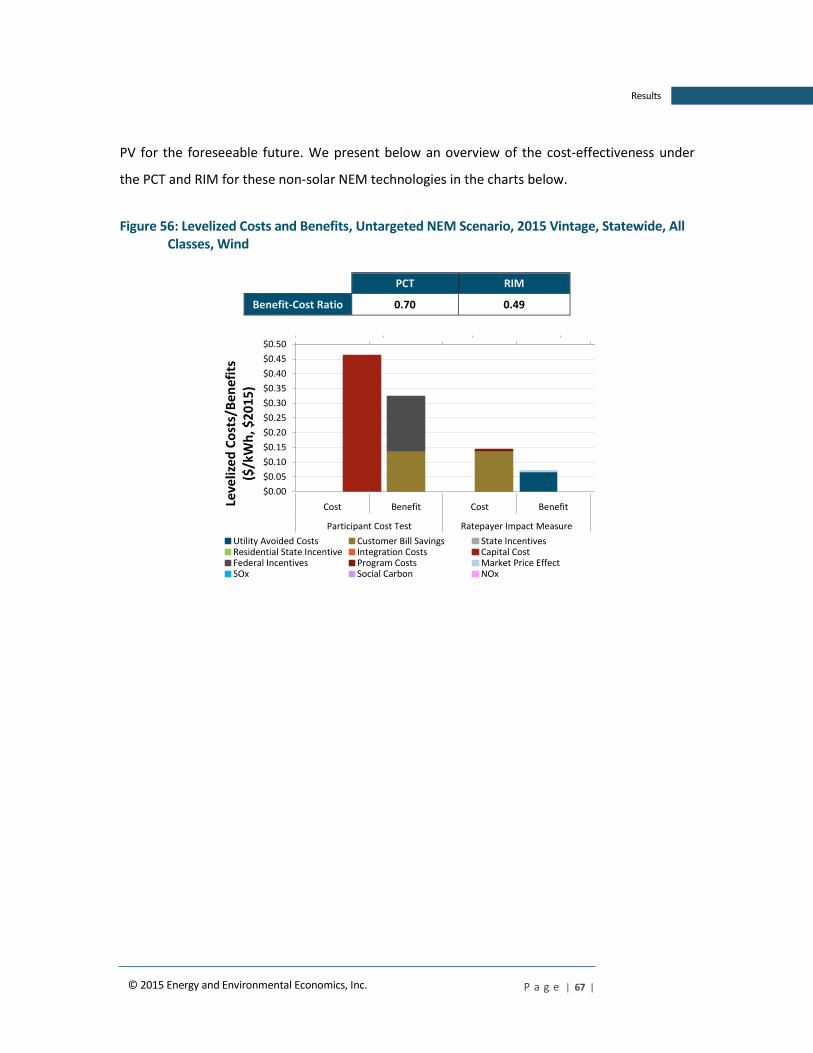
P a g e | 67 |
Results
© 2015 Energy and Environmental Economics, Inc.
PV for the foreseeable future. We present below an overview of the cost-effectiveness under
the PCT and RIM for these non-solar NEM technologies in the charts below.
Figure 56: Levelized Costs and Benefits, Untargeted NEM Scenario, 2015 Vintage, Statewide, All Classes, Wind
PCT RIM
Benefit-Cost Ratio 0.70 0.49
Cost Benefit Cost Benefit Cost Benefit
Participant Cost Test Ratepayer Impact Measure Societal Cost Test
$0.00
$0.05
$0.10
$0.15
$0.20
$0.25
$0.30
$0.35
$0.40
$0.45
$0.50
Leve
lize
d C
ost
s/B
en
efit
s ($
/kW
h, $
20
15
)
Utility Avoided Costs Customer Bill Savings State IncentivesResidential State Incentive Integration Costs Capital CostFederal Incentives Program Costs Market Price EffectSOx Social Carbon NOx

P a g e | 68 |
Results
© 2015 Energy and Environmental Economics, Inc.
Figure 57: Levelized Costs and Benefits, Untargeted NEM Scenario, 2015 Vintage, Statewide, All Classes, Small Hydro
PCT RIM
Benefit-Cost Ratio 2.79 0.52
Figure 58: Levelized Costs and Benefits, Untargeted NEM Scenario, 2015 Vintage, Statewide, All Classes, Anaerobic Digester Gas
PCT RIM
Benefit-Cost Ratio 0.47 0.53
Cost Benefit Cost Benefit Cost Benefit
Participant Cost Test Ratepayer Impact Measure Societal Cost Test
$0.00
$0.02
$0.04
$0.06
$0.08
$0.10
$0.12
$0.14
$0.16
$0.18
Leve
lize
d C
ost
s/B
en
efit
s ($
/kW
h, $
20
15
)
Utility Avoided Costs Customer Bill Savings State IncentivesResidential State Incentive Integration Costs Capital CostFederal Incentives Program Costs Market Price EffectSOx Social Carbon NOx
Cost Benefit Cost Benefit Cost Benefit
Participant Cost Test Ratepayer Impact Measure Societal Cost Test
$0.00
$0.05
$0.10
$0.15
$0.20
$0.25
$0.30
$0.35
$0.40
Leve
lize
d C
ost
s/B
en
efit
s ($
/kW
h, $
20
15
)
Utility Avoided Costs Customer Bill Savings State IncentivesResidential State Incentive Integration Costs Capital CostFederal Incentives Program Costs Market Price EffectSOx Social Carbon NOx

P a g e | 69 |
Results
© 2015 Energy and Environmental Economics, Inc.
Figure 59: Levelized Costs and Benefits, Untargeted NEM Scenario, 2015 Vintage, Statewide, All Classes, Micro Combined Heat and Power (<10 kW Residential)
PCT RIM
Benefit-Cost Ratio 0.56 0.48
Cost Benefit Cost Benefit Cost Benefit
Participant Cost Test Ratepayer Impact Measure Societal Cost Test
$0.00
$0.05
$0.10
$0.15
$0.20
$0.25
$0.30
$0.35
Leve
lize
d C
ost
s/B
en
efit
s ($
/kW
h, $
20
15
)
Utility Avoided Costs Customer Bill Savings State Incentives Residential State Incentive
Integration Costs Capital Cost Federal Incentives Program Costs
Market Price Effect SOx Social Carbon NOx

P a g e | 70 |
Conclusions
© 2015 Energy and Environmental Economics, Inc.
4 Conclusions
A range of reasonable input assumptions and results affect the cost-effectiveness of net
metered resources. There are also significant differences in results across utilities, the NEM
installation vintage,73 the customer class, and other key inputs that are captured in the four
defined scenarios used in the study. However, several key conclusions can be reached, which
are as follows:
Conclusion 1: NEM is a key component of the policy to encourage distributed renewable
generation in New York, most especially solar PV. However, while NEM offers a simple and
understandable tool for consumers, it is an imprecise instrument with no differentiation in
pricing for either higher or lower locational values or higher or lower value technology
performance (e.g. peak coincident energy production). The costs and benefits of NEM should be
monitored given the fast evolution of this market as contemplated in the recent PSC October 15,
2015 Order.74
Conclusion 2: After installing a NEM system, a customer experiences electric bill savings due to
reduced consumption, which means the utility is receiving less revenue from that customer
including reduced revenues for public purpose programs.75
73 This refers to the year the NEM systems are installed. It is expected that NEM system costs will decline over time. 74 http://documents.dps.ny.gov/public/Common/ViewDoc.aspx?DocRefId=%7B6D51E352-B4C8-48F9-9354-2B64B14546DC%7D 75 These public purpose charges range between $0.007 and $0.009 per kWh (or about $4 to $5 per month for the typical New York residential customer) and exist, largely, to reduce the pollution caused by electricity consumption and generation. These charges are collected on a per kWh basis since these program costs and benefits are caused by kWh consumption and production. NEM customers who now consume less kWh compared to non-NEM customers therefore lower their payment on these charges on a kWh per kWh basis, i.e., every kWh they generate, they avoid paying $0.007 to $0.009 per kWh. Alternatively every kWh NEM customers generate is one kWh that does not produce the harmful emissions. This prevention of harmful emissions is one of the reasons these programs were created.

P a g e | 71 |
Conclusions
© 2015 Energy and Environmental Economics, Inc.
Conclusion 3: The results from cost-effectiveness analysis estimate how much non-participating
customers may be paying to enable NEM achievements. Direct financial net costs are borne by
non-participating ratepayers across most scenarios and most years of the analysis, especially in
the residential customer classes. This analysis shows that potential rate impacts in 2015 for non-
participants range between $0.0001 and $0.0004 per kWh across the four defined scenarios
(aggregated across each utility and customer class). Unless forecasted NEM adoptions increase
much more than expected (i.e., based on the current NY-Sun policy goals), the direct financial
net costs of the NEM program will remain relatively modest from a statewide perspective, i.e.,
result in less than an approximately 0.3% annual rate impact in 2015.
Conclusion 4: In some cases the non-financial societal benefits of NEM systems, i.e., GHG
mitigation and improved air quality, when added to the financial benefits, may be greater than
the direct financial costs of NEM.
Conclusion 5: Depending on the underlying rate design of a NEM customer and their specific
consumption pattern, there will be variations around whether an individual customer was
underpaying or overpaying its utility cost of service before and after installing a NEM system,
which may result in that customer paying less than its cost of service.76
Conclusion 6: For NEM systems installed in 2015, there is a net cost to society (financial and
non-financial benefits are approximately 5% less than costs) over the lifetime of these systems
in the baseline scenario. However, with a reasonable assumption of forecasted capital cost
declines and increases in benefits it was found that there is a net benefit to society for NEM
systems installed in 2025 over the lifetime of these systems (financial and non-financial benefits
are approximately 25% higher than costs). If NEM systems can be targeted to higher value
locations on the distribution grid, then there is a net benefit to society for both systems installed
in 2015 (financial and non-financial benefits higher than costs by 6%) as well as in 2025 (financial
and non-financial benefits higher than costs by 43%).
76 Rate design for customers varies significantly by utility and by type of customer class. Generally speaking, residential customer retail rates are designed to recover the utility’s cost to serve that class based on average usage and consumption, with over 90% of all variable and fixed costs collected volumetrically on a per kWh basis. However, many customers are not average and by definition any below average or above average customer may not pay the actual cost the utility incurs to serve that specific type of customer. These considerations are inherent and accepted in utility ratemaking.
P a g e | 72 |
Conclusions
© 2015 Energy and Environmental Economics, Inc.
Conclusion 7: Current NEM customers tend to have higher incomes than average statewide
customers, although not necessarily higher incomes than households in their immediate
geographic regions (e.g. Long Island). Furthermore, NEM customers live in census tracts with
slightly more expensive houses, a slightly older population, a younger housing infrastructure, a
higher fraction of owner-occupied housing, and in much denser areas than the State’s overall
average.
It is expected that New York’s new community distributed generation program should help
address the disproportionate participation of home-owners and single-family homes in the NEM
program, which should make solar more accessible to more New Yorkers.