Embed Size (px)
Citation preview

The End of the Boom: Private higher education in Mexico in the
first decade of the 21st century1 Germán Álvarez Mendiola* Abstract. This work is part of current research focused on private higher education in Mexico,
under an economic sociology approach of the education market and territorial integration. The paper
focuses on four key topics: the current characteristics of growth and supply of private higher
education; the forms that its territorial distribution in the country adopts; some general features of the
economy of private higher education as the business size in the national economy and the price
structure; and the relationship between changes in the regulatory environment and strategies of private
institutions to gain social legitimacy and competitiveness. Keywords: Economics of private higher education, Higher education in Mexico, Private higher
education, Regulation of private higher education, Territorial distribution of private higher education
Introduction A not uncommon image of private higher education in Mexico is that of a low quality sector with high
growth. In social imaginary the exemptions are the expensive and elitist institutions because they
enjoy a good reputation. But for many actors, especially academics, private institutions pursue
obscure for-profit purposes, opposed to the disinterested search of knowledge.
However, this picture is simplistic and inaccurate. The private sector of Mexican higher
education has outpaced the explosive expansion period and the quality of institutions is highly
differentiated. In some cases, profit motives may involve savage capitalist behavior, but in others the
earnings are not incompatible with the quality and continuous improvement of institutions. This is a
huge market, complex and heterogeneous, which needs to be systematically known. This paper is
* Professor at Educational Research Department, Centre for Research and Advanced Studies, DIE-Cinvestav, Mexico city/ Visiting Professor at Faculty of Education, University of British Columbia, Vancouver, BC, Canada, e-mail: [email protected] 1 A previous version of this paper was published in Spanish (Álvarez, 2011). In this version, the text has been edited and the data have been updated.
1

part of research that seeks to broaden the knowledge about private higher education, under an
economic sociology approach of the education market and its territorial integration.2
It focuses upon four key topics of private higher education in Mexico: current characteristics of
growth and supply; forms that its territorial distribution adopts; some general features of the economy
of private higher education, as the business size in the national economy, and the price structure; and
the relationship between changes in the regulatory environment and strategies of private institutions to
gain social legitimacy and competitiveness.
Growth slows its pace
In the early 1990s, the growth of private higher education was explosive, as a result of the population
growth, the increase in the completion of secondary education and the low public investment to meet
the new demand in a context of weak regulation on the private sector and of strengthening of higher
education markets.3 In 1990 this sector concentrated 198,000 students, 18% of total undergraduate
enrollments. In 2000, it reached 525,000 students, which constituted 30.6% of the enrollments.
The 165% increase in enrollment in the private sector during those ten years generated a profound
reshaping of Mexican higher education (Table 1).
Table 1. Enrollment in bachelor’s programs in Mexico, 1990-2000
1990 2000 Growth % 1990-2000
Public 898,934 1,192,959 32.71 % 81.93 69.44 Private 198,207 525,058 164.90 % 18.07 30.56 Total 1,097,141 1,718,017 56.59 % 100 100 Source: Based on data of SEP-UPEPE/DGPyP (SEP, s.f.)
2 This project was financed by CONACYT in its initial phase. It has involved colleagues from several Mexican universities. Miguel Casillas, Ragueb Chaín, Juan Carlos Ortega and Cristina Miranda (Universidad Veracruzana); Juan Carlos Silas (ITESO University); Antonio Gómez Nashiki (University of Colima); and Patricia Fernandez (University of the Altiplano). Nora Hilda Martínez Sánchez (Universidad de Monterrey), José Manuel Asún (Universidad Cristobal Colón); and Angelica Buendía Espinosa (UAM Xochimilco) have collaborated at various times through this project. In a second phase of the project, besides the mentioned colleagues, collaborated on the project Adrian Acosta and Francisco Silva Gama (Universidad de Guadalajara); Guillermo Tapia (Universidad Iberoamericana León, Guanajuato); Jose Raul Ramirez and Juan Pablo Durán (Universidad de Sonora); Wietse de Vries (Universidad Autónoma de Puebla); Jesus Galaz (Universidad Autónoma de Baja California); Pilar Baptista (Universidad Anahuac); Mitzi Morales, Brenda Pérez and Karen Soto, PhD students of DIE-CINVESTAV. 3 The characteristics of the enormous growth of private higher education in the early nineties were explored by Kent and Ramirez (1999), Rodríguez (2004), Acosta (2005) and Silas (2005), among others.
Higher Education Forum2 Vol. 12

Undergraduate enrollment in the decade 2000-2010
In the last decade the total public and private enrollment grew almost equivalent to a percentage of the
previous decade. But the novelty was the end of the trend of rapid expansion of the private sector.
Compare otherwise: between 1990 and 2000, the sector grew 165%, but between 2000 and 2010 it
increased 53.2%. In contrast, from 1990 to 2000 the public sector grew 32.7% and achieved a
growth of 54.2% over the next decade (Tables 1 and 2). This sector regained dynamism to the point
that the distribution of enrollment reached 69.6% for the public sector and 30.4% for the private
(Table 2). The Ministry of Education estimates that the public sector will continue to increase its
share to over 70% from 2015.
Table 2. Enrollment in bachelor’s programs in Mexico, 2000-2010
2000 2010 Growth % 2000-2010
Public 1,192,959 1,839,896 54.23 % 69.44 69.58 Private 525,058 804,301 53.18 % 30.56 30.42 Total 1,718,017 2,644,197 53.91 % 100 100.00 Source: Based on data of SEP-UPEPE/DGPyP (SEP, s.f.)
Source: SEP-UPEPE/DGPyP (SEP, s.f.) Note: estimated from the 2008-2009 school year data.
Figure 1. Percentage distribution of undergraduate enrollment by sector, 1990-2015
The stabilization of the percentage distribution of enrollment across sectors that emerged in the
decade 2000-2010 is explained by the growth of government funding that allowed expansion of the
public sector (cfs. Tuirán, 2011). Existing institutions expanded their enrollments, while new public
0
10
20
30
40
50
60
70
80
90
Public
Private
Germán Álvarez MendiolaMarch 2015 3

institutions (technological and polytechnic universities, technological institutes, intercultural
universities) were created as part of a policy of institutional differentiation, diversification of
educational provision, and quality assurance.
It should be mentioned that the development of higher education has been very heterogeneous
among the thirty-two states in the Mexican Republic. The distribution of enrollment between the
public and private sectors in the states is highly variable, which expresses different levels of
privatization. However, due to the expansion of the public sector, there will be a noticeable reduction
in the private sector in the vast majority of states. Some figures illustrate the phenomenon:
Guanajuato no longer has the levels of privatization of the previous decade (59.4% in 2000) and from
the middle of this decade will no longer be the state with the highest percentage of private enrollment.
Something similar has begun to occur with other states that had a very high private enrollment as
Puebla, Chiapas and Jalisco. Several states that had reached between 37% and 40% of their
enrollment in the private sector have begun to decrease these percentages as Nuevo Leon and Morelos.
A set of states will be located around the national average and others come to have less than 20% of
their enrollment in the private sector.4
The postgraduate
In the decade 2000-2010 the postgraduate showed accelerated growth, especially in the private sector.
In Mexico it is still an educational level with small numbers of students, but draws attention to the
dynamism that has been adopted and the strong percentage of the private sector. The business
opportunities have been transferred to the masters, a characteristic phenomenon of the early nineties,
and, surprisingly, to doctorates, a phenomenon of the 2000s.
The expansion of this level reflects the needs of a workforce with bachelor’s degrees that require
updating and improving its competitive ability to move up in the labor market. As workers, many
students must take their classes on weekends, evenings or online modes. A portion of them is
composed of teachers who have been demanded to increase their qualifications to access to stimuli
schemes and achieve promotions. All this expresses a progressive increase in the symbolic and
economic value of graduate degrees, which does not necessarily imply that students acquire
knowledge and skills at a high level due to the overall low quality of these programs.
In 1990, nearly 46,000 students were enrolled in graduate school, of which 80.6% of whom were
in public and 19.4% in private institutions. This changed substantially by the end of that decade. In
the 2000-2001 school year there were almost 129,000 students enrolled in graduate school, of whom
4 There are several factors that explain this variability. Ongoing investigations suggest that the behavior of the demand for education must be located in larger urban settings (metropolitan areas, metropolitan areas). For example, in Tlaxcala part of the demand for private options moved to the city of Puebla, under the Metropolitan Region Puebla-Tlaxcala (Fernandez, 2008, 2010).
Higher Education Forum4 Vol. 12
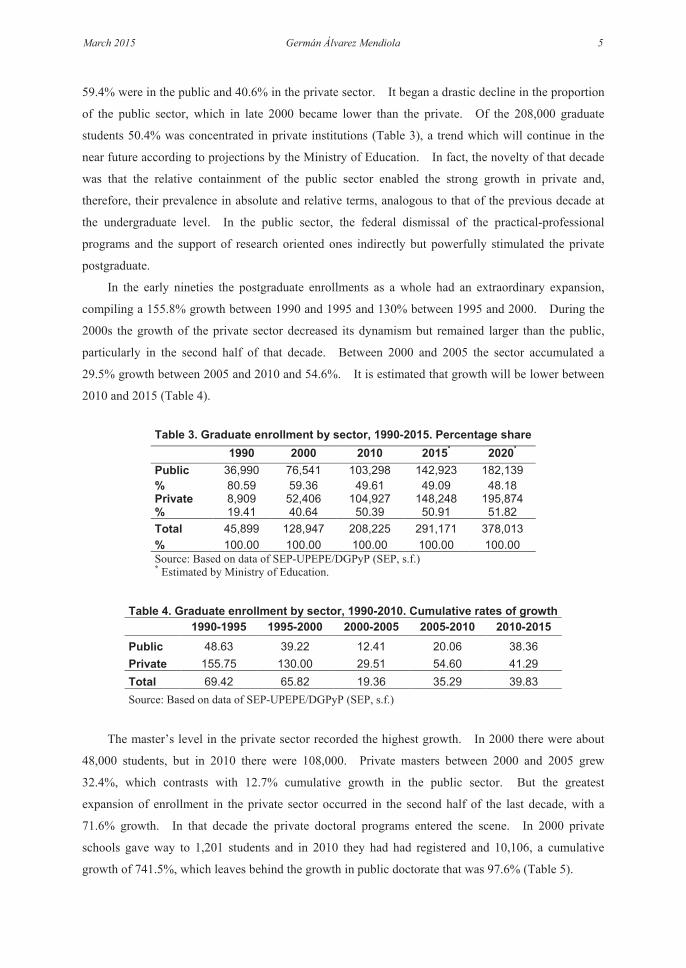
59.4% were in the public and 40.6% in the private sector. It began a drastic decline in the proportion
of the public sector, which in late 2000 became lower than the private. Of the 208,000 graduate
students 50.4% was concentrated in private institutions (Table 3), a trend which will continue in the
near future according to projections by the Ministry of Education. In fact, the novelty of that decade
was that the relative containment of the public sector enabled the strong growth in private and,
therefore, their prevalence in absolute and relative terms, analogous to that of the previous decade at
the undergraduate level. In the public sector, the federal dismissal of the practical-professional
programs and the support of research oriented ones indirectly but powerfully stimulated the private
postgraduate.
In the early nineties the postgraduate enrollments as a whole had an extraordinary expansion,
compiling a 155.8% growth between 1990 and 1995 and 130% between 1995 and 2000. During the
2000s the growth of the private sector decreased its dynamism but remained larger than the public,
particularly in the second half of that decade. Between 2000 and 2005 the sector accumulated a
29.5% growth between 2005 and 2010 and 54.6%. It is estimated that growth will be lower between
2010 and 2015 (Table 4).
Table 3. Graduate enrollment by sector, 1990-2015. Percentage share 1990 2000 2010 2015* 2020*
Public 36,990 76,541 103,298 142,923 182,139 % 80.59 59.36 49.61 49.09 48.18 Private 8,909 52,406 104,927 148,248 195,874 % 19.41 40.64 50.39 50.91 51.82 Total 45,899 128,947 208,225 291,171 378,013 % 100.00 100.00 100.00 100.00 100.00 Source: Based on data of SEP-UPEPE/DGPyP (SEP, s.f.) * Estimated by Ministry of Education.
Table 4. Graduate enrollment by sector, 1990-2010. Cumulative rates of growth
1990-1995 1995-2000 2000-2005 2005-2010 2010-2015 Public 48.63 39.22 12.41 20.06 38.36 Private 155.75 130.00 29.51 54.60 41.29 Total 69.42 65.82 19.36 35.29 39.83 Source: Based on data of SEP-UPEPE/DGPyP (SEP, s.f.)
The master’s level in the private sector recorded the highest growth. In 2000 there were about
48,000 students, but in 2010 there were 108,000. Private masters between 2000 and 2005 grew
32.4%, which contrasts with 12.7% cumulative growth in the public sector. But the greatest
expansion of enrollment in the private sector occurred in the second half of the last decade, with a
71.6% growth. In that decade the private doctoral programs entered the scene. In 2000 private
schools gave way to 1,201 students and in 2010 they had had registered and 10,106, a cumulative
growth of 741.5%, which leaves behind the growth in public doctorate that was 97.6% (Table 5).
Germán Álvarez MendiolaMarch 2015 5
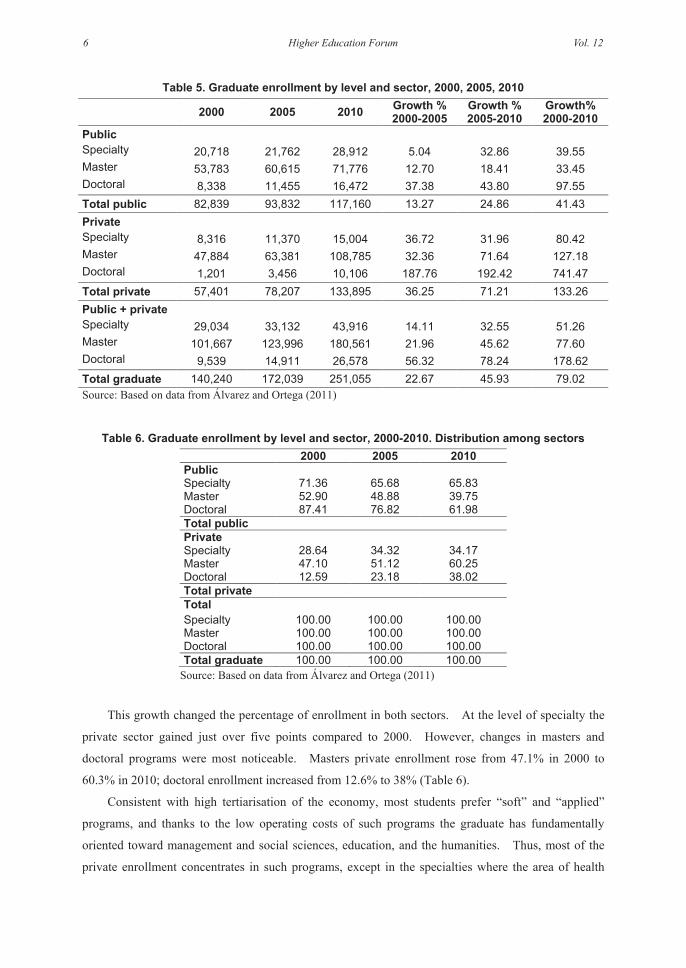
Table 5. Graduate enrollment by level and sector, 2000, 2005, 2010 2000 2005 2010 Growth %
2000-2005 Growth % 2005-2010
Growth% 2000-2010
Public Specialty 20,718 21,762 28,912 5.04 32.86 39.55 Master 53,783 60,615 71,776 12.70 18.41 33.45 Doctoral 8,338 11,455 16,472 37.38 43.80 97.55 Total public 82,839 93,832 117,160 13.27 24.86 41.43 Private Specialty 8,316 11,370 15,004 36.72 31.96 80.42 Master 47,884 63,381 108,785 32.36 71.64 127.18 Doctoral 1,201 3,456 10,106 187.76 192.42 741.47 Total private 57,401 78,207 133,895 36.25 71.21 133.26 Public + private Specialty 29,034 33,132 43,916 14.11 32.55 51.26 Master 101,667 123,996 180,561 21.96 45.62 77.60 Doctoral 9,539 14,911 26,578 56.32 78.24 178.62 Total graduate 140,240 172,039 251,055 22.67 45.93 79.02 Source: Based on data from Álvarez and Ortega (2011)
Table 6. Graduate enrollment by level and sector, 2000-2010. Distribution among sectors 2000 2005 2010 Public Specialty 71.36 65.68 65.83 Master 52.90 48.88 39.75 Doctoral 87.41 76.82 61.98 Total public Private Specialty 28.64 34.32 34.17 Master 47.10 51.12 60.25 Doctoral 12.59 23.18 38.02 Total private Total Specialty 100.00 100.00 100.00 Master 100.00 100.00 100.00 Doctoral 100.00 100.00 100.00 Total graduate 100.00 100.00 100.00
Source: Based on data from Álvarez and Ortega (2011)
This growth changed the percentage of enrollment in both sectors. At the level of specialty the
private sector gained just over five points compared to 2000. However, changes in masters and
doctoral programs were most noticeable. Masters private enrollment rose from 47.1% in 2000 to
60.3% in 2010; doctoral enrollment increased from 12.6% to 38% (Table 6).
Consistent with high tertiarisation of the economy, most students prefer “soft” and “applied”
programs, and thanks to the low operating costs of such programs the graduate has fundamentally
oriented toward management and social sciences, education, and the humanities. Thus, most of the
private enrollment concentrates in such programs, except in the specialties where the area of health
Higher Education Forum6 Vol. 12

prevails. Little more than half of master students and 26% of doctoral students are enrolled in social
sciences and education. With a few exceptions, given the nonexistence of quality controls, these
programs almost are true “diploma mills”.
National war, local battles: Establishments and their territorial distribution
In 2014, 2,493 private companies in undergraduate education were recorded.5 Considering that in
2000 there were 915 institutions, there has been spectacular growth in the number of privates, in a
context of deceleration of private enrollment growth (Table 7). This situation implies a fierce
competition among private institutions to capture a demand which has not grown to the high rates of
the early nineties or the first half of the decade since 2000. On average, private establishments have
less and less students. A lot of the student demand for private schools tends to be captured by large
companies that are organized as systems or networks and distributed in various parts of the country,
displacing medium and small local institutions. On the other hand, a myriad of very small
establishments compete fiercely to attract demand from students who have no interest in large
corporations either for academic or financial reasons.
Table 7. Number of private institutions and private higher education enrollment,
2000, 2005, 2010 2000 2005 2010 2014 Institutions 915 1,450 2,064 2,493 Enrollment 525,058 683,539 804,301 941,154 Ratio 573.83 471.41 389.68 377.52 Source: Based on data of SEP-UPEPE/DGPyP (SEP, s.f.) and Álvarez and Ortega (2011)
This set of institutions has spread in the territory, either around the country, regions and states or
cities. Establishments are very different in size, organization and territorial distribution, but most are
small institutions. The occupation of the country has been part of expansion strategies to approach of
supply locations where higher education previously was not, or was to a lesser extent. As Zacarías
Ramírez (2008, 108) said: “the war for enrollments is national, but the battles are local.” In 2000
only 7.4% of the 2,554 municipalities in the country had some private establishments of higher
education, but in 2010 the proportion rose to 13% (Álvarez & Ortega, 2011). Although private
institutions have expanded in virtually all states, the distribution is extremely uneven. Some entities
provide to a great extent places to private institutions, for example the Federal District where the
private sector is in 94% of the municipalities (delegations in this case), or Baja California where it
occupies 80% of the municipalities. At the opposite end is Oaxaca where private higher education is
only present in 2% of its municipalities (Álvarez & Ortega, 2011).
5 Based on data from: The Query System of Educational Programs with Official Validity. Retrieved September 2014, from http://www.sirvoes.sep.gob.mx/sirvoes/reportes/jspRepInstituciones.jsp
Germán Álvarez MendiolaMarch 2015 7

The territorial differentiation
Private sector growth is expressed differentially in shaping of territorial distribution of institutions.
Two facts stand out: first, the development and strengthening of institution clusters which are
organized as systems and networks at various levels of territorial coverage, and second, the emergence
of a myriad of different size isolated establishments. In summary, one can detect six types of
institutions in accordance with the territorial organization of the distribution of services6:
1) National systems and networks, which also operate as regional networks:
• Medium and long tradition (secular and religious);
• Newly emerging (international or national capital);
• Smaller but with national influence and religious orientation.
2) Multi-regional networks, usually with main seat in a region.
3) Regional networks (national or international capital).
4) State systems (several cities in same state).
5) Urban systems multi-site or multi-campus.
6) Institutions alone, with a single campus.
At the national level, four systems or networks dominate the private sector for its geographic
expansion and number of students: 1) the Laureate network, of international capital, comprising the
Universidad del Valle de Mexico (UVM), Universidad Tecnológica de México (UTM) and the
Universidad del Desarrollo Profesional (UDP); 2) the Tecnológico de Monterrey System, covering
the Instituto Tecnológico de Estudios Superiores de Monterrey (Tec de Monterrey) and Universidad
Tec Milenio; 3) Anahuac Universities Network is part of Anahuac Educational Consortium, which
includes the Universidades Anahuac, Institutos de Estudios Superiores and Universidad
Interamericana para el Desarrollo; and 4) the Universidad CNCI network, which has a smaller
enrollment but wide geographic coverage in the country.
Each of these networks covers almost all the national territory and has different prestige and
pricing: Tec de Monterrey is located on top, followed by the Universidad Anahuac and UVM. Also
inside networks reputations are clearly segmented. They are distinguished by having a sort of
“second division” responsible to compete for medium purchasing power students through a less
prestigious offer and cost.
6 These paragraphs are indebted to Roberto Rodriguez, who wrote a series of articles in which he exposed the central idea of the configuration of networks and university systems as ways that the market has to bring supply to demand. Rodriguez basically distinguishes national networks, regional networks and religious networks (Rodriguez, 2008).
Higher Education Forum8 Vol. 12

The Laureate network, on the other hand, marks the beginning of foreign investment in private
higher education in Mexico, an important development of the decade. The CNCI University, which
has a presence in twenty states and forty branches, is a different case because it does not have
equivalent recognition of the others; it is inexpensive; has a reduced offer of undergraduate three-year
programs; and offers face services on only in two campuses.
All these networks, except Universidad CNCI, integrate institutions offering programs in more
than two areas of knowledge in the undergraduate and graduate levels. Also all of them except
Universidad CNCI have a defined business orientation even if they are not incorporated as
corporations. It is listed on the stock exchange and is organized under a franchise model. The
Anahuac Network adds a religious vocation to its side business. Together, these four networks have
over 170,000 students, representing 20% of private enrollment.
Other networks are those that have spread in various regions without covering the entire country.
The prestige and price of services vary because there is also strong segmentation. The most
prestigious are the Jesuit University System and the network of La Salle universities followed by
UNIVA, all three of which are religious. At the opposite extreme are networks which do not have
accredited programs nor belong to the Federation of Private Mexican Institutions of Higher Education
(FIMPES) and, therefore, have low prestige, as UNIVER or the Instituto de Estudios Universitarios.
Judged by the number of students they have, these establishments are medium and large size with
5,000, 10,000, and over 25,000 students.
The more geographically limited regional networks include universities such as Universidad
Autónoma del Noreste, the Universidad de Tijuana and the Universidad Latinoamericana. The last
was acquired by Apollo Global International Group in 2008, which owns the University of Phoenix,
well known for its profit guidance, huge extension through its offices in forty-two American states and
online programs. These universities have enrollments between 5,000 and 10,000 students.
Networks located in various cities of the same state, with some enclaves in other states in certain
cases, are another kind of establishment which has recently emerged. They are generally medium
size given the number of students they serve. Other institutions are located in a single city with
multiple locations and in some few cases branches in other states. They are small or medium size
institutions which seek to bring educational programs to the students in urban centers. The last type
is the institutions that have one or two locations in the same city. It is a vast, dispersed and generally
inexpensive set of institutions which lack significant professional or academic recognitions but attract
students from lower economic levels. However, in this set there are institutions with specialized,
expensive and presumably higher academic standards and more prestigious programs. These two
types account for the vast majority of private institutions but their enrollments are not as important as
are the big national, multi-regional and regional networks.
Thus, both the dominance of networks in the market and the relative displacement of the smaller
institutions are one of the most important processes in the last decade. These new configurations
Germán Álvarez MendiolaMarch 2015 9

express how private institutions seek to capture demand and grow their businesses through the
provision of educational services both in areas where there is already public or private higher
education and urban peripheries and medium or small cities where there was none a few years before.
At the same time, networks represent corporate strategies to displace other institutions, especially
small and medium size ones which are forced to compete with large and increasingly powerful
companies. It is an urban and regional process of oligopolization of the private higher education
market which emerges as a result of business expansion through economies of scale that the larger
companies can perform thereby reducing competitive capacities of small organizations.
National, multi-regional, regional, and state networks are owned by business groups. In some
cases they are powerful national or international consortia and in others religious corporations (Jesuits,
Opus Dei, Legionaries of Christ, Marist, Lasallian, diocesan Catholic Church), usually organized
under the figures of civil associations or civil societies. Urban institution types are usually owned by
families of professionals, politicians, and (former) public sector officials, and are also grouped under
types of civil societies or associations. Civil associations are required to reinvest profits and civil
societies must pay taxes on them in a special scheme with some fiscal exemptions.
The next section presents some data on the profit margin which these companies view as an
economic sector. Specialized research in Mexico has not elucidated how these organizations
distribute their profits among the partners, except those organized as corporations. Nevertheless
there is some evidence of rights sales (or shares), a kind of non-transparent stock market.7 Some
institutions belong to larger corporations whose real estate and services companies sell or lease them
various products or properties. Others open investment funds to obtain revenues. And most pay
very expensive salaries to owners and their relatives who usually occupy leadership positions in
institutions.
A large business
Private higher education is undoubtedly a business and is part of an industry with knowledge, titles,
and multiple services that generates wealth. As with the prices of educational services, this industry
comprises different types of institutions. This section discusses some ideas on prices in private
higher education. Moreover, in order to know its size and importance as an economic activity, the
participation of private education in the gross domestic product and the profit margins that available
figures allow us to glimpse are analyzed.
Price differentiation
7 Wietse De Vries (2008) commented that the ETAC University of Puebla was one of these cases.
Higher Education Forum10 Vol. 12

Segmentation is clearly expressed in the prices of services and programs offered by the institutions.
The price range in the industry is huge, with highly polarized extremes. A simple exercise made with
data of institutions that offer business management programs allows one to approach this issue.
There are three major segments 8 : the consumer elite; the average consumption, and the low
consumption. The first is a very small segment, highly diversified in its offerings, with some
specialized establishments, and occupying high cost specific niches. The second is an extended
segment, with different prices and levels of diversification. The latter is also very wide by the
number of institutions covered but tends to be lowly diversified.
According to this exercise, one finds that 10.2% of business administration programs lie in the
range of elite institutions; 49.7% in institutions of intermediate income students and 40.15% in low
income students (Table 8). Since one can assume that the prices of management and business
administration programs are reasonably representative of price segmentation of the education market,
then possibly the entire private sector has a similar structure: a small number at the top, a broad band
in the middle and slightly less fraction in the base.9
The price range in each of these bands is very wide (Table 9). For example, in elite institutions
the annual price of the program ranges between US$10,000 to US$24,000 annually, similar to the
prices of many public and private universities in the United States. In institutions of intermediate
consumption price range is wider: they range from US$2,000.00 to US$9,600. Institutions for low
spending poor students are among US$219.00 and US$1,960.00.
These data provide insight into the segmentation of private sector by prices, but one must be
cautious because the prices announced by the institutions are not necessarily real ones. There are
policies that include discounts, grants-credit, exemptions and fees for other services. Therefore, these
data can only approximate the odds of students entering certain types of institutions, given the
economic capacities of their families. They show the enormous variability of prices, especially in the
intermediate and low segments, confirming the existence of a very large market composed of
applicants with heterogeneous economic capacity and aspirations.
Based on case studies (Morales, 2011), it is possible to know that some institutions of low and
intermediate segments develop lower cost options to attract students from lower strata. Also, other
institutions deploy strategies to capture higher economic strata demand through the opening of new
programs, improving services, and therefore increase the tuition and other charges. A reverse
phenomenon has occurred with elite institutions that own second level options to cater to the lower
strata of clientele. For example, the Tec Milenio belongs to the Tec de Monterrey and the
Universidad Tecnológica UNITEC to the Universidad del Valle de Mexico.
8 Based on the Estrada and Gil Anton (2007) scheme on a hypothetical spending of 25% of household income in private institutions. 9 Comparing prices in courses in each institution reveals that there are no major differences, except in programs such as Medicine, Architecture, Graphic Design and Gastronomy. Murayama (2009) confirms this assessment.
Germán Álvarez MendiolaMarch 2015 11

The 2008 economic crisis affected the dynamics of private education, and one result was the
development of pricing policies and products to retain enrollment, manage overdue loans more
efficiently, and save utilities. Thus, several institutions expanded their student loan programs;
applied discounts and offered extended terms for payment of debts; and closed unprofitable programs
or canceled courses, all of which has also involved staff cuts and diversification of offerings such as
weekend, “executive” (three-year), and online programs. In sum, they are companies looking to
maximize their profits. Due to the lack of quality culture and controls in the private sector, one of the
major problems of this capitalist behavior is that, as De Vries (2008) pointed out, the students could be
the losers and the investors the winners.
Table 8. Number of management programs of private sector by price segments included in the analysis
Program of the sample % of the sample Elite 80 10.17 intermediate 391 49.68 Lower 316 40.15 Total 787 100.00 Source: Data calculated with data available in ANUIES (2007). They represent 57.2% of 1,381 business administration programs cataloged for ANUIES.
Table 9. Ranges and rates of management programs, 2006. Approximate prices in 2006 dollars
Annual price range Total price of the program Type Lower Larger Lower Larger Elite 10,004.19 23,794.12 42,517.79 107,073.56 Intermediate 1,978.85 9,620.87 7,915.40 38,483.50 Lower 219.87 1,960.16 989.43 8,822.37 Source: Data calculated with data available in ANUIES (2007). For the 2006 annual average price of the American dollar: Banco de Mexico. Available from http://www.banxico.org.mx/SieInternet/consultarDirectorioInternetAction.do?accion=consultar Cuadro&idCuadro=CF373§or=6&locale=es
Towards an economy of private higher education
The role of private higher education in generating national wealth and profits is not well known in
Mexico. Economic studies on this area are scarce10. However, this kind of economic activity is of
great importance. In a first approximation, this section discusses some national data on private
10 Kent (2004) has ventured into the study of state markets, from a sociological perspective close to the political economy; Murayama (2009) devoted part of his work to the study of prices, household spending and percentage of private expenditure in total expenditure on higher education; Estrada and Gil Anton (2007) exercised price and type of students (income levels); Acosta (2005) has described some features of the marketing strategies of the private sector and De Vries (2008) discussed the impact on educational opportunities in the areas of low cultural capital.
Higher Education Forum12 Vol. 12
higher education’s contribution to Mexico’s GDP and its profits over the last decade (INEGI, 1999,
2004, 2009; Álvarez & Ortega, 2011).
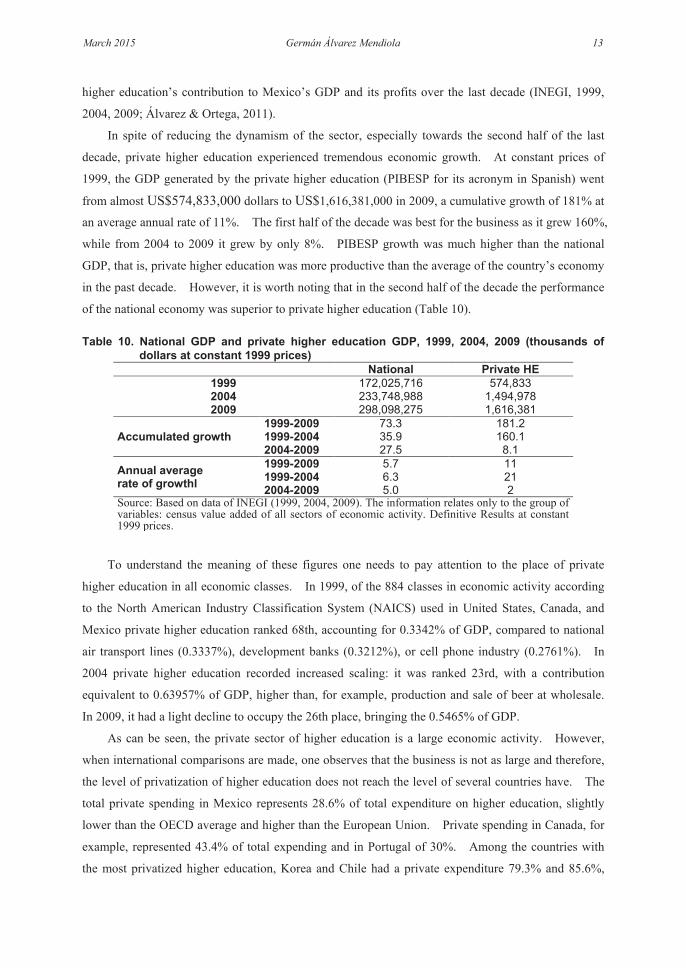
In spite of reducing the dynamism of the sector, especially towards the second half of the last
decade, private higher education experienced tremendous economic growth. At constant prices of
1999, the GDP generated by the private higher education (PIBESP for its acronym in Spanish) went
from almost US$574,833,000 dollars to US$1,616,381,000 in 2009, a cumulative growth of 181% at
an average annual rate of 11%. The first half of the decade was best for the business as it grew 160%,
while from 2004 to 2009 it grew by only 8%. PIBESP growth was much higher than the national
GDP, that is, private higher education was more productive than the average of the country’s economy
in the past decade. However, it is worth noting that in the second half of the decade the performance
of the national economy was superior to private higher education (Table 10). Table 10. National GDP and private higher education GDP, 1999, 2004, 2009 (thousands of
dollars at constant 1999 prices)
National Private HE 1999 172,025,716 574,833 2004 233,748,988 1,494,978 2009 298,098,275 1,616,381
Accumulated growth 1999-2009 73.3 181.2 1999-2004 35.9 160.1 2004-2009 27.5 8.1
Annual average rate of growthl
1999-2009 5.7 11 1999-2004 6.3 21 2004-2009 5.0 2
Source: Based on data of INEGI (1999, 2004, 2009). The information relates only to the group of variables: census value added of all sectors of economic activity. Definitive Results at constant 1999 prices.
To understand the meaning of these figures one needs to pay attention to the place of private
higher education in all economic classes. In 1999, of the 884 classes in economic activity according
to the North American Industry Classification System (NAICS) used in United States, Canada, and
Mexico private higher education ranked 68th, accounting for 0.3342% of GDP, compared to national
air transport lines (0.3337%), development banks (0.3212%), or cell phone industry (0.2761%). In
2004 private higher education recorded increased scaling: it was ranked 23rd, with a contribution
equivalent to 0.63957% of GDP, higher than, for example, production and sale of beer at wholesale.
In 2009, it had a light decline to occupy the 26th place, bringing the 0.5465% of GDP.
As can be seen, the private sector of higher education is a large economic activity. However,
when international comparisons are made, one observes that the business is not as large and therefore,
the level of privatization of higher education does not reach the level of several countries have. The
total private spending in Mexico represents 28.6% of total expenditure on higher education, slightly
lower than the OECD average and higher than the European Union. Private spending in Canada, for
example, represented 43.4% of total expending and in Portugal of 30%. Among the countries with
the most privatized higher education, Korea and Chile had a private expenditure 79.3% and 85.6%,
Germán Álvarez MendiolaMarch 2015 13

respectively.11
It is clear that private participation in higher education spending in Mexico increased during the
past decade: in 2000 it was 20.6% and in 2010 30.12%. From 2005 to 2008 the proportion of private
expenditure recorded a slight decrease in line with the slowdown in enrollment growth in the private
sector. It is possible that the general slowdown in the economy has had important impacts on the
economic capacity of families in those years. However, at the beginning of this decade private
participation experienced a recovery that raised its percentage to unprecedented levels: Mexican
families that year contributed 33% of spending on tertiary education, which meant that the proportion
of public expenditure recorded, in turn, a historical decrease (Figure 2).
Sources: OECD (2013, Table B3.3.; 2014, Table B3.2c.)
Figure 2. Distribution of public and private expenditure on tertiary education, Mexico 1995-2011
Despite the relative recovery of public spending, the increase of private participation in the
decade meant that families, presumably those of lower economic strata, had to assume a significant
portion of education spending. Public spending tends to benefit richer households of the population,
with little benefit for the poor. In 2000, the lowest income decile accounted for 1.2% of public
expenditure and in 2006 for 0.9%. In a completely opposite direction, in 2000 the richest families
were benefited with 10.4% of the public expenditure on higher education, in 2006 with 13% and in
2010 with 37% (SHCP, 2002, 2009, 2012). Thus, the rich enjoy greater public resources while
disadvantaged persons are more likely to be excluded from the public sector and therefore to swell
private spending. Because of the obstacles to getting a place in public institutions they do not have
other options than pay for private education. This situation is inequitable and exclusionary to all
11 Based on data from OECD (2010, Table B3.1.) Relative proportions of public and private expenditure on educational institutions, for all levels of education (2000, 2007).
-
10.00
20.00
30.00
40.00
50.00
60.00
70.00
80.00
90.00
1995 2000 2005 2008 2009 2010 2011
PublicPrivate
Higher Education Forum14 Vol. 12

lights.
While the private sector in Mexico is not too large compared to other countries, it is a very
profitable business for their profit margin and, therefore, is very attractive to investors, especially for
its low operating costs, particularly in institutions that do not offer expensive programs such as
medicine.
According to 1999 Economic Census data, this sector has entered almost US$1,200 million and
spent $967 million, giving a difference of 16.11%, a significant margin that grew over the decade. In
2004 it was 28.7% and in 2009 29.4%. The revenue increased 118.8% in the decade and spending
84.2%, but it is surprising that the difference increased 299% (Table 11). If income increased more
than the outcome it is because investment declined proportionately and the enterprises deployed
policies in order to maximize profits. In sum, during the second half of the decade the private sector
was less dynamic in income received and expenses incurred, but retained a large margin between the
two.
Table 11. Income and expenditures of private higher education, 1999, 2004 and 2009
(Thousands of constant 1999 dollars) Cumulated growth %
1999 2004 2009 1999-2000 2004-2009 1999-2009 Income 1,152,205 1,932,438 2,520,897 67.72 30.45 118.79 Expenditure 966,597 1,377,871 1,780,259 42.55 29.20 84.18 Difference 185,607 554,568 740,639 198.79 33.55 299.04 % 16.11% 28.70% 29.38% Source: Based on data of INEGI (1999, 2004, 2009). The information relates only to the group of variables: Total income of private higher education and Total expenditure of private higher education.
In search of legitimacy
The absence of public policies and lax regulatory environment for private higher education that
characterized the early nineties have been giving way to greater oversight by the federal government
and some still precarious efforts to boost educational quality. In 2000, as part of the initial effort to
bring quality criteria to private institutions and simplify administrative procedures, the SEP began
issuing a Record of Excellence Academic to institutions that previously met the requirements for
academic staff, facilities, plans, and curricula 12 . With this arrangement, also known as
“administrative simplification”, the Ministry of Education may authorize the curricula of certain
institutions without submitting the syllabi to federal authorities, and recognizes its power to
authenticate certificates, diplomas, and degrees (Rodríguez, 2004).
Some changes began in 2003 and 2004 when various actors (rectors of major public and private
universities, educational researchers, and communicators) questioned the low quality of the “duck
12 Meet the percentages of full-time faculty; have a minimum of 10 years teaching higher education Official Recognition of Validity Studies (REVOE) not received sanctions for the past three years and be accredited.
Germán Álvarez MendiolaMarch 2015 15

universities” (Rodriguez, 2004). Soon after, in 2005 the controversy was revived with the strong
participation of the Mexican Federation of Private Institutions of Higher Education (FIMPES).
These controversies took their toll on the federal government, which took over the concerns set out by
the previous administration in the National Education Program 2001-2006 regarding the expansion of
low quality programs that should be addressed by revising the regulatory framework (Rodríguez,
2006). The route was oiling the machinery of execution and inspection of the Register of Official
Validity of Studies (RVOE for its acronym in Spanish); making progress toward building a
coordinated system of RVOE; and implementing a Program to Promote Quality in Private Institutions
in 201013. In an effort to overcome the lag in RVOE, update the authorization of programs; impose
sanctions on non-compliance and, thereby keep pace with the rhythm of creation of educational
programs. The shift began to be better defined in 2005 of the total existing RVOE, over 65% were
granted between 2005 and 2010. Between 2007 and 2009, the Ministry of Education performed more
than 9,000 regular and special inspections and initiated 4,893 sanction procedures in which RVOE
were denied to 1497 programs (22.1% of all programs) (SEP-SES, 2011).
In some states like Puebla local authorities notified institutions that they should initiate processes
of accreditation examinations and apply selection for students (Kent, 2004). The Sub Secretary for
Higher Education, Rodolfo Tuirán (2011: 13) noted that in the framework of the National Council of
Education Authorities (CONADEU for its acronym in Spanish) together with the state education
authorities, the Ministry of Education would trigger a common management model of RVOE. The
lack of coordination and the existence of numerous state instruments applied with different criteria and
rigor for official recognition is a problem that has added complications to the regulation of the sector.
So since 2007 federal and state educational authorities sign a coordination covenant to unify the
standards (SEP-CONADEU, 2010a).14
In October, 2010, the federal government launched the Program for the Promotion of Quality in
Private Institutions (SEP-CONAEDU, 2010b), in order to develop quality processes in private
institutions, providing information to the public about them; and promoting coordination with local
authorities of education. The program was voluntary, based on commitments and incentives of
prestige and social recognition. Each participating institution has developed a self-assessment and
improvements schedule and signed a letter of commitment to be published on the Ministry’s website.
13 Honor to whom honor is due: some predictions of Roberto Rodríguez (2004, 457) have been fulfilled: “The SEP [Ministry of Education by its acronyms in Spanish] will recognize the existence and severity of the problem”; “The SEP will look deeper into the trend for standardizing the current criteria of RVOE between the federation and the states”; “The SEP, in convergence with the traditional private universities, will insist on a single assessment framework that includes the RVOE as a first step on the road to full institutional accreditation”. 14 To date, the important but scant, developments are the construction of a system of official recognition (SIRVOES by its acronym in Spanish) to store, share and query data; making a diagnosis on RVOE in the states and presenting a set of recommendations to standardize RVOE and its operation in terms of facilities, staff, plans and programs of study, assessment and monitoring service, general aspects; systems RVOE request line, request system information online institutions, and online information for the general public (SEP-CONADEU, 2010b).
Higher Education Forum16 Vol. 12

However, this regulatory effort lost steam in late 2012. The new government has lost interest in
this issue and, instead, preferred to apply their efforts on expanding enrollment in public institutions.
This bureaucratic and formalistic scheme focused on paperwork has not been replaced by a modern
scheme focused on accreditation of programs and verifiable commitments, and it is not clear that the
REVOE will be progressively oriented towards mandatory accreditation as a condition for being
granted or denied.
The activism that the federal government deployed to the private sector until 2012, riding the
wave of vilification that loomed over private education in the first half of the last decade, was well for
some private schools that directed their attention to the quality criteria that educational policy has
developed for the public sector and made use of them to recover or increase their social legitimacy.
Also the quality criteria have been useful for private institutions to guide their improvement processes.
However, at the same time, to have better symbolic resources in the competition for social prestige and
clientele and thus, redesign their pricing structures. If RVOE criteria were made stricter in the future
and accreditation of academic programs were required, the private institutions that have advanced the
accreditation of their programs would be better positioned in the educational market as offering a
higher quality image which will give them the best conditions in order to compete in a market that no
longer expand as well as in the nineties.
Conclusions
The landscape of private higher education in Mexico changed during the first decade of this century.
A strong expansion phase was changed to lower growth. While the economic importance of the
activity of the private sector became very large, a reduction in its dynamism can be observed from the
second half. In the decade as a whole the sector outperformed the economy of the country’s
economic performance, but between 2004 and 2009 its performance was lower.
Yet businesses continue. The profits are still very attractive and have increased significantly.
It can be explained by the decline in investment and spending on personal services and amenities,
seeking to maximize profits.
The huge market created by approximately 976,000 students enrolled in a universe of 2,493
institutions is highly segmented. At the top there are elite institutions and programs with very high
prices; in the intermediate sector the price range is very wide, an expression of the great population
range that constitutes the middle classes; in the lower sector the price range is also broad.
These institutions have adopted different ways of territorial organization which distribute their
services and win markets: from large national, multi-regional and regional networks to medium and
small institutions with branches in one state or one city, and to isolated, usually very small and low-
priced institutions, although there are exceptions for some specialized institutions. Networks
concentrate between a third and a half of private enrollment, which makes them the dominant forms of
Germán Álvarez MendiolaMarch 2015 17

regional and state markets that displace smaller organizations.
The federal government made efforts through 2012 to improve the processes of formal
recognition of programs and launched a program to promote quality educational establishments on the
basis of a classification of institutions in accordance with the accreditation of programs. With this
proposal the government intended that accreditation be a requirement for programs to obtain the
RVOE. But in the last two years the federal government has chosen to concentrate on expanding
public enrollment and to proceed no further in improving the regulatory framework for the private
sector.
Several private institutions, however, have seen accreditation as a way to increase their
legitimacy and add value to their services in the market of titles, a strategy to improve its competitive
position. This would not have been achieved without increasing social perception of the low quality
of a large number of private institutions to the point to have reversed the common and simplistic idea
that the private sector was, per se, better than the public. For several private establishments, criteria
and quality paths proposed by the federal government for public institutions have become an important
reference point. This may bring some order to the private sector, although it is doubtful that
significant improvements in the quality of education will be seen in all institutions.
In sum, the public sector has increased the speed of its growth and the private has declined both
in terms of enrollment and economic output. The era of almost limitless prosperity came to an end at
the conclusion of the last decade and, instead, a much more competitive but little regulated market
forces the actors to redefine their positions to avoid losing business opportunities.
References Acosta, A. (2005). La educación superior privada en México, IESALC – UNESCO. Retrieved from
http://www.iesalc.unesco.org.ve
Álvarez, G. (2011). El fin de la bonanza. La educación superior privada en México en la primera
década del siglo XXI. Reencuentro, 60, 10-29. Universidad Autónoma Metropolitana-Xochimilco.
Álvarez, G., & Ortega, J.C. (2011). Sistema de Consulta de la Estadística 911 de Educación Superior.
Mexico, Universidad Veracruzana and DIE-Cinvestav. Retrieved from
http://consulta911.wikispaces.com/
Asociación Nacional de Universidades e Instituciones de Educación Superior (ANUIES). (2007).
Catálogo de Licenciatura Universitaria y Tecnológica 2006. Mexico: ANUIES.
ANUIES. (2010). Anuario Estadístico 2009. Mexico: ANUIES.
De Vries, W. (2008). Capitalismo académico, estilo mexicano. Campus Milenio, 302.
Estrada, N., & Gil Antón, M. (2007). De “¿cuál te pinta mejor?” a “¿para cuál te alcanza?”:
Higher Education Forum18 Vol. 12

Desigualdad e inequidad social en el acceso a la educación superior en México. Revista
Electrónica de Investigación Educativa, 9 (1). Retrieved from
http://redie.uabc.mx/vol9no1/contenido-gil3.html
Fernández, P. (2008). Nuevas configuraciones geográficas de educación superior; factores que
influyen en la distribución de la oferta y la demanda; una revisión del periodo 1996-97 y 2005-
06 en México. Ponencia presentada en la. XII Conferencia de la Educación Superior en América
del Norte. Consorcio para la Colaboración de la Educación Superior en América del Norte.
CONAHEC. Monterrey, Nuevo León, Mexico, October 8-10, 2008.
Fernández, P. (2010). La competencia en la educación privada en la región Puebla-Tlaxcala Research
advances. Seminar on Private Higher Education. Mexico, DIE-Cinvestav.
Fernández, P. (2014). La concentración de la educación superior en la región metropolitana Puebla-
Tlaxcala: Factores que han fortalecido la demanda en las instituciones de educación Private.
Período 2000-2010. Doctoral Dissertation in Regional Development, El Colegio de Tlaxcala,
Mexico.
Instituto Nacional de Estadística y Geografía (INEGI). (1999). Censos Económicos 1999. Retrieved
from http://www.inegi.org.mx/est/contenidos/Proyectos/ce/Default.aspx
INEGI. (2004). Censos Económicos 2004. Retrieved from
http://www.inegi.org.mx/est/contenidos/Proyectos/ce/Default.aspx
INEGI. (2009). Censos Económicos 2009. Retrieved from
http://www.inegi.org.mx/est/contenidos/Proyectos/ce/Default.aspx
Kent, R. (2004). Private Sector Expansion and Emerging Policy Responses in Mexican Higher
Education. 17th Annual Conference of the Consortium of Higher Education Researchers, Center
for Higher Education Policy Studies, University of Twente, The Netherlands, September 17-19,
2004.
Kent, R., & Ramírez, R. (1999). Private higher education in Mexico: Growth and differentiation. In
P.G. Albatch (Ed.), Private Prometheus. Private Higher Education and Development in the 21st
Century (pp. 85-99). Westport, Conn.: Greenwood Press.
Morales, M. (2011). La legitimidad institucional como poder competitivo. El caso del Campus
Universitario Siglo XXI, institución privada del segmento medio del mercado en el Estado de
México. Master’s thesis, DIE-Cinvestav, Mexico
Murayama, C. (2009). La economía política de la educación superior en México. Mexico: ANUIES.
Organization for Economic Co-operation and Development (OECD). (2010). Education at a Glance
2010: OECD Indicators. Retrieved from http://www.sourceoecd.org/9789264055988
OECD. (2013). Education at a Glance 2013: OECD Indicators; Table B3.3. Trends in relative
proportions of public expenditure on educational institutions and index of change. Available from
http://www.oecd.org/edu/EAG2013_ENG_TC_B3.xls
OECD. (2014). Education at a Glance 2014: OECD Indicators; Table B3.2c. Trends in relative
Germán Álvarez MendiolaMarch 2015 19

proportion of public expenditure on tertiary educational institutions and index of change in public
and private expenditure. Available from http://dx.doi.org/10.1787/888933117440
Ramírez, Z. (2008). El boom de las aulas. Expansión, 998.
Rodríguez, R. (2004). Entre lo público y lo privado: la polémica de las universidades patito. In G.T.
Bertussi (Ed.), Anuario Educativo Mexicano. Visión retrospectiva (pp.431-467). Mexico: Miguel
Ángel Porrúa and UPN.
Rodríguez, R. (2006). Relaciones peligrosas. La polémica sobre universidades patito y las
negociaciones SEP-FIMPES en torno al RVOE (primera parte). Campus Milenio, 164.
Rodríguez, R. (2008). Sistemas Universitarios del sector privado. Campus Milenio, 270.
Secretaría de Educación Pública (SEP). (s.f.). Sistema de estadísticas continúas. SEP, UPEPE/DGPyP.
Retrieved from http://www.snie.sep.gob.mx/estadisticas_educativas.html
SEP. (several years). Estadística Básica del Sistema Educativo Nacional. Inicio de Cursos.
SEP-CONAEDU. (2010a). Acuerdos Aprobados. Twenty Second Annual National Plenary Meeting of
Education Authorities National Council, Mexico City, Mexico, November 12, 2010.
SEP-CONAEDU. (2010b). La participación de las instituciones educativas particulares e el sistema
educativo nacional. SEP-CONAEDU, Mexico, March.
SEP-CONAEDU. (2010c). Programa de Fomento a la Calidad de la Educación Superior. SEP, SES,
Mexico. Retrieved from
http://www.acepev.mx/congreso/biblioteca/presentaciones_congreso/Material_4/Programa%20fo
mento%20calidad.ppt
SEP-SES. (2011). Programas con RVOE Federal. Otorgamiento, Inspección y Vigilancia. Retrieved
from http://ses2.sep.gob.mx/inspeccion/MenuCuadrosEst-C.html.
Secretaría de Hacienda y Crédito Público (SHCP). (2002). Distribución del pago de impuestos y
recepción del gasto público por deciles de hogares y personas ordenados por nivel de ingreso.
Resultados para el año 2000. SHCP (Ministry of Finance), México. Retrieved from
http://www.shcp.gob.mx/INGRESOS/Ingresos_dist_pagos/04_art_29_lif_2004.pdf
SHCP. (2009). Distribución del pago de impuestos y recepción del gasto público por deciles de
hogares y personas ordenados por nivel de ingreso. Resultados para el año de 2006. SHCP
(Ministry of Finance), México. Retrieved from
http://www.shcp.gob.mx/INGRESOS/Ingresos_dist_pagos/ingreso_gasto_art25_LIF2009.pdf
SHCP. (2012). Distribución del pago de impuestos y recepción del gasto público por deciles de
hogares y personas ordenados por nivel de ingreso. Resultados para el año 2010. SHCP
(Ministry of Finance), México. Retrieved from
http://www.shcp.gob.mx/INGRESOS/Ingresos_dist_pagos/documento_ingreso_gasto_2010_11_i
ii_13.pdf
Silas, J.C. (2005). Realidades y tendencias en la educación superior privada mexicana. Perfiles
Educativos, 27(109/110), 7-37.
Higher Education Forum20 Vol. 12

Tuirán, R. (2011). La educación superior en México: avances, rezagos y retos. SEP, Mexico.
Retrieved from
http://ses.sep.gob.mx/wb/ses/la_educacion_superior_en_mexico_avances_rezagos_y_
Germán Álvarez MendiolaMarch 2015 21