Embed Size (px)
Citation preview
ORIGINAL ARTICLE
The emergence of attractors under multi-level institutionaldesigns: agent-based modeling of intergovernmental decisionmaking for funding transportation projects
Asim Zia • Christopher Koliba
Received: 28 February 2013 / Accepted: 28 November 2013
� Springer-Verlag London 2013
Abstract Multi-level institutional designs with distrib-
uted power and authority arrangements among federal,
state, regional, and local government agencies could lead to
the emergence of differential patterns of socioeconomic
and infrastructure development pathways in complex
social–ecological systems. Both exogenous drivers and
endogenous processes in social–ecological systems can
lead to changes in the number of ‘‘basins of attraction,’’
changes in the positions of the basins within the state
space, and changes in the positions of the thresholds
between basins. In an effort to advance the theory and
practice of the governance of policy systems, this study
addresses a narrower empirical question: how do inter-
governmental institutional rules set by federal, state, and
regional government agencies generate and sustain basins
of attraction in funding infrastructure projects? A pattern-
oriented, agent-based model (ABM) of an intergovern-
mental network has been developed to simulate real-world
transportation policy implementation processes across the
federal, the state of Vermont, regional, and local govern-
ments for prioritizing transportation projects. The ABM
simulates baseline and alternative intergovernmental
institutional rule structures and assesses their impacts on
financial investment flows. The ABM was calibrated with
data from multiple focus groups, individual interviews, and
analysis of federal, state, and regional scale transportation
projects and programs. The results from experimental
simulations are presented to test system-wide effects of
alternative multi-level institutional designs, in particular
different power and authority arrangements between state
and regional governments, on the emergence of roadway
project prioritization patterns and funding allocations
across regions and towns.
Keywords Institutional design � Intergovernmental
relations � Infrastructure development � Agent-based
modeling � Complex systems � Basins of attraction �Network governance
1 Introduction
Multi-level institutional designs that investigate the distri-
bution of power and authority arrangements among federal,
state, regional, and local government agencies are at the
core of many public policy theories and frameworks, such
as the Institutional Analysis and Development (IAD)
framework (Ostrom 2005), Multiple Streams Framework
(MSF) (Kingdon 1984), Policy Subsystem and Punctuated
Equilibrium framework (Baumgartner and Jones 2002),
Advocacy Coalition Framework (ACF) (Sabatier and Jen-
kins-Smith 1993), Policy Network framework (Marsh and
Rhodes 1992; Rhodes 1997), and Governance Network
framework (Koliba et al. 2010). The IAD framework, for
example, draws on institutionalism and neo-institutional-
ism theories, game theory, transaction cost theory, and
common resource pool theory to create a description of
multi-institutional systems that explains the crafting of
public policy as an institutional design problem within and
A. Zia (&) � C. Koliba
Department of Community Development and Applied
Economics, University of Vermont, 146 University Place,
Burlington, VT 05405, USA
e-mail: [email protected]
C. Koliba
e-mail: [email protected]
A. Zia
Department of Computer Science, University of Vermont,
146 University Place, Burlington, VT 05405, USA
123
AI & Soc
DOI 10.1007/s00146-013-0527-2
across complex ‘‘action arenas.’’ Ostrom (2005) empha-
sizes the roles that institutional rules play in structuring
governance arrangements. Many of these frameworks
impose homogenous assumptions about human decision-
making behaviors, such as expected utility maximizing
behaviors in IAD, while others assume more unpredictable,
chaotic decision-making behavior, such as those found in
the MSF. Another difference that arises across these
frameworks concerns the balance between individual
behavior and institutional norms and rules. While ACF
focuses on the role that common belief networks play in
powerful advocacy coalitions, IAD focuses more on the
role that operational, collective choice, and constitutional
rules play in shaping multi-institutional arrangements. In
contrast, the network-based frameworks (e.g., Rhodes
1997; Kickert et al. 1997; Milward and Provan 1998;
Agranoff and McGuire 2003; Koliba et al. 2010) account
for the multi-scalar dimensions of multi-level policy net-
works, meaning they account for the fact that these net-
works are populated by individual people, groups,
organizations, and networks of organizations. The ties
between these agents are informed by the types of
resources that flow between them (Rhodes 1997), the kinds
of managerial strategies employed (Agranoff and McGuire
2003), and the mixed structures of administrative authority
(Koliba et al. 2010) that persist within and across them.
In this paper, we aim to advance modeling of multi-level
institutional mechanisms that can ultimately be used to
improve both the real-world multi-level institutional
arrangements (e.g., intergovernmental relations) and evi-
dence-based public policy decision-making processes.
Within this broader set of goals, we focus on modeling
alternative multi-level institutional designs that can use the
virtual power of artificial intelligence and computer sim-
ulation modeling to enable a better understanding of power
and authority arrangements among federal, state, regional,
and local government agencies. Differential power con-
figurations among intergovernmental agencies typically
result in vastly different social, economic, political, and
ecological outcomes over various spatial and temporal
scales. Traditional policy research methods (e.g., case
studies, regression models, system dynamic models) have
produced useful insight into the role of multi-level insti-
tutional designs on complex public policy outcomes. Case
studies, interviews, and surveys have been used for ana-
lyzing the functions, capacities, and dynamics of inter-
governmental decision-making processes deployed by so-
called governance networks (Klijn 1996; Jones et al. 1997;
Kickert et al. 1997; O’Toole 1997; Ingram et al. 2005;
Koliba et al. 2010; Zia and Koliba 2011). Markovian
process models provide another strategy for modeling the
transitions in the policy outcomes induced by multi-level
institutional mechanisms over multiple time periods. While
these approaches are useful in analyzing multi-level insti-
tutional designs, we use agent-based modeling as a tool to
model policy systems in a ‘‘bottom-up’’ methodological
and theoretical architecture. Through the use of agent-
based modeling, we can examine alternative intergovern-
mental institutional designs and their effects on the allo-
cation of resources across regions and towns. One
advantage of ABMs over other methodologies is the
explicit representation of agents’ behaviors via their deci-
sion rules. Furthermore, agents within an ABM interact
with each other as well as their environments. The ability
of ABMs to model ‘‘institutional rules’’ as ‘‘decision rules’’
in empirically based models of social–ecological systems
has opened up new vistas of interdisciplinary research
between computer and policy sciences (e.g., see Janssen
and Ostrom 2006). Most importantly, from a mathematical
standpoint, ABMs enable the modeling of an n-dimen-
sional state space of complex systems, which is further
described below.
In this study, we postulate that multi-level institutional
designs with distributed (versus non-distributed) power and
authority arrangements among federal, state, regional, and
local government agencies lead to the emergence of differ-
ential patterns of socioeconomic and infrastructure devel-
opment pathways. We address the question: how do
intergovernmental institutional rules set by federal, state
and regional government agencies generate and sustain
‘‘basins of attraction’’ in funding transportation projects?
Walker et al. (2004) explain that both exogenous drivers and
endogenous processes in policy systems can create dynamic
changes in the number of basins of attraction, changes in the
positions of the basins within the state space, and changes in
the positions of the thresholds between basins. We define a
system’s ‘‘state space’’ or ‘‘phase space’’ as the state vari-
ables that constitute the system under consideration. If, for
example, a transportation system is defined by the amount of
energy consumed per vehicle mile and vehicle miles trav-
eled, then the state space is the two-dimensional space of all
possible combinations of these two state variables. More
complex systems could have an n-dimensional state space. A
system’s state at any time is defined by its current values in
the n-dimensional state space. Broadly speaking, a ‘‘basin of
attraction’’ is an area in state space in which the system tends
to remain over time. Further, as expostulated by Walker et al.
(2004), ‘‘For [social-ecological] systems that tend toward an
equilibrium, the equilibrium state is defined as an ‘attractor’,
and the basin of attraction constitutes all initial conditions
that will tend toward that equilibrium state…the various
basins that a system may occupy, and the boundaries that
separate them, are known as a ‘stability landscape.’’’
The basins of attraction are also linked with alternate
stable states and the resilience of systems under consider-
ation (e.g., Scheffer et al. 2001). The conditions of
AI & Soc
123
dynamic systems, such as integrated transport land use and
environmental systems, are never constant. Stochastic
events, such as economic downturn (e.g., housing market
crash of 2008), economic upturn (e.g., IT boom of the
1990s), political agendas, and climatic and weather
extremes (e.g., more or less intense floods and droughts),
can cause fluctuations in the basins of attraction of a state
space, which in turn can trigger the systems to move from
one stable state to another stable state. In ‘‘fragile’’ sys-
tems, small endogenous changes or exogenous shocks can
induce changes in the system (stable) states. In contrast, as
argued by Holling (1973), more resilient systems remain in
the same stable state despite internal endogenous changes
or exogenous shocks. The size of the basins of attraction in
an n-dimensional state space is thus linked with the fra-
gility or resiliency of dynamic systems (Walker et al.
2004).
In earlier work, solid-state physicists applied basins of
attraction to study the dynamics of ‘‘spin-glasses,’’ theo-
retical magnetic materials in which the interdependencies
between the orientations of dipoles in a lattice create a
complex dynamic system. Other applications exist in
evolutionary biology, computer sciences, game theory,
ecology, and economics. In evolutionary biology, for
example, Kauffman et al. (2004) present methods for cal-
culating the number of attractors in Boolean networks. In
computer sciences, Wuensche (1999) describes the emer-
gence of attractor basins in cellular automata-based com-
putational models. In game theory, Page and Wooders
(2009: 462) address the question, ‘‘given preferences of
individuals and rules governing network formation, what
networks are likely to emerge and persist?’’ Using an
induced abstract game as their basic analytic tool, they
demonstrate that for any set of primitives, the following
results hold: first, ‘‘The feasible set of networks contains a
unique, finite, disjoint collection of non-empty subsets each
constituting a strategic basin of attraction. Given prefer-
ences and the rules governing network formation, these
basins of attraction are the absorbing sets of the process of
network formation modeled via the game’’ (2009: 463).
Second, ‘‘A stable set (in the sense of Von Neumann
Morgenstern) with respect to path dominance consists of
one network from each basin of attraction’’ (Page and
Wooders 2009: 463).
In ecology, Vandermeer et al. (2004) analyzed a data set
accumulated over a 12-year period subsequent to the cat-
astrophic disturbance of a Nicaraguan rain forest by a
hurricane. They analyzed the data to determine whether the
observed trajectories corresponded to expectations from an
equilibrium or non-equilibrium model of community
structure. The equilibrium case, implying a single basin of
attraction, suggests that trajectories should become ever
more similar over time. The non-equilibrium case,
implying multiple basins of attraction, suggests the oppo-
site. Vandermeer et al. (2004) demonstrated that the data
from this particular forest strongly supported the multiple
basins hypothesis. Earlier, the multiple attractors’ hypoth-
esis was also confirmed through an experimental study by
Henson et al. (2002) to account for insect population
growth dynamics. Further, Scheffer et al. (2001) reviewed
the linkage between basins of attraction and alternate stable
states in ecological systems including lakes, coral reefs,
woodlands, deserts, and oceans.
In economics, based on the earlier work of Neary
(1978), Krugman (1994: 412–413) asked the question,
‘‘How complex is the economic landscape…that represents
the dynamics of resource allocation across activities and
locations[?]’’ Krugman (1994: 412–413) analyzed this
question in the context of foundational questions in inter-
national trade, such as the ‘‘relative importance of
increasing returns versus comparative advantage in causing
specialization and trade, the prevalence of multiple equi-
libriums, [and] the extent of path dependence.’’ In this
context, he characterized complex landscapes as being
complex because they contain many basins of attraction,
noting ‘‘which equilibrium the economy ends up in
depends on which basin of attraction it started in.’’ Krug-
man (1994) uses an economic-geographical theoretical
context to explain how countries starting in different basins
of attraction in a two-dimensional state space of resource
allocation and labor location can eventually have differ-
ential market shares in international trade.
In this study, we extend Krugman’s (1994) theoretical
work on basins of attraction in complex economic and
policy systems. We apply it to understand the effects of
intergovernmental decision-making processes and rule
structures on the differential allocation of transportation
funds across regions and towns. Attractors on a landscape
can be represented by the amenities that draw human
populations to congregate in clusters of different sizes,
ranging from small towns to large metropolitan areas.
Through complex feedback loops between societies and
governments, some of these towns and cities continue to
attract substantial government funds over time to sustain
their transportation, energy, and housing infrastructures.
Batty (2007) uses bottom-up cellular automata and agent-
based modeling to demonstrate the ‘‘fractal’’ emergence of
rural to urban land use patterns over time through the
interplay of complex dynamics. Within this broader scope
of land use, transportation, and economic interactions, we
focus our study on investigating the effects of intergov-
ernmental institutional rules on generating basins of fund-
ing attraction across regions and towns/cities.
In the specific context of US transportation policy, we use
an agent-based modeling approach to explore baseline and
alternative intergovernmental institutional rule structures
AI & Soc
123
and how they attract the increasingly scarce, even ‘‘seques-
tered,’’ governmental transportation funds for various
regions and towns/cities. Since 1991, US federal transpor-
tation laws have emphasized two primary policy goals. First,
the US Congress is interested in developing an intermodal
transportation system where citizens can safely use multiple
forms of private and public transit: ‘‘It is the policy of the
United States to develop a National Intermodal Transpor-
tation System that is economically efficient and environ-
mentally sound, provides the foundation for the Nation to
compete in the global economy, and will move people and
goods in an energy efficient manner’’ (Intermodal Surface
Transportation Efficiency Act [ISTEA] of 1991). Second, to
qualify for federal transportation funds, projects need to be
carried out with the cooperation of state and local govern-
ments: the planning process needs to be continuing, com-
prehensive, and cooperative. This principle of ‘‘3C’s’’ has
been in place since the Federal Aid Highway Act of 1962.
The planning system intertwines municipalities, state
transportation agencies, and the US Department of Trans-
portation (USDOT). It is not clear whether and how the
principle of ‘‘3C’s’’ is implemented in practice. The circular
framework requires a hierarchal planning system supple-
mented by federal funding for infrastructure development.
Decisions concerning which transportation projects to
scope, plan, and build are made by a complex latticework of
intergovernmental networks of organizations ranging from
the Federal Congress to USDOT, state DOTs, Municipal
Planning Organizations (MPOs), Regional Planning Com-
missions (RPCs), and municipal governments.
To understand the institutional rules of intergovern-
mental planning systems in the USA, we present a pattern-
oriented, agent-based model (ABM). Pattern-oriented
models are described by Grimm et al. (2005) as ‘‘bottom-
up’’ models that emphasize the applicability of models to
real problem solving. Grimm et al. (2005: 987) describe
pattern-oriented models this way:
In [this approach to modeling], we explicitly follow the
basic research program of science: the explanation of
observed patterns. Patterns are defining characteristics of a
system and often, therefore, indicators of essential under-
lying processes and structures. Patterns contain information
on the internal organization of a system, but in a ‘‘coded’’
form. The purpose of [pattern-oriented models] is to
‘‘decode’’ this information…A key idea [in these models]
is to use multiple patterns observed in real systems to guide
design of model structure. Using observed patterns for
model design directly ties the model’s structure to the
internal organization of the real system. We do so by
asking: What observed patterns seem to characterize the
system and its dynamics, and what variables and processes
must be in the model so that these patterns could, in
principle, emerge?’’
This ABM is calibrated to simulate the allocation pat-
terns of federal funds for roadway projects in the state of
Vermont under baseline intergovernmental institutional
rule structures. The ABM simulates complex, inter-twined
parallel decision making by ten regional governments and
six hundred towns/cities in the state of Vermont. Our
intention is to expand this ABM to study the diffusion of
transportation funds across the states and eventually across
different countries.
In Sect. 2, we present research methods that were used
to elicit roadway project prioritization processes and
decision heuristics of multi-level agents in the simulation
model. We also describe the federal and state transport
policies that govern this network’s dynamic operations in
the specific context of intergovernmental project prioriti-
zation. In particular, we present the observed patterns of
funding allocations for the study region of the state of
Vermont. In Sect. 3, we present the fundamental structure
of the stochastic, multi-level agent-based model. Sect. 4
presents findings from experimental simulations of alter-
native multi-level institutional designs. Section 5 presents
conclusions and discusses the limitations of the current
simulation model and possible next steps to further
improve and generalize it.
2 Research methods and the observed patterns
of roadway project prioritization and funding
allocations in the state of Vermont
To surface the patterns of interaction and resource flows
occurring in this network, we conducted a series of in-
depth interviews and two focus groups with multiple
stakeholders in the fall of 2010 to understand the legal and
policy context of intergovernmental transportation policy
implementation networks, both generally and specifically
in Vermont. The stakeholders included local government
officials, MPO staff and board members, staff of other
RPCs in Vermont, state agency of transportation (VTrans)
officials, Federal Highway Association (FHWA) repre-
sentatives, USDOT officials, federal and state senate office
representatives, and local NGOs. The focus groups and
interviews were recorded, transcribed, coded, and analyzed
for major and minor themes. To understand how projects
were prioritized, we examined various source documents
related to project funding, including major pieces of federal
legislation (such as the Intermodal Surface Transportation
Efficiency Act [ISTEA], the Transportation Equity Act for
the 21st Century [TEA-21], and the Safe, Accountable,
Flexible, Efficient Transportation Equity Act: A Legacy for
Users [SAFETEA-LU]), planning and policy documents
developed by VTrans and the MPO, meeting minutes, and
project databases. We obtained the project prioritization
AI & Soc
123
data for all transportation projects in Vermont between
1998 and 2011 and analyzed it using statistical analysis.
The data included the classes of project, the scoring data
from VTrans and the MPO, the location of the project, and
the amount of funds that went into the roadway projects.
In Vermont, VTrans is delegated the tasks assigned to
States by the federal government. Also, the Chittenden
County MPO (CCMPO), the only Vermont MPO (which
recently merged with the Chittenden Country RPC), and
ten other RPCs collaborate with the State to incorporate the
regional transportation planning needs. The planning pro-
cess and financial structure developed in federal legislation
(ISTEA, TEA-21, and SAFETEA-LU) create both a com-
plementary and competitive partnership between the RPCs
and VTrans. We consider the competitive nature of the
relationship between the state and regional agencies to be
an essential feature to model: it directly affects the flow of
transportation investments to different regions and local
towns.
In the hierarchically nested system of US transportation
policy, USDOT apportions money to each state in accor-
dance with the approved Statewide Transportation
Improvement Plan (STIP). The FHWA authorizes the
apportionment and certifies to the state that funding is
available for each program. Then, depending on state regu-
lations, the state completes federally funded projects by
either distributing money to a municipality or completing the
project itself. From the focus groups and interviews with
MPO and RPC officials, we elicited the current institutional
rule structure, i.e., criteria for project prioritization, that are
followed by the state and MPOs/RPCs in prioritizing trans-
portation projects in Vermont. Table 1 shows these rules for
six project classes: roadways, paving, bridges, bike/pedes-
trian, traffic operations, and park and ride. These rules were
instituted in 2006. Prior to 2006, transportation projects were
prioritized through a more politically driven process of
negotiation among the regional and state agencies. The
introduction of these rules in 2006 was part of a broader ‘‘de-
politicization’’ process, as stated by many focus group par-
ticipants. Simultaneously, an asset management system was
developed by VTrans to assign expected value scores to
transportation projects under the specific criteria shown in
Table 1. For example, for the roadway projects, VTrans
evaluates each project on four criteria: highway system is
assigned 40 % weight, cost per vehicle mile is assigned
20 % weight, regional priority is assigned 20 % weight, and
project momentum is assigned 20 % weight. Both highway
system and cost per vehicle mile are estimated from the
VTrans asset management system. The CCMPO assigns
equal weight (16.6 %) to six criteria in ranking the projects:
economic vitality; safety and security; accessibility, mobil-
ity, and connectivity; environment, energy, and quality of
life; preservation of existing system; and efficient system
management. Remaining RPCs rank the projects on similar
decision criteria but do not explicitly assign equal weights to
all the decision criteria.
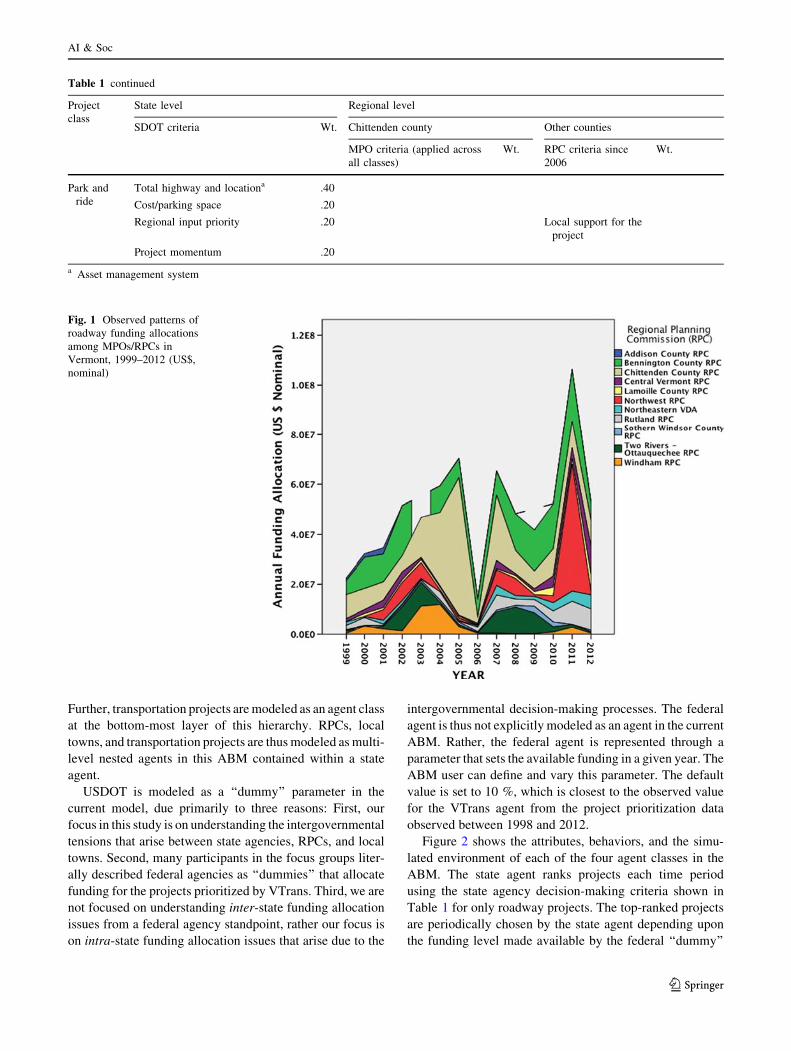
The observed patterns from the project prioritization
data elicited from 1999 to 2012 STIPs reveal ‘‘basins of
attraction’’ in terms of allocation of funding across the
MPO/RPCs in the state of Vermont, as shown in Fig. 1.
Noticeably, some RPCs/MPOs tend to receive more
transportation funding for their projects than others over
time. In particular, as shown in Fig. 1, Bennington County
RPC, Chittenden County RPC, and Northwest RPC appear
to consistently attract funding for their transportation pro-
jects during the observed 12-year time period. The dip in
total monetary allocation for roadway projects in 2006, as
shown in Fig. 1, is observed due to the change in the
project scoring system. Further, the relatively higher peak
of funding allocation in 2010–2011 occurred due to stim-
ulus funding under the American Reinvestment and
Recovery Act (ARRA), which is not a long-term trans-
portation program.
Our intention here, however, is not to model ‘‘black
swan’’ events, but to model operational intergovernmental
decision processes, institutional rules, and the resultant
funding patterns that emerge across the regional planning
commissions and local towns. Taleb (2010) defines ‘‘black
swan’’ events as events or occurrences that deviate beyond
what is normally expected of a situation and that are
extremely difficult to predict based upon historical data.
The 2008 housing market crash and subsequent introduc-
tion of ARRA stimulus funding present an example of such
a black swan event. Instead of modeling such events, we
focus on modeling multi-level institutional rules, as
described in Sect. 3.
3 The structure of the agent-based simulation model
The capacity of computer models of complex governance
networks to lead to accurate forecasting and prediction of
particular policy outcomes is predicated on a ‘‘deep uncer-
tainty’’ that characterizes our current state of understanding
of complex social systems. To cope with the inherent com-
plexity and uncertainty of governance networks, we under-
take a variation in ‘‘pattern-oriented’’ modeling (Grimm
et al. 2005). In this study, a pattern-oriented, agent-based
model (ABM) is designed to simulate the intergovernmental
decision-making process of the transportation governance
network, as shown in Fig. 2. The ABM is designed as a
stochastic multi-level model that generates ‘‘emergent’’
patterns assessed through the mining of state agency records
in the STIP database. Structurally in the ABM, shown in
Fig. 2, a state agent (i.e., VTrans) contains ten nested RPCs
and six hundred local towns that are nested within RPCs.
AI & Soc
123

Table 1 Decision-making criteria for transport project prioritization at state and regional levels
Project
class
State level Regional level
SDOT criteria Wt. Chittenden county Other counties
MPO criteria (applied across
all classes)
Wt. RPC criteria since
2006
Wt.
Roadway Highway systema .40 The impact or the
project on
congestion and
mobility conditions
in the region
Cost per vehicle milea .20
Regional priority .20
Project momentum .20
Paving Pavement condition indexa .20
Benefit/costa .60
Regional priority .20 Economic vitality The availability,
accessibility, and
routes
Bridges Bridge conditiona .30
Remaining lifea .10 Safety and security
Functionalitya .05
Load capacity and use .15 Accessibility, mobility and
connectivity
Waterway adequacy and scour
suspect.
.10 The functional
importance of the
highway or bridge
as a link in the
local, regional, or
state economy
Project momentum .05 Environment, energy and
quality of life
Regional input and priority .15 .166@ Ranked by
priority from
1 (being the
highest) to 5
(being the
lowest)
Asset-benefit cost factor .10
Bike/
pedestrian
Land use density .20 Preservation of existing system
Connectivity to larger bike/pedestrian
network
.10
Multi-modal access .05
Designated downtown/village center .05 Efficient system management The functional
importance of the
facility in the social
and cultural life of
the surrounding
communities
Project cost .20
Regional priority .20
Project momentum .20
Traffic
operations
Intersection capacitya .40
Accident rate .20
Cost per intersection volumea .20
Regional input and priority .20 Conformance to the
local and regional
plans
Project momentum .10
AI & Soc
123
Further, transportation projects are modeled as an agent class
at the bottom-most layer of this hierarchy. RPCs, local
towns, and transportation projects are thus modeled as multi-
level nested agents in this ABM contained within a state
agent.
USDOT is modeled as a ‘‘dummy’’ parameter in the
current model, due primarily to three reasons: First, our
focus in this study is on understanding the intergovernmental
tensions that arise between state agencies, RPCs, and local
towns. Second, many participants in the focus groups liter-
ally described federal agencies as ‘‘dummies’’ that allocate
funding for the projects prioritized by VTrans. Third, we are
not focused on understanding inter-state funding allocation
issues from a federal agency standpoint, rather our focus is
on intra-state funding allocation issues that arise due to the
intergovernmental decision-making processes. The federal
agent is thus not explicitly modeled as an agent in the current
ABM. Rather, the federal agent is represented through a
parameter that sets the available funding in a given year. The
ABM user can define and vary this parameter. The default
value is set to 10 %, which is closest to the observed value
for the VTrans agent from the project prioritization data
observed between 1998 and 2012.
Figure 2 shows the attributes, behaviors, and the simu-
lated environment of each of the four agent classes in the
ABM. The state agent ranks projects each time period
using the state agency decision-making criteria shown in
Table 1 for only roadway projects. The top-ranked projects
are periodically chosen by the state agent depending upon
the funding level made available by the federal ‘‘dummy’’
Table 1 continued
Project
class
State level Regional level
SDOT criteria Wt. Chittenden county Other counties
MPO criteria (applied across
all classes)
Wt. RPC criteria since
2006
Wt.
Park and
ride
Total highway and locationa .40
Cost/parking space .20
Regional input priority .20 Local support for the
project
Project momentum .20
a Asset management system
Fig. 1 Observed patterns of
roadway funding allocations
among MPOs/RPCs in
Vermont, 1999–2012 (US$,
nominal)
AI & Soc
123
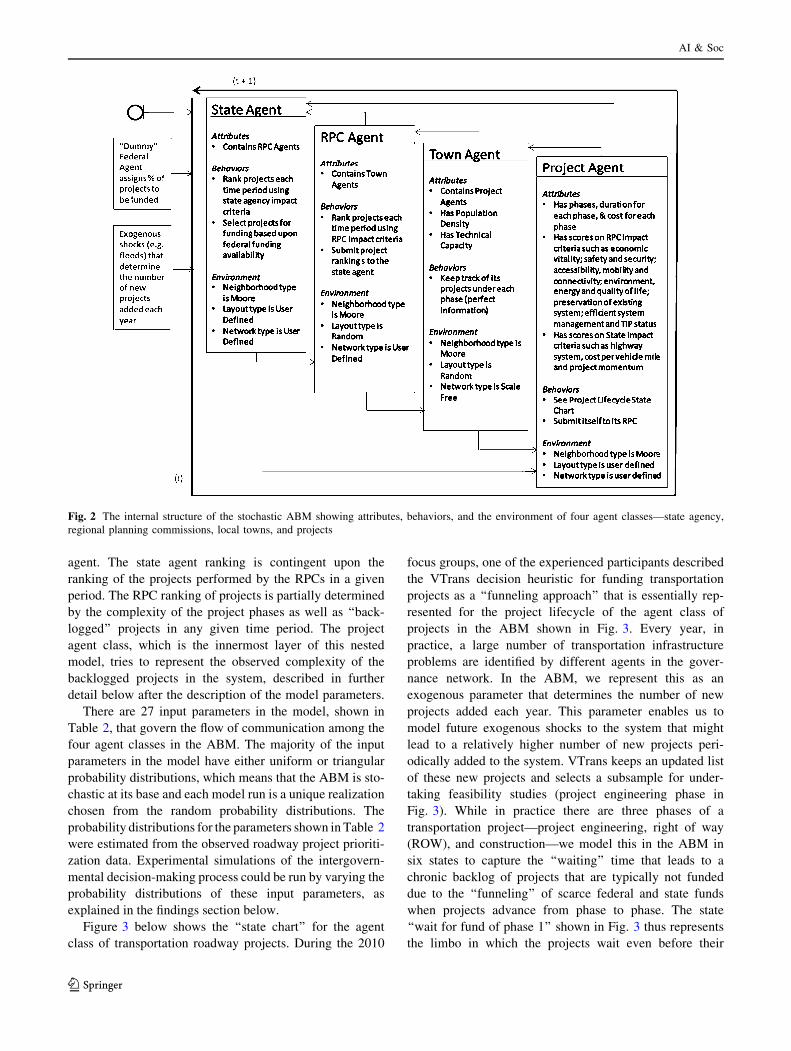
agent. The state agent ranking is contingent upon the
ranking of the projects performed by the RPCs in a given
period. The RPC ranking of projects is partially determined
by the complexity of the project phases as well as ‘‘back-
logged’’ projects in any given time period. The project
agent class, which is the innermost layer of this nested
model, tries to represent the observed complexity of the
backlogged projects in the system, described in further
detail below after the description of the model parameters.
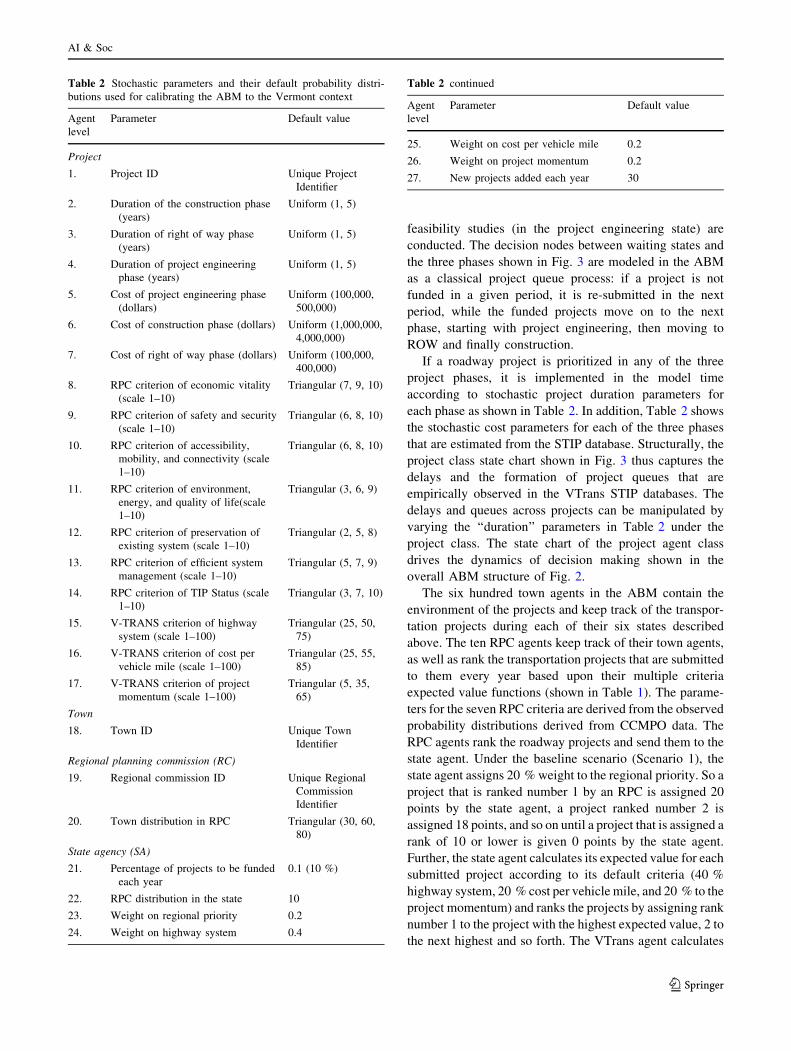
There are 27 input parameters in the model, shown in
Table 2, that govern the flow of communication among the
four agent classes in the ABM. The majority of the input
parameters in the model have either uniform or triangular
probability distributions, which means that the ABM is sto-
chastic at its base and each model run is a unique realization
chosen from the random probability distributions. The
probability distributions for the parameters shown in Table 2
were estimated from the observed roadway project prioriti-
zation data. Experimental simulations of the intergovern-
mental decision-making process could be run by varying the
probability distributions of these input parameters, as
explained in the findings section below.
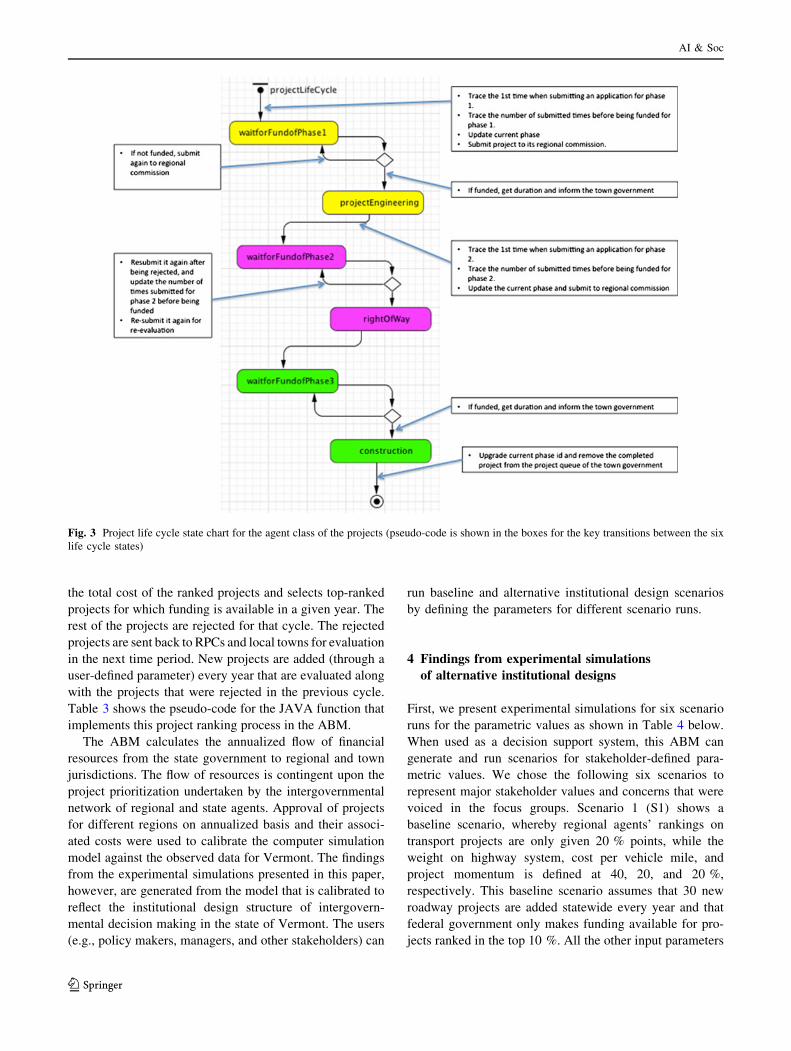
Figure 3 below shows the ‘‘state chart’’ for the agent
class of transportation roadway projects. During the 2010
focus groups, one of the experienced participants described
the VTrans decision heuristic for funding transportation
projects as a ‘‘funneling approach’’ that is essentially rep-
resented for the project lifecycle of the agent class of
projects in the ABM shown in Fig. 3. Every year, in
practice, a large number of transportation infrastructure
problems are identified by different agents in the gover-
nance network. In the ABM, we represent this as an
exogenous parameter that determines the number of new
projects added each year. This parameter enables us to
model future exogenous shocks to the system that might
lead to a relatively higher number of new projects peri-
odically added to the system. VTrans keeps an updated list
of these new projects and selects a subsample for under-
taking feasibility studies (project engineering phase in
Fig. 3). While in practice there are three phases of a
transportation project—project engineering, right of way
(ROW), and construction—we model this in the ABM in
six states to capture the ‘‘waiting’’ time that leads to a
chronic backlog of projects that are typically not funded
due to the ‘‘funneling’’ of scarce federal and state funds
when projects advance from phase to phase. The state
‘‘wait for fund of phase 1’’ shown in Fig. 3 thus represents
the limbo in which the projects wait even before their
Fig. 2 The internal structure of the stochastic ABM showing attributes, behaviors, and the environment of four agent classes—state agency,
regional planning commissions, local towns, and projects
AI & Soc
123
feasibility studies (in the project engineering state) are
conducted. The decision nodes between waiting states and
the three phases shown in Fig. 3 are modeled in the ABM
as a classical project queue process: if a project is not
funded in a given period, it is re-submitted in the next
period, while the funded projects move on to the next
phase, starting with project engineering, then moving to
ROW and finally construction.
If a roadway project is prioritized in any of the three
project phases, it is implemented in the model time
according to stochastic project duration parameters for
each phase as shown in Table 2. In addition, Table 2 shows
the stochastic cost parameters for each of the three phases
that are estimated from the STIP database. Structurally, the
project class state chart shown in Fig. 3 thus captures the
delays and the formation of project queues that are
empirically observed in the VTrans STIP databases. The
delays and queues across projects can be manipulated by
varying the ‘‘duration’’ parameters in Table 2 under the
project class. The state chart of the project agent class
drives the dynamics of decision making shown in the
overall ABM structure of Fig. 2.
The six hundred town agents in the ABM contain the
environment of the projects and keep track of the transpor-
tation projects during each of their six states described
above. The ten RPC agents keep track of their town agents,
as well as rank the transportation projects that are submitted
to them every year based upon their multiple criteria
expected value functions (shown in Table 1). The parame-
ters for the seven RPC criteria are derived from the observed
probability distributions derived from CCMPO data. The
RPC agents rank the roadway projects and send them to the
state agent. Under the baseline scenario (Scenario 1), the
state agent assigns 20 % weight to the regional priority. So a
project that is ranked number 1 by an RPC is assigned 20
points by the state agent, a project ranked number 2 is
assigned 18 points, and so on until a project that is assigned a
rank of 10 or lower is given 0 points by the state agent.
Further, the state agent calculates its expected value for each
submitted project according to its default criteria (40 %
highway system, 20 % cost per vehicle mile, and 20 % to the
project momentum) and ranks the projects by assigning rank
number 1 to the project with the highest expected value, 2 to
the next highest and so forth. The VTrans agent calculates
Table 2 Stochastic parameters and their default probability distri-
butions used for calibrating the ABM to the Vermont context
Agent
level
Parameter Default value
Project
1. Project ID Unique Project
Identifier
2. Duration of the construction phase
(years)
Uniform (1, 5)
3. Duration of right of way phase
(years)
Uniform (1, 5)
4. Duration of project engineering
phase (years)
Uniform (1, 5)
5. Cost of project engineering phase
(dollars)
Uniform (100,000,
500,000)
6. Cost of construction phase (dollars) Uniform (1,000,000,
4,000,000)
7. Cost of right of way phase (dollars) Uniform (100,000,
400,000)
8. RPC criterion of economic vitality
(scale 1–10)
Triangular (7, 9, 10)
9. RPC criterion of safety and security
(scale 1–10)
Triangular (6, 8, 10)
10. RPC criterion of accessibility,
mobility, and connectivity (scale
1–10)
Triangular (6, 8, 10)
11. RPC criterion of environment,
energy, and quality of life(scale
1–10)
Triangular (3, 6, 9)
12. RPC criterion of preservation of
existing system (scale 1–10)
Triangular (2, 5, 8)
13. RPC criterion of efficient system
management (scale 1–10)
Triangular (5, 7, 9)
14. RPC criterion of TIP Status (scale
1–10)
Triangular (3, 7, 10)
15. V-TRANS criterion of highway
system (scale 1–100)
Triangular (25, 50,
75)
16. V-TRANS criterion of cost per
vehicle mile (scale 1–100)
Triangular (25, 55,
85)
17. V-TRANS criterion of project
momentum (scale 1–100)
Triangular (5, 35,
65)
Town
18. Town ID Unique Town
Identifier
Regional planning commission (RC)
19. Regional commission ID Unique Regional
Commission
Identifier
20. Town distribution in RPC Triangular (30, 60,
80)
State agency (SA)
21. Percentage of projects to be funded
each year
0.1 (10 %)
22. RPC distribution in the state 10
23. Weight on regional priority 0.2
24. Weight on highway system 0.4
Table 2 continued
Agent
level
Parameter Default value
25. Weight on cost per vehicle mile 0.2
26. Weight on project momentum 0.2
27. New projects added each year 30
AI & Soc
123
the total cost of the ranked projects and selects top-ranked
projects for which funding is available in a given year. The
rest of the projects are rejected for that cycle. The rejected
projects are sent back to RPCs and local towns for evaluation
in the next time period. New projects are added (through a
user-defined parameter) every year that are evaluated along
with the projects that were rejected in the previous cycle.
Table 3 shows the pseudo-code for the JAVA function that
implements this project ranking process in the ABM.
The ABM calculates the annualized flow of financial
resources from the state government to regional and town
jurisdictions. The flow of resources is contingent upon the
project prioritization undertaken by the intergovernmental
network of regional and state agents. Approval of projects
for different regions on annualized basis and their associ-
ated costs were used to calibrate the computer simulation
model against the observed data for Vermont. The findings
from the experimental simulations presented in this paper,
however, are generated from the model that is calibrated to
reflect the institutional design structure of intergovern-
mental decision making in the state of Vermont. The users
(e.g., policy makers, managers, and other stakeholders) can
run baseline and alternative institutional design scenarios
by defining the parameters for different scenario runs.
4 Findings from experimental simulations
of alternative institutional designs
First, we present experimental simulations for six scenario
runs for the parametric values as shown in Table 4 below.
When used as a decision support system, this ABM can
generate and run scenarios for stakeholder-defined para-
metric values. We chose the following six scenarios to
represent major stakeholder values and concerns that were
voiced in the focus groups. Scenario 1 (S1) shows a
baseline scenario, whereby regional agents’ rankings on
transport projects are only given 20 % points, while the
weight on highway system, cost per vehicle mile, and
project momentum is defined at 40, 20, and 20 %,
respectively. This baseline scenario assumes that 30 new
roadway projects are added statewide every year and that
federal government only makes funding available for pro-
jects ranked in the top 10 %. All the other input parameters
Fig. 3 Project life cycle state chart for the agent class of the projects (pseudo-code is shown in the boxes for the key transitions between the six
life cycle states)
AI & Soc
123
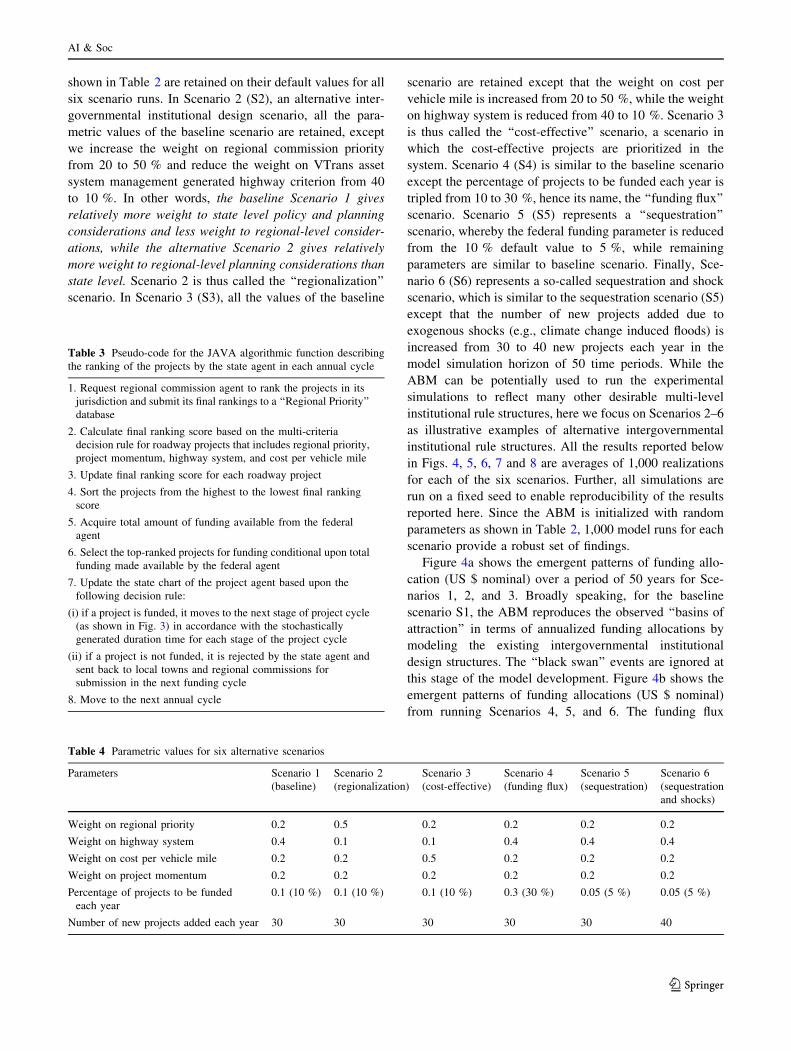
shown in Table 2 are retained on their default values for all
six scenario runs. In Scenario 2 (S2), an alternative inter-
governmental institutional design scenario, all the para-
metric values of the baseline scenario are retained, except
we increase the weight on regional commission priority
from 20 to 50 % and reduce the weight on VTrans asset
system management generated highway criterion from 40
to 10 %. In other words, the baseline Scenario 1 gives
relatively more weight to state level policy and planning
considerations and less weight to regional-level consider-
ations, while the alternative Scenario 2 gives relatively
more weight to regional-level planning considerations than
state level. Scenario 2 is thus called the ‘‘regionalization’’
scenario. In Scenario 3 (S3), all the values of the baseline
scenario are retained except that the weight on cost per
vehicle mile is increased from 20 to 50 %, while the weight
on highway system is reduced from 40 to 10 %. Scenario 3
is thus called the ‘‘cost-effective’’ scenario, a scenario in
which the cost-effective projects are prioritized in the
system. Scenario 4 (S4) is similar to the baseline scenario
except the percentage of projects to be funded each year is
tripled from 10 to 30 %, hence its name, the ‘‘funding flux’’
scenario. Scenario 5 (S5) represents a ‘‘sequestration’’
scenario, whereby the federal funding parameter is reduced
from the 10 % default value to 5 %, while remaining
parameters are similar to baseline scenario. Finally, Sce-
nario 6 (S6) represents a so-called sequestration and shock
scenario, which is similar to the sequestration scenario (S5)
except that the number of new projects added due to
exogenous shocks (e.g., climate change induced floods) is
increased from 30 to 40 new projects each year in the
model simulation horizon of 50 time periods. While the
ABM can be potentially used to run the experimental
simulations to reflect many other desirable multi-level
institutional rule structures, here we focus on Scenarios 2–6
as illustrative examples of alternative intergovernmental
institutional rule structures. All the results reported below
in Figs. 4, 5, 6, 7 and 8 are averages of 1,000 realizations
for each of the six scenarios. Further, all simulations are
run on a fixed seed to enable reproducibility of the results
reported here. Since the ABM is initialized with random
parameters as shown in Table 2, 1,000 model runs for each
scenario provide a robust set of findings.
Figure 4a shows the emergent patterns of funding allo-
cation (US $ nominal) over a period of 50 years for Sce-
narios 1, 2, and 3. Broadly speaking, for the baseline
scenario S1, the ABM reproduces the observed ‘‘basins of
attraction’’ in terms of annualized funding allocations by
modeling the existing intergovernmental institutional
design structures. The ‘‘black swan’’ events are ignored at
this stage of the model development. Figure 4b shows the
emergent patterns of funding allocations (US $ nominal)
from running Scenarios 4, 5, and 6. The funding flux
Table 3 Pseudo-code for the JAVA algorithmic function describing
the ranking of the projects by the state agent in each annual cycle
1. Request regional commission agent to rank the projects in its
jurisdiction and submit its final rankings to a ‘‘Regional Priority’’
database
2. Calculate final ranking score based on the multi-criteria
decision rule for roadway projects that includes regional priority,
project momentum, highway system, and cost per vehicle mile
3. Update final ranking score for each roadway project
4. Sort the projects from the highest to the lowest final ranking
score
5. Acquire total amount of funding available from the federal
agent
6. Select the top-ranked projects for funding conditional upon total
funding made available by the federal agent
7. Update the state chart of the project agent based upon the
following decision rule:
(i) if a project is funded, it moves to the next stage of project cycle
(as shown in Fig. 3) in accordance with the stochastically
generated duration time for each stage of the project cycle
(ii) if a project is not funded, it is rejected by the state agent and
sent back to local towns and regional commissions for
submission in the next funding cycle
8. Move to the next annual cycle
Table 4 Parametric values for six alternative scenarios
Parameters Scenario 1
(baseline)
Scenario 2
(regionalization)
Scenario 3
(cost-effective)
Scenario 4
(funding flux)
Scenario 5
(sequestration)
Scenario 6
(sequestration
and shocks)
Weight on regional priority 0.2 0.5 0.2 0.2 0.2 0.2
Weight on highway system 0.4 0.1 0.1 0.4 0.4 0.4
Weight on cost per vehicle mile 0.2 0.2 0.5 0.2 0.2 0.2
Weight on project momentum 0.2 0.2 0.2 0.2 0.2 0.2
Percentage of projects to be funded
each year
0.1 (10 %) 0.1 (10 %) 0.1 (10 %) 0.3 (30 %) 0.05 (5 %) 0.05 (5 %)
Number of new projects added each year 30 30 30 30 30 40
AI & Soc
123
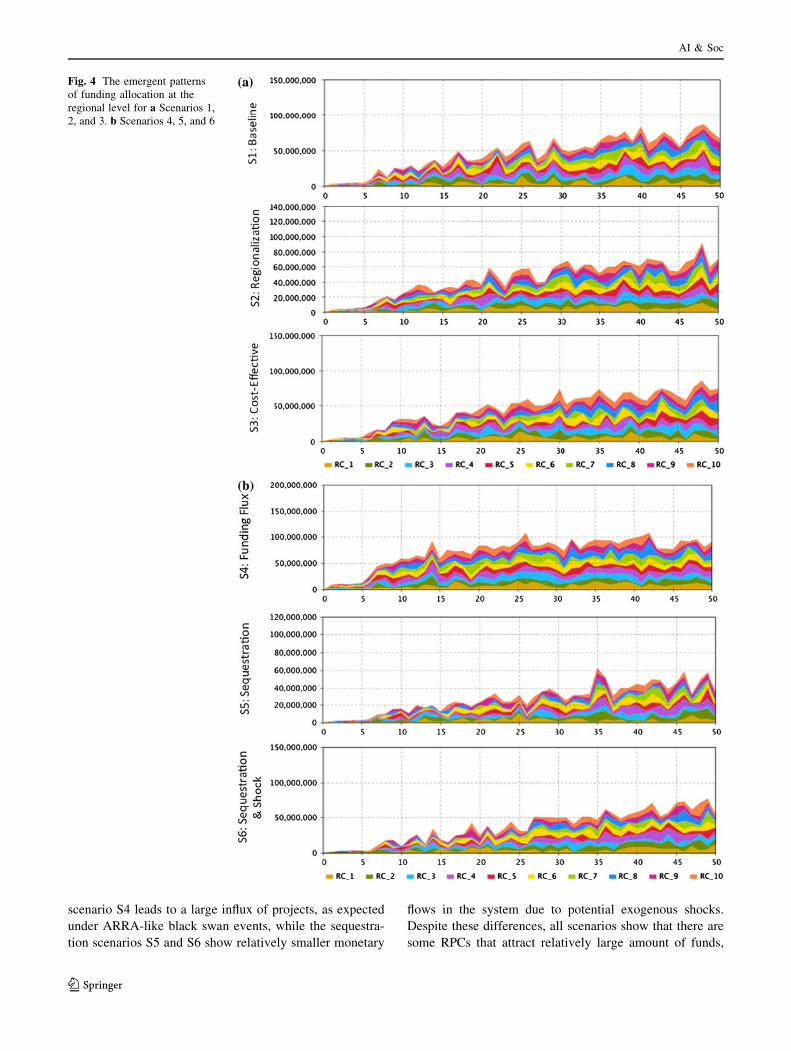
scenario S4 leads to a large influx of projects, as expected
under ARRA-like black swan events, while the sequestra-
tion scenarios S5 and S6 show relatively smaller monetary
flows in the system due to potential exogenous shocks.
Despite these differences, all scenarios show that there are
some RPCs that attract relatively large amount of funds,
Fig. 4 The emergent patterns
of funding allocation at the
regional level for a Scenarios 1,
2, and 3. b Scenarios 4, 5, and 6
AI & Soc
123
i.e., the basins of funding attraction are reproduced in
almost all six scenarios. There are, however, subtle dif-
ferences between the scenarios that we present below.
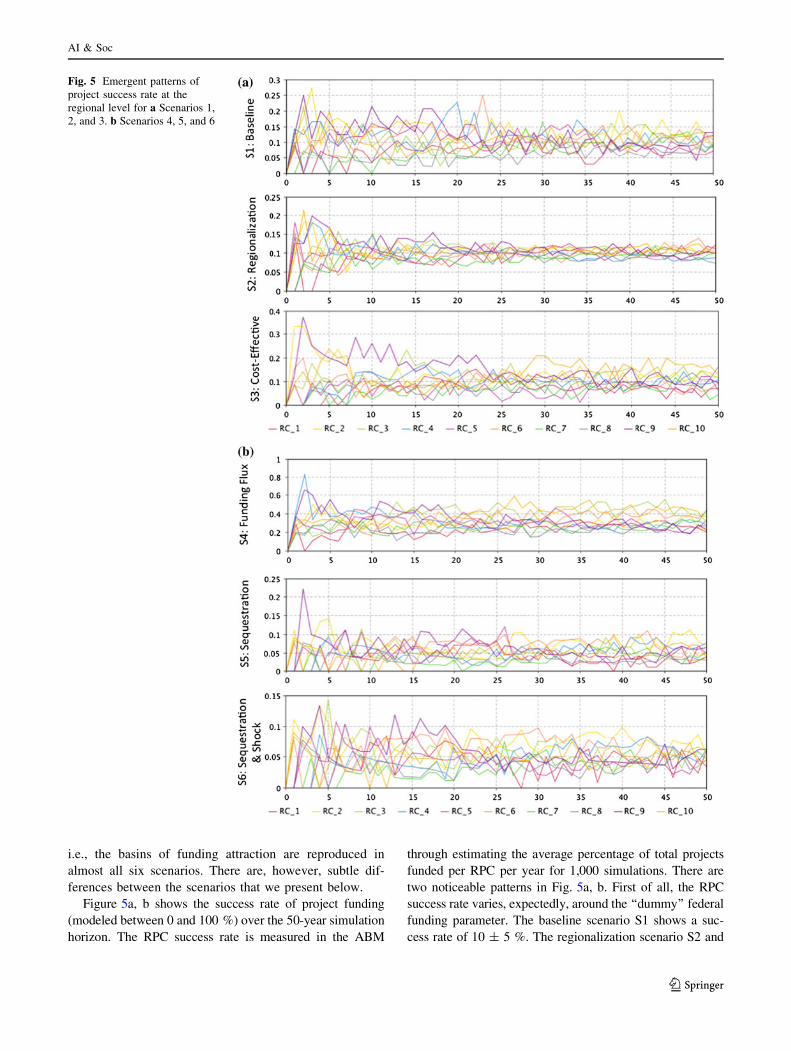
Figure 5a, b shows the success rate of project funding
(modeled between 0 and 100 %) over the 50-year simulation
horizon. The RPC success rate is measured in the ABM
through estimating the average percentage of total projects
funded per RPC per year for 1,000 simulations. There are
two noticeable patterns in Fig. 5a, b. First of all, the RPC
success rate varies, expectedly, around the ‘‘dummy’’ federal
funding parameter. The baseline scenario S1 shows a suc-
cess rate of 10 ± 5 %. The regionalization scenario S2 and
Fig. 5 Emergent patterns of
project success rate at the
regional level for a Scenarios 1,
2, and 3. b Scenarios 4, 5, and 6
AI & Soc
123
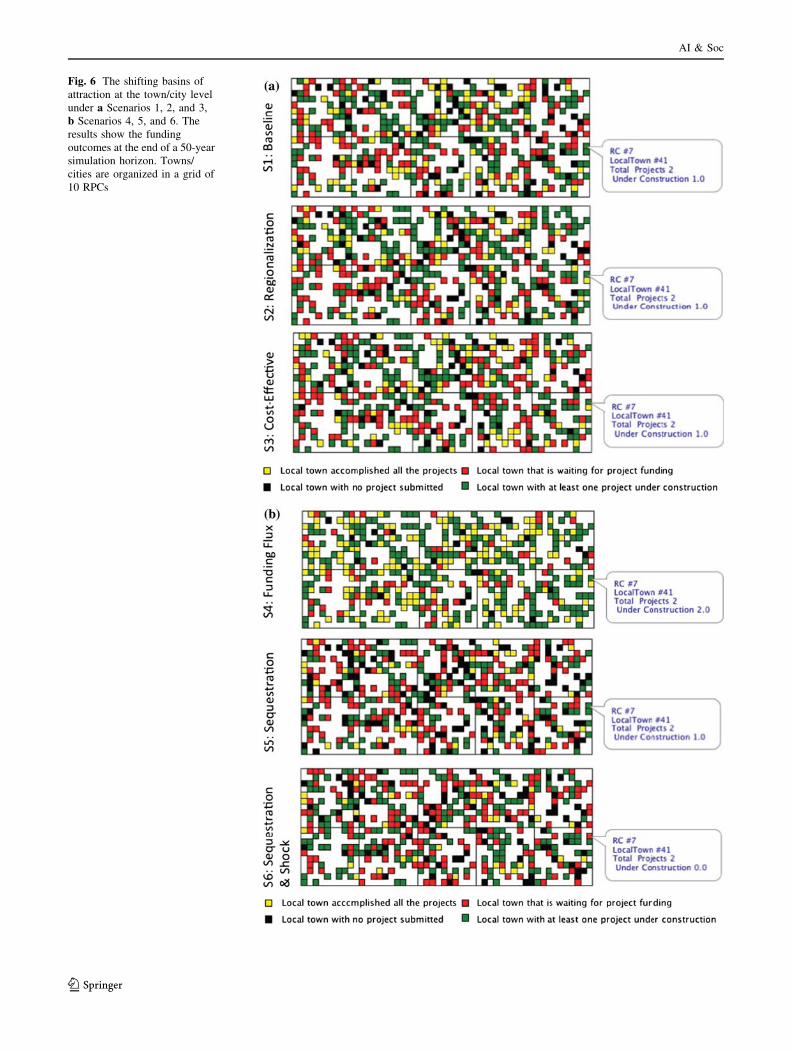
Fig. 6 The shifting basins of
attraction at the town/city level
under a Scenarios 1, 2, and 3,
b Scenarios 4, 5, and 6. The
results show the funding
outcomes at the end of a 50-year
simulation horizon. Towns/
cities are organized in a grid of
10 RPCs
AI & Soc
123
the cost-effective scenario S3 also retain similar success rate
averages around 10 %. In contrast, the success rate for the
funding flux scenario S4 is between 20 and 40 %, while the
sequestration scenarios S5 and S6 show diminished average
success rate of 5 % with varying variability for different
scenarios. This first pattern shows the fidelity of the ABM to
the exogenous parameter of funding availability. It is,
however, the second pattern that is truly emergent and
generated from the internal structure of the ABM. This
second pattern concerns the variability in the success rate
across the six scenarios. Noticeably, the emergent pattern in
Scenario 2 (Fig. 5a) shows a reduced variability across the
percentage of funded projects for RPCs over time, which
implies that the basins of attraction are weakened under the
regionalized institutional design scenario (S2). This reduc-
tion in variability is obvious from comparing success rates
across all scenarios shown in Fig. 5a, b. Interestingly, the
cost-effective scenario S3 shows a strong pattern for mul-
tiple basins of attraction. Theoretically, these emergent
patterns of attractors under alternative institutional designs
provide interesting insights: a decentralized approach in
intergovernmental decision making, i.e., more weight on
regional priorities as shown in regionalization scenario S2,
leads to a more ‘‘equitable’’ pattern of funding allocations
and project financing. On the other hand, counter-intuitively,
higher weight on choosing more ‘‘cost-effective’’ projects,
as in Scenario 3, generates and sustains less equitable and
stronger funding attractors. The differences in the funding
outcomes between Scenarios 2 and 3 demonstrate potential
equity and efficiency trade-offs in the policy outcomes.
Turning our attention toward exogenous shocks, a
higher influx of funding in the system, as in Scenario 4,
merely raises the funding levels but does not necessarily
change the basins of attraction patterns compared with the
baseline scenario. Sequestration scenario S5 and seques-
tration and shock scenario S6 result in increased variability
in the success rates compared to other scenarios, thus
implying that more competitive funding situations could
lead to more pronounced winners and losers in terms of
attracting federal and state funding for transportation
projects.
From the scenario runs shown in Figs. 4a, b, 5a, b, we
can draw a few conclusions about how this system
works. First, if the percentage of weight given to
regional considerations is raised under an alternative
institutional design structure, it will result in a ‘‘phase
change’’ and switch the basins of attraction in terms of
allocating federal and state transportation funds. An
emphasis on increasing the weight on a ‘‘cost-effective’’
scenario does not necessarily result in this phase change.
Second, in the context of a larger transportation policy
debate about the 3Cs between state, regional, and local
governments, we find that a shift in the relative power
from the state to the regional governments could trigger
a more equitable distribution of funding across regions.
This observation will likely be of great interest to
stakeholders. Some interests, such as towns or regions
who feel that they have not received their ‘‘fair share’’ of
federal transportation dollars, may use these results to
argue for changes to the intergovernmental system.
However, the beneficiaries of the current baseline system
might resist such changes in the intergovernmental
institutional designs. The relevant decision makers and
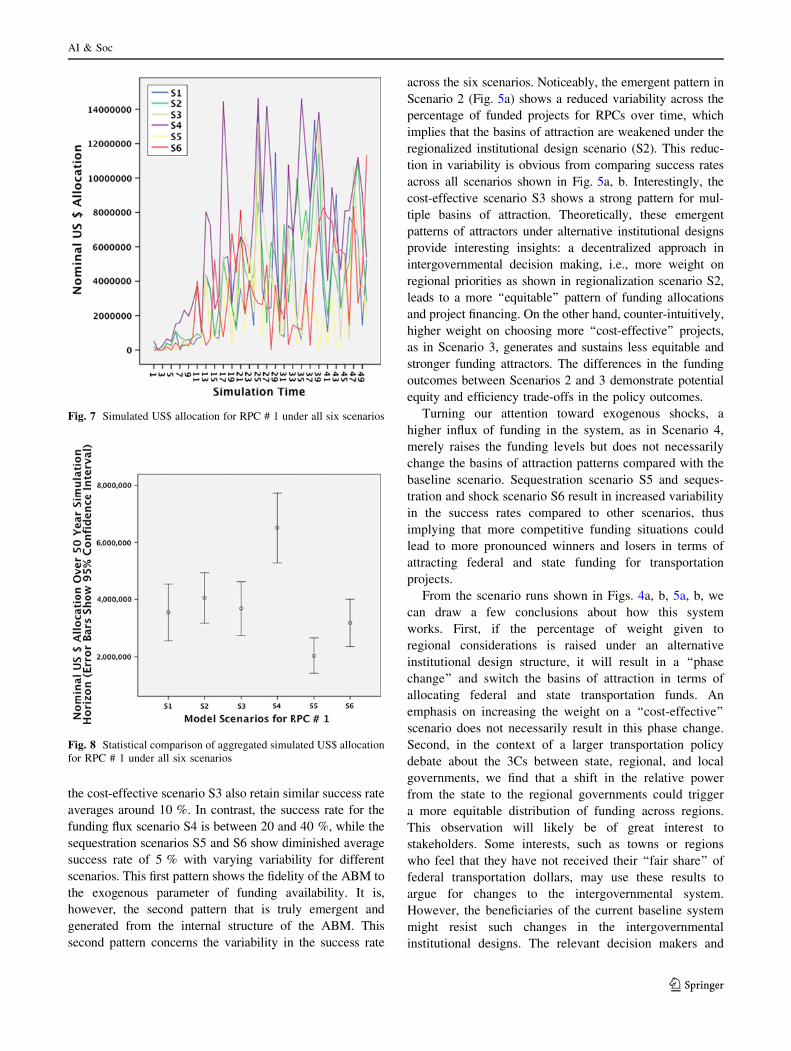
Fig. 7 Simulated US$ allocation for RPC # 1 under all six scenarios
Fig. 8 Statistical comparison of aggregated simulated US$ allocation
for RPC # 1 under all six scenarios
AI & Soc
123
policy makers could use this ABM as a decision support
system to redesign the intergovernmental decision-mak-
ing rules, resulting in a desirable trade-off among equi-
table and cost-effective allocation of federal and state tax
dollars. The effect of these multi-level institutional
design changes at the town level is even more pro-
nounced than the RPC level, as shown in Fig. 6a, b.
Even one small change in the institutional design
structure results in highly significant changes in terms of
the local towns whose projects get funded (shown in yel-
low and green), versus local towns who either keep waiting
for their projects to be funded (shown in red) or who do not
even submit a project in the 50-year simulation horizon
(shown in black) in Fig. 6a, b. This contrast is more pro-
nounced in Fig. 6b, which compares funding flux scenario
S4 with sequestration scenarios S5 and S6. The funding
flux scenario S4 displays mostly green and yellow towns,
while the sequestration scenarios S5 and S6 display more
red towns. Further, if we track an example town (shown in
Fig. 6b as Town #41 in RPC # 7), we find that both of its
projects get funded under the funding flux scenario S4, one
of its two projects gets funded under the sequestration
scenario S5 and neither project gets funded under the
sequestration and shock scenario S6.
At the RPC level, the differences among the six sce-
narios can be discerned by comparing the funding level for
the same RPC under different scenarios, as shown in
Figs. 7 and 8. As a demonstration example, we chose RPC
# 1 in the model. Figure 7 shows a large inter-annual
variability in funding for RPC #1 over the 50-year time
horizon under the six scenarios. Figure 8 shows a statistical
summary (mean and 95 % confidence interval around the
mean) for aggregate RPC #1 simulated allocation under the
six scenarios. Findings in Fig. 8 come close to representing
alternate stable states (basins of attraction) of funding
allocations for RPC #1 under different (n-1 dimensional
state space) scenarios. Clearly, sequestration scenarios S4
and S5 result in significantly less funding allocation over
the 50-year period for RPC #1 compared with the funding
flux scenario S4. The regionalization scenario is slightly
better than the baseline scenario but not statistically sig-
nificant. Similar results are found for other nine RPCs, but
there are slightly different attractor patterns in each case.
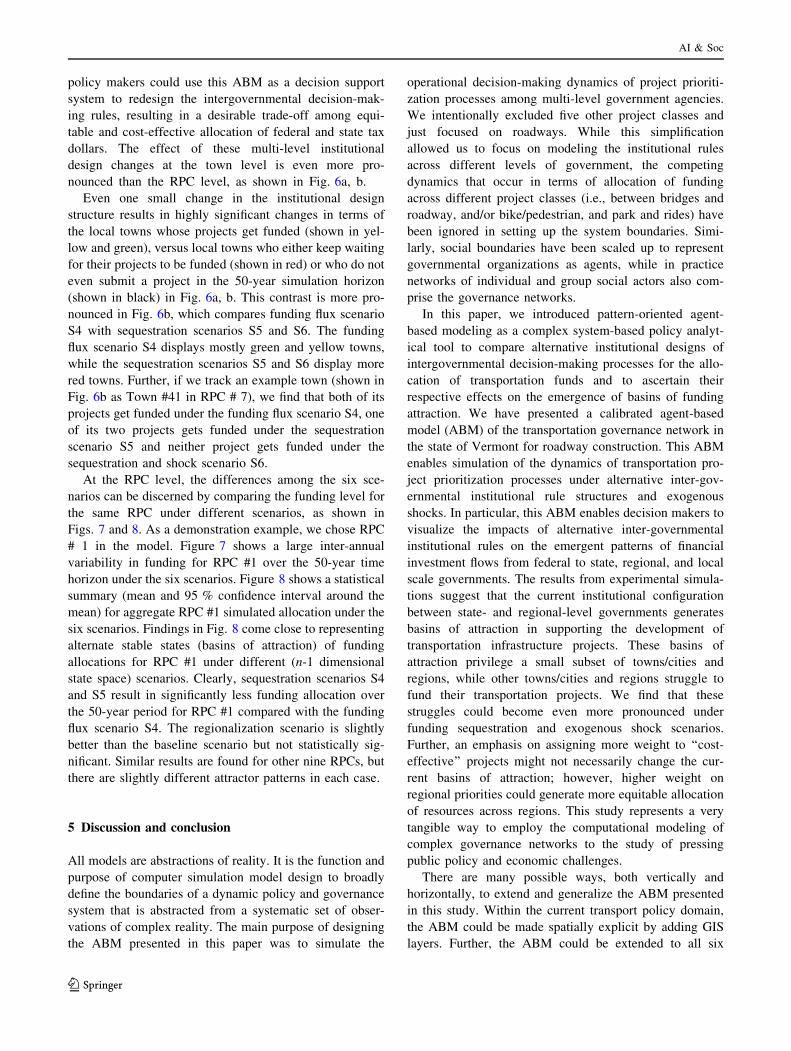
5 Discussion and conclusion
All models are abstractions of reality. It is the function and
purpose of computer simulation model design to broadly
define the boundaries of a dynamic policy and governance
system that is abstracted from a systematic set of obser-
vations of complex reality. The main purpose of designing
the ABM presented in this paper was to simulate the
operational decision-making dynamics of project prioriti-
zation processes among multi-level government agencies.
We intentionally excluded five other project classes and
just focused on roadways. While this simplification
allowed us to focus on modeling the institutional rules
across different levels of government, the competing
dynamics that occur in terms of allocation of funding
across different project classes (i.e., between bridges and
roadway, and/or bike/pedestrian, and park and rides) have
been ignored in setting up the system boundaries. Simi-
larly, social boundaries have been scaled up to represent
governmental organizations as agents, while in practice
networks of individual and group social actors also com-
prise the governance networks.
In this paper, we introduced pattern-oriented agent-
based modeling as a complex system-based policy analyt-
ical tool to compare alternative institutional designs of
intergovernmental decision-making processes for the allo-
cation of transportation funds and to ascertain their
respective effects on the emergence of basins of funding
attraction. We have presented a calibrated agent-based
model (ABM) of the transportation governance network in
the state of Vermont for roadway construction. This ABM
enables simulation of the dynamics of transportation pro-
ject prioritization processes under alternative inter-gov-
ernmental institutional rule structures and exogenous
shocks. In particular, this ABM enables decision makers to
visualize the impacts of alternative inter-governmental
institutional rules on the emergent patterns of financial
investment flows from federal to state, regional, and local
scale governments. The results from experimental simula-
tions suggest that the current institutional configuration
between state- and regional-level governments generates
basins of attraction in supporting the development of
transportation infrastructure projects. These basins of
attraction privilege a small subset of towns/cities and
regions, while other towns/cities and regions struggle to
fund their transportation projects. We find that these
struggles could become even more pronounced under
funding sequestration and exogenous shock scenarios.
Further, an emphasis on assigning more weight to ‘‘cost-
effective’’ projects might not necessarily change the cur-
rent basins of attraction; however, higher weight on
regional priorities could generate more equitable allocation
of resources across regions. This study represents a very
tangible way to employ the computational modeling of
complex governance networks to the study of pressing
public policy and economic challenges.
There are many possible ways, both vertically and
horizontally, to extend and generalize the ABM presented
in this study. Within the current transport policy domain,
the ABM could be made spatially explicit by adding GIS
layers. Further, the ABM could be extended to all six
AI & Soc
123
transport project classes. Explicit rules of federal programs,
such as the Surface Transportation Program, Interstate
Maintenance Program and others, could be incorporated in
an upward expansion of the model. Similarly, in a down-
ward expansion of the model, the complex dynamics that
occur in local towns and their planning commissions/
boards could be explicitly captured. Further, even at a finer
grain, the outcomes of the funded projects could be
ascertained by coupling integrated land use transportation
models such as UrbanSim with the governance network
simulation model presented in this paper.
The ABM presented in this study can be coupled in the
future with integrated land use, transportation, and envi-
ronmental simulation models to test system-wide effects of
alternative institutional designs on the differential emer-
gence of transportation infrastructures and networks across
the urban to rural gradients. Further, inter-modal competitive
dynamics can also be added to simulate the trade-offs
encountered in funding different classes of transportation
projects. A true test of the generalizability of this ABM will
be its calibration to another state in the USA, an effort that is
currently undergoing. For extending the model to other
states or countries, the probability distributions of the ABM
parameters would need to be empirically estimated for cal-
ibrating ABM to that particular geographical scope. Recent
advances in network analysis and data mining approaches
can also potentially be coupled with agent-based modeling
to simulate real-world intergovernmental policy arenas. In
the future, the ABMs could be adapted to model the impact
of simultaneous black swan events as exogenous shocks in
the policy systems. Such policy modeling developments
could permit direct testing and refinement of multiple
institutional design frameworks such as IAD, MSF, and
ACF across different public policy arenas.
Acknowledgments We gratefully acknowledge funding from the
United States Department of Transportation via the University of
Vermont Transportation Research Center and National Science
Foundation EPS-1101317. Authors bear complete responsibility for
all the data and information provided in this article.
References
Agranoff R, McGuire M (2003) Inside the matrix: integrating the
paradigms of intergovernmental and network management. Int J
Public Adm 26:1401–1422
Batty M (2007) Cities and complexity: understanding cities with
cellular automata, agent-based models, and fractals. The MIT
Press, Cambridge, MA
Baumgartner FR, Jones BD (2002) Policy dynamics. University of
Chicago Press, Chicago, IL
Grimm V, Revilla E, Berger U, Jeltsch F, Mooij WM, Railsback SF
et al (2005) Pattern-oriented modeling of agent-based complex
systems: lessons from ecology. Science 310:987–991
Henson SM, Costantino RF, Desharnais RA, Cushing JM, Dennis B
(2002) Basins of attraction: population dynamics with two stable
4-cycles. Oikos 98:17–24
Holling CS (1973) Resilience and stability of ecological systems.
Annu Rev Ecol Syst 4:1–23
Ingram P, Robinson J, Busch ML (2005) The intergovernmental
network of world trade: IGO connectedness, governance, and
embeddedness. Am J Sociol 111:824–858
Intermodal Surface Transportation Efficiency Act of 1991, Pub.
L. No. 102–240, 105 Stat 1914
Janssen MA, Ostrom E (2006) Empirically based, agent-based
models. Ecol Soc 11(2): 37. http://www.ecologyandsociety.org/
vol11/iss2/art37/
Jones C, Hesterly WS, Borgatti SP (1997) A general theory of
network governance: exchange conditions and social mecha-
nisms. Acad Manag Rev 22:911–945
Kauffman S, Peterson C, Samuelsson B, Troein C (2004) Genetic
networks with canalyzing Boolean rules are always stable.
PNAS 101:17102–17107
Kickert WJM, Klijn EH, Koppenjan JFM (1997) Managing complex
networks: strategies for the public sector. Sage, London
Kingdon JW (1984) In agendas, alternatives, and public policies.
Little, Brown and Company, Boston
Klijn EH (1996) Analyzing and managing policy processes in
complex networks. Adm Soc 28:90–119
Koliba C, Meek J, Zia A (2010) Governance networks in public
administration and public policy. CRC Press, Boca Raton, FL
Krugman P (1994) Complex landscapes in economic geography. Am
Econ Rev 84:412–416
Marsh D, Rhodes RAW (1992) Policy networks in British govern-
ment. Clarendon Press, Oxford
Milward HB, Provan KG (1998) Measuring network structure. Public
Adm 76:387–407
Neary JP (1978) Dynamic stability and the theory of factor-market
distortions. Am Econ Rev 68:671–682
Ostrom E (2005) Understanding institutional diversity. Princeton
University Press, Princeton, NJ
O’Toole LJ (1997) Treating networks seriously: practical and
research-based agendas in public administration. Public Adm
Rev 57:45–52
Page F, Wooders M (2009) Strategic basins of attraction, the path
dominance core, and network formation games. Games Econ
Beh 66:462–487
Rhodes RA (1997) Understanding governance: policy networks,
governance, reflexivity and accountability. Open University
Press, Maidenhead
Sabatier P, Jenkins-Smith H (1993) Policy change and learning: an
advocacy coalition approach. Westview Press, Boulder, CO
Scheffer M, Carpenter S, Foley JA, Folke C, Walker B (2001)
Catastrophic shifts in ecosystems. Nature 413:591–596
Taleb NN (2010) The Black Swan: the impact of the highly
improbable fragility. Random House, New York, NY
Vandermeer J, Granzow de la Cerda I, Perfecto I, Boucher D, Ruiz J,
Kaufmann A (2004) Multiple basins of attraction in a tropical
forest: evidence for nonequilibrium community structure. Ecol-
ogy 85:575–579
Walker B, Holling CS, Carpenter SR, Kinzig A (2004) Resilience,
adaptability and transformability in social-ecological systems.
Ecol Soc 9:5. http://www.ecologyandsociety.org/vol9/iss2/art5
Wuensche A (1999) Classifying cellular automata automatically:
finding gliders, filtering, and relating space-time patterns,
attractor basins, and the Z parameter. Complexity 4:47–66
Zia A, Koliba C (2011) Accountable climate governance: dilemmas
of performance management across complex governance net-
works. J Comp Policy Anal Res Pract 13:479–497
AI & Soc
123