Embed Size (px)
Citation preview
A Multi-factor Analysis of the Emergence of a Specialist-based Economy among the
Phoenix Basin Hohokam
by
Sophia Kelly
A Dissertation Presented in Partial Fulfillment
of the Requirements for the Degree
Doctor of Philosophy
Approved April 2013 by the
Graduate Supervisory Committee:
David Abbott, Chair
J. Andrew Darling
Gordon Moore
Katherine Spielmann
ARIZONA STATE UNIVERSITY
May 2013
i
ABSTRACT
This project examines the social and economic factors that contributed to the
development of a specialist-based economy among the Phoenix Basin Hohokam. In the
Hohokam case, widespread dependence on the products of a few concentrated pottery
producers developed in the absence of political centralization or hierarchical social
arrangements. The factors that promoted intensified pottery production, therefore, are the
keys to addressing how economic systems can expand in small-scale and middle-range
societies. This dissertation constructs a multi-factor model that explores changes to the
organization of decorated pottery production during a substantial portion of the pre-
Classic period (AD 700 – AD 1020). The analysis is designed to examine simultaneously
several variables that may have encouraged demand for ceramic vessels made by
specialists.
This study evaluates the role of four factors in the development of supply and
demand for specialist produced red-on-buff pottery in Hohokam settlements. The factors
include 1) agricultural intensification in the form of irrigation agriculture, 2) increases in
population density, 3) ritual or social obligations that require the production of particular
craft items, and 4) reduced transport costs. Supply and demand for specialist-produced
pottery is estimated through a sourcing analysis of non-local pottery at 13 Phoenix Basin
settlements. Through a series of statistical analyses, the study measures changes in the
influence of each factor on demand for specialist-produced pottery through four temporal
phases of the Hohokam pre-Classic period.
ii
The analysis results indicate that specialized red-on-buff production was initially
spurred by demand for light-colored, shiny, decorated pottery, but then by comparative
advantages to specialized production in particular areas of the Phoenix Basin. Specialists
concentrated on the Snaketown canal system were able to generate light-colored, mica-
dense wares that Phoenix Basin consumers desired while lowering transport costs in the
distribution of red-on-buff pottery. The circulation of decorated wares was accompanied
by the production of plainware pottery in other areas of the Phoenix Basin. Economic
growth in the region was based on complementary and coordinated economic activities
between the Salt and the Gila River valleys.
iii
ACKNOWLEDGEMENTS
I am grateful to my dissertation chair, Dave Abbott, who has guided me with great
expertise and patience. Dave’s research on Hohokam prehistory is the most consistent,
logical, and enthusiastic approach that I have witnessed. I have learned a great deal from
him. I am also greatly appreciative of my three committee members, Kate Spielmann,
Andy Darling, and Gordon Moore. Each has provided complementary expertise on
various aspects of this analysis. Kate Spielmann provided a wealth of insight on
specialized craft production in the American Southwest and economic archaeology. I am
indebted to her for her keen advice on various aspects of this project. Andy Darling’s
insightful comments drew from his expertise spanning the American Southwest to
Mexico, the prehistoric to the historic. Gordon offered guidance on the mineralogical
analyses that form the basis for this research. He also provided a valuable perspective
from outside of the anthropological discipline. Of course, all short-comings in this study
are my responsibility, and not that of my committee.
In archaeology, particularly in the American Southwest, no woman stands alone.
Many people helped me throughout the course of this project. Andy Lack has been a
tremendous help to me through the years. I could not have done this without his wit and
wisdom. I am also grateful to my friends and colleagues Josh Watts and Chris Watkins
for their expertise and support. Doug Craig kindly lent his expertise on Hohokam
population estimates. Bill Doelle shared his Southwestern population database that was a
cornerstone of this project. Kyle Woodson was an invaluable consult on population and
canal length estimates for the middle Gila River valley, which were essential to the

iv
research design. Jerry Howard gave me helpful advice and information regarding canal
systems in the Salt River valley. Billy Graves and Jim Heidke provided invaluable
assistance with comparative information on craft specialization in the American
Southwest. Erik Steinbach assisted with GIS renditions of some of the maps in this
dissertation. Beth Miksa, whose methodology has changed the course of Hohokam
research, offered essential guidance on implementing the sand petrofacies model. Mary
Ownby provided comments on the methods used in this analysis. Hector Neff and
Richard George were invaluable help with the TOF-LA-ICP-MS analyses. Bob Hunt and
Sunday Eiselt offered their perspective and expertise on several issues that I tackle in this
project. Kostalena Michelaki granted access to her lab space and microscopes. She also
and provided critical insights on how to present this material to the public. Arleyn Simon,
Dolma Roder and Nathan Wilson offered invaluable assistance with the ASU
Anthropology collections. Arthur Vokes was extremely helpful with collections at the
Arizona State Museum. Holly Young and Lindsey Vogel helped me with collections
from the Pueblo Grande Museum. Ok Soon Kim, Ian Wilder, and Alyssa Snyder assisted
with morphological attribute collection on the ceramic samples.
This analysis utilized ceramic collections and data gathered by the Gila River
Indian Community’s (GRIC) Cultural Resource Management Program (CRMP) in
conjunction with the Pima-Maricopa Irrigation Project (P-MIP). These entities receive
funding from the U.S. Department of the Interior, Bureau of Reclamation, under the
Tribal Self-Governance Act of 1994 (P.L. 103-413), for the design and development of a
water delivery system that uses Central Arizona Project water. I am a research

v
collaborator with GRIC-CRMP and have agreed to follow all protocols associated with
this status (see Appendix A). I appreciate the assistance of Andy Darling (formerly the
CRMP Director) in facilitating the research collaborator agreement.
I am grateful to the GRIC-CRMP in Sacaton, Arizona for logistical support with
portions of this analysis including help with accessing P-MIP ceramic collections and for
providing analysis space for research on these collections. In particular, I am greatly
indebted to Linda Morgan for her assistance throughout this project. I am also very
grateful to Lorie Sinclair. Ceramic collections that I analyzed in the CRMP laboratory are
housed on-site at CRMP or have been transferred to the Huhugam Heritage Center.
Financial support for this dissertation was provided by a National Science
Foundation doctoral dissertation improvement grant (BCS 1115362) and research grants
from the School of Human Evolution and Social Change at Arizona State University and
from the Arizona Archaeological and Historical Society. Funding for research at the
IIRMES laboratory was provided by a National Science Foundation grant awarded to
Hector Neff (BCS 0917702) for the support of visiting researchers at California State
University Long Beach. The Dean's Dissertation Writing Fellowship provided funding
while I was compiling this research.
I am indebted to my parents, Ann and Henry Kelly, for emphasizing the
importance of education throughout my life. I would not have been able to complete this
dissertation without your unflagging encouragement. I’m sure that you imagined that I
would have graduated long before now, and with a much more practical degree than
vi
archaeology. But, you have had the courtesy to never point this out to me. Your support
is a gift that cannot be forgotten, or repaid.
My sister Alice Kelly has been the best friend and cheerleader a person could
wish for. It is fitting that we have gone through the last throes of graduate school in the
same strides. Finally, my husband, Scott Thompson, has been in the trenches with me
(literally and figuratively) from the very beginning. Thank you for all that you have done
and continue to do.
vii
TABLE OF CONTENTS
Page
LIST OF TABLES………………..…………………..………………………………...xiii
LIST OF FIGURES………………………………...……………………………………xv
CHAPTER
1: INTRODUCTION TO CRAFT SPECIALIZATION IN THE HOHOKAM
ECONOMY………………………………………………………………………….……1
Craft Production among the Phoenix Basin Hohokam ........................................... 2
Economy ........................................................................................................... 4
Why Here and Why Now? Political and Economic Theories for Developing
Reliance on the Regional Economy ...................................................................... 10
Political Models .............................................................................................. 11
Economic Models ........................................................................................... 12
Situating the Hohokam Economy in the American Southwest ............................. 16
Specialized Pottery Production in the American Southwest........................... 16
Distinctive Aspects of the Hohokam Economy .............................................. 18
Charting the Development of the Phoenix Basin Economy ................................. 21
2: ADDRESSING THE FACTORS THAT INCREASE THE SUPPLY AND DEMAND
FOR SPECIALIST-PRODUCED POTTERY……………………..……………………25
Defining Supply: Division of Labor and Level of Specialization ........................ 27
Comparative Advantages: External and Internal ............................................ 28
Defining Demand: The Extent of the Market ....................................................... 31
viii
CHAPTER Page
Economic Growth: Putting Supply and Demand Together .................................. 33
Identifying Factors that Change the Supply and Demand for Goods ................... 37
Factor 1: Population Density .......................................................................... 38
Factor 2: Irrigation Agriculture ....................................................................... 40
Factor 3: Socially Valued Goods .................................................................... 41
Factor 4: Transport Costs ................................................................................ 45
Summary ............................................................................................................... 48
3: METHODS…………..……………...……………………………………………...…50
Sampling Regime .................................................................................................. 52
Establishing Temporal Control for Ceramic Samples .......................................... 55
Dated Features ................................................................................................ 55
Wallace’s Refined Seriation of Red-on-buff Pottery ...................................... 57
Ensuring Temporal Sensitivity in the Artifact Collection .................................... 60
The Ceramic Sourcing Analysis ........................................................................... 64
Sand Petrofacies Model ........................................................................................ 65
Binocular Microscope Examination ..................................................................... 67
Petrographic Analysis ........................................................................................... 68
Thin-section Selection and Preparation .......................................................... 68
Modification of Petrofacies Discriminant Model Technique ......................... 69
Results from Petrographic Analysis ................................................................ 72
Accuracy of Low-Powered Microscope Analysis .......................................... 73
ix
CHAPTER Page
Creating Generic Sand Composition Categories ............................................ 75
Applying the Petrographic Data to the Binocular Microscope Analysis .............. 78
Calculating the Dependent Variables: Supply and Demand ................................. 81
Supply ……………………………………………………………………………81
Demand ................................................................................................................. 83
Demand: Volume of Non-Local Wares .......................................................... 83
Demand: Concentration of Pottery from Different Sources ........................... 86
Calculating Evenness. ..................................................................................... 86
Calculating the Independent Variables ................................................................. 88
Factor 1: Population Density ................................................................................ 89
Justification for Doelle’s Population Database ............................................... 90
Factor 2: Workload in Irrigation Agriculture........................................................ 93
Canal Length Figures ...................................................................................... 95
Canal System 1 Length Proxy......................................................................... 95
A Canal System for Las Ruinitas .................................................................... 96
Gila River Canal Length Proxy....................................................................... 96
Factor 3: Socially Valued Goods .......................................................................... 97
Factor 4: Transport Cost ....................................................................................... 99
Vessel Form .................................................................................................. 102
Calculating the Independent Variables for Supply ............................................. 104
The Multiple Regression Analysis ...................................................................... 107
Multiple Regression Method......................................................................... 107
x
CHAPTER Page
Output of Multiple Regression Analyses ...................................................... 109
Checks on Multicolinearity ................................................................................. 111
Limitations of the Regression Analyses ............................................................. 112
4: MULTIPLE REGRESSION ANALYSES FOR THE SUPPLY AND DEMAND OF
SPECIALIST-PRODUCED RED-ON-BUFF POTTERY…………………….……….113
Supply of Specialist-Produced Decorated Pottery .............................................. 114
Social Valuables............................................................................................ 116
Transport Costs ............................................................................................. 118
Demand for Specialist-Produced Decorated Pottery .......................................... 121
Transport Costs ............................................................................................. 123
Social Valuables............................................................................................ 125
Rising Supply Meets Enduring Demand............................................................. 127
Demand and the Social Functions of Red-on-buff Pottery ........................... 127
Encouragements to Supply ........................................................................... 132
5: THE SUPPLY OF DECORATED POTTERY FROM THE SNAKETOWN
COMMUNITY…………………………………………………………………………134
Snaketown Production and Distribution ............................................................. 136
Supply of Petrofacies N Responds to Consumer Demand.................................. 143
Summary: What’s Special About Snaketown ..................................................... 146
Production of Social Valuables ..................................................................... 147
Transport: Central Location .......................................................................... 150
xi
CHAPTER Page
Transport: Ballcourts .................................................................................... 152
Summary ............................................................................................................. 154
6: SPECIALIZED PRODUCTION OF DECORATED AND PLAINWARE
VESSELS……………………………………………………………………………….155
Specialized Plainware Production in Salt River Valley: Abbott’s Research ...... 156
Specialized Plainware Production in the Gila River Valley ............................... 158
Production of “Schist Only” Decorated and Plain Wares on the Gila River ...... 160
I. TOF-LA-ICP-MS Analyses of Schist........................................................ 161
II. Amount of Schist Temper Used in Decorated Pottery Production .......... 166
III. Production Output ................................................................................... 167
V. Technological Similarities ....................................................................... 169
Plainware Moves East, Decorated Wares Move West........................................ 173
Schist-Tempered Decorated Wares and Plainwares ........................................... 175
What Encouraged Specialist Plainware Production? .......................................... 176
Limitations: Plainwares versus Decorated Wares............................................... 178
Regional Distribution of Plainwares and Decorated Wares ............................... 180
Summary ............................................................................................................. 182
7: REGIONAL COORDINATION OF A SPECIALIST-BASED HOHOKAM
ECONOMY…………………………………………………………………………….183
Network Effects .................................................................................................. 188
A. Economic Integration ............................................................................... 189
xii
CHAPTER Page
B. Diversity of Specialists............................................................................. 190
C. Degree of Interpersonal Interaction & Trade Dependence ...................... 191
D. Commodification ..................................................................................... 195
On the Brink of Statehood? ................................................................................. 196
A Tale of Two Rivers: A Final Note .................................................................. 198
REFERENCES CITED…………………………………………………………………200
APPENDIX A …………………………………………………………………………..246
APPENDIX B…………………………………………………………………………..249
APPENDIX C …………………………………………………………………………..270
APPENDIX D…………………………………………………………………………..275
xiii
LIST OF TABLES
Table Page
1.1: Regions of the American Southwest with specialized pottery production………….20
1.1: Summary data on specialized production in the American Southwest……………...21
3.1: Collections used in sourcing analysis……………………………………………….54
3.2: Comparison of Wallace’s Hohokam chronology to Haury and Dean’s temporal
sequences………………………………………………………………………...………59
3.3: Features used in analysis that were dated using Wallace's criteria………………….61
3.4: Contexts from which individually-typed sherds were selected……………………..63
3.5: Red-on-buff sherd counts by site……………………………………………………64
3.6: Accuracy of specific petrofacies assignments based on examination with a binocular
microscope……………………………………………………………………………….75
3.7: Generic petrofacies accuracy of middle Gila River valley and Salt River valley
petrofacies from thin sectioned samples…………………………………………….…...78
3.8: Sherd counts in generic petrofacies groups…………………………………………80
3.9: Proportion of pottery exported from each petrofacies to sites in other petrofacies…82
3.10: Proportion of non-local red-on-buff pottery out of entire ceramic assemblage and
out of decorated ceramic assemblage………………………….………………………...85
3.11: Richness and evenness indices for assemblages……..…………………….………88
3.12: Population within a 2.5 km radius of study sites…………………………………..89
3.13: Population per length of main canals for each study site………………………….94
xiv
Table Page
3.14: Canal lengths for canals in the Middle Gila River Valley and proportion increase
between the Pioneer, Colonial, and Sedentary Periods…………………………...……...97
3.15: Average values for mica density and exterior color for non-local pottery imported to
study sites…………………………………………….…………………………..………99
3.16: Number of ballcourts per person per canal system……………………..…….......100
3.17: Average distance that non-local pottery travels from production locale to
consumption locale………………..………………………..……..……………………101
3.18: Average values for bowl aperture and bowl-jar ratio for non-local pottery imported
to study sites…………………...…………………………………………………..……103
3.19: Independent variables for each production area (petrofacies)…………………....106
4.1: Estimates returned for multiple regression analyses for the supply of red-on-buff
wares from production locales across the Phoenix Basin….…………………...………116
4.2: Estimates returned for multiple regression analyses for the volume (proportion) of
imported pottery in decorated assemblages and the concentration of decorated pottery
sources…………………………………………………………………………...……...122
xv
LIST OF FIGURES
Figure Page
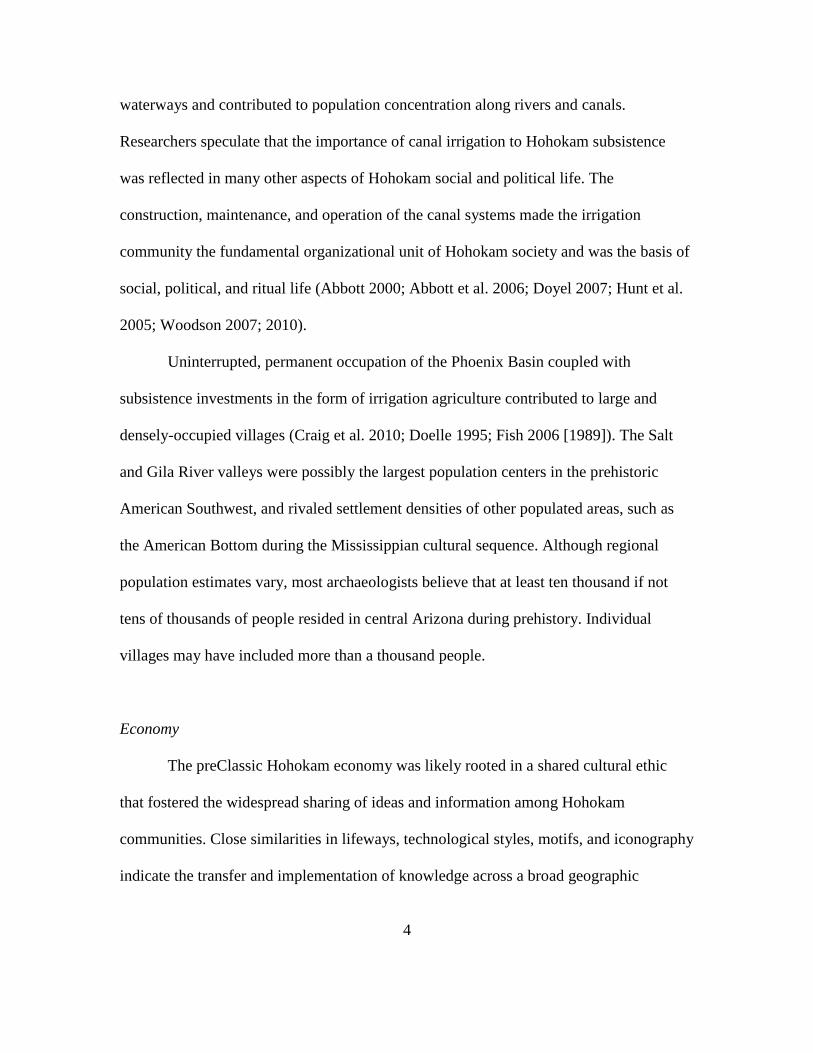
1.1: PreClassic Hohokam red-on-buff pottery from the Phoenix Basin……..……………7
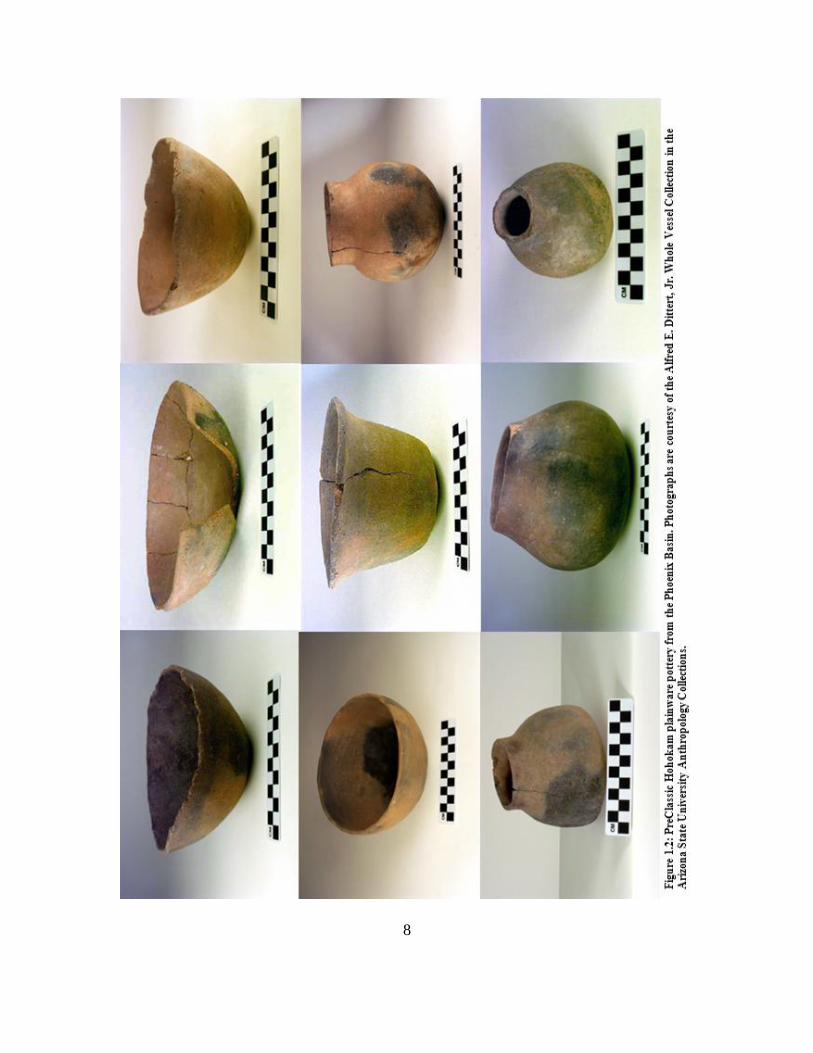
1.2: PreClassic Hohokam plainware pottery from the Phoenix Basin………………….....8
2.1: New Classical diagram of the relationship between the Division of Labor and Extent
of the Market………..……………………………………………………………………34
2.2. Increases to specialized production in a four-good, four-person economy…………37
3.1: Map of the Phoenix Basin with study sites marked…………………………………55
3.2: Flowchart for sand identification in sherd thin sections……………………...……..72
3.3: Generic petrofacies boundaries used in this analysis………………………………..77
3.4: Map used to calculate linear distances between study sites and generic
petrofacies……………………………………………………………………………... 102
3.5: Position of canal systems within petrofacies. Black dots mark the location of major
prehistoric sites…………………………………………………………………………105
4.1. Supply of pottery from Petrofacies A/B/C/H and N to settlements on the Gila River
and the Salt River……………………………………………………………………….115
4.2. Average exterior color value for pottery manufactured in Phoenix Basin production
locales………………………………………………………………….……………….117
4.3. Average mica density for pottery manufactured in Phoenix Basin production
locales………………………………………………………………………………..…117
4.4: Number of people per ballcourt per canal system in major production
locales…………………………………………………………………………...……...119
xvi
Figure Page
4.5: Average bowl aperture of local and non-local pottery consumed by Gila River and
Salt River households……….………………………………………………………….120
4.6: Average bowl-jar ratio of local and non-local pottery consumed by Gila River and
Salt River households……………………………………………………………..……121
4.7: Average proportion of imported buffwares in decorated assemblages and proportion
of buffwares in the entire site assemblage...……………………………………………122
4.8: Proportion of buffware and plainware pottery in Phoenix Basin ceramic assemblages
through the preClassic……………………………………….....................……….……124
4.9: Average mica density of local and non-local pottery consumed by Gila River and
Salt River households…………………………………………………………………..126
4.10: Average exterior color value of local and non-local pottery consumed by Gila River
and Salt River households………………………………………………………………126
5.1: Proportion of red-on-buff pottery manufactured in different production locales
through the preClassic…………………………………………………………………..138
5.2: Relationship between the proportion of pottery from Petrofacies N in site
assemblages and the evenness of sources represented………………………………….139
5.3: Proportion of pottery from Petrofacies A/B/C/H and N in Phoenix Basin
assemblages……………………………………………………………………………..140
5.4: Proportion of non-local pottery from Petrofacies N and from
Petrofacies A/B/C/H……………………………………………………………………141
xvii
Figure Page
5.5: Supply of pottery from small-scale production locales to settlements on the Salt
River…………………………………………………………………………………….142
5.6: Bowl-jar ratio of vessels exported from Petrofacies N to Gila River settlements and
to Salt River settlements………………………………………………………………..144
5.7: Average mica density for vessels made and consumed locally in Petrofacies A/B/C/H
and Petrofacies N…………………………………………………………………….…145
5.8: Average bowl aperture for vessels made in Petrofacies N that were consumed both
within and outside the petrofacies………………………………………………………146
5.9: Proportion of Petrofacies N red-on-buff pottery in Gila River and Salt River site
assemblages……………………………………………………………………………..153
6.1: Locations of raw schist samples collected and analyzed by the Cultural Resource
Management Program of the Gila River Indian Community…………………………...163
6.2: Bivariate plot of cesium and rubidium log concentrations in schist rock samples...164
6.3: Proportion of schist versus sand temper in pottery manufactured in Petrofacies
A/B/C/H and N………………………………………………………………………....166
6.4: Proportion of "schist-only," Petrofacies A/B/C/H, and Petrofacies N decorated
sherds…………………………………………………………………………………...168
6.5: Proportion of “schist-only” plainwares and decorated wares from Petrofacies A as a
proportion of plain and decorated Salt River assemblages, respectively……………….169
6.6: Average mica density of wares from each petrofacies that highlights the similarity
among pottery from Petrofacies A/B/C/H, N, and "schist-only" sherds………………..170
xviii
Figure Page
6.7: Average exterior color value of wares from each petrofacies that highlights the
similarity among pottery from Petrofacies A/B/C/H, N, and "schist-only" sherds….…171
6.8: Average bowl-jar ratio of wares from each petrofacies that highlights the
dissimilarity in production output from Petrofacies A/B/C/H, N, and "schist-only"
sherds…………………………………………………………………………………...172
6.9: Average aperture of bowls from each petrofacies that highlights the similarity among
pottery from Petrofacies A/B/C/H, N, and "schist-only" sherds……………………….172
6.10: Proportion of "schist only" pottery in Gila River and Salt River decorated pottery
assemblages……………………………………………………………………………..174
7.1: Average number of people per kilometer of main canal for the Gila and Salt River
systems………………………………………………………………………………….185
1
CHAPTER 1: INTRODUCTION TO CRAFT SPECIALIZATION IN THE
HOHOKAM ECONOMY
The development of specialized craft production represents a significant shift in
the economic relationships among households. This type of change can be a precursor to
the emergence of complex and interdependent economies. Prehistoric economic systems
in the American Southwest were characterized by the specialized craft production and
distribution of a variety of goods. Almost all documented cases of craft specialization,
however, were part-time, independent production at a community or household industry
level (Mills and Crown 1995:13). Output from individual specialists was relatively low
(Harry 2005; Heidke et al. 2002:169) and the vast majority of households relied
minimally on specialist producers, if at all. One notable exception to this trend was the
Hohokam culture region of central and southern Arizona. For over 600 years, Hohokam
households relied almost entirely on specialists to supply them with their domestic
ceramic assemblage. Households across this wide geographic expanse were particularly
dependent on part-time specialists concentrated along the Gila River to provide them with
decorated vessels (Abbott 2009).
The prehistoric Hohokam economy provides an opportunity to evaluate the effects
of multiple factors on the development of specialized economies, because it was
characterized by long-term and intensive craft production. Intensive craft production in
this region presents a compelling exception to many models for the development of
specialized economies in middle-range societies that highlight unequal access to
2
subsistence resources and increasing political centralization as driving factors. High
supply and demand for specialist-produced crafts in this region persisted in the absence
of resource scarcity or hierarchical political arrangements. Social contexts of production
and consumption of specialist goods likely played a pivotal role in the emergence of
specialized craft economies as well as economic factors that underwrote enduring
relationships between specialist producers and consumers.
The remarkable contrast between the Hohokam economic system during the mid-
tenth century and many other regions of the prehistoric Southwest introduces two
compelling issues: What factors contributed to the development of a specialist-based
economy in the Phoenix Basin? And, what conditions allowed households to become
entirely dependent on craft specialists to supply them with daily necessities? The answers
to these questions reveal the factors that limit or encourage specialized economies in
small-scale and middle-range societies. This project uses one specialist-produced item—
red-on-buff pottery—to explore the development of a specialist-based economy in the
Phoenix Basin. This study investigates the conditions that encouraged the expansion of
specialized red-on-buff pottery production from its early stages in the eighth century until
the height of Hohokam economic expansion during the eleventh century AD.
Craft Production among the Phoenix Basin Hohokam
The Hohokam economy developed on a social and environmental landscape
characterized by large, stable population centers and subsistence intensification in a
desert ecosystem. The cultural developments in the Hohokam region are rooted in the
3
tradition of deep sedentism in central and southern Arizona throughout prehistory (Clark
and Gilman 2012; Fish 2006 [1989]; Fish and Fish 2012; Hill et al. 2004:689; White and
Lekson 2001:99). Although individual household architecture may have had relatively
short use-lives and shifted in location through time (Ciolek-Torrello 2012), particular
areas were intensively occupied over long temporal spans. Permanent villages were
established in the Tucson Basin as early as 2100 BC (Mabry 1999; 2008). By AD 500-
650, the material markers that archaeologists use to identify Hohokam culture, such as
pottery, particular stylistic motifs, pithouse dwellings, and large-scale irrigation
agriculture, appear at settlements throughout central and southern Arizona (Abbott
2000:27; Haury 1976; Wallace et al. 1995). Hohokam communities continued to develop
over the next 1,000 years, often in the same areas, until the disintegration of the regional
system after AD 1400 (Abbott 2003a; Ackerly 1988; Dean 2007).
Although the Hohokam archaeological culture stretched across a vast territory in
central and southern Arizona during prehistory, most settlements were located along
major river systems where intensive agriculture provided most subsistence staples. Long-
term human occupation of central and southern Arizona is generally attributed to the
wide and level river valleys that enabled the development of the largest prehistoric
irrigation systems in North America (Howard 1993b; 2006; Hunt et al. 2005; Woodson
2010). Canal networks were constructed as early as 1250 BC in the Tucson Basin (Mabry
1999; 2008), and remained critical to Hohokam subsistence until the 15th
century.
Although the Sonoran desert offered a diversity of wild resources (Fish and Nabhan
1991; Rice 1992:15-17), low annual rainfall prohibited intensive agriculture away from
4
waterways and contributed to population concentration along rivers and canals.
Researchers speculate that the importance of canal irrigation to Hohokam subsistence
was reflected in many other aspects of Hohokam social and political life. The
construction, maintenance, and operation of the canal systems made the irrigation
community the fundamental organizational unit of Hohokam society and was the basis of
social, political, and ritual life (Abbott 2000; Abbott et al. 2006; Doyel 2007; Hunt et al.
2005; Woodson 2007; 2010).
Uninterrupted, permanent occupation of the Phoenix Basin coupled with
subsistence investments in the form of irrigation agriculture contributed to large and
densely-occupied villages (Craig et al. 2010; Doelle 1995; Fish 2006 [1989]). The Salt
and Gila River valleys were possibly the largest population centers in the prehistoric
American Southwest, and rivaled settlement densities of other populated areas, such as
the American Bottom during the Mississippian cultural sequence. Although regional
population estimates vary, most archaeologists believe that at least ten thousand if not
tens of thousands of people resided in central Arizona during prehistory. Individual
villages may have included more than a thousand people.
Economy
The preClassic Hohokam economy was likely rooted in a shared cultural ethic
that fostered the widespread sharing of ideas and information among Hohokam
communities. Close similarities in lifeways, technological styles, motifs, and iconography
indicate the transfer and implementation of knowledge across a broad geographic
5
expanse. The construction of a network of ballcourts around AD 800 is one of the
strongest indicators of social and economic integration in Hohokam society. The ubiquity
of these ballcourts at settlements has been interpreted as a sign of a pan-Hohokam
identity and widespread participation in an inclusive social and religious system (Wilcox
and Sternberg 1983). Ballcourts are also one of several material markers for the influence
of ideas from northern and central Mexico (Doolittle 1990; Gladwin 1948; Plog 1980a;
Schroeder 1966; Wilcox 1979; 1991a).
The long-term growth of Hohokam settlements and subsistence infrastructure in
the Sonoran desert provided a stable platform for economic development in the region. In
particular, the later preClassic period (AD 650 – 1100) marked the rapid expansion of the
economic system in the Phoenix Basin to its greatest extent during prehistory.
Households began to focus their productive activities on particular tasks through
specialization, and consequently to rely on the products manufactured by other
households. The diversity of goods produced and traded indicates an increased
dependence on supply and demand relationships within the regional economy (cf Doyel
1991). Raw materials and finished craft items such as shell (Marmaduke 1993; Nelson
1991), groundstone (Bostwick and Burton 1993), textiles (Hunt 2011), minerals (Nelson
1981), obsidian (Peterson et al. 1997), and stone palettes (Krueger 1993; White 2004)
were moved in quantities across the region (Bayman 2004; Doyel 1991).
Of the many items that were produced and traded in the Hohokam economy,
ceramic containers are perhaps the best documented (Abbott et al. 2007a). New advances
in ceramic sourcing have enabled archaeologists to determine where these pots were
6
produced and consumed (Miksa and Heidke 2001; Miksa 2001a; Miksa et al. 2004). In
addition, stylistic seriation of red-on-buff pottery designs allows researchers to date
Hohokam decorated wares with precision (Wallace 2004). Recent archaeological
analyses have combined detailed provenance with chronological data on pottery to
reconstruct the organization of Hohokam ceramic manufacture and distribution in
prehistory. This research indicates that both supply and demand for specialist-produced
pottery in the Hohokam economy developed early on in the culture history (ca. AD 450),
and eventually increased to a massive scale by the 11th
century AD (Abbott et al. 2007a;
Abbott 2009). At this time, the volume of pottery generated by Hohokam potters was
substantial enough to satisfy consumers at the regional level. Specialized pottery
producers generated almost all of the plain and decorated pottery for the approximately
20,000 people living in the Phoenix Basin (Figures 1.1 and 1.2). These wares were
distributed to settlements across 2,000 km² surrounding the confluence of the Salt and
Gila rivers (Abbott et al. 2001; Abbott et al. 2007b; Abbott 2009). Decorated red-on-buff
pottery made by specialists in the vicinity of the large settlement of Snaketown was
distributed more broadly than any other type of pottery in the region. During the middle
Sedentary period, approximately seventy percent of Hohokam decorated red-on-buff
vessels consumed by households across the lower Salt River valley was manufactured by
potters living in this area (Abbott et al. 2007b).
7
8
9
Specialized pottery manufacturers across the Phoenix Basin coordinated their
output so that there was little overlap in the production and distribution of varieties and
forms of different wares. By the mid-11th
century, producers residing in the middle Gila
River generated almost all decorated wares used across the Salt River valley (Abbott
2009; 2010) and the Gila River valley. Meanwhile, plainware producers on the Gila River
made a range of bowls and jars for distribution to the Gila and northern Salt Rivers.
Ceramic producers at Las Colinas manufactured similar forms as Gila River producers,
but distributed them to settlements to the north of the Salt River (Abbott 1988; Abbott et
al. 2007a). Finally, potters working near South Mountain manufactured large water jars
for distribution across the Salt River valley (Abbott 2000:202-208).
The intensive production and widespread circulation of Hohokam pottery appears
to have reached an apex during the middle Sacaton phase (ca. AD 1000). Abbott and his
colleagues (2007a) have argued that periodic marketplaces at ballcourts may have been a
mechanism by which pottery was exchanged between distant producers and consumers.
Although ballcourts were first constructed in the Gila Butte phase, they may have
increasingly served as the locus for economic exchanges, including the transfer of pottery
between producers and consumers (see also Wallace 1994; Wilcox and Sternberg 1983;
Wilcox 1991b). The high volume of production, high demand for the products of distant
producers, and widespread circulation of pottery throughout the Hohokam region suggest
that other craft items such as shell or agricultural products like cotton may have been
produced and circulated in the same quantities. Although the organization of shell and
cotton craft production likely differs substantially from pottery production, detailed
10
chronological and sourcing data on pottery can provide the basis for constructing
hypotheses about various aspects of the Hohokam economy. The methods used to
evaluate the production and consumption of pottery are highly sensitive in comparison to
any other item circulated in the Phoenix Basin. Therefore, red-on-buff pottery can
function as a foundation to evaluate the scale of production and consumption of other
goods in the Phoenix Basin.
Why Here and Why Now? Political and Economic Theories for Developing Reliance
on the Regional Economy
The supply and demand for specialist-produced pottery in the Phoenix Basin was
marked by long-term and extensive economic reliance between producers and consumers.
Heavy reliance on exchange for basic necessities can only occur in economies that
maintain continuous and relatively equal levels of supply and demand (Yang 2003).
Therefore, factors that increase and sustain supply and demand for exchanged goods are
the keys to addressing economic growth in middle-range and small-scale societies.
The anthropological literature highlights two ways in which stable supply and
demand relationships develop. First, societies that exert political or social control over the
economy create conditions that underwrite intensified production and a market for the
goods of specialist producers. Second, social or environmental stress can force the
production of goods for trade and can push people to obtain items from exchange that
they cannot obtain themselves. These models are described in greater detail in the
sections that follow.
11
Political Models
In those models that emphasize socio-political factors, the exercise of elite control
can create both a need for and a supply of specialist-produced goods. Craft specialization
is viewed as a pathway for emerging elites to increase their control over labor and
resources (Frankenstein and Rowlands 1978; Friedman and Rowlands 1977). Here,
specialization improves the efficiency of production so that a moderate increase in output
by a few people can result in significant surpluses of particular items. These surpluses
enable potential aggrandizers to leverage goods in exchange for labor. The ability to
organize labor is then used to consolidate political control (D'Altroy and Earle 1985;
Dietler and Herbich 2001; Earle 1982; 1997). Additionally, craft specialists create
symbolic and/or prestigious items, whose controlled production and exchange help to
reify existing power structures (Appadurai 1986:21-33; DeMarrais et al. 1996; Gosden
1989; Vaughn 2006; Voutsaki 1995:9-11). In these cases, particular goods are only
produced by craftsmen who are part of an elite social group (embedded) or are directly
governed by elite control (attached). The increased output of these select specialists
represents an intensification of craft production.
Although these political models explain the development of specialized
production in some middle-range societies, preClassic Hohokam society lacked elites that
would motivate the supply and demand for specialized craft production. Extensive
archaeological research in the Phoenix and Tucson Basins has revealed almost no
material evidence for ranked status differences among individuals or communities. As a
12
result, archaeologists generally agree that Hohokam social organization lacked
centralized authority and hierarchical political structures (Elson and Abbott 2000; Fish
and Yoffee 1996; Fish and Fish 2000; Harry and Bayman 2000). This characterization of
Hohokam society aligns with archaeological and ethnographic research throughout the
broader American Southwest that emphasizes the virtual absence of material evidence for
overtly hierarchical relationships (Graves and Spielmann 2000; Lightfoot and Feinman
1982; Mills 2000a). Additionally, ethnographic research on contemporary tribes indicates
that political organization is marked by an overt ethos of equality that is maintained
through leveling mechanisms that impose social sanctions on potential aggrandizers
(Mills 2004). The prehistoric and historic societies of the American Southwest appear to
use material goods to construct social identities only loosely tied to vertical relationships
(c.f. Bourdieu 1984:208-225; Spielmann 2002:196). Most craft objects were likely
associated with establishing and maintaining horizontal social connections (Clark 2007;
Mills 2004; Weiner 1992).
Economic Models
High economic reliance between consumers and specialized producers that
defines a specialist-based economy can also develop in cases where environmental stress
forces people to depend on one another. Various anthropological models posit different
types of responses to social and environmental stress that result in an increase in both the
supply and demand for the products of craft specialists. The first, and perhaps best known
of these theories is the Agricultural Marginality Model. It contends that unequal access to
13
resources for subsistence production, such as land, forces some people to engage in
specialized craft manufacture as a livelihood (e.g. Arnold 1985; 1993; Durrenberger and
Tannenbaum 1992; Stark 1991). In these situations, craft production becomes the
vocation of the dispossessed and is considered a less preferable strategy to agricultural
production.
Another proposition for sustained economic ties among populations is the
Mutualism Model. This theory holds that the supply and demand for specialized craft
production emerges as a way to balance economic relationships among communities in
different environmental or resource zones. Unlike the Agricultural Marginality Model,
mutualistic relationships involve relatively even benefit to participants. In the American
Southwest, various communities, such as settlements in Mesa Verde and southern
Colorado and the Rio Grande, participated in long-standing mutualistic relationships with
populations who lived in diverse geographic regions (Cordell et al. 2007; Rautman 1996;
Spielmann 1986). The circulation of craft items and agricultural products among these
communities solidified extensive economic networks.
Finally, the Buffering Model posits that populations living in different ecological
zones produce craft items for exchange as a safeguard against risk (e.g. Ford 1972; Mohr
Chavez 1992; Spielmann 1986).1 In this theory, communities create temporary economic
arrangements to alleviate periods of resource scarcity, because seasonal variation and
environmental unpredictability “push” them to do so. Unlike mutualistic relationships,
economic networks based on buffering are characterized by punctuated, short-term
1 Ford’s work extends beyond risk minimization and buffering. Here, I refer to his theories for why
communities might create temporary economic relationships.
14
relationships (Spielmann 1986). These intermittent economic networks can contribute to
temporary increases in production to generate goods for trade.
While anthropological theories that posit a relationship between social and
environmental stress and the supply and demand for specialized craft production may fit
particular situations in the American Southwest, these models only loosely apply to the
Phoenix Basin Hohokam. First, economic models constructed from ethnographic data,
such as the Agricultural Marginality Model, apply to cases where extensive land tenure
prevents some people from participating in subsistence production and forces them to
produce crafts for exchange (Harry 2005). In contrast, specialized pottery production in
the Phoenix Basin emerged and grew during a time when land along the Salt and Gila
rivers would have been relatively plentiful. Population increases and resource stress
during the late Sedentary and Classic periods may have encouraged notions of land
ownership (Watkins 2011), but only well after the peak of red-on-buff specialized
production in the Phoenix Basin. In addition, the model assumes that specialist producers
lack access to large social networks that they could rely on during times of stress.
Hohokam social arrangements, in contrast, likely consisted of nested, kin-based groups
that cooperated in social, ritual, and economic activities (Abbott 2000). Finally, the
Agricultural Marginality Model posits that specialists obtain a substantial portion of their
food from the exchange of their craft items. Heavy reliance on others for food is a risky
strategy that Hohokam households presumably would have avoided.
Although mutualism models have been applied to some cases in the American
Southwest, these models only weakly explain the development of large-scale craft
15
specialization in the Phoenix Basin (see also Hirth 2009:15). First, the Hohokam resided
in the Sonoran desert, which differs environmentally from Puebloan culture regions
above the Mogollon rim (Fish 2006 [1989]; Gasser 1976). The arid desert conditions may
have generated inter-community relationships that differed from those posited elsewhere.
Second, specialized pottery production in Hohokam communities began during a time
when population densities were adequately supplied by the agricultural production on
individual canal systems. The productive capacity of different Phoenix Basin canal
systems during the earlier pre-Classic period was probably not different enough to
encourage widespread demand for specialized pottery production. While mutualistic
relationships may have become more important through the pre-Classic period, a
changing combination of different variables over time likely encouraged the emergence
and growth of a specialist-based Hohokam economy.
Finally, buffering relationships that mitigate localized shortages on a household
scale probably would not account for the emergence of large-scale specialized production
in the Phoenix Basin. Reliance on craft production in exchange for food is risky over the
long term (Arnold 1985:193; Netting 1990; Sahlins 1972). During times of resource
shortfall, many prehistoric populations may have opted to move to other areas, instead of
producing crafts for exchange (after Spielmann 1986). The scale and duration of
specialized pottery production in the Phoenix Basin would require more frequent
economic interactions than those characterized by buffering relationships alone.
16
Situating the Hohokam Economy in the American Southwest
Extant models for economic development in small-scale and middle-range
societies do not explain the development of the Hohokam preClassic economy. In the
Hohokam case, geographically concentrated craft specialists supplied almost all of the
material items that households used on a daily basis including pottery. On a landscape
dotted by culture areas that engaged in specialized pottery production, the Phoenix Basin
economy is unique within the American Southwest for the reliance and duration of
economic relationships between widespread producers and consumers. Some condition,
or series of conditions, must have contributed to economic development in this region
that did not similarly affect surrounding areas. In order to address why the Hohokam
economy developed, I characterize how the Hohokam economy is similar to, and differs
from, the organization of ceramic production in surrounding regions in the American
Southwest. This characterization is then used as the basis to identify conditions that may
have contributed to economic development in the Phoenix Basin.
Specialized Pottery Production in the American Southwest
The scale of specialized prehistoric pottery manufacture in the American
Southwest best fits the definition of individual or community specialization (Costin
1991:8-9), or a household industry (Peacock 1982; van der Leeuw 1984). Pottery was
manufactured by autonomous household production units that distributed their goods
through unrestricted exchange networks. Potters fashioned and distributed their wares
without technological advancements such as the pottery wheel or pack animals. The
17
intensity, or time, that specialists devoted to ceramic and other craft production was
likely part-time work that varied seasonally. In other words, potters distributed their
productive efforts across a range of tasks and shifted how much time they devoted to
these tasks relative to the yearly agricultural cycle. Even during the height of specialist
pottery production in the Phoenix Basin, the estimated volume of pots consumed by
Hohokam households could have been satisfied by part-time work by Phoenix Basin
potters (Heidke 2003; Kelly 2010a). Ceramic manufacture would have likely been
coordinated around the agricultural cycle as well as the activities that the potter
participated in within the domestic context. Pottery production took place within or near
to the home and would have been coordinated with other activities that the potter and her
family engaged in at the same space. Archaeological excavations of pottery
manufacturing areas in the Hohokam region indicate that they are situated within
communal domestic areas that would have been used for a variety of other household
activities. For example, at Snaketown, pottery firing pits and clay mixing basins with
buffware clay were located directly behind several Sacaton phase pithouses (Abbott
2007; Haury 1976:196-197).
The concentration of specialized decorated pottery production in the American
Southwest was typified by community based specialization“in which individual
specialists, aggregated in a limited number of communities, produce pottery for regional
distribution" (Hegmon et al. 1995:33). The Hohokam region also displays this pattern of
community specialization, wherein particular settlements generate goods for exchange.
Potters in villages along the Gila River produced large quantities of decorated and
18
plainware pottery for exchange. By the mid-1100s, and perhaps well before this time,
specialists around the site of Snaketown in the Gila River valley manufactured a large
proportion of the red-on-buff pottery used by households across the Phoenix Basin
(Abbott et al. 2007b).
Distinctive Aspects of the Hohokam Economy
Although the basic organization of pottery and other craft production in the
Hohokam economy is similar to other areas of the American Southwest, the duration of
specialized production, the number of consumers supplied, and the amount of pottery
produced by specialists in the Phoenix Basin exceeded that of specialized production
areas throughout the American Southwest. A large number of consumers in this region
relied almost entirely on concentrated specialists for domestic necessities such as pottery
that they used on a daily basis for cooking and storage. Likewise, a concentrated group of
producers relied on continuous demand for their wares to justify their high output and
distribution of these items across the region.
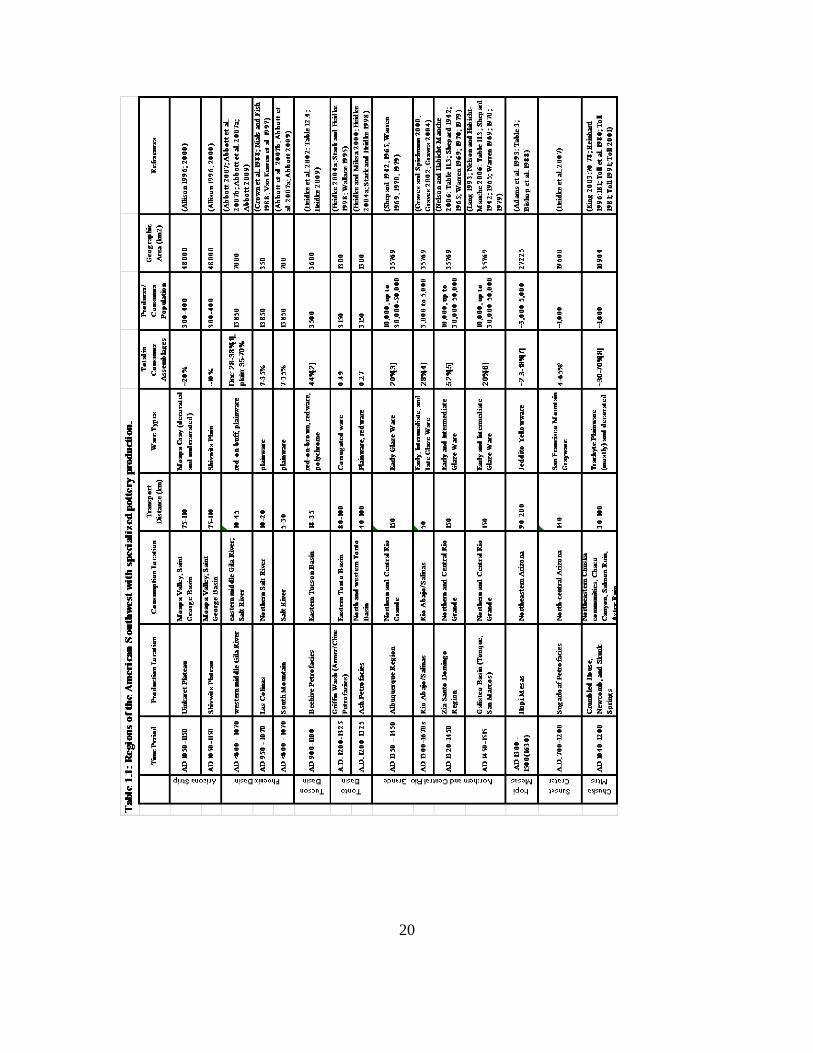
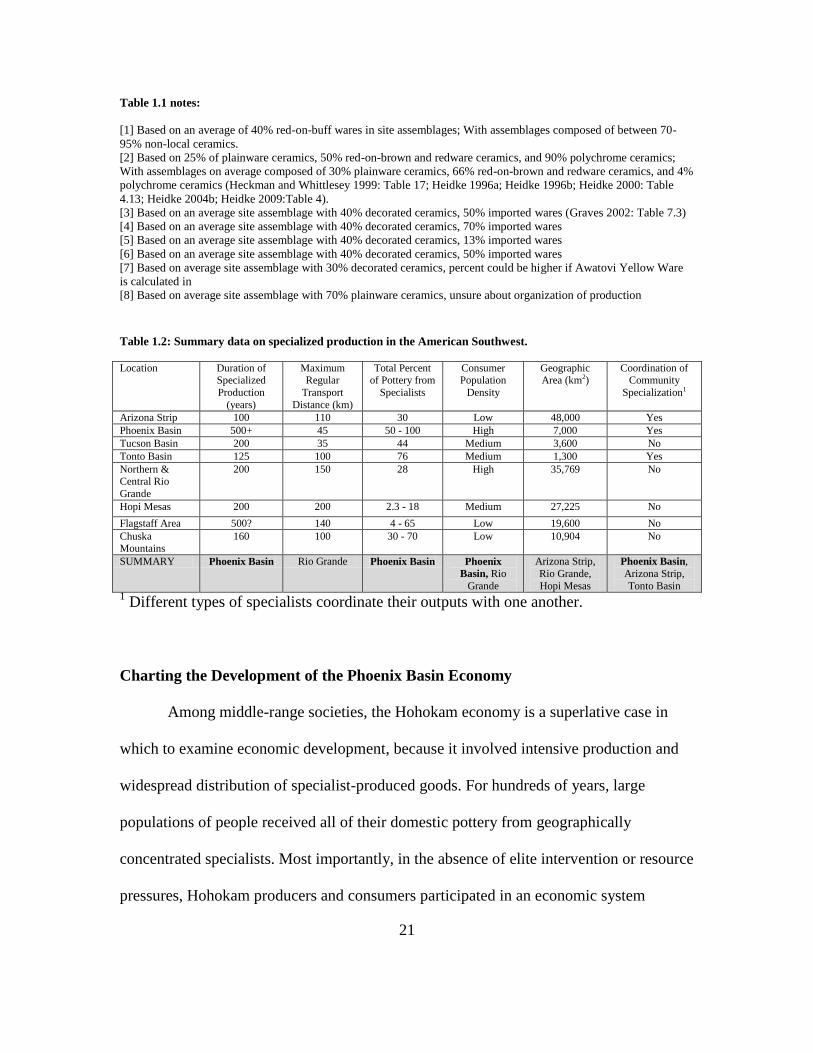
Tables 1.1 and 1.2 display summary statistics on specialized production in each
major specialized ceramic production locale in the American Southwest. These major
production locales include the Arizona Strip, the Northern and Central Rio Grande, the
Hopi Mesas, the Flagstaff area, the Chuska Mountains, the Tucson Basin, and the Tonto
Basin. Of these areas, the Phoenix Basin and possibly the Flagstaff areas were the only
regions where specialized pottery manufacture continued for more than 500 years.
Specialized pottery production also accounted for up to 100 percent of all domestic
19
pottery (decorated and plainwares) used by certain settlements in the Phoenix Basin. In
the American Southwest, reliance on specialists for the supply of pottery was only
matched by producers in the Chuska Mountains whose production accounted for up to 70
percent of wares used by communities to the west. The number of consumers supplied by
specialists in the Phoenix Basin was unparalleled, with the exception of the Rio Grande
region of New Mexico. Finally, specialists in different areas of the Phoenix Basin
coordinated their outputs so that they did not overlap. This type of regional coordination
in specialist output has only been documented in the Arizona Strip and the Tonto Basin.
20
21
Table 1.1 notes:
[1] Based on an average of 40% red-on-buff wares in site assemblages; With assemblages composed of between 70-
95% non-local ceramics.
[2] Based on 25% of plainware ceramics, 50% red-on-brown and redware ceramics, and 90% polychrome ceramics;
With assemblages on average composed of 30% plainware ceramics, 66% red-on-brown and redware ceramics, and 4%
polychrome ceramics (Heckman and Whittlesey 1999: Table 17; Heidke 1996a; Heidke 1996b; Heidke 2000: Table
4.13; Heidke 2004b; Heidke 2009:Table 4).
[3] Based on an average site assemblage with 40% decorated ceramics, 50% imported wares (Graves 2002: Table 7.3)
[4] Based on an average site assemblage with 40% decorated ceramics, 70% imported wares
[5] Based on an average site assemblage with 40% decorated ceramics, 13% imported wares
[6] Based on an average site assemblage with 40% decorated ceramics, 50% imported wares
[7] Based on average site assemblage with 30% decorated ceramics, percent could be higher if Awatovi Yellow Ware
is calculated in
[8] Based on average site assemblage with 70% plainware ceramics, unsure about organization of production
Table 1.2: Summary data on specialized production in the American Southwest.
Location Duration of Specialized
Production
(years)
Maximum Regular
Transport
Distance (km)
Total Percent of Pottery from
Specialists
Consumer Population
Density
Geographic Area (km2)
Coordination of Community
Specialization1
Arizona Strip 100 110 30 Low 48,000 Yes
Phoenix Basin 500+ 45 50 - 100 High 7,000 Yes
Tucson Basin 200 35 44 Medium 3,600 No
Tonto Basin 125 100 76 Medium 1,300 Yes
Northern & Central Rio
Grande
200 150 28 High 35,769 No
Hopi Mesas 200 200 2.3 - 18 Medium 27,225 No
Flagstaff Area 500? 140 4 - 65 Low 19,600 No
Chuska Mountains
160 100 30 - 70 Low 10,904 No
SUMMARY Phoenix Basin Rio Grande Phoenix Basin Phoenix
Basin, Rio
Grande
Arizona Strip,
Rio Grande,
Hopi Mesas
Phoenix Basin,
Arizona Strip,
Tonto Basin 1 Different types of specialists coordinate their outputs with one another.
Charting the Development of the Phoenix Basin Economy
Among middle-range societies, the Hohokam economy is a superlative case in
which to examine economic development, because it involved intensive production and
widespread distribution of specialist-produced goods. For hundreds of years, large
populations of people received all of their domestic pottery from geographically
concentrated specialists. Most importantly, in the absence of elite intervention or resource
pressures, Hohokam producers and consumers participated in an economic system
22
characterized by enduring reliance on one another. Although the basic organization of
specialized production across the American Southwest was roughly similar— community
specialization and part-time household production by independent craft specialists—
particular conditions in the Hohokam case actively encouraged the supply and demand
for specialist-produced goods.
Those conditions that allowed economic development in the Phoenix Basin are
the keys to addressing economic change in societies characterized by an egalitarian social
and political structure. On a landscape characterized by intermittent reliance on
specialized production, what factors contributed to high supply and demand for
specialist-produced pottery in the Hohokam economy? To address this issue, I identify
specific social or economic conditions that encouraged the supply and demand for
specialist-produced pottery in the Phoenix Basin. The analysis principally focuses on the
organization of red-on-buff pottery production, which was manufactured at only a few
locations, yet widely distributed to settlements across the region. It tracks the supply and
demand for specialist-produced decorated pottery from the early beginnings of
widespread reliance on specialists in the Snaketown phase of the preClassic pioneer
period (AD 650-750) until the early Sacaton phase (AD 950-1020), which directly
precedes the apex of the Hohokam economy in the middle Sacaton phase.
The analysis begins by characterizing the relationship between the organization of
production (supply) and the market (demand) for red-on-buff pottery manufactured by
specialists. In Chapter 2, I discuss how the development of the Hohokam economy was
spurred by increases in either the supply or the demand for goods. From this
23
characterization I identify factors that may have affected the supply or demand for
specialist production. I outline how archaeological data in the Hohokam region can
directly address each of these conditions. Chapter 3 then summarizes the methods used to
source decorated Hohokam pottery (dependent variables) and data collection methods for
each of the factors that may have influenced specialized production in central Arizona.
The results of the red-on-buff analyses in Chapter 4 indicate that supply of
specialist-produced decorated pottery, particularly vessels with characteristics of social
valuables, spurred economic development in the Phoenix Basin. In particular, specialized
production of decorated wares on the Snaketown canal system was associated with
economic growth in the Phoenix Basin during the latter portion of the preClassic period.
Chapter 5 explores why decorated pottery manufacture was concentrated on the
Snaketown canal system; it also considers the comparative advantages to intensive
ceramic manufacture in this area. The discussion highlights how Snaketown potters may
have reduced transport costs by situating production in a geographically central area and
by distributing pottery through social events at large ballcourts. Close proximity to the
materials necessary to manufacture light-colored, shiny pottery demanded by Phoenix
Basin consumers and the social or political caché of the Snaketown community may have
also heightened both the supply and demand for decorated vessels.
The development of intensive red-on-buff manufacture in the Phoenix Basin is
then compared to that of specialist-produced plainware pottery. Chapter 6 explores how
the conditions that encouraged the supply and demand for specialist-produced decorated
pottery may be similar to or different from those conditions that affected plainware
24
production. Specifically, plainware pottery production was not as geographically
concentrated as red-on-buff production because of greater transport costs incurred in
moving these bulky wares and the relative abundance of the materials necessary to make
plainwares. However, both decorated and plainware producers may have relied on low
transport costs through centralized production areas and on distribution through a
network of large ballcourts. Chapter 7 provides an analysis at the river system level that
pieces together available evidence on the development of the Phoenix Basin economy
from ceramic sourcing data. The study concludes that complementary economic
relationships between the Salt and the Gila Rivers based on comparative advantages to
particular economic activities on each river system spurred economic development in the
Phoenix Basin. These conditions might be the basis for addressing economic growth in
small-scale and middle-range societies.
25
CHAPTER 2: ADDRESSING THE FACTORS THAT INCREASE THE SUPPLY
AND DEMAND FOR SPECIALIST-PRODUCED POTTERY
The Hohokam archaeological culture exhibited population levels in the tens of
thousands, widespread exchange systems, and infrastructure characteristic of an early
state-level society, but never developed the social or political institutions that mark these
organizations. The supply and demand for specialist-produced pottery —and most likely
other crafts—was higher than any other documented area in the American Southwest. As
a result, the rise of a specialist-based economy in central Arizona directly addresses the
conditions that encourage or limit economic development in small-scale and middle
range economies.
Specialized production of utilitarian goods and the widespread dependence on the
products of specialists for domestic necessities used by every Hohokam household
suggests that large portions of the Hohokam economy were characterized by regular and
reliable interactions between specialist producers and consumers. Economic systems that
involve heavy reliance between producers and consumers are typically structured by
“rational” supply and demand relationships rather than by interactions controlled through
social, ritual, or political institutions. For example, the supply and demand for everyday
household items would not likely be controlled by strong social proscriptions. In addition,
manufacturing of Hohokam pottery took place in ordinary domestic contexts where many
other activities likely took place. Finally, red-on-buff pottery was likely used for standard
26
household functions such as food storage and serving. Therefore, the production, transfer,
and use of decorated pottery were likely closely governed by economic conditions.
The economic root for the supply and demand for specialist-produced red-on-buff
pottery in the Phoenix Basin indicates that it can be analyzed in economic terms.
Specialization, which is often defined as “production above the needs of the household
for purposes of exchange” (Spielmann 1998a:1), is an economic phenomenon. The
process of intensification occurs when a division of labor reduces the number of
craftsmen, while the number of craft objects manufactured remains the same or increases
(after Hunt 2000; Morrison 1994:115; Turner and Doolittle 1978). In other words, people
devote more attention to producing particular items for exchange and in turn rely on
complementary trade with other specialists for goods they do not produce.
An analysis that seeks to identify the factors that contributed to a high level of
craft specialization in the Hohokam economy must simultaneously address the supply
and the demand for goods made by specialists. Supply and demand are two sides to the
division of labor and to the extent of the market. A change to the supply for particular
goods will require a change in demand to reach equilibrium again and vice versa (Smith
1759; Yang 2001:13-15; Young 1928:534, 539). In other words, it is impossible to
analyze consumer and producer decisions separately (Young 1928). Therefore, the
relationship between these economic components must be part of an analysis that
identifies the conditions that encouraged high reliance between producers and consumers.
27
Defining Supply: Division of Labor and Level of Specialization
Factors that affect the supply-side of an economic system are those that influence
an individual’s choice to invest more time and resources into a particular productive
activity (specialization). Economists rely on the concept of comparative advantage to
explain the conditions that encourage or discourage specialization (e.g., Deardorff 2005;
Dornbusch et al. 1977; Jones 1961). Comparative advantage is defined as the ability for a
person to produce an item at a lower overall (marginal) or opportunity cost than another
person (Ricardo 1817). Opportunity cost is the cost incurred by participating in one
activity relative to the costs associated with other possible activities to which a person
could devote their time. Conditions that contribute to a comparative advantage to
specialization are conditions that allow someone to incur a lower opportunity cost by
devoting more of their time to a specialized activity than to a range of different activities.
By specializing in pottery production, for instance, a person may be able to produce more
pots per unit time than they would be able to produce a range of other items.
Archaeologists have long noted that specialized craft production confers
significant advantages, which include greater efficiency within an economic system and
the potential for higher quality goods. In particular, scholars have argued that specialists
can produce more items with less labor than household production by capitalizing on
efficiencies in the production process (Blanton et al. 1982; Brumfiel 1980; Lees and
Bates 1974). Specialists can also produce better quality products because they
concentrate their efforts on particular skills (Blau 1977:188). Recently, archaeologists
have used the concept of comparative advantage to address the emergence and
28
development of specialized craft production within ancient economies (Earle 2000:49;
Rowlands 1998:219; Shennan 1999; Shennan 2011:207). Tibbet (2004) applied the
concept to his analysis of aboriginal subsistence strategies in Australia. Comparative
advantages in production of various agricultural and craft items were critical factors in
the development of a state-level economy in Mesopotamia (Algaze 2005; Algaze
2008:23, 29-30, 35, 63, 148) and Rome (Scheidel 2010:7).
Comparative Advantages: External and Internal
Recently, the concept of comparative advantage has been incorporated into
various economic models for prehistoric economies. Smith (2007) generated a model for
economic specialization in the Late Pleistocene based on the comparative advantages of
particular production activities in negotiating climate change. Watts (2011) used the
concept of comparative advantage to propose a model for the relationship between
intensive irrigation agriculture in the Hohokam region and specialized pottery production
in the Phoenix Basin. Rouse and Weeks (2011) proposed an agent-based model for
economic relationships in Bronze Age Arabia that focuses on the role of comparative
advantage in specialized production and exchange networks.
Comparative advantages can be divided into exogenous and endogenous, or
external and internally derived, comparative advantages. Most modern economists argue
that endogenous comparative advantages are the main cause of changes to the division of
labor within societies (Yang 2001:38; Young 1928). Endogenous comparative advantages
are a result of economies of specialization where an increase in the level of specialization
29
results in increasing returns (productivity) (Yang 2001:8-9). In other words, when an
individual focuses more of their time and attention to a particular production task and less
or no time to other production tasks, they will be able to generate more goods in a shorter
period of time. The increased productivity and efficiency of specialists versus non-
specialists is the largest motivator (advantage) toward devoting time to a specific
productive task (Babbage 1832; Rae 1834; Yang and Ng 1993; Yang 2001).
An increase in production with an increase in specialization (economies of
specialization) is a result of an individual’s ability to increase returns through learning
while doing (Borland and Yang 1994; Yang and Ng 1993; Yang and Ng 1998).
Individuals who specialize in a particular productive activity will become more proficient
and skillful than individuals who engage in this activity less frequently. Specialists
conserve time and effort because they do not switch between different tasks (Maxwell
1721:33; Rashid 1986; Tucker 1755; 1774). Specialization also increases productivity by
reducing fixed learning costs associated with redundant training and learning (Babbage
1832:170-174; Yang 2001:10) and by increasing the usability of fixed training and
learning investments (Arrow 1979:154; Barzel and Yu 1984; Becker 1981). The division
of labor encourages the development and use of different materials, machinery, and tools
that can significantly boost production efficiency (Rae 1834:164-5, 352-7). Finally, the
division of labor can allow a society to accumulate knowledge more quickly and can
contribute to a faster rate of innovation, as individuals perfect particular skills associated
with their production activities (Ehn 2011:20; Yang and Ng 1993).
30
In addition to inherent advantages to specialization, external (exogenous) factors
can increase the comparative advantage to specialization in some people. Exogenous
comparative advantages are differences in the productivity of two individuals that are
caused by external factors unrelated to their choice of productive activities or to their
level of specialization in those activities (Yang 2003:59). These external factors (termed
ex ante factors) may include age, gender, or access to particular materials. Archaeologists
have highlighted the role of the uneven distribution of critical resources as one possible
reason why specialized production of particular items occurs in certain locations (Burton
1984; Costin 1991; Elson 1986; Gasser and Miksicek 1985; Gasser and Kwiatkowski
1991; Malinowski 1922; Murra 1980; Sanders 1956; Shennan 1999; Stark 1991). For
example, a person who lives near to an excellent source of pottery clay may be able to
increase her overall productivity in ceramic manufacture by concentrating more of her
time on manufacturing pottery for exchange. The ease of access to the clay may be a
critical factor in her ability to complete pottery production tasks efficiently. Therefore,
she has an external comparative advantage to specializing in pottery production over a
person who has to travel further to obtain clay suitable for ceramic manufacture. This
woman incurs a low opportunity cost when she chooses to specialize in pottery
production. In contrast, a person who lives further from high quality clay sources may not
be able to increase her overall productivity by investing more of her time in pottery
manufacture, because the higher transportation costs associated with the clay limit her
ability to increase her output. In other words, she incurs a high opportunity cost when
choosing to devote more time to specialized ceramic manufacture.
31
Defining Demand: The Extent of the Market
Demand for particular goods is defined as the extent of the market for an item. At
the most basic level, the market for an item is controlled and limited by the number of
potential consumers, or by the population of a society (Roumasset 2007:8; Yang 2003).
The market for specialist-produced goods in a city can reach much higher levels than in a
small village by virtue of a larger population size. For instance, overall demand for
pottery manufactured by specialists on the Arizona Strip never rose to the level of
demand for these goods in the Phoenix Basin because overall population levels were
much lower.
In addition to basic population levels, the number of goods produced and traded
represents another, interrelated dimension of demand (Yang and Ng 1993:22). A society
that produces and uses a wide range of items has a larger and more varied market than a
society with less material complexity. People living in the modern city of Phoenix,
Arizona use a high number and diversity of material objects in their daily lives, while,
comparatively speaking, communities in the prehistoric Southwest used a lower variety
of items. Phoenix Basin households, however, created an increasing market for various
craft goods through the preClassic. A wide range of goods, including red-on-buff and
plainware pottery in various forms, were circulated through the economy. Demand for
increasingly varied goods (including ceramics) was linked to an expansion of the market
and the growth of the economy.
32
Finally, transaction and transportation costs (Becker and Murphy 1992; Petty
1683:471-472; Smith 1776:31-32) determine the extent of the market. Large population
sizes and the number of goods used in a society can only extend the market so far without
mechanisms that lower costs incurred in the exchange and movement of goods across the
landscape. Transaction costs consist of the time and energy required to locate trading
partners and to complete an exchange (Coase 1937; 1961:15; Wang 2003:2). Social
institutions are often cited as one of the primary mechanisms that influence transaction
costs (Oberschall and Leifer 1986; Yang and Zhou 2009). For instance, regularized
places and times to conduct exchanges reduce the effort involved in arranging transfers.
Markets and fairs that are scheduled in tandem with other social events, such as religious
festivals or other holidays, are one example of social institutions that lower transaction
costs. In contrast, some social institutions increase transaction costs by controlling and
limiting exchanges. Geertz’s (1979) famous example of the Moroccan suq demonstrates
that the identities of producers and consumers within the market contribute to nonlinear
economic transactions that increase the transaction costs of business.
Transportation costs are defined as the expense, time, and energy required to
move goods across a particular distance (Glaeser and Kohlhase 2003; Krugman 1991;
Limão and Venables 2001). Depending on the economic system, producers or consumers
might bear the direct burden of transporting goods. Alternatively, these costs may be
shared by moving the locus for exchange to a geographically central point such as a
marketplace.
33
Economic Growth: Putting Supply and Demand Together
To this point, I have described the general factors that influence increases or
decreases to supply and demand, respectively. Identifying how and why supply and
demand for specialist-produced goods increase requires an understanding of how supply
and demand relate to each other. Even though specialization may be more efficient than
extensive production, people will not choose to specialize if sufficient demand is not
present. Alternatively, although the products of specialists might be better made than
those manufactured by individual households, people will continue to produce and use
their own goods until there are sufficient incentives to rely on exchange relationships for
these goods. Here, I describe how changes to supply and demand contribute to economic
development.
Economic growth and development occur as the supply and variety of goods rises
through specialization, and as the market for these goods (demand) expands with the
number of consumers. This process ultimately increases the reliance that both producers
and consumers have on each other and leads to a more interdependent economy. Since
both supply and demand are intertwined, change to one side will result in a change to the
other. Economic growth occurs through a “ratcheting” effect whereby supply increases,
demand increases, and the economy reaches equilibrium at a higher level of
specialization (Figure 2.1).
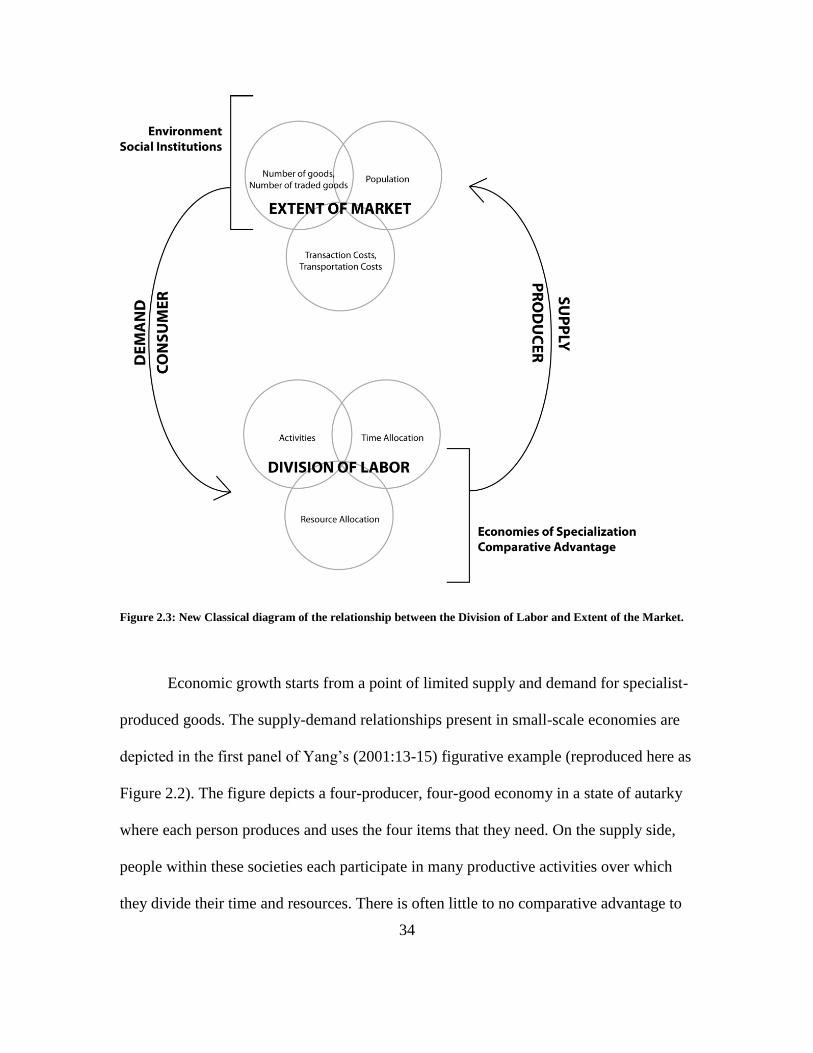
34
Figure 2.3: New Classical diagram of the relationship between the Division of Labor and Extent of the Market.
Economic growth starts from a point of limited supply and demand for specialist-
produced goods. The supply-demand relationships present in small-scale economies are
depicted in the first panel of Yang’s (2001:13-15) figurative example (reproduced here as
Figure 2.2). The figure depicts a four-producer, four-good economy in a state of autarky
where each person produces and uses the four items that they need. On the supply side,
people within these societies each participate in many productive activities over which
they divide their time and resources. There is often little to no comparative advantage to
35
devoting more time to specialized production because the low numbers of potential
consumers and the high transaction costs make self-production of all necessary items
more efficient than the production of items for exchange (and receipt other items in
return). Specialization is also a risky endeavor in which to invest significant time,
because it makes the individual reliant on an often unpredictable and small market.
Economies of specialization, which often rely on regular and intensive access to certain
resources, may also be inhibited in this situation.
Demand for specialist-produced goods in many small-scale and middle-range
prehistoric societies is extremely limited or does not exist at all. Most households
produced almost all the items that they required. The market in these cases was
characterized by low population densities and by low numbers and variety of overall
goods produced. Without technological or subsistence intensification, environmental
conditions also may dramatically affect the ability of people to live in dense settlements
and to transport items across long distances. In addition, large-scale transport of goods
was costly and inefficient without social institutions that lowered transaction costs and
technologies that lowered transportation costs. The movement of items such as pottery
across the landscape likely occurred during periodic social or economic interactions.
The second diagram in the figure (Figure 2.2) represents the economies of most
middle-range societies, in which a small market and a partial division of labor develop. In
this example, the agents only produce three goods instead of the four goods that they
need. Because the agents only produce three of the four goods that they require, they
create complementary exchange relationships with other agents. The person who
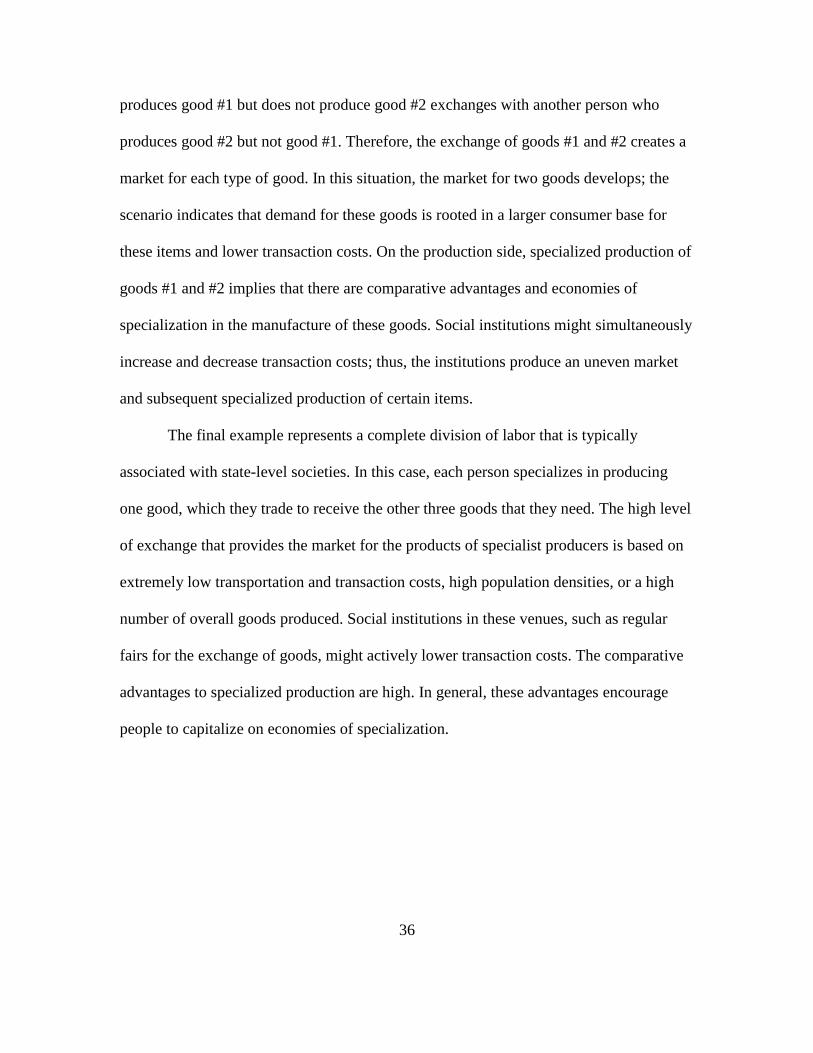
36
produces good #1 but does not produce good #2 exchanges with another person who
produces good #2 but not good #1. Therefore, the exchange of goods #1 and #2 creates a
market for each type of good. In this situation, the market for two goods develops; the
scenario indicates that demand for these goods is rooted in a larger consumer base for
these items and lower transaction costs. On the production side, specialized production of
goods #1 and #2 implies that there are comparative advantages and economies of
specialization in the manufacture of these goods. Social institutions might simultaneously
increase and decrease transaction costs; thus, the institutions produce an uneven market
and subsequent specialized production of certain items.
The final example represents a complete division of labor that is typically
associated with state-level societies. In this case, each person specializes in producing
one good, which they trade to receive the other three goods that they need. The high level
of exchange that provides the market for the products of specialist producers is based on
extremely low transportation and transaction costs, high population densities, or a high
number of overall goods produced. Social institutions in these venues, such as regular
fairs for the exchange of goods, might actively lower transaction costs. The comparative
advantages to specialized production are high. In general, these advantages encourage
people to capitalize on economies of specialization.
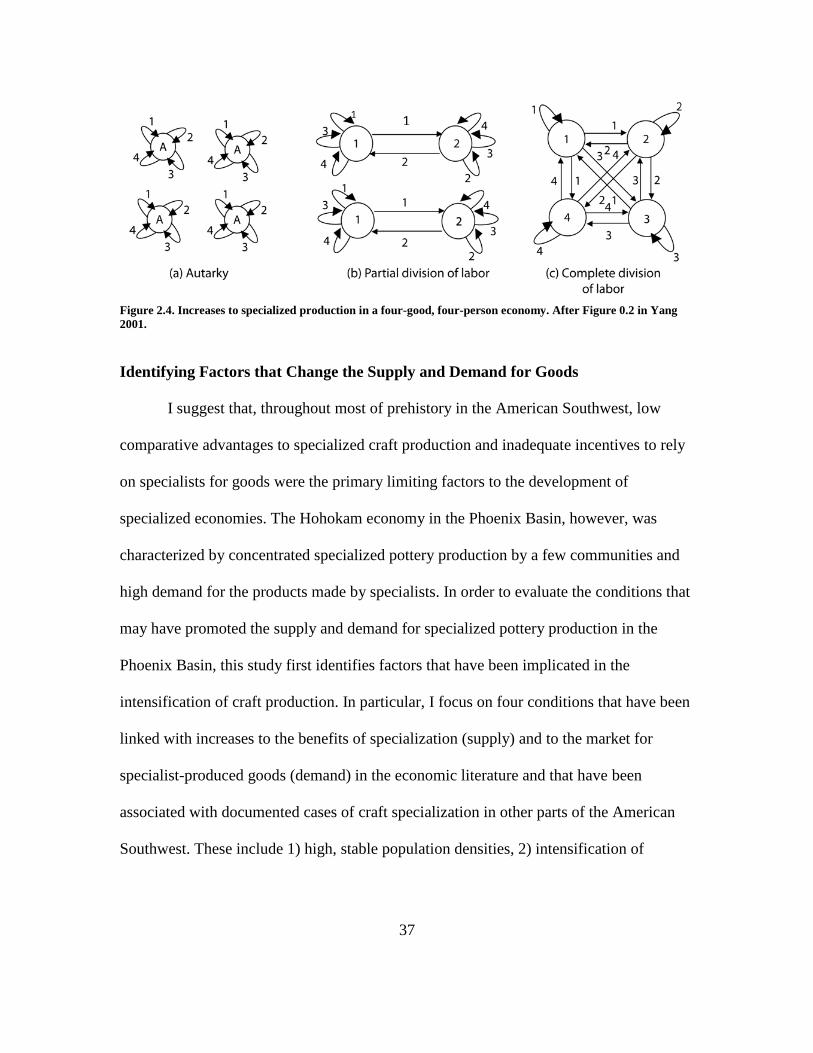
37
Figure 2.4. Increases to specialized production in a four-good, four-person economy. After Figure 0.2 in Yang
2001.
Identifying Factors that Change the Supply and Demand for Goods
I suggest that, throughout most of prehistory in the American Southwest, low
comparative advantages to specialized craft production and inadequate incentives to rely
on specialists for goods were the primary limiting factors to the development of
specialized economies. The Hohokam economy in the Phoenix Basin, however, was
characterized by concentrated specialized pottery production by a few communities and
high demand for the products made by specialists. In order to evaluate the conditions that
may have promoted the supply and demand for specialized pottery production in the
Phoenix Basin, this study first identifies factors that have been implicated in the
intensification of craft production. In particular, I focus on four conditions that have been
linked with increases to the benefits of specialization (supply) and to the market for
specialist-produced goods (demand) in the economic literature and that have been
associated with documented cases of craft specialization in other parts of the American
Southwest. These include 1) high, stable population densities, 2) intensification of
1
38
subsistence production, 3) ritual or social obligations that require particular craft items,
and 4) lower transport costs in the distribution of pottery across the region.
Factor 1: Population Density
Increases in population density in the Phoenix Basin may have provided the
consumer base necessary for large-scale specialized production in the Phoenix Basin and
encouraged producers to intensify production. Population density has been closely
associated with the emergence of craft specialization in the archaeological literature
(Blinman and Wilson 1993:69; Clark and Parry 1990; Curet 1993:438; Durkheim 1893;
Ehn 2011:18; Naroll 1956; Pauketat 1994:174, 177-178; 1997; Rice 1981). In particular,
rising population densities in several regions of the American Southwest are correlated
with an increase in specialized craft production. On the Hopi Mesas, population
aggregation into a series of large pueblos immediately preceded the specialized
production and widespread distribution of Jeddito Yellow Ware (Adams et al. 1993).
Population aggregation has also been linked with a period of intensified pottery
production in the Rio Grande during the fourteenth century (Snow 1981:369).
While population size represents the scale of the potential market, or demand, for
the products of specialists (Yang 2003), clustering of people on the landscape produces
several other effects that can contribute to the supply of goods in an economic system. As
population densities increase, specialization can develop as a means to share resources
efficiently across a wide and densely occupied area, and to create economic niches for
people in a larger economy. Technological innovations and the perfection of craft
39
production techniques, which are both a catalyst and an effect of increasing
specialization, are also correlated with increases in population density (Ehn 2011:20-21;
Kremer 1993).
Increasing demographic scale may be a particularly important variable in the
development of a specialist-based economy in the Phoenix Basin, because the resident
population was larger and more stable than most other regions of the prehistoric
Southwest (Doelle 1995). The expansive Salt and Gila River valleys provided a stable,
resource-rich area for sustained population growth that may have enabled widespread
reliance on specialized producers for domestic items. Population density in the Phoenix
Basin may be related to demand for specialist-produced goods in several ways. First,
increasing regional population densities in central Arizona could place a higher demand
on particular resources. One way that large population centers could efficiently receive
these resources is through specialist production and distribution of finished craft items
(Harry 2005). In addition, stable population centers in the Phoenix Basin may have
allowed reliable social and economic networks to develop between producers and
consumers. It is these networks that encouraged demand for the products of craft
specialists (2007b; Abbott et al. 2007a; Boserup 1965).
If population density is correlated with increases in the supply of pottery by
concentrated craft specialists, those production areas that manufacture the greater portion
of exchanged pottery in the Phoenix Basin are expected to be located in areas with the
highest population densities. If population density is correlated with increases to the
40
demand for red-on-buff pottery made by specialists, consumer locales in areas that are
densely populated are expected to import substantial amounts of pottery from specialists.
Factor 2: Irrigation Agriculture
Second, subsistence intensification in the form of irrigation agriculture may have
increased supply and the market for specialist-produced red-on-buff pottery. Extensive
anthropological and economic research suggests a strong correlation between the
processes of agricultural intensification and specialized craft production (Barlett 1976;
1980; Boserup 1965; Childe 1946; Dalton 1960; Dow 1985; Smith 1976). Archaeologists
have also noted that prehistoric subsistence intensification in the American Southwest
may have encouraged demand for specialized craft production in particular regions.
Examples include the co-occurrence of agricultural intensification and specialized craft
production of various pottery wares in the Dolores area during the Pueblo I period
(Blinman 1986; Wilshusen 1989:827). In the Chuska Mountains, areas with extremely
productive environmental conditions for agriculture were also locales for specialized
pottery production (Toll et al. 1980; Toll 1981; 1991; 2001). Researchers identified corn
from this region in Chaco Canyon. The movement of this staple crop indicates that local
residents may have engaged in surplus corn production either for exchange or for their
own use in ceremonies in the canyon (Benson et al. 2003).
Subsistence intensification in the Phoenix Basin may have also encouraged
specialized pottery production. The extremely large size of prehistoric irrigation systems
in this region indicates that irrigation agriculture played a pivotal role in economic
41
development (Bayman et al. 2004; Doyel 1991; Howard 1993b). Approximately 27,250
ha of arable land were irrigated by canals that extended from the Salt and Gila rivers
(Fish et al. 1992). The high labor requirements of irrigation agriculture could have
introduced scheduling conflicts with craft production; these conflicts would have made
specialist-produced goods more cost effective than household production (Abbott 2009).
Under these conditions, the time investment and scheduling burden involved in irrigation
agriculture may have increased the opportunity costs for craft production and contributed
to the supply and demand for specialized red-on-buff production (Costin 1991:17; Mills
and Crown 1995; Schortman and Urban 2004:197). Hohokam irrigation systems were
also capable of producing surplus food and cotton that could have been exchanged for
craft items. These surpluses may have supported a division of labor in craft production
(Abbott 2009).
If agricultural workloads are correlated with the supply of specialist-produced
pottery, the pottery manufactured by producers on canals with the least number of people
relative to the size of the canal system is expected to account for the highest portion of
exports throughout the Phoenix Basin. If agricultural workloads are correlated with the
market for red-on-buff pottery from specialists, settlements on canal systems with the
highest number of people per canal system size are expected to import the most pottery.
Factor 3: Socially Valued Goods
Third, demand for specialized red-on-buff pottery production may have been the
result of ritual requirements for social valuables. Ritual requirements increase the number
42
of goods used by a society and increase demand for a larger range of goods (see Figure
1.1). Spielmann (2002) suggests that communal ritual and ceremonial participation
motivate specialized craft production and other forms of economic intensification in
small-scale societies. In this model, the intensity and scale of craft production are
affected by sustained demand for material items that satisfy social and ritual obligations
(Rappaport 1984). Although some craft items are exclusively associated with ritual
practice, many social valuables are also linked to less formal contexts. For instance, Rio
Grande glaze ware bowls were closely associated with ritual feasting, but were also used
for food preparation and serving in domestic settings (Spielmann 1998b).
Craft production associated with ritual activities may have promoted the
development of specialized production centers in particular areas of the Southwest. For
example, the emergence of new regional ritual systems in the Rio Grande during the
fourteenth and fifteenth centuries is linked to concentrated production and widespread
distribution of Rio Grande glaze wares (Graves and Spielmann 2000; Spielmann 1998b).
The rise of Chaco Canyon as a ritual center is associated with the development of
specialized white ware production by settlements to the east of the Chuska Mountains.
For instance, three settlements on the eastern side of the Chuska Mountains supplied up
to thirty percent of the pottery recovered from sites in Chaco Canyon (Toll 1981, 1991,
2001; Toll et al. 1980). The Phoenix Basin Hohokam also participated in a pan-regional
ritual system. This system consisted of an extensive network of ballcourts that may have
hosted large community gatherings. Social and ritual events associated with the ballcourts
43
may have promoted specialized production of social valuables (Doyel 1991; Haury
1937a; Marshall 2001; Wilcox and Sternberg 1983).
Hohokam red-on-buff vessels may have been produced as social valuables that
were used in various contexts, ranging from domestic food preparation and consumption
to large-scale social gatherings. Although red-on-buff vessels were a functional
component of Hohokam household pottery assemblages, the designs on these vessels may
have simultaneously signaled participation in Hohokam social and ritual spheres of life.
Red-on-buff bowls and small jars were ubiquitous in Hohokam households from the early
Pioneer period until the end of the Sedentary period. The form and size of red-on-buff
vessels suggest that they were primarily used for food preparation and consumption. In
particular, large red-on-buff bowls could have been used as serving bowls for communal
feasts (c.f. Mills 2007). The production of exotic red-on-buff vessel forms such as
tripods, censers, and human and animal effigies indicates that some red-on-buff items
were used in ceremonial contexts (Whittlesey 2007:69). Several authors draw a
connection between red-on-buff pottery and the display of particular decorative motifs
with a regional Hohokam ideological system (Doyel 2007), as well as with pan-regional
interaction spheres (Nelson and Crider 2005).
The organization of production for socially-valued goods is often affected by the
aesthetic and material qualities of these items. Spielmann (2002:197) notes that the
production of socially-valued goods “has an aesthetic quality to it beyond production for
ordinary, everyday consumption, which may require a certain level of skill and affects the
organization of craft production.” Technological complexity has been closely linked to
44
particular scales of production, such as workshop production (Francis 1991; White and
Pigott 1996). Sometimes the technologies and skills necessary to produce particular craft
items are so complex that only specialists can devote the time and resources to perfect
them (Ambler 1983; Rosen 1997). For instance, Crown (1995:160) argues that large
Salado Polychrome bowls and jars were produced by specialists because the skills
necessary to make them were particularly difficult to master.
The technological investments and skill necessary to produce Hohokam red-on-
buff pottery suggest significant investment in the aesthetic qualities of the pots. Recent
research has highlighted the complexity of the buff ware clay recipe, which contributes to
its light color when fired. Archaeologists believe that ancient potters worked to lighten
the pottery paste so that it provided a contrastive background to red painted designs. To
this end, calcium-rich, and possibly salt-rich, calcareous clays were carefully selected for
buffware production. Caliche nodules were added to the clay to lighten the paste even
further. Most importantly, the firing temperature of the finished pot was carefully
controlled between 800°C and 900°C to induce a chemical reaction between the
calcareous clay and caliche and to prevent spalling. This complex process was not
developed quickly, and ample evidence of experimentation during the late Pioneer period
suggests that potters were actively adjusting their methods to obtain light colored pottery
(Abbott 2007).
If specialized red-on-buff pottery production began as a response to ritual
requirements for the production of socially-valued goods, then the physical appearance of
red-on-buff pottery should reflect this special role early on in the history of its
45
production. Specifically, specialist producers who manufactured the most red-on-buff
wares for export would also manufacture wares with light surface exteriors and high mica
densities. If this physical appearance of red-on-buff wares was important to demand for
these pots, the majority of households who imported buffware would have selected light-
colored vessels with a shiny mica exterior.
Factor 4: Transport Costs
Finally, widespread and uniform circulation of red-on-buff vessel forms suggests
that demand for specialist pottery production may have been related to lower transport
costs within an efficient distribution system (Abbott et al. 2001; Abbott 2010).
Transportation costs can significantly impact the organization of craft production by
increasing or decreasing the ease with which goods are moved from producer to
consumer. Archaeologists working in the American Southwest note that transportation
costs were likely hindered the development of specialized craft production. In particular,
bulky, fragile items, such as pottery, would have been difficult to transport in significant
quantities to potential consumers due to the absence of transportation technologies such
as pack animals (Harry 2005:312).
Despite the fact that transportation in the prehistoric American Southwest was
limited to foot travel, notable cases of specialist production involve the regular transport
of items across long distances. For instance, Moapa Gray Wares and Shivwits Plain
Wares produced by specialists in the Arizona Strip were distributed to Virgin Anasazi
settlements as far away as 110 km (Allison 2000; Lyneis 1992). Jeddito Yellow Wares
46
were distributed from specialist production centers on the Hopi Mesas to settlements over
200 km away (Adams et al. 1993). These instances demonstrate that, although
improvements to transportation methods themselves may not have reduced transport
costs, changes to exchange systems may have lowered the transport costs incurred by
individuals. In particular, the establishment of central exchange areas between producers
and consumers could have reduced the cost of transporting goods by dividing the effort
among the relevant parties (Alden 1982; Belshaw 1965). Both producers and consumers
would travel to exchange goods, but they would not have to travel as far as would be
necessary if only one individual assumed the entire burden of transport.
Changes to exchange systems that lower transportation costs may have been
particularly influential in increasing supply and demand for specialist-produced goods in
the Phoenix Basin. Abbott and his colleagues (2007a) suggest that, by the middle
Sedentary period, marketplaces at ballcourts were important mechanisms to circulate
pottery and other items through the region. Markets, particularly centralized marketing
systems, increase the ease and regularity with which producers and consumers can
exchange goods. As a result, marketplaces lower the cost of their goods and increase
demand for them across a wider geographic area. If supply is correlated with low
transportation costs as a result of ballcourts, the producers who manufacture the most
wares for export are expected to be located on canal systems with the highest number of
ballcourts per capita. If demand is correlated with ballcourts, settlements on canal
systems with the highest number of ballcourts per capita are expected to import the most
pottery.
47
If an efficient distribution system reduced transportation costs, then the volume of
supply and the volume of consumed pottery (demand) should not decrease as the distance
between production and consumption locale increases. In other words, the volume of
non-local pottery should not display patterns consistent with a distance-decay curve.
The absence of efficient distribution mechanisms would be signaled by distinct fall-off
distributions from the location of production to places of consumption. If the supply of
specialist produced pottery is related to transportation costs, those producers who
generate the most wares for export should also transport those wares the farthest. If
demand for pottery is correlated with low transportation costs, villages that import the
most pottery would also import pottery from the furthest distance away.
Finally, producers and consumers could have lowered transport costs by
modifying the form and size of exchanged vessels. For instance, bowls can be carried
more easily than jars because they can be nested inside of one another. Exporting and
importing more bowls than jars may indicate that producers and consumers were
reducing transport costs by modifying the wares that were moved. Similarly, small
vessels are easier to transport than large ones. Producers and consumers could have
lowered transport costs by exchanging those vessels that are smaller than the ones they
produced and used locally. If the supply of specialist-produced pottery is related to
changes in the form and size of vessels, those producers that generate the most wares for
export will also export more bowls than jars (high bowl jar ratio) and small bowls. If
demand for specialist-produced pottery is related to lowered transport costs through
48
modifying the form and size of vessels, those households that import the most non-local
wares will also import more bowls than jars and will import small bowls.
Summary
Although current archaeological work has provided substantial information about
specialized pottery production in central Arizona, it has yet to offer a thorough
explanation for why specialization developed. Population density, subsistence
intensification, ritual obligations, and lower transport costs are all factors that may have
influenced intensive ceramic manufacture and the market for decorated pottery made by
specialized producers in the Phoenix Basin. The effect of the timing, extent, and
coincidence of these conditions on the development of the Hohokam economy, however,
is not yet known. The producers and consumers were likely influenced by several of
these factors, and the impact of these factors likely changed through time as the
Hohokam economy expanded. The precision possible in sourcing and dating decorated
red-on-buff pottery in the Phoenix Basin allows for a close evaluation of each factor at
various stages in the development of regional specialized production.
In the following chapter, I describe the data used to address each of the four
factors that may have contributed to increases in either supply or demand for specialist-
produced pottery. The analysis uses a series of multiple regression analyses to examine
demand for specialist-produced red-on-buff pottery. These regression analyses
incorporate each of the four factors as independent variables. The supply and demand for
buffware pottery represents the dependent variables in these equations. I describe in

49
detail how I calculate the independent and dependent variables that are used in each of
the multiple regression analyses.
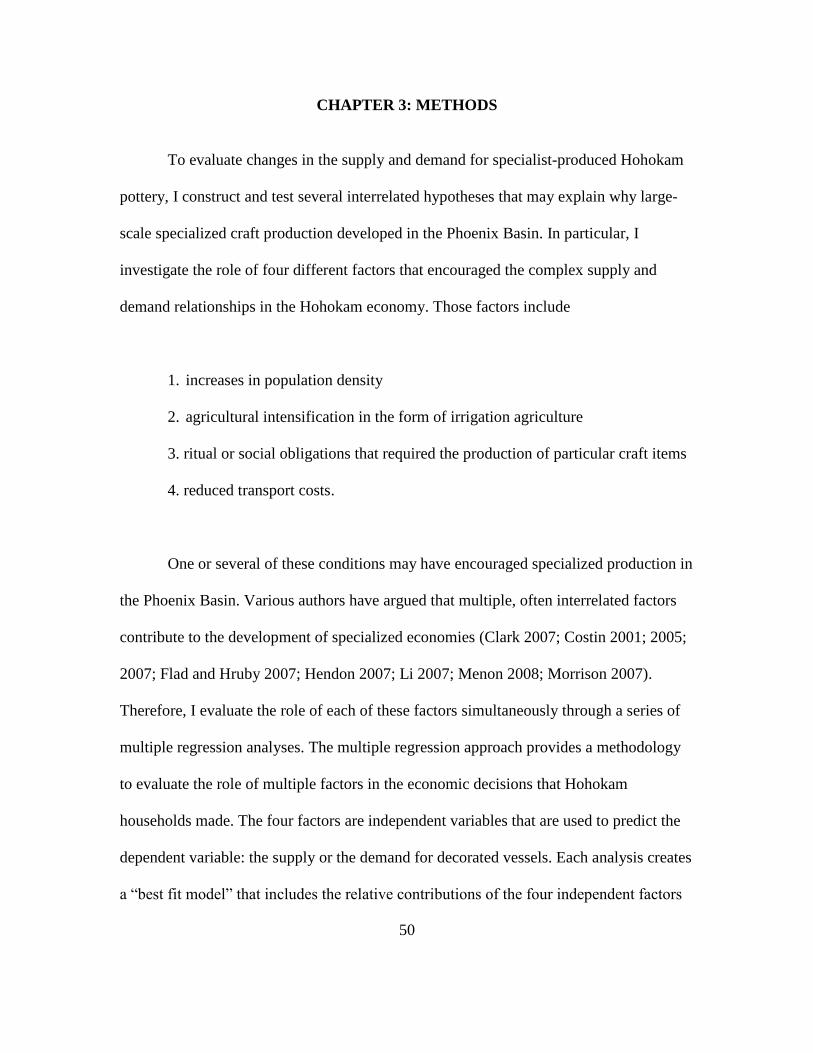
50
CHAPTER 3: METHODS
To evaluate changes in the supply and demand for specialist-produced Hohokam
pottery, I construct and test several interrelated hypotheses that may explain why large-
scale specialized craft production developed in the Phoenix Basin. In particular, I
investigate the role of four different factors that encouraged the complex supply and
demand relationships in the Hohokam economy. Those factors include
1. increases in population density
2. agricultural intensification in the form of irrigation agriculture
3. ritual or social obligations that required the production of particular craft items
4. reduced transport costs.
One or several of these conditions may have encouraged specialized production in
the Phoenix Basin. Various authors have argued that multiple, often interrelated factors
contribute to the development of specialized economies (Clark 2007; Costin 2001; 2005;
2007; Flad and Hruby 2007; Hendon 2007; Li 2007; Menon 2008; Morrison 2007).
Therefore, I evaluate the role of each of these factors simultaneously through a series of
multiple regression analyses. The multiple regression approach provides a methodology
to evaluate the role of multiple factors in the economic decisions that Hohokam
households made. The four factors are independent variables that are used to predict the
dependent variable: the supply or the demand for decorated vessels. Each analysis creates
a “best fit model” that includes the relative contributions of the four independent factors
51
on either producer supply or household demand for buffware vessels manufactured by
specialists (Pedhazur and Schmelkin 1991:417). Finally, the overall strength of each
regression model is measured by how well it explains the variance in the dependent
variable (R2) (Shennan 1997:186-192).
The supply, volume, and concentration of non-local decorated wares from
Phoenix Basin settlements are determined through a sourcing analysis that identifies the
production locale of red-on-buff vessels. The supply of specialist producers in different
areas is measured as the proportion of total exports that one production area
manufactures. Production area is identified on the basis of sand temper composition in
pottery sherds (discussed below).
Demand for specialist-produced Hohokam red-on-buff pottery is identified
through patterns in household ceramic assemblages across the Phoenix Basin. Because
demand is difficult to measure archaeologically, I assume that household demand is
equivalent to household consumption of red-on-buff pottery (Costin 2005:1047).
Therefore, I assess demand by measuring the volume and concentration of non-local red-
on-buff pottery consumed by Phoenix Basin households. The volume of non-local red-
on-buff pottery in an assemblage is measured by the proportion of pottery that is
produced outside of the sand composition zone for the sample site (discussed below). The
concentration of red-on-buff pottery from particular sources is measured by the richness
(number) of represented source areas for red-on-buff pottery in an assemblage as well as
the evenness (distribution) of those sources.
52
The analysis addresses temporal change in supply and demand for specialist-
produced red-on-buff pottery produced by creating a set of regression models for each of
three temporal intervals: the Snaketown to Gila Butte phases (AD 650-850), the Gila
Butte to Santa Cruz phases (AD 750-950), and Santa Cruz to early Sacaton phases (AD
850-1020). These regression models provide a diachronic perspective on the relative
influence of the four independent factors over time. For example, population densities
and irrigation infrastructure, both of which were low during the Snaketown and Gila
Butte phases, may have had a relatively insignificant influence on household demand for
red-on-buff pottery manufactured by specialists, but may have become much more
important later in the temporal sequence. The results of the analysis provide a refined
perspective on the changing conditions related to demand for decorated vessels produced
by specialists, and thus the growth of a Hohokam specialist-based economy. Most
importantly, a multi-factor model that tests several different, independent factors at the
same time may provide data that is broadly applicable to studies of economic
intensification in other middle range societies.
Sampling Regime
The sourcing analysis begins with systematic sampling of Hohokam decorated
pottery2 from 13 village sites (Table 3.1, Figure 3.1). These 13 settlements were occupied
over the Snaketown (AD 700-750), Gila Butte (AD 750-850/900), Santa Cruz (AD
850/900-950), or the early Sedentary (AD 950-1020) phases of the preClassic. Although
the study analyzes pottery from 13 sites, not all of these sites were occupied during all
2 Decorated pottery includes Hohokam red-on-gray, red-on-buff, and brown-paste variants.
53
temporal phases included in the study. Therefore, I sampled ceramic assemblages from a
minimum of six sites for each of the four temporal phases. These samples include an
average of approximately 150 sherds and at least 20 sherds per site per temporal phase.
Sites were selected for an even geographic distribution across the lower Salt and middle
Gila River valleys in the Phoenix Basin during each of the four major preClassic phases.
Settlement selection also maximized the number of canal systems associated with sites in
the analysis.
With the exception of the site of Snaketown, all ceramic collections used in the
study are derived from federally-mandated CRM excavations in compliance with Section
106 of the Historic Preservation Act. Snaketown was the subject of a series of academic
excavations in the early 1930s (Gladwin et al. 1937; Gladwin et al. 1938; Gladwin 1942;
Gladwin 1948) and the mid-1960s (Haury 1976). Collections for sites located along the
lower Salt River valley, Snaketown, and Grewe are housed in public collections
repositories at the Arizona State Museum (ASM), the Pueblo Grande Museum (PGM),
and at Arizona State University (ASU). Ceramic collections for the remaining settlements
located along the middle Gila River valley are housed in tribal collections facilities at the
Huhugam Heritage Center or the Cultural Resource Management Program for the Gila
River Indian Community (GRIC-CRMP).
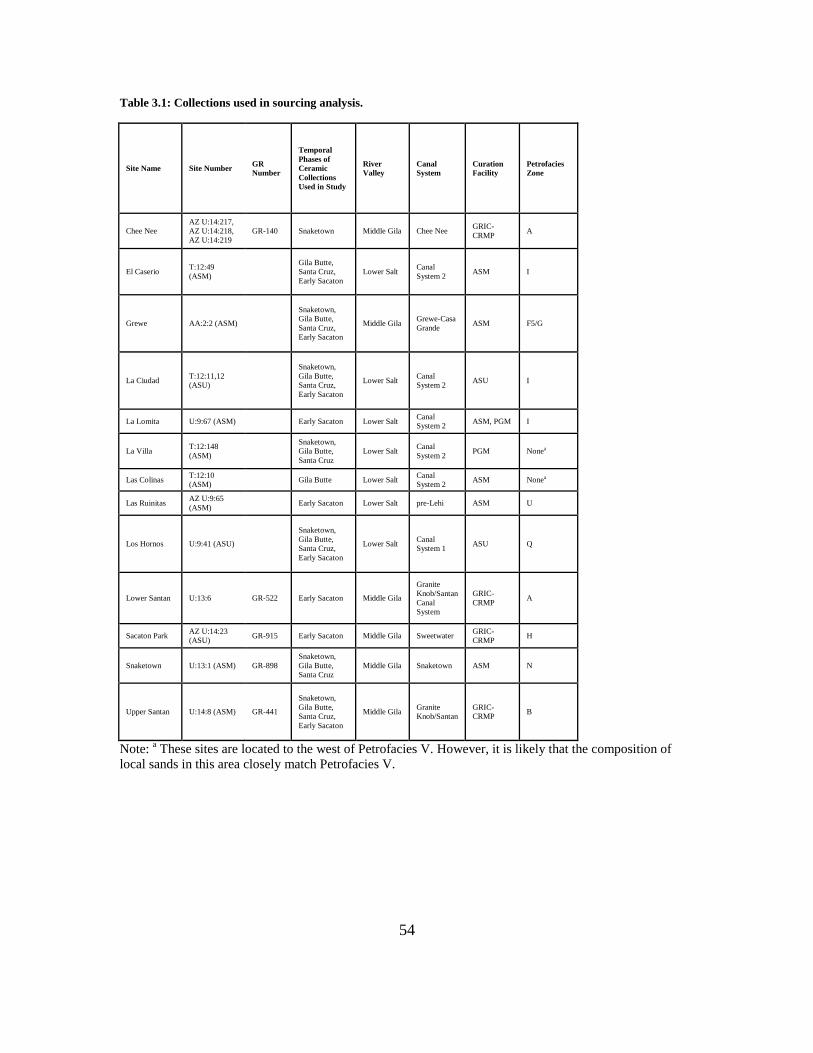
54
Table 3.1: Collections used in sourcing analysis.
Site Name Site Number GR
Number
Temporal
Phases of
Ceramic
Collections
Used in Study
River
Valley
Canal
System
Curation
Facility
Petrofacies
Zone
Chee Nee
AZ U:14:217,
AZ U:14:218,
AZ U:14:219
GR-140 Snaketown Middle Gila Chee Nee GRIC-
CRMP A
El Caserio T:12:49
(ASM)
Gila Butte,
Santa Cruz,
Early Sacaton
Lower Salt Canal
System 2 ASM I
Grewe AA:2:2 (ASM)
Snaketown,
Gila Butte,
Santa Cruz,
Early Sacaton
Middle Gila Grewe-Casa
Grande ASM F5/G
La Ciudad T:12:11,12
(ASU)
Snaketown,
Gila Butte,
Santa Cruz,
Early Sacaton
Lower Salt Canal
System 2 ASU I
La Lomita U:9:67 (ASM) Early Sacaton Lower Salt Canal
System 2 ASM, PGM I
La Villa T:12:148
(ASM)
Snaketown,
Gila Butte,
Santa Cruz
Lower Salt Canal
System 2 PGM Nonea
Las Colinas T:12:10
(ASM) Gila Butte Lower Salt
Canal
System 2 ASM Nonea
Las Ruinitas AZ U:9:65
(ASM) Early Sacaton Lower Salt pre-Lehi ASM U
Los Hornos U:9:41 (ASU)
Snaketown,
Gila Butte,
Santa Cruz,
Early Sacaton
Lower Salt Canal
System 1 ASU Q
Lower Santan U:13:6 GR-522 Early Sacaton Middle Gila
Granite
Knob/Santan
Canal
System
GRIC-
CRMP A
Sacaton Park AZ U:14:23
(ASU) GR-915 Early Sacaton Middle Gila Sweetwater
GRIC-
CRMP H
Snaketown U:13:1 (ASM) GR-898
Snaketown,
Gila Butte,
Santa Cruz
Middle Gila Snaketown ASM N
Upper Santan U:14:8 (ASM) GR-441
Snaketown,
Gila Butte,
Santa Cruz,
Early Sacaton
Middle Gila Granite
Knob/Santan
GRIC-
CRMP B
Note: a These sites are located to the west of Petrofacies V. However, it is likely that the composition of
local sands in this area closely match Petrofacies V.
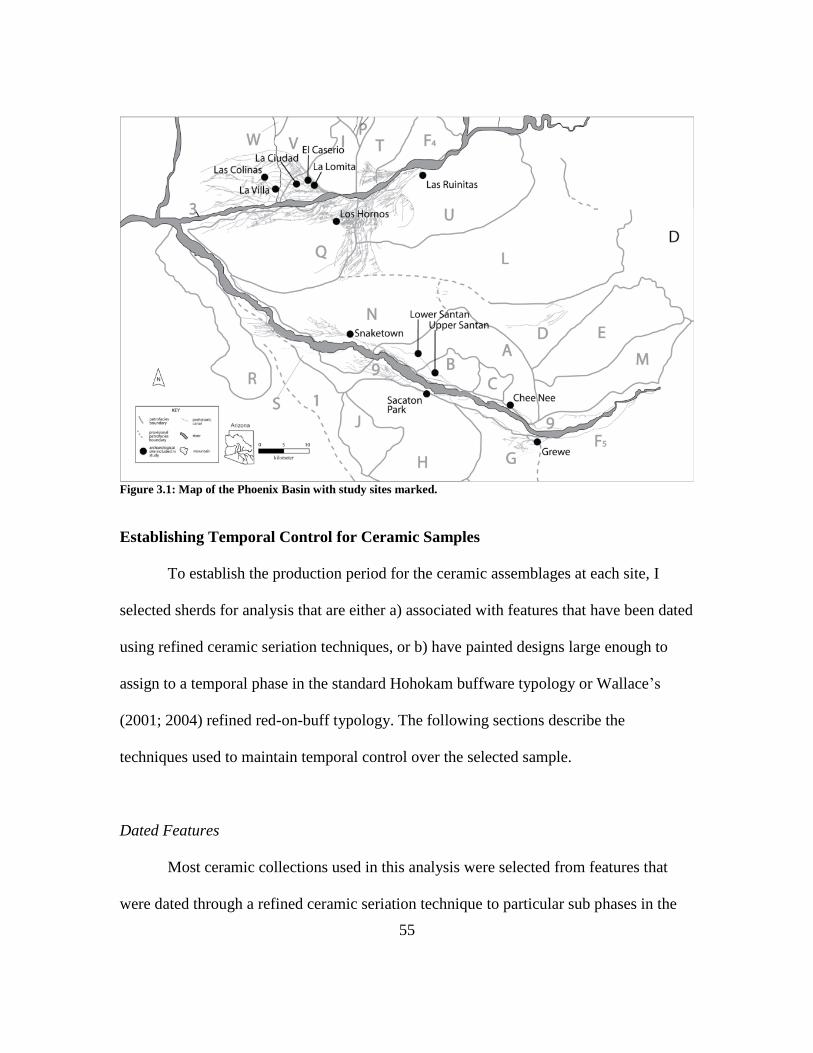
55
Figure 3.1: Map of the Phoenix Basin with study sites marked.
Establishing Temporal Control for Ceramic Samples
To establish the production period for the ceramic assemblages at each site, I
selected sherds for analysis that are either a) associated with features that have been dated
using refined ceramic seriation techniques, or b) have painted designs large enough to
assign to a temporal phase in the standard Hohokam buffware typology or Wallace’s
(2001; 2004) refined red-on-buff typology. The following sections describe the
techniques used to maintain temporal control over the selected sample.
Dated Features
Most ceramic collections used in this analysis were selected from features that
were dated through a refined ceramic seriation technique to particular sub phases in the
56
Hohokam temporal sequence. This novel methodology, which was developed by Henry
Wallace in the early 2000s, marks a considerable breakthrough in the resolution and
accuracy of dating techniques in the Hohokam culture region. Below, I briefly review
Hohokam chronology building and then discuss how Wallace’s stylistic seriation
addressed known issues in Hohokam ceramic dating and analysis.
Until relatively recently, the Hohokam chronological sequence was a matter of
continued debate (Bullard 1962; Cordell 1984; Dean 1991; Deaver and Ciolek-Torrello
1995; Deaver 1997; Di Peso 1956; Eighmy and McGuire 1988; Gladwin 1942; 1948;
Henderson 1987; Plog 1980a; Schiffer 1982; 1986; Wallace et al. 1995; Wilcox 1979). In
the 1920s and 1930s, Harold Gladwin and his colleagues established the first Hohokam
chronology using stratigraphic sequences from their excavations at Snaketown and the
vicinity of Casa Grande. Although subsequent analyses have confirmed the basic
accuracy of the original periods and phases (Haury 1976; Schiffer 1982), the calendric
dates linked to each temporal phase have been hotly disputed. Unlike other regions of the
Southwest, the Hohokam heartland lacked coniferous trees that could provide precise
absolute dates from dendrochronological samples.
The Hohokam chronology is largely based on Hohokam ceramic typologies that
were cross-dated with intrusive Puebloan sherds and matched to radiocarbon and
archaeomagnetic dates (Dean 1991). Despite the emphasis on ceramic typologies to
anchor the Hohokam chronological sequence, little attention was devoted to refining
Hohokam ceramic classification. Until just a few years ago, analysts relied on Emil
Haury’s original definitions for Hohokam ceramic types in his landmark studies at
57
Snaketown (Haury 1937b; 1976). Although the relative sequence of Hohokam red-on-
buff pottery has been refined and corroborated over time (Abbott 1988; Dean 1991;
Wallace and Craig 1988), analysts noted that lack of systematization in how these types
are defined led to ambiguities in how each type was identified (Dean 1991; Doyel and
Elson 1985; Henderson 1987; Marmaduke 1993; Neitzel 1984; Wallace 1992:33-35;
Wallace et al. 1995:58-59). In addition, the long time periods in the Hohokam chronology
made it difficult to address research questions that require greater temporal resolution.
Wallace’s Refined Seriation of Red-on-buff Pottery
In his ground-breaking studies of Hohokam decorated ceramics, Henry Wallace
(2001; 2004) created a refined seriation of red-on-buff pottery that addressed documented
problems in the Hohokam chronology—specifically the ambiguity of defining ceramic
types and the long time periods associated with each type. Wallace’s seriation has quickly
become a baseline for Hohokam ceramic research and the foundation on which detailed
studies on Hohokam pottery production and distribution rely (Table 3.2). To create his
seriation, Wallace carefully selected sherds from excavated features that represented
rapid and unmixed deposition. Wallace then recorded stylistic attributes for sherds in
these contexts. By recording shifts in the presence and proportions of design attributes
through time, Wallace identified specific stylistic characteristics that were linked with
pottery manufactured during each temporal phase. Most importantly, he identified
stylistic trends within phases; he then used those trends to define temporal sub-phases.
For instance, Wallace was able to divide the Gila Butte phase into Early Gila Butte and

58
Late Gila Butte sub-phases. He was also able to divide the Sacaton phase into four sub-
phases: the Early Sacaton, Middle Sacaton I, Middle Sacaton II, and Late Sacaton. These
sub-phases, some of which represent temporal spans as short as 50 years, mark a dramatic
increase in the resolution of the Hohokam chronology.
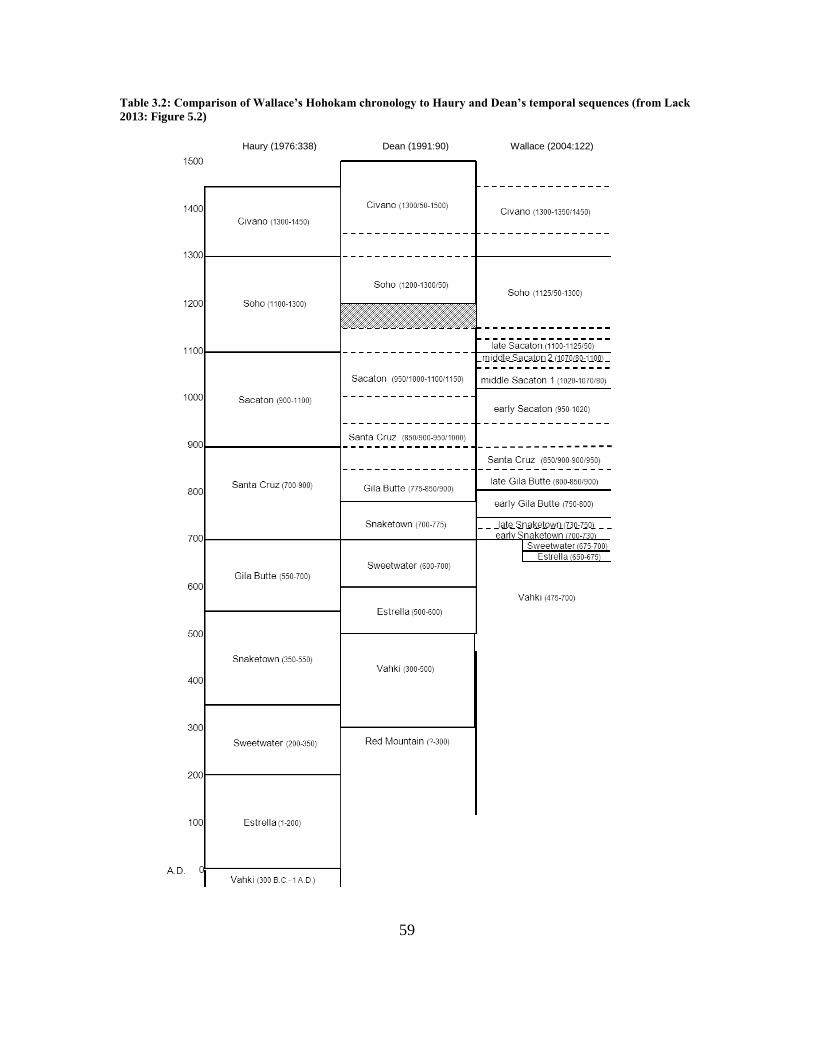
59
Table 3.2: Comparison of Wallace’s Hohokam chronology to Haury and Dean’s temporal sequences (from Lack
2013: Figure 5.2)
Haury (1976:338) Dean (1991:90) Wallace (2004:122)

60
Ensuring Temporal Sensitivity in the Artifact Collection
In this analysis, I use sherds collected from excavated features that either Wallace
(2001; 2004) or Abbott (2009) dated with Wallace’s refined red-on-buff typology (see
also Lack 2012). These features, listed in Table 3.3, were contexts such as pits that were
quickly filled by sherds dating to a single or adjacent temporal phases.
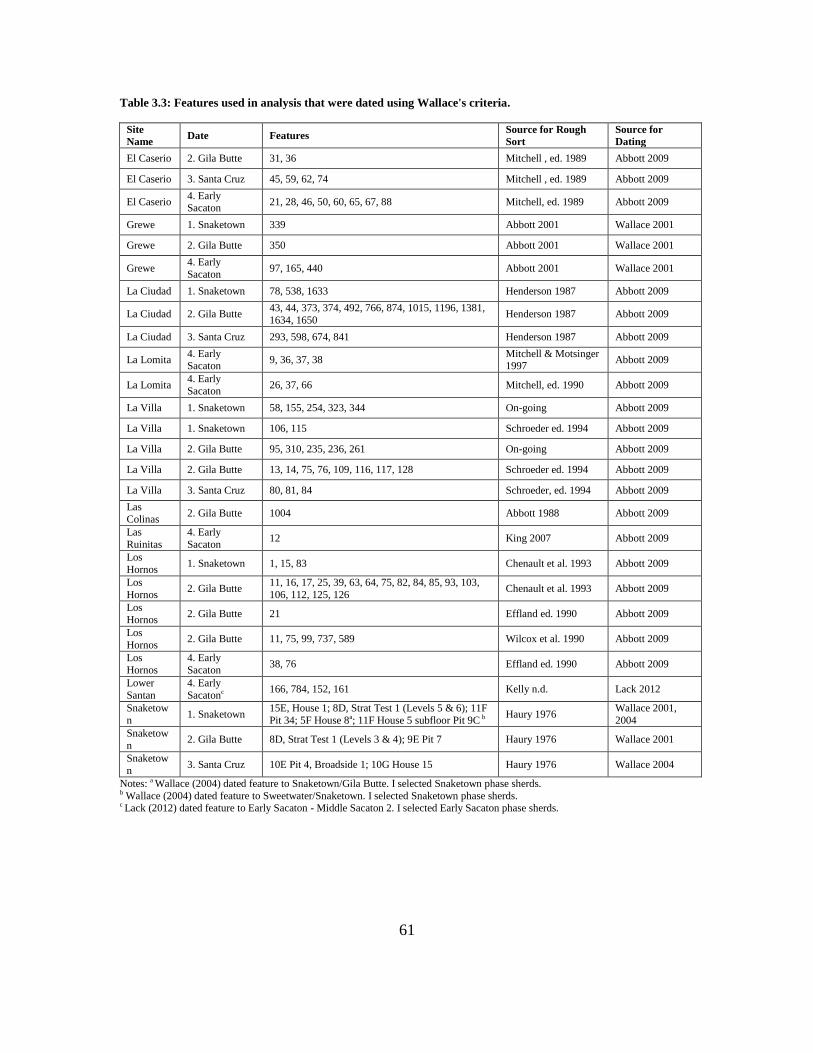
61
Table 3.3: Features used in analysis that were dated using Wallace's criteria.
Site
Name Date Features
Source for Rough
Sort
Source for
Dating
El Caserio 2. Gila Butte 31, 36 Mitchell , ed. 1989 Abbott 2009
El Caserio 3. Santa Cruz 45, 59, 62, 74 Mitchell , ed. 1989 Abbott 2009
El Caserio 4. Early Sacaton
21, 28, 46, 50, 60, 65, 67, 88 Mitchell, ed. 1989 Abbott 2009
Grewe 1. Snaketown 339 Abbott 2001 Wallace 2001
Grewe 2. Gila Butte 350 Abbott 2001 Wallace 2001
Grewe 4. Early
Sacaton 97, 165, 440 Abbott 2001 Wallace 2001
La Ciudad 1. Snaketown 78, 538, 1633 Henderson 1987 Abbott 2009
La Ciudad 2. Gila Butte 43, 44, 373, 374, 492, 766, 874, 1015, 1196, 1381,
1634, 1650 Henderson 1987 Abbott 2009
La Ciudad 3. Santa Cruz 293, 598, 674, 841 Henderson 1987 Abbott 2009
La Lomita 4. Early Sacaton
9, 36, 37, 38 Mitchell & Motsinger 1997
Abbott 2009
La Lomita 4. Early
Sacaton 26, 37, 66 Mitchell, ed. 1990 Abbott 2009
La Villa 1. Snaketown 58, 155, 254, 323, 344 On-going Abbott 2009
La Villa 1. Snaketown 106, 115 Schroeder ed. 1994 Abbott 2009
La Villa 2. Gila Butte 95, 310, 235, 236, 261 On-going Abbott 2009
La Villa 2. Gila Butte 13, 14, 75, 76, 109, 116, 117, 128 Schroeder ed. 1994 Abbott 2009
La Villa 3. Santa Cruz 80, 81, 84 Schroeder, ed. 1994 Abbott 2009
Las
Colinas 2. Gila Butte 1004 Abbott 1988 Abbott 2009
Las
Ruinitas
4. Early
Sacaton 12 King 2007 Abbott 2009
Los
Hornos 1. Snaketown 1, 15, 83 Chenault et al. 1993 Abbott 2009
Los
Hornos 2. Gila Butte 11, 16, 17, 25, 39, 63, 64, 75, 82, 84, 85, 93, 103,
106, 112, 125, 126 Chenault et al. 1993 Abbott 2009
Los
Hornos 2. Gila Butte 21 Effland ed. 1990 Abbott 2009
Los
Hornos 2. Gila Butte 11, 75, 99, 737, 589 Wilcox et al. 1990 Abbott 2009
Los
Hornos
4. Early
Sacaton 38, 76 Effland ed. 1990 Abbott 2009
Lower
Santan
4. Early
Sacatonc 166, 784, 152, 161 Kelly n.d. Lack 2012
Snaketow
n 1. Snaketown
15E, House 1; 8D, Strat Test 1 (Levels 5 & 6); 11F
Pit 34; 5F House 8a; 11F House 5 subfloor Pit 9C b Haury 1976
Wallace 2001,
2004
Snaketow
n 2. Gila Butte 8D, Strat Test 1 (Levels 3 & 4); 9E Pit 7 Haury 1976 Wallace 2001
Snaketow
n 3. Santa Cruz 10E Pit 4, Broadside 1; 10G House 15 Haury 1976 Wallace 2004
Notes: a Wallace (2004) dated feature to Snaketown/Gila Butte. I selected Snaketown phase sherds. b Wallace (2004) dated feature to Sweetwater/Snaketown. I selected Snaketown phase sherds. c Lack (2012) dated feature to Early Sacaton - Middle Sacaton 2. I selected Early Sacaton phase sherds.
62
To increase sample size for the analysis, I also included some sherds that were not
associated with dated features, but that had temporally diagnostic designs. I used
Wallace’s stylistic criteria to date the designs on the surface of these sherds. Table 3.4
lists the contexts from which sherds were individually selected. Some features furnished
sherds that dated to several different temporal phases, while other features furnished
sherds that dated to only one of the four preClassic temporal phases addressed in this
study. The phases of dated sherds from each set of features are noted in Table 3.4.
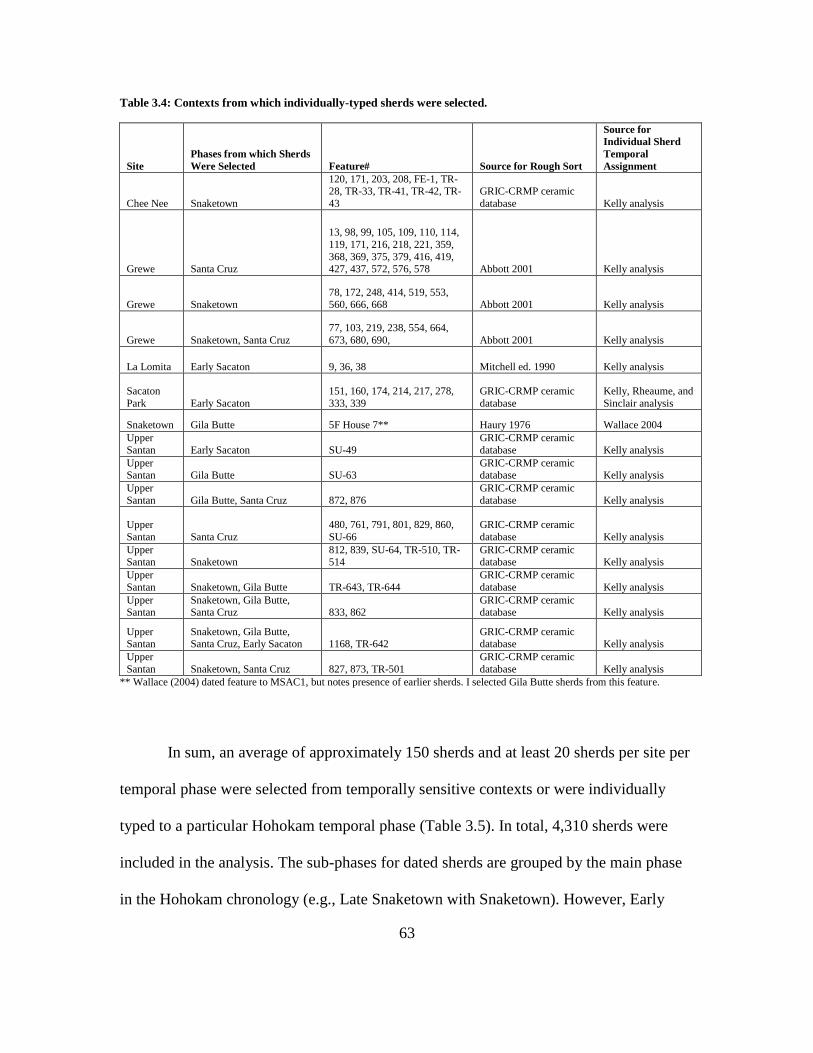
63
Table 3.4: Contexts from which individually-typed sherds were selected.
Site
Phases from which Sherds
Were Selected Feature# Source for Rough Sort
Source for
Individual Sherd
Temporal
Assignment
Chee Nee Snaketown
120, 171, 203, 208, FE-1, TR-28, TR-33, TR-41, TR-42, TR-
43
GRIC-CRMP ceramic
database Kelly analysis
Grewe Santa Cruz
13, 98, 99, 105, 109, 110, 114,
119, 171, 216, 218, 221, 359,
368, 369, 375, 379, 416, 419, 427, 437, 572, 576, 578 Abbott 2001 Kelly analysis
Grewe Snaketown 78, 172, 248, 414, 519, 553, 560, 666, 668 Abbott 2001 Kelly analysis
Grewe Snaketown, Santa Cruz
77, 103, 219, 238, 554, 664,
673, 680, 690, Abbott 2001 Kelly analysis
La Lomita Early Sacaton 9, 36, 38 Mitchell ed. 1990 Kelly analysis
Sacaton
Park Early Sacaton
151, 160, 174, 214, 217, 278,
333, 339
GRIC-CRMP ceramic
database
Kelly, Rheaume, and
Sinclair analysis
Snaketown Gila Butte 5F House 7** Haury 1976 Wallace 2004
Upper
Santan Early Sacaton SU-49
GRIC-CRMP ceramic
database Kelly analysis
Upper Santan Gila Butte SU-63
GRIC-CRMP ceramic database Kelly analysis
Upper
Santan Gila Butte, Santa Cruz 872, 876
GRIC-CRMP ceramic
database Kelly analysis
Upper
Santan Santa Cruz
480, 761, 791, 801, 829, 860,
SU-66
GRIC-CRMP ceramic
database Kelly analysis
Upper
Santan Snaketown
812, 839, SU-64, TR-510, TR-
514
GRIC-CRMP ceramic
database Kelly analysis
Upper
Santan Snaketown, Gila Butte TR-643, TR-644
GRIC-CRMP ceramic
database Kelly analysis
Upper Santan
Snaketown, Gila Butte, Santa Cruz 833, 862
GRIC-CRMP ceramic database Kelly analysis
Upper Santan
Snaketown, Gila Butte, Santa Cruz, Early Sacaton 1168, TR-642
GRIC-CRMP ceramic database Kelly analysis
Upper
Santan Snaketown, Santa Cruz 827, 873, TR-501
GRIC-CRMP ceramic
database Kelly analysis
** Wallace (2004) dated feature to MSAC1, but notes presence of earlier sherds. I selected Gila Butte sherds from this feature.
In sum, an average of approximately 150 sherds and at least 20 sherds per site per
temporal phase were selected from temporally sensitive contexts or were individually
typed to a particular Hohokam temporal phase (Table 3.5). In total, 4,310 sherds were
included in the analysis. The sub-phases for dated sherds are grouped by the main phase
in the Hohokam chronology (e.g., Late Snaketown with Snaketown). However, Early
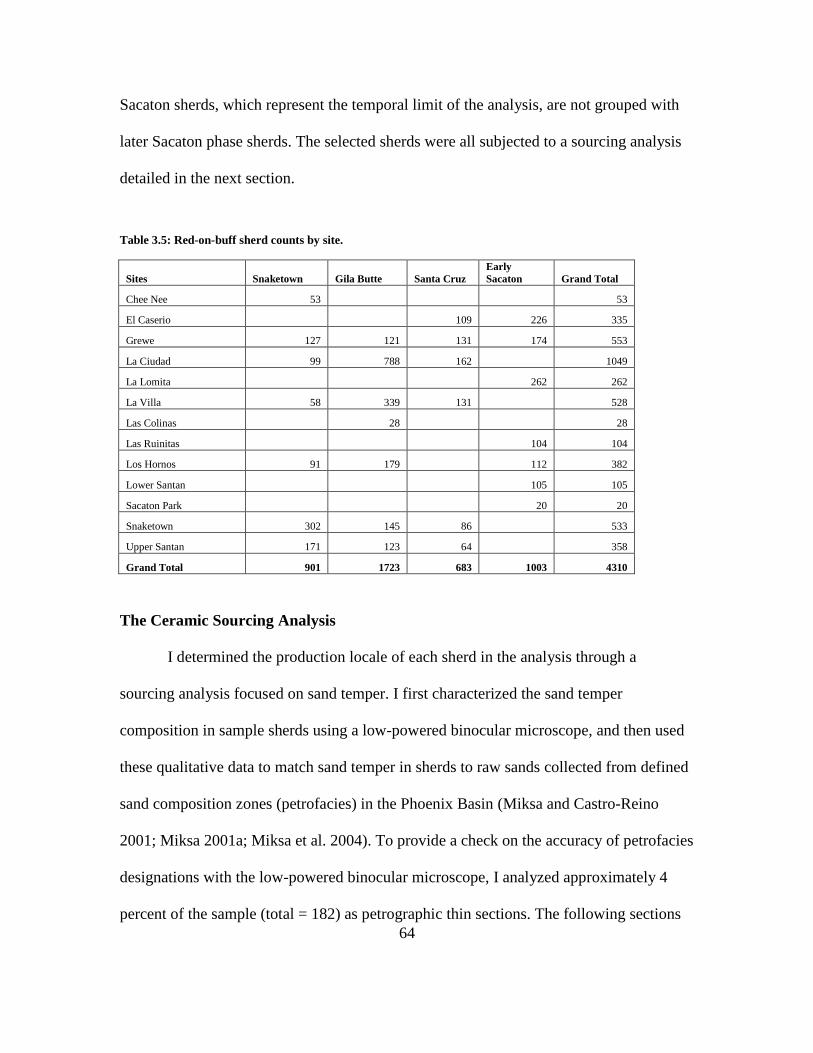
64
Sacaton sherds, which represent the temporal limit of the analysis, are not grouped with
later Sacaton phase sherds. The selected sherds were all subjected to a sourcing analysis
detailed in the next section.
Table 3.5: Red-on-buff sherd counts by site.
Sites Snaketown Gila Butte Santa Cruz
Early
Sacaton Grand Total
Chee Nee 53
53
El Caserio
109 226 335
Grewe 127 121 131 174 553
La Ciudad 99 788 162
1049
La Lomita
262 262
La Villa 58 339 131
528
Las Colinas
28
28
Las Ruinitas
104 104
Los Hornos 91 179
112 382
Lower Santan
105 105
Sacaton Park
20 20
Snaketown 302 145 86
533
Upper Santan 171 123 64
358
Grand Total 901 1723 683 1003 4310
The Ceramic Sourcing Analysis
I determined the production locale of each sherd in the analysis through a
sourcing analysis focused on sand temper. I first characterized the sand temper
composition in sample sherds using a low-powered binocular microscope, and then used
these qualitative data to match sand temper in sherds to raw sands collected from defined
sand composition zones (petrofacies) in the Phoenix Basin (Miksa and Castro-Reino
2001; Miksa 2001a; Miksa et al. 2004). To provide a check on the accuracy of petrofacies
designations with the low-powered binocular microscope, I analyzed approximately 4
percent of the sample (total = 182) as petrographic thin sections. The following sections
65
detail the petrographic and binocular microscope analyses that I use to source pottery to
specific production areas.
Sand Petrofacies Model
Researchers have long recognized that the geological diversity of the Phoenix
Basin offers the potential for comprehensive ceramic sourcing analyses (e.g., Abbott
1994b; Fournier 1989; Gladwin 1937; Hepburn 1984; Lombard 1987; Miksa 1995;
Schaller 1994; Walsh-Anduze and Abbott 1994). In the early 2000s, Elizabeth Miksa and
her colleagues developed a technique for sourcing sand temper in central Arizona that has
among the highest resolution and accuracy in the world. Through the characterization of
unique and geographically isolated sand composition zones called petrofacies, Miksa’s
methodology enables archaeologists to identify the movement of pottery over distances
as little as 5 km (see petrofacies marked on Figure 1).
Miksa’s sand temper sourcing techniques in the Phoenix Basin are based on a
similar methodology that she developed and tested in the Tonto Basin (Heidke and Miksa
2000; Miksa and Heidke 1995; Miksa and Heidke 2001). She began to define sand
petrofacies boundaries in the Phoenix Basin by collecting and point-counting 80 sand
samples from the Salt River valley and 180 sand samples from the Gila River valley
(Miksa and Castro-Reino 2001; Miksa 2001a; Miksa 2001b; Miksa et al. 2004).3 The
point count data from the raw sand samples were then examined using a series of
correspondence analyses. These exploratory analyses demonstrated that distinct sand
3 Miksa collected 87 samples from the Salt River valley and 236 sand samples from the Gila River valley
for a total of 323 samples from the Phoenix Basin. However, she only point counted 260 of these sand
samples (Miksa et al. 2004: Table 2.2).
66
composition groups could be identified on the basis of lithic and mineral content of the
sands. Most importantly, these sand composition groups were geographically discrete,
which indicates that sand composition can be used for provenance identification.
The correspondence analyses on Phoenix Basin sands delineated three major
groups in the sand data-- mineral-rich, lithic-volcanic, and lithic-metamorphic sands.
Miksa plotted where these sands appeared on a map of the Phoenix Basin, and, based on
geologic maps of the region, proposed boundaries for different sand composition zones
(petrofacies). Then, she used a series of nested discriminant models to determine if these
sand petrofacies were statistically distinguishable from one another and to define the
precise criteria by which the groups were separated. The first discriminant model that
used all of the sand samples divided the sand composition zones into two categories:
petrofacies that are primarily mineralic and petrofacies that are primarily lithic. A second
discriminant analysis of the lithic samples then divided the petrofacies into two additional
groups: those that have high proportions of volcanic grains and those that are rich in
metamorphic lithic grains. Finally, separate discriminant models evaluated membership
in the mineralic, volcanic, and metamorphic-rich sand petrofacies. Using the discriminant
analysis parameters, Miksa defined the mineralic and lithic composition of each sand
composition zone. Finally, she developed detailed descriptions for each of the sand
petrofacies that she identified. Using these descriptions and a detailed flowchart, analysts
can now use a low-powered binocular microscope to identify sands from different areas.
67
Binocular Microscope Examination
I examined the temper in each of the 4,310 red-on-buff sherds to determine if
there were sufficient sand inclusions to match the temper to a specific sand petrofacies in
Miksa’s classification scheme. To observe the temper with a binocular microscope, I
inspected a fresh cross-section of each sherd with a magnification of 30x or less.
Approximately 82 percent of the sample was tempered with enough sand to source to
specific petrofacies. The remaining 18 percent of the sample was predominantly
tempered with coarse-grained mica schist that cannot be sourced to a specific production
locale. Although on-going research has identified techniques that may allow schist
deposits to be sourced, these techniques have not yet identified consistent chemical
differences among many of the schist outcrops in the Phoenix Basin (Kelly 2012; Neff
and Dudgeon 2006; Walsh-Anduze 1993).4 Therefore, the “schist-only” samples were not
included in the main statistical analyses presented in Chapters 4 and 5. I explore the
possible origin of schist-tempered red-on-buff and plainware pottery in Chapter 6.
For sand-tempered sherds, raw sand samples collected from wash beds in each
petrofacies were repeatedly studied and referenced during the analysis to maintain
consistency and accuracy. In addition, I consulted reference "grain boxes" that contained
individually identified particles of rock and mineral types along with other comparative
samples for each petrofacies.5 I then used the estimated proportions of each rock and
4 It is likely that most schist-only samples were manufactured in the vicinity of extensive schist deposits at
Gila Butte or Pima Butte in Petrofacies A, H, and N. An LA-ICP-MS analysis of schist temper in
preClassic red-on-buff wares linked the chemical signatures of the temper grains to schist outcrops at Gila
Butte, Pima Butte and other schist outcrops in the middle Gila River valley (Kelly 2012). 5 All sands, grain boxes, and initial training were generously provided by Elizabeth Miksa. The sand
samples and grain boxes are housed in the research collections for the Laboratory for Sonoran Ceramic
Research at ASU.
68
mineral type in the sand temper as a guide to navigate through a detailed and
comprehensive flow chart for the sand petrofacies (Miksa et al. 2004:Figure 2.12). My
petrofacies determinations are based on a process of elimination that relied on
proportions of mineral and lithic sand grains in the samples. I also used qualitative
descriptions of the petrofacies to make petrofacies determinations.
Petrographic Analysis
I analyzed 182 thin sections of red-on-buff pottery in order to provide a check on
petrofacies assignments made through the binocular microscope. Similar to the low-
powered binocular microscope analysis, the petrographic analysis relies on methods
developed by Miksa and her colleagues for the identification of sand temper in Hohokam
sherds (Miksa and Castro-Reino 2001; Miksa et al. 2004).
Thin-section Selection and Preparation
The 182 sherds selected for thin sectioning in this analysis were pulled from
collections from various sites and temporal phases. Selected sherds were at least 9 cm2
and contained enough sand temper to match to a specific petrofacies on a petrographic
slide.6 Sherds were thin-sectioned perpendicular to the vessel wall. Thin sections of
several different areas of a sherd were then mounted on a single slide to increase the
surface area available for identification. The sections were cut to a standard 30 microns
6 Due to internal variability in sherds, 15 samples that were deemed to have enough sand temper to identify
petrographically did not produce thin sections with enough sand temper for analysis.
69
thick and were partially stained with potassium cobaltinitrite and potassium rhodizonate
to aid in the identification of feldspars.7
Modification of Petrofacies Discriminant Model Technique
In this analysis, I use a qualitative assessment of the sand temper in the red-on-
buff sherds to match them to a specific sand petrofacies. This technique departs from
Miksa’s method for determining petrofacies assignments. In particular, Miksa used point
count data on pottery thin sections from the Phoenix Basin in a discriminant model to
predict petrofacies assignments. The merit of this approach is that it is strictly
quantitative and avoids biases associated with qualitative assessments. However, the
technique does not always capture the visible variation among the sand petrofacies. The
inability to capture these variations makes the technique inaccurate in some cases. For
instance, in Miksa’s (Miksa et al. 2004: Table 2.9) analysis of 23 thin sections, only 13 of
the samples were given a final petrofacies assignment that corresponded to the
petrofacies predicted by the discriminant model. Similarly, in Miksa’s (Miksa
2001b:Table 7) analysis of 11 buffware sherds from Palo Verde ruin, one was placed in
another petrofacies category and two were indicated as “possibly” from the discriminant
category. In practice, therefore, the discriminant model was 63% accurate at predicting
the final petrofacies assignment. However, when a conflict between the petrographer’s
7 The ceramic thin sections used by Miksa in her petrographic analyses were cut horizontally to the vessel
wall. The orientation of platy minerals and rock fragments such as mica and schist may differ in
comparison between the thin sections used in this analysis and Miksa’s thin sections.
70
petrofacies assessment and the discriminant model arose, the analysts always decided in
favor of the petrographer’s assessment in the final petrofacies assignment.
Due to the large sample size included in the present analysis (n = 182) and the
variable effectiveness of the quantitative discriminant technique, I rely on a qualitative
assessment of sand composition to determine petrofacies assignments. I developed this
technique in a previous analysis and have refined the approach here (Kelly 2010b).
Petrofacies determinations were made using a series of nested elimination
procedures. These elimination steps focus on the most diagnostic and easily recognizable
differences among the different sand petrofacies. In particular, the presence of volcanic
grains, which are easily recognizable both in thin section and under the binocular
microscope, were used as defining criteria for separating several of the petrofacies.
In general, the revised flowchart (Figure 3.2) avoided using naturally occurring
schist in the sands as a criterion for identifying sand petrofacies. Hohokam potters often
added coarse-grained mica schist to the sand temper in red-on-buff pottery. Although
natural and added schist can be distinguished in thin section, separating natural from
added schist in thin section is less reliable than focusing on other distinctive mineralic
and lithic grains. The exception to this rule is the identification of Petrofacies E, which
could not be distinguished from Petrofacies F4 without accounting for natural schist in
the sand. In this case, I used schist mineral composition, texture, weathering, and size to
distinguish between crushed mica schist and schist present within the sand temper.
The flowchart was also simplified by eliminating petrofacies that are not likely to
appear as temper in Hohokam red-on-buff sherds (Figure 3.2). All petrofacies comprised
of river sands were eliminated (1, 3, 5 and 9) because these small, rounded sands were
71
not preferred as temper by prehistoric potters (Beth Miksa personal communication,
2009). In addition, petrofacies J, K, P, R, S, W and Y were eliminated from consideration
because no permanent preClassic Hohokam sites were occupied in or near these regions.8
Therefore, use of sand for pottery production in these areas is extremely unlikely.
8 One sherd selected for thin sectioning was tentatively assigned to Petrofacies J. The sherd was thin
sectioned specifically to determine if the sand matched this petrofacies. However, the sand matched that of
Petrofacies V instead.
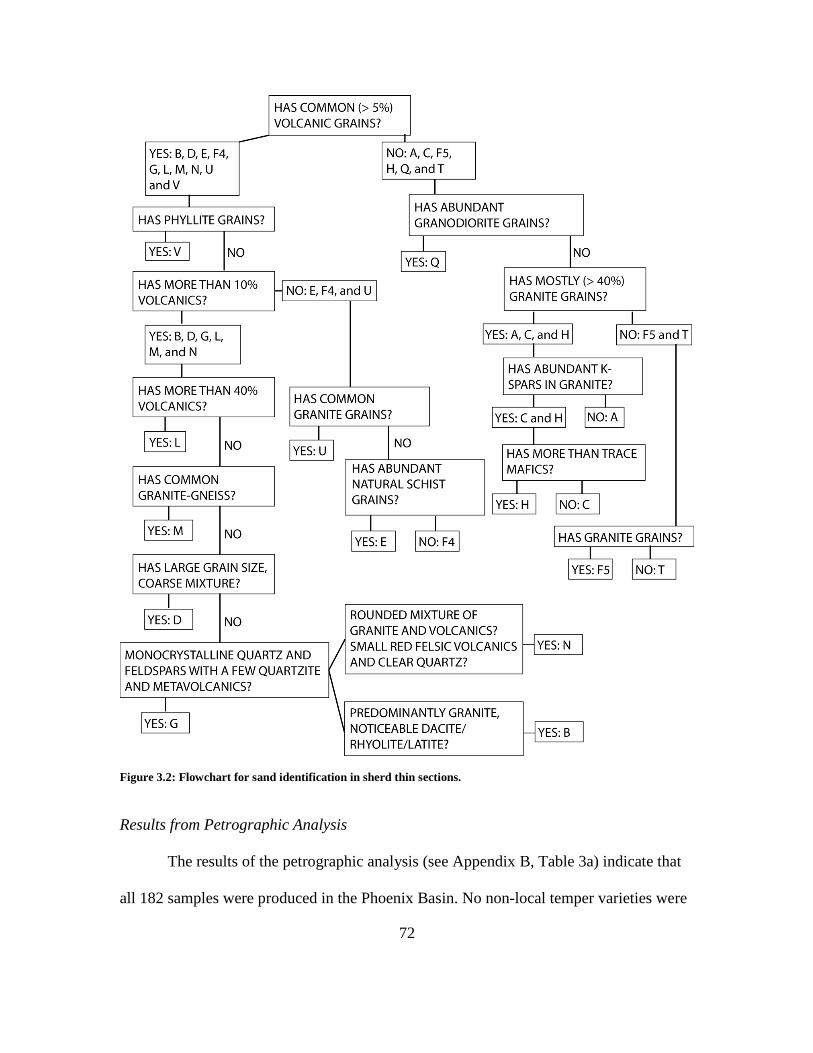
72
Figure 3.2: Flowchart for sand identification in sherd thin sections.
Results from Petrographic Analysis
The results of the petrographic analysis (see Appendix B, Table 3a) indicate that
all 182 samples were produced in the Phoenix Basin. No non-local temper varieties were
73
detected. Fifteen of the samples were tempered with abundant coarse-grained mica schist
and too little sand temper to match to a specific petrofacies. These were labeled as
“schist-only.” Fifty-three samples were matched to the Snaketown Petrofacies (N). Other
common petrofacies in the analysis were Santan (A) with 39 samples, Sacaton (H) with
31, and Queen Creek (D) with 18 sherds.
No sherds were assigned to Petrofacies E, F4, L, M, or T in the thin section or
binocular microscope stages of this analysis. The sites analyzed in this study are not
located near these sand composition zones. Therefore, it is not likely that pottery
produced in these regions would appear in the assemblages. In addition, there is little
evidence to suggest that red-on-buff pottery production occurred in these areas during the
preClassic period. If potters produced ceramics in Petrofacies E, F4, L, M, or T, then
sourcing data should indicate that large numbers of sherds were manufactured with sand
from these composition zones. In addition, archaeological excavation should encounter
direct evidence for ceramic manufacture. Available data on ceramic production in these
petrofacies do not meet either of these conditions.
Accuracy of Low-Powered Microscope Analysis
Petrofacies assignments using the low-powered microscope were predominantly
accurate when compared to petrofacies assignments based on the thin section analysis.
Overall, 71% of sherds that were matched with a specific petrofacies in the binocular
microscope analysis (n = 166) were confirmed in the petrographic analysis. Accuracy,
however, varied among the different sand composition groups. The most accurately
identified sands were Petrofacies, A, D, H, I, N, and sherds manufactured using Squaw
74
Peak Schist (Table 3.6). Squaw Peak Schist appears in the center of the Phoenix
Mountains and has been associated with ceramic manufacture on the western side of
Canal System 2, which lies on the north side of the Salt River (Crown 1981; Schaller
1994). The sands eroding from Squaw Peak Schist and other deposits from the Phoenix
Mountains constitute Petrofacies V sands (Miksa and Castro-Reino 2001; Miksa et al.
2004).
In the few instances when sherds manufactured with sand from Petrofacies, A, D,
H, I, N, and Squaw Peak Schist were misclassified, they were confused with nearby sand
composition zones. For instance, when sherds manufactured with Santan Mountain sand
(A) were misclassified, they were most often confused with those manufactured using
Sacaton Mountain sand (H). Similarly, when Queen Creek (D) sand was misclassified, it
was most often confused with Snaketown sand (N). Lower Salt River petrofacies were
only confused with each other with the exception of one sherd that was classified as
Petrofacies C but that was produced in Petrofacies Q. Limited misclassification among
adjacent sand composition units is heartening because it indicates that those sherds that
are mislabeled are likely misclassified to a nearby locale.
Petrofacies that were not accurately identified were B, C, F4, G, and U. With the
exception of B and C, most of these petrofacies were not frequently assigned to samples
in the binocular microscope analysis. Therefore, even though these petrofacies were not
accurately identified, their misclassification does not significantly alter the analysis. It is
likely that pottery production did not occur in these regions regularly during prehistory.
No large prehistoric sites are located in this area. The site of Granite Knob is located on
the middle Gila River floodplain just over the boundary of Petrofacies C. Although
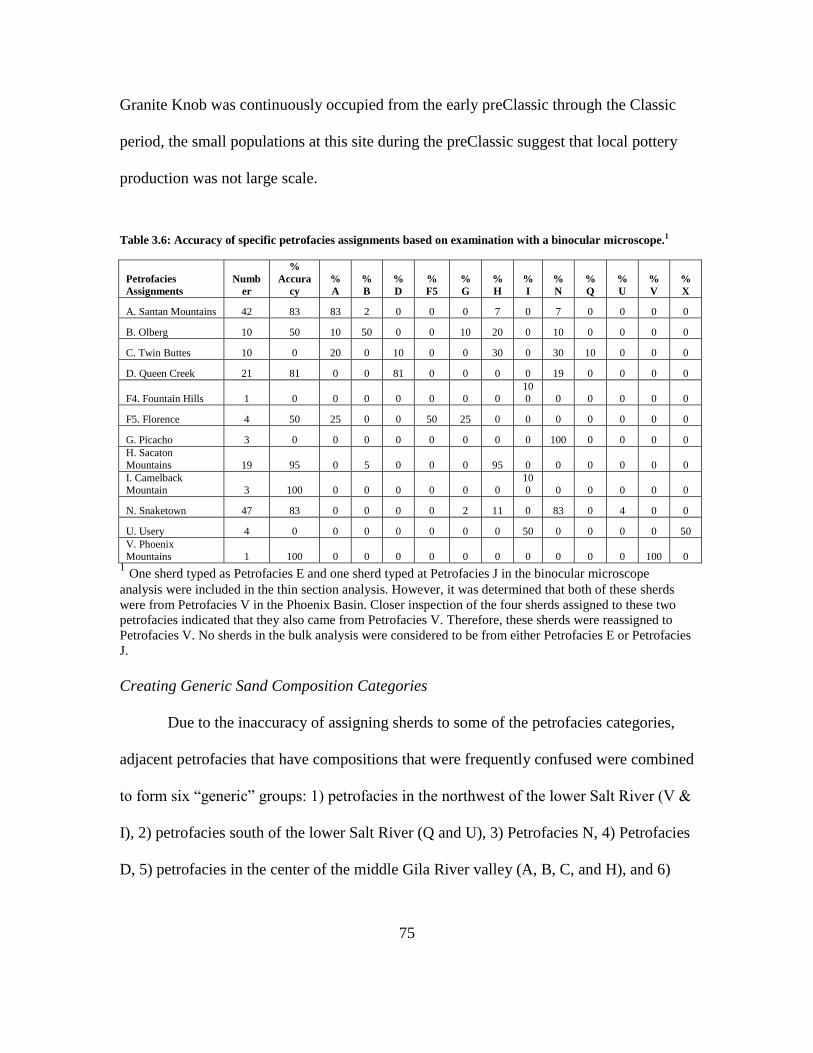
75
Granite Knob was continuously occupied from the early preClassic through the Classic
period, the small populations at this site during the preClassic suggest that local pottery
production was not large scale.
Table 3.6: Accuracy of specific petrofacies assignments based on examination with a binocular microscope.1
Petrofacies
Assignments
Numb
er
%
Accura
cy
%
A
%
B
%
D
%
F5
%
G
%
H
%
I
%
N
%
Q
%
U
%
V
%
X
A. Santan Mountains 42 83 83 2 0 0 0 7 0 7 0 0 0 0
B. Olberg 10 50 10 50 0 0 10 20 0 10 0 0 0 0
C. Twin Buttes 10 0 20 0 10 0 0 30 0 30 10 0 0 0
D. Queen Creek 21 81 0 0 81 0 0 0 0 19 0 0 0 0
F4. Fountain Hills 1 0 0 0 0 0 0 0
10
0 0 0 0 0 0
F5. Florence 4 50 25 0 0 50 25 0 0 0 0 0 0 0
G. Picacho 3 0 0 0 0 0 0 0 0 100 0 0 0 0
H. Sacaton
Mountains 19 95 0 5 0 0 0 95 0 0 0 0 0 0
I. Camelback
Mountain 3 100 0 0 0 0 0 0
10
0 0 0 0 0 0
N. Snaketown 47 83 0 0 0 0 2 11 0 83 0 4 0 0
U. Usery 4 0 0 0 0 0 0 0 50 0 0 0 0 50
V. Phoenix
Mountains 1 100 0 0 0 0 0 0 0 0 0 0 100 0 1 One sherd typed as Petrofacies E and one sherd typed at Petrofacies J in the binocular microscope
analysis were included in the thin section analysis. However, it was determined that both of these sherds
were from Petrofacies V in the Phoenix Basin. Closer inspection of the four sherds assigned to these two
petrofacies indicated that they also came from Petrofacies V. Therefore, these sherds were reassigned to
Petrofacies V. No sherds in the bulk analysis were considered to be from either Petrofacies E or Petrofacies
J.
Creating Generic Sand Composition Categories
Due to the inaccuracy of assigning sherds to some of the petrofacies categories,
adjacent petrofacies that have compositions that were frequently confused were combined
to form six “generic” groups: 1) petrofacies in the northwest of the lower Salt River (V &
I), 2) petrofacies south of the lower Salt River (Q and U), 3) Petrofacies N, 4) Petrofacies
D, 5) petrofacies in the center of the middle Gila River valley (A, B, C, and H), and 6)
76
petrofacies in the southeastern portion of the middle Gila River valley (G & F5) (Figure
3.3).
In general, the accuracy of these generic groups is improved over the accuracy of
assigning sherds to one, specific petrofacies. Eighty-two percent of samples were
assigned to the correct generic petrofacies group. Table 3.7 presents the percent of sherds
in each generic group (based on binocular microscope identification) that were correctly
classified to a petrofacies that was part of this generic group. While sand varieties on the
lower Salt River can be accurately distinguished based on a series of obvious qualitative
differences, middle Gila River valley sand composition groups are defined by more
subtle distinctions. Therefore, the high accuracy of middle Gila River valley petrofacies
in these generic categories suggests that combining different sand composition groups
may provide a more reasonable measure of where pots were produced.
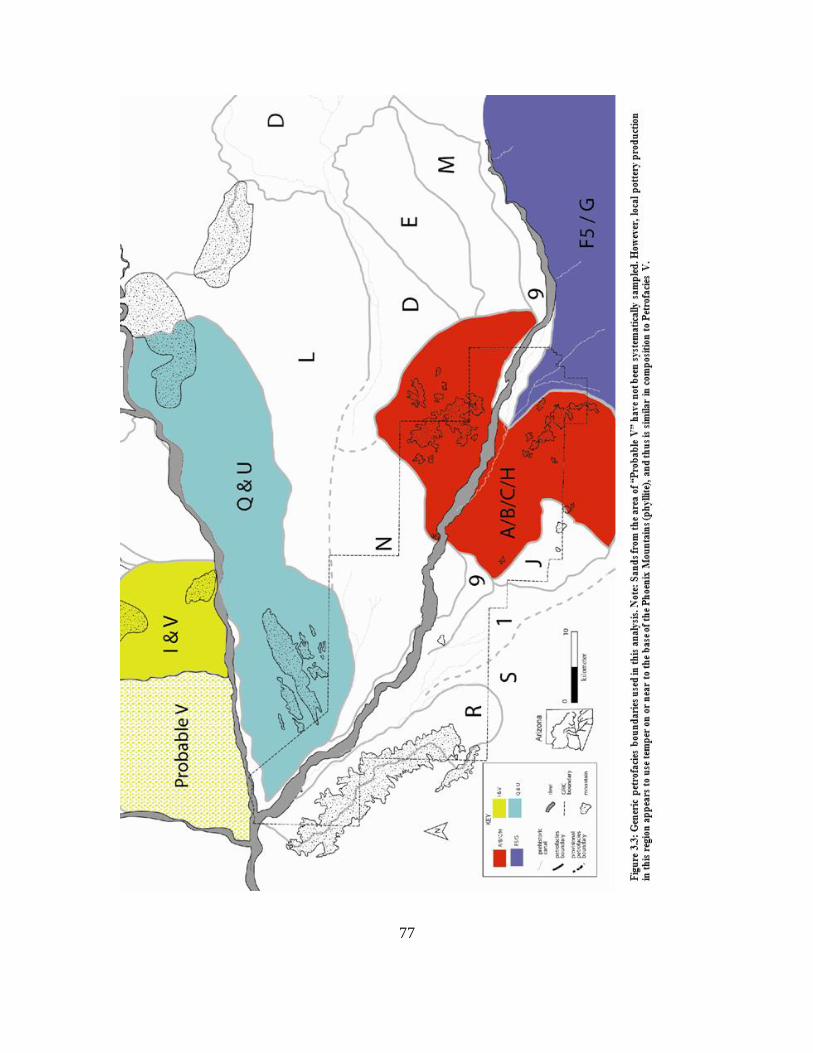
77
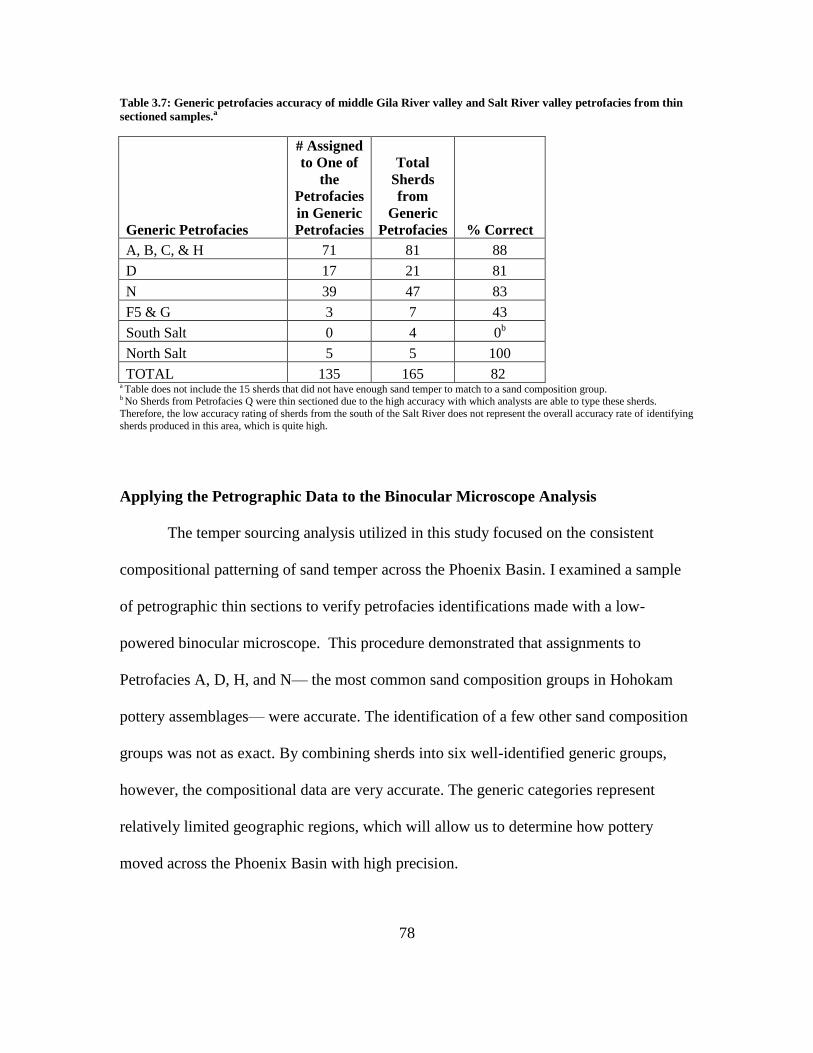
78
Table 3.7: Generic petrofacies accuracy of middle Gila River valley and Salt River valley petrofacies from thin
sectioned samples.a
Generic Petrofacies
# Assigned
to One of
the
Petrofacies
in Generic
Petrofacies
Total
Sherds
from
Generic
Petrofacies % Correct
A, B, C, & H 71 81 88
D 17 21 81
N 39 47 83
F5 & G 3 7 43
South Salt 0 4 0b
North Salt 5 5 100
TOTAL 135 165 82 a Table does not include the 15 sherds that did not have enough sand temper to match to a sand composition group. b No Sherds from Petrofacies Q were thin sectioned due to the high accuracy with which analysts are able to type these sherds.
Therefore, the low accuracy rating of sherds from the south of the Salt River does not represent the overall accuracy rate of identifying
sherds produced in this area, which is quite high.
Applying the Petrographic Data to the Binocular Microscope Analysis
The temper sourcing analysis utilized in this study focused on the consistent
compositional patterning of sand temper across the Phoenix Basin. I examined a sample
of petrographic thin sections to verify petrofacies identifications made with a low-
powered binocular microscope. This procedure demonstrated that assignments to
Petrofacies A, D, H, and N— the most common sand composition groups in Hohokam
pottery assemblages— were accurate. The identification of a few other sand composition
groups was not as exact. By combining sherds into six well-identified generic groups,
however, the compositional data are very accurate. The generic categories represent
relatively limited geographic regions, which will allow us to determine how pottery
moved across the Phoenix Basin with high precision.
79
After judging the accuracy of each petrofacies identified using the binocular
microscope, each of the 4,310 sherds included in this analysis were placed into one of the
six generic categories based on the sand petrofacies that they were grouped with in the
initial analysis. Sherd counts by generic petrographic groups are presented by site and
temporal phase in Table 3.8. These counts represent the final numbers that are used to
calculate the volume and concentration of red-on-buff sources.
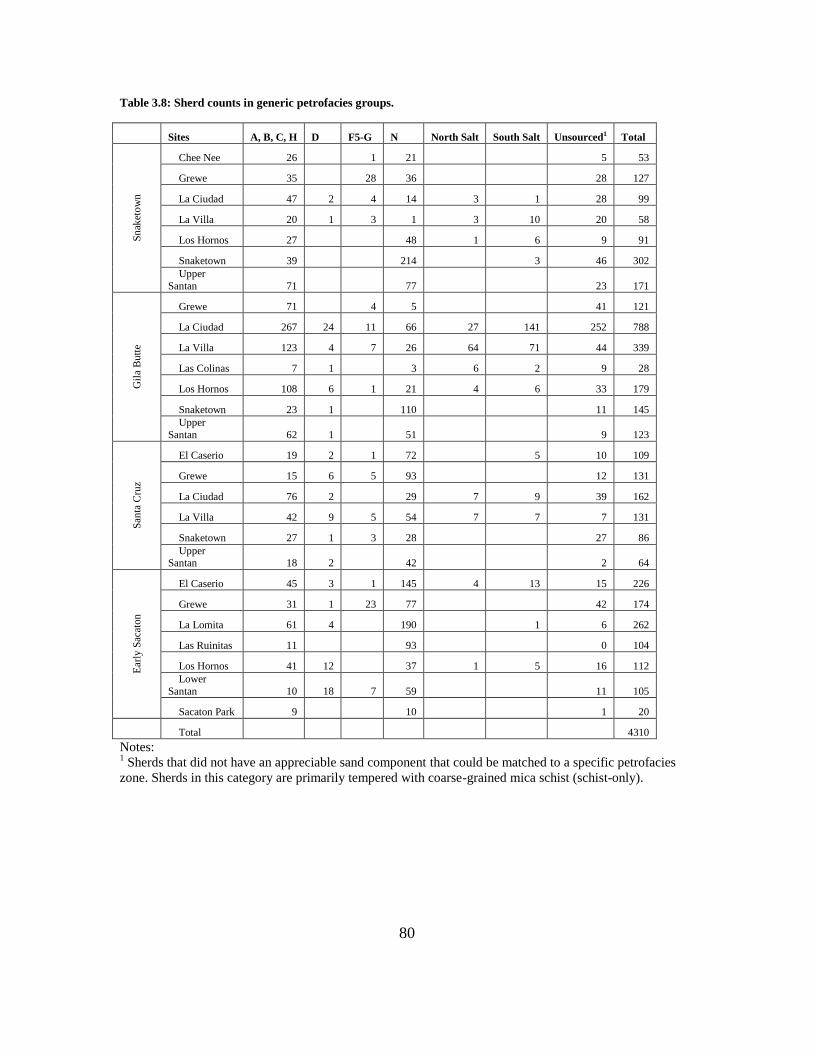
80
Table 3.8: Sherd counts in generic petrofacies groups.
Sites A, B, C, H D F5-G N North Salt South Salt Unsourced1 Total S
nak
eto
wn
Chee Nee 26 1 21 5 53
Grewe 35 28 36 28 127
La Ciudad 47 2 4 14 3 1 28 99
La Villa 20 1 3 1 3 10 20 58
Los Hornos 27 48 1 6 9 91
Snaketown 39 214 3 46 302
Upper
Santan 71 77 23 171
Gil
a B
utt
e
Grewe 71 4 5 41 121
La Ciudad 267 24 11 66 27 141 252 788
La Villa 123 4 7 26 64 71 44 339
Las Colinas 7 1 3 6 2 9 28
Los Hornos 108 6 1 21 4 6 33 179
Snaketown 23 1 110 11 145
Upper
Santan 62 1 51 9 123
San
ta C
ruz
El Caserio 19 2 1 72 5 10 109
Grewe 15 6 5 93 12 131
La Ciudad 76 2 29 7 9 39 162
La Villa 42 9 5 54 7 7 7 131
Snaketown 27 1 3 28 27 86
Upper
Santan 18 2 42 2 64
Ear
ly S
acat
on
El Caserio 45 3 1 145 4 13 15 226
Grewe 31 1 23 77 42 174
La Lomita 61 4 190 1 6 262
Las Ruinitas 11 93 0 104
Los Hornos 41 12 37 1 5 16 112
Lower
Santan 10 18 7 59 11 105
Sacaton Park 9 10 1 20
Total 4310
Notes: 1 Sherds that did not have an appreciable sand component that could be matched to a specific petrofacies
zone. Sherds in this category are primarily tempered with coarse-grained mica schist (schist-only).
81
Calculating the Dependent Variables: Supply and Demand
This analysis constructs a model for demand for specialist-produced red-on-buff
pottery by identifying four factors that may have affected the organization of Hohokam
pottery production. It then tests this model through a series of multiple regression
analyses that calculate the correlation between these factors and the supply and demand
for imported (non-local) buffware vessels. Each of the four factors-- increases to
population density, agricultural intensification, ritual requirements for social valuables,
and efficient regional distribution systems-- represents an independent variable or set of
independent variables in a series of multiple regression equations. The supply and
demand for pottery produced by specialists represents the dependent variable in these
equations. Below, I describe in detail the dependent and independent variables that are
used in each of the multiple regression analyses.
Supply
The dependent variable in the multiple regression analyses for production supply
is the average proportion of pottery from each petrofacies that was exported outside of
that petrofacies (Table 3.9). Production areas are defined at the scale of petrofacies or
generic petrofacies (sets of petrofacies) used in previous analyses in this study. First, I
calculate the proportion of non-local pottery from each production locale (petrofacies) in
site assemblages within each petrofacies. For instance, during the Snaketown phase 0.65
out of 1 (65 percent) of the non-local buffwares at sites within the “North Salt” generic
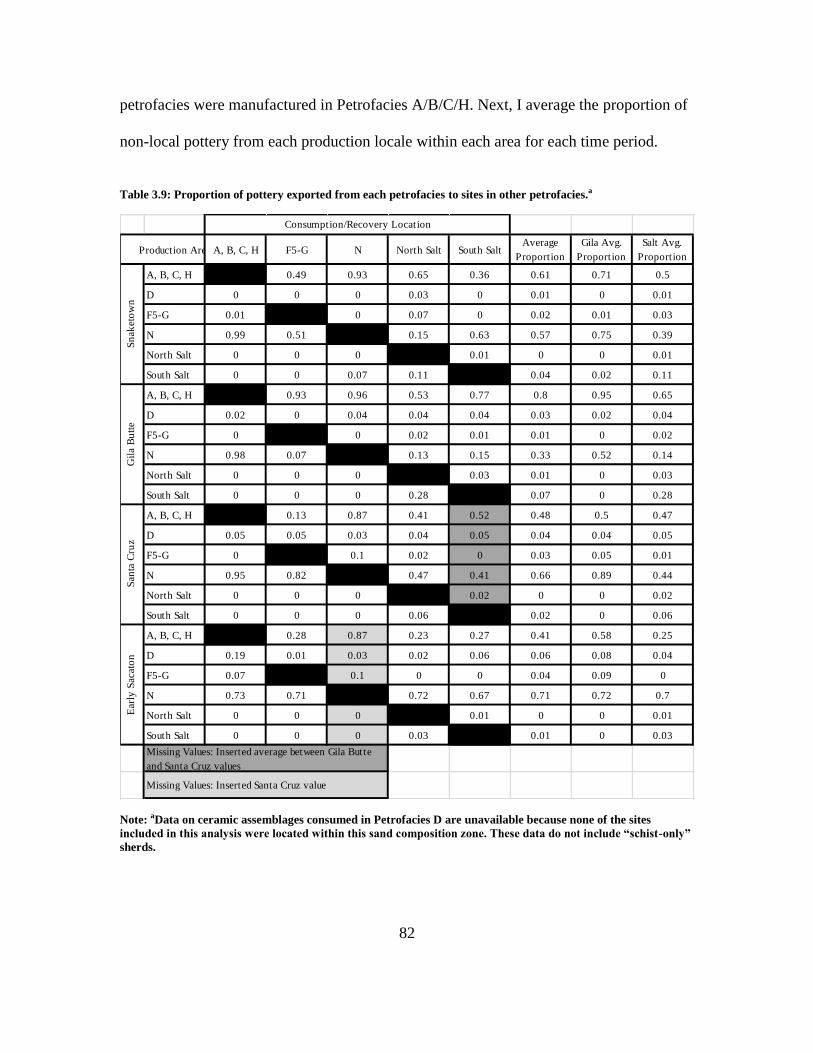
82
petrofacies were manufactured in Petrofacies A/B/C/H. Next, I average the proportion of
non-local pottery from each production locale within each area for each time period.
Table 3.9: Proportion of pottery exported from each petrofacies to sites in other petrofacies.a
Production Area A, B, C, H F5-G N North Salt South SaltAverage
Proportion
Gila Avg.
Proportion
Salt Avg.
Proportion
A, B, C, H 0.49 0.93 0.65 0.36 0.61 0.71 0.5
D 0 0 0 0.03 0 0.01 0 0.01
F5-G 0.01 0 0.07 0 0.02 0.01 0.03
N 0.99 0.51 0.15 0.63 0.57 0.75 0.39
North Salt 0 0 0 0.01 0 0 0.01
South Salt 0 0 0.07 0.11 0.04 0.02 0.11
A, B, C, H 0.93 0.96 0.53 0.77 0.8 0.95 0.65
D 0.02 0 0.04 0.04 0.04 0.03 0.02 0.04
F5-G 0 0 0.02 0.01 0.01 0 0.02
N 0.98 0.07 0.13 0.15 0.33 0.52 0.14
North Salt 0 0 0 0.03 0.01 0 0.03
South Salt 0 0 0 0.28 0.07 0 0.28
A, B, C, H 0.13 0.87 0.41 0.52 0.48 0.5 0.47
D 0.05 0.05 0.03 0.04 0.05 0.04 0.04 0.05
F5-G 0 0.1 0.02 0 0.03 0.05 0.01
N 0.95 0.82 0.47 0.41 0.66 0.89 0.44
North Salt 0 0 0 0.02 0 0 0.02
South Salt 0 0 0 0.06 0.02 0 0.06
A, B, C, H 0.28 0.87 0.23 0.27 0.41 0.58 0.25
D 0.19 0.01 0.03 0.02 0.06 0.06 0.08 0.04
F5-G 0.07 0.1 0 0 0.04 0.09 0
N 0.73 0.71 0.72 0.67 0.71 0.72 0.7
North Salt 0 0 0 0.01 0 0 0.01
South Salt 0 0 0 0.03 0.01 0 0.03
Missing Values: Inserted Santa Cruz value
Consumption/Recovery Location
Sn
aket
ow
nG
ila
Bu
tte
San
ta C
ruz
Ear
ly S
acat
on
Missing Values: Inserted average between Gila Butte
and Santa Cruz values
Note: aData on ceramic assemblages consumed in Petrofacies D are unavailable because none of the sites
included in this analysis were located within this sand composition zone. These data do not include “schist-only”
sherds.
83
Demand
The volume, or proportion, of non-local pottery that Phoenix Basin households
consumed is an indicator of household demand for pottery manufactured by specialists.
The concentration of pottery from different sources in Phoenix Basin assemblages is also
a measure of demand for specialist-produced pottery, because it indicates whether or not
households obtained pottery from a wide range of places or from only a few specialized
producers. If demand for specialist-produced pottery is rooted in some advantage to
obtaining pottery from specialists instead of making it locally, household pottery
assemblages would be marked by high consumption of wares from a few pottery
production locales.
Demand: Volume of Non-Local Wares
The volume of non-local red-on-buff pottery is measured by 1) the proportion of
non-local buffware out of an entire ceramic assemblage that includes both plain and
buffwares, and 2) the proportion of non-local buffware from the site’s decorated pottery
assemblage alone (see Appendix B, Tables 3b and 3c). Regarding the first measure,
Hohokam settlements vary in the proportion of buffware pottery relative to plainware
pottery. In particular, sites on the Salt River tend to have less decorated pottery than sites
on the Gila River. The role of decorated pottery in an entire ceramic assemblage provides
a measure of overall supply and demand for that pottery type.
The second measure of volume is the proportion of non-local red-on-buff pottery
in the decorated ceramic assemblage (Table 3.10; Appendix B, Table 3c). This variable
does not consider the proportion of plainware pottery in site assemblages. It provides a
84
useful complement to the proportion of pottery from the entire ceramic assemblage,
because it focuses on the composition of the decorated wares irrespective of other
ceramic wares in the assemblage.
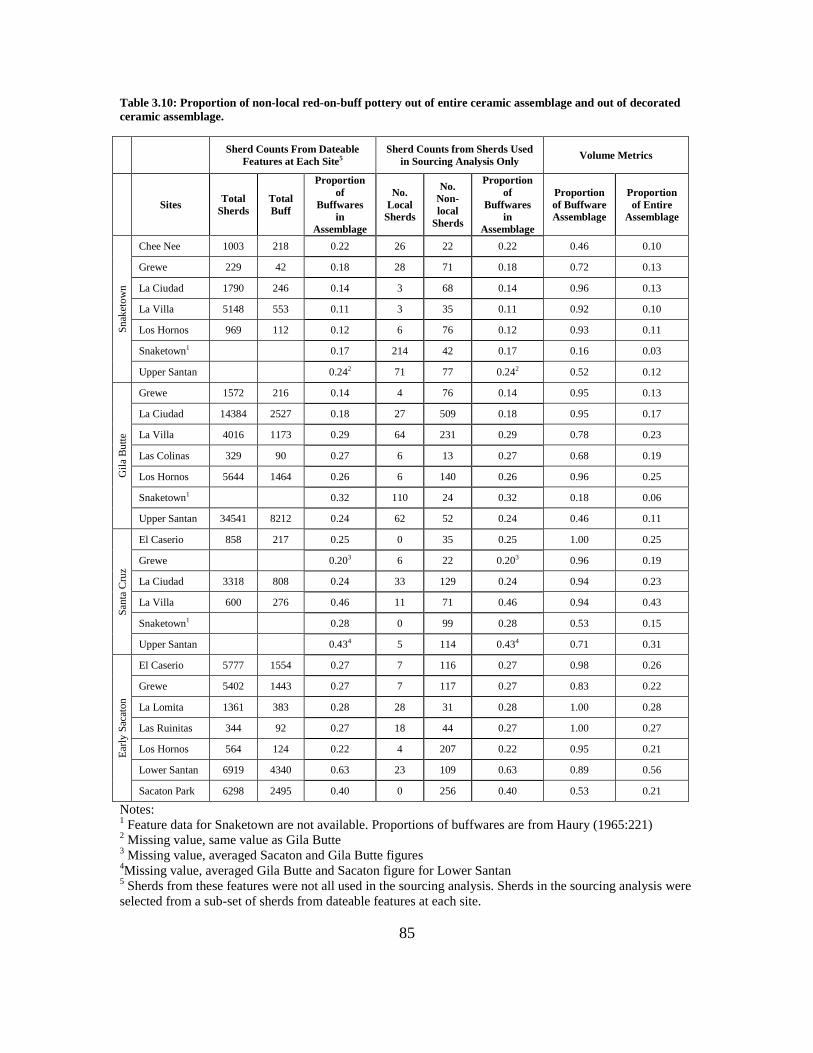
85
Table 3.10: Proportion of non-local red-on-buff pottery out of entire ceramic assemblage and out of decorated
ceramic assemblage.
Sherd Counts From Dateable
Features at Each Site5
Sherd Counts from Sherds Used
in Sourcing Analysis Only Volume Metrics
Sites Total
Sherds
Total
Buff
Proportion
of
Buffwares
in
Assemblage
No.
Local
Sherds
No.
Non-
local
Sherds
Proportion
of
Buffwares
in
Assemblage
Proportion
of Buffware
Assemblage
Proportion
of Entire
Assemblage
Sn
aket
ow
n
Chee Nee 1003 218 0.22 26 22 0.22 0.46 0.10
Grewe 229 42 0.18 28 71 0.18 0.72 0.13
La Ciudad 1790 246 0.14 3 68 0.14 0.96 0.13
La Villa 5148 553 0.11 3 35 0.11 0.92 0.10
Los Hornos 969 112 0.12 6 76 0.12 0.93 0.11
Snaketown1
0.17 214 42 0.17 0.16 0.03
Upper Santan
0.242 71 77 0.242 0.52 0.12
Gil
a B
utt
e
Grewe 1572 216 0.14 4 76 0.14 0.95 0.13
La Ciudad 14384 2527 0.18 27 509 0.18 0.95 0.17
La Villa 4016 1173 0.29 64 231 0.29 0.78 0.23
Las Colinas 329 90 0.27 6 13 0.27 0.68 0.19
Los Hornos 5644 1464 0.26 6 140 0.26 0.96 0.25
Snaketown1
0.32 110 24 0.32 0.18 0.06
Upper Santan 34541 8212 0.24 62 52 0.24 0.46 0.11
San
ta C
ruz
El Caserio 858 217 0.25 0 35 0.25 1.00 0.25
Grewe
0.203 6 22 0.203 0.96 0.19
La Ciudad 3318 808 0.24 33 129 0.24 0.94 0.23
La Villa 600 276 0.46 11 71 0.46 0.94 0.43
Snaketown1
0.28 0 99 0.28 0.53 0.15
Upper Santan
0.434 5 114 0.434 0.71 0.31
Ear
ly S
acat
on
El Caserio 5777 1554 0.27 7 116 0.27 0.98 0.26
Grewe 5402 1443 0.27 7 117 0.27 0.83 0.22
La Lomita 1361 383 0.28 28 31 0.28 1.00 0.28
Las Ruinitas 344 92 0.27 18 44 0.27 1.00 0.27
Los Hornos 564 124 0.22 4 207 0.22 0.95 0.21
Lower Santan 6919 4340 0.63 23 109 0.63 0.89 0.56
Sacaton Park 6298 2495 0.40 0 256 0.40 0.53 0.21
Notes: 1 Feature data for Snaketown are not available. Proportions of buffwares are from Haury (1965:221)
2 Missing value, same value as Gila Butte
3 Missing value, averaged Sacaton and Gila Butte figures
4Missing value, averaged Gila Butte and Sacaton figure for Lower Santan
5 Sherds from these features were not all used in the sourcing analysis. Sherds in the sourcing analysis were
selected from a sub-set of sherds from dateable features at each site.
86
Demand: Concentration of Pottery from Different Sources
In addition to addressing the conditions that might affect the volume of non-local
red-on-buff pottery, I also determine what factors influence the concentration of wares
from different production locales. The concentration of red-on-buff pottery in site
assemblages is measured by 1) the richness (number) of represented source areas for red-
on-buff pottery as well as 2) the evenness (distribution) of those sources.
Calculating Richness. The richness (S) of red-on-buff production sources in Phoenix
Basin site assemblages is the number of sources represented in a particular ceramic
collection. Richness does not include temper categories that are not linked with a
particular geographic locale because these pots could be produced in a variety of different
locations that overlap other provenance-linked temper groups. Temper varieties that are
not included in richness are schist and unidentified sand, schist- only, unidentified sand,
and no temper. Table 3.11 presents the richness scores for each site’s assemblage for each
temporal phase.
Calculating Evenness. The evenness of sand temper sources represented in red-on-buff
assemblages is calculated using a common index for evenness called Simpson’s E.
Simpson’s E is a reliable estimate of the concentration of samples when a population is
divided into types. This measure, therefore, is amenable to calculating the evenness of
sand temper varieties that have been classified into groups. In order to calculate
Simpson’s E, we must first calculate the diversity index Simpson’s D such that
E = D/Dmax
87
In other words, Simpson’s E is the ratio between the diversity measure of the population
(Simpson’s D) and the maximum number of sand source groups (Dmax). Simpson’s D is
the probability that any two sherds chosen at random from an assemblage will have the
same sand type.
Simpson’s D is calculated as
D = 1 / Σpi2
Where pi are proportions of red-on-buff sherds manufactured with sand from a particular
source locale. The sum of the squares of these proportions produces Σpi2. By taking the
reciprocal of this equation (1 / Σpi2), the high values for this index denote assemblages
with even distribution over a number of different sand composition types.
Simpson’s E is the ratio between D and the maximum value of Dmax. In this case,
Dmax is 6 because there are six total sand source groups. The Simpson’s E index ranges
from the reciprocal of Dmax (1/Dmax), which in this case is 0.17, and 1. Therefore, a value
close to 0.17 indicates that there is very low evenness and a value close to 1 indicates
high evenness in the sources represented in the red-on-buff assemblages. Table 3.11
provides the final Simpson’s E scores for each assemblage. Calculations for Simpson’s D
and E are presented in Appendix B, Table 3d.
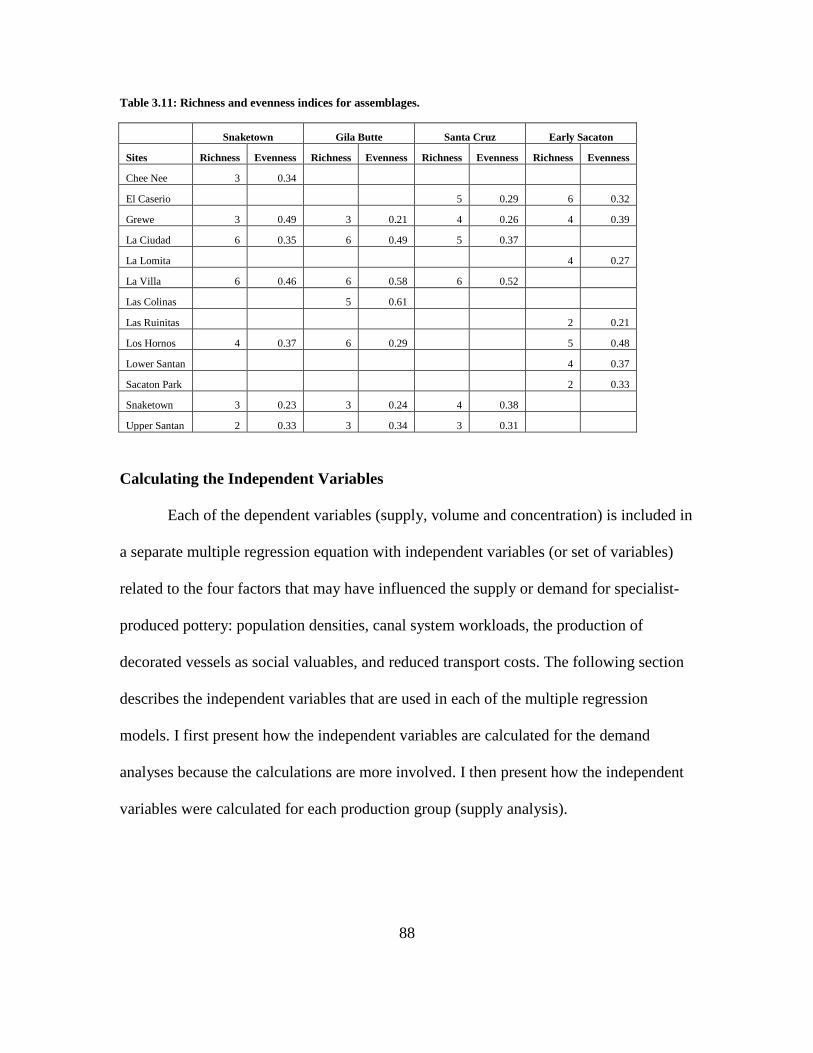
88
Table 3.11: Richness and evenness indices for assemblages.
Snaketown Gila Butte Santa Cruz Early Sacaton
Sites Richness Evenness Richness Evenness Richness Evenness Richness Evenness
Chee Nee 3 0.34
El Caserio 5 0.29 6 0.32
Grewe 3 0.49 3 0.21 4 0.26 4 0.39
La Ciudad 6 0.35 6 0.49 5 0.37
La Lomita 4 0.27
La Villa 6 0.46 6 0.58 6 0.52
Las Colinas 5 0.61
Las Ruinitas 2 0.21
Los Hornos 4 0.37 6 0.29 5 0.48
Lower Santan 4 0.37
Sacaton Park 2 0.33
Snaketown 3 0.23 3 0.24 4 0.38
Upper Santan 2 0.33 3 0.34 3 0.31
Calculating the Independent Variables
Each of the dependent variables (supply, volume and concentration) is included in
a separate multiple regression equation with independent variables (or set of variables)
related to the four factors that may have influenced the supply or demand for specialist-
produced pottery: population densities, canal system workloads, the production of
decorated vessels as social valuables, and reduced transport costs. The following section
describes the independent variables that are used in each of the multiple regression
models. I first present how the independent variables are calculated for the demand
analyses because the calculations are more involved. I then present how the independent
variables were calculated for each production group (supply analysis).
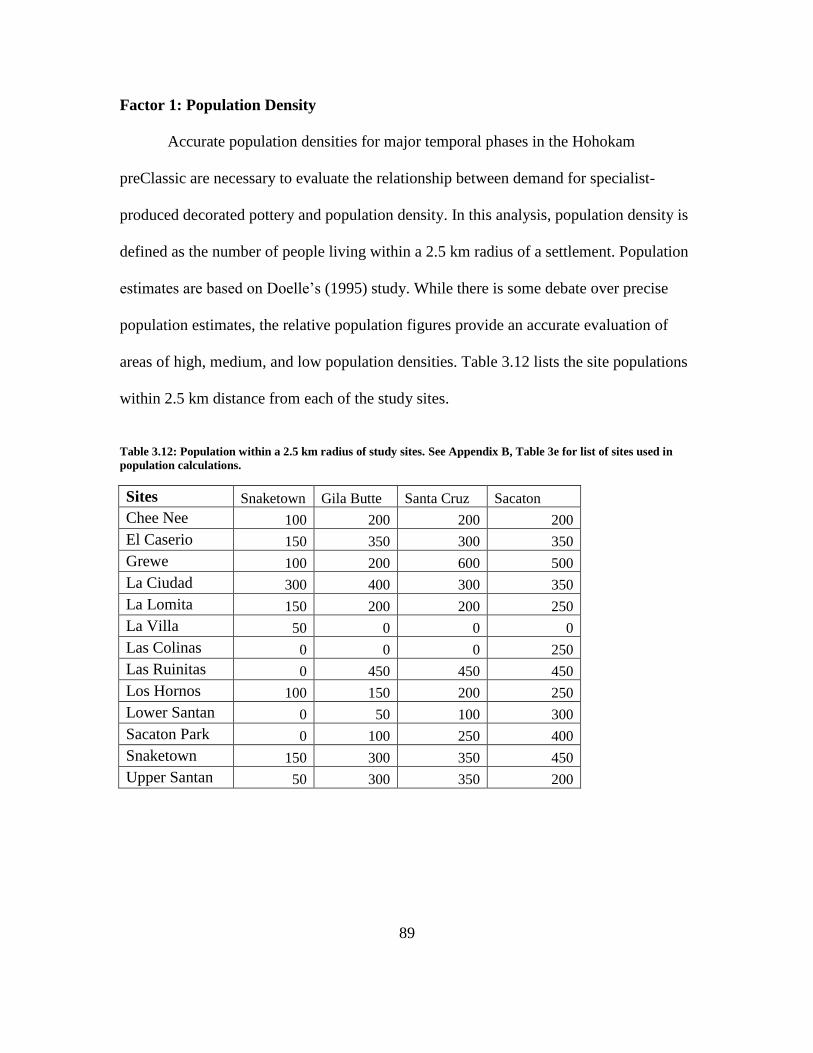
89
Factor 1: Population Density
Accurate population densities for major temporal phases in the Hohokam
preClassic are necessary to evaluate the relationship between demand for specialist-
produced decorated pottery and population density. In this analysis, population density is
defined as the number of people living within a 2.5 km radius of a settlement. Population
estimates are based on Doelle’s (1995) study. While there is some debate over precise
population estimates, the relative population figures provide an accurate evaluation of
areas of high, medium, and low population densities. Table 3.12 lists the site populations
within 2.5 km distance from each of the study sites.
Table 3.12: Population within a 2.5 km radius of study sites. See Appendix B, Table 3e for list of sites used in
population calculations.
Sites Snaketown Gila Butte Santa Cruz Sacaton
Chee Nee 100 200 200 200
El Caserio 150 350 300 350
Grewe 100 200 600 500
La Ciudad 300 400 300 350
La Lomita 150 200 200 250
La Villa 50 0 0 0
Las Colinas 0 0 0 250
Las Ruinitas 0 450 450 450
Los Hornos 100 150 200 250
Lower Santan 0 50 100 300
Sacaton Park 0 100 250 400
Snaketown 150 300 350 450
Upper Santan 50 300 350 200
90
Justification for Doelle’s Population Database
Several criteria influenced the selection of Doelle’s population database as a
baseline for population estimates for the Phoenix Basin. First, the population estimates
must be calculated independently of canal system workloads. Due to the importance of
canal systems to the agricultural economy, recent estimates of Hohokam populations
refer directly to the number of people required to construct, maintain, and farm canal
systems (Woodson 2010). This study assesses the role of canal system workload in
demand for red-on-buff pottery produced by specialists. Workload in this case is
calculated as the ratio of the number of people living along a canal system and the length
of the main canal in that canal system. Therefore, population estimates must be based on
different measures than the size, field, or command area of canal systems. Doelle’s data
is not based on variables linked with canal system size.
Second, the population data must provide separate population estimates for each
major temporal phase in the Hohokam preClassic. Doelle provided separate estimates for
the following time spans: AD 700 – 800, AD 800 – 900, AD 900 – 1000, and AD 1000 –
1050. The date ranges roughly correspond to the Snaketown, Gila Butte, Santa Cruz, and
Early Sacaton phases in the Hohokam culture sequence.
Third, the selected population data must cover all sites within the Phoenix Basin.
Doelle’s (1995) regional population estimates, which are still among the most complete
inventory of prehistoric community sizes in the southern Southwest, cover the entire
Phoenix Basin. The database is grounded in site information collected from over 200
years of archaeological survey and excavation projects in central Arizona. Large
91
reconnaissance surveys during the late 1800s and early 1900s were the first projects to
identify and record an extensive number of archaeological sites systematically in the
Phoenix Basin (Bandelier 1892; Cushing 1890; Fewkes 1909; Gabel 1931; Gladwin
1928; 1929a; 1929b; 1930a; 1930b; 1935; Haury 1934; Haury 1945; Huntington 1912;
1913; 1914; Kelly 1936; Midvale 1965; Mindeleff 1896; Sauer and Brand 1930;
Schroeder 1940; Turney 1929). These early surveys provided particularly complete
information on large sites that were more visible on the landscape. Doelle then used more
recent survey data collected by the Gila River Indian Community (Gregory and
Huckleberry 1994; Wood 1971a; Wood 1971b; Wood 1972) and the Central Arizona
Water Control Study (Rice and Bostwick 1986) to update his database. He also reviewed
reports generated by excavation projects and compared these findings to the survey data.
Finally, Doelle used previous population studies focused on the Phoenix Basin as a
starting point for his own calculations (Bostwick and Downum 1994; Downum and
Bostwick 1993; Gregory and McGuire 1982; Gregory and Nials 1985; Howard and
Huckleberry 1991; Wilcox et al. 1981; Wilcox and Sternberg 1983; Wilcox 1987; Wilcox
et al. 1990; Wilcox 1993).
Fourth, the population estimates used in this analysis must be consistent relative
to one another so that they can be equally compared across the study area. One of the
most important features of Doelle’s population database is that the population figures are
internally consistent; they are all based on the same criteria and were calculated at the
same time. As a result, the relative differences among settlement population data will be
accurate even if the particular population numbers themselves are too high or too low. In
order to control for change in settlement size over occupation span, Doelle created a
92
measure for occupation intensity at each site for each temporal phase. Intensity is
measured by the location of the site in the context of regional population distribution,
occupation length, size and number of middens, site structure, site area, and size and
number of public architecture.
Finally, the population estimates must include correction factors that mitigate the
issues posed by missing data, the underrepresentation of small sites, and temporal
confusion in sites characterized by long occupation spans. Doelle noted that his database
was affected by these three main sources of error. First, it is likely that not all sites are
recorded in the database. In particular, early components (i.e., Snaketown phase) are
disproportionately represented (Doelle 1995:517). Second, the low resolution on small
sites in general is troublesome. In particular, it is difficult to determine the difference
between sites that are seasonally occupied from those that are more permanent. In these
cases, Doelle suggested that we rely on general population trends through time as a
baseline for our estimates for small and ephemeral sites. Third, the long temporal phases
recorded in the database may mask shifts in population levels. To compensate for these
sources of error, Doelle modeled the effect of occupation length, abandonment rate, and
settlement growth rate on population estimates and developed correction factors for the
population data in each temporal span.
Although Doelle’s population data are almost 20 years old, these data remain the
most complete array of population estimates through each of the major temporal phases
in the preClassic period (for updated population estimates on specific time periods see
Craig et al. 2010). These population data enable me to compare population estimates
among different temporal phases for archaeological sites across the Phoenix Basin. In
93
addition, the consistency of Doelle’s data enables me to measure relative population
differences among sites.
Factor 2: Workload in Irrigation Agriculture
Time investment in irrigation agriculture is calculated as a ratio between the
number of people living on a canal system and the length of the main canal of each
irrigation system (Table 3.13). Population estimates for particular canal systems are
based on estimates compiled by Doelle (1995), discussed above. The length of the main
canal is used as a proxy for time investment in irrigation management. Canal length is a
suitable estimate for the amount of time invested in canal irrigation for several reasons: 1)
cleaning the main canals is a time-intensive task, 2) the main canal must be cleaned
periodically as part of routine maintenance of the system, 3) the workload of cleaning the
main canal was presumably shared among all members in the irrigation community, and
4) the length of the main canal is a rough proxy for the number of lateral canals and fields
that extend from it (e.g., Castetter and Bell 1942; Howard 1993b; Lewis 1991; Sheridan
1996).
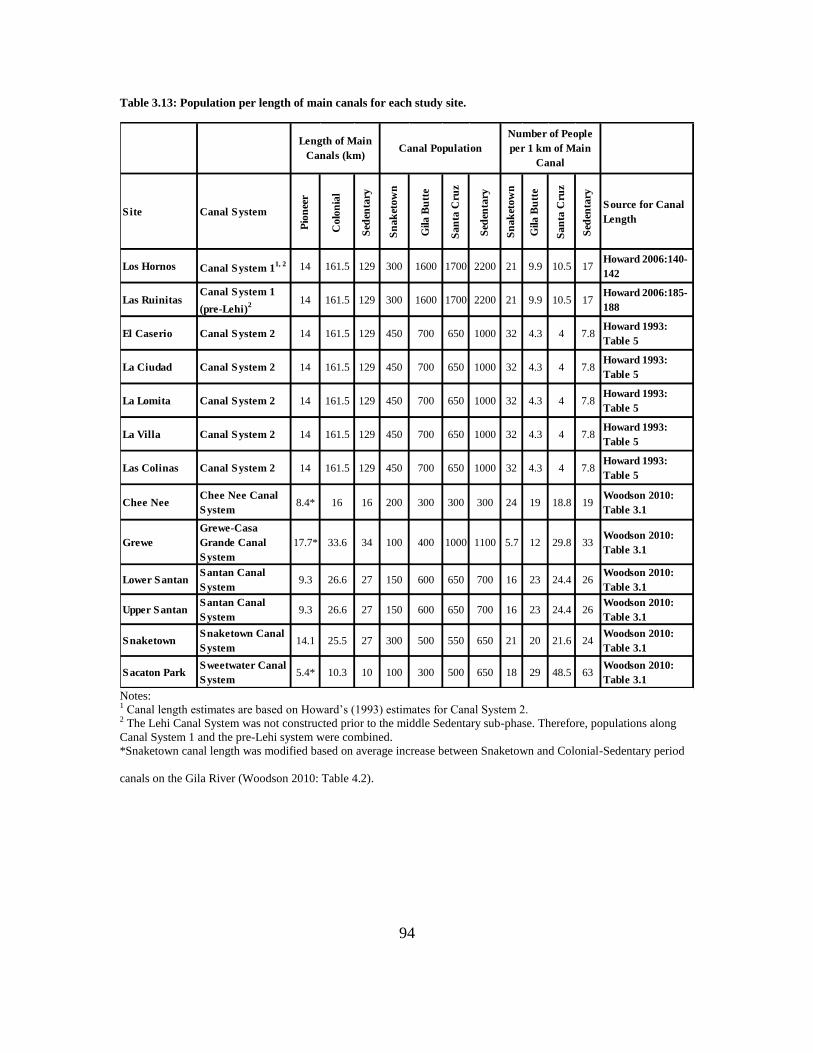
94
Table 3.13: Population per length of main canals for each study site.
Site Canal System
Pio
nee
r
Co
lon
ial
Sed
enta
ry
Sn
ak
eto
wn
Gila
Bu
tte
Sa
nta
Cru
z
Sed
enta
ry
Sn
ak
eto
wn
Gila
Bu
tte
Sa
nta
Cru
z
Sed
enta
ry
Source for Canal
Length
Los Hornos Canal System 11, 2 14 161.5 129 300 1600 1700 2200 21 9.9 10.5 17
Howard 2006:140-
142
Las RuinitasCanal System 1
(pre-Lehi)2
14 161.5 129 300 1600 1700 2200 21 9.9 10.5 17Howard 2006:185-
188
El Caserio Canal System 2 14 161.5 129 450 700 650 1000 32 4.3 4 7.8Howard 1993:
Table 5
La Ciudad Canal System 2 14 161.5 129 450 700 650 1000 32 4.3 4 7.8Howard 1993:
Table 5
La Lomita Canal System 2 14 161.5 129 450 700 650 1000 32 4.3 4 7.8Howard 1993:
Table 5
La Villa Canal System 2 14 161.5 129 450 700 650 1000 32 4.3 4 7.8Howard 1993:
Table 5
Las Colinas Canal System 2 14 161.5 129 450 700 650 1000 32 4.3 4 7.8Howard 1993:
Table 5
Chee NeeChee Nee Canal
System8.4* 16 16 200 300 300 300 24 19 18.8 19
Woodson 2010:
Table 3.1
Grewe
Grewe-Casa
Grande Canal
System
17.7* 33.6 34 100 400 1000 1100 5.7 12 29.8 33Woodson 2010:
Table 3.1
Lower SantanSantan Canal
System9.3 26.6 27 150 600 650 700 16 23 24.4 26
Woodson 2010:
Table 3.1
Upper SantanSantan Canal
System9.3 26.6 27 150 600 650 700 16 23 24.4 26
Woodson 2010:
Table 3.1
SnaketownSnaketown Canal
System14.1 25.5 27 300 500 550 650 21 20 21.6 24
Woodson 2010:
Table 3.1
Sacaton ParkSweetwater Canal
System5.4* 10.3 10 100 300 500 650 18 29 48.5 63
Woodson 2010:
Table 3.1
Length of Main
Canals (km)Canal Population
Number of People
per 1 km of Main
Canal
Notes: 1 Canal length estimates are based on Howard’s (1993) estimates for Canal System 2. 2 The Lehi Canal System was not constructed prior to the middle Sedentary sub-phase. Therefore, populations along
Canal System 1 and the pre-Lehi system were combined.
*Snaketown canal length was modified based on average increase between Snaketown and Colonial-Sedentary period
canals on the Gila River (Woodson 2010: Table 4.2).
95
Canal Length Figures
The lengths of canals along the lower Salt River and the middle Gila River valleys
are based on the extensive work of Jerry Howard and Kyle Woodson, respectively. Jerry
Howard reconstructed the construction sequence for Canal System 2 for the Pioneer,
Colonial, Sedentary, and Classic periods (Howard 1993b). Similarly, Kyle Woodson
(2010) documented changes to the canal length of the Granite Knob, Santan, Gila Butte,
and Snaketown canal systems along the middle Gila River valley for specific temporal
phases from the Pioneer period to the Classic period.
Howard and Woodson’s canal length estimates are used in this analysis as a proxy
for canal system workloads. However, high resolution data on the construction sequence
of Canal System 1, the Chee Nee Canal system, the Grewe-Casa Grande Canal System,
and the Sweetwater Canal System do not yet exist. In the following sections, I detail the
methods used to compensate for these gaps in data.
Canal System 1 Length Proxy
Unlike the detailed construction sequence of Canal System 2 (Howard 1993b),
very little research has been devoted to reconstructing the development of Canal System
1. Howard speculates that Canal System 1 was constructed as a mirror image to Canal
System 2 on the north side of the lower Salt River valley (Howard 2006:140-142). He
suggests that these two canal systems were likely organized and administered similarly
because they share the same structural elements (Howard 2006:142). The comparability
of the two largest canal systems on the lower Salt River suggests that Howard’s canal
length estimates for Canal System 2 during the preClassic may be used as a proxy for the
96
growth of Canal System 1. Therefore, in my estimates, I use the length of Canal System 2
as the length of Canal System 1 during each temporal phase.
A Canal System for Las Ruinitas
A second issue associated with canal length calculations is linking Las Ruinitas to
a canal system during the preClassic period. Las Ruinitas, which is located in the Lehi
canal system, had a preClassic occupation span that predated the construction of the Lehi
System in the middle Sacaton phase. Howard (2006:185-188) argues that, prior to the
construction of the Lehi Canal System, settlements in this area likely relied on irrigation
channels linked with Canal System 1 on the lower Salt River terrace. Therefore, the canal
lengths for Canal System 1 are used for Las Ruinitas even though this site was eventually
incorporated within the Lehi Canal System when the system was constructed in the
middle Sedentary phase. One potential source of error in combining the populations of
Canal System 1 and the pre-Lehi System is that the population per canal length in the
Sedentary period may be overestimated. The Lehi Canal System was constructed during
the Sedentary period. Therefore, the additional population gain in the Sedentary period
would be offset by the construction of more canals.
Gila River Canal Length Proxy
Finally, although Woodson (2010) provides a detailed reconstruction of changes
to canal system length for several middle Gila River canal systems, his estimates do not
include phase by phase changes to the Chee Nee, Grewe-Casa Grande, or Sweetwater
canal systems. Woodson does provide total length estimates that likely approximate the
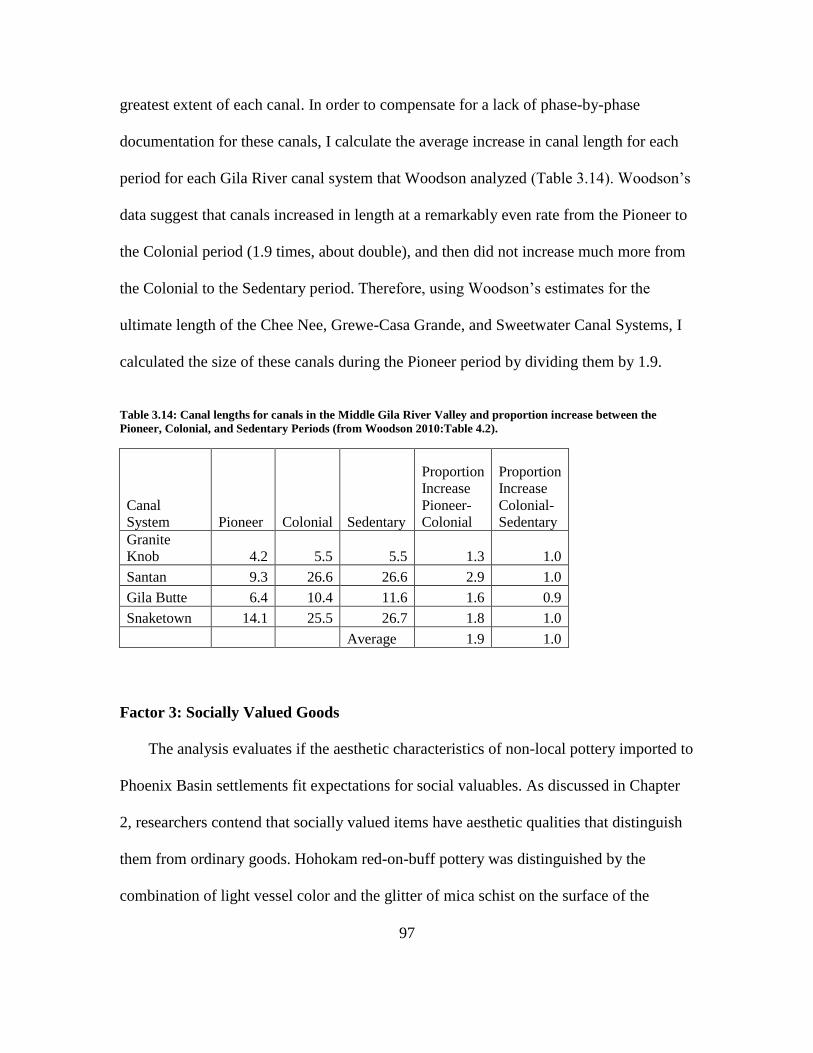
97
greatest extent of each canal. In order to compensate for a lack of phase-by-phase
documentation for these canals, I calculate the average increase in canal length for each
period for each Gila River canal system that Woodson analyzed (Table 3.14). Woodson’s
data suggest that canals increased in length at a remarkably even rate from the Pioneer to
the Colonial period (1.9 times, about double), and then did not increase much more from
the Colonial to the Sedentary period. Therefore, using Woodson’s estimates for the
ultimate length of the Chee Nee, Grewe-Casa Grande, and Sweetwater Canal Systems, I
calculated the size of these canals during the Pioneer period by dividing them by 1.9.
Table 3.14: Canal lengths for canals in the Middle Gila River Valley and proportion increase between the
Pioneer, Colonial, and Sedentary Periods (from Woodson 2010:Table 4.2).
Canal
System Pioneer Colonial Sedentary
Proportion
Increase
Pioneer-
Colonial
Proportion
Increase
Colonial-
Sedentary
Granite
Knob 4.2 5.5 5.5 1.3 1.0
Santan 9.3 26.6 26.6 2.9 1.0
Gila Butte 6.4 10.4 11.6 1.6 0.9
Snaketown 14.1 25.5 26.7 1.8 1.0
Average 1.9 1.0
Factor 3: Socially Valued Goods
The analysis evaluates if the aesthetic characteristics of non-local pottery imported to
Phoenix Basin settlements fit expectations for social valuables. As discussed in Chapter
2, researchers contend that socially valued items have aesthetic qualities that distinguish
them from ordinary goods. Hohokam red-on-buff pottery was distinguished by the
combination of light vessel color and the glitter of mica schist on the surface of the
98
pottery. Therefore, I used the exterior color of red-on-buff vessels and the density of mica
on the surface of these vessels as variables to identify the production of these pots as
social valuables.
The exterior vessel color for each sherd was measured using a standard Munsell
color book. In this case, the color value measurement—the indicator of how light a color
is on each page of the Munsell book—was recorded. Color value ranges on an ordinal
scale from 2 or 2.5 to 8 depending on the specific color chart (Table 3.15). In each case,
higher numbers (e.g., 8) designated the lightest color values while lower numbers (e.g., 2)
designated the darkest color values. Color readings on bowls were taken on the inside
surface, because the interior surfaces bear the decorative designs. Similarly, color
readings on jars were taken on the exterior surface of the vessel where the painted
designs appear. In cases where color variation existed, I measured the lightest portion of
the sherd.
The density of mica particles on the surface of sherds was measured using a
standardized mica density gauge developed by David Abbott (Abbott 2001a). This gauge
consists of a piece of cardboard with nine 1 x 1 millimeter holes cut in a line at 5
millimeter intervals. To measure mica density, I counted the number of mica particles
that appear within the holes when the gauge was placed against the surface of the pot.
Mica densities range from zero (no mica) to nine (mica filling every hole in the gauge)
(Table 3.15).
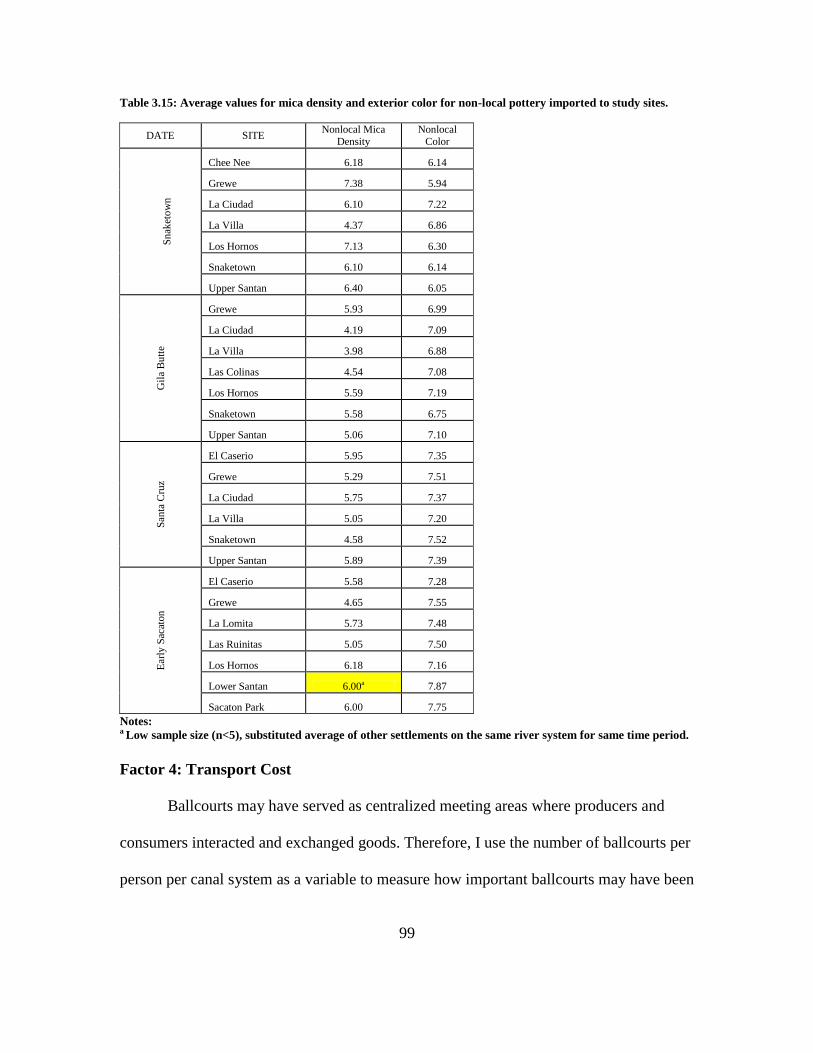
99
Table 3.15: Average values for mica density and exterior color for non-local pottery imported to study sites.
DATE SITE Nonlocal Mica
Density Nonlocal
Color
Sn
aket
ow
n
Chee Nee 6.18 6.14
Grewe 7.38 5.94
La Ciudad 6.10 7.22
La Villa 4.37 6.86
Los Hornos 7.13 6.30
Snaketown 6.10 6.14
Upper Santan 6.40 6.05
Gil
a B
utt
e
Grewe 5.93 6.99
La Ciudad 4.19 7.09
La Villa 3.98 6.88
Las Colinas 4.54 7.08
Los Hornos 5.59 7.19
Snaketown 5.58 6.75
Upper Santan 5.06 7.10
San
ta C
ruz
El Caserio 5.95 7.35
Grewe 5.29 7.51
La Ciudad 5.75 7.37
La Villa 5.05 7.20
Snaketown 4.58 7.52
Upper Santan 5.89 7.39
Ear
ly S
acat
on
El Caserio 5.58 7.28
Grewe 4.65 7.55
La Lomita 5.73 7.48
Las Ruinitas 5.05 7.50
Los Hornos 6.18 7.16
Lower Santan 6.00a 7.87
Sacaton Park 6.00 7.75
Notes: a Low sample size (n<5), substituted average of other settlements on the same river system for same time period.
Factor 4: Transport Cost
Ballcourts may have served as centralized meeting areas where producers and
consumers interacted and exchanged goods. Therefore, I use the number of ballcourts per
person per canal system as a variable to measure how important ballcourts may have been
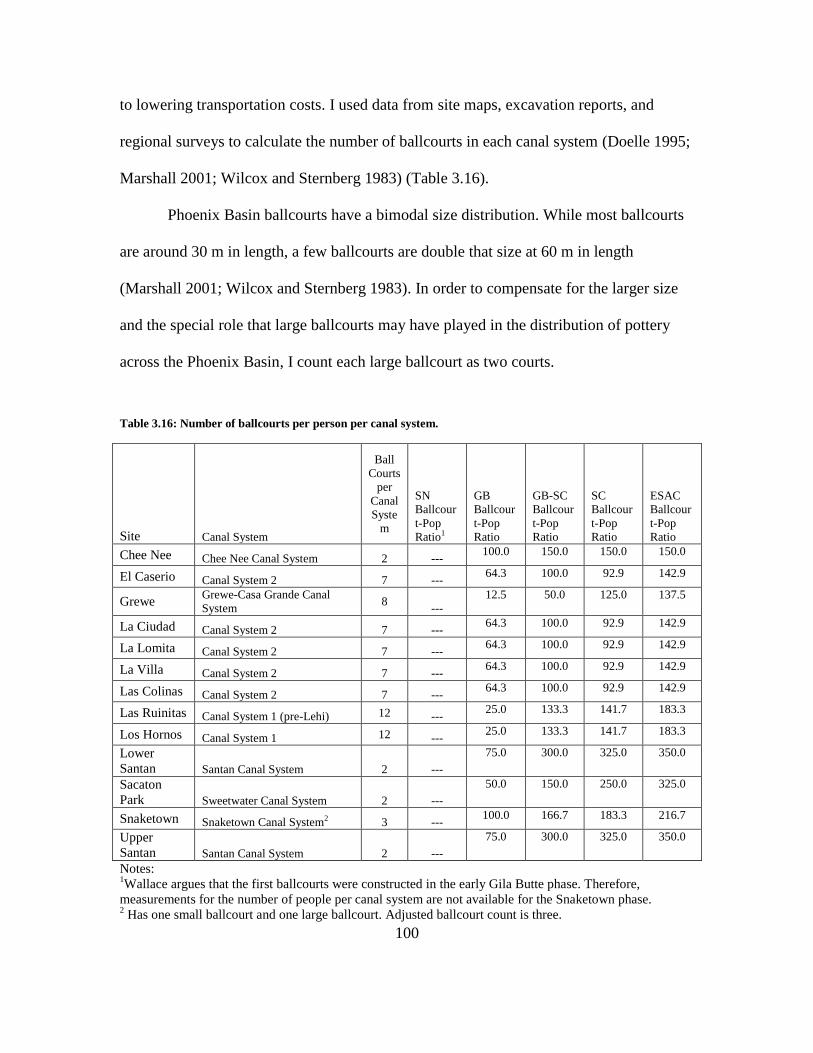
100
to lowering transportation costs. I used data from site maps, excavation reports, and
regional surveys to calculate the number of ballcourts in each canal system (Doelle 1995;
Marshall 2001; Wilcox and Sternberg 1983) (Table 3.16).
Phoenix Basin ballcourts have a bimodal size distribution. While most ballcourts
are around 30 m in length, a few ballcourts are double that size at 60 m in length
(Marshall 2001; Wilcox and Sternberg 1983). In order to compensate for the larger size
and the special role that large ballcourts may have played in the distribution of pottery
across the Phoenix Basin, I count each large ballcourt as two courts.
Table 3.16: Number of ballcourts per person per canal system.
Site Canal System
Ball
Courts
per
Canal
Syste
m
SN
Ballcour
t-Pop
Ratio1
GB
Ballcour
t-Pop
Ratio
GB-SC
Ballcour
t-Pop
Ratio
SC
Ballcour
t-Pop
Ratio
ESAC
Ballcour
t-Pop
Ratio
Chee Nee Chee Nee Canal System 2 --- 100.0 150.0 150.0 150.0
El Caserio Canal System 2 7 --- 64.3 100.0 92.9 142.9
Grewe Grewe-Casa Grande Canal
System 8
---
12.5 50.0 125.0 137.5
La Ciudad Canal System 2 7 --- 64.3 100.0 92.9 142.9
La Lomita Canal System 2 7 --- 64.3 100.0 92.9 142.9
La Villa Canal System 2 7 --- 64.3 100.0 92.9 142.9
Las Colinas Canal System 2 7 --- 64.3 100.0 92.9 142.9
Las Ruinitas Canal System 1 (pre-Lehi) 12 --- 25.0 133.3 141.7 183.3
Los Hornos Canal System 1 12 --- 25.0 133.3 141.7 183.3
Lower
Santan Santan Canal System 2 ---
75.0 300.0 325.0 350.0
Sacaton
Park Sweetwater Canal System 2 ---
50.0 150.0 250.0 325.0
Snaketown Snaketown Canal System2 3 --- 100.0 166.7 183.3 216.7
Upper
Santan Santan Canal System 2 ---
75.0 300.0 325.0 350.0
Notes: 1Wallace argues that the first ballcourts were constructed in the early Gila Butte phase. Therefore,
measurements for the number of people per canal system are not available for the Snaketown phase. 2 Has one small ballcourt and one large ballcourt. Adjusted ballcourt count is three.
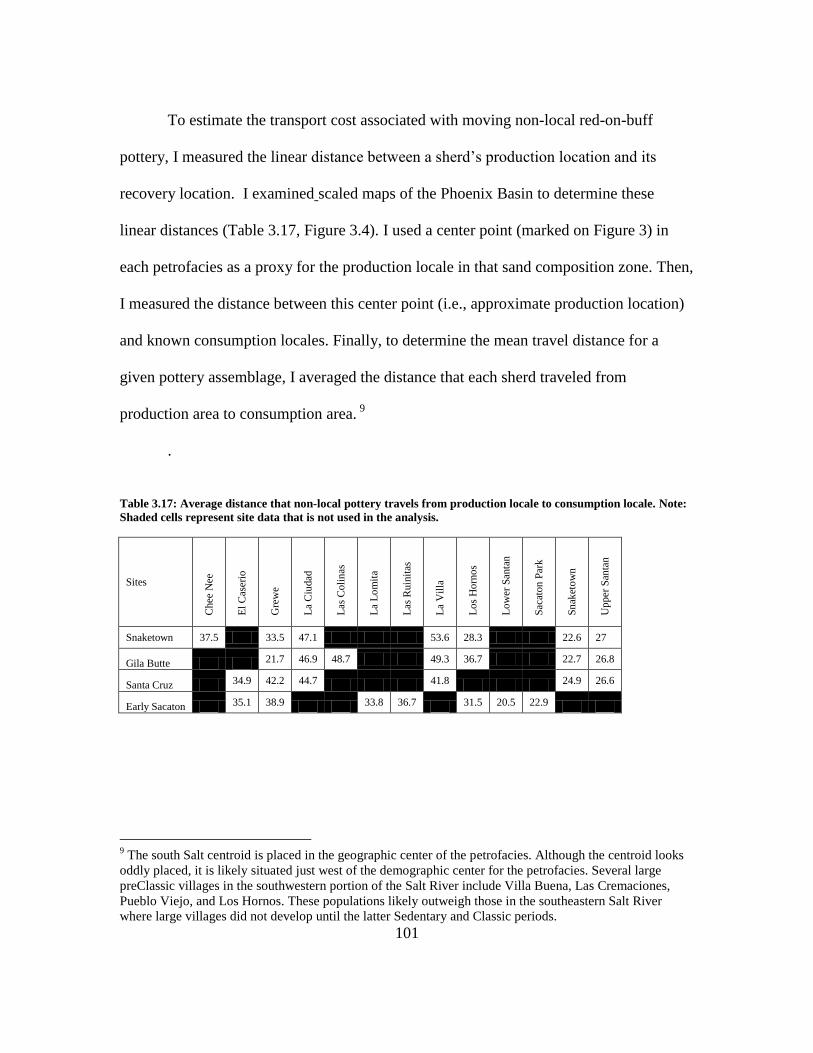
101
To estimate the transport cost associated with moving non-local red-on-buff
pottery, I measured the linear distance between a sherd’s production location and its
recovery location. I examined scaled maps of the Phoenix Basin to determine these
linear distances (Table 3.17, Figure 3.4). I used a center point (marked on Figure 3) in
each petrofacies as a proxy for the production locale in that sand composition zone. Then,
I measured the distance between this center point (i.e., approximate production location)
and known consumption locales. Finally, to determine the mean travel distance for a
given pottery assemblage, I averaged the distance that each sherd traveled from
production area to consumption area. 9
.
Table 3.17: Average distance that non-local pottery travels from production locale to consumption locale. Note:
Shaded cells represent site data that is not used in the analysis.
Sites
Chee
Nee
El
Cas
erio
Gre
we
La
Ciu
dad
Las
Coli
nas
La
Lo
mit
a
Las
Ruin
itas
La
Vil
la
Lo
s H
orn
os
Lo
wer
San
tan
Sac
aton
Par
k
Sn
aket
ow
n
Up
per
San
tan
Snaketown 37.5 33.5 47.1 53.6 28.3 22.6 27
Gila Butte 21.7 46.9 48.7 49.3 36.7 22.7 26.8
Santa Cruz 34.9 42.2 44.7 41.8 24.9 26.6
Early Sacaton 35.1 38.9 33.8 36.7 31.5 20.5 22.9
9 The south Salt centroid is placed in the geographic center of the petrofacies. Although the centroid looks
oddly placed, it is likely situated just west of the demographic center for the petrofacies. Several large
preClassic villages in the southwestern portion of the Salt River include Villa Buena, Las Cremaciones,
Pueblo Viejo, and Los Hornos. These populations likely outweigh those in the southeastern Salt River
where large villages did not develop until the latter Sedentary and Classic periods.
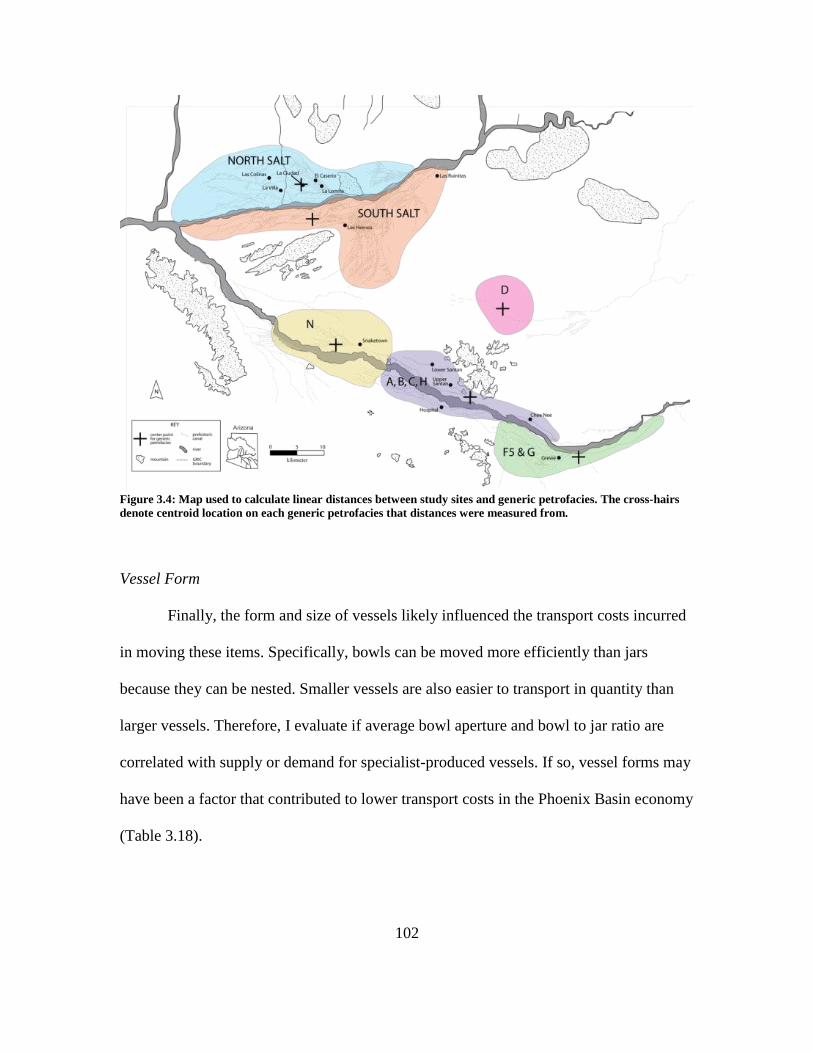
102
Figure 3.4: Map used to calculate linear distances between study sites and generic petrofacies. The cross-hairs
denote centroid location on each generic petrofacies that distances were measured from.
Vessel Form
Finally, the form and size of vessels likely influenced the transport costs incurred
in moving these items. Specifically, bowls can be moved more efficiently than jars
because they can be nested. Smaller vessels are also easier to transport in quantity than
larger vessels. Therefore, I evaluate if average bowl aperture and bowl to jar ratio are
correlated with supply or demand for specialist-produced vessels. If so, vessel forms may
have been a factor that contributed to lower transport costs in the Phoenix Basin economy
(Table 3.18).
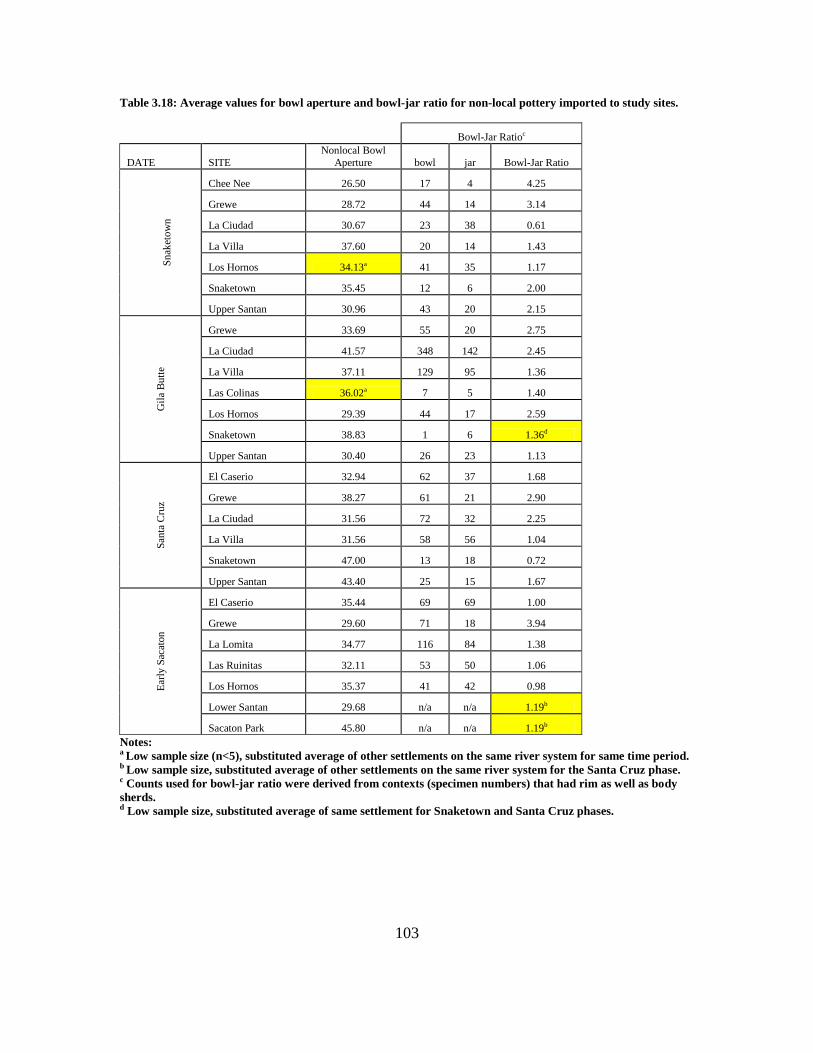
103
Table 3.18: Average values for bowl aperture and bowl-jar ratio for non-local pottery imported to study sites.
Bowl-Jar Ratioc
DATE SITE
Nonlocal Bowl
Aperture bowl jar Bowl-Jar Ratio
Sn
aket
ow
n
Chee Nee 26.50 17 4 4.25
Grewe 28.72 44 14 3.14
La Ciudad 30.67 23 38 0.61
La Villa 37.60 20 14 1.43
Los Hornos 34.13a 41 35 1.17
Snaketown 35.45 12 6 2.00
Upper Santan 30.96 43 20 2.15
Gil
a B
utt
e
Grewe 33.69 55 20 2.75
La Ciudad 41.57 348 142 2.45
La Villa 37.11 129 95 1.36
Las Colinas 36.02a 7 5 1.40
Los Hornos 29.39 44 17 2.59
Snaketown 38.83 1 6 1.36d
Upper Santan 30.40 26 23 1.13
San
ta C
ruz
El Caserio 32.94 62 37 1.68
Grewe 38.27 61 21 2.90
La Ciudad 31.56 72 32 2.25
La Villa 31.56 58 56 1.04
Snaketown 47.00 13 18 0.72
Upper Santan 43.40 25 15 1.67
Ear
ly S
acat
on
El Caserio 35.44 69 69 1.00
Grewe 29.60 71 18 3.94
La Lomita 34.77 116 84 1.38
Las Ruinitas 32.11 53 50 1.06
Los Hornos 35.37 41 42 0.98
Lower Santan 29.68 n/a n/a 1.19b
Sacaton Park 45.80 n/a n/a 1.19b
Notes: a Low sample size (n<5), substituted average of other settlements on the same river system for same time period. b Low sample size, substituted average of other settlements on the same river system for the Santa Cruz phase. c Counts used for bowl-jar ratio were derived from contexts (specimen numbers) that had rim as well as body
sherds. d Low sample size, substituted average of same settlement for Snaketown and Santa Cruz phases.
104
Calculating the Independent Variables for Supply
The independent variables assessed in the multiple regression analyses are
calculated at the scale of each production area (petrofacies) (Table 3.19). Population
density for each production locale is measured by the most densely populated area (2.5
km radius) within each petrofacies (Appendix B, Table 3f). Irrigation workload is a ratio
of the number of people who lived along a canal system and the length of the main canal
in that system. (Appendix B, Table 3g). Petrofacies D is represented by the Queen Creek
canal system. The northern Salt River is represented by Canal System 2, the southern Salt
River is represented by Canal System 1, Petrofacies F5-G is represented by the Grewe-
Casa Grande canal system, and Petrofacies N is represented by the Snaketown canal
system. Petrofacies A/B/C/H spans seven different canal systems: the Casa Blanca, Chee
Nee, Gila Butte, Granite Knob/Santan, Santan, and Sweetwater canal systems. Population
and canal length ratios were averaged among these canal systems to provide a single
metric for Petrofacies A/B/C/H. The same canal systems were used to calculate the
people per ballcourt per canal system (Figure 3.5; Appendix B, Table 3h). Vessel metrics,
such as exterior color value, mica density, bowl aperture, and bowl jar ratios, are
averages. Each metric represents a statistical mean of all vessels from an individual
production group for a particular time period. Transport distance for each production
locale is the average distance that locally produced pottery was transported to consumers.
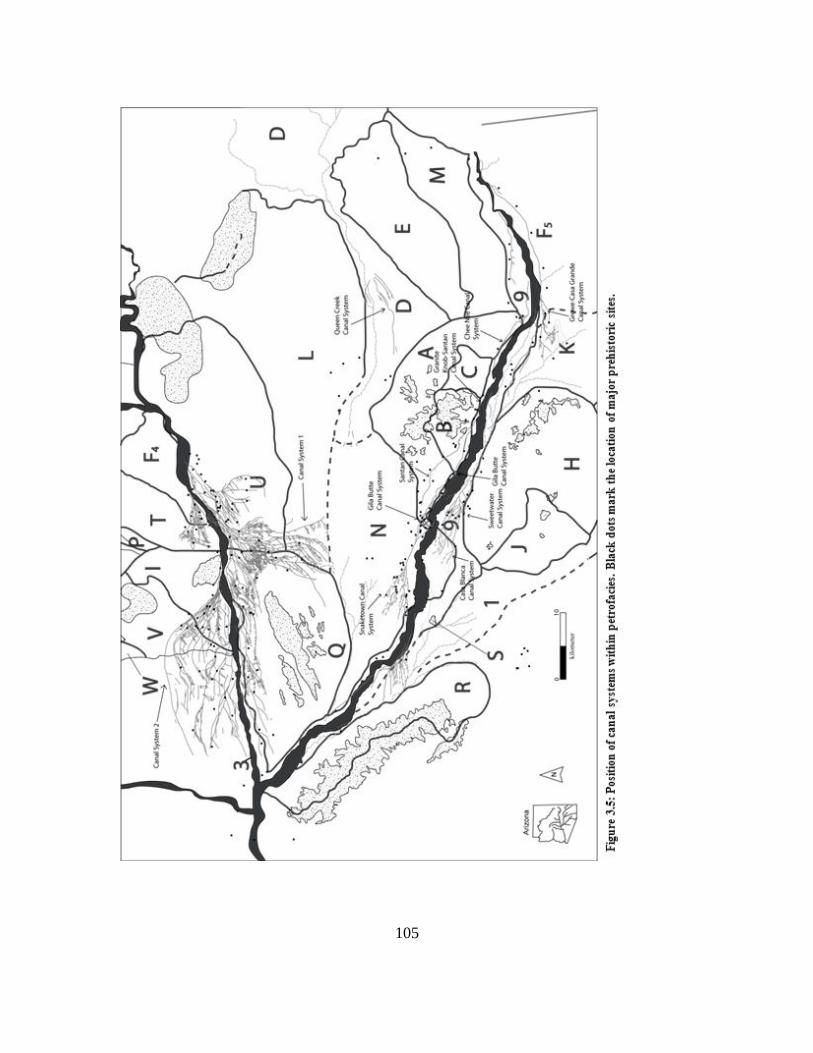
105
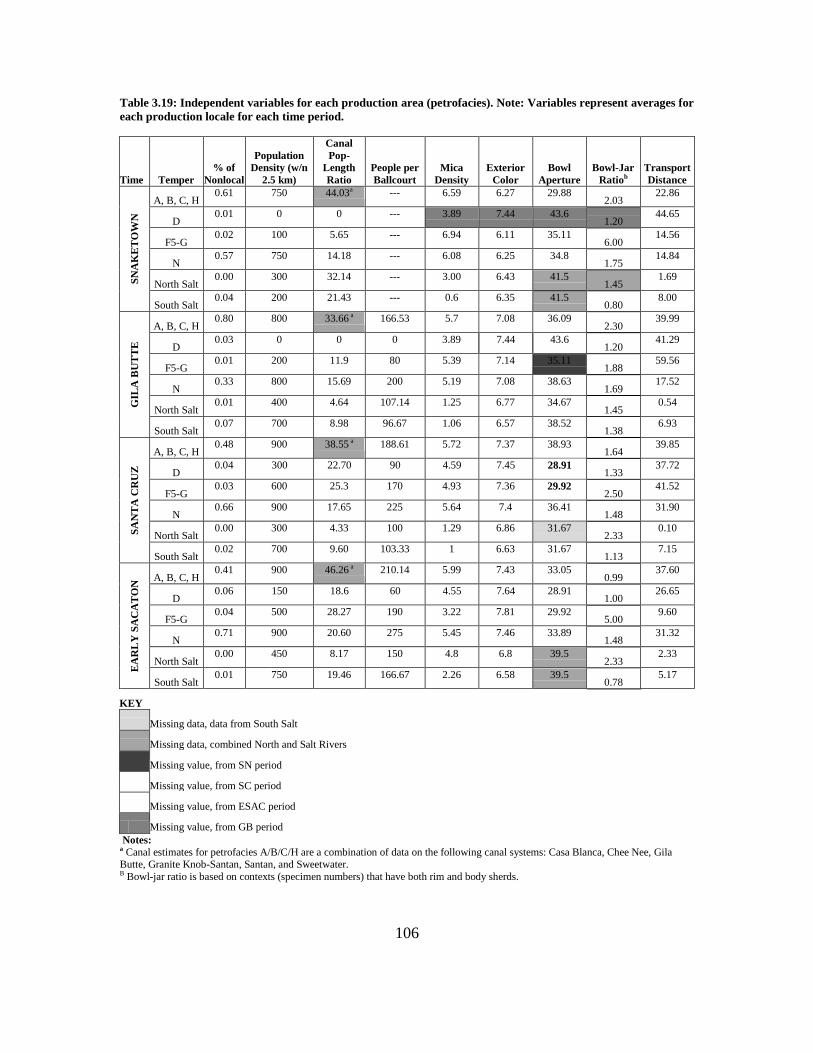
106
Table 3.19: Independent variables for each production area (petrofacies). Note: Variables represent averages for
each production locale for each time period.
Time Temper
% of
Nonlocal
Population
Density (w/n
2.5 km)
Canal
Pop-
Length
Ratio
People per
Ballcourt
Mica
Density
Exterior
Color
Bowl
Aperture
Bowl-Jar
Ratiob
Transport
Distance
SN
AK
ET
OW
N
A, B, C, H 0.61 750 44.03a --- 6.59 6.27 29.88
2.03 22.86
D 0.01 0 0 --- 3.89 7.44 43.6
1.20 44.65
F5-G 0.02 100 5.65 --- 6.94 6.11 35.11
6.00 14.56
N 0.57 750 14.18 --- 6.08 6.25 34.8
1.75 14.84
North Salt 0.00 300 32.14 --- 3.00 6.43 41.5
1.45 1.69
South Salt 0.04 200 21.43 --- 0.6 6.35 41.5
0.80 8.00
GIL
A B
UT
TE
A, B, C, H 0.80 800 33.66 a 166.53 5.7 7.08 36.09
2.30 39.99
D 0.03 0 0 0 3.89 7.44 43.6
1.20 41.29
F5-G 0.01 200 11.9 80 5.39 7.14 35.11
1.88 59.56
N 0.33 800 15.69 200 5.19 7.08 38.63
1.69 17.52
North Salt 0.01 400 4.64 107.14 1.25 6.77 34.67
1.45 0.54
South Salt 0.07 700 8.98 96.67 1.06 6.57 38.52
1.38 6.93
SA
NT
A C
RU
Z
A, B, C, H 0.48 900 38.55 a 188.61 5.72 7.37 38.93
1.64 39.85
D 0.04 300 22.70 90 4.59 7.45 28.91
1.33 37.72
F5-G 0.03 600 25.3 170 4.93 7.36 29.92
2.50 41.52
N 0.66 900 17.65 225 5.64 7.4 36.41
1.48 31.90
North Salt 0.00 300 4.33 100 1.29 6.86 31.67
2.33 0.10
South Salt 0.02 700 9.60 103.33 1 6.63 31.67
1.13 7.15
EA
RL
Y S
AC
AT
ON
A, B, C, H 0.41 900 46.26 a 210.14 5.99 7.43 33.05
0.99 37.60
D 0.06 150 18.6 60 4.55 7.64 28.91
1.00 26.65
F5-G 0.04 500 28.27 190 3.22 7.81 29.92
5.00 9.60
N 0.71 900 20.60 275 5.45 7.46 33.89
1.48 31.32
North Salt 0.00 450 8.17 150 4.8 6.8 39.5
2.33 2.33
South Salt 0.01 750 19.46 166.67 2.26 6.58 39.5
0.78 5.17
KEY
Missing data, data from South Salt
Missing data, combined North and Salt Rivers
Missing value, from SN period
Missing value, from SC period
Missing value, from ESAC period
Missing value, from GB period
Notes: a Canal estimates for petrofacies A/B/C/H are a combination of data on the following canal systems: Casa Blanca, Chee Nee, Gila Butte, Granite Knob-Santan, Santan, and Sweetwater. B Bowl-jar ratio is based on contexts (specimen numbers) that have both rim and body sherds.
107
The Multiple Regression Analysis
This study examines the relationships among the demand for non-local red-on-
buff pottery and the independent variables for two major temporal phases of the
Hohokam preClassic period—the early preClassic represented by the Snaketown and Gila
Butte phases, and the later preClassic represented by the Santa Cruz and early Sacaton
phase. The eight independent variables include population density, canal length-
population ratio, average bowl aperture, average bowl-jar ratio, average exterior color,
average mica density, ballcourts per person per canal, and the average distance between
production and consumption locale. For each temporal phase, I construct a multiple
regression equation for each dependent variable: 1) proportion of non-local buffware
pottery in the entire ceramic assemblage, 2) proportion of non-local buffware pottery in
the decorated assemblage, 3) richness of red on buff production sources represented in
the assemblage, 4) evenness of production sources represented in the assemblage, and 5)
proportion of non-local pottery supplied by each production locale. Thus, in total, the
study examines 10 multiple regression equations.
Multiple Regression Method
Multiple regression allows the analyst to determine the relationship among several
independent variables and a single dependent variable. In particular, it predicts the
amount of change expected in the dependent variable per unit change in the independent
variable. Multiple regression analysis is ideally suited to studies that require prediction or
modeling of the relationships among the independent and dependent variables. It has
been used to assess the influence of several variables simultaneously on a single
108
dependent variable in various types of archaeological analyses, including mortuary and
dental studies (Gordon and Buikstra 1981; Kvaal and Solheim 1994; Walker et al. 1991),
faunal analyses (Marshalla and Pilgram 1991), dating methods (Plog and Hantman 1986),
site hierarchies and classifications (Kohler and Parker 1986), lithic analysis (Dibble and
Whittaker 1981), agricultural productivity and crop yields (Burns 1983) and ceramic
analyses (Longacre 1964).
Multiple linear regression analyses were performed with JMP Statistical Software.
Prior to importing the dependent and independent variables into the multiple regression
model, each variable was converted into a z-score. The z-scores were calculated using the
mean and standard deviation for each combined time period (Snaketown-Gila Butte and
Santa Cruz-Early Sacaton). As a result, the estimates (β) provided by the multiple
regression analyses for each dependent variable for each temporal phase can be
compared. The resulting estimates, therefore, are standardized regression coefficients or
beta weights for each variable. These estimates will be referred to as scaled estimates.
To identify variables that should enter the multiple regression models, I first
performed a stepwise regression analysis on each of the dependent variables and the full
set of independent variables. This stepwise regression involved the forward selection
process whereby variables are added to the model one by one if they are considered
statistically significant. The selection process was set to pick the solution that would
minimize the Bayesian Information Criterion (BIC).
After the forward stepwise regression selected independent variables, I performed
an ordinary least squares (OLS) regression analysis on the dependent variables and the
selected independent variables. Ordinary Least Squares minimizes the sum of the squared
109
errors (difference between the observed and predicted responses) in the dataset. From this
analysis, I generated the R2 and the individual estimate coefficients that are used in the
interpretation of each regression model. The results of the least squares regression
analysis were accepted if the F-value or F-ratio was statistically significant at the 0.1
level. Statistical significance indicates that the model explains more than random
variation in the sample. In addition, the model was accepted if each estimate coefficient
was statistically significant at the 0.1 level. If these conditions were not met, I removed
independent variables that were not significant and re-ran the least squares regression
analysis. In some cases, I could not identify a model with an F-value probability less than
0.1 or with independent variables statistically significant at the 0.1 level.
Output of Multiple Regression Analyses
The results of the multiple regression analyses are measures of correlation among the
four factors (8 independent variables) described above and the demand for specialist-
produced red on buff pottery. Each of the 12 regressions performed in this study returned
a coefficient of determination (R2) that measures the correlation among one of the
dependent variables (volume, richness, evenness of buffware pottery) and the eight
independent variables. The significance of each independent variable’s contribution to
the regression model was examined by testing if its associated regression coefficient was
statistically different from zero (Pedhazur and Schmelkin 1991:417).
The overarching hypothesis that population density, time investment in irrigation
agriculture, ritual demands for socially valued goods, and transport costs are related to
increased demand for specialist-produced red-on-buff pottery would be supported by a
110
coefficient of determination value (R2) that is statistically greater than zero. An R
2 value
above zero would indicate that some proportion of the variance is explained by the
independent variables in the equation (Pedhazur and Schmelkin 1991:417). If an R2 value
for a particular multiple regression equation is close to 1, the factors included in this
analysis explain the majority of variance in demand for specialist-produced red-on-buff
pottery. This result would indicate that the present model is strongly predictive. If an R2
value for the multiple regression equation is statistically above zero but significantly
below 1, other factors may be influencing demand for red-on-buff pottery than those
included in the present analysis. This result would indicate that the model should be
revised to include additional variables. If an R2 value for the multiple regression
equations is statistically close to zero, none of the variables in the analysis are strongly
associated with demand for red-on-buff pottery. This result would provide a foundation
for subsequent analyses by eliminating factors that are not explanatory.
The regression analysis also produced estimate coefficients for each of the
independent variables (Shennan 1997:186-192). The estimate coefficients correspond to
the amount of variation in demand (the dependent variables) that is explained by
individual independent variables when variation in the other factors is held constant. A
comparison of the estimates indicated the relative influence of each independent variable
on the dependent variable. The resultant correlations led to inferences about the
conditions that contributed to demand for specialized red-on-buff pottery production in
the Phoenix Basin through time.
111
Checks on Multicolinearity
One issue in multiple regression analyses is the potential for covariance or
multicolinearity among some of the independent variables. Multiple regression analyses
with highly correlated independent variables will generate unstable estimates for
independent variables and high standard errors. In this analysis, correlation matrices
indicate that covariance may be an issue in a few of the multiple regression solutions. For
instance, the maximum population density, the number of people per ballcourt, and canal
workload covary during certain time periods. This type of correlation, unfortunately, is
unavoidable because each of the independent variables addresses human behavior either
with respect to settlement position or ballcourt/canal construction. Although there is not a
direct link between the number of ballcourts, population, and canal workload, these
variables are closely connected by patterns in human activities.
In order to verify if multicolinearity was an issue in the variables selected by the
stepwise regression analyses, I analyzed the Variance Inflation Factors (VIF) for each of
the multiple regression solutions. The VIF is considered to be a reliable estimate of
multicolinearity (Adnan et al. 2006; e.g., Mansfield and Helms 1982). Multicolinearity is
likely an issue with a VIF greater than 10. For the multiple regression analyses in this
project, no independent variable had a VIF score greater than 4.7 and the average VIF
score was 1.7. The low VIF scores indicate that multicolinearity was not a large issue in
the solutions proposed by the multiple regression analyses. In addition, I did not accept
regression solutions with standard errors for the independent variables greater than 0.19.
Although multicolinearity did not affect the multiple regression solutions
presented in this project, it is possible that multicolinearity between some independent
112
variables in certain time periods may have influenced the variable selection during the
initial stepwise procedure. To address this issue, I cross-checked the results of the
multiple regression data with extant archaeological data. I present these data in the results
discussion. By using the multiple regression data as an exploratory method to flesh out
patterns, and by matching these data with other lines of evidence, I reduce issues
associated with possible multicolinearity in the stepwise variable selection.
Limitations of the Regression Analyses
The relatively small sample sizes of sites dated to each time period increase the
overall R2 in the multiple regression analyses and the possibility of over-fitting the
independent variables. Therefore, the statistics on each of the multiple regression models
may indicate that the models explain more of the variation in the dependent variables
than they actually do. The results presented in this dissertation are thus preliminary and
should be reexamined with additional data.
113
CHAPTER 4: MULTIPLE REGRESSION ANALYSES FOR THE SUPPLY AND
DEMAND OF SPECIALIST-PRODUCED RED-ON-BUFF POTTERY
The development of the Phoenix Basin ceramic economy was first encouraged by
demand for specialist-produced pottery in the 8th
and 9th
centuries and then by conditions
that promoted the supply of these wares during the 10th
and 11th
centuries. Consumption
of pottery made by specialists was initially spurred by desire for vessels with particular
aesthetic characteristics. While demand for these types of wares continued into the latter
preClassic, growth of the specialized ceramic economy was principally related to Gila
River specialists increasing production output and distribution of ceramic wares.
The independent variables addressed in this analysis– population density, irrigation
workload, mica density, exterior color value, bowl aperture, bowl-jar ratio, people per
ballcourt, and transport distance for non-local pottery—significantly influenced the supply
and demand (volume, and concentration) of specialist-produced pottery in the preClassic
period. Statistically significant (p(F) < 0.1) coefficients of determination (R2) were achieved
for 8 of the 12 multiple regression models (Appendix C). These coefficients ranged between
0.37 and 0.95. The results indicate that various combinations of the eight independent
variables explained a large percentage of variation in the volume and concentration of
Hohokam decorated pottery in Phoenix Basin assemblages. Estimates provided for each
variable included in the multiple regression models indicate the influence that a particular
variable has on the dependent variable. The estimates provide the basis to evaluate changes to
the factors that most significantly influenced supply and demand for decorated pottery
through time.
114
Supply of Specialist-Produced Decorated Pottery
Hohokam economic development in the Phoenix Basin was mainly encouraged by
conditions that increased the supply of pottery from specialists. Detailed sourcing
analyses of preClassic red-on-buff pottery indicate that Hohokam households received
decorated ceramics manufactured by specialists residing in just a few areas of the
Phoenix Basin (Figure 4.1). The vast majority of decorated pottery used by Phoenix
Basin households throughout the preClassic period was manufactured in the Snaketown
Petrofacies (N) on the middle Gila River. Communities in the Santan-Sacaton Mountain
Petrofacies (generic petrofacies A/B/C/H) also produced a considerable amount of
decorated pottery during the earlier preClassic period. Depending on time period, pottery
from Petrofacies N and Petrofacies A/B/C/H accounted for an average of 63 – 82 percent
of red-on-buff assemblages.10
10
These sourcing analyses focused on pottery with sand temper that could be matched to particular sand
composition groups (petrofacies) across the Phoenix Basin. Sherds that were tempered only with coarse-
grained mica schist (~20 percent of buffware assemblages) were not included in this portion of the study
because they could not be sourced to particular production locales.
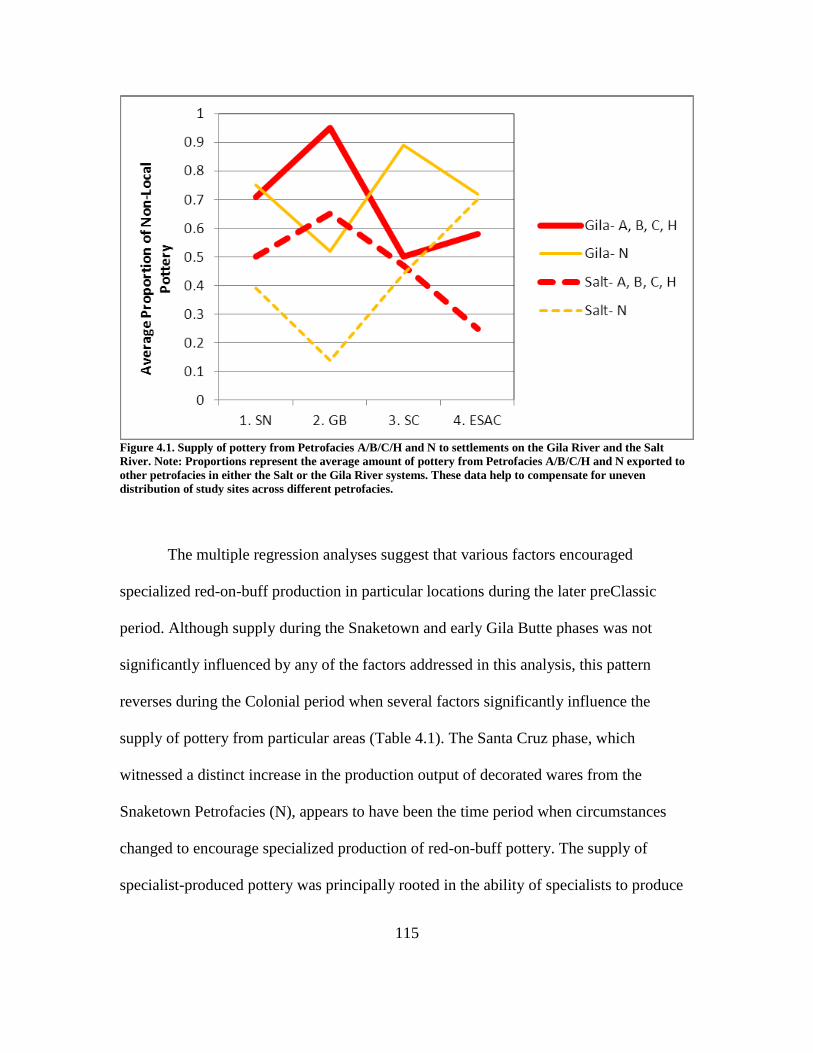
115
Figure 4.1. Supply of pottery from Petrofacies A/B/C/H and N to settlements on the Gila River and the Salt
River. Note: Proportions represent the average amount of pottery from Petrofacies A/B/C/H and N exported to
other petrofacies in either the Salt or the Gila River systems. These data help to compensate for uneven
distribution of study sites across different petrofacies.
The multiple regression analyses suggest that various factors encouraged
specialized red-on-buff production in particular locations during the later preClassic
period. Although supply during the Snaketown and early Gila Butte phases was not
significantly influenced by any of the factors addressed in this analysis, this pattern
reverses during the Colonial period when several factors significantly influence the
supply of pottery from particular areas (Table 4.1). The Santa Cruz phase, which
witnessed a distinct increase in the production output of decorated wares from the
Snaketown Petrofacies (N), appears to have been the time period when circumstances
changed to encourage specialized production of red-on-buff pottery. The supply of
specialist-produced pottery was principally rooted in the ability of specialists to produce
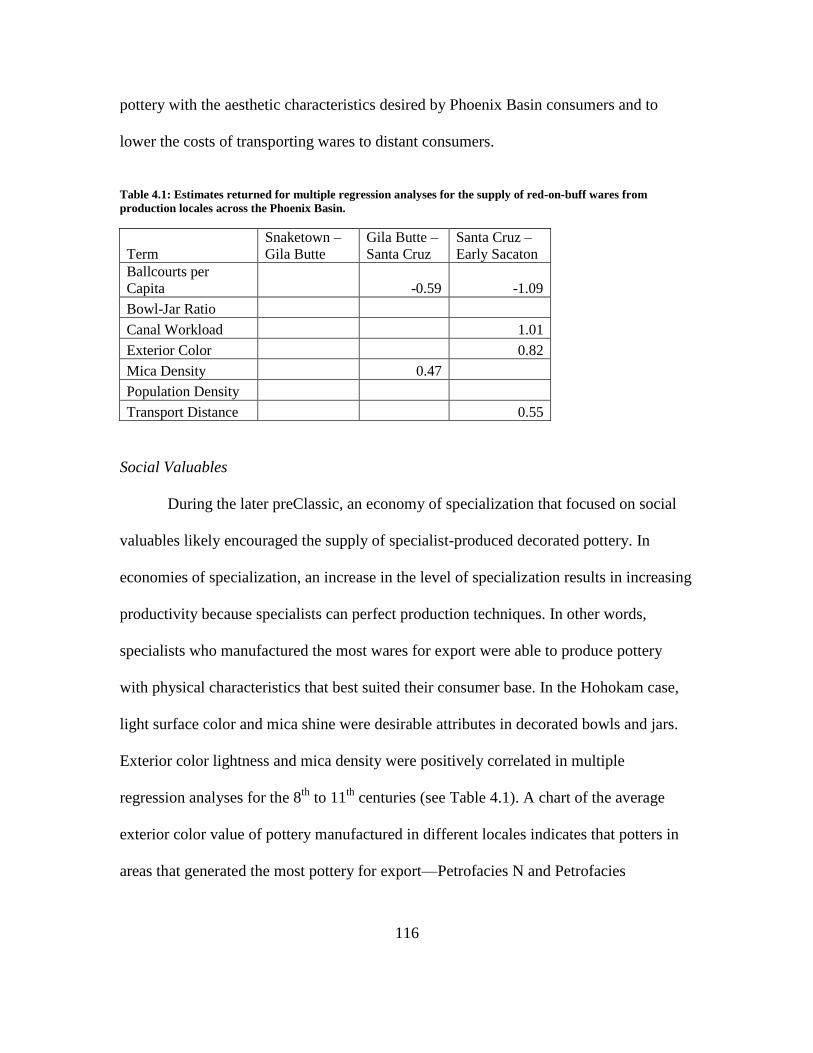
116
pottery with the aesthetic characteristics desired by Phoenix Basin consumers and to
lower the costs of transporting wares to distant consumers.
Table 4.1: Estimates returned for multiple regression analyses for the supply of red-on-buff wares from
production locales across the Phoenix Basin.
Term
Snaketown –
Gila Butte
Gila Butte –
Santa Cruz
Santa Cruz –
Early Sacaton
Ballcourts per
Capita -0.59 -1.09
Bowl-Jar Ratio
Canal Workload 1.01
Exterior Color 0.82
Mica Density 0.47
Population Density
Transport Distance 0.55
Social Valuables
During the later preClassic, an economy of specialization that focused on social
valuables likely encouraged the supply of specialist-produced decorated pottery. In
economies of specialization, an increase in the level of specialization results in increasing
productivity because specialists can perfect production techniques. In other words,
specialists who manufactured the most wares for export were able to produce pottery
with physical characteristics that best suited their consumer base. In the Hohokam case,
light surface color and mica shine were desirable attributes in decorated bowls and jars.
Exterior color lightness and mica density were positively correlated in multiple
regression analyses for the 8th
to 11th
centuries (see Table 4.1). A chart of the average
exterior color value of pottery manufactured in different locales indicates that potters in
areas that generated the most pottery for export—Petrofacies N and Petrofacies
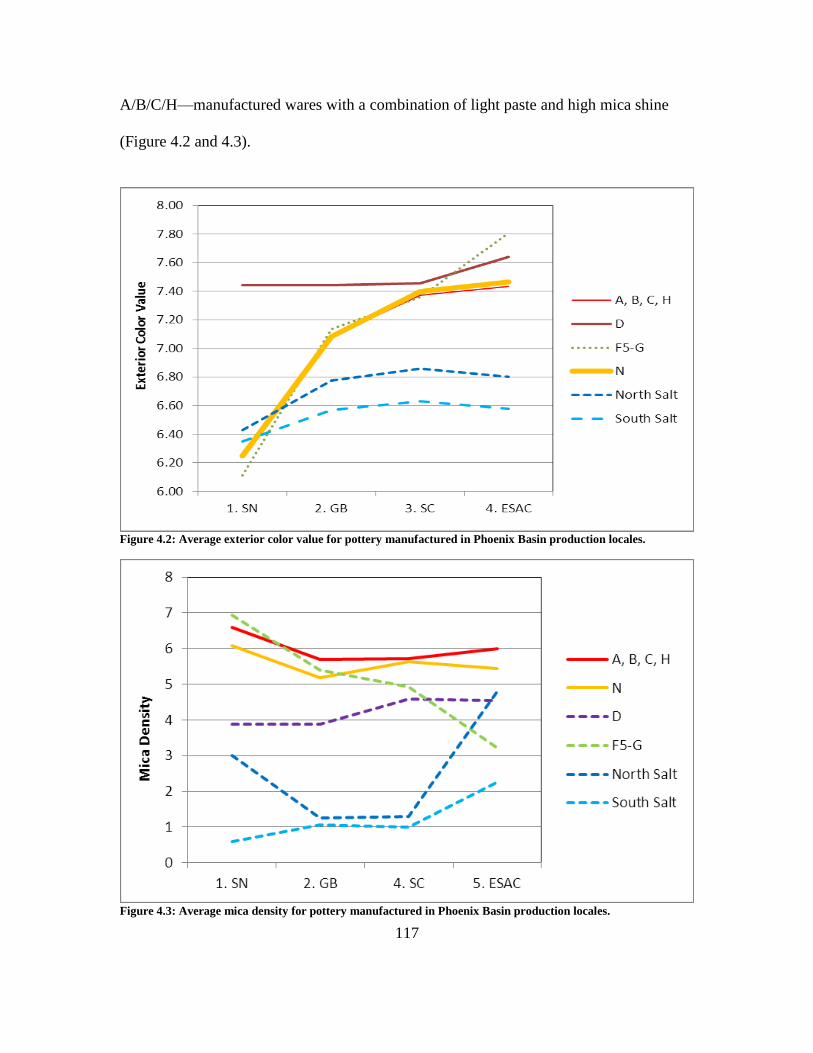
117
A/B/C/H—manufactured wares with a combination of light paste and high mica shine
(Figure 4.2 and 4.3).
Figure 4.2: Average exterior color value for pottery manufactured in Phoenix Basin production locales.
Figure 4.3: Average mica density for pottery manufactured in Phoenix Basin production locales.
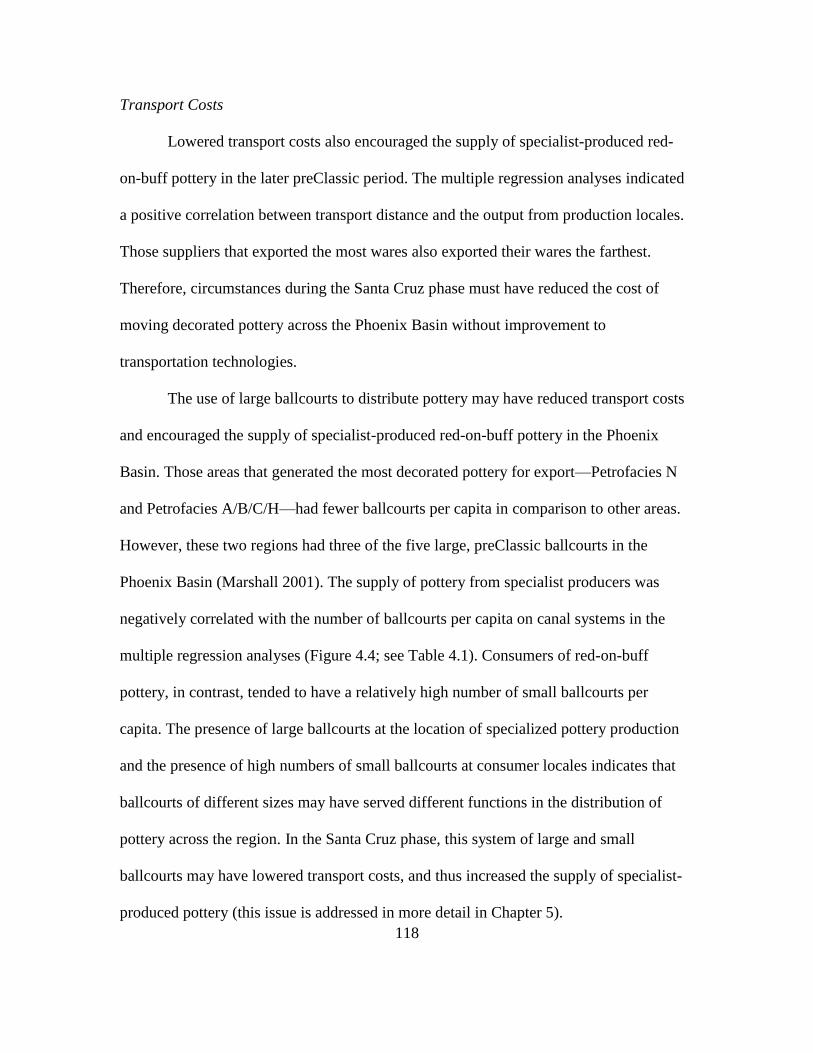
118
Transport Costs
Lowered transport costs also encouraged the supply of specialist-produced red-
on-buff pottery in the later preClassic period. The multiple regression analyses indicated
a positive correlation between transport distance and the output from production locales.
Those suppliers that exported the most wares also exported their wares the farthest.
Therefore, circumstances during the Santa Cruz phase must have reduced the cost of
moving decorated pottery across the Phoenix Basin without improvement to
transportation technologies.
The use of large ballcourts to distribute pottery may have reduced transport costs
and encouraged the supply of specialist-produced red-on-buff pottery in the Phoenix
Basin. Those areas that generated the most decorated pottery for export—Petrofacies N
and Petrofacies A/B/C/H—had fewer ballcourts per capita in comparison to other areas.
However, these two regions had three of the five large, preClassic ballcourts in the
Phoenix Basin (Marshall 2001). The supply of pottery from specialist producers was
negatively correlated with the number of ballcourts per capita on canal systems in the
multiple regression analyses (Figure 4.4; see Table 4.1). Consumers of red-on-buff
pottery, in contrast, tended to have a relatively high number of small ballcourts per
capita. The presence of large ballcourts at the location of specialized pottery production
and the presence of high numbers of small ballcourts at consumer locales indicates that
ballcourts of different sizes may have served different functions in the distribution of
pottery across the region. In the Santa Cruz phase, this system of large and small
ballcourts may have lowered transport costs, and thus increased the supply of specialist-
produced pottery (this issue is addressed in more detail in Chapter 5).
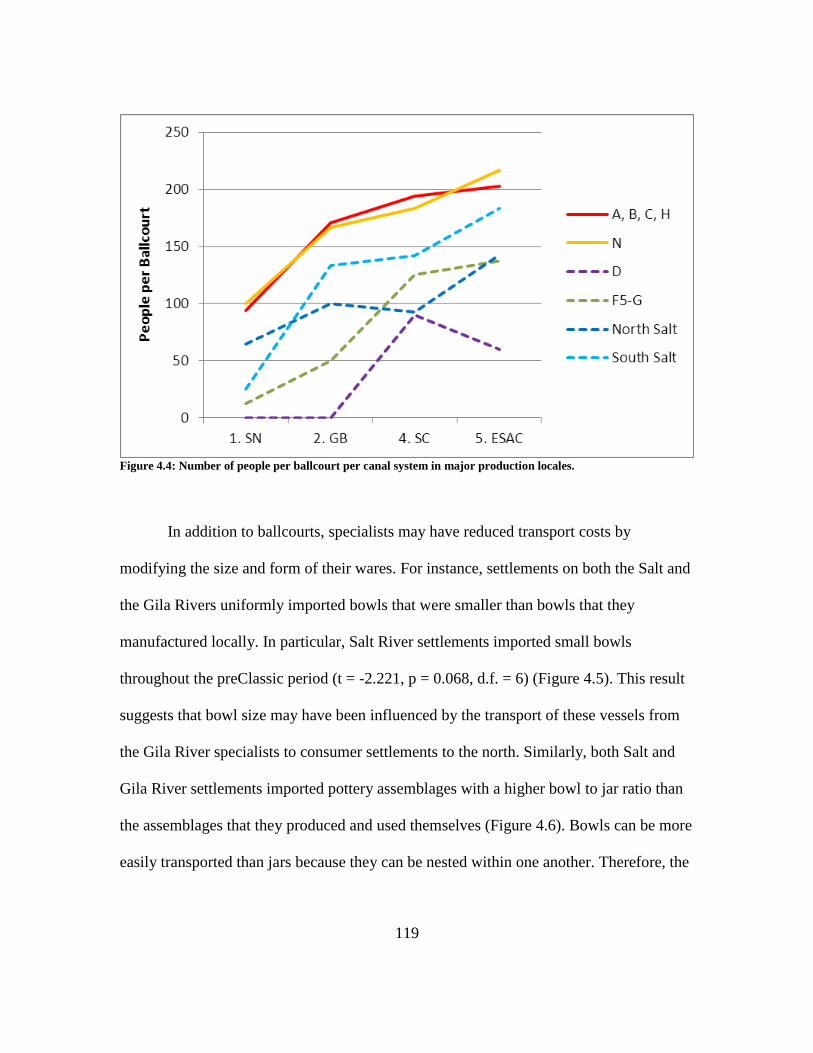
119
Figure 4.4: Number of people per ballcourt per canal system in major production locales.
In addition to ballcourts, specialists may have reduced transport costs by
modifying the size and form of their wares. For instance, settlements on both the Salt and
the Gila Rivers uniformly imported bowls that were smaller than bowls that they
manufactured locally. In particular, Salt River settlements imported small bowls
throughout the preClassic period (t = -2.221, p = 0.068, d.f. = 6) (Figure 4.5). This result
suggests that bowl size may have been influenced by the transport of these vessels from
the Gila River specialists to consumer settlements to the north. Similarly, both Salt and
Gila River settlements imported pottery assemblages with a higher bowl to jar ratio than
the assemblages that they produced and used themselves (Figure 4.6). Bowls can be more
easily transported than jars because they can be nested within one another. Therefore, the
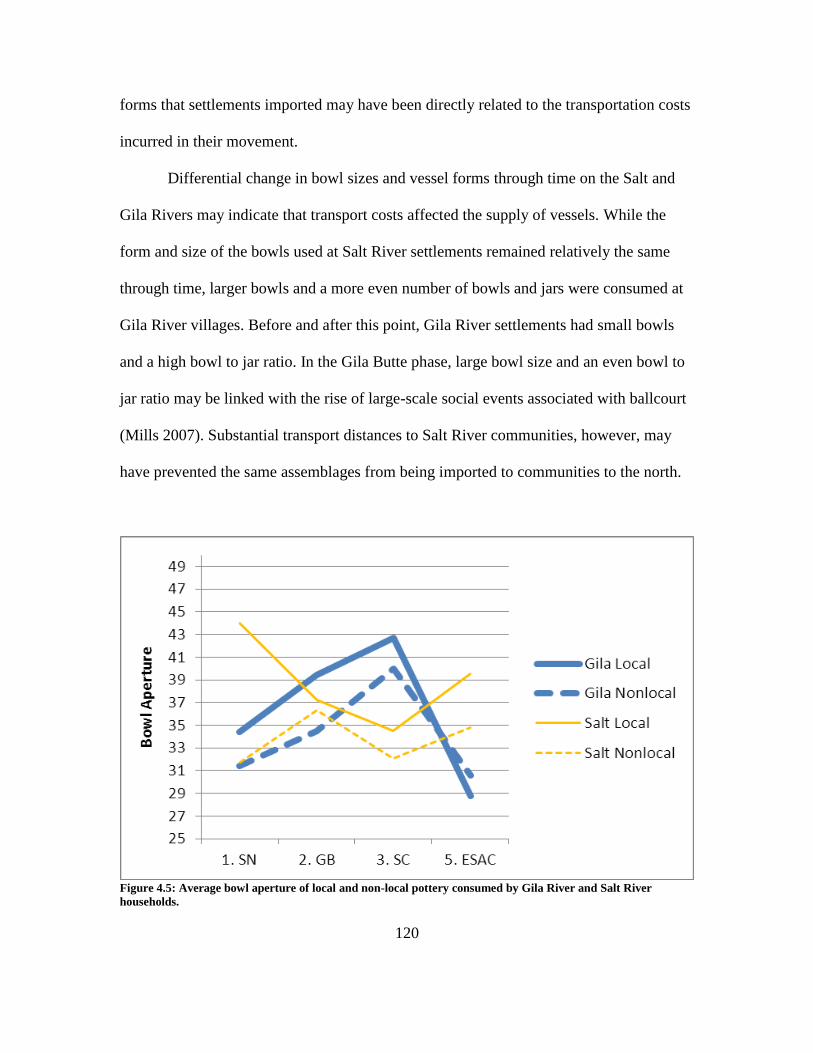
120
forms that settlements imported may have been directly related to the transportation costs
incurred in their movement.
Differential change in bowl sizes and vessel forms through time on the Salt and
Gila Rivers may indicate that transport costs affected the supply of vessels. While the
form and size of the bowls used at Salt River settlements remained relatively the same
through time, larger bowls and a more even number of bowls and jars were consumed at
Gila River villages. Before and after this point, Gila River settlements had small bowls
and a high bowl to jar ratio. In the Gila Butte phase, large bowl size and an even bowl to
jar ratio may be linked with the rise of large-scale social events associated with ballcourt
(Mills 2007). Substantial transport distances to Salt River communities, however, may
have prevented the same assemblages from being imported to communities to the north.
Figure 4.5: Average bowl aperture of local and non-local pottery consumed by Gila River and Salt River
households.
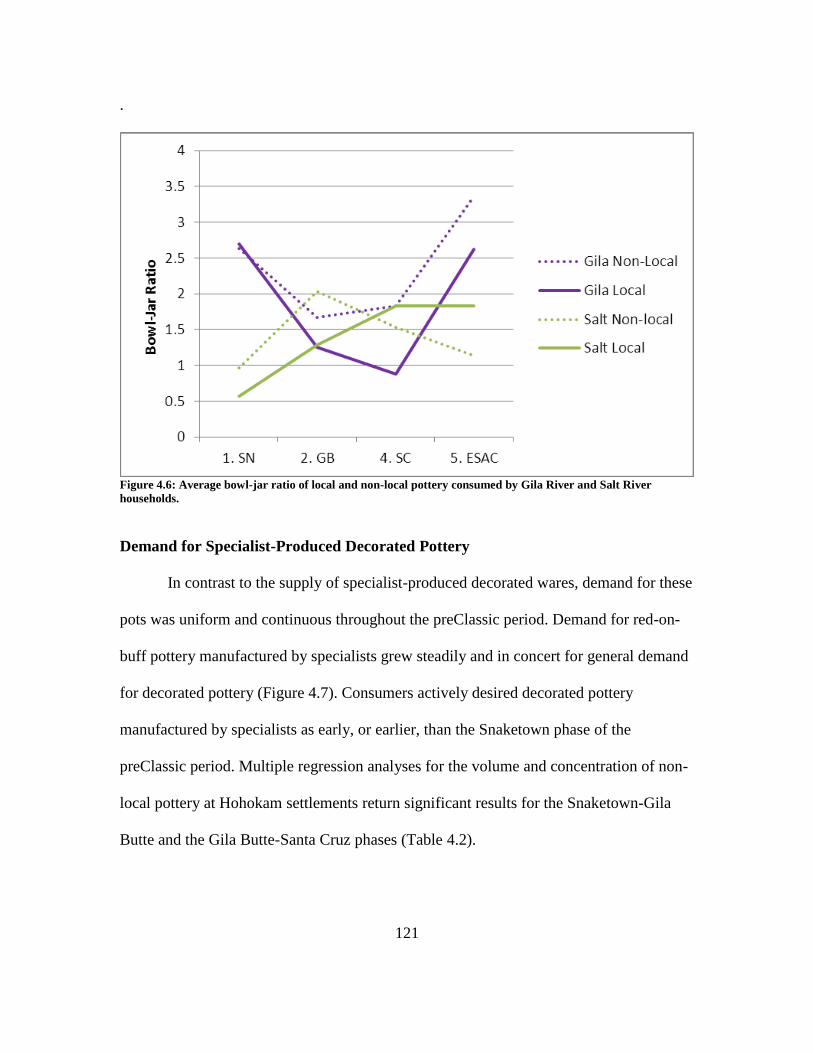
121
.
Figure 4.6: Average bowl-jar ratio of local and non-local pottery consumed by Gila River and Salt River
households.
Demand for Specialist-Produced Decorated Pottery
In contrast to the supply of specialist-produced decorated wares, demand for these
pots was uniform and continuous throughout the preClassic period. Demand for red-on-
buff pottery manufactured by specialists grew steadily and in concert for general demand
for decorated pottery (Figure 4.7). Consumers actively desired decorated pottery
manufactured by specialists as early, or earlier, than the Snaketown phase of the
preClassic period. Multiple regression analyses for the volume and concentration of non-
local pottery at Hohokam settlements return significant results for the Snaketown-Gila
Butte and the Gila Butte-Santa Cruz phases (Table 4.2).
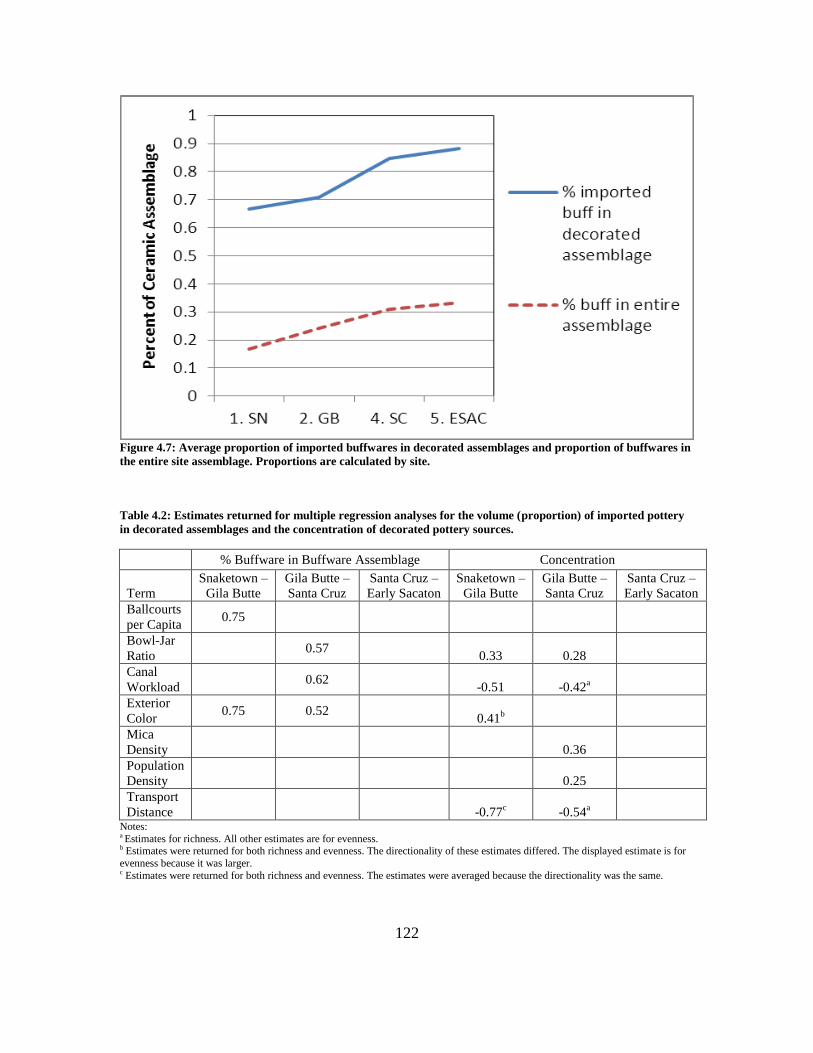
122
Figure 4.7: Average proportion of imported buffwares in decorated assemblages and proportion of buffwares in
the entire site assemblage. Proportions are calculated by site.
Table 4.2: Estimates returned for multiple regression analyses for the volume (proportion) of imported pottery
in decorated assemblages and the concentration of decorated pottery sources.
% Buffware in Buffware Assemblage Concentration
Term
Snaketown –
Gila Butte
Gila Butte –
Santa Cruz
Santa Cruz –
Early Sacaton
Snaketown –
Gila Butte
Gila Butte –
Santa Cruz
Santa Cruz –
Early Sacaton
Ballcourts
per Capita 0.75
Bowl-Jar
Ratio 0.57
0.33 0.28
Canal
Workload 0.62
-0.51 -0.42a
Exterior
Color 0.75 0.52
0.41b
Mica
Density 0.36
Population
Density 0.25
Transport
Distance -0.77c -0.54
a
Notes: a Estimates for richness. All other estimates are for evenness. b Estimates were returned for both richness and evenness. The directionality of these estimates differed. The displayed estimate is for
evenness because it was larger. c Estimates were returned for both richness and evenness. The estimates were averaged because the directionality was the same.
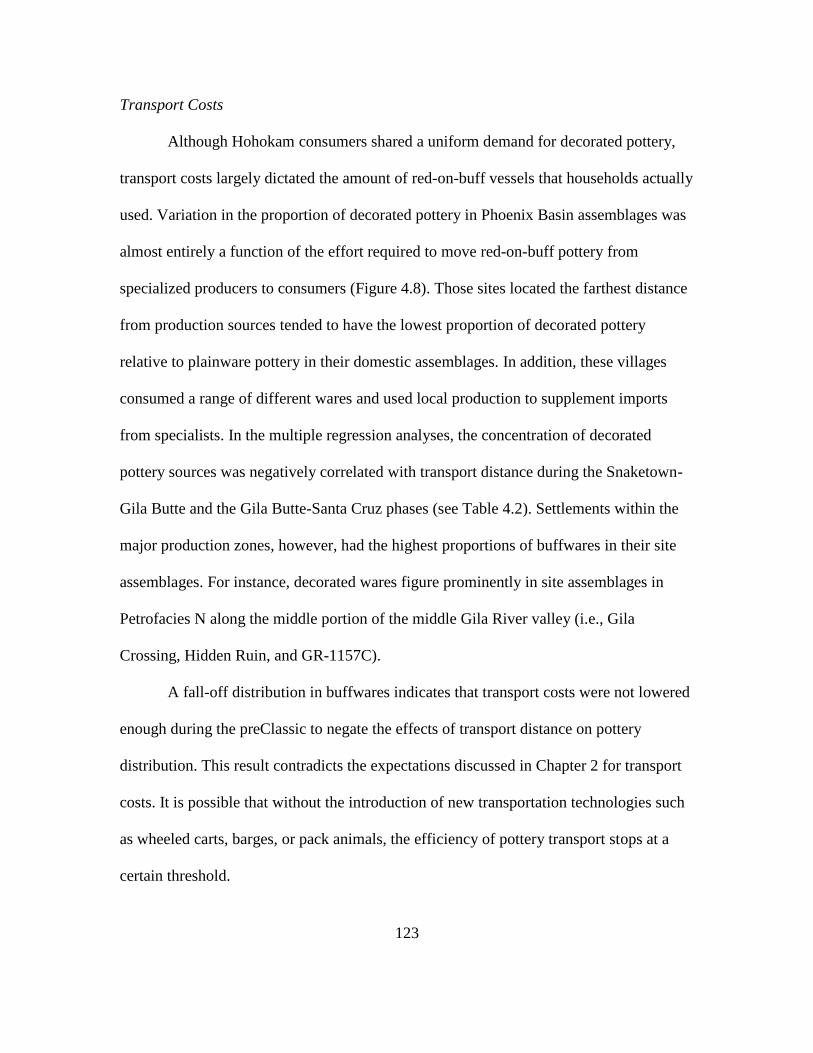
123
Transport Costs
Although Hohokam consumers shared a uniform demand for decorated pottery,
transport costs largely dictated the amount of red-on-buff vessels that households actually
used. Variation in the proportion of decorated pottery in Phoenix Basin assemblages was
almost entirely a function of the effort required to move red-on-buff pottery from
specialized producers to consumers (Figure 4.8). Those sites located the farthest distance
from production sources tended to have the lowest proportion of decorated pottery
relative to plainware pottery in their domestic assemblages. In addition, these villages
consumed a range of different wares and used local production to supplement imports
from specialists. In the multiple regression analyses, the concentration of decorated
pottery sources was negatively correlated with transport distance during the Snaketown-
Gila Butte and the Gila Butte-Santa Cruz phases (see Table 4.2). Settlements within the
major production zones, however, had the highest proportions of buffwares in their site
assemblages. For instance, decorated wares figure prominently in site assemblages in
Petrofacies N along the middle portion of the middle Gila River valley (i.e., Gila
Crossing, Hidden Ruin, and GR-1157C).
A fall-off distribution in buffwares indicates that transport costs were not lowered
enough during the preClassic to negate the effects of transport distance on pottery
distribution. This result contradicts the expectations discussed in Chapter 2 for transport
costs. It is possible that without the introduction of new transportation technologies such
as wheeled carts, barges, or pack animals, the efficiency of pottery transport stops at a
certain threshold.
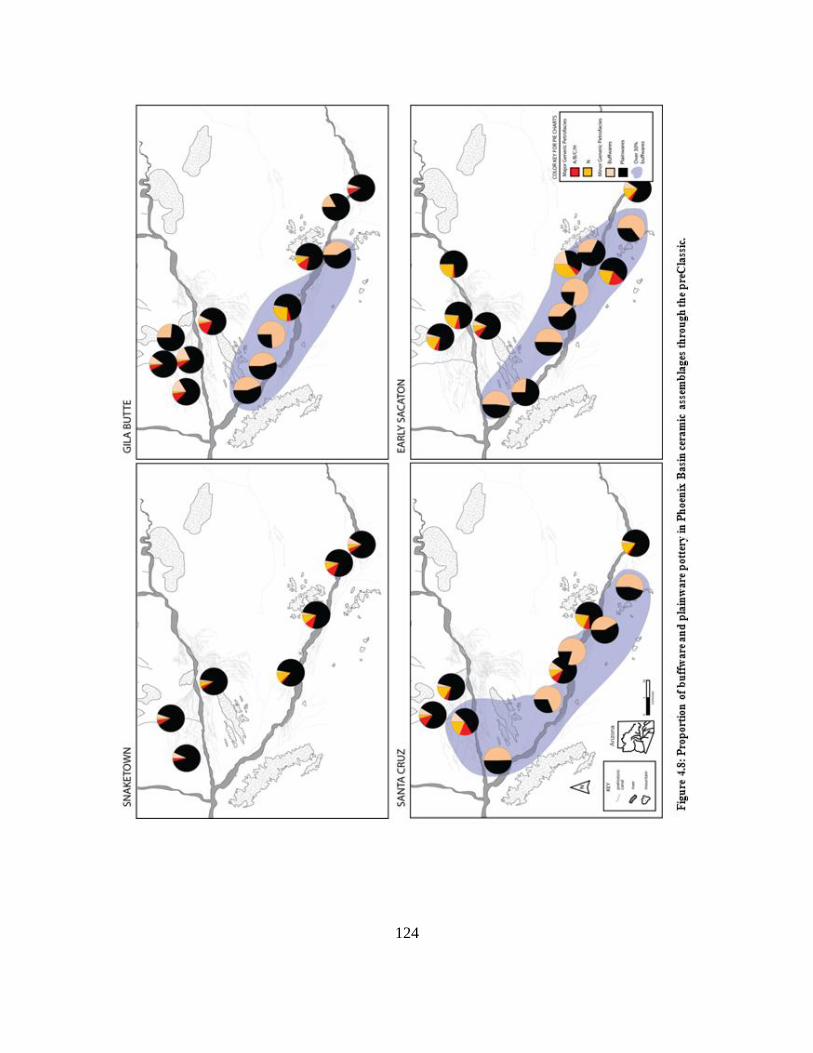
124
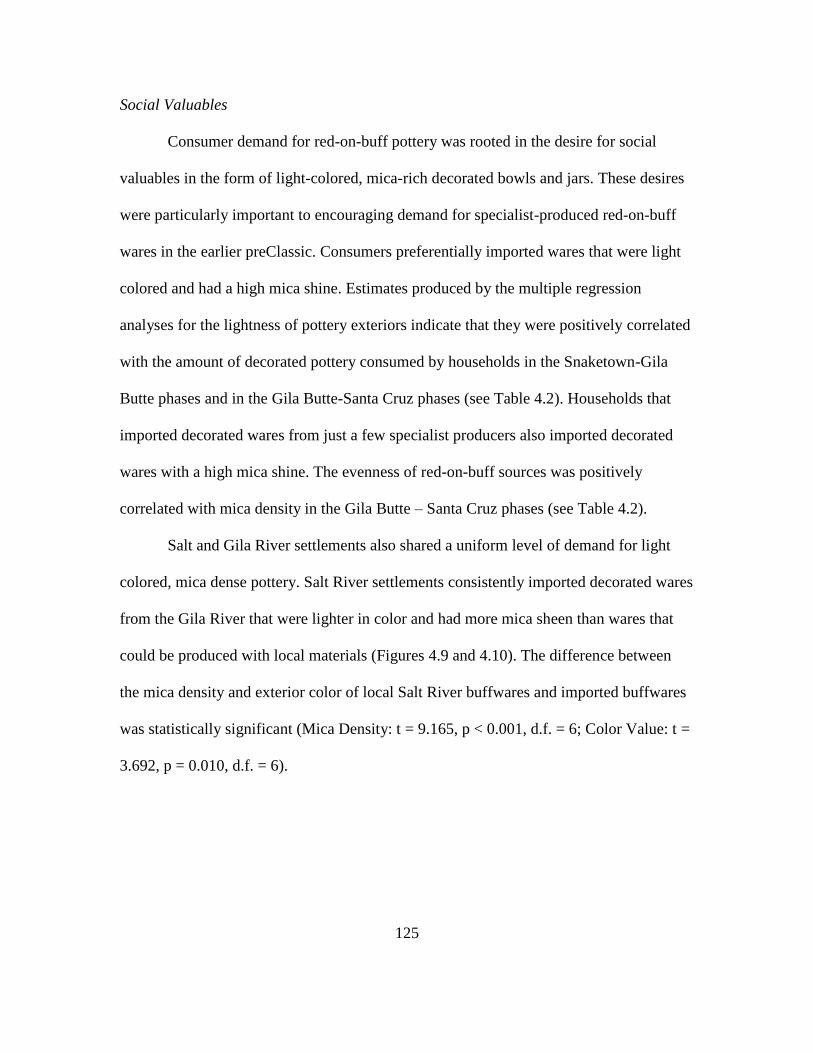
125
Social Valuables
Consumer demand for red-on-buff pottery was rooted in the desire for social
valuables in the form of light-colored, mica-rich decorated bowls and jars. These desires
were particularly important to encouraging demand for specialist-produced red-on-buff
wares in the earlier preClassic. Consumers preferentially imported wares that were light
colored and had a high mica shine. Estimates produced by the multiple regression
analyses for the lightness of pottery exteriors indicate that they were positively correlated
with the amount of decorated pottery consumed by households in the Snaketown-Gila
Butte phases and in the Gila Butte-Santa Cruz phases (see Table 4.2). Households that
imported decorated wares from just a few specialist producers also imported decorated
wares with a high mica shine. The evenness of red-on-buff sources was positively
correlated with mica density in the Gila Butte – Santa Cruz phases (see Table 4.2).
Salt and Gila River settlements also shared a uniform level of demand for light
colored, mica dense pottery. Salt River settlements consistently imported decorated wares
from the Gila River that were lighter in color and had more mica sheen than wares that
could be produced with local materials (Figures 4.9 and 4.10). The difference between
the mica density and exterior color of local Salt River buffwares and imported buffwares
was statistically significant (Mica Density: t = 9.165, p < 0.001, d.f. = 6; Color Value: t =
3.692, p = 0.010, d.f. = 6).
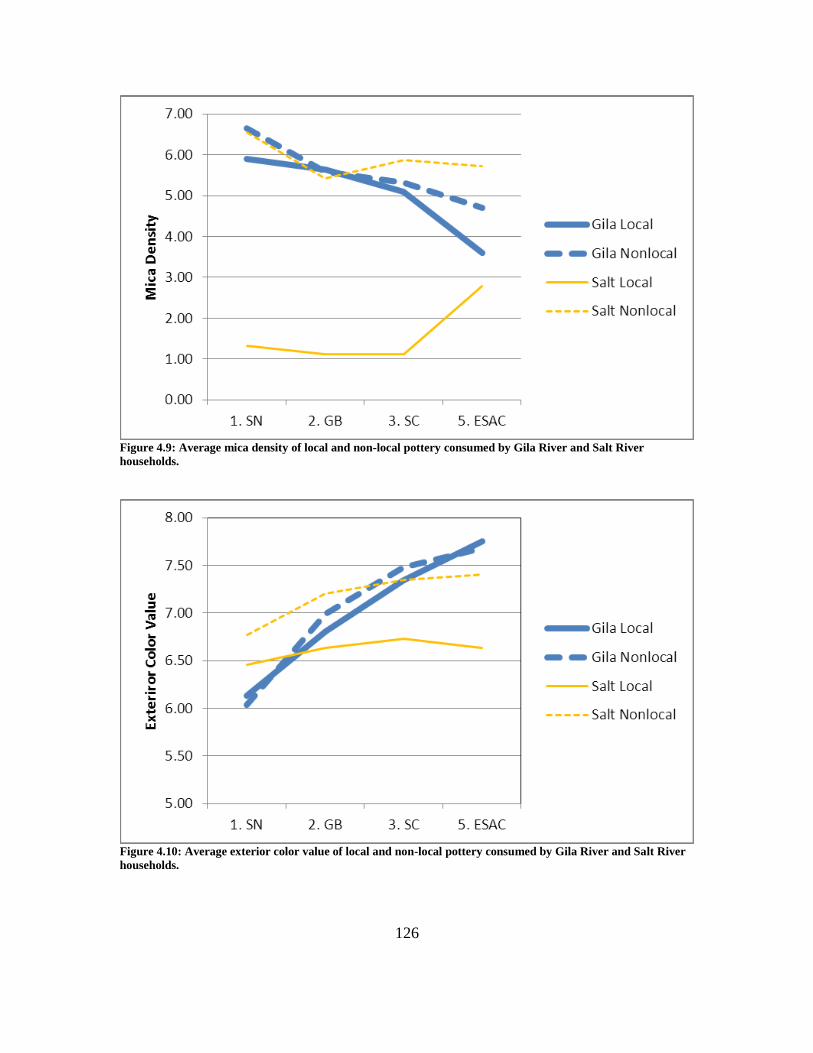
126
Figure 4.9: Average mica density of local and non-local pottery consumed by Gila River and Salt River
households.
Figure 4.10: Average exterior color value of local and non-local pottery consumed by Gila River and Salt River
households.
127
Rising Supply Meets Enduring Demand
Data generated by the multiple regression analyses suggest that demand existed
for specialized red-on-buff production from a very early point in the preClassic period.
Thus, economic development in the Phoenix Basin can be attributed to conditions in the
9th
century that allowed or encouraged specialized suppliers to meet regional demands for
their products. Most importantly, specialist producers were able to reduce the transport
costs of moving pottery across long distances. Here, I have proposed that large ballcourts
may have played an influential role in facilitating the transfer of pottery across the region
in the Santa Cruz phase onwards (after Abbott et al. 2007a; Lack 2013). Specialists also
adapted the forms and shapes of their wares to reduce the cost of moving pottery over
long distances.
Demand and the Social Functions of Red-on-buff Pottery
Widespread and continuous demand for red-on-buff pottery made by specialists is
ultimately rooted in the functional and social uses of red-on-buff pottery. Household
ceramic assemblages in almost every prehistoric archaeological culture in the American
Southwest were generally divided between undecorated (or sparsely decorated) utility
wares and decorated vessels. These two pottery types fall into different functional classes.
Utility wares tend to be coarser and were fashioned into shapes such as cooking pots and
storage jars that reflect basic practical purposes. In general, demand for utilitarian pottery
is based almost entirely on the suitability of the wares to specific tasks (Balfet 1981:259;
Birmingham 1975; Nicholson and Patterson 1992:42). Researchers working in the
Hohokam culture area (e.g., Van Keuren et al. 1997) and elsewhere in the American
128
Southwest (e.g., Blinman 1993:15-16) also contend that demand for plainware vessels
was likely rooted in their real or perceived functionality. Strength tests of Hohokam
decorated and plainware pottery indicate that the plainware fabric was more resilient to
breakage than decorated red-on-buff pottery (Beck 2002)
In contrast to plainware pottery, decorated pottery was associated with serving,
eating, and other activities in which ceramic vessels were readily visible. Decorations on
publicly visible vessels suggest that pottery aesthetics were important in social contexts.
The social function of pottery is only loosely associated with the functions that a pot
performs. For instance, while unpainted pottery is sometimes used for cooking,
ethnographic data suggests that painted pottery was almost never used over a direct flame
(Plog 1980b:85). Direct or close contact with heat can blister and obscure paint, damage
that would negate the purpose of the design. Therefore, the social function(s) of pottery
define how ceramic vessels are used irrespective of whether or not the pot can perform a
particular task.
The anthropological literature is replete with analyses directed at why people
decorate pottery. As Braun notes (1991:362), “There are no cross-culturally consistent
reasons why people vary in the extent to which they decorate utilitarian household
objects.” The predominant explanation for decoration is that it conveys social or even
ideological information to people. In terms of different classes of material culture,
decoration on pottery is an efficient way to convey social information because it is high
impact and bears a relatively low cost. Since pottery manufacture is a multi-step process,
decoration can be added at various stages of the production sequence. Additionally, most
decorative treatments do not represent a large additional time investment in comparison
129
to the time required to fashion and fire ceramic vessels (Arnold 1985; Braun 1991;
Feinman et al. 1981; Rice 1987; Rye 1981). Finally, domestic pottery are suitable for
signaling various messages because these vessels are highly visible and ubiquitously
present in household contexts (Braun 1991:367). Decoration on pottery, therefore, is an
effective way to convey information.
Decoration on domestic vessels can signal the tone, importance, etiquette, and
rules of social settings in which these vessels are used. In cases where people may be
unclear as to the social expectations of a particular gathering, decoration on vessels and
the use of these vessels may signal the appropriate response (DeBoer and Moore 1982;
Douglas 1970; Gluckman 1962; Hodder 1982; Roe 1980; Wobst 1977). Decoration can
also reflect ideological, religious or spiritual themes (Boas 1966:32, 159-161; Braun
1991:366). For instance, David and his colleagues (1988) argue for a metaphorical
association between ceramic decoration and body adornment in Mafa and Bulahay
ceramic traditions in northern Cameroon. Finally, decoration can serve as a means to
mark and maintain social boundaries (Carr and Neitzel 1995; Hegmon 1992; Hegmon
1998; Rice 1996:148-153; Stark et al. 1998; 2000).
Ethnographic and archaeological information from the American Southwest
indicate that decorated pottery served a variety of social functions that differed from the
use of plainware pottery. For instance, decorated pottery may have been associated with
both household and supra-household social gatherings (Crown 1994; Mills 1999; Potter
and Ortman 2004; Van Keuren 2004). The more frequent movement of decorated or
burnished bowls across the landscape in comparison to plainwares suggests that these
wares may be linked with exchanges and ritual preparations associated with large ritual
130
events and public ceremonies (Abbott 1996; 2000; Graves and Spielmann 2000; Huntley
2008; Mills 1999:104; 2000b:308; Spielmann 1998b; 2004). In particular, large bowls for
both the display and the serving of food are prominent features in communal feasts (Mills
2007).
Demand for decorated red-on-buff pottery in the Hohokam region was likely
rooted in the social functions that these pots performed. As domestic items in every
Hohokam household across the Phoenix Basin, red-on-buff pottery was not restricted in
its use to particular areas or groups of people. Decorated vessels were likely used in
everyday contexts as food dishes, serving wares, and storage jars. However, the use of
red-on-buff pottery also signaled participation in pan-Hohokam social and ideological
realms of life. Lack (2013) argues for the arrival of a new ideological system during the
Gila Butte phase that involved the widespread arrival of ballcourts and other ideas from
Mesoamerica to the south (see also Wallace 1994; Wilcox 1991b). In a stylistic analysis
of Hohokam red-on-buff pottery, Lack contends that red-on-buff pottery styles heralded
the arrival of this new way of thinking and promoted the spread of the ideology across the
Hohokam culture region. The data presented here also indicates that light exterior color
and mica shine were also aesthetic attributes that may have been important to the social
function of these wares (Figures 4.9 and 4.10). The consumption of red-on-buff pottery
may have served as a powerful symbol of community participation and consensus during
a time of social change.
The intricate connection between the social function of red-on-buff pottery and
Hohokam ideologies during the preClassic is further evidenced by the precipitous drop in
the production and use of decorated pottery after the collapse of the ballcourt network
131
(Abbott et al. 2007a). When Hohokam ballcourts were suddenly abandoned ca. AD 1070,
concentrated ceramic manufacture and widespread distribution of pottery in the Phoenix
Basin appears to have ceased as well (Abbott et al. 2007a). Lack (2013) argues that the
abandonment of the ballcourts and the drop in decorated buffware vessels signaled
widespread ideological shifts in Hohokam society. As the social and ritual importance of
red-on-buff pottery waned, red-on-buff pottery became a much less prominent part of
Hohokam lifeways, and production was much less concentrated on the landscape (Lack et
al. 2012).
While the social functions of red-on-buff pottery created enduring demand for
these wares in Hohokam households, economic factors dictated the extent to which
Hohokam consumers manufactured their own pottery or relied on specialists for these
wares. The underlying economic conditions that ultimately contributed to long-standing
demand and increasing supply of specialist-produced red-on-buff pottery are likely rooted
in endogenous (interally derived) comparative advantages to specialization of red-on-buff
pottery manufacture. Specialists could manufacture red-on-buff wares more efficiently
and more skillfully than individual household production. The complex paste recipes
required to generate a light-colored paste, for instance, intensified the importance of
learning while doing and emphasized the accumulation of skill and knowledge that
separates the specialist from an occasional potter. Demand for social valuables that
required technical expertise, therefore, created the fundamental conditions for increases
to the supply and the level of specialization in ceramic production.
132
Encouragements to Supply
Although demand for the products of specialized red-on-buff producers was
widespread, the location of manufacturing locales was not. The location of the
Snaketown canal system in Petrofacies N must have offered some type of incentive to
specialized pottery production. Concentrated red-on-buff manufacture on the Gila River
is not surprising given that materials necessary to manufacture decorated wares were
geographically concentrated in the Gila River valley (Abbott 2007). In particular,
hematite used for paint (Fernald 1973; Fontana et al. 1962; Rea 1996; Russell 1975; Spier
1970; Stoeppelmann 1995), mica schist used for temper (Cogswell et al. 2005; Kelly
2012; Miksa 2001b; Ownby et al. 2004; Rafferty 1982; Walsh-Anduze 1993), and
calcareous clays that produced light-colored buffwares (Abbott 1994a; Abbott 2001b;
Beck 2006) were available along the Gila River. Even though Gila River settlements
were located near the materials necessary to manufacture light colored, mica dense
buffwares, these settlements also relied on decorated pottery manufactured by specialists
in the vicinity of Snaketown. For instance, households at Grewe, a large preClassic
village in the eastern portion of the middle Gila River, imported over 70 percent of their
buffwares from the Snaketown area by the early Sacaton phase.
In the following chapter, I explore why the Snaketown area became the
preeminent location for specialized red-on-buff production in the preClassic period. I
investigate the combination of endogenous and exogenous comparative advantages to
specialized production in this area. The results of the analysis indicate that potters in the
Snaketown area capitalized on lowered transport costs through a central geographic

133
location, the distribution of pottery and other items through large ballcourts, and the
social or political importance of the Snaketown community.
134
CHAPTER 5: THE SUPPLY OF DECORATED POTTERY FROM THE
SNAKETOWN COMMUNITY
Following initial consumer demand for light-colored shiny pots, specialized
suppliers of decorated wares provided the major push to economic growth in the Phoenix
Basin economy during the later portion of the preClassic period. Specifically, specialists
working on the Snaketown canal system in Petrofacies N manufactured large numbers of
decorated wares for export to settlements across the region. Production likely occurred at
the community scale and was intertwined with the seasonal cycle of canal maintenance
and subsistence activities.
The impetus for specialized decorated pottery production on the Snaketown canal
system was based on comparative advantages to intensive ceramic manufacture in this
area. I suggest that these comparative advantages are rooted in geographic centrality of
the Snaketown canal system in the Phoenix Basin, the local availability of materials
necessary to make light-colored shiny pottery, and the importance of the Snaketown
canal system as a social, ritual, or political center in the Phoenix Basin. All of these
factors are likely closely intertwined. For instance, the position of the Snaketown canal
system in the center of the Phoenix Basin would allow it to operate as a communication
or exchange hub between the Salt and Gila River valleys. The geographic centrality of
the Snaketown canal system provides the ideal location for a settlement of social
importance because it could allow people from across the region to convene in this area.
Finally, the location and importance of Snaketown area would have highlighted the
135
production and distribution of social valuables such as decorated pottery. Although
settlements on the Salt River could (and occasionally did) make decorated wares, they
vastly preferred to import light-colored, mica-dense decorated pottery that could only be
made from materials located on the Gila River. Conversely, although Gila River
settlements could have made their own decorated wares, as the materials were locally
available to them, they opted to import pottery from the Snaketown region. The red-on-
buff pottery manufactured in this area may have been linked to the importance of the
activities that took place in the Snaketown area and the ease of exchange from this central
place.
Archaeological excavation, survey, and material science data indicate that the
Snaketown canal system was the primary locus of decorated pottery manufacture. All
direct evidence for red-on-buff production in the Phoenix Basin is located directly on or
adjacent to the Snaketown canal system. Clay mixing basins and possible pit kilns were
uncovered at a Sedentary period courtyard group at Snaketown (Haury 1976:194-197).
Chemical testing of a ball of clay left in the mixing basin determined that it was buff-
firing clay that was presumably intended for red-on-buff ware manufacture (Abbott and
Love 2001:142-144). Archaeologists have also noted the existence of a prehistoric trail
that links the center point of the site of Snaketown to extensive schist outcrops at Gila
Butte. Based on the trail alignment, potters could have traveled regularly back and forth
from their settlements to mine raw schist from Gila Butte for pottery production
(Motsinger 1998). The Gila Butte site, which is located adjacent to Gila Butte near the
headgates of the Snaketown canal system, also revealed evidence for red-on-buff
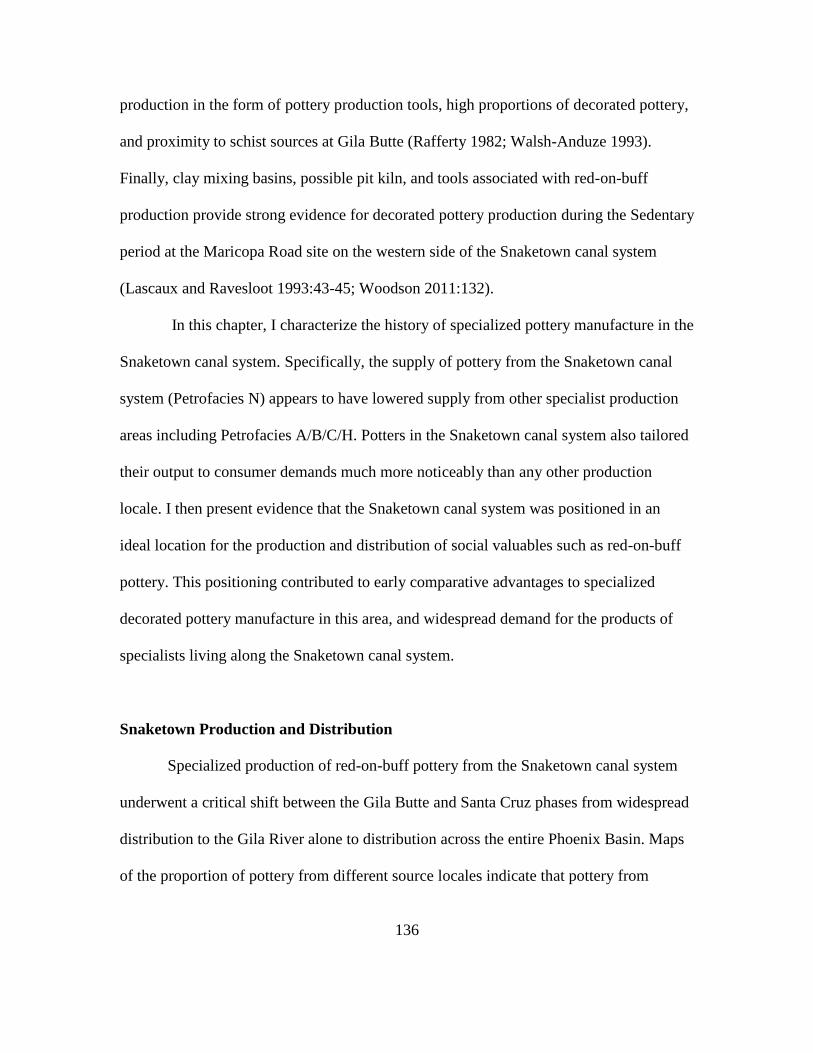
136
production in the form of pottery production tools, high proportions of decorated pottery,
and proximity to schist sources at Gila Butte (Rafferty 1982; Walsh-Anduze 1993).
Finally, clay mixing basins, possible pit kiln, and tools associated with red-on-buff
production provide strong evidence for decorated pottery production during the Sedentary
period at the Maricopa Road site on the western side of the Snaketown canal system
(Lascaux and Ravesloot 1993:43-45; Woodson 2011:132).
In this chapter, I characterize the history of specialized pottery manufacture in the
Snaketown canal system. Specifically, the supply of pottery from the Snaketown canal
system (Petrofacies N) appears to have lowered supply from other specialist production
areas including Petrofacies A/B/C/H. Potters in the Snaketown canal system also tailored
their output to consumer demands much more noticeably than any other production
locale. I then present evidence that the Snaketown canal system was positioned in an
ideal location for the production and distribution of social valuables such as red-on-buff
pottery. This positioning contributed to early comparative advantages to specialized
decorated pottery manufacture in this area, and widespread demand for the products of
specialists living along the Snaketown canal system.
Snaketown Production and Distribution
Specialized production of red-on-buff pottery from the Snaketown canal system
underwent a critical shift between the Gila Butte and Santa Cruz phases from widespread
distribution to the Gila River alone to distribution across the entire Phoenix Basin. Maps
of the proportion of pottery from different source locales indicate that pottery from

137
Petrofacies N consistently dominated site assemblages on the Gila River with the
exception of the Gila Butte phase (Figure 5.1). In contrast, Petrofacies A/B/C/H pottery
was a major component of ceramic assemblages on the Salt River during the earlier
preClassic period. During the Gila Butte phase, the distribution of N retracted
considerably and pottery from Petrofacies A/B/C/H was dominant at all study sites, with
the exception of Snaketown in Petrofacies N. By the Santa Cruz and early Sacaton
phases, however, decorated pottery from Petrofacies N was dominant at almost all sites
with the exception of a few in the Salt River valley.
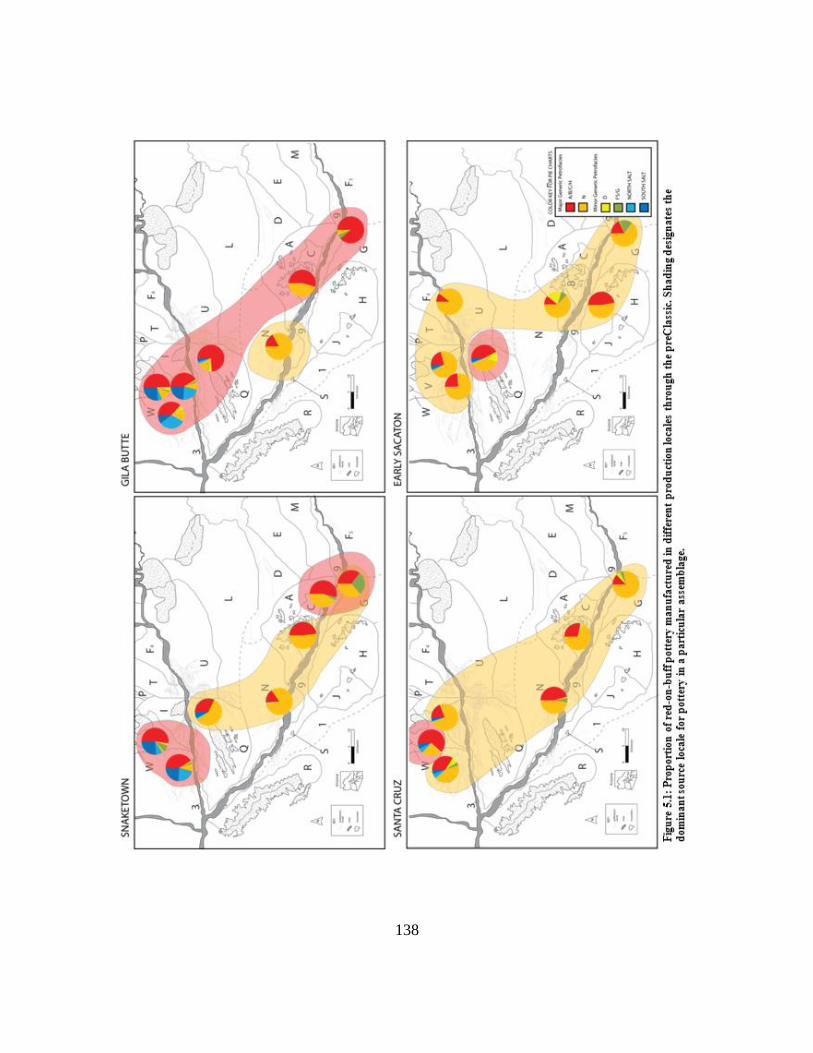
138
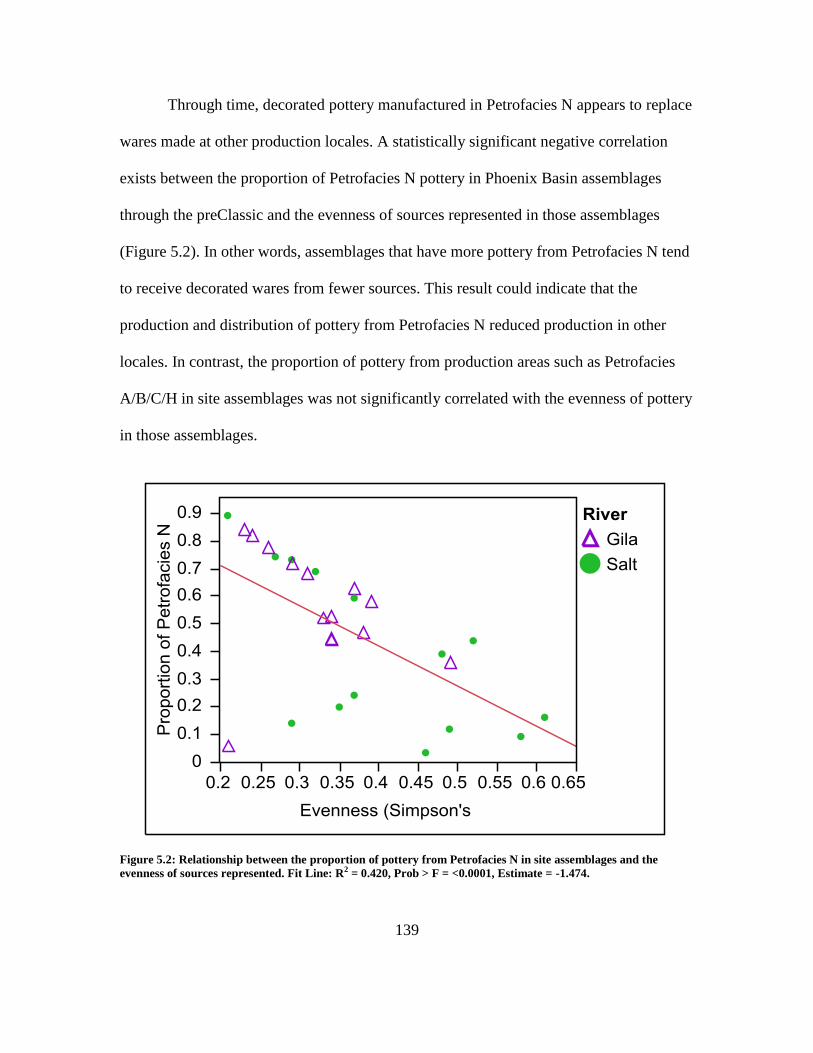
139
Through time, decorated pottery manufactured in Petrofacies N appears to replace
wares made at other production locales. A statistically significant negative correlation
exists between the proportion of Petrofacies N pottery in Phoenix Basin assemblages
through the preClassic and the evenness of sources represented in those assemblages
(Figure 5.2). In other words, assemblages that have more pottery from Petrofacies N tend
to receive decorated wares from fewer sources. This result could indicate that the
production and distribution of pottery from Petrofacies N reduced production in other
locales. In contrast, the proportion of pottery from production areas such as Petrofacies
A/B/C/H in site assemblages was not significantly correlated with the evenness of pottery
in those assemblages.
Figure 5.2: Relationship between the proportion of pottery from Petrofacies N in site assemblages and the
evenness of sources represented. Fit Line: R2 = 0.420, Prob > F = <0.0001, Estimate = -1.474.
140
The supply and demand for pottery produced in Petrofacies N particularly
impacted the supply and demand for pottery from Petrofacies A/B/C/H. With respect to
demand, a statistically significant negative relationship between the proportion of pottery
manufactured in Petrofacies N and Petrofacies A/B/C/H in Phoenix Basin assemblages
was present through time (Figure 5.3). This result suggests that, as demand for
Petrofacies N pottery increased through time, demand for pottery from Petrofacies
A/B/C/H decreased.
Figure 5.3: Proportion of pottery from Petrofacies A/B/C/H and N in Phoenix Basin assemblages. Fit Line: R2 =
0.681, Prob > F = <0.0001, Estimate = -1.076.
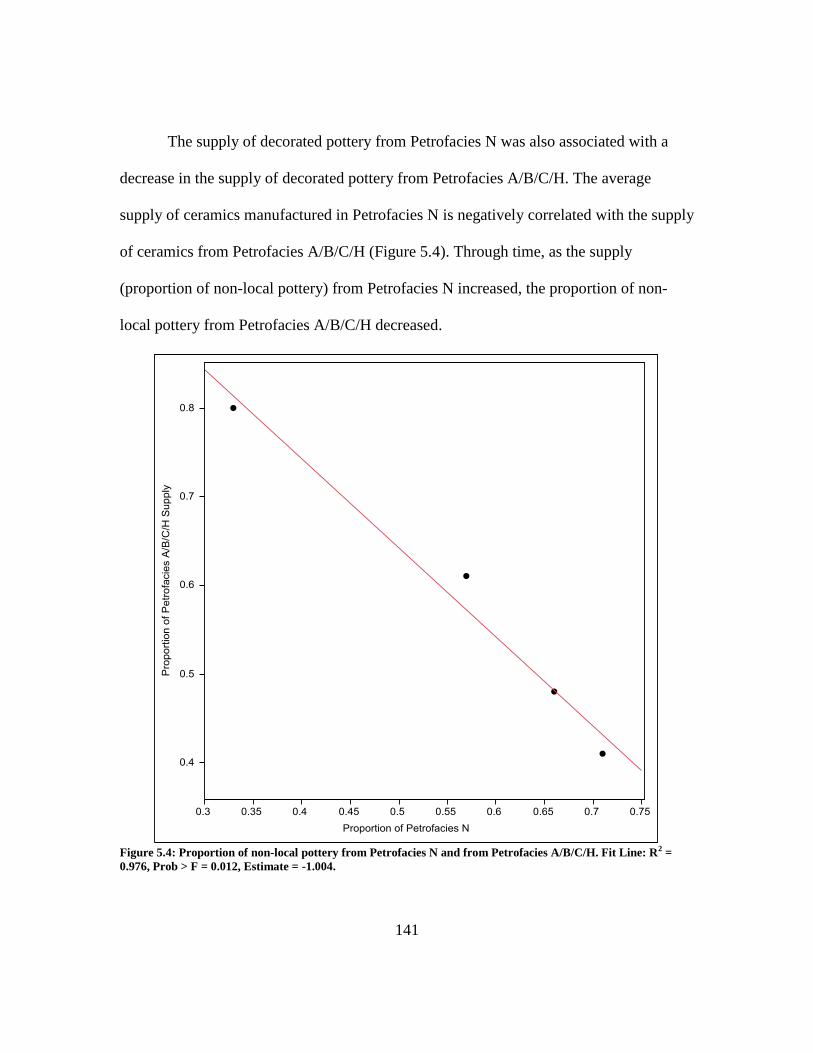
141
The supply of decorated pottery from Petrofacies N was also associated with a
decrease in the supply of decorated pottery from Petrofacies A/B/C/H. The average
supply of ceramics manufactured in Petrofacies N is negatively correlated with the supply
of ceramics from Petrofacies A/B/C/H (Figure 5.4). Through time, as the supply
(proportion of non-local pottery) from Petrofacies N increased, the proportion of non-
local pottery from Petrofacies A/B/C/H decreased.
Figure 5.4: Proportion of non-local pottery from Petrofacies N and from Petrofacies A/B/C/H. Fit Line: R2 =
0.976, Prob > F = 0.012, Estimate = -1.004.
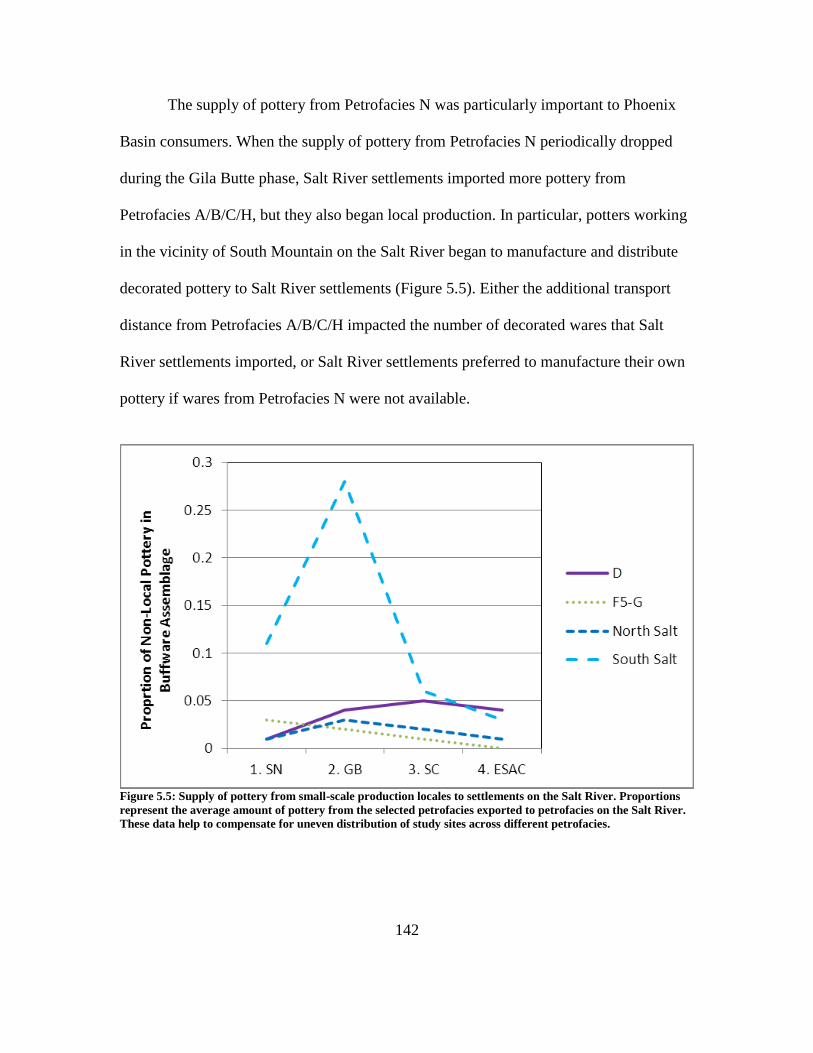
142
The supply of pottery from Petrofacies N was particularly important to Phoenix
Basin consumers. When the supply of pottery from Petrofacies N periodically dropped
during the Gila Butte phase, Salt River settlements imported more pottery from
Petrofacies A/B/C/H, but they also began local production. In particular, potters working
in the vicinity of South Mountain on the Salt River began to manufacture and distribute
decorated pottery to Salt River settlements (Figure 5.5). Either the additional transport
distance from Petrofacies A/B/C/H impacted the number of decorated wares that Salt
River settlements imported, or Salt River settlements preferred to manufacture their own
pottery if wares from Petrofacies N were not available.
Figure 5.5: Supply of pottery from small-scale production locales to settlements on the Salt River. Proportions
represent the average amount of pottery from the selected petrofacies exported to petrofacies on the Salt River.
These data help to compensate for uneven distribution of study sites across different petrofacies.
143
Supply of Petrofacies N Responds to Consumer Demand
Unlike other production locales, specialized pottery producers working within
Petrofacies N may have manufactured wares that would specifically fit the demands of
consumer bases. In the case of vessel form, potters in Petrofacies N appeared to have
exported different proportions of bowls and jars to different areas of the Phoenix Basin.
With the exception of the Gila Butte phase, pottery specialists in Petrofacies N exported a
more even number of bowls and jars to the Salt River than to the Gila River (t = 2.45, p =
0.09, d.f. = 6) (Figure 5.6). This trend continues relatively consistently throughout the
entire preClassic period. A low bowl-jar ratio for exports to the Salt River from Gila
River producers is counterintuitive to what would be expected if transportation costs were
an issue. Bowls can be nested for easy transport. Therefore, the difference in the vessels
exported from Petrofacies N to settlements along the Salt and Gila Rivers suggests that
specialists were catering to the desires (demand) of different populations.
It is possible that, since Gila River settlements were in close proximity to the
materials necessary to manufacture red-on-buff pottery, people at some distance from
production locales opted to manufacture their own jars. Therefore, the vessels they
received from specialists were composed of many more bowls than jars. Salt River
settlements, in contrast, did not have easy access to materials necessary to make light-
colored, mica dense decorated wares. As a result, these settlements appear to have
imported the full complement of decorated wares including both bowls and jars.
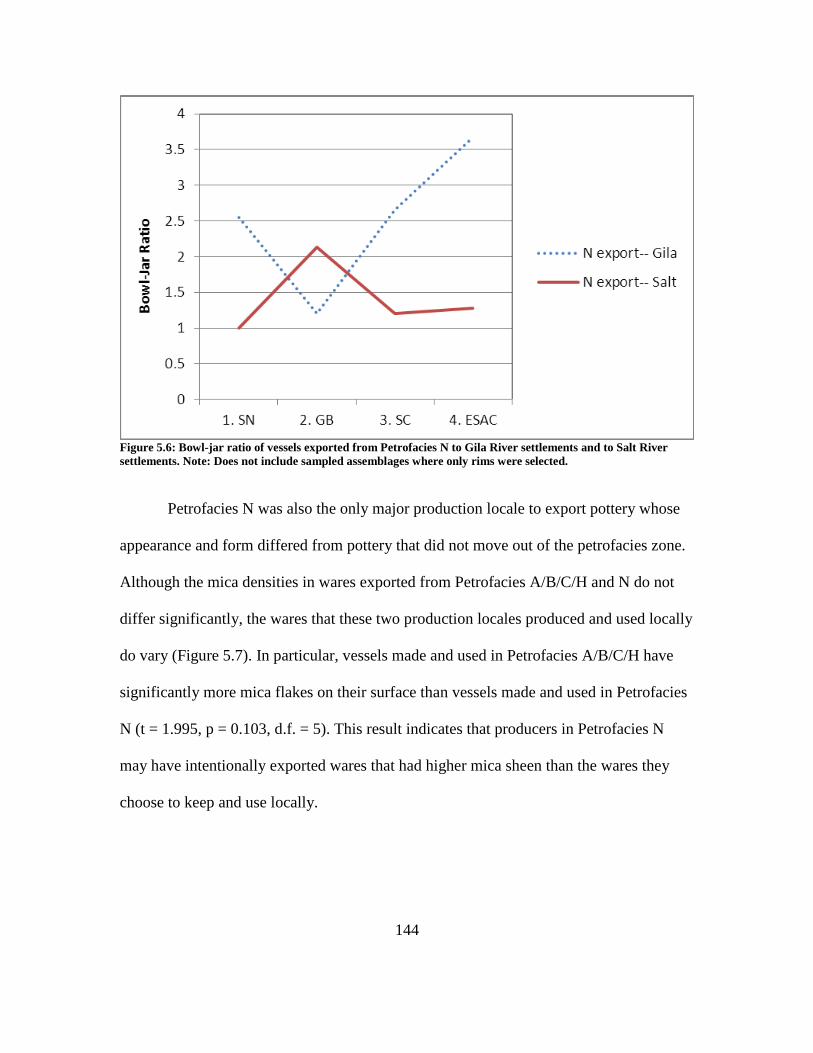
144
Figure 5.6: Bowl-jar ratio of vessels exported from Petrofacies N to Gila River settlements and to Salt River
settlements. Note: Does not include sampled assemblages where only rims were selected.
Petrofacies N was also the only major production locale to export pottery whose
appearance and form differed from pottery that did not move out of the petrofacies zone.
Although the mica densities in wares exported from Petrofacies A/B/C/H and N do not
differ significantly, the wares that these two production locales produced and used locally
do vary (Figure 5.7). In particular, vessels made and used in Petrofacies A/B/C/H have
significantly more mica flakes on their surface than vessels made and used in Petrofacies
N (t = 1.995, p = 0.103, d.f. = 5). This result indicates that producers in Petrofacies N
may have intentionally exported wares that had higher mica sheen than the wares they
choose to keep and use locally.
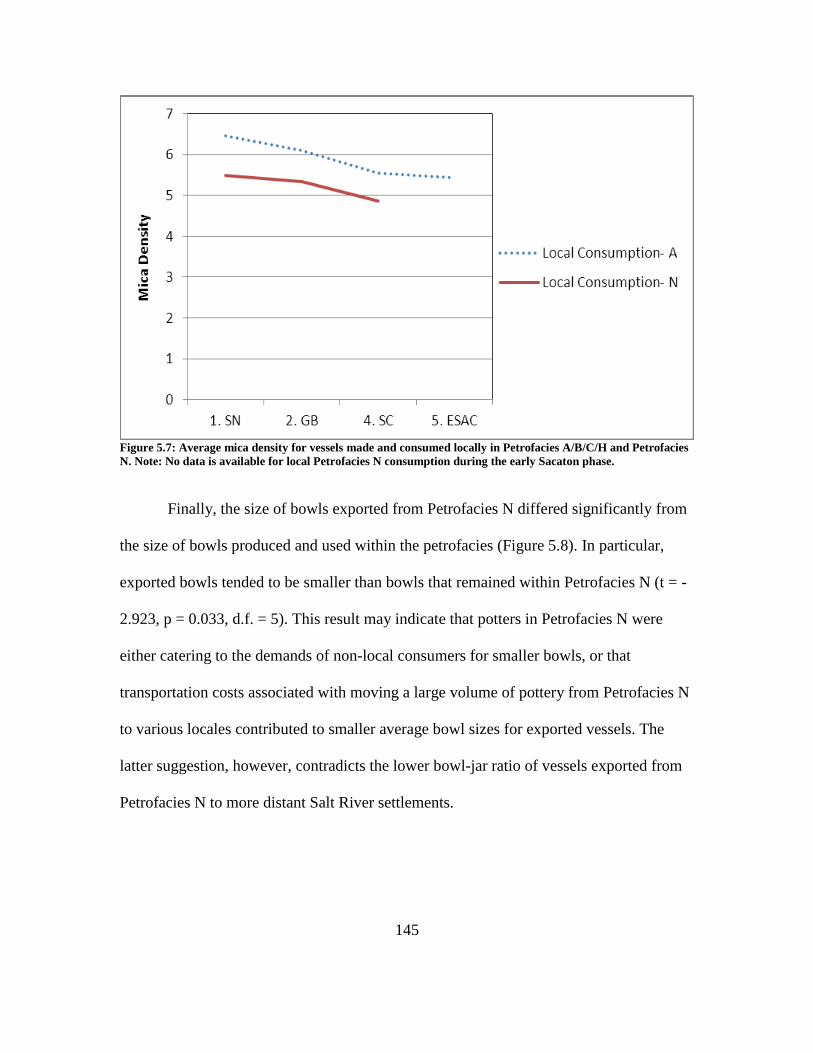
145
Figure 5.7: Average mica density for vessels made and consumed locally in Petrofacies A/B/C/H and Petrofacies
N. Note: No data is available for local Petrofacies N consumption during the early Sacaton phase.
Finally, the size of bowls exported from Petrofacies N differed significantly from
the size of bowls produced and used within the petrofacies (Figure 5.8). In particular,
exported bowls tended to be smaller than bowls that remained within Petrofacies N (t = -
2.923, p = 0.033, d.f. = 5). This result may indicate that potters in Petrofacies N were
either catering to the demands of non-local consumers for smaller bowls, or that
transportation costs associated with moving a large volume of pottery from Petrofacies N
to various locales contributed to smaller average bowl sizes for exported vessels. The
latter suggestion, however, contradicts the lower bowl-jar ratio of vessels exported from
Petrofacies N to more distant Salt River settlements.
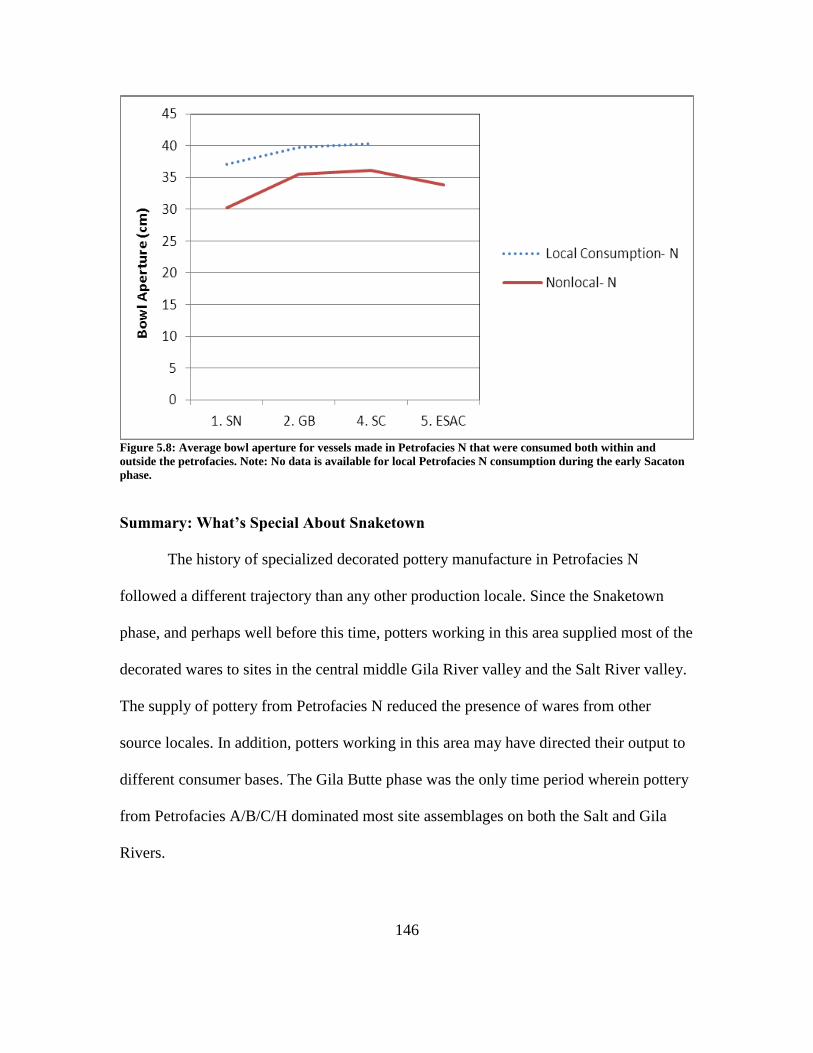
146
Figure 5.8: Average bowl aperture for vessels made in Petrofacies N that were consumed both within and
outside the petrofacies. Note: No data is available for local Petrofacies N consumption during the early Sacaton
phase.
Summary: What’s Special About Snaketown
The history of specialized decorated pottery manufacture in Petrofacies N
followed a different trajectory than any other production locale. Since the Snaketown
phase, and perhaps well before this time, potters working in this area supplied most of the
decorated wares to sites in the central middle Gila River valley and the Salt River valley.
The supply of pottery from Petrofacies N reduced the presence of wares from other
source locales. In addition, potters working in this area may have directed their output to
different consumer bases. The Gila Butte phase was the only time period wherein pottery
from Petrofacies A/B/C/H dominated most site assemblages on both the Salt and Gila
Rivers.
147
Production of Social Valuables
I contend that specialized decorated pottery production was concentrated on the
Snaketown canal system because production in this location was best suited to the
manufacture of social valuables. First, the social and political caché of the Snaketown
community could have heightened the social signaling of decorated pottery manufactured
in this area. The previous chapter argued for a close connection between demand for
Hohokam red-on-buff pottery and the social functions of these vessels in the adoption of
a pan-Hohokam ideological system (after Lack 2013). Archaeological data indicates that
the Snaketown community was at the core of Hohokam social and ideological life. Early
and persistently high population densities, concentrations of ritual items, shell ornament
production, and the construction of among the first ballcourts and platform mounds in the
Phoenix Basin provide convincing evidence that Snaketown was no ordinary Hohokam
settlement (Haury 1976). If demand for red-on-buff pottery was linked to the use of these
vessels as social valuables, specialists at Snaketown would have been well placed to
signal the latest conceptualization of Hohokam ideology.
Second, the role of red-on-buff vessels as social valuables is reinforced by the
attention to the aesthetics of these wares. While economies of specialization are present
in ceramic manufacture, they are particularly key to encouraging specialization in items
like decorated pottery for which aesthetics are important to demand for these items.
Economies of specialization mean that specialists can produce pottery much more
skillfully, efficiently, and at a lower opportunity cost than non-specialists (Borland and
Yang 1994; Yang and Ng 1993; Yang and Ng 1998). When present, economies of
148
specialization in supply encourage reliance (demand) on specialists as long as there are
sufficient mechanisms to distribute wares to potential consumers.
Economies of specialization in the production of Hohokam red-on-buff wares are
rooted in the skills and knowledge necessary to complete relatively complicated
production tasks. In particular, recent research suggests that careful control over buffware
clay chemistries contribute to the light color of the ceramic paste. This process involves
the careful selection and mixing of raw materials as well as the accurate firing of the
wares to a narrow temperature range. Over the course of approximately 100 years, potters
experimented with buffware recipes to obtain light colored wares (Abbott 2007). The
skill necessary to manufacture decorated pottery, therefore, would have contributed to
economies of specialization in ceramic manufacture. Specialists could learn while doing
and could produce greater numbers of vessels and higher quality wares than non-
specialists. The clustering of specialists on the landscape also indicates that learning and
specialist recruitment may have taken place along kinship lines (Costin 1991; 1998;
Habicht-Mauche 1995; Hagstrum 1995; Lindeman 2006; Stark 1991). In these contexts,
knowledge on ceramic manufacturing techniques could be easily transmitted and any
fixed investments in ceramic manufacture would remain within pottery producing
families or communities.
The artistry of decorated wares manufactured at Snaketown increased
concurrently with the dramatic increase in supply from Snaketown potters in the Santa
Cruz phase. Haury (1976:117) notes that “artistic achievements in stone sculpture and
other arts reached their peak of excellence” during the Santa Cruz phase at Snaketown. In
149
particular, he hails “the Santa Cruz Phase potter as the best in the line. Grace in form, and
imagination and skill in composing the painted line, were never exceeded (Haury
1976:210).” Elaboration in painted designs on decorated wares at Snaketown in concert
with increased output of these wares indicates that the use of these pots as social
valuables was closely linked to increases in their supply and demand.
Finally, widespread demand for red-painted, shiny, and light-colored decorated
pottery, which requires materials from localized sources, likely generated exogenous
advantages to specialist production along the Snaketown canal system. Although
settlements on both the Salt and the Gila River could and did manufacture their own
decorated pottery, the buff-firing calcareous clays and mica schist required to produce
light-colored shiny pots were all in close proximity to the Snaketown canal system
(Abbott 2007; Beck 2006; Miksa 2001b; Ownby et al. 2004; Walsh-Anduze 1993).
Hematite sources used to produce the red pigments for Hohokam red-on-buff pottery are
clustered near Tertiary volcanic formations on both sides of the Gila River valley
(Fernald 1973; Fontana et al. 1962; Rea 1996; Russell 1975; Spier 1970; Stoeppelmann
1995). Coarse-grained mica schist was mined from Gila Butte and other bedrock sources
and incorporated within both plain and decorated wares manufactured along the Gila
River (Cogswell et al. 2005; Kelly 2012; Miksa 2001b; Ownby et al. 2004; Rafferty
1982; Walsh-Anduze 1993). Finally, although alluvial clay sources used to manufacture
plainware containers were widely distributed, calcareous clays used to manufacture light-
colored Hohokam pottery were predominantly located along the Gila River (Abbott
1994a; Abbott 2001b; Beck 2006). Recent analyses by Margaret Beck (2012) and her
150
colleagues suggests that sources of buff firing clay were located in only a few areas,
including areas near the Snaketown canal system, and were not ubiquitously distributed
across the Gila River valley.
The spatial concentration of specialized pottery manufacture on the Snaketown
canal system in close proximity to various raw material sources used in red-on-buff
manufacture supports the general argument that potters were often situated in locations
that reduced the transport distance of bulky materials such as clay (Kelly et al. 2011).
Ethnographic and archaeological data suggest that the uneven distribution of resources
used in craft production was an important factor in the location of craft specialists in pre-
modern economies (Arnold 1975; 1985; 1993; Hagstrum 2001; Harry 2005; Muller 1997;
Toll 1991; 2001). Harry’s (2005) analysis of specialized pottery production in the
American Southwest suggests that the location of intensified craft production is strongly
correlated with the distribution of raw materials necessary for pottery manufacture. The
economic advantage of transporting finished craft items instead of raw materials is a
common explanation for the relationship between the distribution of critical raw materials
and specialized production. In the Phoenix Basin, widespread demand for decorated
pottery with a particular appearance coupled with the uneven distribution of raw
materials required for making these pots encouraged a specialist-based economy.
Transport: Central Location
An additional and interrelated exogenous comparative advantage to specialized
pottery production at Snaketown was its central physical, and perhaps, social location in
151
Phoenix Basin Hohokam society. Snaketown is located in center of the middle of the Gila
River. It is also situated on the most direct route between the Gila River and the Salt
River. Although settlements to the west of the Gila River are closer to the Salt, South
Mountain would have blocked direct movement. People could have walked directly
through Canal System 1, through the modern-day city of Ahwatukee, to reach the site of
Snaketown on the Snaketown canal system.
Perhaps due to its central location, Snaketown was among the largest settlements
in the Phoenix Basin both in aerial extent and population size (Craig et al. 2010; Doelle
1995). Population aggregation in this area was noticeable by the Snaketown phase and
the area continued to be occupied throughout the Hohokam preClassic period. Early and
continuous occupation of this location indicates that opportunistic locale might have been
a principal reason for the growth of the Snaketown community. Darling (2009)
documented numerous historic and prehistoric trails that connected the Snaketown area to
other places both within and outside of the Phoenix Basin. People residing in the large
communities surrounding Gila Butte could travel easily to both the Salt and Gila river
valleys.
Lower transportation costs are critical to economic growth because they increase
the incentives for specialized production and demand for the products of specialists
(Arnold 1995; Glaeser and Kohlhase 2003). Reduced exchange costs allow people to rely
on others to provide them with goods. Although technological improvements to
transportation technologies were not evident in the Hohokam case, centralized
positioning of production centers would have dramatically reduced transport costs. The
152
Snaketown canal system may have cut distribution costs to consumers on both the Salt
and Gila Rivers to the point where there was little to no comparative advantage to
specialized decorated pottery manufacture elsewhere.
Transport: Ballcourts
The costs incurred by distributing decorated pottery from Snaketown to villages
throughout the Phoenix Basin may have also been lowered through regularized meetings
at events associated with the ballcourt network. Abbott and his colleagues (Abbott et al.
2007a; Abbott 2010) have argued that periodic marketplaces associated with communal
gatherings at ballcourts could have served as a regular and efficient means to transport
specialist-produced goods across the region. Interestingly, though, the supply of pottery
from specialist producers was negatively correlated with the number of ballcourts per
capita on canal systems (Chapter 4). In particular, the Snaketown canal system has
relatively few ballcourts relative to the number of people on this canal system. This result
may indicate that the absence of many small ballcourts may be less important to regional
trade as the presence of particularly large ballcourts designed for large, inter-community
gatherings. The site of Snaketown has one of five large, preClassic ballcourts in the
Phoenix Basin (Marshall 2001).11
This ballcourt could have accommodated more than a
thousand spectators around its edges (Wilcox et al. 1981; Wilcox and Sternberg 1983). If
the size of the ballcourt is a proxy for the scale of exchanges that took place at the
11
Large ballcourts in the Phoenix Basin include: Las Cremaciones, Snaketown, Casa Blanca, and
Sweetwater. Although a large ballcourt was also constructed at Casa Grande, this ballcourt appears to date
to the late Sedentary/early Classic period.
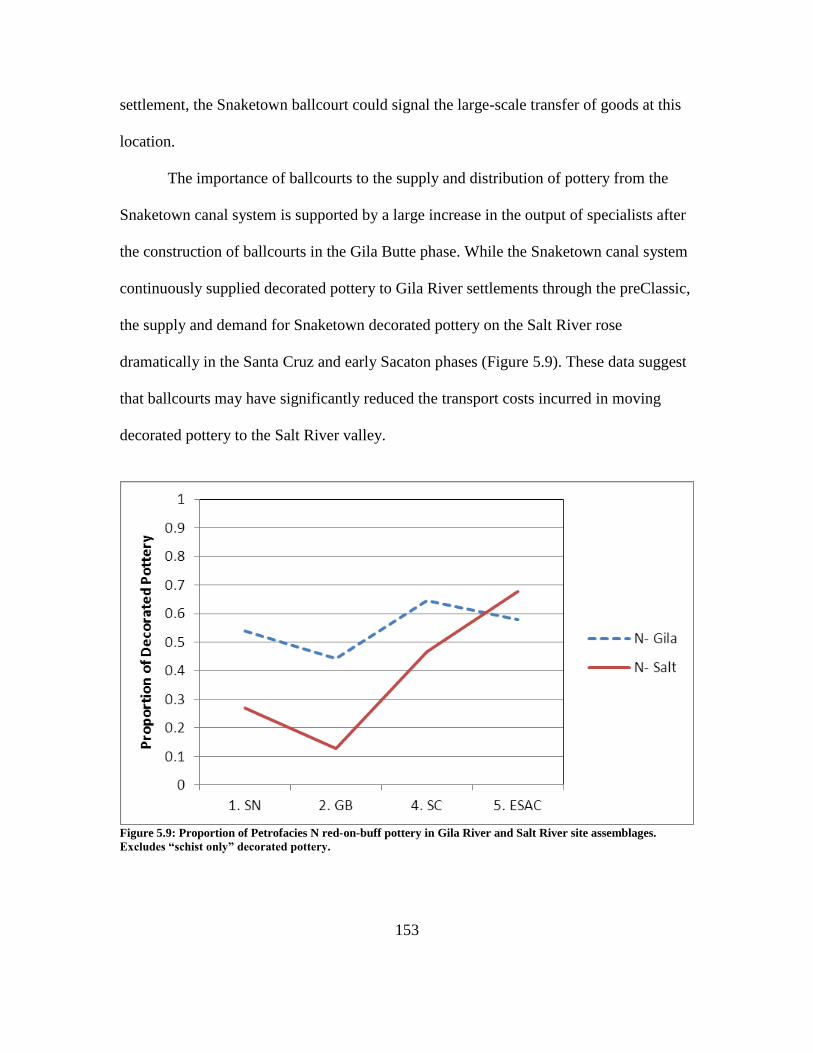
153
settlement, the Snaketown ballcourt could signal the large-scale transfer of goods at this
location.
The importance of ballcourts to the supply and distribution of pottery from the
Snaketown canal system is supported by a large increase in the output of specialists after
the construction of ballcourts in the Gila Butte phase. While the Snaketown canal system
continuously supplied decorated pottery to Gila River settlements through the preClassic,
the supply and demand for Snaketown decorated pottery on the Salt River rose
dramatically in the Santa Cruz and early Sacaton phases (Figure 5.9). These data suggest
that ballcourts may have significantly reduced the transport costs incurred in moving
decorated pottery to the Salt River valley.
Figure 5.9: Proportion of Petrofacies N red-on-buff pottery in Gila River and Salt River site assemblages.
Excludes “schist only” decorated pottery.
154
Summary
Exogenous comparative advantages to specialized production of decorated wares
on the Snaketown canal system are likely linked with geographic proximity to materials
necessary to manufacture social valuables, the social and political importance of the area,
and a centralized position in the region that lowered transport costs in exchanges. Early
and continued settlement in this region indicates that people chose to live in this location
instead of being compelled to do so because of shortage of cultivable land. In addition,
while workloads for the Snaketown canal system were relatively low in comparison to
the large Salt River canal systems 1 and 2, canal workloads were high in comparison to
many other Gila River canal systems. Therefore, irrigation requirements, at least on the
Snaketown canal system, do not seem to have encouraged people to specialize in
decorated pottery production. Dramatically lower transport costs in the Santa Cruz phase,
perhaps due to the advent of large ballcourts in regional distribution, appear to have
provided the impetus for the expansion of the Phoenix Basin economy.
155
CHAPTER 6: SPECIALIZED PRODUCTION OF DECORATED AND
PLAINWARE VESSELS
Specialized decorated pottery production in the Snaketown canal system
accounted for the highest output and widest distribution of any specialist production
location in the Phoenix Basin. By the early Sacaton phase, almost all settlements in the
Phoenix Basin relied on specialists in the Snaketown canal system to supply them with
decorated pottery. Distribution of decorated pottery spanned both the Salt and Gila River
systems. The previous chapters have argued that the production of social valuables and
lowered transport costs allowed Snaketown area potters to capitalize on economies of
specialization in the production of decorated pottery. In other words, specialists in this
area could produce red-on-buff pottery with the aesthetic attributes that consumers
wanted more efficiently than non-specialists. Greater incentives to specialized production
in this region met with existing demand for the products of specialist producers to
encourage the development of the Phoenix Basin economy.
Decorated ceramics, however, are complemented by a large proportion of
plainware pottery in Hohokam household assemblages (See Figures 1.1 and 1.2).
Delineating the conditions that encouraged specialized pottery production in the Phoenix
Basin requires an understanding of both decorated and plainware pottery production. In
this chapter, I argue that some of the factors that influenced the organization of decorated
pottery manufacture in the Phoenix Basin differ slightly from those that influenced the
organization of plainware production. While decorated pottery producers were spatially
156
concentrated and distributed their wares widely, specialized plainware production took
place in several locations in the Phoenix Basin and distribution from these locales was
more limited. For instance, specialist-produced plainwares were less often circulated
between the Salt and Gila River systems. PreClassic plainware producers also
manufactured small amounts of decorated wares when specialized production on the
Snaketown canal system waned during the Gila Butte period (see Figure 5.5).
Specialized Plainware Production in Salt River Valley: Abbott’s Research
The products of Salt River plainware producers were only distributed to
communities in the Salt River valley. To date, there is no indication that plainwares
manufactured on the Salt River were distributed to communities on the middle Gila River
valley. David Abbott (2009) has demonstrated that plainwares used by households on the
Salt River were generally manufactured by specialists on the eastern half of South
Mountain through most of the preClassic period. These specialists began large-scale
output for exchange in the Vahki phase (AD 450-500) and continued supplying
plainwares to settlements on both the north and south sides of the Salt River until the end
of the early Sacaton phase (AD 1020). Potters on the eastern side of South Mountain also
produced small amounts of decorated pottery during the preClassic period. In particular,
production of this pottery increased in the Gila Butte phase when supply of decorated
pots from the Snaketown canal system dropped. Decorated pottery manufacture at South
Mountain never accounted for more than 30 percent of Salt River decorated assemblages.
157
In addition to suppliers at South Mountain, potters using phyllite temper from the
Phoenix Mountains to the north of the Salt River supplied small amounts of plainwares to
nearby settlements that were also on the north side of the river. These producers
manufactured wares for local use at a low level until the middle Sacaton phase when they
increased production to generate most of the plainware jars and bowls used by
settlements to the north of the Salt River (Abbott 2009).
Direct evidence for plainware production on the Salt River valley corresponds to
sourcing data on plainware pottery. On the south side of the Salt River, a kiln feature was
excavated at the site of Las Canopas near the eastern side of South Mountain (Rice et al.
2009). The feature was not datable but appeared to be used during the preClassic when
low to moderate levels of pottery sourced to South Mountain were distributed across Salt
River settlements. In contrast, there is no direct evidence for ceramic production on the
north side of the Salt River before AD 1020.12
The absence of direct evidence for
plainware production on the north side of the river corresponds to low levels of sherds
sourced to this area prior to the middle Sacaton phase. Several clay settling basins
possibly used for plainware pottery manufacture in the middle Sedentary period were
exposed in the vicinity of Las Colinas; the basins dated to a period of time when ceramic
manufacture to the north of the river was higher (Crown et al. 1988; Nials and Fish 1988;
Van Keuren et al. 1997).
12
In the middle Sacaton phase, plainware production on the north side of the Salt River increased. During
this time, several settling basins at Las Colinas may have been used to levigate plainware clay for ceramic
production (Nials and Fish 1988).
158
Specialized Plainware Production in the Gila River Valley
In contrast to the Salt River, plainware pottery specialists on the middle Gila
River supplied plainwares to settlements across the Gila River valley as well as to
settlements on the south side of the Salt River. Through the preClassic period, however,
Salt River settlements received fewer and fewer plainwares from the Gila River. The
number of plainwares imported from the Gila River to the south side of the Salt River
declines from over 40 percent in the middle Pioneer (AD 600-650) to roughly 10 percent
of plainware assemblages during the early Sacaton phase (AD 1000) (Abbott 2009).
Plainware production locales on the middle Gila River valley are not as well-
known as Salt River plainware production locales. As a result, the scale of plainware
production on the middle Gila River is more difficult to estimate. Most plainwares
manufactured on the Gila River were tempered with mica schist exclusively, which
cannot be easily sourced to specific areas like sand temper. The chemical variation in
schist composition has not yet been mapped across the Phoenix Basin. Schist deposits in
southern Arizona (known as the Pinal Schist) also have complicated chemistries that can
often only be separated by trace elements, which are not detectable with standard
characterization techniques (Cogswell et al. 2005; Miksa 2001b; Neff and Dudgeon 2006;
Walsh-Anduze 1993).
Despite set-backs in sourcing plainware pottery on the middle Gila River, current
evidence indicates that specialized plainware production on the middle Gila River valley
was likely concentrated on the Santan, Gila Butte, Sweetwater, and Casa Blanca canal
systems in Petrofacies A and H. Direct evidence for plainware production in this region
159
was recovered in excavations of the Lower Santan site in Petrofacies A on the Santan
canal system. Pottery production tools and a possible pit kiln with plainware waster
sherds indicate that plainware manufacture occurred at the site (Kelly 2011). Just across
the river from the Lower Santan site, evidence for plainware pottery manufacture at the
Sweetwater site during the Classic period indicates that the area continued to manufacture
plainware pottery for exchange (Woodson 2002)
Indirect evidence for specialized plainware production in Petrofacies A and H
consists of large schist deposits with indications of prehistoric schist mining. Specialized
plainware production on the Gila River was characterized by the prevalent use of mica
schist temper that was mined from outcrops along the river valley. Plainwares, even in
comparison with decorated wares, had much more schist than sand temper, and most
plainwares were only manufactured using schist temper. Therefore, specialized plainware
production that relied on large quantities of schist temper was likely located in close
proximity to natural mica schist sources. The most extensive prehistoric schist mines
have been identified on the sides of Gila Butte in Petrofacies A. The identification of
more than 40 schist quarry pits on the butte indicates that thousands of tons of rock were
removed for ceramic production (Rafferty 1982; Walsh-Anduze 1993). Evidence for
prehistoric schist mining is also present at Rattlesnake Hill adjacent to Petrofacies H on
the south side of the Gila River. Eight pits at the base of the hill may represent prehistoric
schist quarries (Burton and Simon 2002; Eiselt and Woodson 2002; Walsh-Anduze
1993). Finally, settlements in Petrofacies A and H have higher proportions of plainware
pottery than prehistoric villages elsewhere on the middle Gila River (see Figure 4.2).
160
Specifically, through many portions of the preClassic period, these settlements had more
plainwares relative to decorated wares than settlements in the Snaketown canal system in
Petrofacies N.
Production of “Schist Only” Decorated and Plain Wares on the Gila River
Despite direct and indirect evidence linking plainware production on the middle
Gila River to Petrofacies A and H, no conclusive argument has yet connected plainware
production to this area. In the following sections, I present additional data that indicates
that almost all “schist-only” Hohokam decorated, and by extension plainware pottery, was
manufactured in Petrofacies A or H. These data allow me to compare the organization of
decorated and plainware production in the Phoenix Basin.
I focus on four lines of evidence that support the argument for concentrated
specialist plainware production in Petrofacies A and H in the middle Gila River valley.
First, I discuss the results of a schist sourcing analysis using Time of Flight-Laser Ablation-
Inductively Coupled Plasma-Mass Spectroscopy (TOF-LA-ICP-MS) that linked the
chemical signature of schist temper in pottery from Petrofacies A/B/C/H with the chemistry
of raw schist samples collected from Gila Butte. Gila Butte is located on the edge of
Petrofacies A and across the Gila River from Petrofacies H. Therefore, potters working in
those sand composition zones would have had the most direct access to the Gila Butte
schist source. Second, I provide evidence that decorated pots manufactured in Petrofacies
A/B/C/H included more schist and less sand than pots produced in other production locales.
As a result, it is likely that “schist-only” wares were manufactured at a production locale
161
where potters used a large proportion of schist temper. Third, I discuss similarities in the
proportion of pottery manufactured in Petrofacies A/B/C/H and the proportion of “schist-
only” sherds in Phoenix Basin assemblages through the preClassic period. I argue that
similar changes to the proportions of pottery manufactured in Petrofacies A/B/C/H and
“schist-only” pots may indicate that they were manufactured in the same place. Finally, I
discuss the close similarities between the technological characteristics of decorated pottery
manufactured in Petrofacies A/B/C/H and “schist-only” wares, and the dissimilarities
between “schist-only” wares and pottery from other petrofacies.
I. TOF-LA-ICP-MS Analyses of Schist
The first piece of evidence that most “schist-only” decorated pottery and, by
extension, most schist-tempered plainware pottery were manufactured in the vicinity of
Gila Butte in Petrofacies A and H is a close chemical match between schist temper in this
area and raw schist from those outcrops. New advances in chemical characterization
techniques have detected consistent variability among different schist outcrops, variation
that can be used to source “schist-only” pottery. Due to extensive mixing over multiple
tectonic episodes, the composition of Pinal Schist outcrops varies substantially across the
region (Miksa 2001a). Thus, the composition of schist outcrops may be unique to defined
geographic areas throughout southern Arizona.
Recent chemical analyses of raw schist samples and schist temper in Hohokam
pottery sherds suggest that chemical sourcing with Inductively Coupled Plasma-Mass
Spectroscopy (ICP-MS) may be able to detect the variation in schist composition. Unlike
162
other elemental characterization methods, such as the electron microprobe, ICP-MS can
measure a large range of elements in concentrations as low as parts per trillion. Walsh-
Anduze’s (1993) analysis of 49 raw schist samples and Miksa’s (2001a; 2001b) analysis of
59 raw samples using ICP-MS identified consistent differences in the chemical
composition of schist outcrops at Gila Butte, Pima Butte, and Sacaton Butte along the
middle Gila River valley. However, the bulk ICP-MS analyses in these cases produced data
that represented a combination of minerals within the raw schist. In addition, ICP-MS
cannot analyze raw schist temper in a ceramic because it cannot target the schist temper
and the ceramic paste separately. As a result, chemical data on raw schist samples and
schist temper cannot be compared at present.
Laser ablation represents a substantial improvement on ICP-MS analysis; it allows
analysts to target a specific spot on a material (LA-ICP-MS). For instance, an analyst can
target a mica grain on a piece of schist, either in a raw sample or a piece of temper. Time of
flight spectroscopy represents the latest advancement in ICP-MS analysis. It
simultaneously measures and standardizes the entire elemental mass spectrum of a targeted
spot on a sample. TOF-ICP-MS can measure the chemical differences between different
schist samples with great sensitivity.
In 2005 and 2006, researchers at the IIRMES laboratory in partnership with
archaeologists from the Cultural Resource Management Program for the Gila River Indian
Community analyzed 56 raw schist samples using TOF-LA-ICP-MS. Chemical readings
were taken on single pieces of muscovite mica within the schist. This analysis was able to
detect consistent chemical differences among muscovite in schist outcrops at Pima Butte,
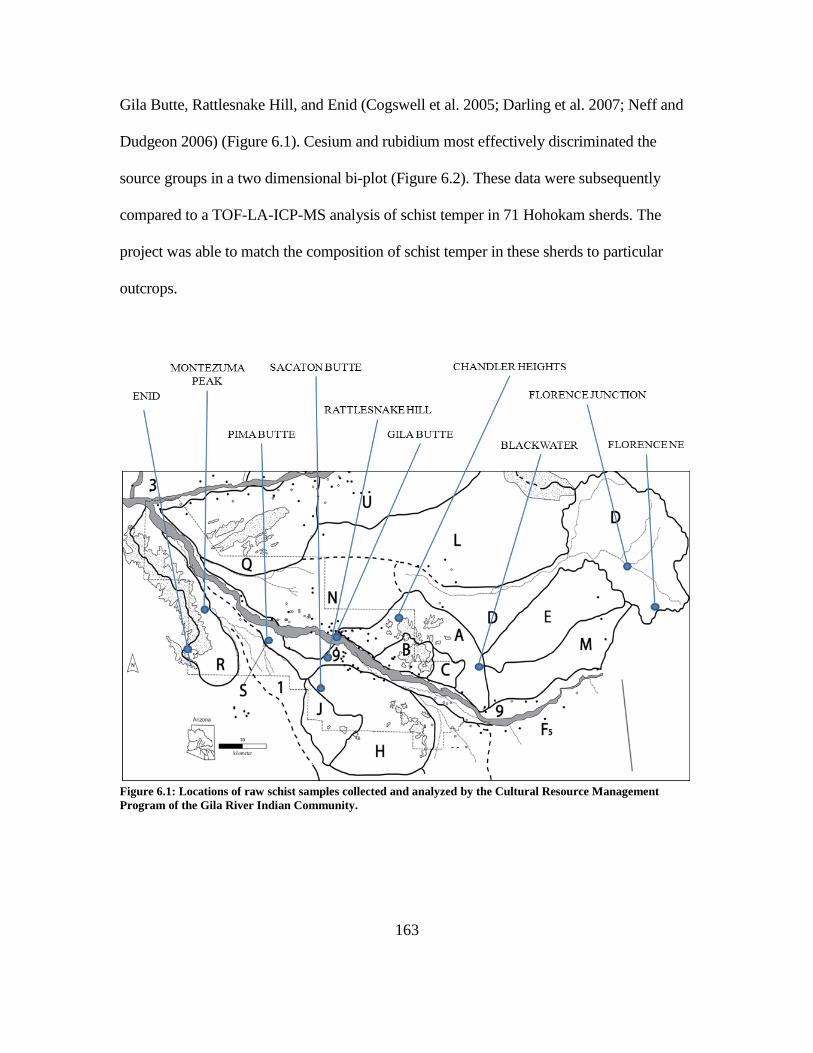
163
Gila Butte, Rattlesnake Hill, and Enid (Cogswell et al. 2005; Darling et al. 2007; Neff and
Dudgeon 2006) (Figure 6.1). Cesium and rubidium most effectively discriminated the
source groups in a two dimensional bi-plot (Figure 6.2). These data were subsequently
compared to a TOF-LA-ICP-MS analysis of schist temper in 71 Hohokam sherds. The
project was able to match the composition of schist temper in these sherds to particular
outcrops.
Figure 6.1: Locations of raw schist samples collected and analyzed by the Cultural Resource Management
Program of the Gila River Indian Community.
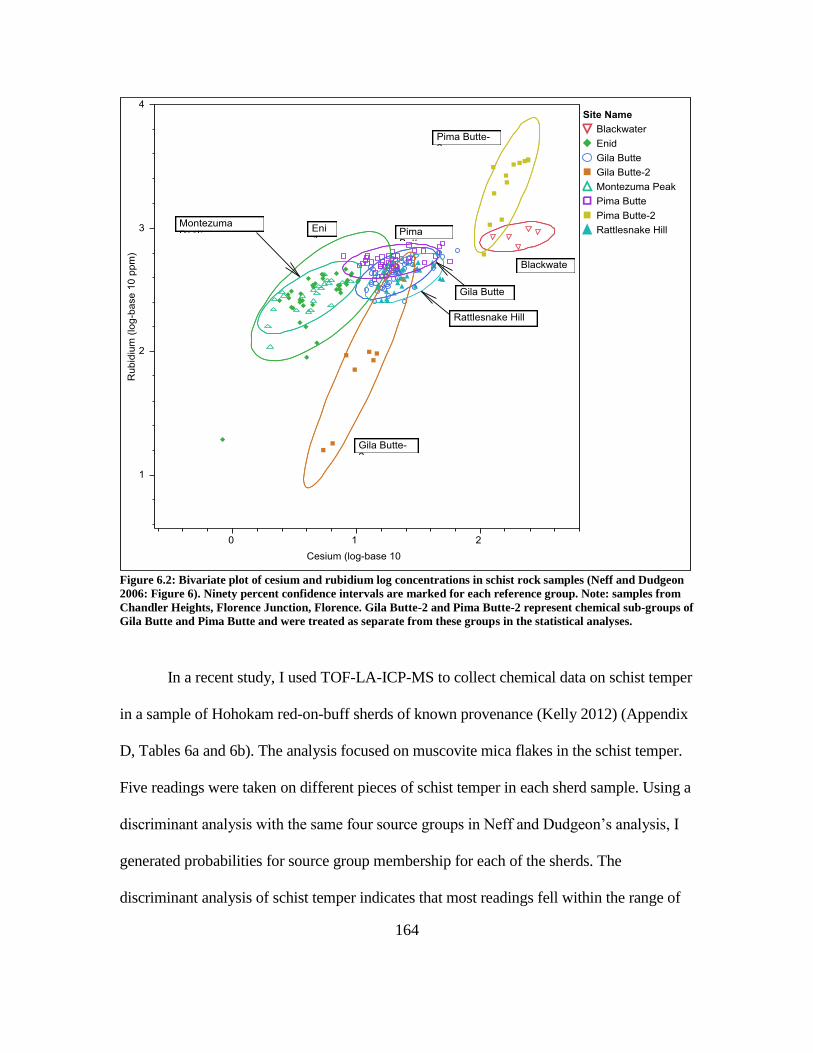
164
Figure 6.2: Bivariate plot of cesium and rubidium log concentrations in schist rock samples (Neff and Dudgeon
2006: Figure 6). Ninety percent confidence intervals are marked for each reference group. Note: samples from
Chandler Heights, Florence Junction, Florence. Gila Butte-2 and Pima Butte-2 represent chemical sub-groups of
Gila Butte and Pima Butte and were treated as separate from these groups in the statistical analyses.
In a recent study, I used TOF-LA-ICP-MS to collect chemical data on schist temper
in a sample of Hohokam red-on-buff sherds of known provenance (Kelly 2012) (Appendix
D, Tables 6a and 6b). The analysis focused on muscovite mica flakes in the schist temper.
Five readings were taken on different pieces of schist temper in each sherd sample. Using a
discriminant analysis with the same four source groups in Neff and Dudgeon’s analysis, I
generated probabilities for source group membership for each of the sherds. The
discriminant analysis of schist temper indicates that most readings fell within the range of
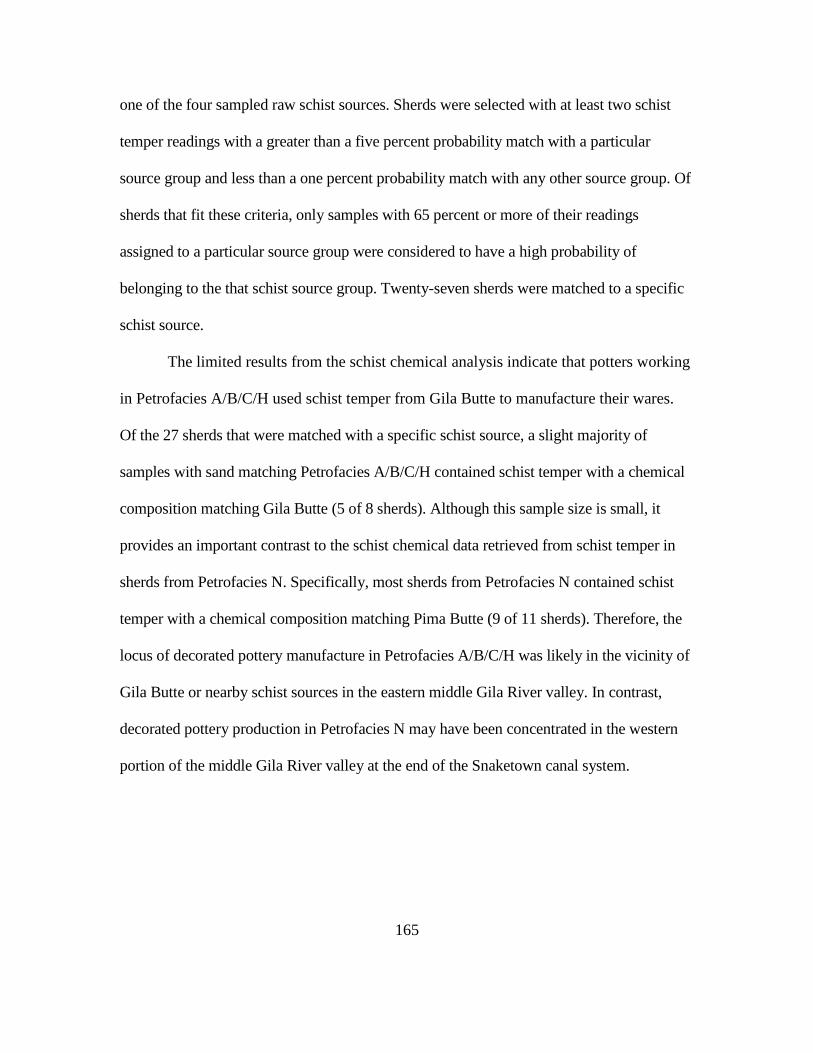
165
one of the four sampled raw schist sources. Sherds were selected with at least two schist
temper readings with a greater than a five percent probability match with a particular
source group and less than a one percent probability match with any other source group. Of
sherds that fit these criteria, only samples with 65 percent or more of their readings
assigned to a particular source group were considered to have a high probability of
belonging to the that schist source group. Twenty-seven sherds were matched to a specific
schist source.
The limited results from the schist chemical analysis indicate that potters working
in Petrofacies A/B/C/H used schist temper from Gila Butte to manufacture their wares.
Of the 27 sherds that were matched with a specific schist source, a slight majority of
samples with sand matching Petrofacies A/B/C/H contained schist temper with a chemical
composition matching Gila Butte (5 of 8 sherds). Although this sample size is small, it
provides an important contrast to the schist chemical data retrieved from schist temper in
sherds from Petrofacies N. Specifically, most sherds from Petrofacies N contained schist
temper with a chemical composition matching Pima Butte (9 of 11 sherds). Therefore, the
locus of decorated pottery manufacture in Petrofacies A/B/C/H was likely in the vicinity of
Gila Butte or nearby schist sources in the eastern middle Gila River valley. In contrast,
decorated pottery production in Petrofacies N may have been concentrated in the western
portion of the middle Gila River valley at the end of the Snaketown canal system.
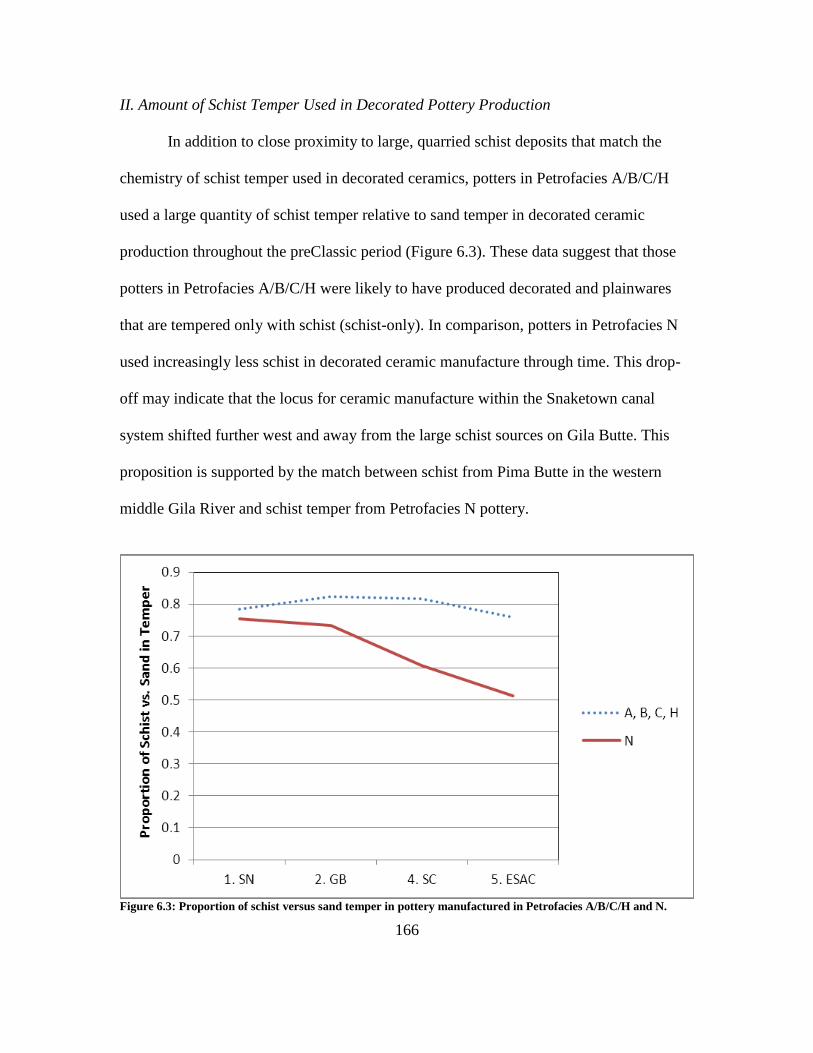
166
II. Amount of Schist Temper Used in Decorated Pottery Production
In addition to close proximity to large, quarried schist deposits that match the
chemistry of schist temper used in decorated ceramics, potters in Petrofacies A/B/C/H
used a large quantity of schist temper relative to sand temper in decorated ceramic
production throughout the preClassic period (Figure 6.3). These data suggest that those
potters in Petrofacies A/B/C/H were likely to have produced decorated and plainwares
that are tempered only with schist (schist-only). In comparison, potters in Petrofacies N
used increasingly less schist in decorated ceramic manufacture through time. This drop-
off may indicate that the locus for ceramic manufacture within the Snaketown canal
system shifted further west and away from the large schist sources on Gila Butte. This
proposition is supported by the match between schist from Pima Butte in the western
middle Gila River and schist temper from Petrofacies N pottery.
Figure 6.3: Proportion of schist versus sand temper in pottery manufactured in Petrofacies A/B/C/H and N.
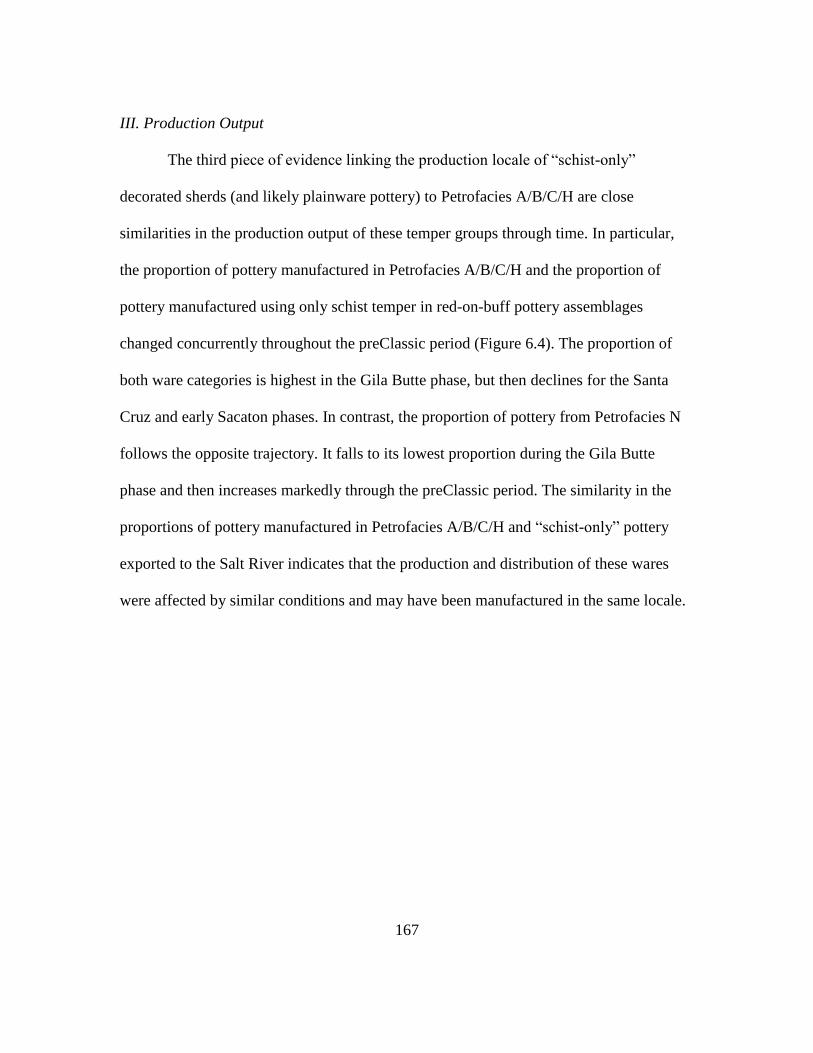
167
III. Production Output
The third piece of evidence linking the production locale of “schist-only”
decorated sherds (and likely plainware pottery) to Petrofacies A/B/C/H are close
similarities in the production output of these temper groups through time. In particular,
the proportion of pottery manufactured in Petrofacies A/B/C/H and the proportion of
pottery manufactured using only schist temper in red-on-buff pottery assemblages
changed concurrently throughout the preClassic period (Figure 6.4). The proportion of
both ware categories is highest in the Gila Butte phase, but then declines for the Santa
Cruz and early Sacaton phases. In contrast, the proportion of pottery from Petrofacies N
follows the opposite trajectory. It falls to its lowest proportion during the Gila Butte
phase and then increases markedly through the preClassic period. The similarity in the
proportions of pottery manufactured in Petrofacies A/B/C/H and “schist-only” pottery
exported to the Salt River indicates that the production and distribution of these wares
were affected by similar conditions and may have been manufactured in the same locale.
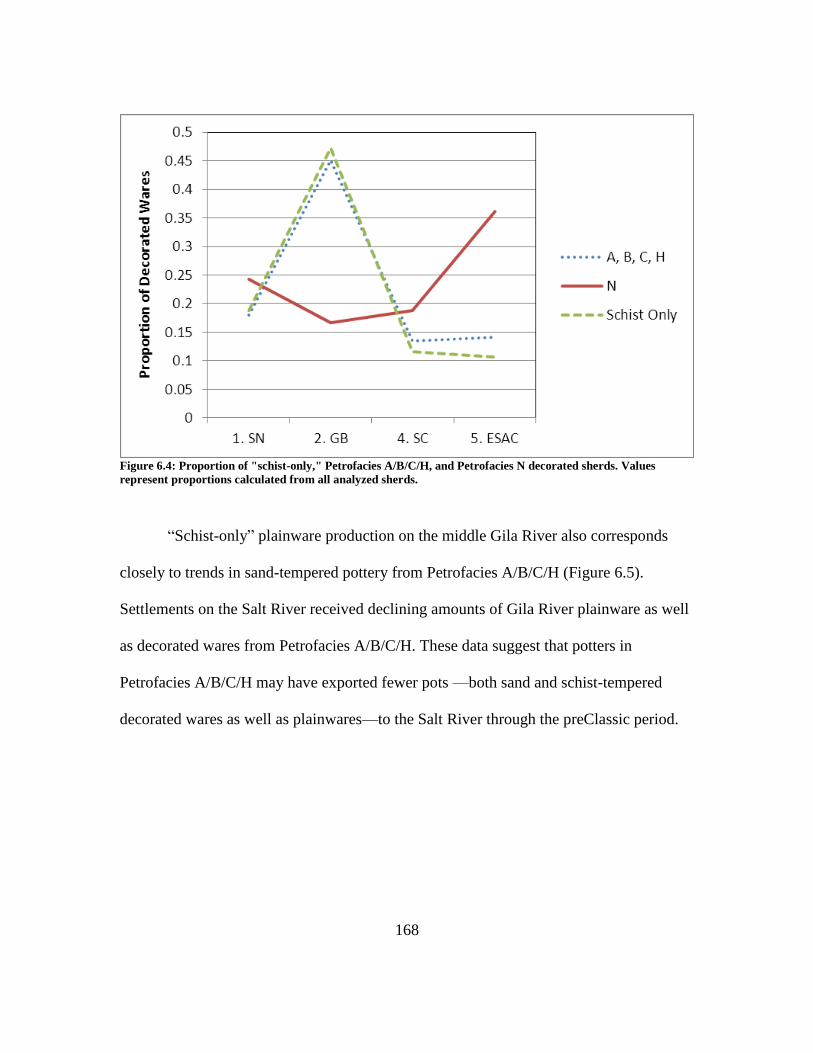
168
Figure 6.4: Proportion of "schist-only," Petrofacies A/B/C/H, and Petrofacies N decorated sherds. Values
represent proportions calculated from all analyzed sherds.
“Schist-only” plainware production on the middle Gila River also corresponds
closely to trends in sand-tempered pottery from Petrofacies A/B/C/H (Figure 6.5).
Settlements on the Salt River received declining amounts of Gila River plainware as well
as decorated wares from Petrofacies A/B/C/H. These data suggest that potters in
Petrofacies A/B/C/H may have exported fewer pots —both sand and schist-tempered
decorated wares as well as plainwares—to the Salt River through the preClassic period.
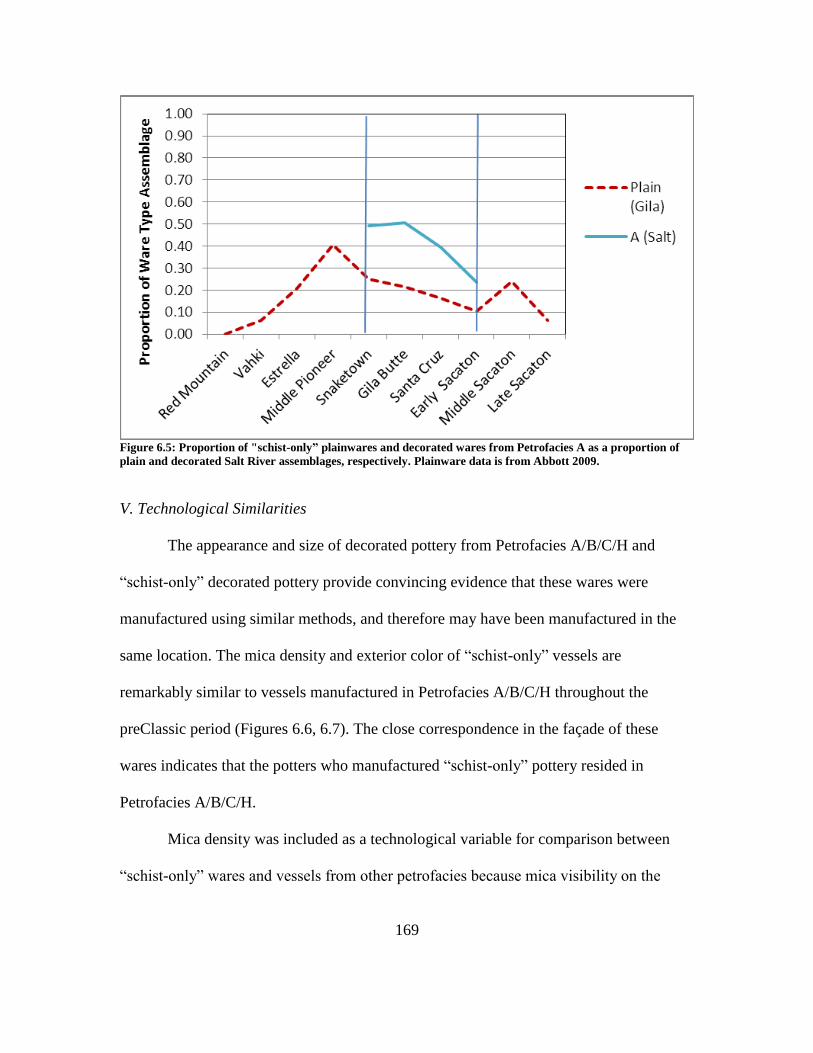
169
Figure 6.5: Proportion of "schist-only” plainwares and decorated wares from Petrofacies A as a proportion of
plain and decorated Salt River assemblages, respectively. Plainware data is from Abbott 2009.
V. Technological Similarities
The appearance and size of decorated pottery from Petrofacies A/B/C/H and
“schist-only” decorated pottery provide convincing evidence that these wares were
manufactured using similar methods, and therefore may have been manufactured in the
same location. The mica density and exterior color of “schist-only” vessels are
remarkably similar to vessels manufactured in Petrofacies A/B/C/H throughout the
preClassic period (Figures 6.6, 6.7). The close correspondence in the façade of these
wares indicates that the potters who manufactured “schist-only” pottery resided in
Petrofacies A/B/C/H.
Mica density was included as a technological variable for comparison between
“schist-only” wares and vessels from other petrofacies because mica visibility on the
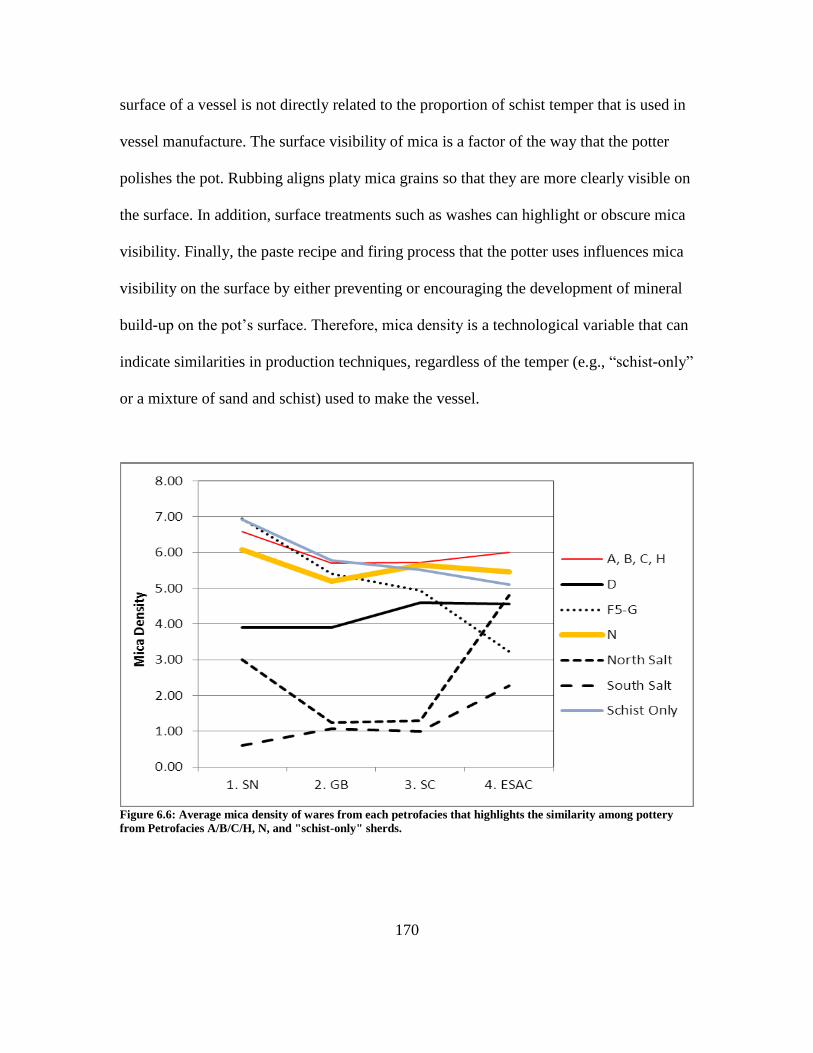
170
surface of a vessel is not directly related to the proportion of schist temper that is used in
vessel manufacture. The surface visibility of mica is a factor of the way that the potter
polishes the pot. Rubbing aligns platy mica grains so that they are more clearly visible on
the surface. In addition, surface treatments such as washes can highlight or obscure mica
visibility. Finally, the paste recipe and firing process that the potter uses influences mica
visibility on the surface by either preventing or encouraging the development of mineral
build-up on the pot’s surface. Therefore, mica density is a technological variable that can
indicate similarities in production techniques, regardless of the temper (e.g., “schist-only”
or a mixture of sand and schist) used to make the vessel.
Figure 6.6: Average mica density of wares from each petrofacies that highlights the similarity among pottery
from Petrofacies A/B/C/H, N, and "schist-only" sherds.
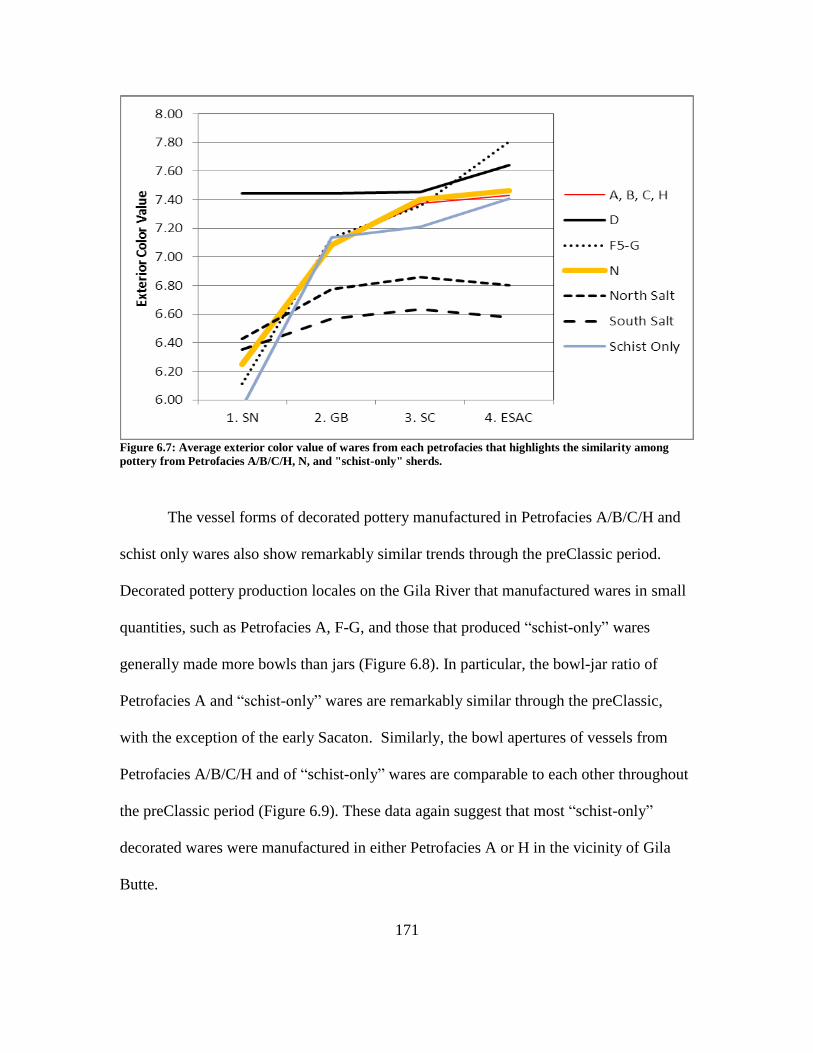
171
Figure 6.7: Average exterior color value of wares from each petrofacies that highlights the similarity among
pottery from Petrofacies A/B/C/H, N, and "schist-only" sherds.
The vessel forms of decorated pottery manufactured in Petrofacies A/B/C/H and
schist only wares also show remarkably similar trends through the preClassic period.
Decorated pottery production locales on the Gila River that manufactured wares in small
quantities, such as Petrofacies A, F-G, and those that produced “schist-only” wares
generally made more bowls than jars (Figure 6.8). In particular, the bowl-jar ratio of
Petrofacies A and “schist-only” wares are remarkably similar through the preClassic,
with the exception of the early Sacaton. Similarly, the bowl apertures of vessels from
Petrofacies A/B/C/H and of “schist-only” wares are comparable to each other throughout
the preClassic period (Figure 6.9). These data again suggest that most “schist-only”
decorated wares were manufactured in either Petrofacies A or H in the vicinity of Gila
Butte.
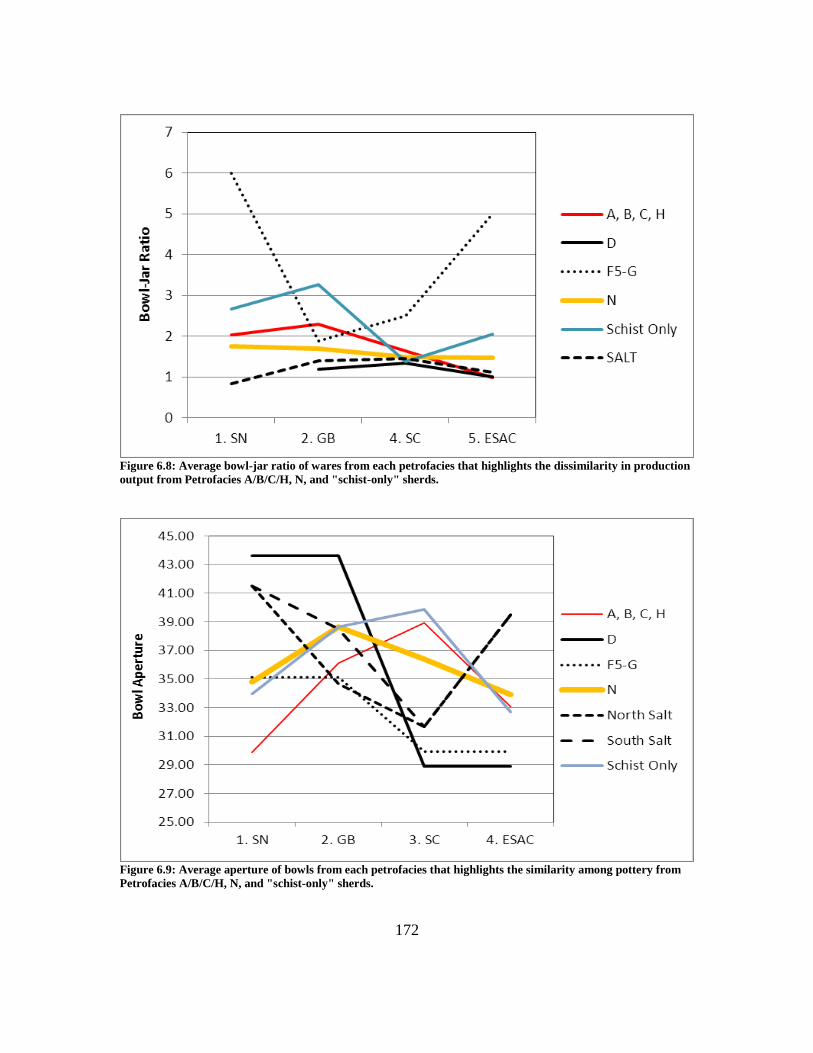
172
Figure 6.8: Average bowl-jar ratio of wares from each petrofacies that highlights the dissimilarity in production
output from Petrofacies A/B/C/H, N, and "schist-only" sherds.
Figure 6.9: Average aperture of bowls from each petrofacies that highlights the similarity among pottery from
Petrofacies A/B/C/H, N, and "schist-only" sherds.
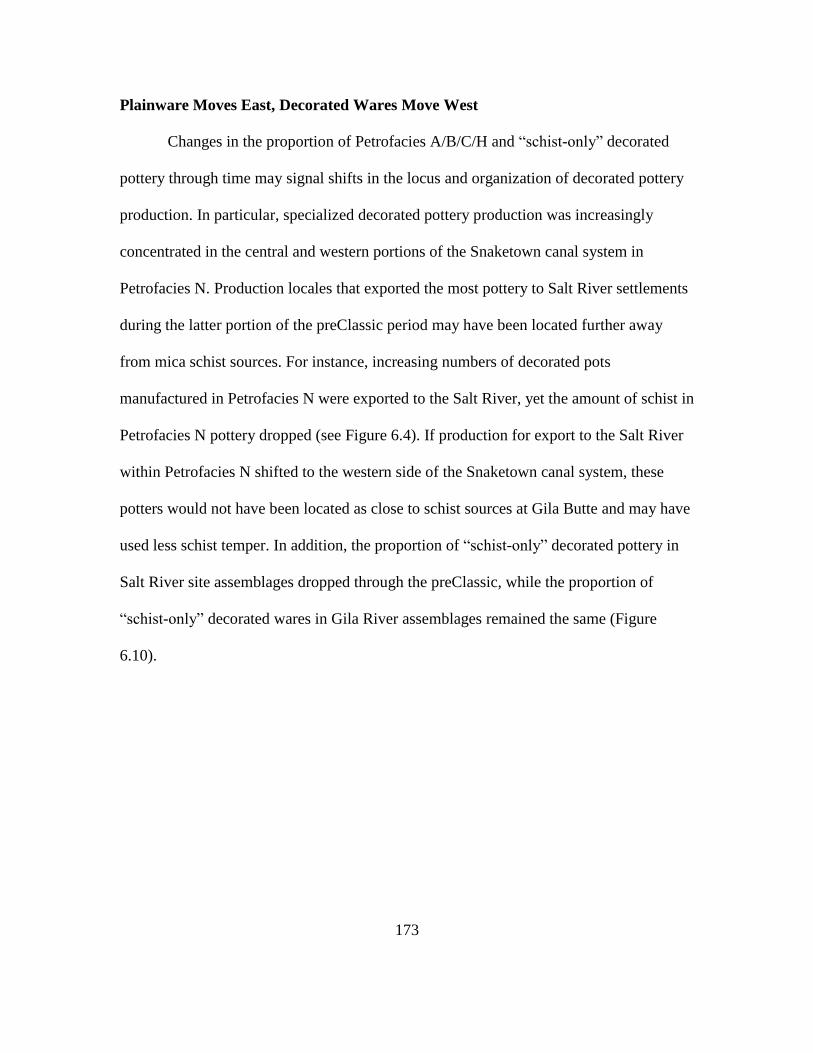
173
Plainware Moves East, Decorated Wares Move West
Changes in the proportion of Petrofacies A/B/C/H and “schist-only” decorated
pottery through time may signal shifts in the locus and organization of decorated pottery
production. In particular, specialized decorated pottery production was increasingly
concentrated in the central and western portions of the Snaketown canal system in
Petrofacies N. Production locales that exported the most pottery to Salt River settlements
during the latter portion of the preClassic period may have been located further away
from mica schist sources. For instance, increasing numbers of decorated pots
manufactured in Petrofacies N were exported to the Salt River, yet the amount of schist in
Petrofacies N pottery dropped (see Figure 6.4). If production for export to the Salt River
within Petrofacies N shifted to the western side of the Snaketown canal system, these
potters would not have been located as close to schist sources at Gila Butte and may have
used less schist temper. In addition, the proportion of “schist-only” decorated pottery in
Salt River site assemblages dropped through the preClassic, while the proportion of
“schist-only” decorated wares in Gila River assemblages remained the same (Figure
6.10).
174
Figure 6.10: Proportion of "schist only" pottery in Gila River and Salt River decorated pottery assemblages.
Although Snaketown potters reduced the amount of schist that they used to
manufacture their wares, they still catered production to consumers who wanted mica
shine on the surface of their vessels. The mica density on the surface of vessels imported
to the Salt River from the Gila River does not change measurably through the preClassic
(see Figure 6.8). Snaketown potters may have accomplished high shine with less schist
by not crushing the schist as much in order to produce larger mica flakes and a higher
mica glimmer on the surface (Abbott 2001a:88).
Using less schist temper in decorated pottery production may have been a result
of longer travel distances to Gila Butte or Pima Butte from the western Snaketown canal
system or some type of restrictions in access to schist sources. Rafferty (1982) suggests
that the Gila Butte site may have regulated access to schist quarries on Gila Butte. More
175
recently, Eiselt and Darling (2010) have proposed that resources such as mica schist may
have been controlled and distributed by particular communities on the Gila River.
Schist-Tempered Decorated Wares and Plainwares
“Schist-only” decorated wares and schist-tempered plainwares were likely
manufactured in Petrofacies A or H in the middle Gila River valley. Multiple lines of
evidence converge to support the inference that “schist-only” wares were made in this
area. Foremost, there is direct archaeological evidence for the production of plainware
vessels in these petrofacies, as well as for prehistoric mining at large, raw schist outcrops.
Technological studies of pottery from Petrofacies A and H have identified distinctive
similarities between decorated pottery and “schist-only” decorated pottery. Finally,
ceramic sourcing data suggest similar trends in the production outputs of Petrofacies A/H
decorated pottery, “schist-only” decorated pottery, and schist-tempered decorated and
plainwares.
The results of the multiple regression analyses presented in Chapter 4 would not
differ dramatically if “schist-only” decorated wares were manufactured in Petrofacies
A/B/C/H. Data related to Petrofacies N and Petrofacies A/B/C/H principally affected the
multiple regression models of the supply and demand of decorated pottery. The
relationships between Petrofacies N and Petrofacies A/B/C/H do not change, however, if
schist only wares are added to sherd counts for Petrofacies A/B/C/H. For instance,
Petrofacies N accounts for the greatest supply of non-local pottery during the Snaketown,
Santa Cruz, and early Sacaton phases. The combined Petrofacies A/B/C/H and schist only
176
wares are only dominant during the Gila Butte phase, which is the same as when schist
only wares were not included in these counts. Therefore, if the “schist-only” decorated
sherds were included with Petrofacies A/B/C/H in the statistical analyses, we would
likely see an intensification of the trends reported in Chapters 4.
What Encouraged Specialist Plainware Production?
Reconstructing the probable production locales for plainware pottery on the
middle Gila River allows us to consider the factors that encouraged the supply and
demand for specialized plainware manufacture. Prior to the middle Sedentary period,
most plainwares used by Salt River households were produced on the eastern side of
South Mountain in the vicinity of Canal System 7 (Abbott 2009). The vast majority of
plainwares used by households on the Gila River were likely manufactured in the vicinity
of Gila Butte on the Santan, Gila Butte, Sweetwater, and Casa Blanca canal systems in
Petrofacies A and H. The conditions that encouraged the supply and demand for
specialist-produced plainware production appear to differ from those that encouraged
decorated pottery production. Specifically, the amount of time investment that people
devoted to subsistence agriculture appears to distinguish the producers and consumers of
plainware pottery.
Demand for plainware pottery may have been rooted in economic conditions that
increased the comparative advantages of subsistence intensification in lieu of craft
production. Settlements that imported the most plainware pottery were located on canal
systems with high irrigation workloads. These canal systems had a long main canal, and
177
presumably more lateral canals and fields within the irrigation network than canal
systems with a short main canal. For instance, households on Canal System 2 in the Salt
River valley imported almost all their plainware pottery prior to the middle Sedentary
period. Few people lived on Canal System 2 relative to the massive size of the irrigation
network. Therefore, settlements likely devoted considerable time and energy to cleaning
and maintaining the irrigation networks and to preparing, planting, and harvesting fields.
In contrast to the consumers of specialist-produced plainware pottery, Phoenix
Basin plainware production locales were situated in areas where additional investments in
subsistence agriculture could not generate proportionally higher agricultural yields. These
areas were characterized by topography that limited the expansion of irrigation networks,
yet were occupied by sizeable populations. People living on these canal systems probably
devoted less time to canal maintenance, field preparation, and sowing and harvesting than
people who lived on expansive irrigation networks. Time freed from agricultural
responsibilities would have increased the comparative advantages to intensive craft
production such as ceramic manufacture. For instance, plainware production on the
eastern end of South Mountain was likely concentrated on Canal System 7. Hundreds of
people resided in the large settlements of Las Canopas, Las Cremaciones, and Pueblo
Viejo on Canal System 7 throughout the preClassic period (Czarzasty and Rice 2009;
Hackbarth 1997), yet the canal system itself was one of the smallest in the Salt River
valley. South Mountain prevented expansion of the main and lateral canals to the south
unlike Canal System 1 to the east. Similarly, the canal systems in Petrofacies A and H on
the Gila River were characterized by a series of large settlements on relatively small
178
irrigation networks. Canal workloads on the Gila Butte, Granite Knob-Santan, and
Sweetwater canal systems were lower than anywhere else in the Phoenix Basin. The
Santan and Sacaton Mountains and steeper topography on the river sides prevented
expansion of these canal systems far from the Gila River (Woodson 2010:304).
Interestingly, Hohokam settlements were founded relatively early in prehistory in
areas where the geographic extent of canal systems was limited; these villages continued
to grow through the preClassic period. It appears that people in these areas consciously
decided to pursue a more diverse economic strategy that involved both specialized craft
production and irrigation agriculture. The early foundation and subsequent growth of
these areas indicates that this strategy was not linked with resource pressures or land
scarcity.
Limitations: Plainwares versus Decorated Wares
While the comparative economic advantages to time investment in ceramic
production encouraged the supply and demand for specialist-produced plainware pottery,
several factors may have limited the growth of the plainware economy in comparison to
the production of red-on-buff pottery. First, specialized plainware production was not
encouraged by demand for vessels with particular aesthetic qualities or raw materials.
The resources necessary for plainware production such as alluvial clay were ubiquitously
available across the Phoenix Basin. Plainware jars and bowls were used for utilitarian
domestic functions, in which performance characteristics outweighed physical
appearance. For instance, settlements on the Salt River were not located near sources for
179
mica schist temper and could not manufacture plainware vessels with high mica sheen
locally. If Salt River consumers desired sparkly plainwares, they would have imported
them from producers along the Gila River. Yet, households on both the north and the
south side of the Salt River principally relied on plainware vessels with South Mountain
granodiorite temper and little to no mica sheen on the surface. Gila River plainwares
were imported to sites to the south of the Salt River, but their numbers declined from the
Snaketown to the early Sacaton phase (Abbott 2009). The advantages conferred by a
sparkly surface did not outweigh the additional costs incurred by transporting large
quantities of plainwares between river systems.
Transportation costs incurred in moving plainware pottery may have presented a
significant limit on the supply and demand for specialist-produced plainwares. While
decorated wares were produced in one area and then circulated across the Phoenix Basin,
plainware production areas were present on both the Salt and the Gila Rivers. The size
difference between plainwares and decorated wares was likely the principal reason why
plainwares could not be distributed as easily as red-on-buff pottery. Plainware jars and
bowls were on average larger than decorated jars and bowls (Abbott 2009:545). These
sizeable and bulky items would have been more difficult than red-on-buff pottery to
move in quantity. The weight of plainware vessels relative to decorated vessels would
have also been a hindrance to their transport. On average, the vessel walls of plainware
vessels were thicker and more substantial than decorated vessels. The thickness of these
wares corresponds to their larger size, as well as to their function as utilitarian vessels
that require durability. Finally, plainwares were predominantly jars, which unlike bowls,
180
could not be nested for efficient transport. The utilitarian use of plainwares did not permit
specialists to reduce their size and forms for easier distribution as decorated pottery
specialists appeared to have done (see results in Chapter 4).
Regional Distribution of Plainwares and Decorated Wares
Although plainware pottery production was less concentrated than specialized
red-on-buff production, both plainware and decorated pottery specialists in the Phoenix
Basin were spatially concentrated, generated a high output, and distributed their wares
widely. Continuous demand existed for the products of specialized decorated and
plainware producers from an early time in Hohokam culture history. Increasing
incentives to specialized production, however, contributed to grow in the Hohokam
economy. By the early Sacaton phase, two plainware manufacturing areas and one
decorated pottery production area generated almost all the pottery used by households
across the Phoenix Basin.
Low transport costs, which facilitated movement of pottery across the region,
encouraged specialized production of both plain and decorated ceramic wares.
Specialized producers could limit transport costs by situating production areas in
geographically central areas. Plainware producers on the east side of South Mountain
were directly across from Canal System 2 and directly adjacent to Canal System 1.
Producers and consumers could easily exchange goods from this central location.
Petrofacies A and H, while not as centrally located as Petrofacies N, were approximately
181
in the center of the Gila River system. Plainware producers, therefore, could transport
their wares widely from this position.
In addition to operating in centralized locations, specialized plainware and red-on-
buff ware producers may have also lowered transport costs by distributing their wares
through periodic gatherings at large ballcourt sites. Each of the five large preClassic
ballcourts was situated in an area of intensive plainware or red-on-buff production. On
the Salt River, large ballcourts were located at the sites of Las Cremaciones and Villa
Buena at the base of South Mountain. On the Gila River, large ballcourts were situated at
the site of Snaketown in Petrofacies N and Casa Blanca and Sweetwater in Petrofacies H.
The position of these ballcourts at specialist pottery production locales indicates that
these extramural features were likely instrumental in the distribution of pottery across the
Phoenix Basin. The function of the five large ballcourts may have differed from that of
the abundant small ballcourts in the Phoenix Basin. The latter may have served for
localized social and economic gatherings within particular canal system communities.
Dramatic decreases to transportation costs may have been the underlying cause of
rapid economic expansion during the middle Sedentary period. During this time, Abbott
(2009) documents an increase in the number of plainwares that are transported to the Salt
River and a continued increase in the number of decorated wares from Petrofacies N.
Transport costs were reduced to the point where South Mountain consumers began to rely
on Gila River specialists for plainware pottery in lieu of using pottery manufactured
nearby at South Mountain. South Mountain potters reduced their plainware production to
large ollas that could not be transported efficiently under any circumstance.
182
Summary
The supply of specialized plainware production at eastern South Mountain in the
Salt River valley and Petrofacies A and H on the Gila River valley was encouraged by
economic conditions that increased the comparative advantages to intensive subsistence
or craft manufacture. While the specific locale for decorated pottery manufacture was
associated with a socially or politically important area (Snaketown), the locus for
plainware production appears to be directly related to economic conditions that supported
diversification in productive activities. People in areas where additional subsistence
investments would not lead to significant increases in agricultural productivity decided to
engage in surplus craft production for exchange. This strategy appears to have developed
early on in the Phoenix Basin and intensified in the 9th
and 10th
century when incentives
to specialized production increased. Specifically, transportation costs appear to have
dropped dramatically. The drop in cost facilitated the movement of plainware and
decorated pottery across the region.
183
CHAPTER 7: REGIONAL COORDINATION OF A SPECIALIST-BASED
HOHOKAM ECONOMY
At a regional scale, the Salt and Gila River systems are characterized by different
demographic histories and subsistence infrastructure that contributed to distinctive and
complementary local economies. The comparative advantages to specialization in
different productive activities in each river valley encouraged economic development in
the Phoenix Basin (Yang and Ng 1993; 1998; Yang 2001; 2003). For instance, the
comparative advantages to ceramic specialization on the Gila River appeared to outweigh
the benefits of ceramic production on the Salt River. Plainware and decorated pottery
sourcing data indicate that there was a large-scale, one-way movement of pottery from
the Gila River to the Salt River valley. Of the 1,622 decorated sherds recovered from Gila
River sites sourced in this analysis, only 3 sherds (0.2 percent) were sourced to the Salt
River. In contrast, Salt River decorated and plainware assemblages were almost entirely
composed of pottery manufactured on the Gila River. The large and uni-directional
transport of pottery from the Gila River to the Salt River suggests that pottery was a
traded commodity that was exchanged for items from the Salt River. Here, I explore how
macro-scale economic differences in the Phoenix Basin may have provided the
foundation for a specialist-based economy in this region.
184
Irrigation and Demographics: Critical Differences between the Salt and Gila River
Valleys?
The topography of the Gila and Salt River valleys contributed to differences in the
extent of irrigation networks in the two areas and to the density of populated sites. The
wide and level Salt River valley enabled canal systems to extend freely from the river
(Graybill 1989; Graybill and Nials 1989; Nials and Gregory 1989; Nials et al. 1989). This
fortuitous landscape contributed to the earliest and most extensive irrigation
infrastructure in the Phoenix Basin and a number of villages were established along these
irrigation networks. Archaeological data and Pima oral histories indicate that Red
Mountain phase irrigation settlements on the Salt River were among the first in the region
(Bahr et al. 1994; Woodson 2010:239-240). In contrast, the Gila River is more
entrenched and canals are forced to run parallel to the river instead of away from it
(Graybill et al. 2006). As a result, almost all Gila River settlements are concentrated
within 1 or 2 kilometers from the river.
In concert with differences in canal infrastructure and settlement distribution, the
Salt and Gila River valleys may have been characterized by different levels of time
commitment to subsistence agriculture. A chart of the average number of people per
kilometer of main canal for Salt River and Gila River canal systems indicates that Salt
River canal systems have significantly higher irrigation workloads than Salt River canal
systems throughout the preClassic period (t = 3.564, p = 0.012, d.f. = 6) (Figure 7.1).
Most Salt River communities would have had to invest significant time in subsistence
activities through large portions of the year. In contrast, large settlements in the Gila
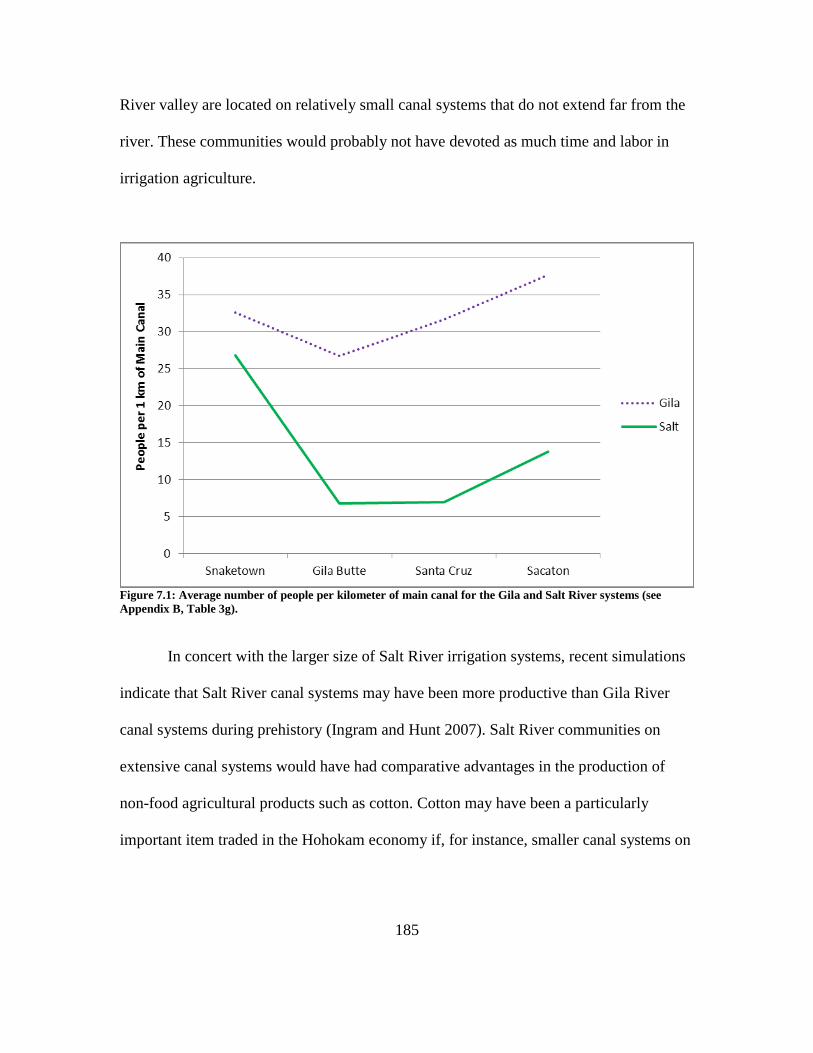
185
River valley are located on relatively small canal systems that do not extend far from the
river. These communities would probably not have devoted as much time and labor in
irrigation agriculture.
Figure 7.1: Average number of people per kilometer of main canal for the Gila and Salt River systems (see
Appendix B, Table 3g).
In concert with the larger size of Salt River irrigation systems, recent simulations
indicate that Salt River canal systems may have been more productive than Gila River
canal systems during prehistory (Ingram and Hunt 2007). Salt River communities on
extensive canal systems would have had comparative advantages in the production of
non-food agricultural products such as cotton. Cotton may have been a particularly
important item traded in the Hohokam economy if, for instance, smaller canal systems on
186
the Gila River settlements could not produce both food and non-food crops (Bob Hunt
personal communication, 2009).13
.
In contrast to the Salt River, conditions that limited the extent of subsistence
intensification on the Gila River may have broadly encouraged economic diversification
in the form of specialized craft production. Large numbers of people on relatively small
canal systems meant that people did not have to invest as much time in canal and field
maintenance. In addition, those canal systems that specialized in ceramic production are
further downstream on the Gila River and would have been most affected by water
shortages. Therefore, it is possible that benefits of specialized ceramic production in the
vicinity of Snaketown and Gila Butte and cotton cultivation on the Salt River created
complementary economic relationships that encouraged specialization on both the Salt
and the Gila Rivers.
Refining Models on Specialized Production
Complementary economic relationships between the Salt and Gila Rivers may
have provided the basis for enduring supply and demand relationships in a regional
economy. Analysis of the Hohokam case provides several interesting insights that may be
used to refine models for the development of specialist-based economies in middle range
societies. First, those conditions that encouraged supply and demand relationships were
identifiable early on in Hohokam prehistory. Abbott’s (2009) recent analyses of Salt
River site assemblages suggest that widespread distribution of plainwares from
specialized producers in the vicinity of South Mountain began as early as the Vahki phase
13
Bob Hunt’s work on Salt and Gila River agriculture is on-going.
187
(AD 450-500). By the Estrella phase (AD 500-600), Salt River consumers also received
large quantities of “schist-only” plainwares from the Gila River. These data are consistent
with the results of this study, which indicate that by the Snaketown phase (AD 650),
specialists in the Gila River valley manufactured a large portion of the decorated wares
used by settlements across the region While some of the vessels may have been
exchanged for the contents they held, the number of vessels produced for export and the
widespread reliance of Hohokam households for these wares indicates that the ceramics
themselves were the primary commodity.
Second, the Hohokam case suggests that when supply is relatively regular,
households are more than willing to forgo their own ceramic production. Acquiring
pottery from specialists likely conferred significant advantages because pottery
manufacture requires some skill, is relatively time consuming, and messy. Although Gila
River residents were located in proximity to all the necessary resources to manufacture
decorated wares, settlements on the Gila River also relied on specialists to supply them
with most of their decorated, and likely plainware pottery. Low transport costs through
the preClassic, perhaps through exchanges at large ballcourts, may have allowed
consumers to rely on specialists to a high degree (Abbott et al. 2007a).
Finally, the Gila River economy defies the premise that subsistence intensification
is always a preferable strategy to intensive craft production. Some of the earliest, largest
and most densely occupied areas of the region were areas where topography limited the
size of potential canal systems. Although agricultural settlements on the Salt River began
before the Gila River, settlers soon began to move southwards to the Gila River to occupy
188
irrigable farmland in this river system (Woodson 2010:239). Population growth in these
areas occurred long before resource pressures or notions of land tenure may have induced
or forced people to aggregate in particular locations. It is possible that economic
diversification in the form of specialized craft production was an attractive strategy to
some people and that these benefits outweighed potential limitations to irrigation systems
in this area. The early and continuous specialized production of pottery in areas where
residents could not expand canal systems indicates that the comparative advantages to
pottery production in these areas were always strong.
Network Effects
The development of large-scale specialist production of red-on-buff wares along
the middle Gila River was likely related to myriad changes throughout the Hohokam
economy. Economists have long noted that economic systems consist of networks of
relationships. A change to one part of an economic system, therefore, can send rippling
effects throughout other areas of the same system. These indirect influences are termed
network effects (Cheng and Yang 2004). Classical economists Adam Smith and Allyn
Young formalized the relationship between the division of labor and network effects by
stating that the level of specialization within an economy depends on the extent of the
market and vice versa (Smith 1776; Young 1928). This circular relationship mean that a
change to demand for a particular item will necessitate a change in the supply of that item
in order to restore the system to equilibrium (and vice versa). Network effects hold that as
supply and demand for specialist-produced goods increase, the following also increase: a)
189
economic integration, b) diversity of types of specialists, c) degree of interpersonal
dependence and interaction between individuals, and d) commodification. In the
following sections, I consider each of these factors in the Hohokam case.
A. Economic Integration
Economic integration tends to increase with societal complexity. For instance,
various authors have argued for close connection between economic integration and state
development in Mesoamerica (Feinman 1997; Smith 2002). Economic integration is not a
new concept to Hohokam archaeology and various researchers have remarked on the
complementarity in economic production among different communities within the
society. Bayman contends that Tucson Basin Hohokam communities were economically
integrated with respect to several craft production activity, such as shell ornament
manufacture (Bayman 1994:96-108; 1996:404). Abbott and his colleagues have argued
that the Hohokam economy was economically integrated through a series of ballcourt
marketplaces during the middle Sedentary period (Abbott et al. 2007a).
High and continuous supply and demand of specialist-produced decorated pottery
throughout the preClassic period indicates that the Hohokam economy was highly
integrated. Hohokam households relied on a limited number of specialists to supply them
with almost all of their decorated pottery. Research also suggests that preClassic
households also received almost all of their plainware pottery from concentrated ceramic
producers (Abbott 2009). These producers specialized in particular vessel sizes and
forms; this relationship indicates that their production coordinated with the output of
190
other manufacturing locales. The movement of high volumes of pottery to Phoenix Basin
consumers suggests that significant quantities of other types of goods were exchanged in
return. Widespread household reliance on these wares as part of their domestic ceramic
assemblages and the large volume of wares transported indicates that the pots were the
focus of exchange rather than the contents of the vessels.
B. Diversity of Specialists
As the level of specialization increases in a society, the number of different
specialties also increases (Ehn 2011:23-24; Söderlund 1943). This observation is borne
out in the Hohokam economy. The output of Phoenix Basin specialists became
increasingly more limited through time and the distribution of pottery was coordinated
such that specialists with overlapping production outputs did not distribute to the same
area. On the Gila River, specialists working on the Snaketown canal system (Petrofacies
N) increasingly took over decorated pottery production, while potters in the vicinity of
Gila Butte (Petrofacies A and H) appear to have reduced decorated pottery production to
focus on plainware manufacture. On the Salt River, potters working on the eastern end of
South Mountain reduced their production of decorated wares to a negligible amount and
focused on plainware manufacture. By the middle Sedentary period, these potters further
limited the scope of their production by focusing exclusively on large ollas as plainwares
from the Gila River became dominant in assemblages to the south of the Salt River.
Potters to the north of the Salt River began plainware production that mirrored the Gila
River plainware forms distributed to the south of the Salt River (Abbott 2009).
191
In concert with evidence for early and continued reliance on specialized pottery
producers, Hohokam archaeologists have long noted the diversity of goods that were
generated by specialists in the Hohokam economy (Doyel 1991). Shell (Howard 1993a;
Marmaduke 1993; Nelson 1991), groundstone (Bostwick and Burton 1993), textiles
(Hunt 2011), minerals (Nelson 1981), obsidian (Peterson et al. 1997), and stone palettes
(Krueger 1993; White 2004) were among the goods that circulated within the Hohokam
economy and may have been procured or manufactured by specialists at various points
during the preClassic period.
Some of the settlements that participated in specialized pottery manufacture may
have also been the locus for the intensive production of other craft items. For instance,
archaeological data suggests that marine shell artifacts were manufactured at the site of
Snaketown during the preClassic period (Seymour and Schiffer 1987; Seymour 1988).
The conditions that promoted intensive pottery manufacture in particular areas—such as
geographically central locations and low agricultural workloads—likely increased the
comparative advantages to specialized production of a range of different craft items.
C. Degree of Interpersonal Interaction & Trade Dependence
Archaeologists have noted the increasing role of trade dependence in the
development of ancient economies (Ames 1981; Peregrine et al. 2007; Wattenmaker
1990). Hohokam archaeologists have emphasized the intense reliance on exchange
relationships to obtain a variety of necessities during the middle Sedentary period in the
Phoenix Basin (Abbott 2003b:205; Abbott et al. 2007a). This means that people may
192
have interacted with individuals outside of their household, and their extended family on
a relatively regular basis. These interactions likely involved some type of formality that
would increase the security and ease of economic transactions with strangers and lower
the transaction costs involved.
One of the most important prerequisites of trade dependence is reliable exchange
relationships (Bestor 2001; Geertz 1978). Reliable exchange relationships are fostered
during times of peace when feuding does not prevent the free transfer of goods
throughout an economic system. Reliable exchange relationships are encouraged by
stable and sedentary populations. Finally, reliable exchange relationships are fostered by
a society that lacks strict social proscriptions to the production, movement, and use of
goods.
PreClassic Hohokam society appears to have met these prerequisites by providing
a safe and dependable platform for the movement of goods from specialists to consumers.
Notably, the Hohokam economy included “pure consumers,” or people who did not make
the items that they use regularly. For instance, settlements north of the Salt River
settlements were, for the most part, “pure consumers” of red-on-buff pottery. People in
these areas relied entirely on exchange relationships to obtain this pottery.
One implication for increases to household interaction spheres and trade
dependence are shifts to the gendered division of labor. Ethnographic data in the
American Southwest closely associate women with ceramic production (Bunzel 1972;
Colton 1953; Cushing 1886; Hardin 1993; Mills 1995; Stevenson 1904:373). Specialized
ceramic manufacture by women living in certain communities indicates that women’s
193
tasks varied across the Phoenix Basin. While some women produced surplus pottery for
exchange, other women did not produce pottery at all. Those women who did not produce
pottery likely devoted their time to agricultural activities or to the specialized production
of other types of craft items such as textile production. Depending on the gendered
division of labor in the Hohokam economy, women’s roles may have varied more or less
than men’s roles across the Phoenix Basin. It is possible that women in less productive
canal systems devoted most of their time to various craft production activities while the
men focused their labors on agricultural production. Women in more productive canal
systems may have assisted men with agricultural tasks. In this scenario, women’s work
would vary substantially between different areas of the Phoenix Basin while men’s work
would be relatively consistent across the region. Alternatively, both men and women in
craft production communities could have devoted equal amounts of time to craft and
agricultural tasks.
I have argued that large scale production and distribution of red-on-buff pottery
manufactured by specialists in the Hohokam region may be a signal for the increased
importance of women’s contributions to the regional economy (Kelly 2010a). If
prehistoric Hohokam women were the primary potters, their products would have seen an
early and dramatic rise in importance to the Hohokam economy through the preClassic.
For this reason, female potters were probably quite empowered in preClassic Hohokam
society. Wealth, prestige, and status are closely linked with work associated with the
entire community (Costin 1996; Joyce 1992; 1996). Male dependence on the products of
women would have potentially enabled women to have economic and potentially social
194
influence in Hohokam society (i.e., Brumfiel 1991; Nash 1978; Sillitoe 1985:517;
Strathern 1984:25; Weiner 1986:108; Wylie 1992). Although pottery production is
connected to the domestic sphere, it was produced and distributed in public areas where
women could easily interact with others. In addition, exchange of the pottery that women
produced in regional markets would have provided women the opportunity to network
and establish social ties with a variety of different people (Costin 1996). In general,
women have greater social prominence in societies where they sell their products in a
marketplace (Hadfield 1999). Female potters in non-stratified societies, such as the
Hohokam, also tend to have relatively high status (Arnold 1985:198).
Although the social position of women in Hohokam society is difficult to specify,
archaeological data suggest that Hohokam women had the greatest freedoms and access
to resources during the preClassic period when they participated in specialized pottery
manufacture. Based on an analysis of domestic architecture, access to ritual spaces,
production activities, and burial treatments, Crown and Fish (1996) contend that
preClassic women had lower workloads and greater rights and privileges in domestic and
public life in comparison to Classic period women. Although sexual stratification may
have existed during the preClassic period as evidenced by the possible presence of
menstrual huts at some Hohokam sites (Crown 1985; Haury 1976:62, 68) and higher
incidences of ritual and rare items in male graves than female graves (McGuire 1992;
Teague 1984), preClassic women were not restricted from participation in public ritual or
social events at ballcourts, and women’s’ activities were not inhibited by domestic
195
architecture. PreClassic Hohokam society may have thrived on comparatively equal
access to productive activities and social opportunities for both men and women.
D. Commodification
In market economies, increases in the extent of the market and in the level of
specialization are also marked by increases in the commodification of items circulated in
these economies (Carrier 1994; Gregory 1982; Hart 1982; Kopytoff 1986; Marx 1911).
Commodification is the transformation of a good whose production and exchange are
dictated by the identity of the producer, the identity of the consumer, and the social
context that the items are used in to an item that has an economic value.
Commodification increases with the level, output, and dependence on specialization
within an economy because people use goods that they do not produce, that are
manufactured by people they may not know, and that they obtain through an economic
exchange of some sort.
The craft items circulated at a large scale within the Hohokam may have been
more commoditized than craft items exchanged in other areas of the American
Southwest. The emergence of specialist-based economy in the Phoenix Basin indicates a
shift from an economy based on generalized exchanges or delayed reciprocity to an
economic system founded on frequent, regularized, and balanced reciprocity between
non-kin (after Sahlins 1972). While both types of exchanges probably co-existed in
economies throughout the American Southwest, the scale of the Hohokam economy
implies that most goods were likely moved across the region through economic
196
transactions. Hohokam red-on-buff wares may have assumed some aspects of
commodities in exchange contexts that emphasized the equal and probably direct
exchange of one good for another between geographically distant and unrelated people.
The disassociation of the individual and the household from material items that
they use every day, and which are visible to members of the household and wider
community, also implies a shift in the messages these items might have conveyed and
their social meanings. Stylistic consistency in decorated wares used by people across the
Phoenix Basin likely resulted directly or indirectly from concentrated specialized
production of these wares in a few locations along the middle Gila River. The similarities
in the designs of Hohokam pottery across a vast region likely reflected participation in a
pan-Hohokam identity instead of membership within a lineage or other social group
(Lack 2013).
On the Brink of Statehood?
The large, stable Hohokam populations that resided along the Salt and Gila river
valleys share many of the same characteristics as those societies that directly preceded
state formation in Egypt and Mesopotamia. This dissertation has focused one of these
characteristics: a complex economy that involves the large-scale production and
distribution of a variety of goods (Childe 1942; Wailes 1996). Like Egypt and
Mesopotamia, the Hohokam culture region was characterized by a relatively marginal
ecosystem that necessitated investments in subsistence intensification, such as irrigation
agriculture, in order to sustain year-round sedentary populations. Desert conditions did
197
not permit rainfall agriculture and the availability of wild resources fluctuated
dramatically with the seasons. With initial subsistence investments, however, these desert
environments were incredibly productive and could support high population densities.
Most importantly, the high temperatures permitted multiple crops to be grown each
season (Ingram and Hunt 2007). This situation encouraged the early and rapid expansion
of canal irrigation and the long sedentism associated with investments in stable
subsistence production.
If the Hohokam heartland in the Phoenix Basin exhibited so many of the qualities
associated with state-level formation, why did Hohokam society remain politically
decentralized? I suggest two potential answers to this question. First, almost all
traditional societies in the American Southwest were overtly egalitarian and enforced
powerful leveling mechanisms that would reduce an individual’s ability to consolidate
power (Mills 2004). Although some Hohokam communities contain evidence for political
centralization, particularly in the Classic period, archaeologists generally agree that
Hohokam social organization lacked the unified authority and hierarchical political
structures that characterized complex chiefdoms and state-level societies (Elson and
Abbott 2000; Fish and Yoffee 1996; Fish and Fish 2000; Harry and Bayman 2000).
Second, the Sonoran Desert encouraged, but did not force, people to live
exclusively along the river valleys. Although the Phoenix Basin receives less than 15
inches of rain per year, it is a relatively resource-rich environment (Fish and Nabhan
1991:51-52). Small permanent settlements could exist away from the major river systems
(Bayman et al. 2004; Ferg et al. 1984; Gladwin and Gladwin 1929b; Hill Jr. et al. 2008).
198
In addition, higher elevation ecozones in northern Arizona and New Mexico were only a
few days journey from the Hohokam heartland. While residing along the expansive canal
systems on the Salt and Gila Rivers offered many benefits, Hohokam households could
have moved or journeyed to receive the foodstuffs and other items that they needed. In
other words, the environment did not force people to negotiate the use of limited
resources along the river valleys. Alternatives may have prevented the development of
institutions to formalize and organize the use of these resources.
It is notable that the first markers of political and social differentiation arose when
the regional Hohokam economy contracted in the Classic period. The Classic period was
marked by increased immigration to the Salt and Gila River valleys, rising population
densities, and fundamental changes in land tenure (Abbott 2000; Ciolek-Torrello 2012;
Elson and Abbott 2000). As a result, social stratification linked to competition over
water, land, and other resources likely rose during this time. Societal differentiation may
have contributed to fragmentation of the economic networks that permitted the large-
scale production and exchange in the Hohokam economy. The coincidence of political
centralization and the disintegration of a regional economy may indicate that early states
or pre-state societies experience an initial period of economic balkanization as new social
roles are negotiated.
A Tale of Two Rivers: A Final Note
PreClassic Hohokam culture in the Phoenix Basin was characterized by one of the
most complex ancient economies of the American Southwest. The wide and fertile river
199
valleys of the Salt and Gila rivers provided the environmental setting for early and
continuous sedentary population growth. Specialized production, encouraged by reliable
subsistence production through irrigation agriculture and stable communities, began
almost in concert with the first recognizable material signs for Hohokam culture. As
populations grew, reliance on specialized production intensified and specialized
production of agricultural and craft goods capitalized on both endogenous and exogenous
comparative advantages. The most striking of these advantages were differences in the
economies of the Salt and Gila Rivers, which were based on agricultural potential of their
canal systems and the distribution of raw materials used for craft production. Advantages
to red-on-buff manufacture on the Gila River encouraged large-scale ceramic production
on the Snaketown canal system; in contrast, agricultural production on the Salt River
fueled the growth of a burgeoning complementary economy.
200
REFERENCES CITED
Abbott, David R.
1988 Form, Function, Technology, and Style in Hohokam Ceramics. In The 1982-
1984 Excavation at Las Colinas: Material Culture, edited by David R. Abbott, Kim
R. Beckwith, Patricia L. Crown, Robert C. Euler, David A. Gregory, J. Ronald
London, Marylin B. Saul, Larry A. Schwalbe and M. Bernard-Shaw, pp. 73-198.
Archaeological Series No. 162. Arizona State Museum, University of Arizona,
Tucson.
1994a Chemical Analyses of Clay Fractions in Hohokam Pottery. In The Pueblo
Grande Project, Volume 3: Ceramics and the Production and Exchange of Pottery
in the Central Phoenix Basin, edited by David R. Abbott, pp. 91-148. Publications in
Archaeology No. 20. Soil Systems, Phoenix.
1994b Appendix B: Categories and Criteria for Temper Classification During the
Detailed Analyses of Whole Vessels and Sherds. In The Pueblo Grande Project,
Volume 3: Ceramics and the Production and Exchange of Pottery in the Central
Phoenix Basin, edited by David R. Abbott, pp. 582-585. Soil Systems Publications
in Archaeology No. 20. Soil Systems, Inc., Phoenix.
1996 Ceramic Exchange and a Strategy for Reconstructing Organizational
Developments among the Hohokam. In Interpreting Southwestern Diversity:
Underlying Principles and Overarching Patterns, edited by Paul R. Fish and J.
Jefferson Reid, pp. 147-158. Arizona State University, Tempe.
2000 Ceramics and Community Organization among the Hohokam. University of
Arizona Press, Tucson.
2001a Detailed Sherd Analysis. In The Grewe Archaeological Research Project,
Volume 2: Material Culture, Part I: Ceramic Studies, edited by David R. Abbott, pp.
67-106. Northland Research, Inc., Flagstaff, AZ.
2001b Electron Microprobe Analyses of the GARP Pottery and Raw Clays. In The
Grewe Archaeological Research Project Volume 2: Material Culture Part 1:
Ceramic Studies, edited by David R. Abbott, pp. 47-66. Anthropological Papers No.
99-1. Northland Research, Flagstaff, AZ.
2003a Centuries of Decline During the Hohokam Classic Period at Pueblo Grande.
University of Arizona Press, Tucson.
201
2003b The Politics of Decline in Canal System 2. In Centuries of Decline During the
Hohokam Classic Period, edited by David R. Abbott, pp. 201-228. The University of
Arizona Press, Tucson.
2007 The Process, Location, and History of Hohokam Buff Ware Production: Some
Experimental and Analytical Results. Journal of Archaeological Science 35(2):388-
397.
2009 Extensive and Long-Term Specialization: Hohokam Ceramic Production in the
Phoenix Basin, Arizona. American Antiquity 74(3):531-557.
2010 The Rise and Demise of Marketplace Exchange among the Prehistoric
Hohokam of Arizona. In Archaeological Approaches to Market Exchange in Ancient
Societies, edited by Christopher P. Garraty and Barbara L. Stark, pp. 61-83.
University Press of Colorado, Boulder.
Abbott, David R., and Tina K. Love
2001 Specialized Studies and Observations on Pottery Production. In The Grewe
Archaeological Research Project, Volume 2, Part 1. Ceramic Studies, edited by
David R. Abbott, pp. 141-154. Northland Research, Tempe.
Abbott, David R., Susan L. Stinson, and Scott Van Keuren
2001 The Economic Implications of Hohokam Buff Ware Exchange During the
Early Sedentary Period. Kiva 67(1):7-29.
Abbott, David R., Scott E. Ingram, and Brent G. Kober
2006 Hohokam Exchange and Early Classic Period Organization in Central Arizona:
Focal Villages or Linear Communities? Journal of Field Archaeology 31(3):285-
305.
Abbott, David R., Alexa M. Smith, and Emiliano Gallaga
2007a Ballcourts and Ceramics: The Case for Hohokam Marketplaces in the Arizona
Desert. American Antiquity 72(3):461-484.
Abbott, David R., Joshua Watts, and Andrew D. Lack
2007b The Provenance and Concentrated Production of Hohokam Red-on-buff
Pottery: Implications for an Ancient Arizona Economy. Journal of Anthropological
Research 63(3):331-357.
Ackerly, Neal W.
1988 False Causality in the Hohokam Collapse. Kiva 53(4):305-319.
202
Adams, E. Charles, Deborah S. Dosh, and Miriam T. Stark
1993 Ceramic Distribution and Exchange: Jeddito Yellow Ware and Implications for
Social Complexity. Journal of Field Archaeology 20(1):3-21.
Adnan, Norliza Adnan, Maizah Hura Ahmad, and Robiah Adnan
2006 A Comparative Study On Some Methods For Handling Multicollinearity
Problems. Matematika 22(2):109-119.
Alden, John R.
1982 Marketplace Exchange as Indirect Distribution: An Iranian Example. In
Contexts for Prehistoric Exchange, edited by Jonathon E. Ericson and Timothy K.
Earle, pp. 83-102. Academic Press, New York.
Algaze, Guillermo
2005 The Sumerian Takeoff. Structure and Dynamics 1(1):1-41.
2008 Ancient Mesopotamia at the Dawn of Civilization: The Evolution of an Urban
Landscape. University of Chicago Press, Chicago.
Allison, James R.
1996 Comments on the Impacts of Climatic Variability and Population Growth on
Virgin Anasazi Cultural Development. American Antiquity 61:414-418.
2000 Craft Specialization and Exchange in Small-Scale Societies: A Virgin Anasazi
Case Study. Unpublished Ph.D. dissertation, Department of Anthropology, Arizona
State University, Tempe.
Ambler, J. Richard
1983 Kayenta Craft Specialization and Social Differentiation. In Proceedings of the
Anasazi Symposium, 1981, edited by Jack E. Smith, pp. 75-82. Mesa Verde Museum
Association, Mesa Verde National Park,
Ames, Kenneth M.
1981 The Evolution of Social Ranking on the Northwest Coast of North America.
American Antiquity 46(4):789-805.
Appadurai, Arjun
1986 Introduction: Commodities and the Politics of Value. In The Social Life of
Things: Commodities in Cultural Perspectives, edited by Arjun Appadurai, pp. 3-63.
Cambridge University Press, Cambridge.
Arnold, Dean E.
1975 Ceramic Ecology of the Ayacucho Basin, Peru: Implications for Prehistory.
Current Anthropology 16(2):183-194.
203
1985 Ceramic Theory and Cultural Process. Cambridge University Press,
Cambridge.
1993 Ecology and Ceramic Production in an Andean Community. Cambridge
University Press, Cambridge.
Arnold, Jeanne E.
1995 Transportation Innovation and Social Complexity among Maritime Hunter-
Gatherer Societies. American Anthropologist 97(4):733-747.
Arrow, Kenneth J.
1979 The Division of Labor in the Economy, the Polity, and Society. In Adam Smith
and Modern Political Economy, edited by G. O'Driscoll Jr., pp. 153-164. Iowa State
University Press, Ames, IA.
Babbage, Charles
1832 On the Economy of Machinery and Manufacturers. 4th enlarged of 1835,
reissued in 1977 ed. M. Kelly, New York.
Bahr, Donald, Juan Smith, William Smith Allison, and Julian D. Hayden
1994 The Short Swift Time of Gods on Earth: The Hohokam Chronicles. University
of California Press, Berkeley.
Balfet, Helene
1981 Production and Distribution of Pottery in the Maghreb. In Production and
Distribution: A Ceramic Viewpoint, edited by Helen Howard and Elaine Morris, pp.
257-269. BAR International Series No. 120, Oxford.
Bandelier, Adolf F.
1892 Final Report of Investigations among the Indians of the Southwestern United
States, Part II. Papers of the Archaeological Institute of America, American Series
IV, Cambridge, MA.
Barlett, Peggy F.
1976 Labor Efficiency and the Mechanism of Agricultural Evolution. Journal of
Anthropological Research 32(2):124-140.
1980 Adaptive Strategies in Peasant Agricultural Production. Annual Reviews in
Anthropology 9:545-573.
Barzel, Yoram, and Ben T. Yu
1984 The Effect of the Utilization Rate on the Division of Labor. Economic Inquiry
22:18-27.
204
Bayman, James M.
1994 Craft Production and Political Economy at the Marana Platform Mound
Community. Unpublished Ph.D. dissertation, Department of Anthropology, Arizona
State University, Tempe, AZ.
1996 Shell Ornament Consumption in a Classic Hohokam Platform Mound
Community Center. Journal of Field Archaeology 23(4):403-420.
2004 The Hohokam of Southwest North America. Journal of World Prehistory
15(3):257-311.
Bayman, James M., Manuel R. Palacios-Fest, Suzanne K. Fish, and Lisa W. Huckell
2004 The Paleoecology and Archaeology of Long-Term Water Storage in a
Hohokam Reservoir, Southwestern Arizona. Geoarchaeology 19(2):119-140.
Beck, Margaret E.
2002 The Ball-on-Three-Ball Test for Tensile Strength: Refined Methodology and
Results for Three Hohokam Ceramic Types. American Antiquity 67(3):558-569.
2006 Linking Finished Ceramics to Raw Materials: Oxidized Color Groups for
Lowland Desert Clays. Kiva 72(1):93-118.
Beck, Margaret E., Jill Onken, B. Sunday Eiselt, J. Andrew Darling, and Jeffrey R.
Ferguson
2012 Geomorphological Setting and Native American Acquisition of Buff-firing
Ceramic Clays in the Lower and Middle Gila River Valley, Arizona. Journal of
Archaeological Science 39:321-331.
Becker, Gary S.
1981 A Treatise on the Family. Harvard University Press, Cambridge, MA.
Becker, Gary S., and Kevin M. Murphy
1992 The Division of Labor, Coordination Costs, and Knowledge. The Quarterly
Journal of Economics 107(4):1137-1160.
Belshaw, Cyril S.
1965 Traditional Exchange and Modern Markets. Prentice-Hall, Englewood Cliffs,
NJ.
Benson, Larry, Linda S. Cordell, Kirk Vincent, Howard Taylor, John Stein, G. Lang
Farmer, and Kiyoto Futa
2003 Ancient Maize from Chacoan Great Houses: Where Was it Grown?
Proceedings of the National Academy of Sciences of the United States of America
100(22):13111-13115.
205
Bestor, Theodore C.
2001 Markets: Anthropological Aspects. In International Encyclopedia of the Social
and Behavioral Sciences, edited by Neil J. Smelser and Paul B. Baltes, pp. 9227-
9231. Pergamon, Oxford.
Birmingham, Judy
1975 Traditional Potters of the Kathmandu Valley: An Ethnoarcheological Study.
Man 10:370-386.
Bishop, Ronald L., Veletta Canouts, Suzanne P. DeAtley, Alfred Qoyawayma, and C. W.
Aikens
1988 The Formation of Ceramic Analytical Groups: Hopi Pottery Production and
Exchange, A.C. 1300-1600. Journal of Field Archaeology 15:317-337.
Blanton, Richard E., Stephen A. Kowalewski, Gary M. Feinman, and Jill Appel
1982 Monte Alban's Hinterland, Part I: The Prehispanic Settlement Patterns of the
Central and Southern Parts of the Valley of Oaxaca, Mexico. Museum of
Anthropology Memoir No. 15, University of Michigan, Ann Arbor.
Blau, Peter
1977 Inequality and Heterogeneity. The Free Press, New York.
Blinman, Eric
1986 Exchange and Interaction in the Dolores Area. In Dolores Archaeological
Program: Final Synthetic Report, edited by David A. Breternitz, Christine K.
Robinson and G. Timothy Gross, pp. 663-701. Department of the Interior, Bureau of
Reclamation Engineering and Research Center, Denver.
1993 Anasazi Pottery: Evolution of a Technology. Expedition 35(1):14-22.
Blinman, Eric, and C. Dean Wilson
1993 Ceramic Perspectives on Northern Anasazi Exchange. In The American
Southwest and Mesoamerica: Systems of Prehistoric Exchange, edited by Jonathon
E. Ericson and Timothy G. Baugh, pp. 65-94. Plenum Press, New York.
Boas, Franz
1966 Kwakiutl Ethnography. University of Chicago Press, Chicago.
Borland, Jeffrey I., and Xiaokai Yang
1994 Specialization and a New Approach to Economic Organization and Growth. In
The Return to Increasing Returns, edited by James M. Buchanan and Yong J. Yoon,
pp. 319-327. The University of Michigan Press, Ann Arbor, MI.
206
Boserup, Ester
1965 The Conditions of Agricultural Growth: The Economics of Agrarian Change
Under Population Pressure. G. Allen & Unwin, London.
Bostwick, Todd W., and James H. Burton
1993 Study in Sourcing Hohokam Basalt Ground Stone Implements. Kiva
58(3):357-372.
Bostwick, Todd W., and Christian E. Downum
1994 Site Structure and Ceremony at Pueblo Grande. In Archaeology of the Pueblo
Grande Platform Mound and Surrounding Features. Vol. 2, Features in the Central
Precinct of the Pueblo Grande Community, edited by Todd W. Bostwick and
Christian E. Downum, pp. 297-434. Anthropological Papers 1(2), Pueblo Grande
Museum, Phoenix.
Bourdieu, Pierre
1984 Distinction: A Social Critique of the Judgment of Taste. Routledge, London.
Braun, David P.
1991 Why decorate a pot? Midwestern household pottery, 200 B.C.-A.D.600.
Journal of Anthropological Archaeology 10(4):360-397.
Brumfiel, Elizabeth M.
1980 Specialization, Market Exchange, and the Aztec State: A View from Huexotla.
Current Anthropology 21(4):459-478.
1991 Weaving and cooking: women's production in Aztec Mexico. In Engendering
Archaeology: Women and Prehistory, edited by Joan M. Gero and Margaret W.
Conkey, pp. 224-251. Basil Blackwell, Oxford.
Bullard, William R., Jr.
1962 The Cerro Colorado Site and Pit House Architecture in the Southwestern
United States. Archaeology and Ethnology Papers No. 44(2). Peabody Museum,
Harvard University, Cambridge.
Bunzel, Ruth L.
1972 The Pueblo Potter: A Study of Creative Imagination in Primitive Art. Columbia
University Contributions to Anthropology 8. Dover, New York.
Burns, Barney Tillman
1983 Simulated Anasazi Storage Behavior Using Crop Yields Reconstructed from
Tree Rings: A.D. 652-1968 (Colorado). Unpublished Ph.D. dissertation, Department
of Anthropology, University of Arizona, Tucson.
207
Burton, James H., and Arleyn W. Simon
2002 Geologic Reconnaissance of Potential Ceramic Temper Sources on Lands of
the Gila River Indian Community. Report on file at the Cultural Resource
Management Program, Gila River Indian Community, Sacaton, AZ.
Burton, John
1984 Repeng and the Salt-Makers: 'Ecological Trade' and Stone Axe Production in
the Papua New Guinea Highlands. Man 24:255-272.
Carr, Christopher, and Jill E. Neitzel (editors)
1995 Style, Society, and Person: Archaeological and Ethnological Perspectives.
Plenum Press, New York.
Carrier, James G.
1994 Gifts and Commodities: Exchange and Western Capitalism since 1700.
Routledge, London.
Castetter, Edward F., and Willis H. Bell
1942 Pima and Papago Indian Agriculture. University of New Mexico Press,
Albuquerque.
Cheng, Wenli, and Xiaokai Yang
2004 Inframarginal Analysis of Division of Labor: A Survey. Journal of Economic
Behavior and Organization 55:137-174.
Childe, V. Gordon
1942 What Happened in History. Penguin Books, Harmondsworth.
1946 What Happened in History. Pelican Books, New York.
Ciolek-Torrello, Richard
2012 Hohokam Household Organization, Sedentism, and Irrigation in the Sonoran
Desert, Arizona. In Ancient Households of the Americas: Conceptualizing What
Households Do, edited by John G. Douglass and Nancy Gonlin, pp. 221-268.
University of Colorado Press, Boulder.
Clark, Jeffrey J., and Pat Gilman
2012 Persistent and Permanent Pithouse places in the Basin and Range Province of
Southeastern Arizona. In Southwestern Pithouse Communities, AD 200–900, edited
by Lisa C. Young and Sarah A. Herr, pp. 61-77. The University of Arizona Press,
Tucson.
Clark, John E.
2007 In Craft Specialization's Penumbra: Things, Persons, Action, Value, and
208
Surplus. Archeological Papers of the American Anthropological Association
17(1):20-35.
Clark, John E., and William J. Parry
1990 Craft Specialization and Cultural Complexity. Research in Economic
Anthropology 12:289-346.
Coase, Ronald
1937 The Nature of the Firm. Economica 4:386-405.
1961 The Problem of Social Cost. Journal of Law and Economics 3:1-44.
Cogswell, James W., David R. Abbott, Elizabeth J. Miksa, Hector A. Neff, Robert J.
Speakman, and Michael D. Glascock
2005 A Provenance Study of Hohokam Schist-tempered Pottery and Raw Materials
from the Middle Gila River Valley, Arizona: Techniques and Prospects. In Laser
Ablation ICP-MS in Archaeological Research, edited by Robert J. Speakman and
Hector A. Neff, pp. 105-116. University of New Mexico Press, Albuquerque.
Colton, Harold S.
1953 Potsherds. Bulletin 25. Museum of Northern Arizona, Flagstaff.
Cordell, Linda S.
1984 Prehistory of the Southwest. Academic Press, Orlando.
Cordell, Linda S., Carla R. Van West, Jeffrey S. Dean, and Deborah A. Muenchrath
2007 Mesa Verde Settlement History and Relocation: Climate Change, Social
Networks, and Ancestral Pueblo Migration. Kiva 72:391-417.
Costin, Cathy L.
1991 Craft Specialization: Issues in Defining, Documenting, and Explaining the
Organization of Production. In Archaeological Method and Theory, Vol. 1, edited by
Michael B. Schiffer, pp. 1-56. University of Arizona Press, Tucson.
1996 Exploring the Relationship between Gender and Craft in Complex Societies:
Methodological and Theoretical Issues of Gender Attribution. In Gender and
Archaeology, edited by Rita P. Wright, pp. 111-140. University of Pennsylvania
Press, Philadelphia.
1998 Introduction: Craft and Social Identity. In Craft and Social Identity, edited by
Cathy L. Costin and Rita P. Wright, pp. 3-16. Archaeological Papers of the
American Anthropological Association No. 8, Washington, D.C.
209
2001 Craft Production Systems. In Archaeology at the Millennium: A Sourcebook,
edited by Gary M. Feinman and T. Douglas Price, pp. 273-327. Kluwer
Academic/Plenum, New York.
2005 Craft Production. In Handbook of Archaeological Methods, Vol. 2, edited by
Herbert D. G. Maschner and Christopher Chippindale, pp. 1034-1107. Altamira
Press, New York.
2007 Thinking about Production: Phenomenological Classification and Lexical
Semantics. Archeological Papers of the American Anthropological Association
17(1):143-162.
Craig, Douglas B., Henry D. Wallace, and Michael W. Lindeman
2010 Village Growth and Ritual Transformation in the Southern Southwest Between
A.D. 700 and 900. Report on file at Northland Research, Inc., Tucson.
Crown, Patricia L.
1981 Analysis of the Las Colinas ceramics. Archaeological series 154:87-169.
1985 Morphology and Function of Hohokam Small Structures. Kiva 50(2-3):75-94.
1994 Ceramics and Ideology: Salado Polychrome Pottery. University of New
Mexico Press, Albuquerque.
1995 The Production of the Salado Polychromes in the American Southwest. In
Ceramic Production in the American Southwest, edited by Barbara J. Mills and
Patricia L. Crown, pp. 142-166. University of Arizona Press, Tucson.
Crown, Patricia L., and Suzanne K. Fish
1996 Gender and Status in the Hohokam pre-Classic to Classic Transition. American
Anthropologist 98(4):803-817.
Crown, Patricia L., Larry A. Schwalbe, and J. Ronald London
1988 X-ray Fluorescence Analysis of Materials Variability in Las Colinas Ceramics.
In Excavations at Las Colinas, Phoenix, Arizona, Volume IV: Material Culture,
edited by David A. Gregory, pp. 29-72. Arizona State Museum Archaeological
Series 162. University of Arizona, Tucson.
Curet, L. Antonio
1993 Regional Studies and Ceramic Production Areas: An Example from La
Mixtequilla, Veracruz, Mexico. Journal of Field Archaeology 20:427-440.
210
Cushing, Frank H.
1886 A Study of Pueblo Pottery as Illustrative of Zuni Culture Growth. Annual
Report 4:467-521. Bureau of American Ethnology, Washington, D. C.
1890 Preliminary Notes on the Origin, Working Hypothesis, and Primary Researches
of the Hemenway Southwestern Archaeological Expedition. In Congres
International des Americanistes, Compte-redu de la Septieme Session, pp. 151-194.
W. H. Kuhl, Berlin.
Czarzasty, John L., and Glen E. Rice
2009 Excavations at Las Canopas: A Hohokam Village in the Phoenix Basin. Pueblo
Grande Museum Anthropological Papers No. 17. City of Phoenix Parks and
Recreation Department and Rio Salado Archaeology, Phoenix, AZ.
Dalton, George
1960 A Note of Clarification on Economic Surplus. American Anthropologist
62(3):483-490.
D'Altroy, Terence N., and Timothy K. Earle
1985 Staple Finance, Wealth Finance and Storage in the Inka Political Economy.
Current Anthropology 26(2):187-206.
Darling, J. Andrew
2009 O'odham Trails and the Archaeology of Space. In Landscapes of Movement:
Trails, Paths, and Roads in Anthropological Perspective, edited by James E. Snead,
Clark L. Erickson and J. Andrew Darling, pp. 61-83. University of Pennsylvania
Press, Philadelphia.
Darling, J. Andrew, Hector A. Neff, B. Sunday Eiselt, and Linda Newman
2007 Recent Advances in Provenance Research Along the Middle Gila River Valley
Using Time of Flight Laser Ablation-Inductively Coupled Plasma-Mass
Spectrometry (LA-ICP-MS). Poster Presented at the 72nd Annual Meeting of the
Society for American Archaeology, Austin, Texas.
David, Nicholas, Judy Sterner, and Kodzo Gavua
1988 Why Pots are Decorated. Current Anthropology 29(3):365-389.
Dean, Jeffrey S.
1991 Thoughts on the Hohokam Chronology. In Exploring the Hohokam: Desert
Dwellers of the Southwest, edited by George J. Gumerman, pp. 61-150. University of
New Mexico Press, Albuquerque.

211
Dean, Rebecca M.
2007 Hunting Intensification and the Hohokam "Collapse". Journal of
Anthropological Archaeology 26(1):109-132.
Deardorff, Alan V.
2005 How Robust is Comparative Advantage. Review of International Economics
13(5):1004-1016.
Deaver, William L.
1997 Chronological Issues of the LVAP. In Vanishing River: Landscapes and Lives
of the Lower Verde Valley, edited by Stephanie M. Whittlesey, Richard Ciolek-
Torrello and Jeffrey H. Altschul, pp. 447-490. Statistical Research, Inc., Tucson.
Deaver, William L., and Richard Ciolek-Torrello
1995 Early Formative Period Chronology for the Tucson Basin. Kiva 60:481-530.
DeBoer, Warren R., and James A. Moore
1982 The Measurement and Meaning of Stylistic Diversity. Nawpa Pacha 20:147-
162.
DeMarrais, Elizabeth, Luis Jaime Castillo, and Timothy K. Earle
1996 Ideology, Materialization, and Power Strategies. Current Anthropology
37(1):15-31.
Di Peso, Charles C.
1956 The Upper Pima of San Cayetano del Tumacacori: An Archaeological
Reconstruction of the ootam of the Pimeria Alta. Amerind Foundation Series No. 7,
Dragoon, AZ.
Dibble, Harold L., and John C. Whittaker
1981 New Experimental Evidence on the Relation Between Percussion Flaking and
Flake Variation. Journal of Archaeological Science 8(3):283-296.
Dietler, Michael, and Ingrid Herbich
2001 Feasts and Labor Mobilization: Dissecting a Fundamental Economic Practice.
In Feasts: Archaeological and Ethnographic Perspectives on Food, Politics, and
Power, edited by Michael Dietler and Brian Hayden, pp. 240-264. Smithsonian,
Washington, D.C.
Doelle, William H.
1995 A Method for Estimating Regional Population. In The Roosevelt Community
Development Study: New Perspectives on Tonto Basin Prehistory, edited by Mark D.
Elson, Miriam T. Stark and David A. Gregory, pp. 513-536. Center for Desert
Archaeology, Tucson.
212
Doolittle, William E.
1990 Canal Irrigation in Prehistoric Mexico: The Sequence of Technological
Change. University of Texas Press, Austin.
Dornbusch, R., S. Fischer, and P. A. Samuelson
1977 Comparative Advantage, Trade, and Payments in a Ricardian Model with a
Continuum of Goods. The American Economic Review 67(5):823-839.
Douglas, Mary
1970 Natural Symbols, Explorations in Cosmology. Random House, New York.
Dow, Malcolm M.
1985 Agricultural Intensification and Craft Specialization: A Nonrecursive Model.
Ethnology 24(2):137-152.
Downum, Christian E., and Todd W. Bostwick
1993 Archaeology of the Pueblo Grande Platform Mound and Surrounding
Features: Historical Background and Investigations of the Mound to 1936.
Anthropological Papers, No. 1., Pueblo Grande Museum, Phoenix.
Doyel, David E.
1991 Hohokam Cultural Evolution in the Phoenix Basin. In Exploring the Hohokam:
Prehistoric Peoples of the American Southwest, edited by George J. Gumerman, pp.
231-278. University of New Mexico Press, Albuquerque.
2007 Irrigation, Production, and Power in Phoenix Basin Hohokam Society. In The
Hohokam Millennium, edited by Suzanne K. Fish and Paul R. Fish, pp. 83-90.
School for Advanced Research, Santa Fe.
Doyel, David E., and Mark D. Elson
1985 Hohokam Settlement and Economic Systems in the Central New River
Drainage, Arizona, Volume II. Vol. 4, Soil Systems Publications in Archaeology No.
4, Phoenix.
Durkheim, Émile
1893 The Division of Labour in Society. Free Press, Glencoe, IL.
Durrenberger, E. Paul, and Nicola Tannenbaum
1992 Household Economy, Political Economy, and Ideology: Peasants and the State
in Southeast Asia. American Anthropologist 94(1):74-89.
Earle, Timothy K.
1982 The Ecology and Politics of Primitive Valuables. In Cultural Ecology: Eclectic
213
Perspectives, edited by John Kennedy and Robert Edgerton, pp. 65-83. American
Anthropological Association, Washington, D.C.
1997 How Chiefs Came to Power: The Political Economy in Prehistory. Stanford
University Press, Stanford.
2000 Archaeology, Property, and Prehistory. Annual Review of Anthropology 29:39-
60.
Ehn, Micael
2011 Modeling Specialization and Division of Labor in Cultural Evolution.
Unpublished Ph.D. dissertation, School of Education, Culture and Communication,
Malardalen University, Vasteras, Sweden.
Eighmy, Jeffrey L., and Randall H. McGuire
1988 Archaeomagnetic Dates and the Hohokam Phase Sequence. Technical Series
No. 3. Archaeometric Lab, Department of Anthropology, Colorado State University,
Fort Collins.
Eiselt, B. Sunday, and M. Kyle Woodson
2002 Changing Patterns of Pottery Production in the Casa Blanca Area of the Middle
Gila River Valley. Paper presented in the symposium entitled 'Visible Archaeology
on the Gila River Indian Reservation,' at the 67th Annual Meeting of the Society for
American Archaeology, Denver, CO.
Eiselt, B. Sunday, and J. Andrew Darling
2010 The Organization of Middle Sedentary Period Hohokam Ceramic Production
in the Gila River Valley, Arizona. Proposal funded by the National Science
Foundation (BCS 943774).
Elson, Mark D.
1986 Archaeological Investigations at the Tanque Verde Wash Site, a Middle Rincon
Settlement in the Eastern Tucson Basin. Anthropological Papers No. 7. Institute for
American Research, Tucson.
Elson, Mark D., and David R. Abbott
2000 Organizational Variability in Platform Mound-Building Groups of the
American Southwest. In Alternative Leadership Strategies in the Prehispanic
Southwest, edited by Barbara J. Mills, pp. 117-135. The University of Arizona Press,
Tucson.
Feinman, Gary M.
1997 Macro-scale Perspectives on Settlement and Production in Ancient Oaxaca. In
Economic Analysis Beyond the Local System, edited by Richard E. Blanton, Peter N.
214
Peregrine, Deborah Winslow and Thomas D. Hall, pp. 13-42. University Press of
America, Lanham, MD.
Feinman, Gary M., Steadman Upham, and Kent G. Lightfoot
1981 The Production Step Measure: An Ordinal Index of Labor Input in Ceramic
Manufacture. American Antiquity 46(4):871-884.
Ferg, Alan, Kenneth C. Rozen, William L. Deaver, Martyn D. Tagg, David A. Phillips
Jr., and David A. Gregory (editors)
1984 Hohokam Habitation Sites in the Northern Santa Rita Mountains.
Archaeological Series No. 147, Vol. 2, Part 2, Cultural Resource Management
Division, Arizona State Museum, Tucson.
Fernald, Mary L.
1973 A Study of Maricopa Pottery. Unpublished M.A. thesis, Department of
Anthropology, Arizona State University, Tempe.
Fewkes, Jesse W.
1909 Prehistoric Ruins of the Gila Valley. 436th ed. Vol. 403, Smithsonian
Miscellaneous Collections 52. Quarterly Issue 5. Government Printing Office,
Washington, D.C.
Fish, Paul R.
2006 [1989] The Hohokam: 1,000 Years of Prehistory in the Sonoran Desert. In
Dynamics of Southwest Prehistory, edited by Linda S. Cordell and George J.
Gumerman, pp. 19-63. The University of Alabama Press, Tuscaloosa.
Fish, Suzanne K., and Gary P. Nabhan
1991 Desert as Context: The Hohokam Environment. In Exploring the Hohokam:
Prehistoric Desert Peoples of the American Southwest, edited by George J.
Gumerman, pp. 29-60. University of New Mexico Press, Albuquerque.
Fish, Suzanne K., and Norman Yoffee
1996 The State of the Hohokam. In Debating Complexity: Proceedings of the 26th
Annual Chacmool Conference, edited by Daniel A. Meyer, Peter C. Dawson and
Donald T. Hanna, pp. 290-296. The Archaeological Association of the University of
Calgary, Calgary.
Fish, Suzanne K., and Paul R. Fish
2000 The Institutional Contexts of Hohokam Complexity and Inequality. In
Alternative Leadership Strategies in the Prehispanic Southwest, edited by Barbara J.
Mills, pp. 154-167. The University of Arizona Press, Tucson.
215
2012 Hohokam Society and Water Management. In The Oxford Handbook of North
American Archaeology, edited by Timothy R. Pauketat, pp. online. Oxford
University Press, New York.
Fish, Suzanne K., Paul R. Fish, and John H. Madsen (editors)
1992 The Marana Community in the Hohokam World. University of Arizona Press,
Tucson.
Flad, Rowan K., and Zachary X. Hruby
2007 Specialized Production in Archaeological Contexts: Rethinking Specialization,
the Social Value of Products, and the Practice of Production. Archeological Papers
of the American Anthropological Association 17(1):1-19.
Fontana, Bernard L., William J. Robinson, Charles W. Cormack, and Earnest E. Leavitt
1962 Papago Indian Pottery. University of Washington Press, Seattle.
Ford, Richard I.
1972 Barter, Gift, or Violence: An Analysis of Tewa Inter-Tribal Exchange. In
Social Exchange and Interaction, edited by Edwin N. Wilmsen, pp. 21-45.
Anthropological Papers of the Museum of Anthropology, University of Michigan,
Ann Arbor.
Fournier, Dale M.
1989 Appendix A: The Results of the Petrographic Analysis of 86 Prehistoric Sherds
from Sites AZ T:12:14 (ASU) and AZ T:12:16 (ASU). In Archaeological
Investigations at the Grand Canal Ruins: A Classic Period Site in Phoenix, Arizona,
Volume 1, edited by Douglas R. Mitchell, pp. 965-975. Soil Systems Publications in
Archaeology No. 12. Soil Systems, Inc., Phoenix.
Francis, Peter, Jr.
1991 Beadmaking at Arikamedu and Beyond. World Archaeology 23(1):28-43.
Frankenstein, Susan, and Michael J. Rowlands
1978 The Internal Structure and Regional Context of Early Iron Age Society in
South-Western Germany. Bulletin of the Institute of Archaeology of London 15:73-
112.
Friedman, Jonathan, and Michael J. Rowlands
1977 Notes Toward an Epigenetic Model of the Evolution of 'Civilization'. In The
Evolution of Social Systems, edited by Jonathan Friedman and Michael J. Rowlands,
pp. 201-276. Duckworth, London.
Gabel, Norman
1931 Martinez Hill Ruins: An Example of Prehistoric Culture of the Middle Gila.
216
Unpublished M.A. thesis, Department of Anthropology, University of Arizona,
Tucson, AZ.
Gasser, Robert E.
1976 Hohokam subsistence : a 2,000 year continuum in the indigenous exploitation
of the lower Sonoran desert. Vol. 11, USDA Forest Service, Southwestern Region,
Albuquerque, N.M.
Gasser, Robert E., and Charles H. Miksicek
1985 The Specialist: A Reappraisal of Hohokam Exchange of Food Plants. In
Proceedings of the 1983 Hohokam Symposium, edited by Alfred E. Dittert Jr. and
Donald E. Dove, pp. 483-498. Occasional Paper No. 2, Arizona Archaeological
Society, Phoenix.
Gasser, Robert E., and Scott M. Kwiatkowski
1991 Food for Thought: Recognizing Patterns in Hohokam Subsistence. In
Exploring the Hohokam: Prehistoric Peoples of the American Southwest, edited by
George J. Gumerman, pp. 417-459. University of New Mexico Press, Albuquerque.
Geertz, Clifford
1978 Bazaar Economy: Information and Search in Peasant Marketing. American
Economic Review 68(2):28-32.
1979 Suq: The Bazaar Economy in Sefrou. In Order and Meaning in Moroccan
Society: Three Essays in Cultural Analysis, edited by Clifford Geertz and Lawrence
Rosen, pp. 159-268. Cambridge University Press, Cambridge.
Gladwin, Harold S.
1928 Excavations at Casa Grande, Arizona. Southwest Museum Papers No. 2, Los
Angeles.
1942 Excavations at Snaketown III: Revisions. Medallion Papers No. 30. Gila
Pueblo, Globe, AZ.
1948 Excavations at Snaketown IV: Review and Conclusions. Medallion Papers No.
38. Gila Pueblo, Globe, AZ.
Gladwin, Harold S., Emil W. Haury, Nora Gladwin, and Edwin B. Sayles
1937 Excavations at Snaketown. Vol. 25-26, 30, 38, Medallion Papers Nos. 25-26,
Gila Pueblo, Globe.
Gladwin, Harold S., Emil W. Haury, Edwin B. Sayles, and Nora Gladwin
1938 Excavations at Snaketown I: Material Culture. Medallion Papers No. 25, Gila
Pueblo, Globe, AZ.
217
Gladwin, Nora
1937 Petrography of Snaketown Pottery. In Excavations at Snaketown: Material
Culture, edited by Harold S. Gladwin, Emil W. Haury, Edwin B. Sayles and Nora
Gladwin, pp. 230-232. Medallion Papers No. 25. Gila Pueblo, Globe, AZ.
Gladwin, Winifred, and Harold S. Gladwin
1929a The Red-on-buff Culture of the Gila Basin. Medallion Papers No. 3. Gila
Pueblo, Globe, AZ.
1929b The Red-on-buff Culture of the Papagueria. Medallion Papers, No. 4., Gila
Pueblo., Globe, AZ.
1930a Some Southwestern Pottery Types, Series I. Medallion Paper No. 8, Gila
Pueblo, Globe, AZ.
1930b The Western Range of the Red-on-buff Culture. Medallion papers No. 5, Gila
Pueblo, Globe, AZ.
1935 The Eastern Range of the Red-on-Buff Culture. Medallion Papers 16, Gila
Pueblo, Globe, AZ.
Glaeser, Edward L., and Janet E. Kohlhase
2003 Cities, Regions and the Decline of Transport Costs. Papers in Regional Science
83(1):197-228.
Gluckman, Max (editor)
1962 Essays on the Ritual of Social Relations. Manchester Univ. Press, Manchester,
England.
Gordon, Claire C., and Jane E. Buikstra
1981 Soil, pH, Bone Preservation, and Sampling Bias at Mortuary Sites. American
Antiquity 46(3):566-571.
Gosden, Chris
1989 Debt, Production, and Prehistory. Journal of Anthropological Archaeology
8:355-387.
Graves, William M.
2002 Power, Autonomy, and Inequality in Rio Grande Puebloan Society, A.D. 1300-
1672. Unpublished Ph.D. dissertation, School of Human Evolution and Social
Change, Arizona State University, Tempe.
2004 Social Identity and the Internal Organization of the Jumanos Pueblos
Settlement Cluster in the Salinas District, Central New Mexico. In The Protohistoric
218
Pueblo World, A.D. 1275–1600, edited by E. Charles Adams and Andrew I. Duff,
pp. 43-52. University of Arizona Press, Tucson.
Graves, William M., and Katherine A. Spielmann
2000 Leadership, Long Distance Exchange, and Feasting in the Protohistoric Rio
Grande. In Alternative Leadership Strategies in the Greater Southwest, edited by
Barbara J. Mills, pp. 45-59. University of Arizona Press, Tucson.
Graybill, Donald A.
1989 The Reconstruction of Prehistoric Salt River Streamflow. In The 1982-1984
Excavations at Las Colinas: Environment and Subsistence, edited by Donald A.
Graybill, David A. Gregory, Fred L. Nials, Suzanne K. Fish, Charles H. Miksicek,
Robert E. Gasser and Christine R. Szuter, pp. 25-38. Archaeological Series 162, Vol.
5. Cultural Resource Management Division, Arizona State Museum, University of
Arizona, Tucson.
Graybill, Donald A., and Fred L. Nials
1989 Aspects of Climate, Streamflow and Geomorphology Affecting Irrigation
Systems in the Salt River Valley. In The 1982-1984 Excavations at Las Colinas:
Environment and Subsistence, edited by Donald A. Graybill, David A. Gregory, Fred
L. Nials, Suzanne K. Fish, Charles H. Miksicek, Robert E. Gasser and Christine R.
Szuter, pp. 5-23. Archaeological Series 162, Vol. 5. Cultural Resource Management
Division, Arizona State Museum, University of Arizona, Tucson.
Graybill, Donald A., David A. Gregory, Gary S. Funkhouser, and Fred L. Nials
2006 Long-Term Streamflow Reconstructions, River Channel Morphology, and
Aboriginal Irrigation Systems Along the Salt and Gila Rivers. In Environmental
Change and Human Adaptation in the Ancient American Southwest, edited by David
E. Doyel and Jeffrey S. Dean, pp. 69-123. The University of Utah Press, Salt Lake
City.
Gregory, Chris A.
1982 Gifts and Commodities. Academic Press, London.
Gregory, David A., and Thomas R. McGuire
1982 Research Design for the Testing of Interstate 10 Corridor Prehistoric and
Historic Remains Between Interstate 17 and 30th Drive (Group 11, Las Colinas).
Arizona State Museum Archaeological Series 157. Arizona State Museum, Tucson.
Gregory, David A., and Fred L. Nials
1985 Observations Concerning the Distribution of Classic Period Hohokam Platform
Mounds. In Proceedings of the 1983 Hohokam Symposium, Part 1. edited by Alfred
E. Dittert Jr. and Donald E. Dove, pp. 373-388. Occasional Paper No. 2., Arizona
Archaeological Society, Phoenix.
219
Gregory, David A., and Gary A. Huckleberry
1994 An Archaeological Survey in the Blackwater Area: Vol. 1. The History of
Human Settlement in the Blackwater Area. Cultural Resources Report, No. 86,
Archaeological Consulting Services, Tempe, AZ.
Habicht-Mauche, Judith A.
1995 Changing Patterns of Pottery Manufacture and Trade in the Northern Rio
Grande. In Ceramic Production in the American Southwest, edited by Barbara J.
Mills and Patricia L. Crown, pp. 167-199. University of Arizona Press, Tucson.
Hackbarth, Mark R.
1997 Archaeological and Archival Investigations of Las Canopas: The Esteban Park
Project. Pueblo Grande Museum Anthropological Papers No. 6, City of Phoenix
Parks, Recreation and Library Department, Phoenix.
Hadfield, Gillian K.
1999 A Coordination Model of the Sexual Division of Labor. Journal of Economic
Behavior & Organization 40:125-153.
Hagstrum, Melissa B.
1995 Creativity and Craft: Household Pottery Traditions in the American Southwest.
In The Organization of Ceramic Production in the American Southwest, edited by
Barbara J. Mills and Patricia L. Crown, pp. 281-300. University of Arizona Press,
Tucson.
2001 Household Production in Chaco Canyon Society. American Antiquity 66(1):47-
55.
Hardin, Margaret A.
1993 Zuni Potters and The Pueblo Potter: The Contributions of Ruth Bunzel. In
Hidden Scholars: Women Anthropologists and the Native American, edited by
Nancy J. Parezo, pp. 259-269. University of New Mexico Press, Albuquerque.
Harry, Karen G.
2005 Ceramic Specialization and Agricultural Marginality: Do Ethnographic Models
Explain the Development of Specialized Pottery Production in the Prehistoric
American Southwest? American Antiquity 70(2):295-319.
Harry, Karen G., and James M. Bayman
2000 Leadership Strategies among the Classic Period Hohokam: A Case Study. In
Alternative Leadership Strategies in the Prehispanic Southwest, edited by Barbara J.
Mills, pp. 136-153. The University of Arizona Press, Tucson.
220
Hart, Keith
1982 On Commoditization. In From Craft to Industry, edited by Esther N. Goody,
pp. 38-49. Cambridge University Press, Cambridge.
Haury, Emil W.
1934 The Canyon Creek Ruin and Cliff Dwellings of the Sierra Ancha. Medallion
Papers, no. 14, Gila Pueblo, Globe, Arizona.
1937a Ball Courts. In Excavations at Snaketown: Material Culture, edited by Harold
S. Gladwin, Emil W. Haury, Edwin B. Sayles and Nora Gladwin, pp. 36-49.
Medallion Papers No. 25. Gila Pueblo, Globe, AZ.
1937b Pottery Types at Snaketown. In Excavations at Snaketown: Material Culture,
edited by Harold S. Gladwin, Emil W. Haury, Edwin B. Sayles and Nora Gladwin,
pp. 169-229. Medallion Papers No. 25. Gila Pueblo, Globe, AZ.
1945 The excavation of Los Muertos and neighboring ruins in the Salt River valley,
southern Arizona. Papers of the Peabody Museum of American Archaeology and
Ethnology No. 24(1), Cambridge, MA.
1976 The Hohokam, Desert Farmers & Craftsmen: Excavations at Snaketown, 1964-
1965. University of Arizona Press, Tucson.
Heckman, Robert A., and Stephanie M. Whittlesey
1999 Ceramics. In Investigations at Sunset Mesa Ruin, edited by Richard Ciolek-
Torrello, Edgar K. Huber and Robert B. Neily, pp. 87-134. Technical Series 66,
Statistical Research, Tucson.
Hegmon, Michelle
1992 Archaeological Research on Style. Annual Review of Anthropology 21:517-
536.
1998 Technology, Style, and Social Practices: Archaeological Approaches. In The
Archaeology of Social Boundaries, edited by Miriam T. Stark, pp. 264-280.
Smithsonian Institution Press, Washington, D.C.
Hegmon, Michelle, Winston Hurst, and James R. Allison
1995 Production for Local Consumption and Exchange: Comparisons of Early Red
and White Ware Ceramics in the San Juan Region. In Ceramic Production in the
American Southwest, edited by Barbara J. Mills and Patricia L. Crown, pp. 30-62.
The University of Arizona Press, Tucson.
Heidke, James M.
1996a Ceramic Artifacts from the Cook Avenue Locus. In Archaeological Data
221
Recovery at the Cook Avenue Locus of the West Branch Site, edited by Allen Dart
and Deborah L. Swartz, pp. 53-76. Technical Report No. 94-2. Center for Desert
Archaeology, Tucson.
1996b Production and Distribution of Rincon Phase Pottery: Evidence from the
Julian Wash Site. In A Rincon Phase Occupation at Julian Wash, AZ BB:13:17
(ASM), edited by Jonathan B. Mabry, pp. 47-71. Technical Report No. 96-7. Center
for Desert Archaeology, Tucson.
2000 Middle Rincon Phase Ceramic Artifacts from Sunset Mesa. In Excavations at
Sunset Mesa Ruin, edited by Michael W. Lindeman, pp. 69-118. Technical Report
No. 2000-02. Desert Archaeology, Tucson.
2003 Middle Rincon Phase Ceramics from AZ BB:13:74 (ASM). In Excavations at
AZ BB:13:74 (ASM): An Examination of Three Middle Rincon Phase Loci, edited by
Michael W. Lindeman, pp. 35-62. Technical Report No. 2000-01, Desert
Archaeology Inc., Tucson.
2004a Utilitarian Ceramic Production and Distribution in the Prehistoric Tonto
Basin. In 2000 Years of Settlement in the Tonto Basin: Overview and Synthesis of the
Tonto Creek Archaeological Project, edited by Jeffery J. Clark and James M. Vint,
pp. 77-138. Anthropological Papers No. 25. Center for Desert Archaeology, Tucson.
2004b Appendix D: Temper Characterization. In Pots, Potters, and Models:
Archaeological Investigations at the SRI Locus of the West Branch Site, Tucson,
Arizona, Volume 1: Feature Descriptions, Material Culture, and Specialized
Analyses, edited by Karen G. Harry and Stephanie M. Whittlesey, pp. 504-532.
Statistical Research Technical Series 80. Statistical Research, Tucson.
2009 Multi-village Specialized Craft Production & The Distribution of Hohokam
Sedentary Period Pottery, Tucson, Arizona. In Interpreting Silent Artefacts:
Petrographic Approaches to Archaeological Ceramics, edited by Patrick S. Quinn,
pp. 227-244. Archaeopress, London.
Heidke, James M., and Elizabeth J. Miksa
2000 Correspondence and Discriminant Analyses of Sand and Sand Temper
Compositions, Tonto Basin, Arizona. Archaeometry 42(2):273-299.
Heidke, James M., Elizabeth J. Miksa, and Henry D. Wallace
2002 The Petrographic Approach to Sand-Tempered Pottery Provenance Studies:
Examples from Two Hohokam Local Systems. In Ceramic Production and
Circulation in the Greater Southwest: Source Determination by INAA and
Complementary Mineralogical Investigations, edited by Donna M. Glowacki and
222
Hector A. Neff, pp. 152-178. The Costen Institute of Archaeology at UCLA, Los
Angeles.
Heidke, James M., Susan C. Leary, Sarah A. Herr, and Mark D. Elson
2007 Alameda Brown Ware and San Francisco Mountain Gray Ware Technology
and Economics. In Sunset Crater Archaeology: The History of a Volcanic
Landscape. Ceramic Technology, Distribution, and Use, edited by Scott Van
Keuren, Mark D. Elson and Sarah A. Herr, pp. 145-183. Anthropological Papers No.
32. Center for Desert Archaeology, Tucson.
Henderson, T. Kathleen
1987 Structure and Organization at La Ciudad. Anthropological Field Studies No.
18, Arizona State University, Tempe, AZ.
Hendon, Julia A.
2007 Production as Social Process. Archeological Papers of the American
Anthropological Association 17(1):163-168.
Hepburn, Judith R.
1984 Appendix B: Ceramic Petrographic Analysis. In Hohokam Archaeology along
the Salt-Gila Aqueduct, Central Arizona Project, Vol. VIII: Material Culture, edited
by Lynn S. Teague and Patricia L. Crown, pp. 341-352. Arizona State Museum
Archaeological Series 150. University of Arizona, Tucson.
Hill Jr., Matthew E., J. Simon Bruder, Margaret E. Beck, and Bruce G. Phillips
2008 Mobile Horticulturalists in the Western Papagueria. Kiva 74(1):33-69.
Hill, J. Brett, Jeffrey J. Clark, William H. Doelle, and Patrick D. Lyons
2004 Prehistoric Demography in the Southwest: Migration, Coalescence, and
Hohokam Population Decline. American Antiquity 69(4):689-716.
Hirth, Kenneth G.
2009 Craft Production, Household Diversification, and Domestic Economy in
Prehispanic Mesoamerica. In Housework: Craft Production and Domestic Economy
in Ancient Mesoamerica, edited by Kenneth G. Hirth, pp. 13-32. Archeological
Papers of the American Anthropological Association No. 19, Wiley Periodicals, Inc.,
Malden, MA.
Hodder, Ian
1982 Symbols in Action. Cambridge Univ. Press, Cambridge, England.
Howard, A. V.
1993a Marine shell artifacts and production processes at Shelltown and the Hind
site. In Shelltown and the Hindsite: A Study of Two Hohokam Craftsman
223
Communities in Southwestern Arizona, edited by W. S. Marmaduke and R. J.
Martynec, pp. 321-423. Northland Research, Flagstaff, AZ.
Howard, Jerry B.
1993b A Paleohydraulic Approach to Examining Agricultural Intensification in
Hohokam Irrigation Systems. In Economic Aspects of Water Management in the
Prehispanic New World, edited by Vernon L. Scarborough and Barry L. Isaac, pp.
261-322. JAI Press, Greenwich, CT.
2006 Hohokam Irrigation Communities: A Study of Internal Structure, External
Relationships and Sociopolitical Complexity. Unpublished Ph.D. dissertation,
School of Human Evolution and Social Change, Arizona State University, Tempe.
Howard, Jerry B., and Gary A. Huckleberry
1991 The Operation and Evolution of an Irrigation System: The East Papago Canal
Study. Publications in Archaeology No. 18, Soil Systems, Phoenix.
Hunt, Robert C.
2000 Labor Productivity and Agricultural Development: Boserup Revisited. Human
Ecology 28(2):251-277.
2011 Hohokam Cotton: Irrigation, Production, and Trade in Prehistory. In Textile
Economies: Power and Value From the Local to the Transnational edited by Walter
E. Little and Patricia A. McAnany, pp. 147-162. Altamira Press, Lanham, MD.
Hunt, Robert C., David Guillet, David R. Abbott, James M. Bayman, Paul R. Fish,
Suzanne K. Fish, Keith W. Kintigh, and James A. Neely
2005 Plausible Ethnographic Analogies for the Social Organization of Hohokam
Canal Irrigation. American Antiquity 70(3):433-456.
Huntington, Ellsworth
1912 The Fluctuating Climate of North America- The Ruins of the Hohokam. In
Annual Reports of the Board of Regents of the Smithsonian Institution, pp. 383-387.
Smithsonian Institution, Washington, D.C.
1913 The Secret of the Big Trees. Department of the Interior, Washington, D.C.
1914 The Climatic Factor as Illustrated in Arid America. Publications of the
Carnegie Institution of Washington No. 192, Washington, D.C.
Huntley, Deborah L.
2008 Ancestral Zuni Glaze-Decorated Pottery: Viewing Pueblo IV Regional
Organization through Ceramic Production and Exchange. Anthropological Papers
of the University of Arizona No. 72, University of Arizona Press, Tucson.
224
Ingram, Scott E., and Robert C. Hunt
2007 Double-Cropping Maize on the Middle Gila River: Intra-Annual River Regime
and Canal Management in the Classic Period. Paper presented at the fall meeting of
the Arizona Archaeological Council, Mesa, AZ.
Jones, Richard
1961 Comparative Advantage and the Theory Tariffs: A Multi-country, Multi-
commodity Model. Review of Economic Studies 77:161-175.
Joyce, Rosemary A.
1992 Images of Gender and Labor Organization in Classic Maya Society. In
Exploring Gender through Archaeology: Selected papers from the 1991 Boone
Conference, edited by Cheryl Claassen, pp. 63-70. Prehistory Press, Madison, WI.
1996 The Construction of Gender in Classic Maya Monuments. In Gender and
Archaeology, edited by Rita P. Wright, pp. 167-191-191. University of Pennsylvania
Press, Philadelphia.
Kelly, Sophia E.
2010a Transformations to the Gendered Division of Labor with the Rise of a
Hohokam Specialized Economy. Paper presented at the 75th Society for American
Archaeology meeting, St. Louis.
2010b Petrographic Analysis of Red-on-Buff Pottery from Sonoqui Ruin [AZ
U:14:49(ASM)]. In Archaeological Data Recovery for the Ellsworth Road (Hunt
Highway to Cloud Road) Widening Project, Queen Creek, Maricopa County,
Arizona, edited by A. E. Rogge and Pamela J. Cox, pp. Appendix. URS Cultural
Resource Report 2010-7, Phoenix.
2011 Ceramic Specials at the Lower Santan Site. In The Archaeology of the Pima-
Maricopa Irrigation Project, in the Santan Area of the Gila River Indian
Community, Volume 2: Material Culture (Part 1: Ceramic Studies at Lower Santan
Village), edited by Christopher P. Garraty, pp. xx-xx. P-MIP Technical Report No.
2008-01. GRIC-CRMP, Sacaton, AZ.
2012 A Refined Methodology to Source Hohokam Schist-Tempered Pottery. Paper
presented in symposium Petrography’s Continued Role in Ceramic Studies: New
Advances and Debates organized by Mary Ownby and Sophia Kelly. 77th Annual
Meeting of the Society for American Archaeology. Memphis, Tennessee,
Kelly, Sophia E., Christopher N. Watkins, and David R. Abbott
2011 Revisiting the Exploitable Threshold Model: 14th Century Resource
Procurement and Landscape Dynamics on Perry Mesa, Arizona. Journal of Field
Archaeology 36(4):303-317.
225
Kelly, William H.
1936 University Ruin. Kiva 1(8):1-4.
King, Valerie Claire
2003 The Organization of Production for Chuska Gray Ware Ceramics Distribution
and Consumption in Chaco Canyon, New Mexico. Unpublished Ph.D. dissertation,
Department of Anthropology, University of New Mexico, Albuquerque.
Kohler, Timothy A., and Sandra C. Parker
1986 Predictive Models for Archaeological Resource Location. Advances in
Archaeological Method and Theory 9:397-452.
Kopytoff, Igor
1986 The Cultural Biography of Things: Commoditization as Process. In The Social
Life of Things: Commodities in Cultural Perspective, edited by Arjun Appadurai, pp.
64-91. Cambridge University Press, Cambridge.
Kremer, Michael
1993 Population Growth and Technological Change: One Million B.C. to 1990. The
Quarterly Journal of Economics 108(3):681-716.
Krueger, Kari A.
1993 A Definitive Analysis of Hohokam Stone Palettes. Unpublished M.A. thesis,
Department of Anthropology, Northern Illinois University, DeKalb.
Krugman, Paul
1991 Increasing Returns and Economic Geography. Journal of Political Economy
99(3):483-499.
Kvaal, Sigrid I., and Tore Solheim
1994 A Non-destructive Dental Method for Age Estimation. The Journal of Forensic
Odonto-stomatology 12(1):6-11.
Lack, Andrew D.
2012 A Stylistic Analysis of Hohokam Red-on-buff Ceramics from the Lower
Santan Site (AZ U:13:6 ASM). In The Archaeology of the Pima-Maricopa Irrigation
Project, in the Santan Area of the Gila River Indian Community, Volume 2: Material
Culture (Part 1: Ceramic Studies at Lower Santan Village), edited by Christopher P.
Garraty, P-MIP Technical Report No. 2008-01, Cultural Resource Management
Program, Gila River Indian Community, Sacaton, AZ.
2013 Innovation in Context: The Process of Stylistic Change among Hohokam
Potters in the Phoenix Basin, A.D. 800-1300. Unpublished Ph.D. dissertation,
School of Human Evolution and Social Change, Arizona State University, Tempe.
226
Lack, Andrew D., Sophia E. Kelly, David R. Abbott, Joshua Watts, and Pamela Cox
2012 Identifying and Charting the Rise of Specialized Red-on-Buff Pottery
Production along Queen Creek, Phoenix Basin. Journal of Arizona Archaeology
2(1):37-50.
Lang, Richard W.
1993 Additional Report: Analysis and Seriation of Stratigraphic Ceramic Samples
from Arroyo Hondo Pueblo. In The Pottery from Arroyo Hondo Pueblo, New
Mexico: Tribalization and Trade in the Northern Rio Grande, edited by Judith A.
Habicht-Mauche, pp. 166-181. School of American Research Press, Santa Fe, NM.
Lascaux, Annick, and John C. Ravesloot
1993 The Maricopa Road Site Viewed in its Local and Regional Context. In The
Maricopa Road Site: A Pre-Classic Hohokam Village, edited by John C. Ravesloot
and Annick Lascaux, pp. 39-48. Arizona State University, Tempe.
Lees, Susan H., and Daniel G. Bates
1974 The Origins of Specialized Nomadic Pastoralism: A Systemic Model.
American Antiquity 39(2):187-193.
Lewis, Henry T.
1991 Ilocano Irrigation: The Corporate Resolution. Asian Studies at Hawaii No. 37.
University of Hawaii Press, Honolulu.
Li, Yung-ti
2007 Specialization, Context of Production, and Alienation in the Production
Process: Comments and Afterthoughts. Archeological Papers of the American
Anthropological Association 17(1):169-180.
Lightfoot, Kent, and Gary M. Feinman
1982 Social differentiation and leadership development in early pithouse villages in
the Mogollon region of the American Southwest. American Antiquity 47(1):64-86.
Limão, Nuno, and Anthony J. Venables
2001 Infrastructure, Geographical Disadvantage, Transport Costs, and Trade. World
Bank Economic Review 15(3):451-479.
Lindeman, Michael W.
2006 Specialized Production and Social Reproduction During the Middle Rincon
Phase in the Tucson Basin. Unpublished Ph.D. dissertation, School of Human
Evolution and Social Change, Arizona State University, Tempe.
227
Lombard, James P.
1987 Provenance of Sand Temper in Hohokam Ceramics, Arizona. Geoarchaeology
2:91-119.
Longacre, William A.
1964 Archeology as Anthropology: A Case Study. Science 144(3625):1454-1455.
Lyneis, Margaret M.
1992 The Main Ridge Community at Lost City: Virgin Anasazi Architecture,
Ceramics, and Burials. University of Utah Anthropological Papers No. 117,
University of Utah Press, Salt Lake City.
Mabry, Jonathan B.
1999 Las Capas and Early Irrigation Farming. Archaeology Southwest 13(1):14.
2008 Las Capas: Early Irrigation and Sedentism in a Southwestern Floodplain.
Anthropological Papers No. 28, Center for Desert Archaeology, Tucson.
Malinowski, Bronislaw
1922 Argonauts of the Western Pacific. E. P. Dutton, New York.
Mansfield, Edward R., and Billy P. Helms
1982 Detecting Multicollinearity. The American Statistician 36(3):158-160.
Marmaduke, William S.
1993 Research Precepts at Shelltown and the Hind Site. In Shelltown and the Hind
Site: A Study of Two Hohokam Craftsman Communities in Southwestern Arizona,
Volume 1, edited by William S. Marmaduke and Richard J. Martynec, pp. 15-35.
Northland Research, Inc., Flagstaff, AZ.
Marshall, John T.
2001 Ballcourt. In The Grewe Archaeological Research Project, Volume 1: Project
Background and Feature Descriptions, edited by Douglas B. Craig, pp. 109-124.
Anthropological Papers No. 99-1. Northland Research, Tempe.
Marshalla, Fiona, and Tom Pilgram
1991 Meat Versus Within-bone Nutrients: Another Look at the Meaning of Body
Part Representation in Archaeological Sites. Journal of Archaeological Science
18(2):149-163.
Marx, Karl
1911 A Contribution to the Critique of Political Economy. 2nd ed. Charles H. Kerr
& Company, Chicago.
228
Maxwell, Henry
1721 Reasons Offered for Erecting a Bank in Ireland. 2nd ed. Aaron Rhames,
Dublin.
McGuire, Randall H.
1992 Death, Society, and Ideology in a Hohokam Community. Westview Press,
Boulder, CO.
Menon, Jaya
2008 Archaeological Problems with Specialization. Studies in History 24(1):137-
157.
Midvale, Frank M.
1965 Prehistoric Irrigation of the Casa Grande Ruins Area. Kiva 80(82):86.
Miksa, Elizabeth J.
1995 Petrographic Analysis of Pottery from Pueblo Blanco. In Archaeological
Investigations at Pueblo Blanco: The MCDOT Alma School Road Project, edited by
David E. Doyel, A. T. Black and B. S. Macnider, pp. 169-186. Archaeological
Resources Report No. 90. Archaeological Consulting Services, Tempe, AZ.
2001a Temper Provenance Studies. In Grewe Archaeological Research Project: Vol.
2. Material Culture: Part I. Ceramic Studies, edited by David R. Abbott, pp. 7-45.
Northland Research, Inc., Flagstaff.
2001b Provenance Characterization of Schist-Tempered Buff Ware Pottery.
Petrographic Report No. 99-6. Center for Desert Archaeology, Tucson.
Miksa, Elizabeth J., and James M. Heidke
1995 Drawing a Line in the Sands: Models of Ceramic Temper Provenance. In The
Roosevelt Community Development Study Vol. 2: Ceramic Chronology, Technology,
and Economics, edited by James M. Heidke and Miriam T. Stark, pp. 133-206.
Center for Desert Archaeology, Tucson.
2001 It All Comes Out in the Wash: Actualistic Petrofacies Modeling of Temper
Provenance, Tonto Basin, Arizona, USA. Geoarchaeology 16(2):177-222.
Miksa, Elizabeth J., and Sergio F. Castro-Reino
2001 An Updated Sand Petrofacies Model for the Middle Gila River Basin.
Petrographic Report No. 2001-02, Desert Archaeology, Inc., Tucson.
Miksa, Elizabeth J., Sergio F. Castro-Reino, and Carlos Lavayen
2004 A Combined Petrofacies Model for the Middle Gila and Phoenix Basins, with
Applications to Pottery from the Sky Harbor Site. In Hohokam Farming on the Salt
229
River Floodplain: Refining Models and Analytical Methods, edited by T. Kathleen
Henderson, pp. 7-44. Pueblo Grande Museum, City of Phoenix Parks, Recreation
and Library Department, Phoenix.
Mills, Barbara J.
1995 Gender and the Reorganization of Historic Zuni Craft Production: Implications
for Archaeological Interpretation. Journal of Anthropological Research 51(2):149-
172.
1999 Ceramics and the Social Contexts of Food Consumption in the Northern
Southwest. In Pottery and People: A Dynamic Interaction, edited by James M. Skibo
and Gary M. Feinman, pp. 99-114. University of Utah Press, Salt Lake City.
2000a Alternative Leadership Strategies in the Prehispanic Southwest. University of
Arizona Press, Tucson.
2000b Gender, Craft Production, and Inequality. In Women and Men in the
Prehispanic Southwest: Labor, Power, and Prestige, edited by Patricia L. Crown,
pp. 301-343. School of American Research Press, Santa Fe.
2004 The Establishment and Defeat of Hierarchy: Inalienable Possessions and the
History of Collective Prestige Structures in the Pueblo Southwest. American
Anthropologist 106(2):238-251.
2007 Performing the Feast: Visual Display and Suprahousehold Commensalism in
the Puebloan Southwest. American Antiquity 72(2):210-239.
Mills, Barbara J., and Patricia L. Crown
1995 Ceramic Production in the American Southwest. University of Arizona Press,
Tucson.
Mindeleff, Cosmos
1896 Casa Grande Ruin. In Thirteenth Annual Report of the Bureau of American
Ethnology, edited by J. W. Powell, pp. 289-319. Government Printing Office,
Washington, D.C.
Mohr Chavez, Karen L.
1992 The Organization of Production and Distribution of Traditional Pottery In
South Highland Peru. In Ceramic Production and Distribution: An Integrated
Approach, edited by George J. Bey III and Christopher A. Pool, pp. 49-92.
Westview Press, Boulder.
230
Morrison, Kathleen D.
1994 Intensification of Production: Archaeological Approaches. Journal of
Archaeological Method and Theory 1(2):111-159.
2007 Rethinking Intensification: Power Relations and Scales of Analysis in
Precolonial South India. In Seeking a Richer Harvest: The Archaeology of
Subsistence Intensification, Innovation, and Change, edited by Tina L. Thurston and
Christopher T. Fisher, pp. 235-247. Studies in Human Ecology and Adaptation, Vol
3. Springer US, New York.
Motsinger, Thomas N.
1998 Hohokam roads at Snaketown, Arizona. Journal of Field Archaeology
25(1):89-96.
Muller, Jon
1997 Mississippian Political Economy. Plenum Press, New York.
Murra, John V.
1980 The Economic Organization of the Inka State. JAI Press, Greenwich, CT.
Naroll, Raoul
1956 A Preliminary Index of Social Development. American Anthropologist
58(4):687-715.
Nash, June
1978 The Aztecs and the Ideology of Male Dominance. Signs 4:349-362.
Neff, Hector A., and John V. Dudgeon
2006 LA-ICP-MS of Ceramics and Ceramic Raw Materials from the Gila River
Indian Community, Arizona. Report on file at the Gila River Indian Community,
Cultural Resource Management Program, Sacaton, Arizona.
Neitzel, Jill E.
1984 The Regional Organization of the Hohokam in the American Southwest: A
Stylistic Analysis of Red-on-buff Pottery. Unpublished Ph.D. dissertation,
Department of Anthropology, Arizona State University, Tempe, AZ.
Nelson, Ben A., and Destiny Crider
2005 Posibles Pasajes Migratorios en el Norte de México y el Suroeste de Los
Estados Unidos Durante el Epiclásico y el Postclásico. In Reacomodos
Demográficos del Clásico al Posclásico en el Centro de México, edited by Linda
Manzanilla, Instituto de Investigaciones Antropólogicas, Universidad Nacional de
México, Mexico City.
231
Nelson, Kit, and Judith A. Habicht-Mauche
2006 Lead, Paint, and Pots: Rio Grande Intercommunity dynamics from a Glaze
Ware Perspective. In edited by Judith A. Habicht-Mauche, Suzanne L. Eckert and
Deborah L. Huntley, pp. 197-215. The University of Arizona Press, Tucson.
Nelson, Richard S.
1981 The Role of a Puchteca System in Hohokam Exchange. Unpublished Ph.D.
dissertation, Department of Anthropology, New York University, New York.
1991 Hohokam Marine Shell Exchange and Artifacts. Vol. 179, Arizona State
Museum Archaeological Series No. 179, University of Arizona, Tucson.
Netting, Robert McC
1990 Population, Permanent Agriculture, and Polities: Unpacking the Evolutionary
Portmanteau. In The Evolution of Political Systems, edited by Steadman Upham, pp.
21-61. School of American Research, Cambridge University Press, Cambridge.
Nials, Fred L., and Suzanne K. Fish
1988 Canals and Related Features. In The 1982-1984 Excavations at Las Colinas.
Vol 2: The Site and Its Features, Vol. 2, edited by Carol Ann Heathington and David
A. Gregory, pp. 275-306. Arizona State Museum, Tucson.
Nials, Fred L., and David A. Gregory
1989 Irrigation Systems in the Lower Salt River Valley. In Las Colinas:
Environment and Subsistence, edited by Donald A. Graybill, David A. Gregory, Fred
L. Nials, Suzanne K. Fish, Charles H. Miksicek, Robert E. Gasser and Christine R.
Szuter, pp. 39-58. Archaeological Series 162, Vol. 5. Cultural Resource
Management Division, Arizona State Museum, University of Arizona, Tucson.
Nials, Fred L., David A. Gregory, and Donald A. Graybill
1989 Salt River Streamflow and Hohokam Irrigation Systems. In The 1982-1984
Excavations at Las Colinas: Environment and Subsistence, edited by Donald A.
Graybill, David A. Gregory, Fred L. Nials, Suzanne K. Fish, Robert E. Gasser,
Charles H. Miksicek and Christine R. Szuter, pp. 59-76. Archaeological Series 162,
Vol. 5. Cultural Resource Management Division, Arizona State Museum, University
of Arizona, Tucson.
Nicholson, P. T., and H. L. Patterson
1992 The Ballas Pottery Project: Ethnoarchaeology in Upper Egypt. In Ceramic
Production and Distribution: An Integrated Approach, edited by George J. Bey III
and Christopher A. Pool, pp. 25-47. Westview Press, Boulder, CO.
232
Oberschall, Anthony, and Eric M. Leifer
1986 Efficiency and Social Institutions: Uses and Misues of Economic Reasoning in
Sociology. Annual Review of Sociology 12:233-253.
Ownby, Mary F., Charlotte L. Ownby, and Elizabeth J. Miksa
2004 Use of Scanning Electron Microscopy to Characterize Schist as a Temper in
Hohokam Pottery. Journal of Archaeological Science 31(1):31-38.
Pauketat, Timothy R.
1994 The Ascent of Chiefs: Cahokia and Mississippian Politics in Native North
America. University of Alabama Press, Tuscaloosa.
1997 Mississippian Political Economy. In Cahokia: Domination and Ideology in the
Mississippian World, edited by Timothy R. Pauketat and Thomas E. Emerson, pp.
30-51. University of Nebraska Press, Lincoln.
Peacock, David P. S.
1982 Pottery in the Roman World: An Ethnoarchaeological Approach. Longman,
London.
Pedhazur, Elazar J., and Liora Pedhazur Schmelkin
1991 Measurement, Design, and Analysis: An Integrated Approach. Lawrence
Erlbaum, Inc., Hillsdale, NJ.
Peregrine, Peter N., Carol R. Ember, and Melvin Ember
2007 Modeling State Origins Using Cross-Cultural Data. Cross-Cultural Research
41(1):75-86.
Peterson, Jane, Douglas R. Mitchell, and M. Steven Shackley
1997 Social and Economic Contexts of Lithic Procurement: Obsidian from Classic-
Period Hohokam Sites. American Antiquity 62(2):231-259.
Petty, William
1683 Another Essay in Political Arithmetick, Concerning the Growth of the City of
London with the Measures, Periods, Causes, and Consequences Thereof. Printed by
H.H. for Mark Pardoe, London.
Plog, Fred
1980a Explaining Culture Change in the Hohokam Preclassic. In Current Issues in
Hohokam Prehistory: Proceedings of a Symposium, edited by David E. Doyel and
Fred Plog, pp. 4-22. Anthropological Research Papers No. 23, Arizona State
University, Tempe, AZ.
233
Plog, Stephen
1980b Stylistic Variation in Prehistoric Ceramics: Design Analysis in the American
Southwest. Cambridge University Press, Cambridge.
Plog, Stephen, and Jeffrey H. Hantman
1986 Multiple Regression Analysis as a Dating Method in the American Southwest.
In Spatial Organization and Exchange, edited by Stephen Plog, pp. 87-113.
Southern Illinois University Press, Carbondale.
Potter, James M., and Scott G. Ortman
2004 Community and Cuisine in the Prehispanic American Southwest. In Identity,
Feasting, and the Archaeology of the Greater Southwest, edited by Barbara J. Mills,
pp. 173-191. Proceedings of the 2002 Southwest Symposium. University Press of
Colorado, Boulder.
Rae, John
1834 Statement of Some New Principles on the Subject of Political Economy. 1964th
ed. Augustus M. Kelly, New York.
Rafferty, Kevin
1982 Hohokam Micaceous Schist Mining and Ceramic Craft Specialization: An
Example from Gila Butte, Arizona. In Mining and Mining Techniques in Ancient
Mesoamerica, edited by P. C. Weigand and G Gwynne, special issue of
Anthropology 6(1 and 2):199-222.
Rappaport, Roy
1984 Pigs for the Ancestors. Yale University Press, New Haven.
Rashid, Salim
1986 Adam Smith and the Division of Labor: A Historical View. Scottish Journal of
Political Economy 33:292-297.
Rautman, Alison E.
1996 Risk, Reciprocity, and the Operation of Social Networks. In Evolving
Complexity and Environmental Risk in the Prehistoric Southwest, edited by Joseph
A. Tainter and Bonnie Bagley Tainter, pp. 197-222. Addison-Wesley, Reading.
Rea, Amadeo M.
1996 Inventory of Traditional Cultural Properties of the Gila River Indian
Community. Report on file at the Cultural Resource Management Program, Gila
River Indian Community, Sacaton.
Reinhard, Karl J.
1996 Parasite Ecology of Two Anasazi Villages. In Case Studies in Environmental
234
Archaeology, edited by Elizabeth Jean Reitz, C. Margaret Scarry and Sylvia J.
Scudder, pp. 175-194. Plenum Press, New York.
Ricardo, David
1817 On the Principles of Political Economy and Taxation. John Murray, London.
Rice, Glen E.
1992 Modeling the Development of Complexity in the Sonoran Desert of Arizona.
In Developing Perspectives on Tonto Basin Prehistory, edited by Charles L.
Redman, Glen E. Rice and Kathryn E. Pedrick, pp. 11-26. Roosevelt Monograph
Series, No. 2, Anthropological Field Studies, No. 26, Tempe, AZ.
Rice, Glen E., and Todd W. Bostwick (editors)
1986 Studies in the Prehistory of Central Arizona, Vol 2: The Central Arizona Water
Control Study. Office of Cultural Resource Management, Department of
Anthropology, Arizona State University, Tempe, AZ.
Rice, Glen E., Travis Cureton, Erik Steinbach, and Christopher N. Watkins
2009 A Hohokam Kiln at Las Canopas. In Excavations at Las Canopas: A Hohokam
Village in the Phoenix Basin, Part 2: The Feature Descriptions, edited by John L.
Czarzasty and Glen E. Rice, pp. 84-92. Pueblo Grande Museum Anthropological
Papers No. 17. City of Phoenix Parks and Recreation Department and Rio Salado
Archaeology, Phoenix, AZ.
Rice, Prudence M.
1981 Evolution of Specialized Pottery Production: A Trial Model. Current
Anthropology 22(3):219-240.
1987 Pottery Analysis: A Sourcebook. The University of Chicago Press, Chicago.
1996 Recent Ceramic Analysis: 1. Function, Style, and Origins. Journal of
Archaeological Research 4:133-163.
Roe, Peter G.
1980 Art and Residence among the Shipibo Indians of Peru: A Study in
Microacculturation. American Anthropologist (82):42-71.
Rosen, Steven A.
1997 Craft Specialization and the Rise of Secondary Urbanism: A View from the
Southern Levant. In Urbanism in Antiquity from Mesopotamia to Crete, edited by
Walter E. Aufrecht, Neil A. Mirau and Steven W. Gauley, pp. 82-91. Sheffield
Academic Press, Sheffield.
235
Roumasset, James
2007 Population and Agricultural Development. University of Hawaii at Manoa
Economics Department Working Paper 07-2, University of Hawaii, Manoa.
Rouse, Lynne M., and Lloyd Weeks
2011 Specialization and Social Inequality in Bronze Age SE Arabia: Analyzing the
Development of Production Strategies and Economic Networks Using Agent-based
Modeling. Journal of Archaeological Science 38(7):1583-1590.
Rowlands, Michael J.
1998 Centre and Periphery: A Review of a Concept. In Centre and Periphery in the
Ancient World, edited by Michael J. Rowlands, Mogens Larsen, and Kristian
Kristiansen, pp. 214-235. Routledge, New York.
Russell, Frank
1975 The Pima Indians. Twenty-Sixth Annual Report of the Bureau of American
Ethnology, 1904-1905, Smithsonian Institution, Washington D.C.
Rye, Owen S.
1981 Pottery Technology: Principles and Reconstruction. Taraxacum, Washington,
D. C.
Sahlins, Marshall D.
1972 Stone Age Economics. Aldine-Atherton, Chicago.
Sanders, William T.
1956 The Central American Symbiotic Region: A Study in Prehistoric Settlement
Patterns. In Prehistoric Settlement Patterns in the New World, edited by Gordon R.
Willey, pp. 115-127. Viking Fund Publications in Anthropology No. 23, New York.
Sauer, C. O., and D. Brand
1930 Pueblo Sites in Southeastern Arizona. In University of California Publications
in Geography Vol. 3, No. 6, pp. 415-458. University of California Press, Berkeley.
Schaller, David M.
1994 Geographic Sources of Phoenix Basin Hohokam Plainware Based on
Petrographic Analysis. In Pueblo Grande Project: Vol. 3. Ceramics and the
Production and Exchange of Pottery in the Central Phoenix Basin, edited by David
R. Abbott, pp. 17-90. Soil Systems, Inc., Phoenix.
Scheidel, Walter
2010 Approaching the Roman Economy. Princeton/Stanford Working Papers in
Classics. Stanford University, Palo Alto.
236
Schiffer, Michael B.
1982 Hohokam Chronology: An Essay on History and Method. In Hohokam and
Patayan: Prehistory of Southwestern Arizona, edited by Randall H. McGuire and
Michael B. Schiffer, pp. 299-344. Academic Press, New York.
1986 Radiocarbon Dating and the “Old Wood” Problem: The Case of the Hohokam
Chronology. Journal of Archaeological Science 13:13-30.
Schortman, Edward M., and Patricia A. Urban
2004 Modeling the Roles of Craft Production in Ancient Political Economies.
Journal of Archaeological Research 12:185-226.
Schroeder, Albert H.
1940 A Stratigraphic Survey of the Pre-Spanish Trashmounds of the Salt River
Valley, Arizona. Unpublished M.A. thesis, University of Arizona, Tucson, AZ.
1966 Pattern diffusion from Mexico into the Southwest after A.D. 600. American
Antiquity 31:683-704.
Seymour, D. J.
1988 An Alternative View of Sedentary Period Hohokam Shell-ornament
Production. American Antiquity 53:812-829.
Seymour, D. J., and Michael B. Schiffer
1987 A Preliminary Analysis of Pithouse Assemblages from Snaketown, Arizona. In
Method and Theory for Activity Area Research: An Ethnoarchaeological Approach,
edited by Susan Kent, pp. 549-603. Plenum Press, New York.
Shennan, Stephen
1997 Quantifying Archaeology. 2nd ed. Edinburgh University Press, Edinburgh.
1999 Cost, Benefit and Value in the Organization of Early European Copper
Production. Antiquity 73(280):352-363.
2011 Social Evolution Today. Journal of World Prehistory 24:201-212.
Shepard, Anna O.
1942 Rio Grande Glaze-Paint Ware: A Study Illustrating the Place of Ceramic
Technological Analysis in Archaeological Research. In Contributions to American
Anthropology and History, No. 39, pp. 129-262. Publication 528 of the Carnegie
Institution, Washington, D. C.
1965 Rio Grande Glaze-Paint Pottery: A Test of Petrographic Analysis. In Ceramics
and Man, edited by Frederick R. Matson, pp. 62-87. Aldine, Chicago.
237
Sheridan, Thomas E.
1996 La Gente Es Muy Perra: Conflict and Cooperation over Irrigation Water in
Cucurpe, Sonora, Mexico. In Canals and Communities, edited by Jonathan B.
Mabry, pp. 33-52. University of Arizona Press, Tucson.
Sillitoe, Paul
1985 Divide and No One Rules: The Implications of Sexual Divisions of Labor in
the Papua New Guinea. Man 20:494-522.
Smith, Adam
1759 The Theory of Moral Sentiments. 6th ed. A. Millar, London.
1776 An Inquiry into the Nature and Causes of the Wealth of Nations. 1976th ed.
The Clarendon Press, Oxford.
Smith, Carol A.
2002 Concordant Change and Core-Periphery Dynamics: A Synthesis of Highland
Mesoamerican Survey Data. Unpublished Ph.D. dissertation, Department of
Anthropology, University of Georgia, Athens.
Smith, Philip E. L.
1976 Food Production and Its Consequences. Benjamin-Cummings Publishing,
Menlo Park.
Smith, Ronald F.
2007 An Individual-based Comparative Advantage Model: Did Economic
Specialization Mediate the Fluctuating Climate of the Late Pleistocene During the
Transition from Neanderthals to Modern Humans? Unpublished Ph.D. dissertation,
Department of Anthropology, Rutgers University, New Brunswick, NJ.
Snow, David H.
1981 Protohistoric Rio Grande Pueblo Economics: A Review of Trends. In The
Protohistoric Period in the North American Southwest, A.D. 1450-1700, edited by
David R. Wilcox and W. Bruce Masse, pp. 354-377. Anthropological Research
Papers No. 24, Arizona State University, Tempe.
Söderlund, Ernst
1943 Stockholms Hantverkarklass, 1720-1772, Sociala och Ekonomiska
Förhållanden. Norstedt, Stockholm.
Spielmann, Katherine A.
1986 Interdependence among Egalitarian Societies. Journal of Anthropological
Archaeology 5:279-312.
238
1998a Ritual Craft Specialists in Middle Range Societies. In Craft and Social
Identity, edited by Cathy L. Costin and Rita P. Wright, pp. 153-159. American
Anthropological Association, Arlington, VA.
1998b Ritual Influences on the Development of Rio Grande Glaze A Ceramics. In
Migration and Reorganization: The Pueblo IV Period in the American Southwest,
Vol. 51, edited by Katherine A. Spielmann, pp. 253-261. Anthropological Research
Paper No. 51, Arizona State University, Tempe.
2002 Feasting, Craft Specialization, and the Ritual Mode of Production in Small-
Scale Societies. American Anthropologist 104(1):195-207.
2004 Communal Feasting, Ceramics, and Exchange. In Identity, Feasting, and the
Archaeology of the Greater Southwest, edited by Barbara J. Mills, pp. 210-232.
University of Colorado Press, Boulder.
Spier, Leslie
1970 Yuman Tribes of the Gila River. Dover Publications, New York.
Stark, Miriam T.
1991 Ceramic Production and Community Specialization: A Kalinga
Ethnoarchaeological Study. World Archaeology 23(1):64-78.
Stark, Miriam T., and James M. Heidke
1998 Ceramic manufacture, productive specialization, and the early Classic period in
Arizona's Tonto Basin. Journal of Anthropological Research 54(4):497-517.
Stark, Miriam T., Mark D. Elson, and Jeffrey J. Clark
1998 Social Boundaries and Technical Choices in Tonto Basin Prehistory. In The
Archaeology of Social Boundaries, pp. 208-231. Smithsonian Institution Press,
Washington, D.C.
Stark, Miriam T., Ronald L. Bishop, and Elizabeth J. Miksa
2000 Ceramic technology and social boundaries: cultural practices in Kalinga clay
selection and use. Journal of Archaeological Method and Theory 7(4):295-331.
Stevenson, Matilda Coxe
1904 The Zuni Indians: Their Mythology, Esoteric Societies, and Fraternities.
Twenty-third Annual Report of the Bureau of American Ethnology, 1901-1902, U.S.
Government Printing Office, Washington, D.C.
Stoeppelmann, Janet
1995 Dirt for Making Things: An Apprenticeship in Maricopa Pottery. Northland
Publishing, Phoenix.
239
Strathern, Marilyn
1984 Domesticity and the Denigration of Women. In Rethinking Women's Roles,
edited by D. O'Brien and S. Tiffany, pp. 13-31. University of California Press,
Berkeley.
Teague, Lynn S.
1984 Role and Ritual in Hohokam Society. In Hohokam Archaeology along the
Salt–Gila Aqueduct, Central Arizona Project, Vol. IX: Synthesis and Conclusions,
edited by Lynn S. Teague and Patricia L. Crown, pp. 155-186. Arizona State
Museum Archaeological Series, University of Arizona, Tucson.
Tibbett, Kevin
2004 Risk and Economic Reciprocity: An Analysis of Three Regional Aboriginal
Food-sharing Systems in Late Holocene Australia. Australian Archaeology 58:7-10.
Toll, H. Wolcott
1981 Ceramic Comparisons Concerning Redistribution in Chaco Canyon, New
Mexico. In Production and Distribution: A Ceramic Viewpoint, edited by H. Howard
and E. Morris, pp. 83-120. British Archaeological Reports No. 120, Oxford.
1991 Material Distributions and Exchange in the Chaco System. In Chaco and
Hohokam: Prehistoric Regional Systems in the American Southwest, edited by
Patricia L. Crown and W. James Judge, pp. 77-107. School of American Research,
Santa Fe.
2001 Making and Breaking Pots in the Chaco World. American Antiquity 66(1):56-
78.
Toll, H. Wolcott, Thomas C. Windes, and Peter J. McKenna
1980 Late Ceramic Patterns in Chaco Canyon: The Pragmatics of Modeling Ceramic
Exchange. In Models and Methods in Regional Exchange, edited by Robert E. Fry.
Society for American Archaeology papers 1:95-117.
Tucker, Josiah
1755 The Elements of Commerce and Theory of Taxes. Private printing, London.
1774 Four Tracts on Political and Commercial Subjects. R. Taikes, Gloucester, UK.
Turner, Bill L., II, and William E. Doolittle
1978 The Concept and Measure of Agricultural Intensity. Professional Geographer
30(3):297-301.
Turney, Omar A.
1929 Prehistoric Irrigation. Arizona Historical Review 2(2):11-52.
240
van der Leeuw, Sander E.
1984 Dust to Dust: A Transformational View of the Ceramic Cycle. In The Many
Dimensions of Pottery: Ceramics in Archaeology and Anthropology, edited by
Sander E. van der Leeuw and Alison C. Pritchard, pp. 707-773. Cigvula 7. Albert
Egges van Giffen Institut voor Prae- an Protohistoire, University van Amsterdam,
Amsterdam.
Van Keuren, Scott
2004 Crafting Feasts in the Prehispanic Southwest. In Identity, Feasting, and the
Archaeology of the Greater Southwest, edited by Barbara J. Mills, pp. 192-209.
University Press of Colorado, Boulder.
Van Keuren, Scott, Susan L. Stinson, and David R. Abbott
1997 Specialized Production of Hohokam Plain Ware Ceramics in the Lower Salt
River Valley. Kiva 63(2):155-175.
Vaughn, Kevin J.
2006 Craft Production, Exchange, and Political Power in the Pre-Incaic Andes.
Journal of Archaeological Research 14(4):313-344.
Voutsaki, Sofia
1995 Value and Exchange in Premonetary Societies: Anthropological Debates and
Aegean Archaeology. In Trade and Production in Premonetary Greece: Aspects of
Trade, edited by Carole Gillis, Christina Risberg and Birgitta Sjoberg, pp. 7-19. Paul
Ĺströms Förlag, Jonsered.
Wailes, Bernard (editor)
1996 Craft specialization and social evolution : in memory of V. Gordon Childe.
Vol. 6, University Museum of Archaeology and Anthropology, University of
Pennsylvania, Philadelphia.
Walker, Phillip L., Gregory Dean, and Perry Shapiro
1991 Estimating Age from Tooth Wear in Archaeological Populations. In Advances
in Dental Anthropology, edited by Marc Kelley and Clark Spencer Larsen, pp. 169-
178. Alan R. Liss, New York.
Wallace, Henry D.
1992 Cross-dating the Gila Butte Phase, and a Reconsideration of the Ceramic Type
Gila Butte Red-on-buff. In The Rye Creek Project: Archaeology in the Upper Tonto
Basin, Vol. 3: Synthesis and Conclusions, edited by Mark D. Elson and Douglas B.
Craig, pp. 29-54. Anthropological Papers No. 11. Center for Desert Archaeology,
Tucson.
241
1994 An Iconographic Perspective on the Sequence of Culture Change in Central
and Southern Arizona. Paper presented at the Southwest Symposium, Tempe,
Arizona.
1995 Decorated Buffware and Brownware Ceramics. In The Roosevelt Community
Development Study, Volume 2: Ceramic Chronology, Technology, and Economics,
edited by James M. Heidke and Miriam T. Stark, pp. 19-84. Anthropological Papers
No. 14, Center for Desert Archaeology, Tucson, AZ.
2001 Time Seriation and Typological Refinement of the Middle Gila Buffware
Sequence: Snaketown Through Soho Phases. In The Grewe Archaeological
Research Project, Volume 2, Part 1. Ceramic Studies, edited by David R. Abbott,
pp. 177-262. Northland Research, Tempe.
2004 Update to the Middle Gila Buff Ware Ceramic Sequence. In Hohokam
Farming on the Salt River Floodplain: Refining Models and Analytical Methods,
edited by T. Kathleen Henderson, pp. 45-124. Center for Desert Archaeology,
Tucson.
Wallace, Henry D., and Douglas B. Craig
1988 A Reconsideration of the Tucson Basin Hohokam Chronology. In Recent
Research on Tucson Basin Prehistory: Proceedings of the Second Tucson Basin
Conference, edited by William H. Doelle and Paul R. Fish, pp. 9-29.
Anthropological Papers No. 10. Institute for American Research, Tucson.
Wallace, Henry D., James M. Heidke, and William H. Doelle
1995 Hohokam origins. Kiva 60(4):575-618.
Walsh-Anduze, Mary-Ellen
1993 The Sourcing of Hohokam Red-on-buff Ceramics Using Inductively Coupled
Plasma Spectroscopy: "Schist Happens". Unpublished M.A. thesis, Department of
Anthropology, Northern Arizona University, Flagstaff.
Walsh-Anduze, Mary-Ellen, and David R. Abbott
1994 Pueblo Grande Whole Vessel Study: An Examination of Production and Short
Distance Exchange. In The Pueblo Grande Project, Volume 3: Ceramics and the
Production and Exchange of Pottery in the Central Phoenix Basin, edited by David
R. Abbott, pp. 149-259. Publications in Archaeology No. 20, Soil Systems, Phoenix.
Wang, Ning
2003 Measuring Transaction Costs: An Incomplete Survey. Working Paper No. 2,
Ronald Coase Institute, St. Louis.
242
Warren, A. Helene
1969 Tonque: One Pueblo's Glaze Pottery Industry Dominated Middle Rio Grande
Commerce. El Palacio 76(2):36-42.
1970 Notes on Manufacture and Trade of Rio Grande Glazes. The Artifact 8(4):1-7.
1979 The Glaze Paint Wares of the Upper Middle Rio Grande. In Archaeological
Investigations in Cochiti Reservoir, New Mexico. Vol. 4: Adaptive Changes in the
Northern Rio Grande Valley, edited by Jan V. Biella and Richard C. Chapman, pp.
187-216. Office of Contract Archaeology, Department of Anthropology, University
of New Mexico, Albuquerque.
Watkins, Christopher N.
2011 The Organization of Agricultural Labor Among Smallholder Irrigation
Agriculturalists: Implications for the Phoenix Basin Hohokam. Journal of Arizona
Archaeology 1(2):105-119.
Wattenmaker, Patricia A.
1990 The Social Context of Specialized Production: Reorganization of Household
Craft and Food Economies in an Early Near Eastern State. Unpublished Ph.D.
dissertation, Department of Anthropology, University of Michigan, Ann Arbor.
Watts, Joshua
2011 Agriculture and Specialized Production: A View from the Desert. Working
paper. School of Human Evolution and Social Change, Arizona State University,
Tempe, AZ.
Weiner, Annette B.
1986 Forgotten Wealth: Cloth and Women's Production in the Pacific. In Women's
Work: Development and the Division of Labor by Gender, edited by E. Leacock and
H. Safa, pp. 96-110. Bergin and Garvey, South Hadley, MA.
1992 Inalienable Possessions: The Paradox of Keeping-While-Giving. University of
California Press, Berkeley.
White, Devin Alan
2004 Hohokam palettes. Vol. 196, Arizona State Museum, University of Arizona,
Tucson.
White, Devon, and Stephen H. Lekson
2001 Early Hohokam. In Encyclopedia of Prehistory: Volume 6: North America,
edited by Peter N. Peregrine and Melvin Ember, pp. 98-114. Springer, New York.
243
White, Joyce C., and Vincent C. Pigott
1996 From Community Craft to Regional Specialization: Intensification of Copper
Production in Pre-state Thailand. In Craft Specialization and Social Evolution: In
Memory of V. Gordon Childe, edited by Bernard Wailes, pp. 151-175. University of
Pennsylvania Museum, Philadelphia.
Whittlesey, Stephanie M.
2007 Hohokam Ceramics, Hohokam Beliefs. In The Hohokam Millennium, edited by
Suzanne K. Fish and Paul R. Fish, pp. 65-74. School for Advanced Research, Santa
Fe.
Wilcox, David R.
1979 The Hohokam Regional System. In An Archaeological Test of Sites in the Gila
Butte-Santan Region, South-Central Arizona, edited by Glen E. Rice, David R.
Wilcox, Kevin Rafferty and James Schoenwetter, pp. 77-116. Anthropological
Research Papers No. 18. Arizona State University, Tempe.
1987 The Evolution of Hohokam Ceremonial Systems. In Astronomy and Ceremony
in the Prehistoric Southwest, edited by John B. Carlson and W. James Judge, pp.
149-168. Papers of the Maxwell Museum of Anthropology, No. 2, Albuquerque.
1991a Mesoamerican ballgame in the American Southwest. In The Mesoamerican
Ballgame, edited by Vernon Scarborough and David R. Wilcox, pp. 101-125.
University of Arizona Press, Tucson.
1991b Hohokam Religion: An Archaeologist's Perspective. In The Hohokam:
Ancient Peoples of the Desert, edited by David Grant Nobel, pp. 47-59. School of
American Research Press, Santa Fe.
1993 Pueblo Grande in the Early Twentieth Century. In Archaeology of the Pueblo
Grande Platform Mound and Surrounding Features, Vol. 1: Introduction to the
Archival Project and History of Archaeological Research, edited by Christian E.
Downum and Todd W. Bostwick, pp. 43-72. Pueblo Grande Museum
Anthropological Papers No. 1. City of Phoenix Parks, Recreation and Library
Department, Pueblo Grande Museum, Phoenix.
Wilcox, David R., and Charles Sternberg
1983 Hohokam Ballcourts and their Interpretation. Archaeological Series No. 160.
Arizona State Museum, Tucson.
Wilcox, David R., Randall H. McGuire, and Charles Sternberg
1981 Snaketown Revisited. Arizona State Museum Archaeological Series, No. 155,
University of Arizona, Tucson, AZ.
244
Wilcox, David R., Jerry B. Howard, and Ruben H. Nelson
1990 One Hundred Years of Archaeology at La Ciudad de los Hornos. Publications
in Archaeology No. 16. Soil Systems, Phoenix.
Wilshusen, Richard H.
1989 Architecture as Artifact. Part II: A Comment on Gilman. American Antiquity
54(4):826-833.
Wobst, H. Martin
1977 Stylistic Behavior and Information Exchange. In For the Director: Research
Essays in Honor of James B. Griffin. edited by C. Cleland, pp. 317-342.
Anthropological Paper 61, University of Michigan Museum of Anthropology, Ann
Arbor.
Wood, Donald G.
1971a Archaeological Reconnaissance of the Gila River Indian Reservation--Phase
II. Archaeological Series No. 7, Arizona State Museum, Tucson.
1971b A Summary of the Recorded Archaeological Sites on the Gila River Indian
Reservation. :Archaeological Series No. 3, Arizona State Museum-Tucson.
1972 Recorded Archaeological Sites on the Gila River Indian Reservation: Phase
III. Archaeological Series No. 16. Arizona State Museum. University of Arizona,
Tucson.
Woodson, M. Kyle
2002 Archaeological Investigations at the Sweetwater Site on the Gila River Indian
Community. CRMP Technical Report No. 2002-14. Cultural Resource Management
Program, Gila River Indian Community, Sacaton.
2007 Building and Cleaning the Snaketown Canal: Hohokam Labor Requirements
and Work Force Sizes in the Middle Gila River Valley. Paper presented at the
Arizona Archaeological Council Fall Conference: Going with the Flow: Current
Research in Prehistoric Irrigation Technology, Mesa, AZ.
2010 The Social Organization of Hohokam Irrigation in the Middle Gila River
Valley, Arizona. Unpublished Ph.D. dissertation, School of Human Evolution and
Social Change, Arizona State University, Tempe, AZ.
2011 Hohokam Pottery Production Areas and the Organization of Ceramic
Production and Exchange in the Phoenix Basin. Journal of Arizona Archaeology
1(2):128-147.
245
Wylie, Alison
1992 Feminist Theories of Social Power Some Implications for a Processual
Archaeology. Norwegian Archaeological Review 25(1):51-68.
Yang, Ling, and Xueguang Zhou
2009 Transaction Costs, Social Institutions, and the Duration of Interfirm Contracts
in China. In Work and Organizations in China After Thirty Years of Transition
(Research in the Sociology of Work, Volume 19), edited by Lisa Keister, pp. 69-104.
Emerald Group Publishing Limited, Bingley, UK.
Yang, Xiaokai
2001 Economics: New Classical Versus Neoclassical Frameworks. Blackwell,
Boston.
2003 Economic Development and the Division of Labor. Blackwell, Malden, MA.
Yang, Xiaokai, and Yew-Kwang Ng
1993 Specialization and Economic Organization, a New Classical Microeconomic
Framework. North-Holland, Amsterdam.
Yang, Xiaokai, and Siang Ng
1998 Specialization and Division of Labour: A Survey. In Increasing Returns and
Economic Analysis, edited by Kenneth J. Arrow, Yew-Kwang Ng and Xiaokai Yang,
pp. 3-70. Macmillan, London.
Young, Allyn
1928 Increasing Returns and Economic Progress. The Economic Journal 38:527-
542.
246
APPENDIX A
RESEARCH COLLABORATOR AGREEMENT WITH THE CULTURAL
RESOURCE MANAGEMENT PROGRAM OF THE GILA RIVER INDIAN
COMMUNITY

247

248

249
APPENDIX B
SUPPLEMENTARY TABLES FOR METHODS CHAPTER
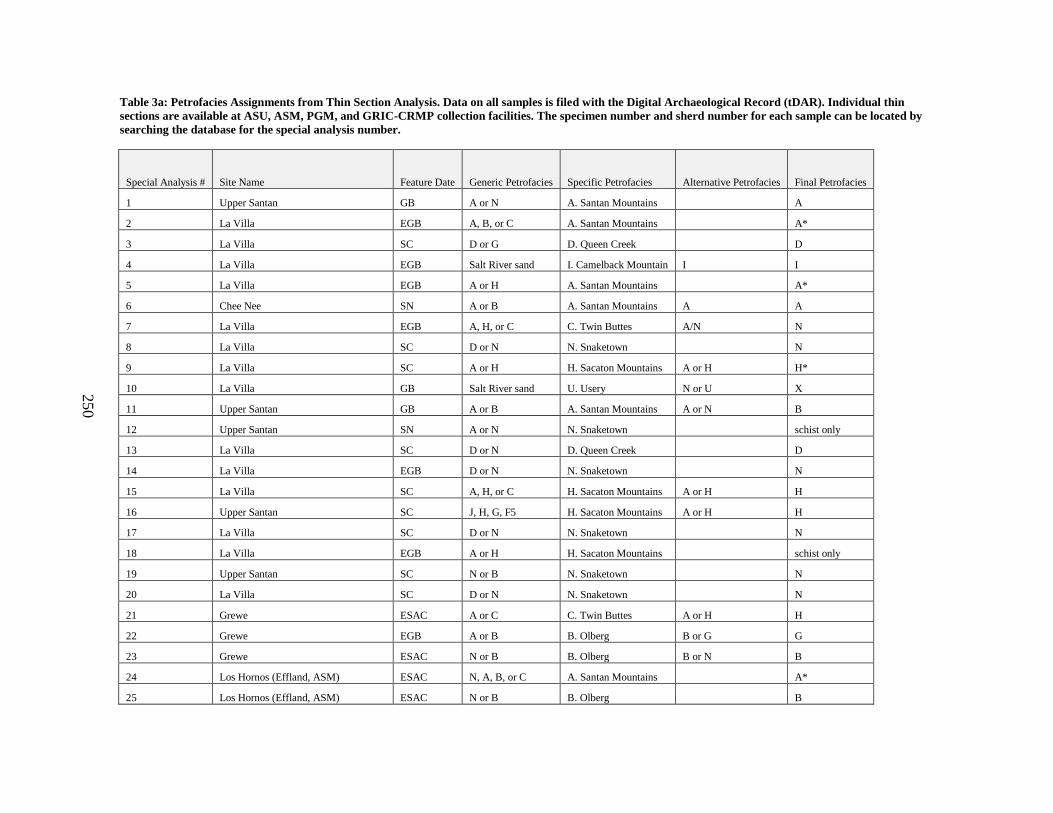
250
Table 3a: Petrofacies Assignments from Thin Section Analysis. Data on all samples is filed with the Digital Archaeological Record (tDAR). Individual thin
sections are available at ASU, ASM, PGM, and GRIC-CRMP collection facilities. The specimen number and sherd number for each sample can be located by
searching the database for the special analysis number.
Special Analysis # Site Name Feature Date Generic Petrofacies Specific Petrofacies Alternative Petrofacies Final Petrofacies
1 Upper Santan GB A or N A. Santan Mountains A
2 La Villa EGB A, B, or C A. Santan Mountains A*
3 La Villa SC D or G D. Queen Creek D
4 La Villa EGB Salt River sand I. Camelback Mountain I I
5 La Villa EGB A or H A. Santan Mountains A*
6 Chee Nee SN A or B A. Santan Mountains A A
7 La Villa EGB A, H, or C C. Twin Buttes A/N N
8 La Villa SC D or N N. Snaketown N
9 La Villa SC A or H H. Sacaton Mountains A or H H*
10 La Villa GB Salt River sand U. Usery N or U X
11 Upper Santan GB A or B A. Santan Mountains A or N B
12 Upper Santan SN A or N N. Snaketown schist only
13 La Villa SC D or N D. Queen Creek D
14 La Villa EGB D or N N. Snaketown N
15 La Villa SC A, H, or C H. Sacaton Mountains A or H H
16 Upper Santan SC J, H, G, F5 H. Sacaton Mountains A or H H
17 La Villa SC D or N N. Snaketown N
18 La Villa EGB A or H H. Sacaton Mountains schist only
19 Upper Santan SC N or B N. Snaketown N
20 La Villa SC D or N N. Snaketown N
21 Grewe ESAC A or C C. Twin Buttes A or H H
22 Grewe EGB A or B B. Olberg B or G G
23 Grewe ESAC N or B B. Olberg B or N B
24 Los Hornos (Effland, ASM) ESAC N, A, B, or C A. Santan Mountains A*
25 Los Hornos (Effland, ASM) ESAC N or B B. Olberg B
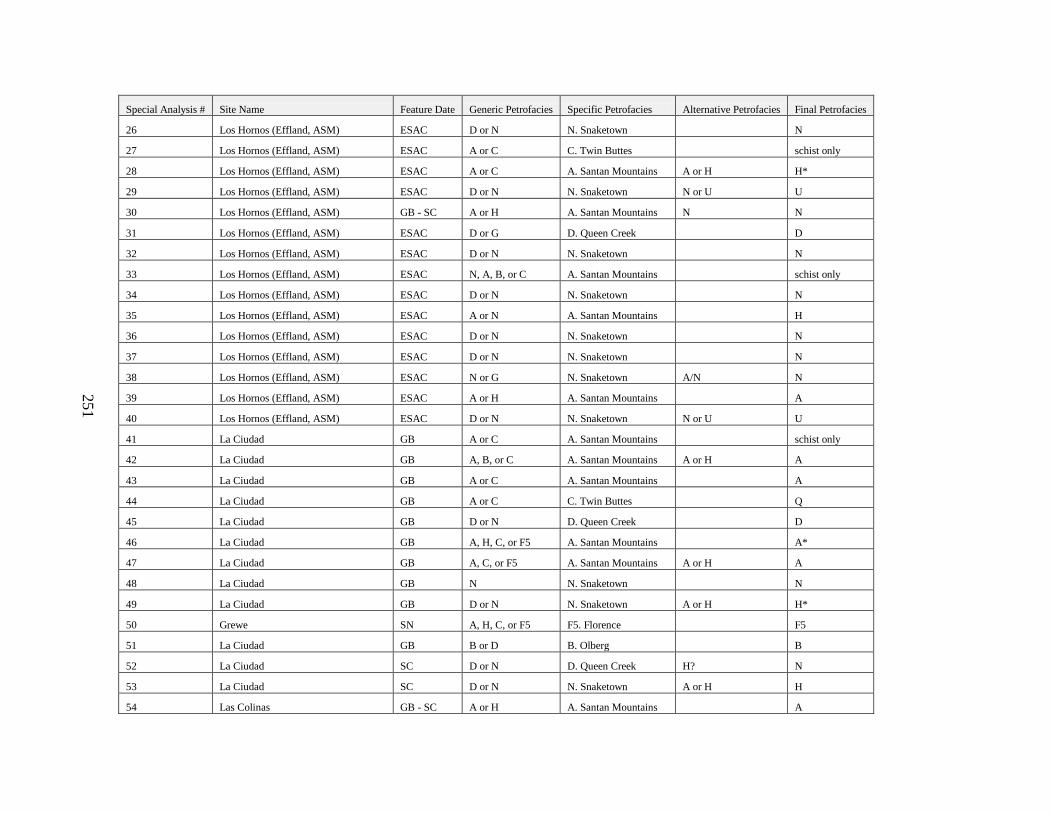
251
Special Analysis # Site Name Feature Date Generic Petrofacies Specific Petrofacies Alternative Petrofacies Final Petrofacies
26 Los Hornos (Effland, ASM) ESAC D or N N. Snaketown N
27 Los Hornos (Effland, ASM) ESAC A or C C. Twin Buttes schist only
28 Los Hornos (Effland, ASM) ESAC A or C A. Santan Mountains A or H H*
29 Los Hornos (Effland, ASM) ESAC D or N N. Snaketown N or U U
30 Los Hornos (Effland, ASM) GB - SC A or H A. Santan Mountains N N
31 Los Hornos (Effland, ASM) ESAC D or G D. Queen Creek D
32 Los Hornos (Effland, ASM) ESAC D or N N. Snaketown N
33 Los Hornos (Effland, ASM) ESAC N, A, B, or C A. Santan Mountains schist only
34 Los Hornos (Effland, ASM) ESAC D or N N. Snaketown N
35 Los Hornos (Effland, ASM) ESAC A or N A. Santan Mountains H
36 Los Hornos (Effland, ASM) ESAC D or N N. Snaketown N
37 Los Hornos (Effland, ASM) ESAC D or N N. Snaketown N
38 Los Hornos (Effland, ASM) ESAC N or G N. Snaketown A/N N
39 Los Hornos (Effland, ASM) ESAC A or H A. Santan Mountains A
40 Los Hornos (Effland, ASM) ESAC D or N N. Snaketown N or U U
41 La Ciudad GB A or C A. Santan Mountains schist only
42 La Ciudad GB A, B, or C A. Santan Mountains A or H A
43 La Ciudad GB A or C A. Santan Mountains A
44 La Ciudad GB A or C C. Twin Buttes Q
45 La Ciudad GB D or N D. Queen Creek D
46 La Ciudad GB A, H, C, or F5 A. Santan Mountains A*
47 La Ciudad GB A, C, or F5 A. Santan Mountains A or H A
48 La Ciudad GB N N. Snaketown N
49 La Ciudad GB D or N N. Snaketown A or H H*
50 Grewe SN A, H, C, or F5 F5. Florence F5
51 La Ciudad GB B or D B. Olberg B
52 La Ciudad SC D or N D. Queen Creek H? N
53 La Ciudad SC D or N N. Snaketown A or H H
54 Las Colinas GB - SC A or H A. Santan Mountains A
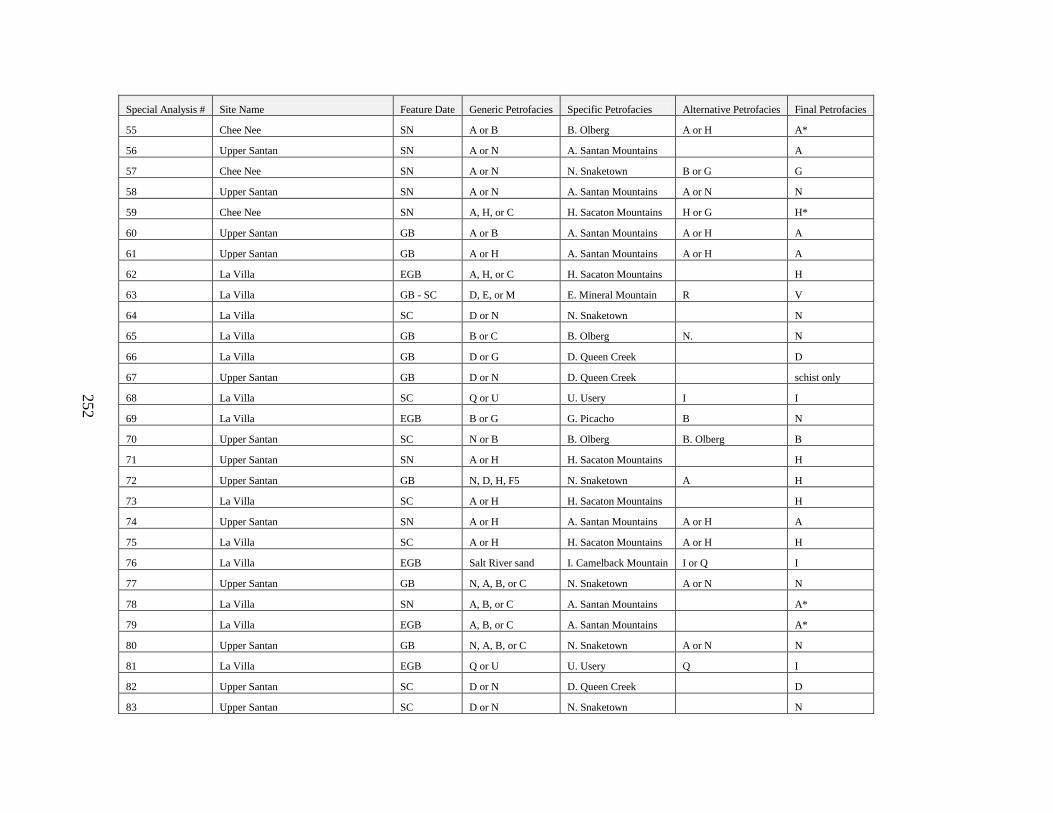
252
Special Analysis # Site Name Feature Date Generic Petrofacies Specific Petrofacies Alternative Petrofacies Final Petrofacies
55 Chee Nee SN A or B B. Olberg A or H A*
56 Upper Santan SN A or N A. Santan Mountains A
57 Chee Nee SN A or N N. Snaketown B or G G
58 Upper Santan SN A or N A. Santan Mountains A or N N
59 Chee Nee SN A, H, or C H. Sacaton Mountains H or G H*
60 Upper Santan GB A or B A. Santan Mountains A or H A
61 Upper Santan GB A or H A. Santan Mountains A or H A
62 La Villa EGB A, H, or C H. Sacaton Mountains H
63 La Villa GB - SC D, E, or M E. Mineral Mountain R V
64 La Villa SC D or N N. Snaketown N
65 La Villa GB B or C B. Olberg N. N
66 La Villa GB D or G D. Queen Creek D
67 Upper Santan GB D or N D. Queen Creek schist only
68 La Villa SC Q or U U. Usery I I
69 La Villa EGB B or G G. Picacho B N
70 Upper Santan SC N or B B. Olberg B. Olberg B
71 Upper Santan SN A or H H. Sacaton Mountains H
72 Upper Santan GB N, D, H, F5 N. Snaketown A H
73 La Villa SC A or H H. Sacaton Mountains H
74 Upper Santan SN A or H A. Santan Mountains A or H A
75 La Villa SC A or H H. Sacaton Mountains A or H H
76 La Villa EGB Salt River sand I. Camelback Mountain I or Q I
77 Upper Santan GB N, A, B, or C N. Snaketown A or N N
78 La Villa SN A, B, or C A. Santan Mountains A*
79 La Villa EGB A, B, or C A. Santan Mountains A*
80 Upper Santan GB N, A, B, or C N. Snaketown A or N N
81 La Villa EGB Q or U U. Usery Q I
82 Upper Santan SC D or N D. Queen Creek D
83 Upper Santan SC D or N N. Snaketown N
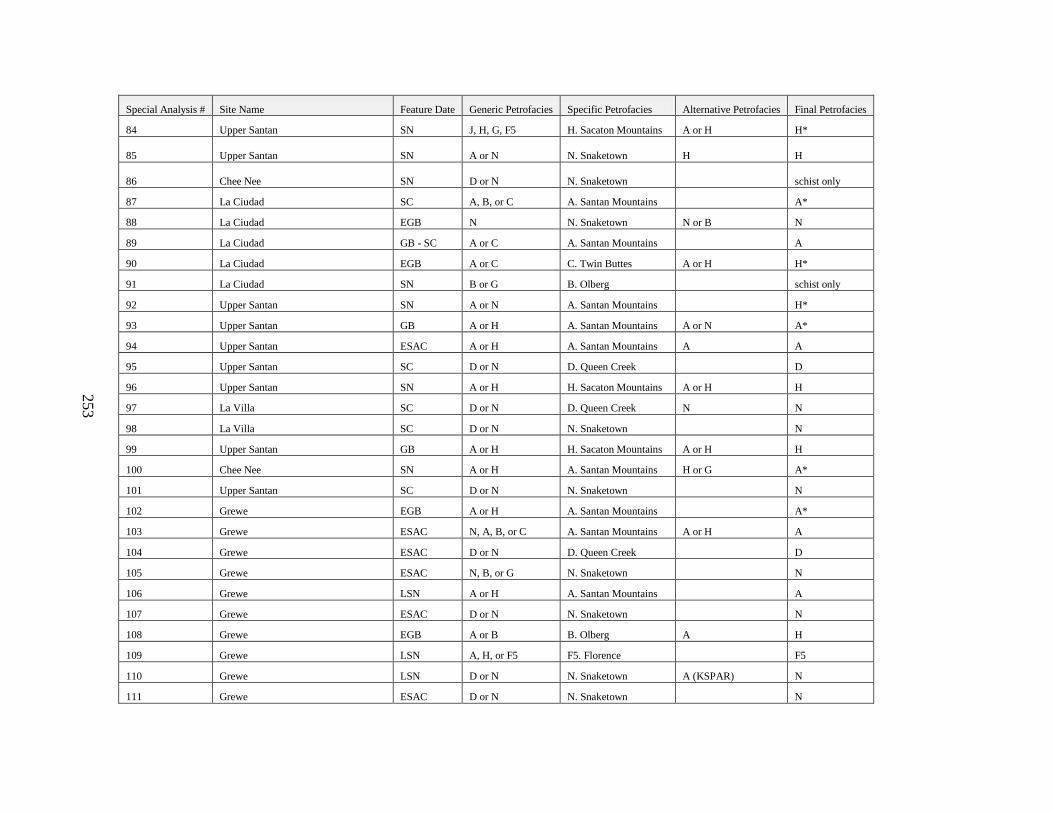
253
Special Analysis # Site Name Feature Date Generic Petrofacies Specific Petrofacies Alternative Petrofacies Final Petrofacies
84 Upper Santan SN J, H, G, F5 H. Sacaton Mountains A or H H*
85 Upper Santan SN A or N N. Snaketown H H
86 Chee Nee SN D or N N. Snaketown schist only
87 La Ciudad SC A, B, or C A. Santan Mountains A*
88 La Ciudad EGB N N. Snaketown N or B N
89 La Ciudad GB - SC A or C A. Santan Mountains A
90 La Ciudad EGB A or C C. Twin Buttes A or H H*
91 La Ciudad SN B or G B. Olberg schist only
92 Upper Santan SN A or N A. Santan Mountains H*
93 Upper Santan GB A or H A. Santan Mountains A or N A*
94 Upper Santan ESAC A or H A. Santan Mountains A A
95 Upper Santan SC D or N D. Queen Creek D
96 Upper Santan SN A or H H. Sacaton Mountains A or H H
97 La Villa SC D or N D. Queen Creek N N
98 La Villa SC D or N N. Snaketown N
99 Upper Santan GB A or H H. Sacaton Mountains A or H H
100 Chee Nee SN A or H A. Santan Mountains H or G A*
101 Upper Santan SC D or N N. Snaketown N
102 Grewe EGB A or H A. Santan Mountains A*
103 Grewe ESAC N, A, B, or C A. Santan Mountains A or H A
104 Grewe ESAC D or N D. Queen Creek D
105 Grewe ESAC N, B, or G N. Snaketown N
106 Grewe LSN A or H A. Santan Mountains A
107 Grewe ESAC D or N N. Snaketown N
108 Grewe EGB A or B B. Olberg A H
109 Grewe LSN A, H, or F5 F5. Florence F5
110 Grewe LSN D or N N. Snaketown A (KSPAR) N
111 Grewe ESAC D or N N. Snaketown N
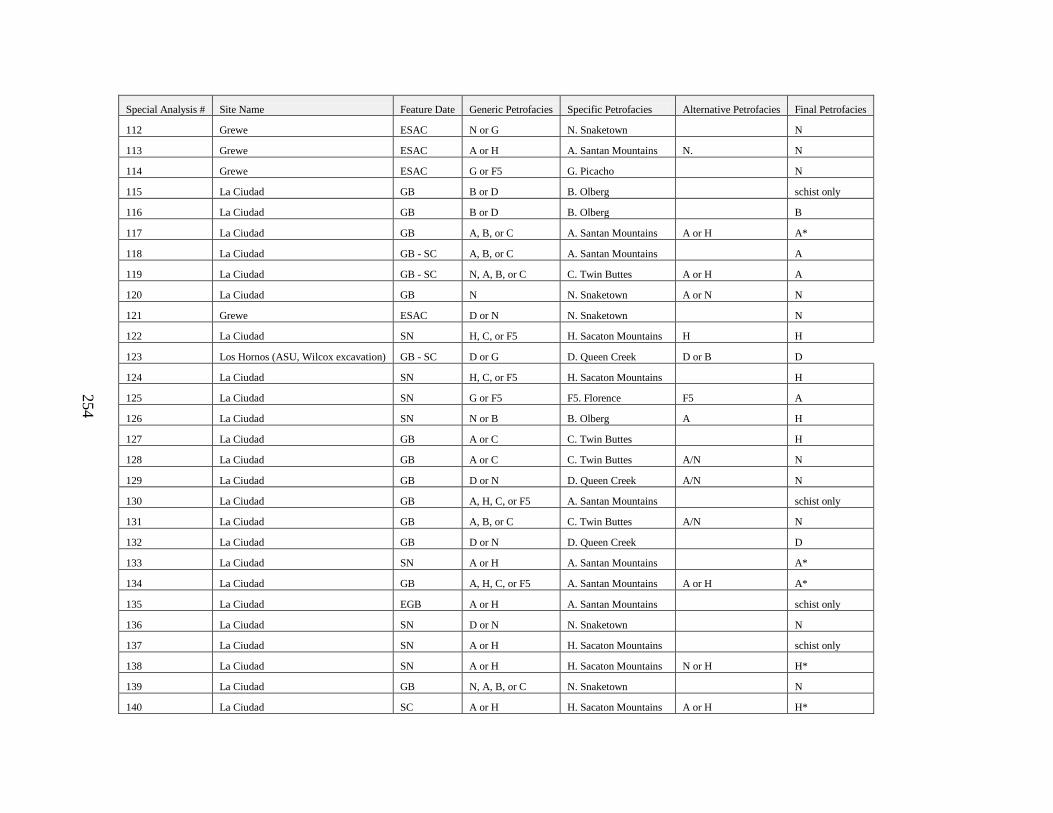
254
Special Analysis # Site Name Feature Date Generic Petrofacies Specific Petrofacies Alternative Petrofacies Final Petrofacies
112 Grewe ESAC N or G N. Snaketown N
113 Grewe ESAC A or H A. Santan Mountains N. N
114 Grewe ESAC G or F5 G. Picacho N
115 La Ciudad GB B or D B. Olberg schist only
116 La Ciudad GB B or D B. Olberg B
117 La Ciudad GB A, B, or C A. Santan Mountains A or H A*
118 La Ciudad GB - SC A, B, or C A. Santan Mountains A
119 La Ciudad GB - SC N, A, B, or C C. Twin Buttes A or H A
120 La Ciudad GB N N. Snaketown A or N N
121 Grewe ESAC D or N N. Snaketown N
122 La Ciudad SN H, C, or F5 H. Sacaton Mountains H H
123 Los Hornos (ASU, Wilcox excavation) GB - SC D or G D. Queen Creek D or B D
124 La Ciudad SN H, C, or F5 H. Sacaton Mountains H
125 La Ciudad SN G or F5 F5. Florence F5 A
126 La Ciudad SN N or B B. Olberg A H
127 La Ciudad GB A or C C. Twin Buttes H
128 La Ciudad GB A or C C. Twin Buttes A/N N
129 La Ciudad GB D or N D. Queen Creek A/N N
130 La Ciudad GB A, H, C, or F5 A. Santan Mountains schist only
131 La Ciudad GB A, B, or C C. Twin Buttes A/N N
132 La Ciudad GB D or N D. Queen Creek D
133 La Ciudad SN A or H A. Santan Mountains A*
134 La Ciudad GB A, H, C, or F5 A. Santan Mountains A or H A*
135 La Ciudad EGB A or H A. Santan Mountains schist only
136 La Ciudad SN D or N N. Snaketown N
137 La Ciudad SN A or H H. Sacaton Mountains schist only
138 La Ciudad SN A or H H. Sacaton Mountains N or H H*
139 La Ciudad GB N, A, B, or C N. Snaketown N
140 La Ciudad SC A or H H. Sacaton Mountains A or H H*
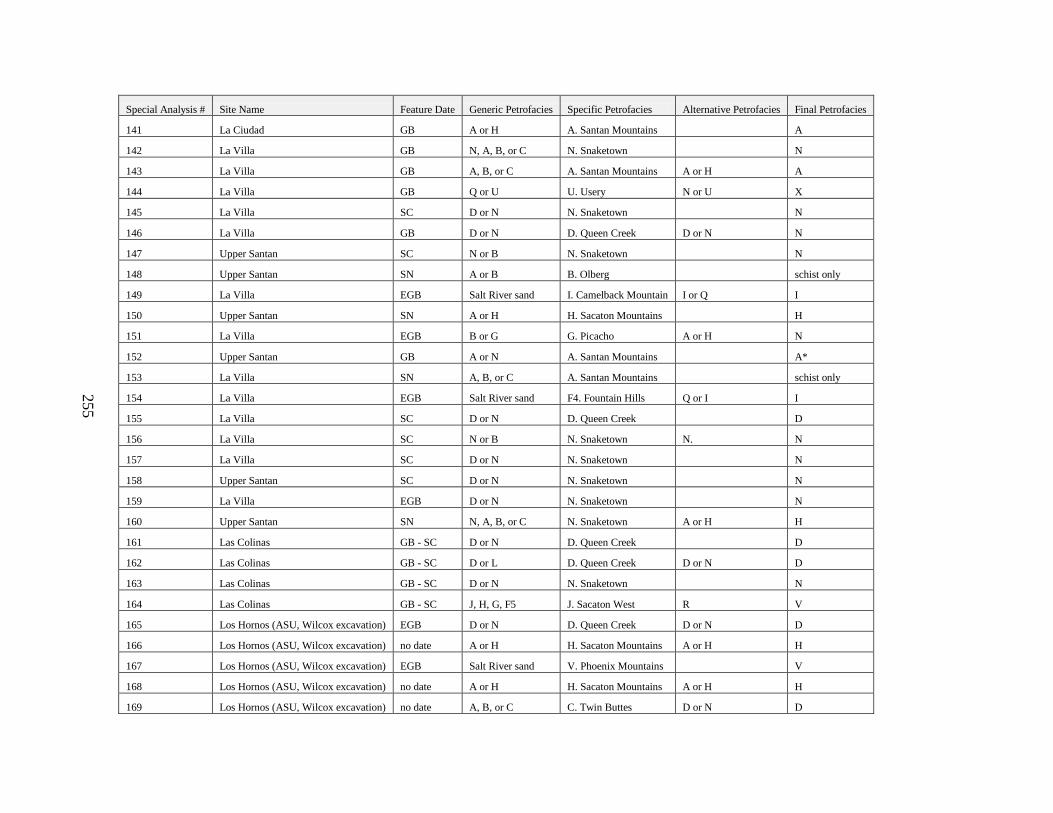
255
Special Analysis # Site Name Feature Date Generic Petrofacies Specific Petrofacies Alternative Petrofacies Final Petrofacies
141 La Ciudad GB A or H A. Santan Mountains A
142 La Villa GB N, A, B, or C N. Snaketown N
143 La Villa GB A, B, or C A. Santan Mountains A or H A
144 La Villa GB Q or U U. Usery N or U X
145 La Villa SC D or N N. Snaketown N
146 La Villa GB D or N D. Queen Creek D or N N
147 Upper Santan SC N or B N. Snaketown N
148 Upper Santan SN A or B B. Olberg schist only
149 La Villa EGB Salt River sand I. Camelback Mountain I or Q I
150 Upper Santan SN A or H H. Sacaton Mountains H
151 La Villa EGB B or G G. Picacho A or H N
152 Upper Santan GB A or N A. Santan Mountains A*
153 La Villa SN A, B, or C A. Santan Mountains schist only
154 La Villa EGB Salt River sand F4. Fountain Hills Q or I I
155 La Villa SC D or N D. Queen Creek D
156 La Villa SC N or B N. Snaketown N. N
157 La Villa SC D or N N. Snaketown N
158 Upper Santan SC D or N N. Snaketown N
159 La Villa EGB D or N N. Snaketown N
160 Upper Santan SN N, A, B, or C N. Snaketown A or H H
161 Las Colinas GB - SC D or N D. Queen Creek D
162 Las Colinas GB - SC D or L D. Queen Creek D or N D
163 Las Colinas GB - SC D or N N. Snaketown N
164 Las Colinas GB - SC J, H, G, F5 J. Sacaton West R V
165 Los Hornos (ASU, Wilcox excavation) EGB D or N D. Queen Creek D or N D
166 Los Hornos (ASU, Wilcox excavation) no date A or H H. Sacaton Mountains A or H H
167 Los Hornos (ASU, Wilcox excavation) EGB Salt River sand V. Phoenix Mountains V
168 Los Hornos (ASU, Wilcox excavation) no date A or H H. Sacaton Mountains A or H H
169 Los Hornos (ASU, Wilcox excavation) no date A, B, or C C. Twin Buttes D or N D
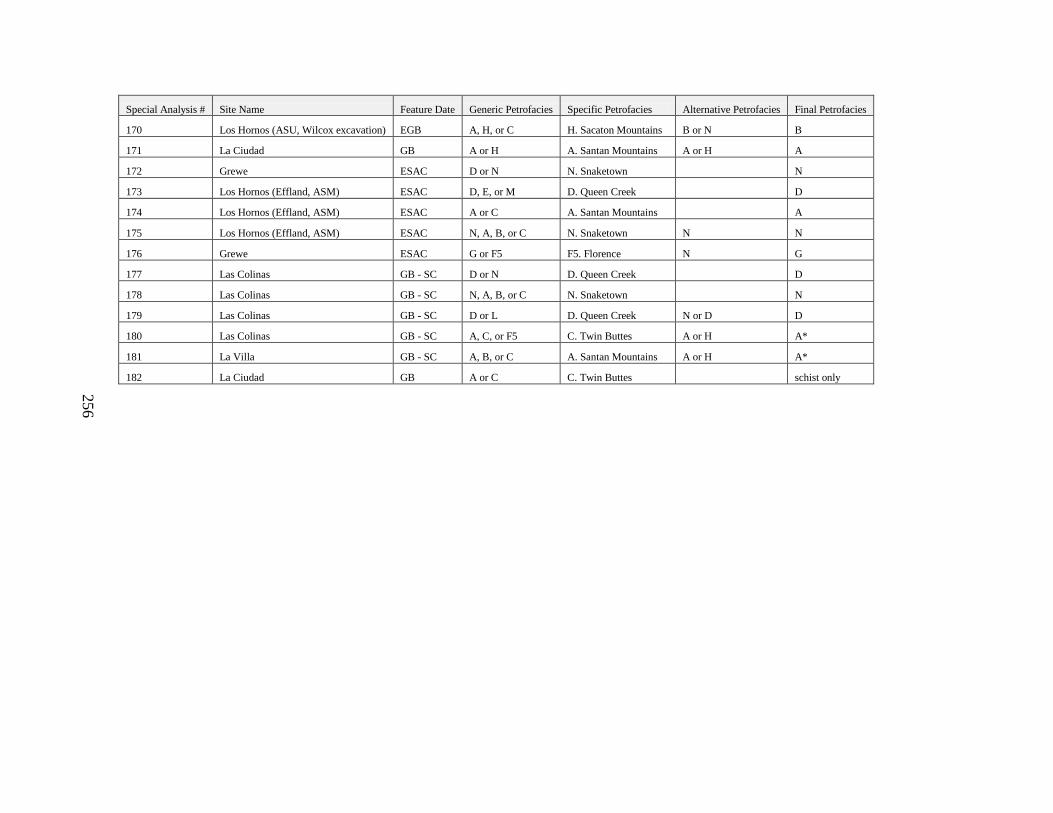
256
Special Analysis # Site Name Feature Date Generic Petrofacies Specific Petrofacies Alternative Petrofacies Final Petrofacies
170 Los Hornos (ASU, Wilcox excavation) EGB A, H, or C H. Sacaton Mountains B or N B
171 La Ciudad GB A or H A. Santan Mountains A or H A
172 Grewe ESAC D or N N. Snaketown N
173 Los Hornos (Effland, ASM) ESAC D, E, or M D. Queen Creek D
174 Los Hornos (Effland, ASM) ESAC A or C A. Santan Mountains A
175 Los Hornos (Effland, ASM) ESAC N, A, B, or C N. Snaketown N N
176 Grewe ESAC G or F5 F5. Florence N G
177 Las Colinas GB - SC D or N D. Queen Creek D
178 Las Colinas GB - SC N, A, B, or C N. Snaketown N
179 Las Colinas GB - SC D or L D. Queen Creek N or D D
180 Las Colinas GB - SC A, C, or F5 C. Twin Buttes A or H A*
181 La Villa GB - SC A, B, or C A. Santan Mountains A or H A*
182 La Ciudad GB A or C C. Twin Buttes schist only
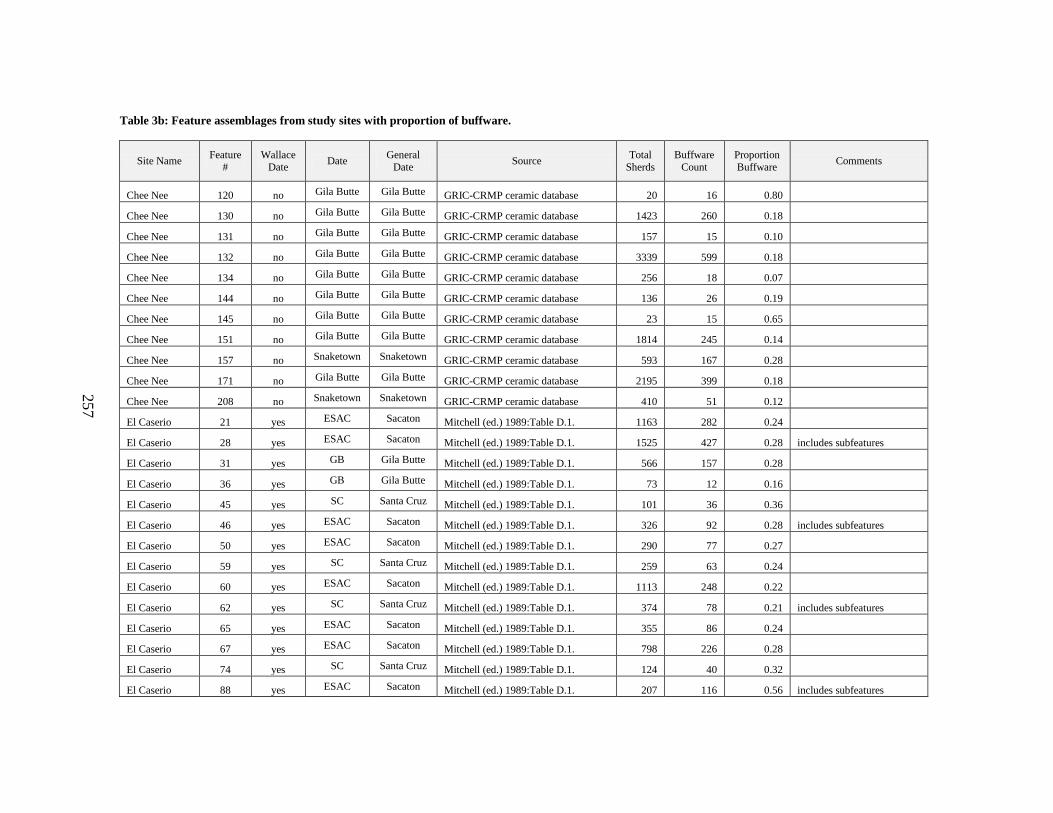
257
Table 3b: Feature assemblages from study sites with proportion of buffware.
Site Name Feature
#
Wallace
Date Date
General
Date Source
Total
Sherds
Buffware
Count
Proportion
Buffware Comments
Chee Nee 120 no Gila Butte Gila Butte GRIC-CRMP ceramic database 20 16 0.80
Chee Nee 130 no Gila Butte Gila Butte GRIC-CRMP ceramic database 1423 260 0.18
Chee Nee 131 no Gila Butte Gila Butte GRIC-CRMP ceramic database 157 15 0.10
Chee Nee 132 no Gila Butte Gila Butte GRIC-CRMP ceramic database 3339 599 0.18
Chee Nee 134 no Gila Butte Gila Butte GRIC-CRMP ceramic database 256 18 0.07
Chee Nee 144 no Gila Butte Gila Butte GRIC-CRMP ceramic database 136 26 0.19
Chee Nee 145 no Gila Butte Gila Butte GRIC-CRMP ceramic database 23 15 0.65
Chee Nee 151 no Gila Butte Gila Butte GRIC-CRMP ceramic database 1814 245 0.14
Chee Nee 157 no Snaketown Snaketown GRIC-CRMP ceramic database 593 167 0.28
Chee Nee 171 no Gila Butte Gila Butte GRIC-CRMP ceramic database 2195 399 0.18
Chee Nee 208 no Snaketown Snaketown GRIC-CRMP ceramic database 410 51 0.12
El Caserio 21 yes ESAC Sacaton Mitchell (ed.) 1989:Table D.1. 1163 282 0.24
El Caserio 28 yes ESAC Sacaton Mitchell (ed.) 1989:Table D.1. 1525 427 0.28 includes subfeatures
El Caserio 31 yes GB Gila Butte Mitchell (ed.) 1989:Table D.1. 566 157 0.28
El Caserio 36 yes GB Gila Butte Mitchell (ed.) 1989:Table D.1. 73 12 0.16
El Caserio 45 yes SC Santa Cruz Mitchell (ed.) 1989:Table D.1. 101 36 0.36
El Caserio 46 yes ESAC Sacaton Mitchell (ed.) 1989:Table D.1. 326 92 0.28 includes subfeatures
El Caserio 50 yes ESAC Sacaton Mitchell (ed.) 1989:Table D.1. 290 77 0.27
El Caserio 59 yes SC Santa Cruz Mitchell (ed.) 1989:Table D.1. 259 63 0.24
El Caserio 60 yes ESAC Sacaton Mitchell (ed.) 1989:Table D.1. 1113 248 0.22
El Caserio 62 yes SC Santa Cruz Mitchell (ed.) 1989:Table D.1. 374 78 0.21 includes subfeatures
El Caserio 65 yes ESAC Sacaton Mitchell (ed.) 1989:Table D.1. 355 86 0.24
El Caserio 67 yes ESAC Sacaton Mitchell (ed.) 1989:Table D.1. 798 226 0.28
El Caserio 74 yes SC Santa Cruz Mitchell (ed.) 1989:Table D.1. 124 40 0.32
El Caserio 88 yes ESAC Sacaton Mitchell (ed.) 1989:Table D.1. 207 116 0.56 includes subfeatures
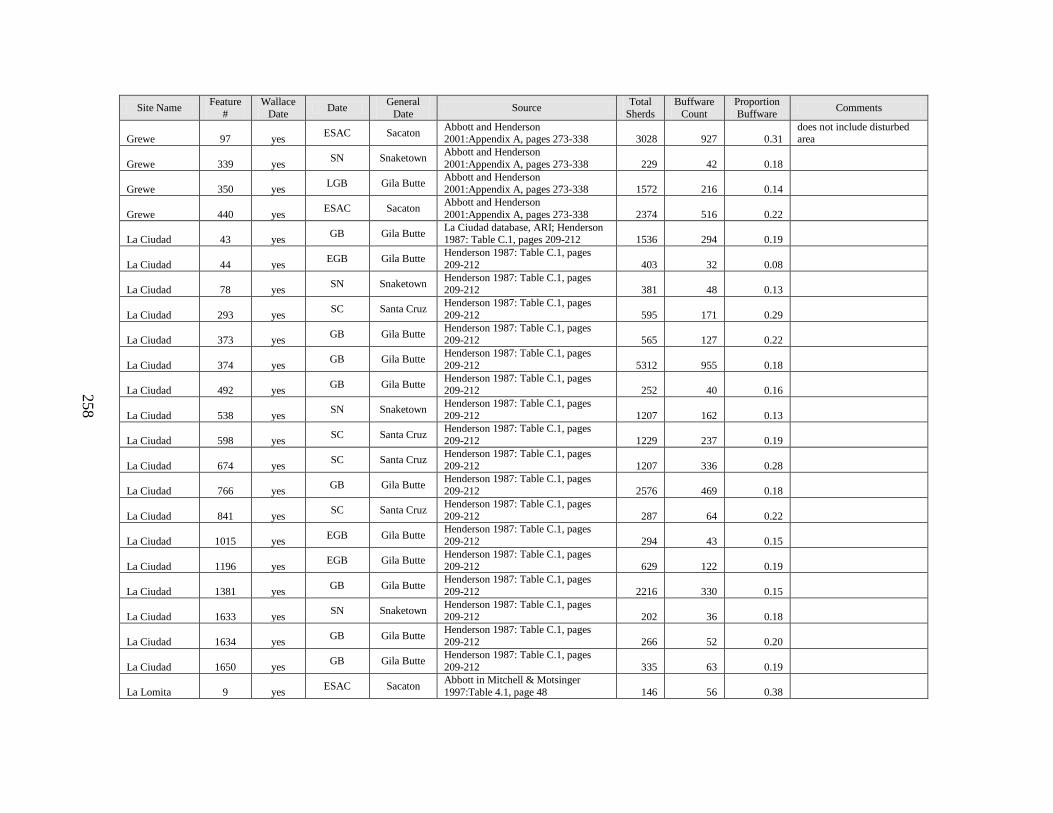
258
Site Name Feature
#
Wallace
Date Date
General
Date Source
Total
Sherds
Buffware
Count
Proportion
Buffware Comments
Grewe 97 yes ESAC Sacaton
Abbott and Henderson 2001:Appendix A, pages 273-338 3028 927 0.31
does not include disturbed area
Grewe 339 yes SN Snaketown
Abbott and Henderson
2001:Appendix A, pages 273-338 229 42 0.18
Grewe 350 yes LGB Gila Butte
Abbott and Henderson 2001:Appendix A, pages 273-338 1572 216 0.14
Grewe 440 yes ESAC Sacaton
Abbott and Henderson
2001:Appendix A, pages 273-338 2374 516 0.22
La Ciudad 43 yes GB Gila Butte
La Ciudad database, ARI; Henderson 1987: Table C.1, pages 209-212 1536 294 0.19
La Ciudad 44 yes EGB Gila Butte
Henderson 1987: Table C.1, pages
209-212 403 32 0.08
La Ciudad 78 yes SN Snaketown
Henderson 1987: Table C.1, pages 209-212 381 48 0.13
La Ciudad 293 yes SC Santa Cruz
Henderson 1987: Table C.1, pages
209-212 595 171 0.29
La Ciudad 373 yes GB Gila Butte
Henderson 1987: Table C.1, pages 209-212 565 127 0.22
La Ciudad 374 yes GB Gila Butte
Henderson 1987: Table C.1, pages
209-212 5312 955 0.18
La Ciudad 492 yes GB Gila Butte
Henderson 1987: Table C.1, pages 209-212 252 40 0.16
La Ciudad 538 yes SN Snaketown
Henderson 1987: Table C.1, pages
209-212 1207 162 0.13
La Ciudad 598 yes SC Santa Cruz
Henderson 1987: Table C.1, pages
209-212 1229 237 0.19
La Ciudad 674 yes SC Santa Cruz
Henderson 1987: Table C.1, pages
209-212 1207 336 0.28
La Ciudad 766 yes GB Gila Butte
Henderson 1987: Table C.1, pages
209-212 2576 469 0.18
La Ciudad 841 yes SC Santa Cruz
Henderson 1987: Table C.1, pages
209-212 287 64 0.22
La Ciudad 1015 yes EGB Gila Butte
Henderson 1987: Table C.1, pages
209-212 294 43 0.15
La Ciudad 1196 yes EGB Gila Butte
Henderson 1987: Table C.1, pages
209-212 629 122 0.19
La Ciudad 1381 yes GB Gila Butte
Henderson 1987: Table C.1, pages
209-212 2216 330 0.15
La Ciudad 1633 yes SN Snaketown
Henderson 1987: Table C.1, pages
209-212 202 36 0.18
La Ciudad 1634 yes GB Gila Butte
Henderson 1987: Table C.1, pages
209-212 266 52 0.20
La Ciudad 1650 yes GB Gila Butte
Henderson 1987: Table C.1, pages
209-212 335 63 0.19
La Lomita 9 yes ESAC Sacaton
Abbott in Mitchell & Motsinger
1997:Table 4.1, page 48 146 56 0.38
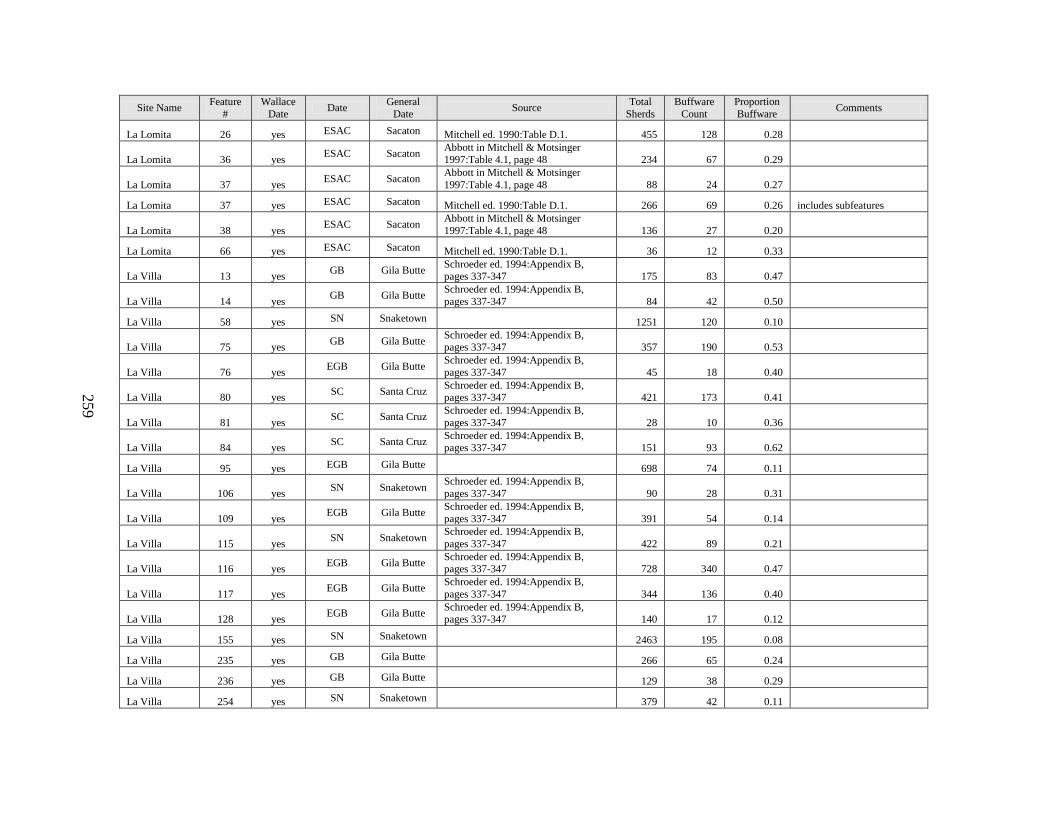
259
Site Name Feature
#
Wallace
Date Date
General
Date Source
Total
Sherds
Buffware
Count
Proportion
Buffware Comments
La Lomita 26 yes ESAC Sacaton Mitchell ed. 1990:Table D.1. 455 128 0.28
La Lomita 36 yes ESAC Sacaton
Abbott in Mitchell & Motsinger 1997:Table 4.1, page 48 234 67 0.29
La Lomita 37 yes ESAC Sacaton
Abbott in Mitchell & Motsinger
1997:Table 4.1, page 48 88 24 0.27
La Lomita 37 yes ESAC Sacaton Mitchell ed. 1990:Table D.1. 266 69 0.26 includes subfeatures
La Lomita 38 yes ESAC Sacaton
Abbott in Mitchell & Motsinger
1997:Table 4.1, page 48 136 27 0.20
La Lomita 66 yes ESAC Sacaton Mitchell ed. 1990:Table D.1. 36 12 0.33
La Villa 13 yes GB Gila Butte
Schroeder ed. 1994:Appendix B, pages 337-347 175 83 0.47
La Villa 14 yes GB Gila Butte
Schroeder ed. 1994:Appendix B,
pages 337-347 84 42 0.50
La Villa 58 yes SN Snaketown 1251 120 0.10
La Villa 75 yes GB Gila Butte
Schroeder ed. 1994:Appendix B, pages 337-347 357 190 0.53
La Villa 76 yes EGB Gila Butte
Schroeder ed. 1994:Appendix B,
pages 337-347 45 18 0.40
La Villa 80 yes SC Santa Cruz
Schroeder ed. 1994:Appendix B, pages 337-347 421 173 0.41
La Villa 81 yes SC Santa Cruz
Schroeder ed. 1994:Appendix B,
pages 337-347 28 10 0.36
La Villa 84 yes SC Santa Cruz
Schroeder ed. 1994:Appendix B, pages 337-347 151 93 0.62
La Villa 95 yes EGB Gila Butte 698 74 0.11
La Villa 106 yes SN Snaketown
Schroeder ed. 1994:Appendix B,
pages 337-347 90 28 0.31
La Villa 109 yes EGB Gila Butte
Schroeder ed. 1994:Appendix B,
pages 337-347 391 54 0.14
La Villa 115 yes SN Snaketown
Schroeder ed. 1994:Appendix B,
pages 337-347 422 89 0.21
La Villa 116 yes EGB Gila Butte
Schroeder ed. 1994:Appendix B, pages 337-347 728 340 0.47
La Villa 117 yes EGB Gila Butte
Schroeder ed. 1994:Appendix B,
pages 337-347 344 136 0.40
La Villa 128 yes EGB Gila Butte
Schroeder ed. 1994:Appendix B, pages 337-347 140 17 0.12
La Villa 155 yes SN Snaketown 2463 195 0.08
La Villa 235 yes GB Gila Butte 266 65 0.24
La Villa 236 yes GB Gila Butte 129 38 0.29
La Villa 254 yes SN Snaketown 379 42 0.11
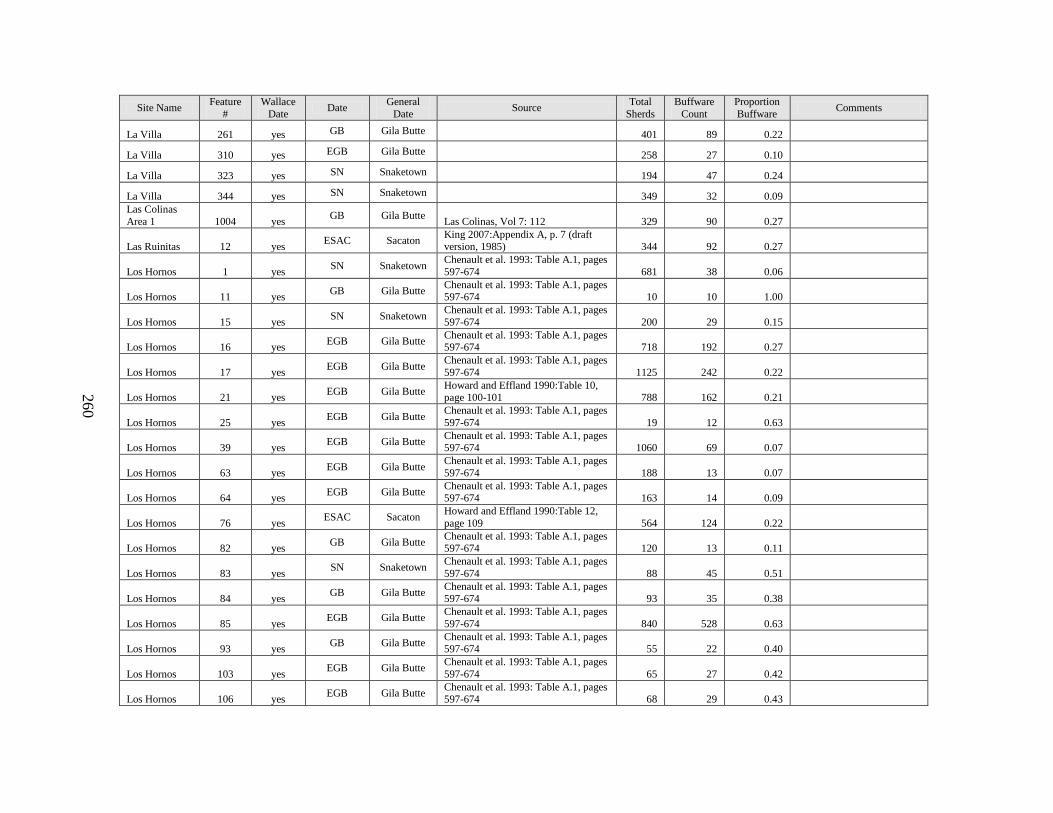
260
Site Name Feature
#
Wallace
Date Date
General
Date Source
Total
Sherds
Buffware
Count
Proportion
Buffware Comments
La Villa 261 yes GB Gila Butte 401 89 0.22
La Villa 310 yes EGB Gila Butte 258 27 0.10
La Villa 323 yes SN Snaketown 194 47 0.24
La Villa 344 yes SN Snaketown 349 32 0.09
Las Colinas
Area 1 1004 yes GB Gila Butte
Las Colinas, Vol 7: 112 329 90 0.27
Las Ruinitas 12 yes ESAC Sacaton
King 2007:Appendix A, p. 7 (draft version, 1985) 344 92 0.27
Los Hornos 1 yes SN Snaketown
Chenault et al. 1993: Table A.1, pages
597-674 681 38 0.06
Los Hornos 11 yes GB Gila Butte
Chenault et al. 1993: Table A.1, pages 597-674 10 10 1.00
Los Hornos 15 yes SN Snaketown
Chenault et al. 1993: Table A.1, pages
597-674 200 29 0.15
Los Hornos 16 yes EGB Gila Butte
Chenault et al. 1993: Table A.1, pages 597-674 718 192 0.27
Los Hornos 17 yes EGB Gila Butte
Chenault et al. 1993: Table A.1, pages
597-674 1125 242 0.22
Los Hornos 21 yes EGB Gila Butte
Howard and Effland 1990:Table 10, page 100-101 788 162 0.21
Los Hornos 25 yes EGB Gila Butte
Chenault et al. 1993: Table A.1, pages
597-674 19 12 0.63
Los Hornos 39 yes EGB Gila Butte
Chenault et al. 1993: Table A.1, pages 597-674 1060 69 0.07
Los Hornos 63 yes EGB Gila Butte
Chenault et al. 1993: Table A.1, pages
597-674 188 13 0.07
Los Hornos 64 yes EGB Gila Butte
Chenault et al. 1993: Table A.1, pages 597-674 163 14 0.09
Los Hornos 76 yes ESAC Sacaton
Howard and Effland 1990:Table 12,
page 109 564 124 0.22
Los Hornos 82 yes GB Gila Butte
Chenault et al. 1993: Table A.1, pages 597-674 120 13 0.11
Los Hornos 83 yes SN Snaketown
Chenault et al. 1993: Table A.1, pages
597-674 88 45 0.51
Los Hornos 84 yes GB Gila Butte
Chenault et al. 1993: Table A.1, pages
597-674 93 35 0.38
Los Hornos 85 yes EGB Gila Butte
Chenault et al. 1993: Table A.1, pages
597-674 840 528 0.63
Los Hornos 93 yes GB Gila Butte
Chenault et al. 1993: Table A.1, pages 597-674 55 22 0.40
Los Hornos 103 yes EGB Gila Butte
Chenault et al. 1993: Table A.1, pages
597-674 65 27 0.42
Los Hornos 106 yes EGB Gila Butte
Chenault et al. 1993: Table A.1, pages 597-674 68 29 0.43
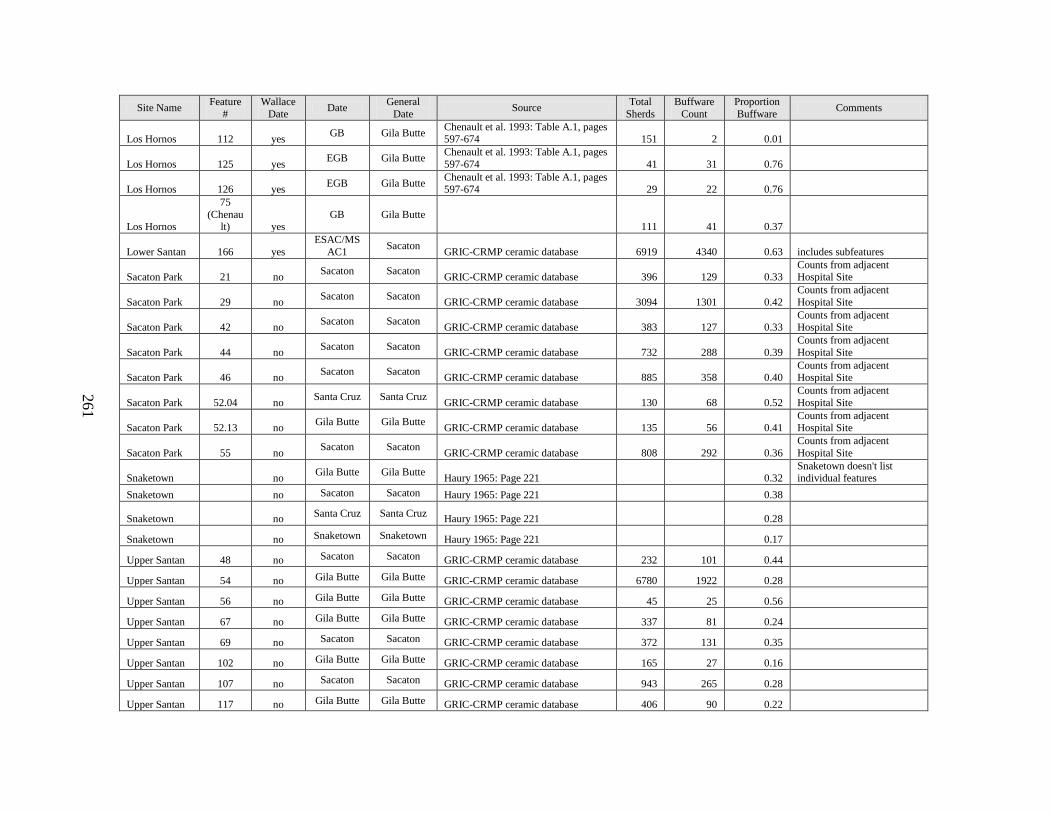
261
Site Name Feature
#
Wallace
Date Date
General
Date Source
Total
Sherds
Buffware
Count
Proportion
Buffware Comments
Los Hornos 112 yes GB Gila Butte
Chenault et al. 1993: Table A.1, pages 597-674 151 2 0.01
Los Hornos 125 yes EGB Gila Butte
Chenault et al. 1993: Table A.1, pages
597-674 41 31 0.76
Los Hornos 126 yes EGB Gila Butte
Chenault et al. 1993: Table A.1, pages 597-674 29 22 0.76
Los Hornos
75
(Chenault) yes
GB Gila Butte 111 41 0.37
Lower Santan 166 yes
ESAC/MS
AC1 Sacaton
GRIC-CRMP ceramic database 6919 4340 0.63 includes subfeatures
Sacaton Park 21 no Sacaton Sacaton
GRIC-CRMP ceramic database 396 129 0.33 Counts from adjacent Hospital Site
Sacaton Park 29 no Sacaton Sacaton
GRIC-CRMP ceramic database 3094 1301 0.42
Counts from adjacent
Hospital Site
Sacaton Park 42 no Sacaton Sacaton
GRIC-CRMP ceramic database 383 127 0.33 Counts from adjacent Hospital Site
Sacaton Park 44 no Sacaton Sacaton
GRIC-CRMP ceramic database 732 288 0.39
Counts from adjacent
Hospital Site
Sacaton Park 46 no Sacaton Sacaton
GRIC-CRMP ceramic database 885 358 0.40 Counts from adjacent Hospital Site
Sacaton Park 52.04 no Santa Cruz Santa Cruz
GRIC-CRMP ceramic database 130 68 0.52
Counts from adjacent
Hospital Site
Sacaton Park 52.13 no Gila Butte Gila Butte
GRIC-CRMP ceramic database 135 56 0.41
Counts from adjacent
Hospital Site
Sacaton Park 55 no Sacaton Sacaton
GRIC-CRMP ceramic database 808 292 0.36
Counts from adjacent
Hospital Site
Snaketown no Gila Butte Gila Butte
Haury 1965: Page 221 0.32 Snaketown doesn't list individual features
Snaketown no Sacaton Sacaton Haury 1965: Page 221 0.38
Snaketown no Santa Cruz Santa Cruz
Haury 1965: Page 221 0.28
Snaketown no Snaketown Snaketown Haury 1965: Page 221 0.17
Upper Santan 48 no Sacaton Sacaton GRIC-CRMP ceramic database 232 101 0.44
Upper Santan 54 no Gila Butte Gila Butte GRIC-CRMP ceramic database 6780 1922 0.28
Upper Santan 56 no Gila Butte Gila Butte GRIC-CRMP ceramic database 45 25 0.56
Upper Santan 67 no Gila Butte Gila Butte GRIC-CRMP ceramic database 337 81 0.24
Upper Santan 69 no Sacaton Sacaton GRIC-CRMP ceramic database 372 131 0.35
Upper Santan 102 no Gila Butte Gila Butte GRIC-CRMP ceramic database 165 27 0.16
Upper Santan 107 no Sacaton Sacaton GRIC-CRMP ceramic database 943 265 0.28
Upper Santan 117 no Gila Butte Gila Butte GRIC-CRMP ceramic database 406 90 0.22
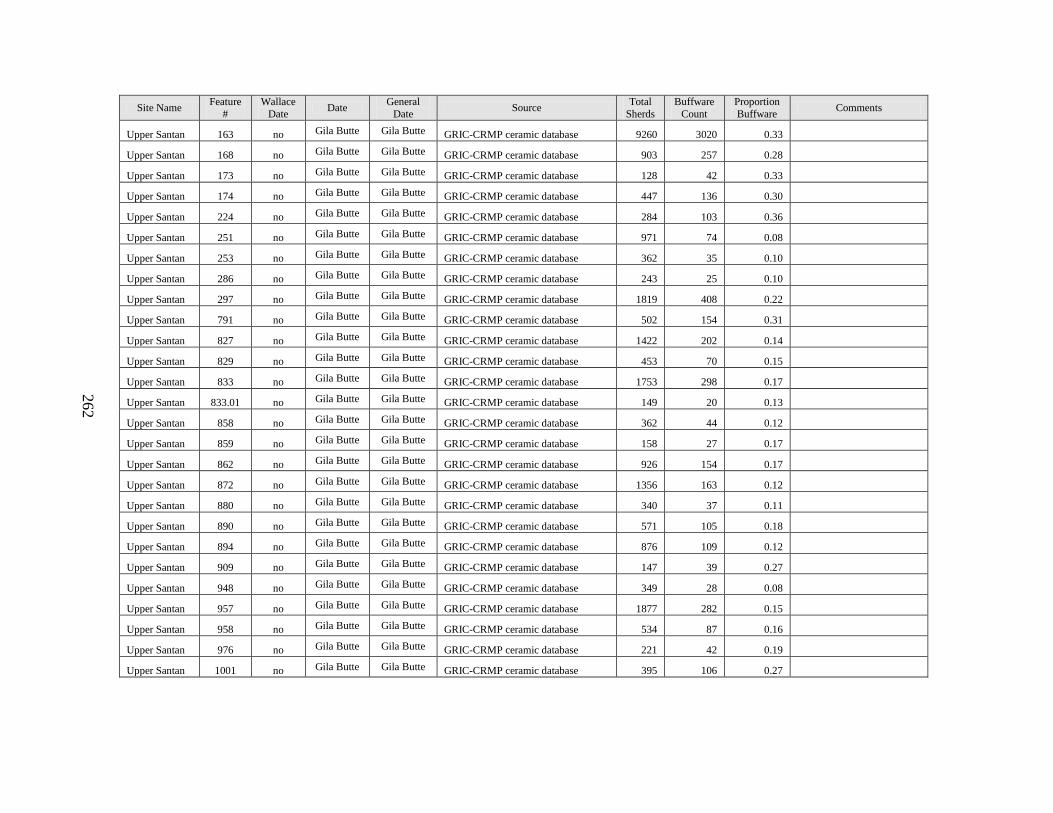
262
Site Name Feature
#
Wallace
Date Date
General
Date Source
Total
Sherds
Buffware
Count
Proportion
Buffware Comments
Upper Santan 163 no Gila Butte Gila Butte GRIC-CRMP ceramic database 9260 3020 0.33
Upper Santan 168 no Gila Butte Gila Butte GRIC-CRMP ceramic database 903 257 0.28
Upper Santan 173 no Gila Butte Gila Butte GRIC-CRMP ceramic database 128 42 0.33
Upper Santan 174 no Gila Butte Gila Butte GRIC-CRMP ceramic database 447 136 0.30
Upper Santan 224 no Gila Butte Gila Butte GRIC-CRMP ceramic database 284 103 0.36
Upper Santan 251 no Gila Butte Gila Butte GRIC-CRMP ceramic database 971 74 0.08
Upper Santan 253 no Gila Butte Gila Butte GRIC-CRMP ceramic database 362 35 0.10
Upper Santan 286 no Gila Butte Gila Butte GRIC-CRMP ceramic database 243 25 0.10
Upper Santan 297 no Gila Butte Gila Butte GRIC-CRMP ceramic database 1819 408 0.22
Upper Santan 791 no Gila Butte Gila Butte GRIC-CRMP ceramic database 502 154 0.31
Upper Santan 827 no Gila Butte Gila Butte GRIC-CRMP ceramic database 1422 202 0.14
Upper Santan 829 no Gila Butte Gila Butte GRIC-CRMP ceramic database 453 70 0.15
Upper Santan 833 no Gila Butte Gila Butte GRIC-CRMP ceramic database 1753 298 0.17
Upper Santan 833.01 no Gila Butte Gila Butte GRIC-CRMP ceramic database 149 20 0.13
Upper Santan 858 no Gila Butte Gila Butte GRIC-CRMP ceramic database 362 44 0.12
Upper Santan 859 no Gila Butte Gila Butte GRIC-CRMP ceramic database 158 27 0.17
Upper Santan 862 no Gila Butte Gila Butte GRIC-CRMP ceramic database 926 154 0.17
Upper Santan 872 no Gila Butte Gila Butte GRIC-CRMP ceramic database 1356 163 0.12
Upper Santan 880 no Gila Butte Gila Butte GRIC-CRMP ceramic database 340 37 0.11
Upper Santan 890 no Gila Butte Gila Butte GRIC-CRMP ceramic database 571 105 0.18
Upper Santan 894 no Gila Butte Gila Butte GRIC-CRMP ceramic database 876 109 0.12
Upper Santan 909 no Gila Butte Gila Butte GRIC-CRMP ceramic database 147 39 0.27
Upper Santan 948 no Gila Butte Gila Butte GRIC-CRMP ceramic database 349 28 0.08
Upper Santan 957 no Gila Butte Gila Butte GRIC-CRMP ceramic database 1877 282 0.15
Upper Santan 958 no Gila Butte Gila Butte GRIC-CRMP ceramic database 534 87 0.16
Upper Santan 976 no Gila Butte Gila Butte GRIC-CRMP ceramic database 221 42 0.19
Upper Santan 1001 no Gila Butte Gila Butte GRIC-CRMP ceramic database 395 106 0.27
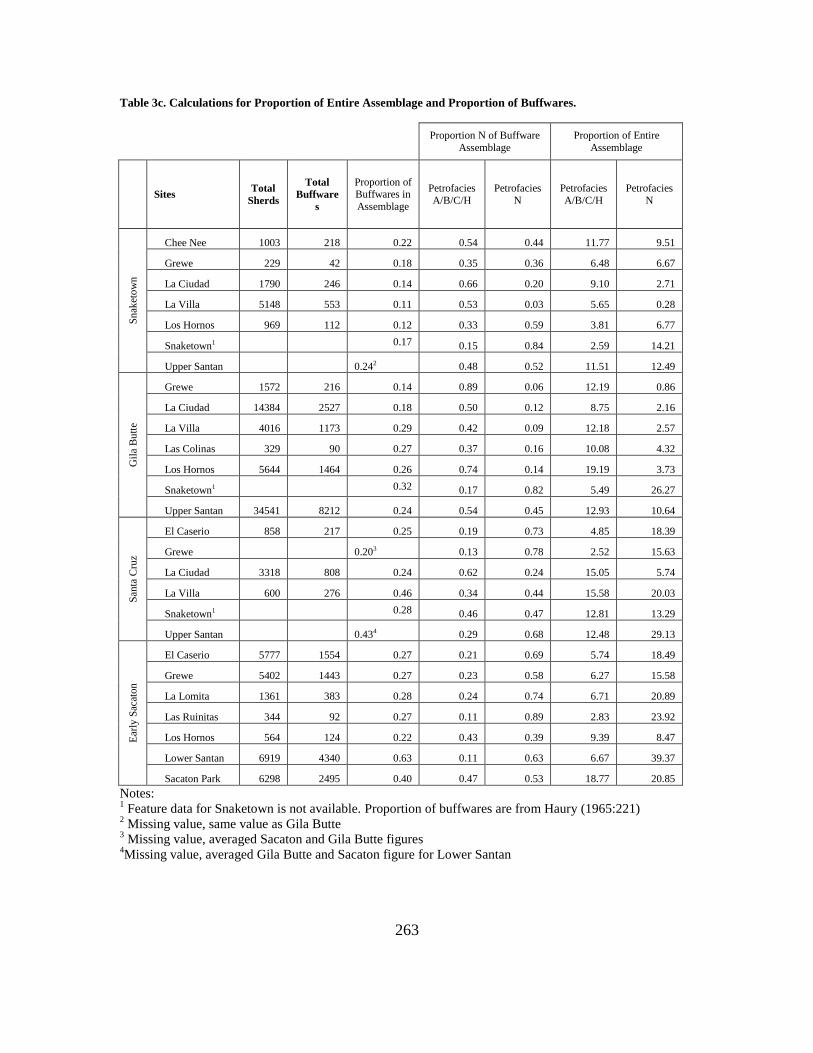
263
Table 3c. Calculations for Proportion of Entire Assemblage and Proportion of Buffwares.
Proportion N of Buffware
Assemblage
Proportion of Entire
Assemblage
Sites Total
Sherds
Total
Buffware
s
Proportion of Buffwares in
Assemblage
Petrofacies
A/B/C/H
Petrofacies
N
Petrofacies
A/B/C/H
Petrofacies
N
Sn
aket
ow
n
Chee Nee 1003 218 0.22 0.54 0.44 11.77 9.51
Grewe 229 42 0.18 0.35 0.36 6.48 6.67
La Ciudad 1790 246 0.14 0.66 0.20 9.10 2.71
La Villa 5148 553 0.11 0.53 0.03 5.65 0.28
Los Hornos 969 112 0.12 0.33 0.59 3.81 6.77
Snaketown1 0.17 0.15 0.84 2.59 14.21
Upper Santan 0.242 0.48 0.52 11.51 12.49
Gil
a B
utt
e
Grewe 1572 216 0.14 0.89 0.06 12.19 0.86
La Ciudad 14384 2527 0.18 0.50 0.12 8.75 2.16
La Villa 4016 1173 0.29 0.42 0.09 12.18 2.57
Las Colinas 329 90 0.27 0.37 0.16 10.08 4.32
Los Hornos 5644 1464 0.26 0.74 0.14 19.19 3.73
Snaketown1 0.32 0.17 0.82 5.49 26.27
Upper Santan 34541 8212 0.24 0.54 0.45 12.93 10.64
San
ta C
ruz
El Caserio 858 217 0.25 0.19 0.73 4.85 18.39
Grewe 0.203 0.13 0.78 2.52 15.63
La Ciudad 3318 808 0.24 0.62 0.24 15.05 5.74
La Villa 600 276 0.46 0.34 0.44 15.58 20.03
Snaketown1 0.28 0.46 0.47 12.81 13.29
Upper Santan 0.434 0.29 0.68 12.48 29.13
Ear
ly S
acat
on
El Caserio 5777 1554 0.27 0.21 0.69 5.74 18.49
Grewe 5402 1443 0.27 0.23 0.58 6.27 15.58
La Lomita 1361 383 0.28 0.24 0.74 6.71 20.89
Las Ruinitas 344 92 0.27 0.11 0.89 2.83 23.92
Los Hornos 564 124 0.22 0.43 0.39 9.39 8.47
Lower Santan 6919 4340 0.63 0.11 0.63 6.67 39.37
Sacaton Park 6298 2495 0.40 0.47 0.53 18.77 20.85
Notes: 1 Feature data for Snaketown is not available. Proportion of buffwares are from Haury (1965:221)
2 Missing value, same value as Gila Butte
3 Missing value, averaged Sacaton and Gila Butte figures
4Missing value, averaged Gila Butte and Sacaton figure for Lower Santan
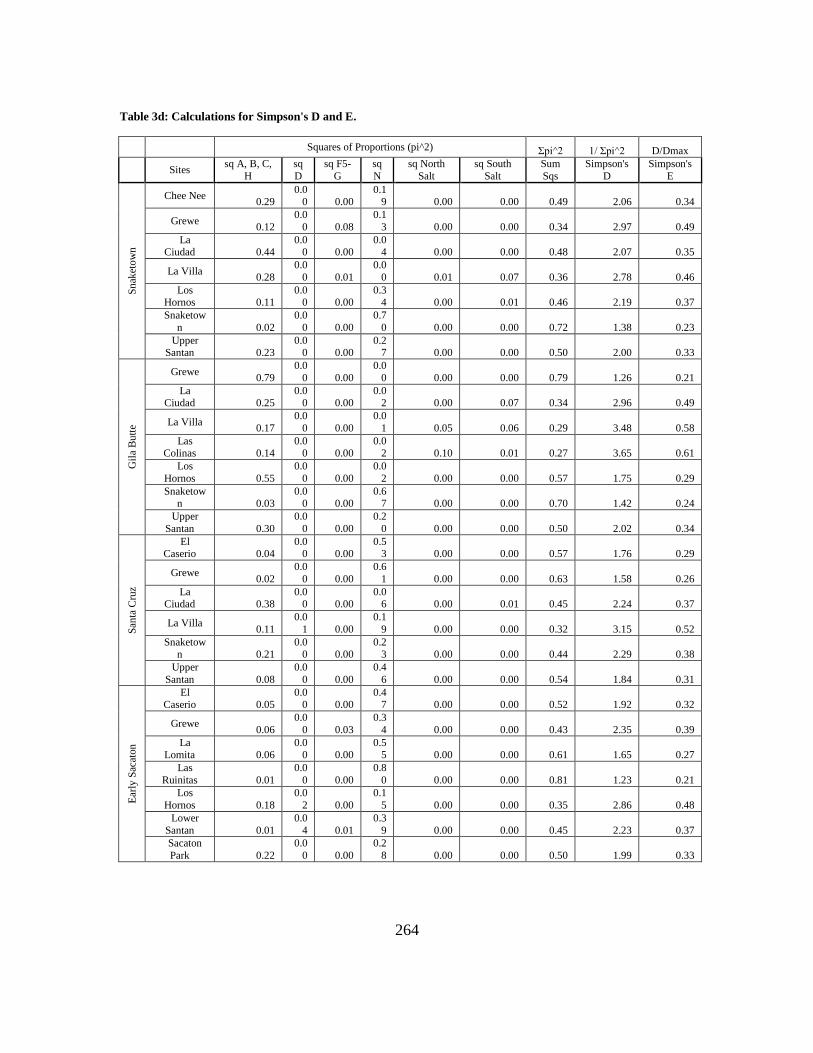
264
Table 3d: Calculations for Simpson's D and E.
Squares of Proportions (pi^2) Σpi^2 1/ Σpi^2 D/Dmax
Sites sq A, B, C,
H
sq
D
sq F5-
G
sq
N
sq North
Salt
sq South
Salt
Sum
Sqs
Simpson's
D
Simpson's
E
Sn
aket
ow
n
Chee Nee 0.29
0.00 0.00
0.19 0.00 0.00 0.49 2.06 0.34
Grewe 0.12
0.0
0 0.08
0.1
3 0.00 0.00 0.34 2.97 0.49
La Ciudad 0.44
0.00 0.00
0.04 0.00 0.00 0.48 2.07 0.35
La Villa 0.28
0.0
0 0.01
0.0
0 0.01 0.07 0.36 2.78 0.46
Los Hornos 0.11
0.00 0.00
0.34 0.00 0.01 0.46 2.19 0.37
Snaketow
n 0.02
0.0
0 0.00
0.7
0 0.00 0.00 0.72 1.38 0.23
Upper Santan 0.23
0.00 0.00
0.27 0.00 0.00 0.50 2.00 0.33
Gil
a B
utt
e
Grewe 0.79
0.0
0 0.00
0.0
0 0.00 0.00 0.79 1.26 0.21
La Ciudad 0.25
0.00 0.00
0.02 0.00 0.07 0.34 2.96 0.49
La Villa 0.17
0.0
0 0.00
0.0
1 0.05 0.06 0.29 3.48 0.58
Las Colinas 0.14
0.00 0.00
0.02 0.10 0.01 0.27 3.65 0.61
Los
Hornos 0.55
0.0
0 0.00
0.0
2 0.00 0.00 0.57 1.75 0.29
Snaketown 0.03
0.00 0.00
0.67 0.00 0.00 0.70 1.42 0.24
Upper
Santan 0.30
0.0
0 0.00
0.2
0 0.00 0.00 0.50 2.02 0.34
San
ta C
ruz
El Caserio 0.04
0.00 0.00
0.53 0.00 0.00 0.57 1.76 0.29
Grewe 0.02
0.0
0 0.00
0.6
1 0.00 0.00 0.63 1.58 0.26
La Ciudad 0.38
0.00 0.00
0.06 0.00 0.01 0.45 2.24 0.37
La Villa 0.11
0.0
1 0.00
0.1
9 0.00 0.00 0.32 3.15 0.52
Snaketown 0.21
0.00 0.00
0.23 0.00 0.00 0.44 2.29 0.38
Upper
Santan 0.08
0.0
0 0.00
0.4
6 0.00 0.00 0.54 1.84 0.31
Ear
ly S
acat
on
El Caserio 0.05
0.00 0.00
0.47 0.00 0.00 0.52 1.92 0.32
Grewe 0.06
0.0
0 0.03
0.3
4 0.00 0.00 0.43 2.35 0.39
La Lomita 0.06
0.00 0.00
0.55 0.00 0.00 0.61 1.65 0.27
Las
Ruinitas 0.01
0.0
0 0.00
0.8
0 0.00 0.00 0.81 1.23 0.21
Los
Hornos 0.18
0.0
2 0.00
0.1
5 0.00 0.00 0.35 2.86 0.48
Lower
Santan 0.01
0.0
4 0.01
0.3
9 0.00 0.00 0.45 2.23 0.37
Sacaton
Park 0.22
0.0
0 0.00
0.2
8 0.00 0.00 0.50 1.99 0.33
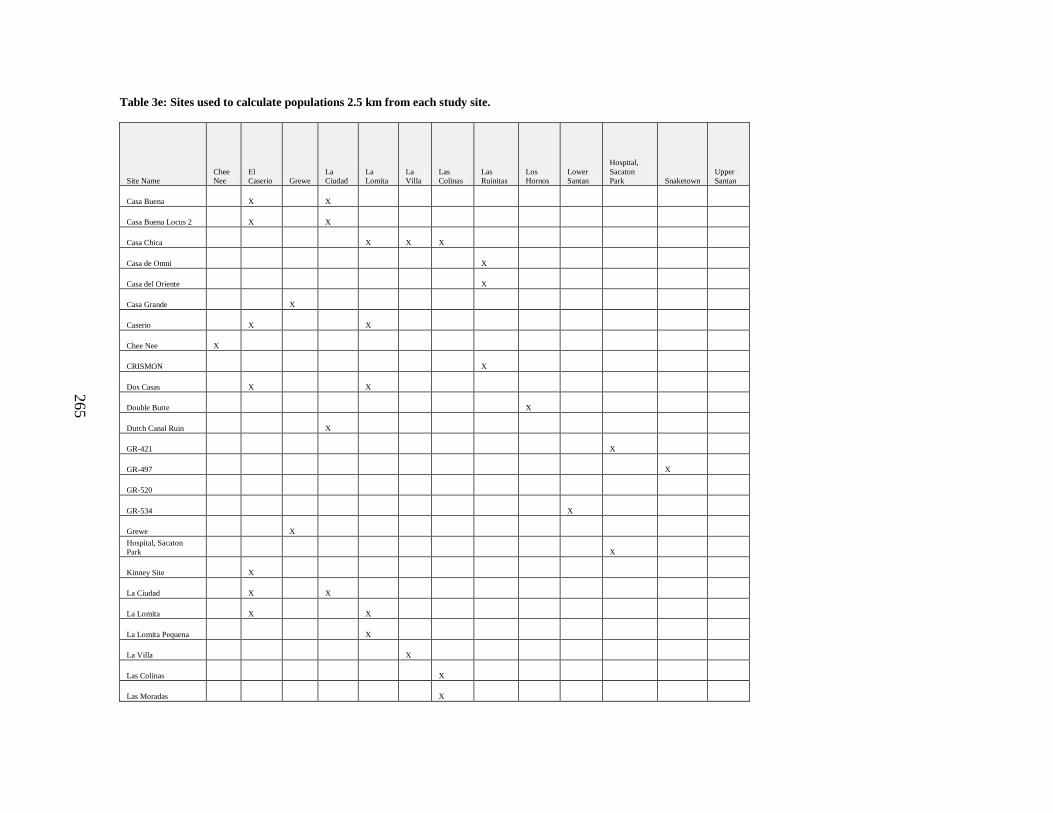
265
Table 3e: Sites used to calculate populations 2.5 km from each study site.
Site Name
Chee
Nee
El
Caserio Grewe
La
Ciudad
La
Lomita
La
Villa
Las
Colinas
Las
Ruinitas
Los
Hornos
Lower
Santan
Hospital,
Sacaton
Park Snaketown
Upper
Santan
Casa Buena X X
Casa Buena Locus 2 X X
Casa Chica X X X
Casa de Omni X
Casa del Oriente X
Casa Grande X
Caserio X X
Chee Nee X
CRISMON X
Dos Casas X X
Double Butte X
Dutch Canal Ruin X
GR-421 X
GR-497 X
GR-520
GR-534 X
Grewe X
Hospital, Sacaton
Park X
Kinney Site X
La Ciudad X X
La Lomita X X
La Lomita Pequena X
La Villa X
Las Colinas X
Las Moradas X
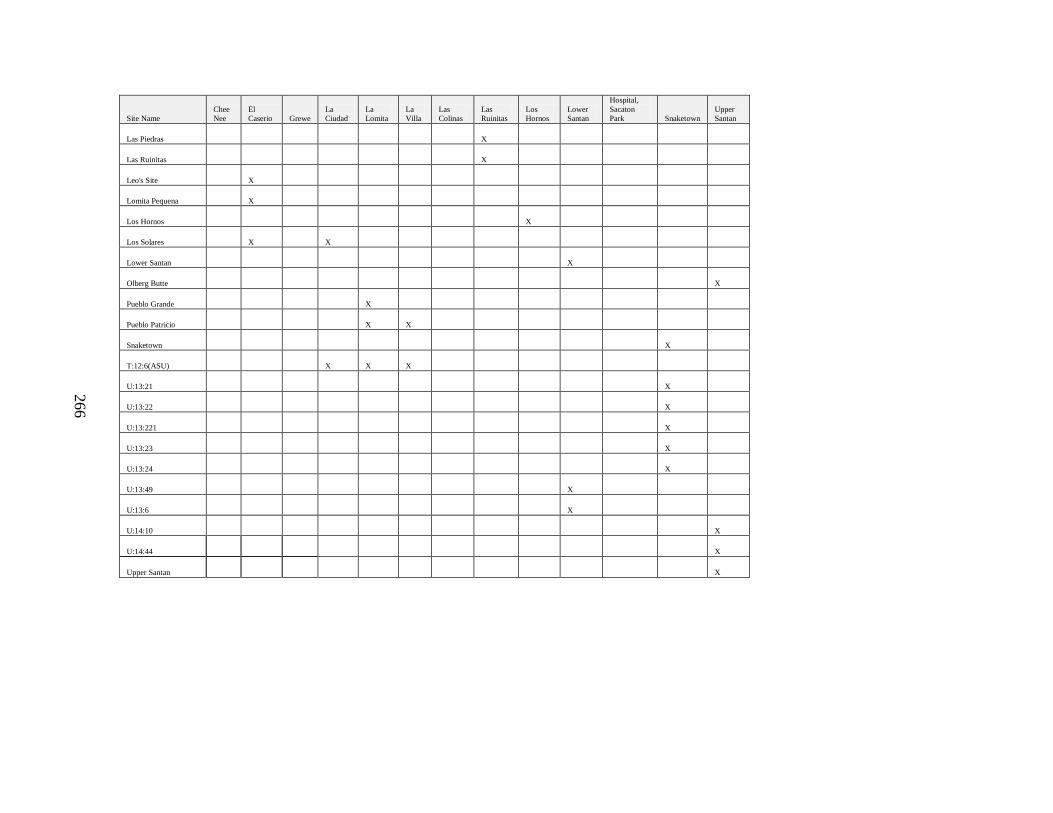
266
Site Name
Chee
Nee
El
Caserio Grewe
La
Ciudad
La
Lomita
La
Villa
Las
Colinas
Las
Ruinitas
Los
Hornos
Lower
Santan
Hospital,
Sacaton
Park Snaketown
Upper
Santan
Las Piedras X
Las Ruinitas X
Leo's Site X
Lomita Pequena X
Los Hornos X
Los Solares X X
Lower Santan X
Olberg Butte X
Pueblo Grande X
Pueblo Patricio X X
Snaketown X
T:12:6(ASU) X X X
U:13:21 X
U:13:22 X
U:13:221 X
U:13:23 X
U:13:24 X
U:13:49 X
U:13:6 X
U:14:10 X
U:14:44
X
Upper Santan
X
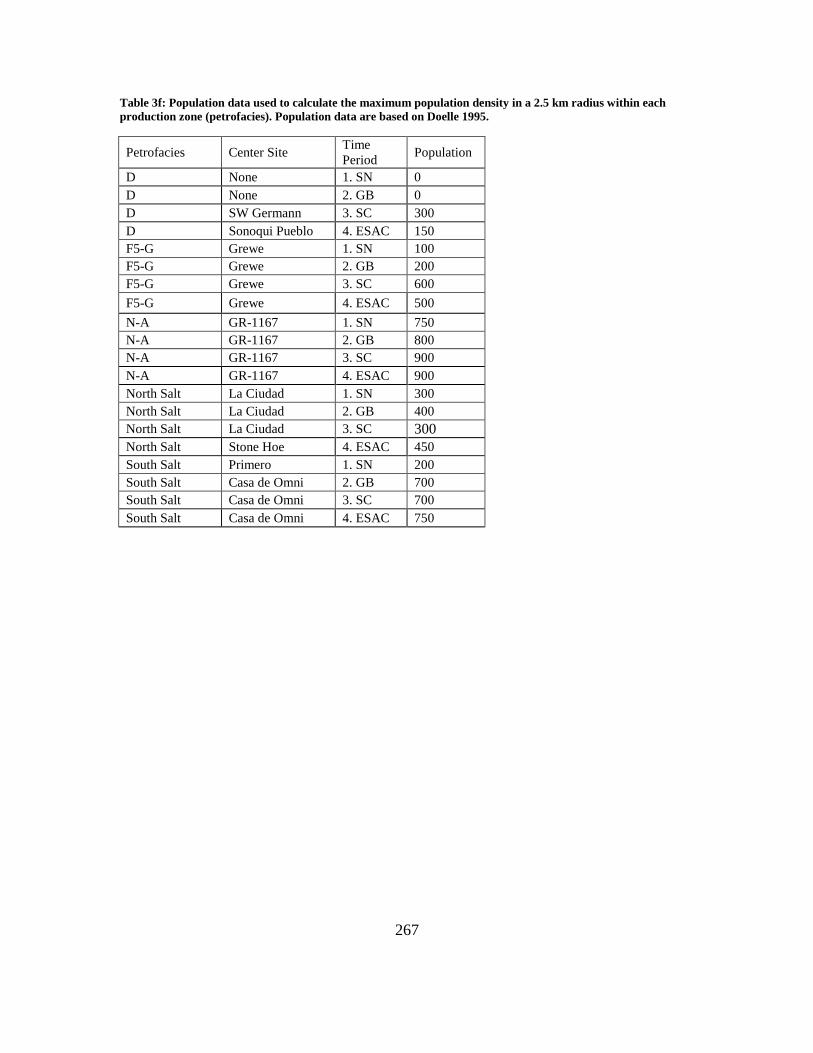
267
Table 3f: Population data used to calculate the maximum population density in a 2.5 km radius within each
production zone (petrofacies). Population data are based on Doelle 1995.
Petrofacies Center Site Time
Period Population
D None 1. SN 0
D None 2. GB 0
D SW Germann 3. SC 300
D Sonoqui Pueblo 4. ESAC 150
F5-G Grewe 1. SN 100
F5-G Grewe 2. GB 200
F5-G Grewe 3. SC 600
F5-G Grewe 4. ESAC 500
N-A GR-1167 1. SN 750
N-A GR-1167 2. GB 800
N-A GR-1167 3. SC 900
N-A GR-1167 4. ESAC 900
North Salt La Ciudad 1. SN 300
North Salt La Ciudad 2. GB 400
North Salt La Ciudad 3. SC 300
North Salt Stone Hoe 4. ESAC 450
South Salt Primero 1. SN 200
South Salt Casa de Omni 2. GB 700
South Salt Casa de Omni 3. SC 700
South Salt Casa de Omni 4. ESAC 750
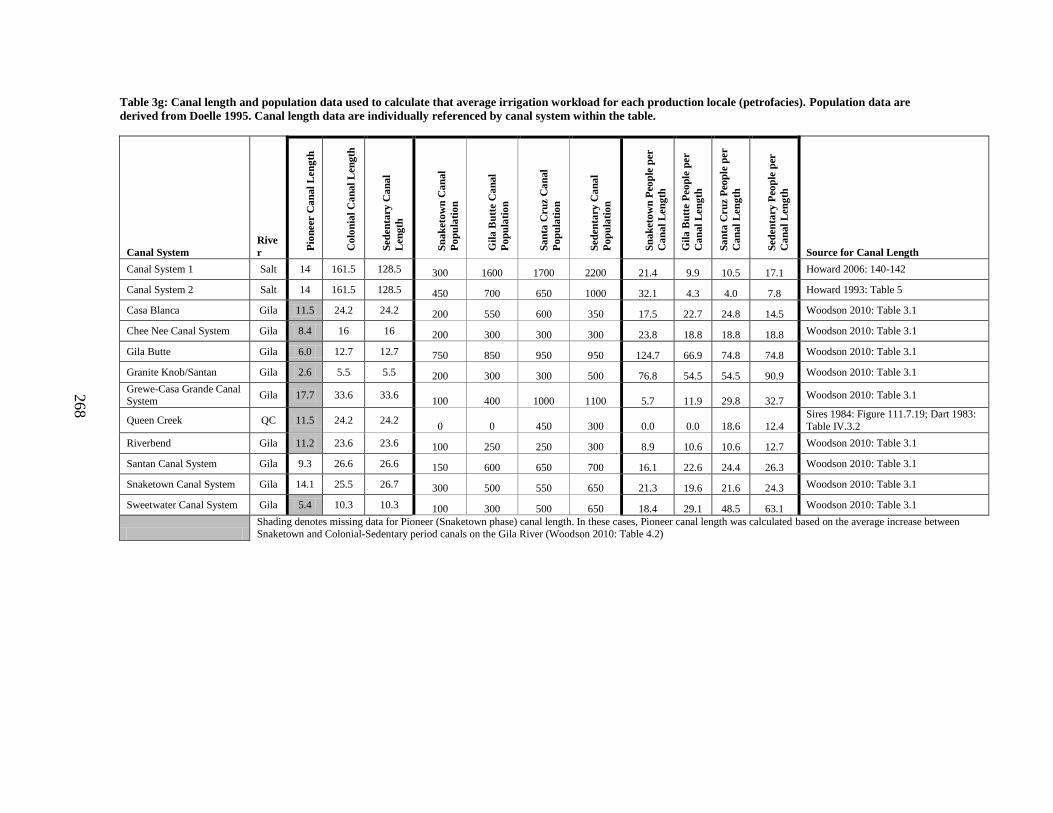
268
Table 3g: Canal length and population data used to calculate that average irrigation workload for each production locale (petrofacies). Population data are
derived from Doelle 1995. Canal length data are individually referenced by canal system within the table.
Canal System
Rive
r
Pio
neer
Ca
na
l L
en
gth
Co
lon
ial
Ca
na
l L
en
gth
Sed
en
tary
Ca
na
l
Len
gth
Sn
ak
eto
wn
Ca
nal
Po
pu
lati
on
Gil
a B
utt
e C
an
al
Po
pu
lati
on
Sa
nta
Cru
z C
an
al
Po
pu
lati
on
Sed
en
tary
Ca
na
l
Po
pu
lati
on
Sn
ak
eto
wn
Peo
ple
per
Ca
nal
Len
gth
Gil
a B
utt
e P
eo
ple
per
Ca
nal
Len
gth
Sa
nta
Cru
z P
eop
le p
er
Ca
nal
Len
gth
Sed
en
tary
Peo
ple
per
Ca
nal
Len
gth
Source for Canal Length
Canal System 1 Salt 14 161.5 128.5 300 1600 1700 2200 21.4 9.9 10.5 17.1 Howard 2006: 140-142
Canal System 2 Salt 14 161.5 128.5 450 700 650 1000 32.1 4.3 4.0 7.8 Howard 1993: Table 5
Casa Blanca Gila 11.5 24.2 24.2 200 550 600 350 17.5 22.7 24.8 14.5 Woodson 2010: Table 3.1
Chee Nee Canal System Gila 8.4 16 16 200 300 300 300 23.8 18.8 18.8 18.8 Woodson 2010: Table 3.1
Gila Butte Gila 6.0 12.7 12.7 750 850 950 950 124.7 66.9 74.8 74.8 Woodson 2010: Table 3.1
Granite Knob/Santan Gila 2.6 5.5 5.5 200 300 300 500 76.8 54.5 54.5 90.9 Woodson 2010: Table 3.1
Grewe-Casa Grande Canal System
Gila 17.7 33.6 33.6 100 400 1000 1100 5.7 11.9 29.8 32.7
Woodson 2010: Table 3.1
Queen Creek QC 11.5 24.2 24.2 0 0 450 300 0.0 0.0 18.6 12.4
Sires 1984: Figure 111.7.19; Dart 1983:
Table IV.3.2
Riverbend Gila 11.2 23.6 23.6 100 250 250 300 8.9 10.6 10.6 12.7 Woodson 2010: Table 3.1
Santan Canal System Gila 9.3 26.6 26.6 150 600 650 700 16.1 22.6 24.4 26.3 Woodson 2010: Table 3.1
Snaketown Canal System Gila 14.1 25.5 26.7 300 500 550 650 21.3 19.6 21.6 24.3 Woodson 2010: Table 3.1
Sweetwater Canal System Gila 5.4 10.3 10.3 100 300 500 650 18.4 29.1 48.5 63.1 Woodson 2010: Table 3.1
Shading denotes missing data for Pioneer (Snaketown phase) canal length. In these cases, Pioneer canal length was calculated based on the average increase between
Snaketown and Colonial-Sedentary period canals on the Gila River (Woodson 2010: Table 4.2)
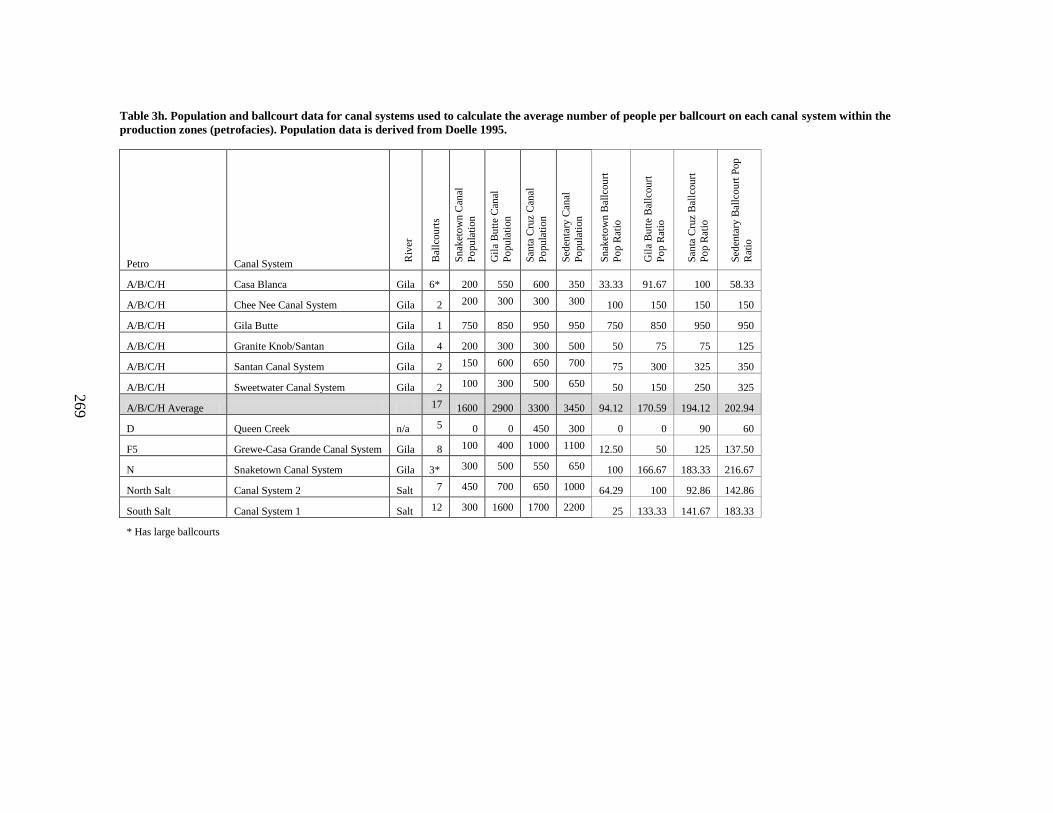
269
Table 3h. Population and ballcourt data for canal systems used to calculate the average number of people per ballcourt on each canal system within the
production zones (petrofacies). Population data is derived from Doelle 1995.
Petro Canal System
Riv
er
Bal
lcou
rts
Sn
aket
ow
n C
anal
Po
pu
lati
on
Gil
a B
utt
e C
anal
Po
pu
lati
on
San
ta C
ruz
Can
al
Po
pu
lati
on
Sed
enta
ry C
anal
Po
pu
lati
on
Sn
aket
ow
n B
allc
ou
rt
Po
p R
atio
Gil
a B
utt
e B
allc
ou
rt
Po
p R
atio
San
ta C
ruz
Bal
lcou
rt
Po
p R
atio
Sed
enta
ry B
allc
ou
rt P
op
Rat
io
A/B/C/H Casa Blanca Gila 6* 200 550 600 350 33.33 91.67 100 58.33
A/B/C/H Chee Nee Canal System Gila 2 200 300 300 300 100 150 150 150
A/B/C/H Gila Butte Gila 1 750 850 950 950 750 850 950 950
A/B/C/H Granite Knob/Santan Gila 4 200 300 300 500 50 75 75 125
A/B/C/H Santan Canal System Gila 2 150 600 650 700 75 300 325 350
A/B/C/H Sweetwater Canal System Gila 2 100 300 500 650 50 150 250 325
A/B/C/H Average 17 1600 2900 3300 3450 94.12 170.59 194.12 202.94
D Queen Creek n/a 5 0 0 450 300 0 0 90 60
F5 Grewe-Casa Grande Canal System Gila 8 100 400 1000 1100 12.50 50 125 137.50
N Snaketown Canal System Gila 3* 300 500 550 650 100 166.67 183.33 216.67
North Salt Canal System 2 Salt 7 450 700 650 1000 64.29 100 92.86 142.86
South Salt Canal System 1 Salt 12 300 1600 1700 2200 25 133.33 141.67 183.33
* Has large ballcourts

270
APPENDIX C
RESULTS FROM MULTIPLE REGRESSION ANALYSES
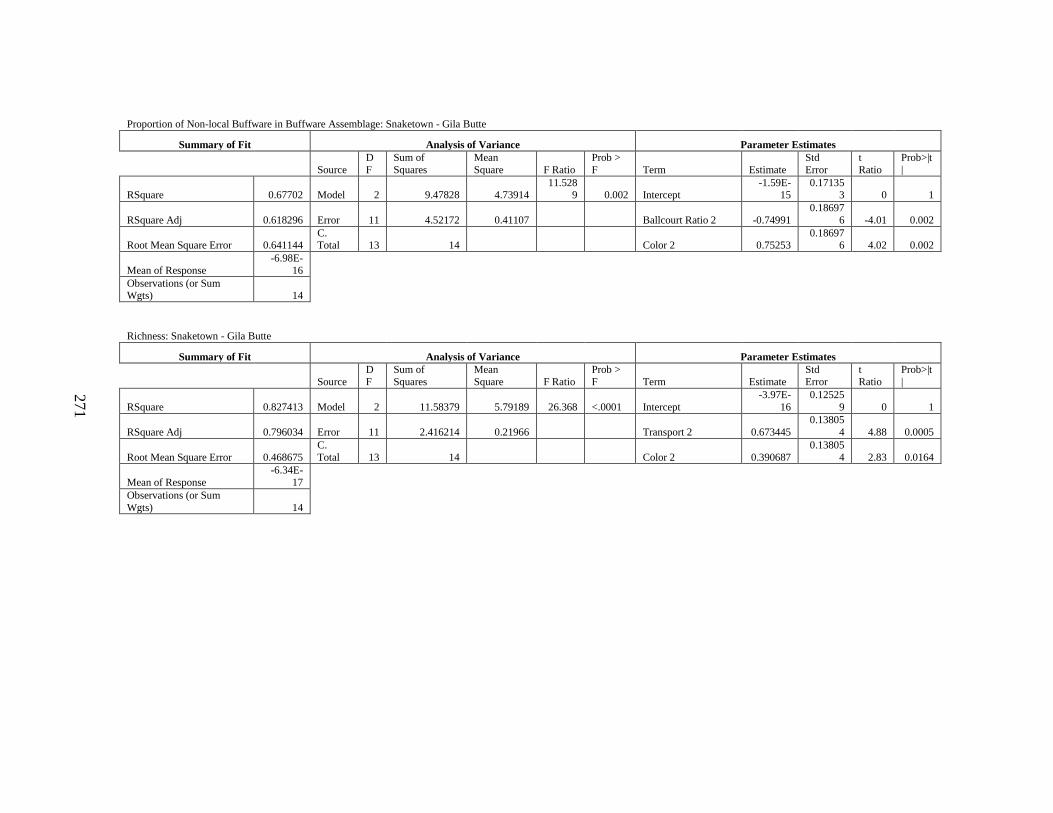
271
Proportion of Non-local Buffware in Buffware Assemblage: Snaketown - Gila Butte
Summary of Fit Analysis of Variance Parameter Estimates
Source
D
F
Sum of
Squares
Mean
Square F Ratio
Prob >
F Term Estimate
Std
Error
t
Ratio
Prob>|t
|
RSquare 0.67702 Model 2 9.47828 4.73914 11.528
9 0.002 Intercept -1.59E-
15 0.17135
3 0 1
RSquare Adj 0.618296 Error 11 4.52172 0.41107 Ballcourt Ratio 2 -0.74991
0.18697
6 -4.01 0.002
Root Mean Square Error 0.641144 C. Total 13 14 Color 2 0.75253
0.186976 4.02 0.002
Mean of Response
-6.98E-
16 Observations (or Sum
Wgts) 14
Richness: Snaketown - Gila Butte
Summary of Fit Analysis of Variance Parameter Estimates
Source
D
F
Sum of
Squares
Mean
Square F Ratio
Prob >
F Term Estimate
Std
Error
t
Ratio
Prob>|t
|
RSquare 0.827413 Model 2 11.58379 5.79189 26.368 <.0001 Intercept
-3.97E-
16
0.12525
9 0 1
RSquare Adj 0.796034 Error 11 2.416214 0.21966 Transport 2 0.673445
0.13805
4 4.88 0.0005
Root Mean Square Error 0.468675
C.
Total 13 14 Color 2 0.390687
0.13805
4 2.83 0.0164
Mean of Response
-6.34E-
17
Observations (or Sum
Wgts) 14
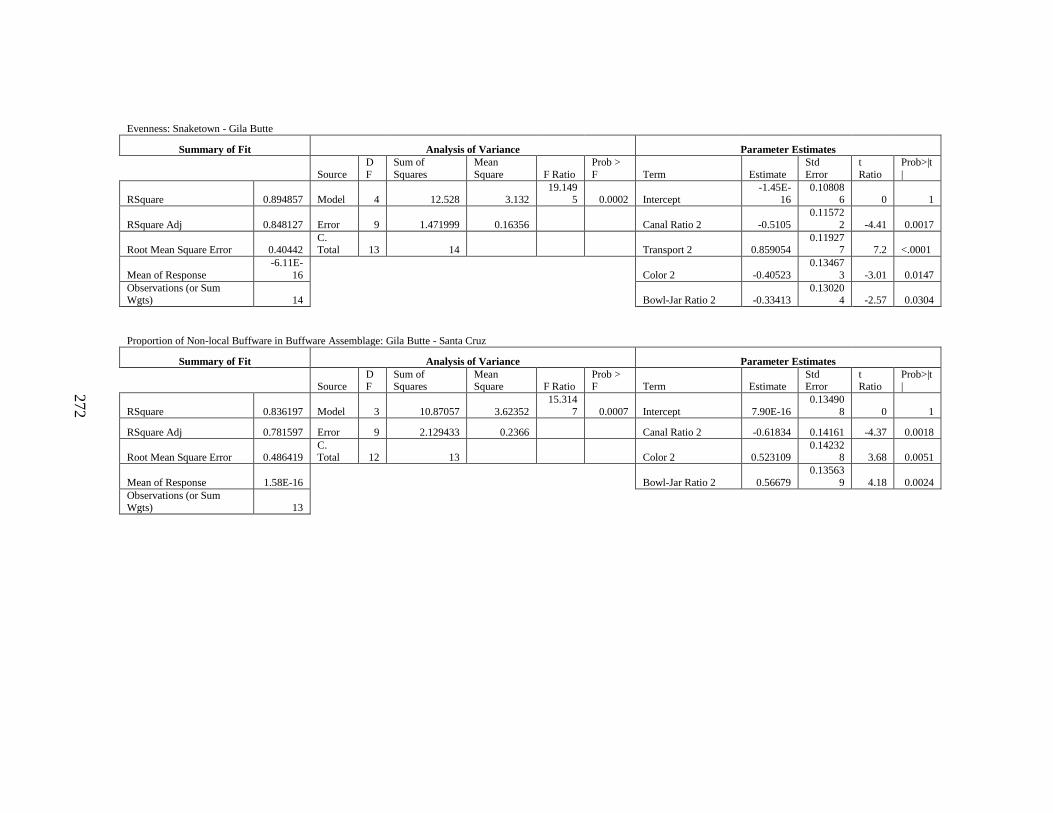
272
Evenness: Snaketown - Gila Butte
Summary of Fit Analysis of Variance Parameter Estimates
Source
D
F
Sum of
Squares
Mean
Square F Ratio
Prob >
F Term Estimate
Std
Error
t
Ratio
Prob>|t
|
RSquare 0.894857 Model 4 12.528 3.132 19.149
5 0.0002 Intercept -1.45E-
16 0.10808
6 0 1
RSquare Adj 0.848127 Error 9 1.471999 0.16356 Canal Ratio 2 -0.5105
0.11572
2 -4.41 0.0017
Root Mean Square Error 0.40442 C. Total 13 14 Transport 2 0.859054
0.119277 7.2 <.0001
Mean of Response
-6.11E-
16
Color 2 -0.40523
0.13467
3 -3.01 0.0147
Observations (or Sum Wgts) 14
Bowl-Jar Ratio 2 -0.33413 0.13020
4 -2.57 0.0304
Proportion of Non-local Buffware in Buffware Assemblage: Gila Butte - Santa Cruz
Summary of Fit Analysis of Variance Parameter Estimates
Source DF
Sum of Squares
Mean Square F Ratio
Prob > F Term Estimate
Std Error
t Ratio
Prob>|t|
RSquare 0.836197 Model 3 10.87057 3.62352
15.314
7 0.0007 Intercept 7.90E-16
0.13490
8 0 1
RSquare Adj 0.781597 Error 9 2.129433 0.2366 Canal Ratio 2 -0.61834 0.14161 -4.37 0.0018
Root Mean Square Error 0.486419 C. Total 12 13 Color 2 0.523109
0.142328 3.68 0.0051
Mean of Response 1.58E-16
Bowl-Jar Ratio 2 0.56679
0.13563
9 4.18 0.0024
Observations (or Sum Wgts) 13
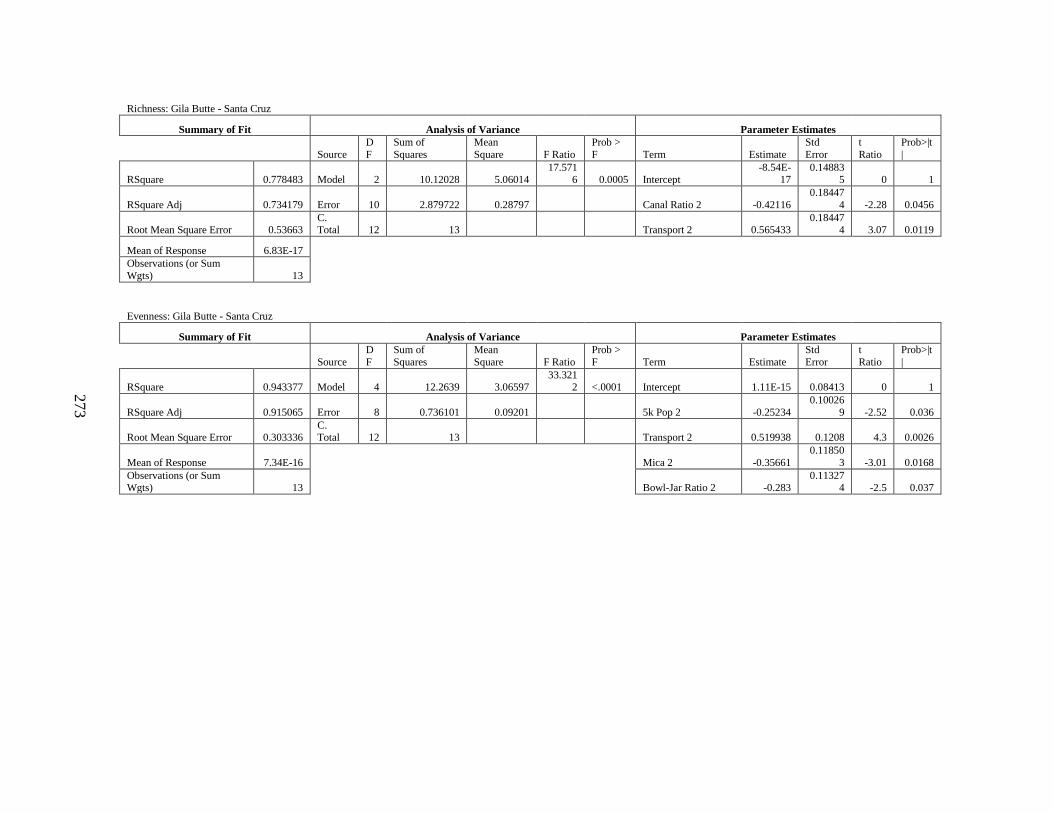
273
Richness: Gila Butte - Santa Cruz
Summary of Fit Analysis of Variance Parameter Estimates
Source
D
F
Sum of
Squares
Mean
Square F Ratio
Prob >
F Term Estimate
Std
Error
t
Ratio
Prob>|t
|
RSquare 0.778483 Model 2 10.12028 5.06014 17.571
6 0.0005 Intercept -8.54E-
17 0.14883
5 0 1
RSquare Adj 0.734179 Error 10 2.879722 0.28797 Canal Ratio 2 -0.42116
0.18447
4 -2.28 0.0456
Root Mean Square Error 0.53663 C. Total 12 13 Transport 2 0.565433
0.184474 3.07 0.0119
Mean of Response 6.83E-17
Observations (or Sum
Wgts) 13
Evenness: Gila Butte - Santa Cruz
Summary of Fit Analysis of Variance Parameter Estimates
Source
D
F
Sum of
Squares
Mean
Square F Ratio
Prob >
F Term Estimate
Std
Error
t
Ratio
Prob>|t
|
RSquare 0.943377 Model 4 12.2639 3.06597 33.321
2 <.0001 Intercept 1.11E-15 0.08413 0 1
RSquare Adj 0.915065 Error 8 0.736101 0.09201 5k Pop 2 -0.25234
0.10026
9 -2.52 0.036
Root Mean Square Error 0.303336 C. Total 12 13 Transport 2 0.519938 0.1208 4.3 0.0026
Mean of Response 7.34E-16
Mica 2 -0.35661
0.11850
3 -3.01 0.0168
Observations (or Sum Wgts) 13
Bowl-Jar Ratio 2 -0.283 0.11327
4 -2.5 0.037
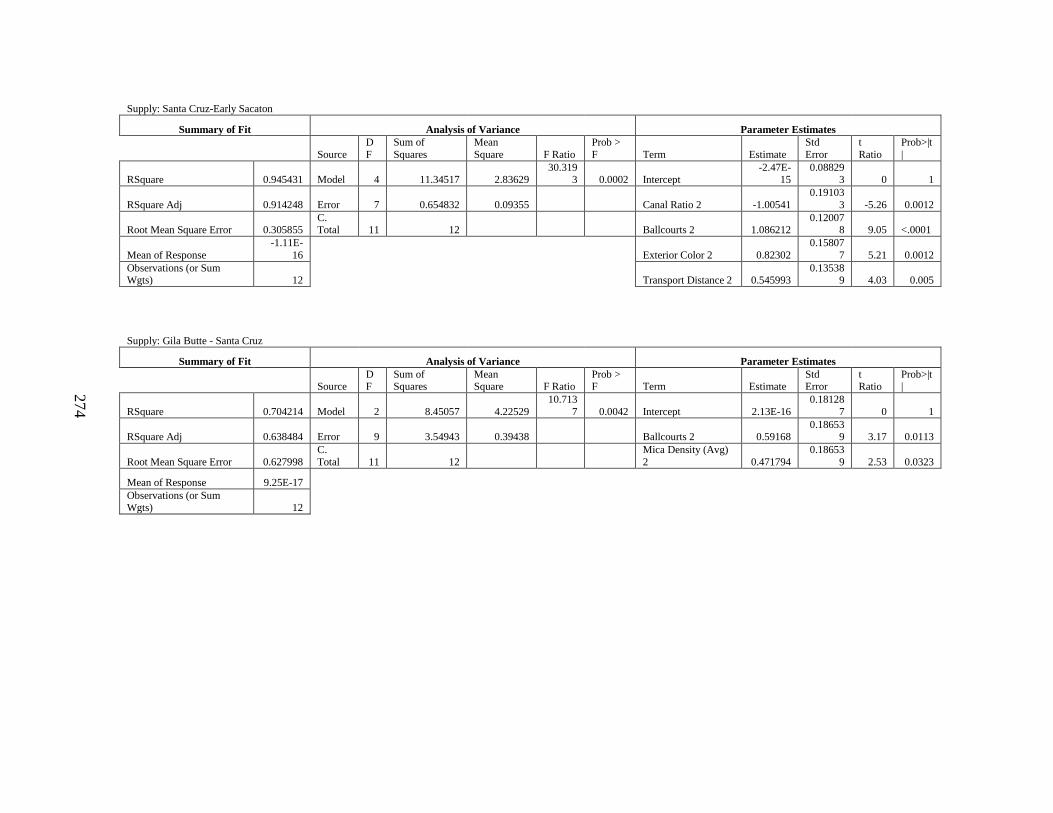
274
Supply: Santa Cruz-Early Sacaton
Summary of Fit Analysis of Variance Parameter Estimates
Source
D
F
Sum of
Squares
Mean
Square F Ratio
Prob >
F Term Estimate
Std
Error
t
Ratio
Prob>|t
|
RSquare 0.945431 Model 4 11.34517 2.83629 30.319
3 0.0002 Intercept -2.47E-
15 0.08829
3 0 1
RSquare Adj 0.914248 Error 7 0.654832 0.09355 Canal Ratio 2 -1.00541
0.19103
3 -5.26 0.0012
Root Mean Square Error 0.305855 C. Total 11 12 Ballcourts 2 1.086212
0.120078 9.05 <.0001
Mean of Response
-1.11E-
16
Exterior Color 2 0.82302
0.15807
7 5.21 0.0012
Observations (or Sum Wgts) 12
Transport Distance 2 0.545993 0.13538
9 4.03 0.005
Supply: Gila Butte - Santa Cruz
Summary of Fit Analysis of Variance Parameter Estimates
Source DF
Sum of Squares
Mean Square F Ratio
Prob > F Term Estimate
Std Error
t Ratio
Prob>|t|
RSquare 0.704214 Model 2 8.45057 4.22529
10.713
7 0.0042 Intercept 2.13E-16
0.18128
7 0 1
RSquare Adj 0.638484 Error 9 3.54943 0.39438 Ballcourts 2 0.59168 0.18653
9 3.17 0.0113
Root Mean Square Error 0.627998
C.
Total 11 12
Mica Density (Avg)
2 0.471794
0.18653
9 2.53 0.0323
Mean of Response 9.25E-17
Observations (or Sum Wgts) 12

275
APPENDIX D
CHEMICAL DATA FROM TOF-LA-ICP-MS ANALYSES OF SCHIST TEMPER
PARTICLES IN RED-ON-BUFF POTTERY
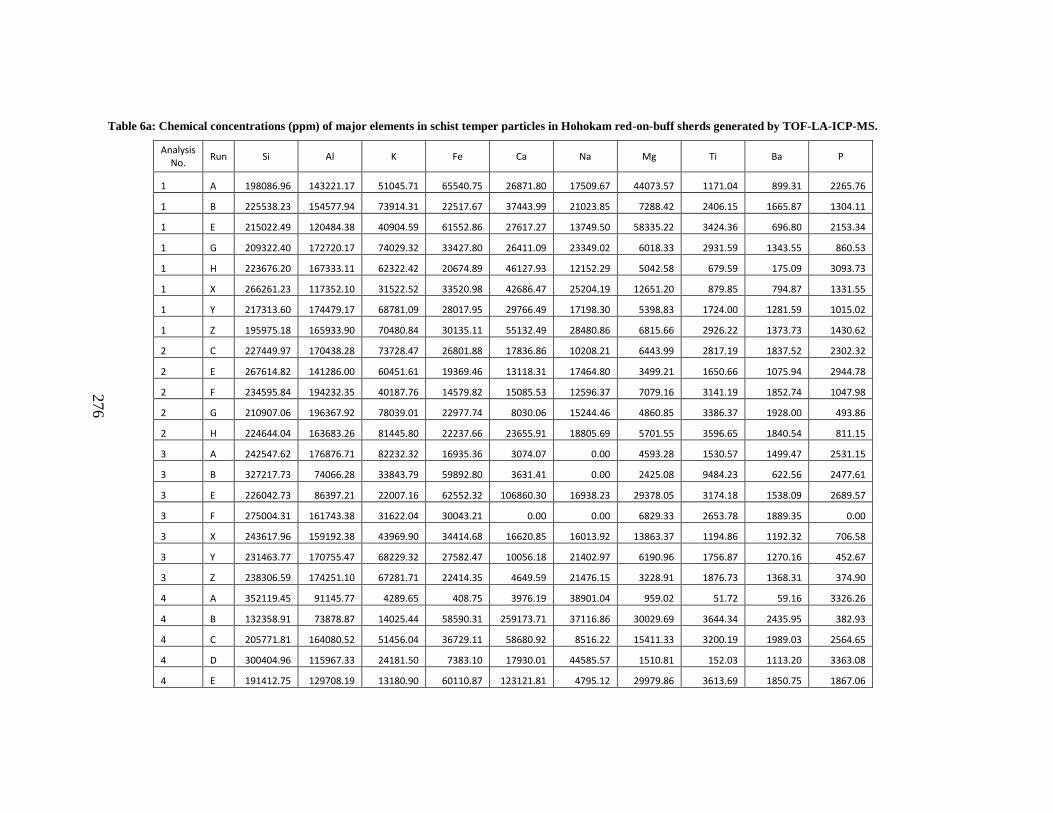
276
Table 6a: Chemical concentrations (ppm) of major elements in schist temper particles in Hohokam red-on-buff sherds generated by TOF-LA-ICP-MS.
Analysis No.
Run Si Al K Fe Ca Na Mg Ti Ba P
1 A 198086.96 143221.17 51045.71 65540.75 26871.80 17509.67 44073.57 1171.04 899.31 2265.76
1 B 225538.23 154577.94 73914.31 22517.67 37443.99 21023.85 7288.42 2406.15 1665.87 1304.11
1 E 215022.49 120484.38 40904.59 61552.86 27617.27 13749.50 58335.22 3424.36 696.80 2153.34
1 G 209322.40 172720.17 74029.32 33427.80 26411.09 23349.02 6018.33 2931.59 1343.55 860.53
1 H 223676.20 167333.11 62322.42 20674.89 46127.93 12152.29 5042.58 679.59 175.09 3093.73
1 X 266261.23 117352.10 31522.52 33520.98 42686.47 25204.19 12651.20 879.85 794.87 1331.55
1 Y 217313.60 174479.17 68781.09 28017.95 29766.49 17198.30 5398.83 1724.00 1281.59 1015.02
1 Z 195975.18 165933.90 70480.84 30135.11 55132.49 28480.86 6815.66 2926.22 1373.73 1430.62
2 C 227449.97 170438.28 73728.47 26801.88 17836.86 10208.21 6443.99 2817.19 1837.52 2302.32
2 E 267614.82 141286.00 60451.61 19369.46 13118.31 17464.80 3499.21 1650.66 1075.94 2944.78
2 F 234595.84 194232.35 40187.76 14579.82 15085.53 12596.37 7079.16 3141.19 1852.74 1047.98
2 G 210907.06 196367.92 78039.01 22977.74 8030.06 15244.46 4860.85 3386.37 1928.00 493.86
2 H 224644.04 163683.26 81445.80 22237.66 23655.91 18805.69 5701.55 3596.65 1840.54 811.15
3 A 242547.62 176876.71 82232.32 16935.36 3074.07 0.00 4593.28 1530.57 1499.47 2531.15
3 B 327217.73 74066.28 33843.79 59892.80 3631.41 0.00 2425.08 9484.23 622.56 2477.61
3 E 226042.73 86397.21 22007.16 62552.32 106860.30 16938.23 29378.05 3174.18 1538.09 2689.57
3 F 275004.31 161743.38 31622.04 30043.21 0.00 0.00 6829.33 2653.78 1889.35 0.00
3 X 243617.96 159192.38 43969.90 34414.68 16620.85 16013.92 13863.37 1194.86 1192.32 706.58
3 Y 231463.77 170755.47 68229.32 27582.47 10056.18 21402.97 6190.96 1756.87 1270.16 452.67
3 Z 238306.59 174251.10 67281.71 22414.35 4649.59 21476.15 3228.91 1876.73 1368.31 374.90
4 A 352119.45 91145.77 4289.65 408.75 3976.19 38901.04 959.02 51.72 59.16 3326.26
4 B 132358.91 73878.87 14025.44 58590.31 259173.71 37116.86 30029.69 3644.34 2435.95 382.93
4 C 205771.81 164080.52 51456.04 36729.11 58680.92 8516.22 15411.33 3200.19 1989.03 2564.65
4 D 300404.96 115967.33 24181.50 7383.10 17930.01 44585.57 1510.81 152.03 1113.20 3363.08
4 E 191412.75 129708.19 13180.90 60110.87 123121.81 4795.12 29979.86 3613.69 1850.75 1867.06
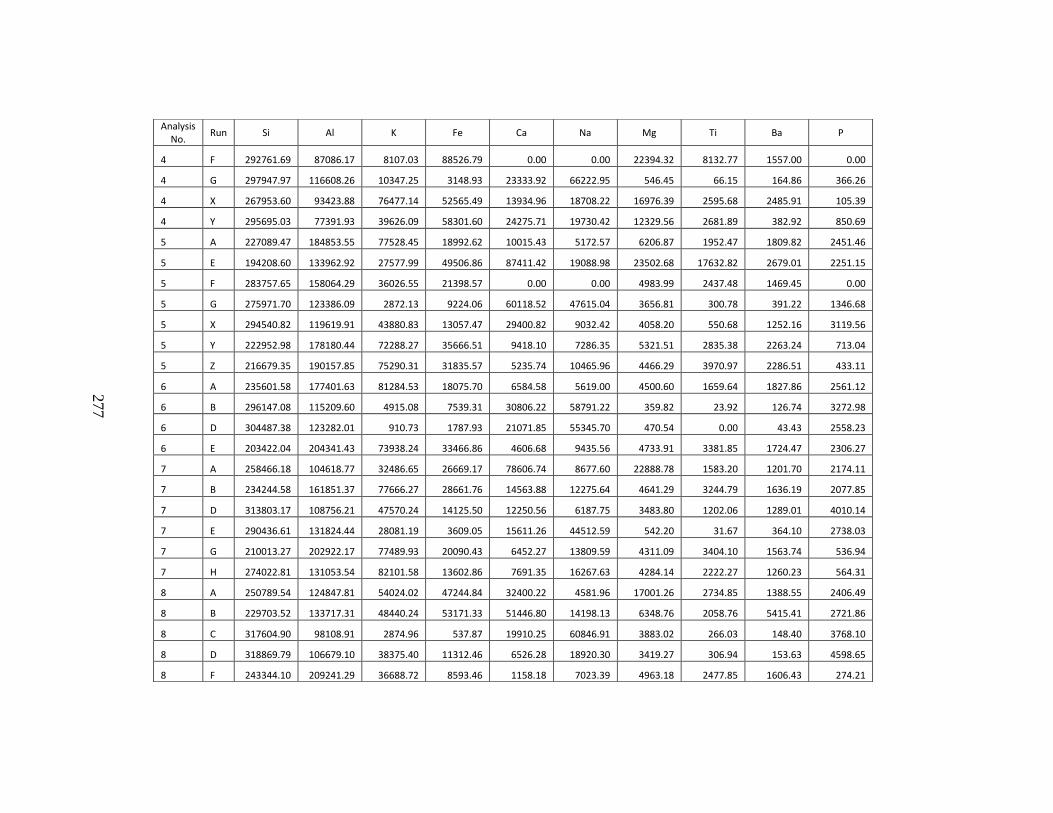
277
Analysis No.
Run Si Al K Fe Ca Na Mg Ti Ba P
4 F 292761.69 87086.17 8107.03 88526.79 0.00 0.00 22394.32 8132.77 1557.00 0.00
4 G 297947.97 116608.26 10347.25 3148.93 23333.92 66222.95 546.45 66.15 164.86 366.26
4 X 267953.60 93423.88 76477.14 52565.49 13934.96 18708.22 16976.39 2595.68 2485.91 105.39
4 Y 295695.03 77391.93 39626.09 58301.60 24275.71 19730.42 12329.56 2681.89 382.92 850.69
5 A 227089.47 184853.55 77528.45 18992.62 10015.43 5172.57 6206.87 1952.47 1809.82 2451.46
5 E 194208.60 133962.92 27577.99 49506.86 87411.42 19088.98 23502.68 17632.82 2679.01 2251.15
5 F 283757.65 158064.29 36026.55 21398.57 0.00 0.00 4983.99 2437.48 1469.45 0.00
5 G 275971.70 123386.09 2872.13 9224.06 60118.52 47615.04 3656.81 300.78 391.22 1346.68
5 X 294540.82 119619.91 43880.83 13057.47 29400.82 9032.42 4058.20 550.68 1252.16 3119.56
5 Y 222952.98 178180.44 72288.27 35666.51 9418.10 7286.35 5321.51 2835.38 2263.24 713.04
5 Z 216679.35 190157.85 75290.31 31835.57 5235.74 10465.96 4466.29 3970.97 2286.51 433.11
6 A 235601.58 177401.63 81284.53 18075.70 6584.58 5619.00 4500.60 1659.64 1827.86 2561.12
6 B 296147.08 115209.60 4915.08 7539.31 30806.22 58791.22 359.82 23.92 126.74 3272.98
6 D 304487.38 123282.01 910.73 1787.93 21071.85 55345.70 470.54 0.00 43.43 2558.23
6 E 203422.04 204341.43 73938.24 33466.86 4606.68 9435.56 4733.91 3381.85 1724.47 2306.27
7 A 258466.18 104618.77 32486.65 26669.17 78606.74 8677.60 22888.78 1583.20 1201.70 2174.11
7 B 234244.58 161851.37 77666.27 28661.76 14563.88 12275.64 4641.29 3244.79 1636.19 2077.85
7 D 313803.17 108756.21 47570.24 14125.50 12250.56 6187.75 3483.80 1202.06 1289.01 4010.14
7 E 290436.61 131824.44 28081.19 3609.05 15611.26 44512.59 542.20 31.67 364.10 2738.03
7 G 210013.27 202922.17 77489.93 20090.43 6452.27 13809.59 4311.09 3404.10 1563.74 536.94
7 H 274022.81 131053.54 82101.58 13602.86 7691.35 16267.63 4284.14 2222.27 1260.23 564.31
8 A 250789.54 124847.81 54024.02 47244.84 32400.22 4581.96 17001.26 2734.85 1388.55 2406.49
8 B 229703.52 133717.31 48440.24 53171.33 51446.80 14198.13 6348.76 2058.76 5415.41 2721.86
8 C 317604.90 98108.91 2874.96 537.87 19910.25 60846.91 3883.02 266.03 148.40 3768.10
8 D 318869.79 106679.10 38375.40 11312.46 6526.28 18920.30 3419.27 306.94 153.63 4598.65
8 F 243344.10 209241.29 36688.72 8593.46 1158.18 7023.39 4963.18 2477.85 1606.43 274.21
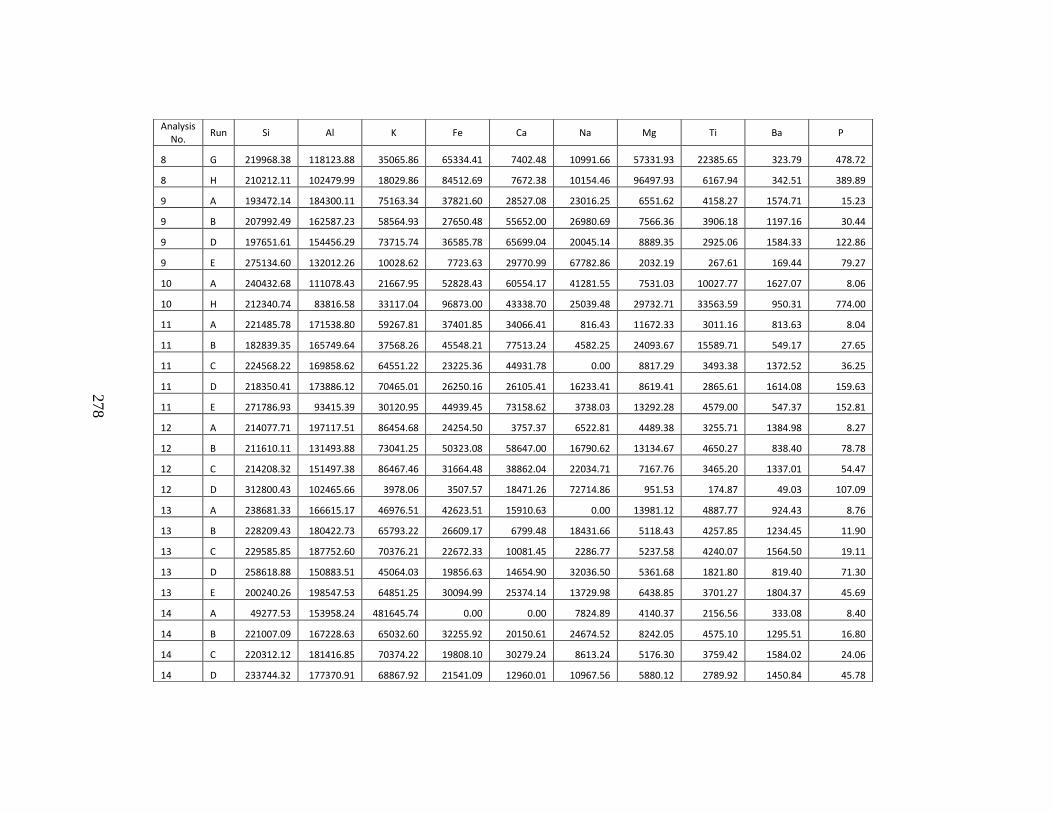
278
Analysis No.
Run Si Al K Fe Ca Na Mg Ti Ba P
8 G 219968.38 118123.88 35065.86 65334.41 7402.48 10991.66 57331.93 22385.65 323.79 478.72
8 H 210212.11 102479.99 18029.86 84512.69 7672.38 10154.46 96497.93 6167.94 342.51 389.89
9 A 193472.14 184300.11 75163.34 37821.60 28527.08 23016.25 6551.62 4158.27 1574.71 15.23
9 B 207992.49 162587.23 58564.93 27650.48 55652.00 26980.69 7566.36 3906.18 1197.16 30.44
9 D 197651.61 154456.29 73715.74 36585.78 65699.04 20045.14 8889.35 2925.06 1584.33 122.86
9 E 275134.60 132012.26 10028.62 7723.63 29770.99 67782.86 2032.19 267.61 169.44 79.27
10 A 240432.68 111078.43 21667.95 52828.43 60554.17 41281.55 7531.03 10027.77 1627.07 8.06
10 H 212340.74 83816.58 33117.04 96873.00 43338.70 25039.48 29732.71 33563.59 950.31 774.00
11 A 221485.78 171538.80 59267.81 37401.85 34066.41 816.43 11672.33 3011.16 813.63 8.04
11 B 182839.35 165749.64 37568.26 45548.21 77513.24 4582.25 24093.67 15589.71 549.17 27.65
11 C 224568.22 169858.62 64551.22 23225.36 44931.78 0.00 8817.29 3493.38 1372.52 36.25
11 D 218350.41 173886.12 70465.01 26250.16 26105.41 16233.41 8619.41 2865.61 1614.08 159.63
11 E 271786.93 93415.39 30120.95 44939.45 73158.62 3738.03 13292.28 4579.00 547.37 152.81
12 A 214077.71 197117.51 86454.68 24254.50 3757.37 6522.81 4489.38 3255.71 1384.98 8.27
12 B 211610.11 131493.88 73041.25 50323.08 58647.00 16790.62 13134.67 4650.27 838.40 78.78
12 C 214208.32 151497.38 86467.46 31664.48 38862.04 22034.71 7167.76 3465.20 1337.01 54.47
12 D 312800.43 102465.66 3978.06 3507.57 18471.26 72714.86 951.53 174.87 49.03 107.09
13 A 238681.33 166615.17 46976.51 42623.51 15910.63 0.00 13981.12 4887.77 924.43 8.76
13 B 228209.43 180422.73 65793.22 26609.17 6799.48 18431.66 5118.43 4257.85 1234.45 11.90
13 C 229585.85 187752.60 70376.21 22672.33 10081.45 2286.77 5237.58 4240.07 1564.50 19.11
13 D 258618.88 150883.51 45064.03 19856.63 14654.90 32036.50 5361.68 1821.80 819.40 71.30
13 E 200240.26 198547.53 64851.25 30094.99 25374.14 13729.98 6438.85 3701.27 1804.37 45.69
14 A 49277.53 153958.24 481645.74 0.00 0.00 7824.89 4140.37 2156.56 333.08 8.40
14 B 221007.09 167228.63 65032.60 32255.92 20150.61 24674.52 8242.05 4575.10 1295.51 16.80
14 C 220312.12 181416.85 70374.22 19808.10 30279.24 8613.24 5176.30 3759.42 1584.02 24.06
14 D 233744.32 177370.91 68867.92 21541.09 12960.01 10967.56 5880.12 2789.92 1450.84 45.78
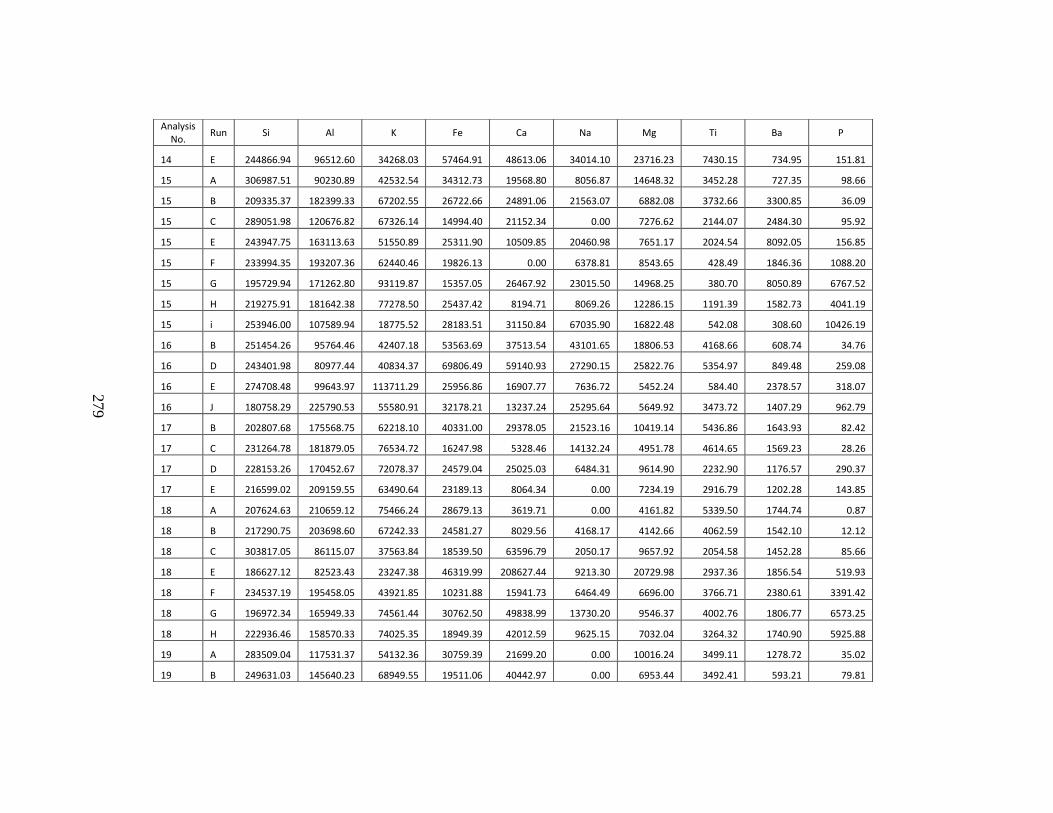
279
Analysis No.
Run Si Al K Fe Ca Na Mg Ti Ba P
14 E 244866.94 96512.60 34268.03 57464.91 48613.06 34014.10 23716.23 7430.15 734.95 151.81
15 A 306987.51 90230.89 42532.54 34312.73 19568.80 8056.87 14648.32 3452.28 727.35 98.66
15 B 209335.37 182399.33 67202.55 26722.66 24891.06 21563.07 6882.08 3732.66 3300.85 36.09
15 C 289051.98 120676.82 67326.14 14994.40 21152.34 0.00 7276.62 2144.07 2484.30 95.92
15 E 243947.75 163113.63 51550.89 25311.90 10509.85 20460.98 7651.17 2024.54 8092.05 156.85
15 F 233994.35 193207.36 62440.46 19826.13 0.00 6378.81 8543.65 428.49 1846.36 1088.20
15 G 195729.94 171262.80 93119.87 15357.05 26467.92 23015.50 14968.25 380.70 8050.89 6767.52
15 H 219275.91 181642.38 77278.50 25437.42 8194.71 8069.26 12286.15 1191.39 1582.73 4041.19
15 i 253946.00 107589.94 18775.52 28183.51 31150.84 67035.90 16822.48 542.08 308.60 10426.19
16 B 251454.26 95764.46 42407.18 53563.69 37513.54 43101.65 18806.53 4168.66 608.74 34.76
16 D 243401.98 80977.44 40834.37 69806.49 59140.93 27290.15 25822.76 5354.97 849.48 259.08
16 E 274708.48 99643.97 113711.29 25956.86 16907.77 7636.72 5452.24 584.40 2378.57 318.07
16 J 180758.29 225790.53 55580.91 32178.21 13237.24 25295.64 5649.92 3473.72 1407.29 962.79
17 B 202807.68 175568.75 62218.10 40331.00 29378.05 21523.16 10419.14 5436.86 1643.93 82.42
17 C 231264.78 181879.05 76534.72 16247.98 5328.46 14132.24 4951.78 4614.65 1569.23 28.26
17 D 228153.26 170452.67 72078.37 24579.04 25025.03 6484.31 9614.90 2232.90 1176.57 290.37
17 E 216599.02 209159.55 63490.64 23189.13 8064.34 0.00 7234.19 2916.79 1202.28 143.85
18 A 207624.63 210659.12 75466.24 28679.13 3619.71 0.00 4161.82 5339.50 1744.74 0.87
18 B 217290.75 203698.60 67242.33 24581.27 8029.56 4168.17 4142.66 4062.59 1542.10 12.12
18 C 303817.05 86115.07 37563.84 18539.50 63596.79 2050.17 9657.92 2054.58 1452.28 85.66
18 E 186627.12 82523.43 23247.38 46319.99 208627.44 9213.30 20729.98 2937.36 1856.54 519.93
18 F 234537.19 195458.05 43921.85 10231.88 15941.73 6464.49 6696.00 3766.71 2380.61 3391.42
18 G 196972.34 165949.33 74561.44 30762.50 49838.99 13730.20 9546.37 4002.76 1806.77 6573.25
18 H 222936.46 158570.33 74025.35 18949.39 42012.59 9625.15 7032.04 3264.32 1740.90 5925.88
19 A 283509.04 117531.37 54132.36 30759.39 21699.20 0.00 10016.24 3499.11 1278.72 35.02
19 B 249631.03 145640.23 68949.55 19511.06 40442.97 0.00 6953.44 3492.41 593.21 79.81
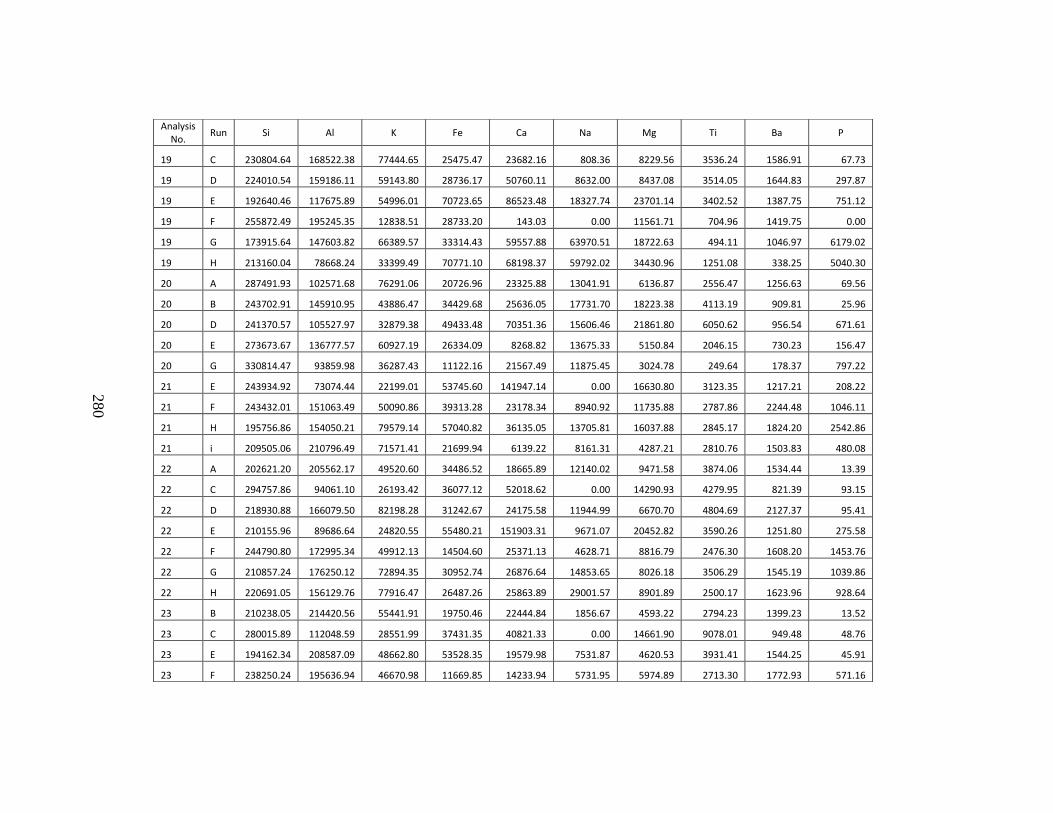
280
Analysis No.
Run Si Al K Fe Ca Na Mg Ti Ba P
19 C 230804.64 168522.38 77444.65 25475.47 23682.16 808.36 8229.56 3536.24 1586.91 67.73
19 D 224010.54 159186.11 59143.80 28736.17 50760.11 8632.00 8437.08 3514.05 1644.83 297.87
19 E 192640.46 117675.89 54996.01 70723.65 86523.48 18327.74 23701.14 3402.52 1387.75 751.12
19 F 255872.49 195245.35 12838.51 28733.20 143.03 0.00 11561.71 704.96 1419.75 0.00
19 G 173915.64 147603.82 66389.57 33314.43 59557.88 63970.51 18722.63 494.11 1046.97 6179.02
19 H 213160.04 78668.24 33399.49 70771.10 68198.37 59792.02 34430.96 1251.08 338.25 5040.30
20 A 287491.93 102571.68 76291.06 20726.96 23325.88 13041.91 6136.87 2556.47 1256.63 69.56
20 B 243702.91 145910.95 43886.47 34429.68 25636.05 17731.70 18223.38 4113.19 909.81 25.96
20 D 241370.57 105527.97 32879.38 49433.48 70351.36 15606.46 21861.80 6050.62 956.54 671.61
20 E 273673.67 136777.57 60927.19 26334.09 8268.82 13675.33 5150.84 2046.15 730.23 156.47
20 G 330814.47 93859.98 36287.43 11122.16 21567.49 11875.45 3024.78 249.64 178.37 797.22
21 E 243934.92 73074.44 22199.01 53745.60 141947.14 0.00 16630.80 3123.35 1217.21 208.22
21 F 243432.01 151063.49 50090.86 39313.28 23178.34 8940.92 11735.88 2787.86 2244.48 1046.11
21 H 195756.86 154050.21 79579.14 57040.82 36135.05 13705.81 16037.88 2845.17 1824.20 2542.86
21 i 209505.06 210796.49 71571.41 21699.94 6139.22 8161.31 4287.21 2810.76 1503.83 480.08
22 A 202621.20 205562.17 49520.60 34486.52 18665.89 12140.02 9471.58 3874.06 1534.44 13.39
22 C 294757.86 94061.10 26193.42 36077.12 52018.62 0.00 14290.93 4279.95 821.39 93.15
22 D 218930.88 166079.50 82198.28 31242.67 24175.58 11944.99 6670.70 4804.69 2127.37 95.41
22 E 210155.96 89686.64 24820.55 55480.21 151903.31 9671.07 20452.82 3590.26 1251.80 275.58
22 F 244790.80 172995.34 49912.13 14504.60 25371.13 4628.71 8816.79 2476.30 1608.20 1453.76
22 G 210857.24 176250.12 72894.35 30952.74 26876.64 14853.65 8026.18 3506.29 1545.19 1039.86
22 H 220691.05 156129.76 77916.47 26487.26 25863.89 29001.57 8901.89 2500.17 1623.96 928.64
23 B 210238.05 214420.56 55441.91 19750.46 22444.84 1856.67 4593.22 2794.23 1399.23 13.52
23 C 280015.89 112048.59 28551.99 37431.35 40821.33 0.00 14661.90 9078.01 949.48 48.76
23 E 194162.34 208587.09 48662.80 53528.35 19579.98 7531.87 4620.53 3931.41 1544.25 45.91
23 F 238250.24 195636.94 46670.98 11669.85 14233.94 5731.95 5974.89 2713.30 1772.93 571.16
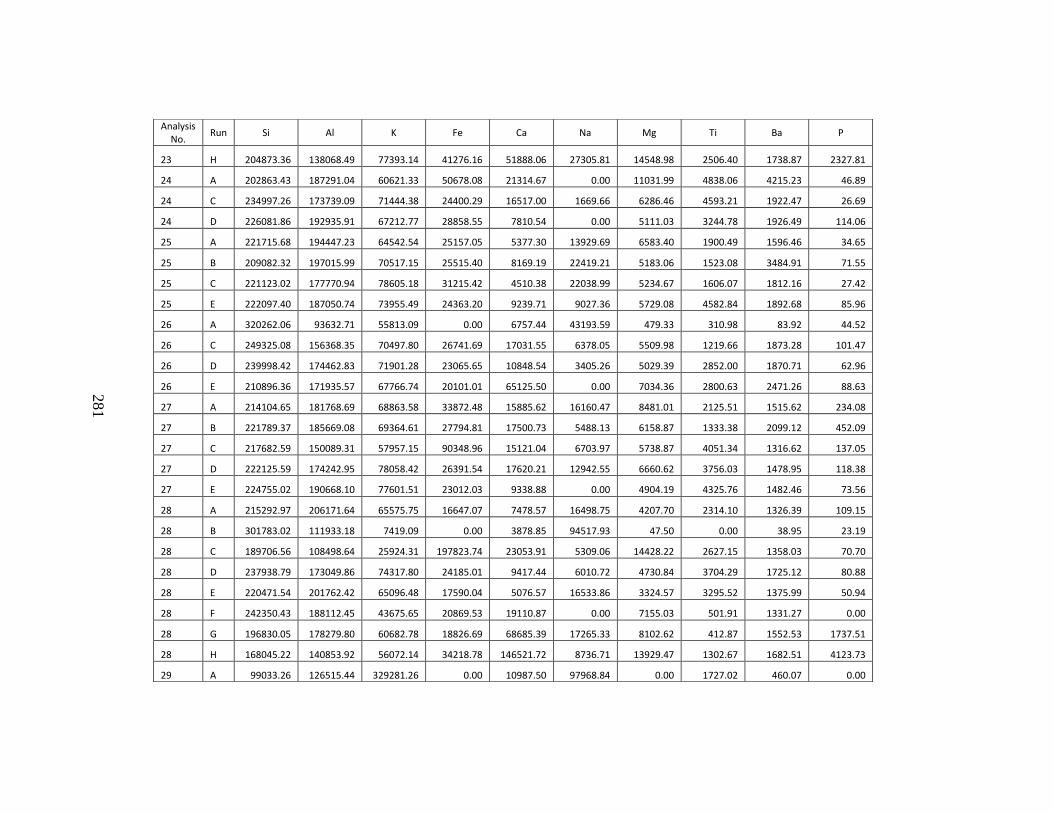
281
Analysis No.
Run Si Al K Fe Ca Na Mg Ti Ba P
23 H 204873.36 138068.49 77393.14 41276.16 51888.06 27305.81 14548.98 2506.40 1738.87 2327.81
24 A 202863.43 187291.04 60621.33 50678.08 21314.67 0.00 11031.99 4838.06 4215.23 46.89
24 C 234997.26 173739.09 71444.38 24400.29 16517.00 1669.66 6286.46 4593.21 1922.47 26.69
24 D 226081.86 192935.91 67212.77 28858.55 7810.54 0.00 5111.03 3244.78 1926.49 114.06
25 A 221715.68 194447.23 64542.54 25157.05 5377.30 13929.69 6583.40 1900.49 1596.46 34.65
25 B 209082.32 197015.99 70517.15 25515.40 8169.19 22419.21 5183.06 1523.08 3484.91 71.55
25 C 221123.02 177770.94 78605.18 31215.42 4510.38 22038.99 5234.67 1606.07 1812.16 27.42
25 E 222097.40 187050.74 73955.49 24363.20 9239.71 9027.36 5729.08 4582.84 1892.68 85.96
26 A 320262.06 93632.71 55813.09 0.00 6757.44 43193.59 479.33 310.98 83.92 44.52
26 C 249325.08 156368.35 70497.80 26741.69 17031.55 6378.05 5509.98 1219.66 1873.28 101.47
26 D 239998.42 174462.83 71901.28 23065.65 10848.54 3405.26 5029.39 2852.00 1870.71 62.96
26 E 210896.36 171935.57 67766.74 20101.01 65125.50 0.00 7034.36 2800.63 2471.26 88.63
27 A 214104.65 181768.69 68863.58 33872.48 15885.62 16160.47 8481.01 2125.51 1515.62 234.08
27 B 221789.37 185669.08 69364.61 27794.81 17500.73 5488.13 6158.87 1333.38 2099.12 452.09
27 C 217682.59 150089.31 57957.15 90348.96 15121.04 6703.97 5738.87 4051.34 1316.62 137.05
27 D 222125.59 174242.95 78058.42 26391.54 17620.21 12942.55 6660.62 3756.03 1478.95 118.38
27 E 224755.02 190668.10 77601.51 23012.03 9338.88 0.00 4904.19 4325.76 1482.46 73.56
28 A 215292.97 206171.64 65575.75 16647.07 7478.57 16498.75 4207.70 2314.10 1326.39 109.15
28 B 301783.02 111933.18 7419.09 0.00 3878.85 94517.93 47.50 0.00 38.95 23.19
28 C 189706.56 108498.64 25924.31 197823.74 23053.91 5309.06 14428.22 2627.15 1358.03 70.70
28 D 237938.79 173049.86 74317.80 24185.01 9417.44 6010.72 4730.84 3704.29 1725.12 80.88
28 E 220471.54 201762.42 65096.48 17590.04 5076.57 16533.86 3324.57 3295.52 1375.99 50.94
28 F 242350.43 188112.45 43675.65 20869.53 19110.87 0.00 7155.03 501.91 1331.27 0.00
28 G 196830.05 178279.80 60682.78 18826.69 68685.39 17265.33 8102.62 412.87 1552.53 1737.51
28 H 168045.22 140853.92 56072.14 34218.78 146521.72 8736.71 13929.47 1302.67 1682.51 4123.73
29 A 99033.26 126515.44 329281.26 0.00 10987.50 97968.84 0.00 1727.02 460.07 0.00
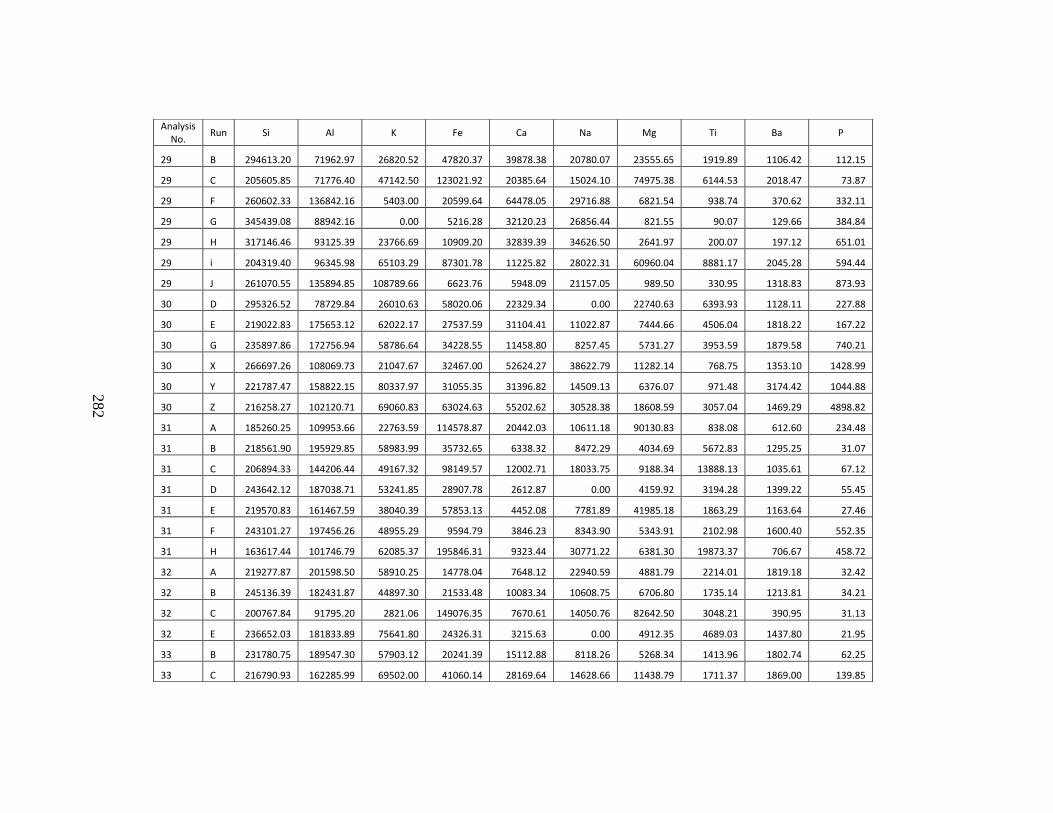
282
Analysis No.
Run Si Al K Fe Ca Na Mg Ti Ba P
29 B 294613.20 71962.97 26820.52 47820.37 39878.38 20780.07 23555.65 1919.89 1106.42 112.15
29 C 205605.85 71776.40 47142.50 123021.92 20385.64 15024.10 74975.38 6144.53 2018.47 73.87
29 F 260602.33 136842.16 5403.00 20599.64 64478.05 29716.88 6821.54 938.74 370.62 332.11
29 G 345439.08 88942.16 0.00 5216.28 32120.23 26856.44 821.55 90.07 129.66 384.84
29 H 317146.46 93125.39 23766.69 10909.20 32839.39 34626.50 2641.97 200.07 197.12 651.01
29 i 204319.40 96345.98 65103.29 87301.78 11225.82 28022.31 60960.04 8881.17 2045.28 594.44
29 J 261070.55 135894.85 108789.66 6623.76 5948.09 21157.05 989.50 330.95 1318.83 873.93
30 D 295326.52 78729.84 26010.63 58020.06 22329.34 0.00 22740.63 6393.93 1128.11 227.88
30 E 219022.83 175653.12 62022.17 27537.59 31104.41 11022.87 7444.66 4506.04 1818.22 167.22
30 G 235897.86 172756.94 58786.64 34228.55 11458.80 8257.45 5731.27 3953.59 1879.58 740.21
30 X 266697.26 108069.73 21047.67 32467.00 52624.27 38622.79 11282.14 768.75 1353.10 1428.99
30 Y 221787.47 158822.15 80337.97 31055.35 31396.82 14509.13 6376.07 971.48 3174.42 1044.88
30 Z 216258.27 102120.71 69060.83 63024.63 55202.62 30528.38 18608.59 3057.04 1469.29 4898.82
31 A 185260.25 109953.66 22763.59 114578.87 20442.03 10611.18 90130.83 838.08 612.60 234.48
31 B 218561.90 195929.85 58983.99 35732.65 6338.32 8472.29 4034.69 5672.83 1295.25 31.07
31 C 206894.33 144206.44 49167.32 98149.57 12002.71 18033.75 9188.34 13888.13 1035.61 67.12
31 D 243642.12 187038.71 53241.85 28907.78 2612.87 0.00 4159.92 3194.28 1399.22 55.45
31 E 219570.83 161467.59 38040.39 57853.13 4452.08 7781.89 41985.18 1863.29 1163.64 27.46
31 F 243101.27 197456.26 48955.29 9594.79 3846.23 8343.90 5343.91 2102.98 1600.40 552.35
31 H 163617.44 101746.79 62085.37 195846.31 9323.44 30771.22 6381.30 19873.37 706.67 458.72
32 A 219277.87 201598.50 58910.25 14778.04 7648.12 22940.59 4881.79 2214.01 1819.18 32.42
32 B 245136.39 182431.87 44897.30 21533.48 10083.34 10608.75 6706.80 1735.14 1213.81 34.21
32 C 200767.84 91795.20 2821.06 149076.35 7670.61 14050.76 82642.50 3048.21 390.95 31.13
32 E 236652.03 181833.89 75641.80 24326.31 3215.63 0.00 4912.35 4689.03 1437.80 21.95
33 B 231780.75 189547.30 57903.12 20241.39 15112.88 8118.26 5268.34 1413.96 1802.74 62.25
33 C 216790.93 162285.99 69502.00 41060.14 28169.64 14628.66 11438.79 1711.37 1869.00 139.85
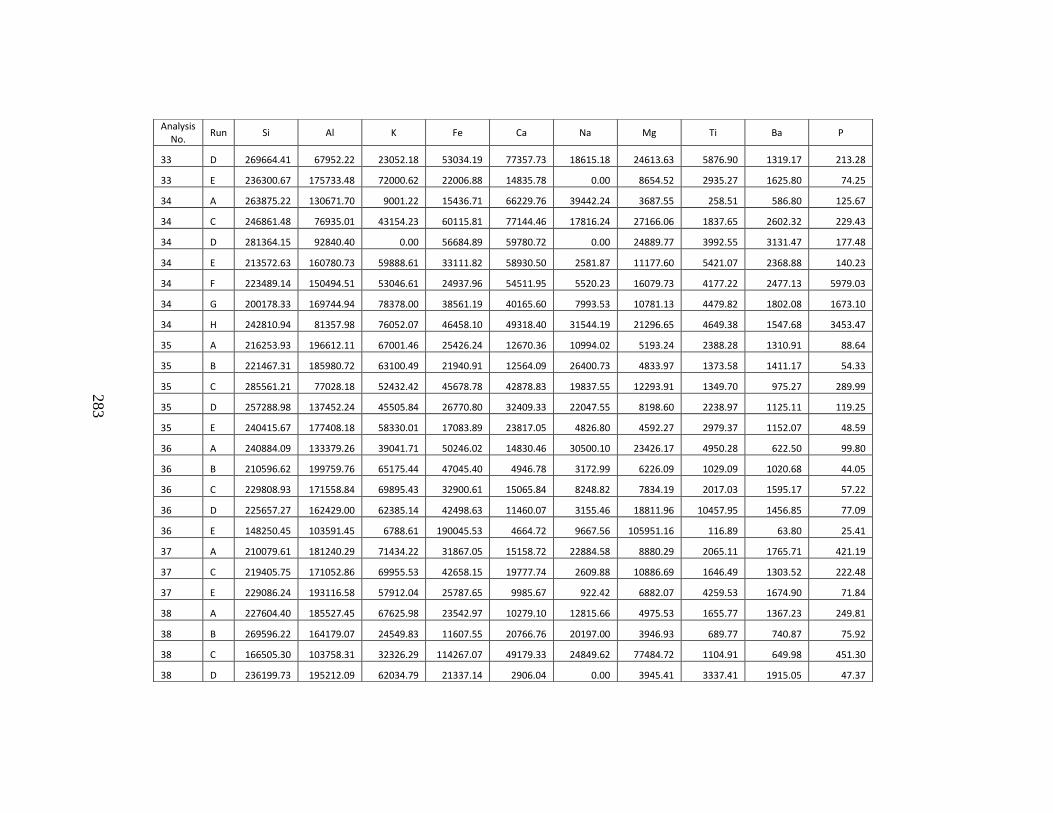
283
Analysis No.
Run Si Al K Fe Ca Na Mg Ti Ba P
33 D 269664.41 67952.22 23052.18 53034.19 77357.73 18615.18 24613.63 5876.90 1319.17 213.28
33 E 236300.67 175733.48 72000.62 22006.88 14835.78 0.00 8654.52 2935.27 1625.80 74.25
34 A 263875.22 130671.70 9001.22 15436.71 66229.76 39442.24 3687.55 258.51 586.80 125.67
34 C 246861.48 76935.01 43154.23 60115.81 77144.46 17816.24 27166.06 1837.65 2602.32 229.43
34 D 281364.15 92840.40 0.00 56684.89 59780.72 0.00 24889.77 3992.55 3131.47 177.48
34 E 213572.63 160780.73 59888.61 33111.82 58930.50 2581.87 11177.60 5421.07 2368.88 140.23
34 F 223489.14 150494.51 53046.61 24937.96 54511.95 5520.23 16079.73 4177.22 2477.13 5979.03
34 G 200178.33 169744.94 78378.00 38561.19 40165.60 7993.53 10781.13 4479.82 1802.08 1673.10
34 H 242810.94 81357.98 76052.07 46458.10 49318.40 31544.19 21296.65 4649.38 1547.68 3453.47
35 A 216253.93 196612.11 67001.46 25426.24 12670.36 10994.02 5193.24 2388.28 1310.91 88.64
35 B 221467.31 185980.72 63100.49 21940.91 12564.09 26400.73 4833.97 1373.58 1411.17 54.33
35 C 285561.21 77028.18 52432.42 45678.78 42878.83 19837.55 12293.91 1349.70 975.27 289.99
35 D 257288.98 137452.24 45505.84 26770.80 32409.33 22047.55 8198.60 2238.97 1125.11 119.25
35 E 240415.67 177408.18 58330.01 17083.89 23817.05 4826.80 4592.27 2979.37 1152.07 48.59
36 A 240884.09 133379.26 39041.71 50246.02 14830.46 30500.10 23426.17 4950.28 622.50 99.80
36 B 210596.62 199759.76 65175.44 47045.40 4946.78 3172.99 6226.09 1029.09 1020.68 44.05
36 C 229808.93 171558.84 69895.43 32900.61 15065.84 8248.82 7834.19 2017.03 1595.17 57.22
36 D 225657.27 162429.00 62385.14 42498.63 11460.07 3155.46 18811.96 10457.95 1456.85 77.09
36 E 148250.45 103591.45 6788.61 190045.53 4664.72 9667.56 105951.16 116.89 63.80 25.41
37 A 210079.61 181240.29 71434.22 31867.05 15158.72 22884.58 8880.29 2065.11 1765.71 421.19
37 C 219405.75 171052.86 69955.53 42658.15 19777.74 2609.88 10886.69 1646.49 1303.52 222.48
37 E 229086.24 193116.58 57912.04 25787.65 9985.67 922.42 6882.07 4259.53 1674.90 71.84
38 A 227604.40 185527.45 67625.98 23542.97 10279.10 12815.66 4975.53 1655.77 1367.23 249.81
38 B 269596.22 164179.07 24549.83 11607.55 20766.76 20197.00 3946.93 689.77 740.87 75.92
38 C 166505.30 103758.31 32326.29 114267.07 49179.33 24849.62 77484.72 1104.91 649.98 451.30
38 D 236199.73 195212.09 62034.79 21337.14 2906.04 0.00 3945.41 3337.41 1915.05 47.37
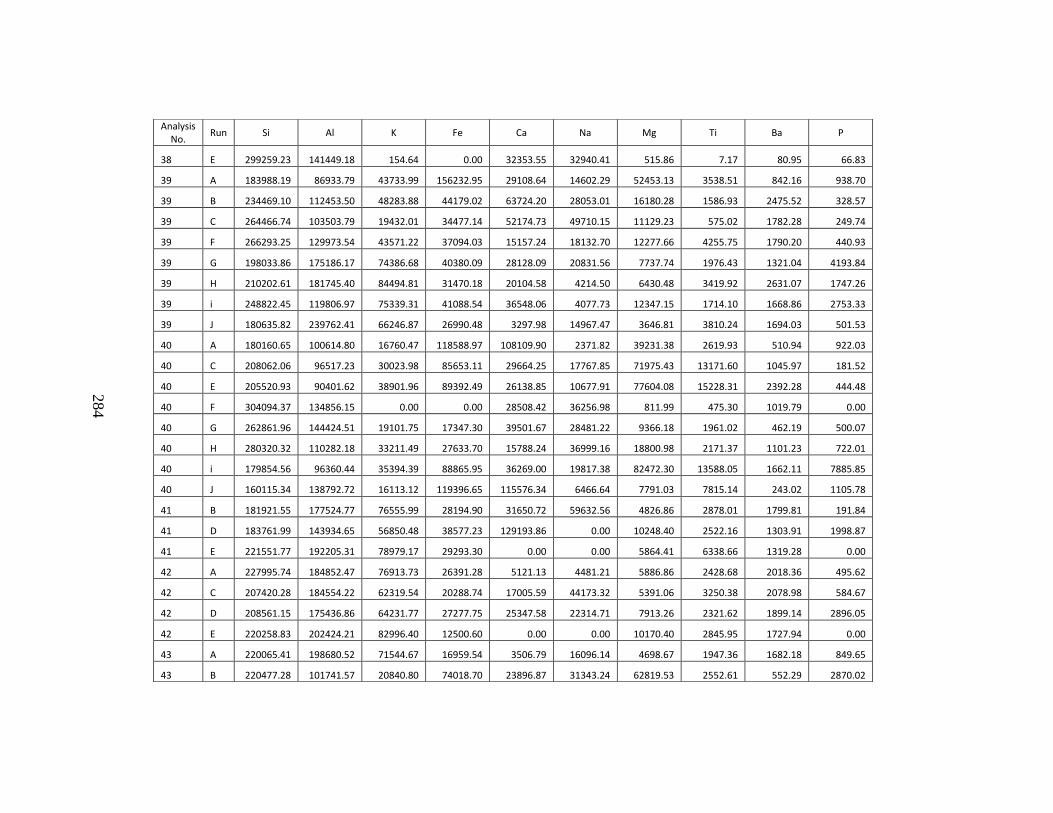
284
Analysis No.
Run Si Al K Fe Ca Na Mg Ti Ba P
38 E 299259.23 141449.18 154.64 0.00 32353.55 32940.41 515.86 7.17 80.95 66.83
39 A 183988.19 86933.79 43733.99 156232.95 29108.64 14602.29 52453.13 3538.51 842.16 938.70
39 B 234469.10 112453.50 48283.88 44179.02 63724.20 28053.01 16180.28 1586.93 2475.52 328.57
39 C 264466.74 103503.79 19432.01 34477.14 52174.73 49710.15 11129.23 575.02 1782.28 249.74
39 F 266293.25 129973.54 43571.22 37094.03 15157.24 18132.70 12277.66 4255.75 1790.20 440.93
39 G 198033.86 175186.17 74386.68 40380.09 28128.09 20831.56 7737.74 1976.43 1321.04 4193.84
39 H 210202.61 181745.40 84494.81 31470.18 20104.58 4214.50 6430.48 3419.92 2631.07 1747.26
39 i 248822.45 119806.97 75339.31 41088.54 36548.06 4077.73 12347.15 1714.10 1668.86 2753.33
39 J 180635.82 239762.41 66246.87 26990.48 3297.98 14967.47 3646.81 3810.24 1694.03 501.53
40 A 180160.65 100614.80 16760.47 118588.97 108109.90 2371.82 39231.38 2619.93 510.94 922.03
40 C 208062.06 96517.23 30023.98 85653.11 29664.25 17767.85 71975.43 13171.60 1045.97 181.52
40 E 205520.93 90401.62 38901.96 89392.49 26138.85 10677.91 77604.08 15228.31 2392.28 444.48
40 F 304094.37 134856.15 0.00 0.00 28508.42 36256.98 811.99 475.30 1019.79 0.00
40 G 262861.96 144424.51 19101.75 17347.30 39501.67 28481.22 9366.18 1961.02 462.19 500.07
40 H 280320.32 110282.18 33211.49 27633.70 15788.24 36999.16 18800.98 2171.37 1101.23 722.01
40 i 179854.56 96360.44 35394.39 88865.95 36269.00 19817.38 82472.30 13588.05 1662.11 7885.85
40 J 160115.34 138792.72 16113.12 119396.65 115576.34 6466.64 7791.03 7815.14 243.02 1105.78
41 B 181921.55 177524.77 76555.99 28194.90 31650.72 59632.56 4826.86 2878.01 1799.81 191.84
41 D 183761.99 143934.65 56850.48 38577.23 129193.86 0.00 10248.40 2522.16 1303.91 1998.87
41 E 221551.77 192205.31 78979.17 29293.30 0.00 0.00 5864.41 6338.66 1319.28 0.00
42 A 227995.74 184852.47 76913.73 26391.28 5121.13 4481.21 5886.86 2428.68 2018.36 495.62
42 C 207420.28 184554.22 62319.54 20288.74 17005.59 44173.32 5391.06 3250.38 2078.98 584.67
42 D 208561.15 175436.86 64231.77 27277.75 25347.58 22314.71 7913.26 2321.62 1899.14 2896.05
42 E 220258.83 202424.21 82996.40 12500.60 0.00 0.00 10170.40 2845.95 1727.94 0.00
43 A 220065.41 198680.52 71544.67 16959.54 3506.79 16096.14 4698.67 1947.36 1682.18 849.65
43 B 220477.28 101741.57 20840.80 74018.70 23896.87 31343.24 62819.53 2552.61 552.29 2870.02
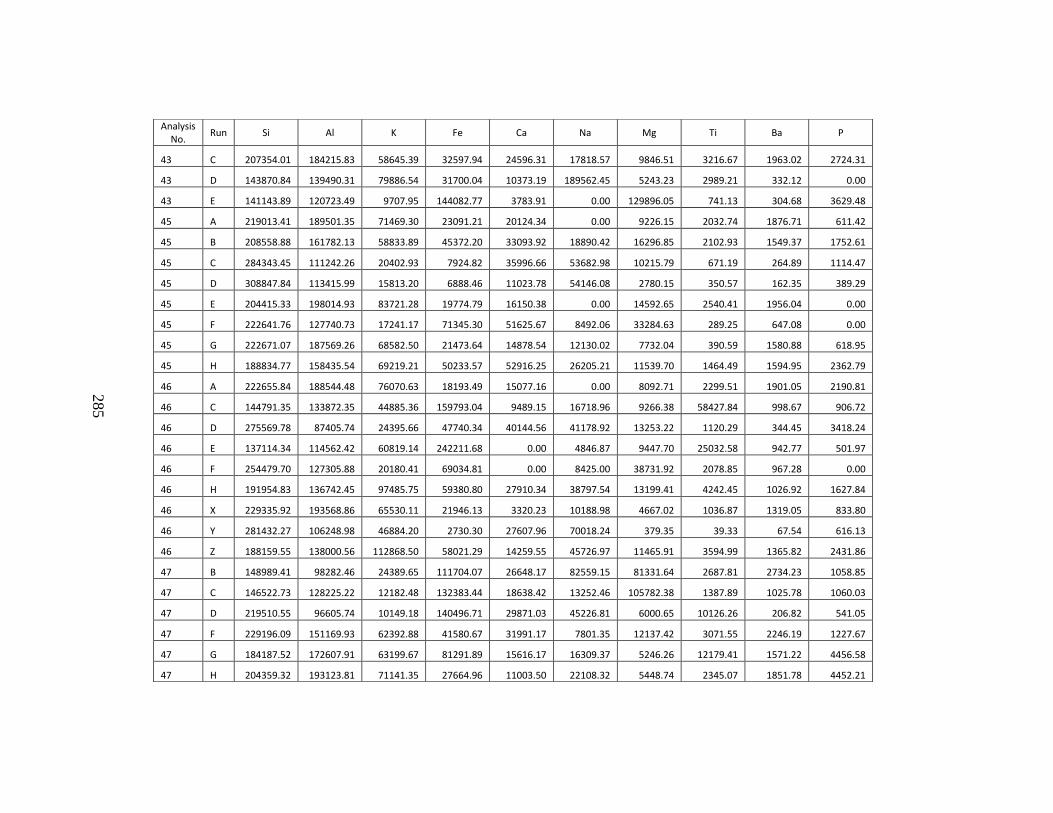
285
Analysis No.
Run Si Al K Fe Ca Na Mg Ti Ba P
43 C 207354.01 184215.83 58645.39 32597.94 24596.31 17818.57 9846.51 3216.67 1963.02 2724.31
43 D 143870.84 139490.31 79886.54 31700.04 10373.19 189562.45 5243.23 2989.21 332.12 0.00
43 E 141143.89 120723.49 9707.95 144082.77 3783.91 0.00 129896.05 741.13 304.68 3629.48
45 A 219013.41 189501.35 71469.30 23091.21 20124.34 0.00 9226.15 2032.74 1876.71 611.42
45 B 208558.88 161782.13 58833.89 45372.20 33093.92 18890.42 16296.85 2102.93 1549.37 1752.61
45 C 284343.45 111242.26 20402.93 7924.82 35996.66 53682.98 10215.79 671.19 264.89 1114.47
45 D 308847.84 113415.99 15813.20 6888.46 11023.78 54146.08 2780.15 350.57 162.35 389.29
45 E 204415.33 198014.93 83721.28 19774.79 16150.38 0.00 14592.65 2540.41 1956.04 0.00
45 F 222641.76 127740.73 17241.17 71345.30 51625.67 8492.06 33284.63 289.25 647.08 0.00
45 G 222671.07 187569.26 68582.50 21473.64 14878.54 12130.02 7732.04 390.59 1580.88 618.95
45 H 188834.77 158435.54 69219.21 50233.57 52916.25 26205.21 11539.70 1464.49 1594.95 2362.79
46 A 222655.84 188544.48 76070.63 18193.49 15077.16 0.00 8092.71 2299.51 1901.05 2190.81
46 C 144791.35 133872.35 44885.36 159793.04 9489.15 16718.96 9266.38 58427.84 998.67 906.72
46 D 275569.78 87405.74 24395.66 47740.34 40144.56 41178.92 13253.22 1120.29 344.45 3418.24
46 E 137114.34 114562.42 60819.14 242211.68 0.00 4846.87 9447.70 25032.58 942.77 501.97
46 F 254479.70 127305.88 20180.41 69034.81 0.00 8425.00 38731.92 2078.85 967.28 0.00
46 H 191954.83 136742.45 97485.75 59380.80 27910.34 38797.54 13199.41 4242.45 1026.92 1627.84
46 X 229335.92 193568.86 65530.11 21946.13 3320.23 10188.98 4667.02 1036.87 1319.05 833.80
46 Y 281432.27 106248.98 46884.20 2730.30 27607.96 70018.24 379.35 39.33 67.54 616.13
46 Z 188159.55 138000.56 112868.50 58021.29 14259.55 45726.97 11465.91 3594.99 1365.82 2431.86
47 B 148989.41 98282.46 24389.65 111704.07 26648.17 82559.15 81331.64 2687.81 2734.23 1058.85
47 C 146522.73 128225.22 12182.48 132383.44 18638.42 13252.46 105782.38 1387.89 1025.78 1060.03
47 D 219510.55 96605.74 10149.18 140496.71 29871.03 45226.81 6000.65 10126.26 206.82 541.05
47 F 229196.09 151169.93 62392.88 41580.67 31991.17 7801.35 12137.42 3071.55 2246.19 1227.67
47 G 184187.52 172607.91 63199.67 81291.89 15616.17 16309.37 5246.26 12179.41 1571.22 4456.58
47 H 204359.32 193123.81 71141.35 27664.96 11003.50 22108.32 5448.74 2345.07 1851.78 4452.21

286
Analysis No.
Run Si Al K Fe Ca Na Mg Ti Ba P
47 i 199243.81 193486.27 62978.99 22228.53 26685.83 23545.35 6094.95 2125.50 1892.96 5808.62
47 J 218125.43 162318.29 43118.69 39229.73 32802.08 33466.31 7607.72 2277.76 759.86 3148.98
48 A 216052.09 197899.86 32796.82 0.00 0.00 0.00 52462.76 0.00 1373.07 0.00
48 B 194441.61 168180.62 39805.59 58262.90 11972.98 14312.83 48300.35 2141.01 477.18 2531.60
48 C 136249.51 108577.48 8818.84 122527.50 40941.76 69356.50 89042.90 2188.12 427.98 1420.77
48 D 203306.85 119966.46 19610.57 88956.82 6870.17 32247.02 69655.50 2314.02 359.89 1142.18
48 E 113401.48 125918.95 16572.21 97154.25 0.00 82293.47 73263.03 34136.55 1328.51 19984.95
48 F 299728.15 122743.50 30618.18 34644.62 0.00 0.00 12578.34 3474.28 1392.61 0.00
48 G 220241.89 137566.94 47294.54 51652.18 52667.68 15533.03 14106.09 3761.05 1164.53 3696.59
48 X 221676.05 177373.92 69176.82 27449.17 26160.62 4053.65 7317.70 851.77 1371.55 2850.92
48 Y 227012.22 157890.32 64270.75 34818.18 24974.99 16450.81 9939.20 2483.79 1099.89 2066.00
48 Z 213213.54 163149.78 72328.68 41603.49 20993.50 17473.06 11575.02 3189.08 1383.43 2973.48
49 A 231417.74 189085.63 64446.15 15901.17 15053.33 0.00 7908.74 2728.06 1609.04 1320.74
49 B 204278.24 188651.73 64129.37 29379.33 16291.55 29418.51 7603.39 2943.36 1730.44 1163.62
49 C 202395.79 212920.71 52948.04 26966.09 18841.35 9134.50 6837.11 4408.19 1704.26 184.57
49 D 210996.55 141565.06 58964.88 41435.38 45948.95 33763.83 15011.37 2342.26 1221.37 2848.56
50 A 308596.11 120789.23 46309.52 5763.24 6068.45 8788.61 9790.72 2584.18 1734.69 252.00
50 B 282571.23 134551.32 26211.26 4890.67 27837.09 39718.40 3226.88 1429.18 300.37 9.20
50 D 220408.02 184317.47 75409.12 24591.68 6134.10 19844.38 4997.84 2298.15 2562.38 506.09
50 E 178676.43 87711.98 69837.91 151256.23 0.00 0.00 68418.34 15367.95 688.06 0.00
51 A 174566.85 103402.10 23688.27 119206.17 15659.31 14428.92 96181.37 551.26 2483.85 3725.01
51 C 285409.53 151226.75 1919.43 5999.23 32099.67 31933.06 579.51 55.35 162.36 469.80
51 D 208810.46 200084.09 78751.32 17708.99 7108.01 19899.87 4279.29 2389.41 1574.44 1359.99
51 E 309797.19 149148.14 7920.51 0.00 0.00 17298.85 6389.12 2587.75 222.21 0.00
52 A 216443.91 210186.91 68399.39 19698.07 0.00 3732.77 5753.65 5365.65 1565.81 66.90
52 B 257148.47 91394.12 15577.57 27670.81 70334.92 49245.58 23188.85 4299.41 1422.60 1416.26
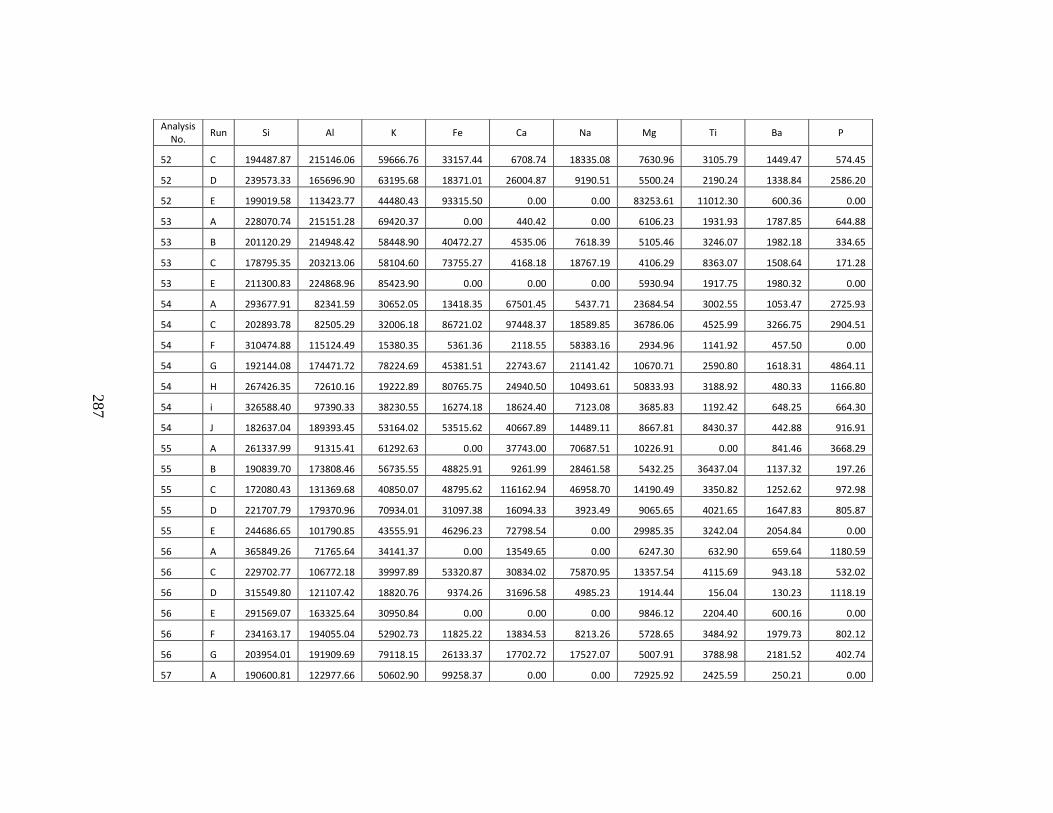
287
Analysis No.
Run Si Al K Fe Ca Na Mg Ti Ba P
52 C 194487.87 215146.06 59666.76 33157.44 6708.74 18335.08 7630.96 3105.79 1449.47 574.45
52 D 239573.33 165696.90 63195.68 18371.01 26004.87 9190.51 5500.24 2190.24 1338.84 2586.20
52 E 199019.58 113423.77 44480.43 93315.50 0.00 0.00 83253.61 11012.30 600.36 0.00
53 A 228070.74 215151.28 69420.37 0.00 440.42 0.00 6106.23 1931.93 1787.85 644.88
53 B 201120.29 214948.42 58448.90 40472.27 4535.06 7618.39 5105.46 3246.07 1982.18 334.65
53 C 178795.35 203213.06 58104.60 73755.27 4168.18 18767.19 4106.29 8363.07 1508.64 171.28
53 E 211300.83 224868.96 85423.90 0.00 0.00 0.00 5930.94 1917.75 1980.32 0.00
54 A 293677.91 82341.59 30652.05 13418.35 67501.45 5437.71 23684.54 3002.55 1053.47 2725.93
54 C 202893.78 82505.29 32006.18 86721.02 97448.37 18589.85 36786.06 4525.99 3266.75 2904.51
54 F 310474.88 115124.49 15380.35 5361.36 2118.55 58383.16 2934.96 1141.92 457.50 0.00
54 G 192144.08 174471.72 78224.69 45381.51 22743.67 21141.42 10670.71 2590.80 1618.31 4864.11
54 H 267426.35 72610.16 19222.89 80765.75 24940.50 10493.61 50833.93 3188.92 480.33 1166.80
54 i 326588.40 97390.33 38230.55 16274.18 18624.40 7123.08 3685.83 1192.42 648.25 664.30
54 J 182637.04 189393.45 53164.02 53515.62 40667.89 14489.11 8667.81 8430.37 442.88 916.91
55 A 261337.99 91315.41 61292.63 0.00 37743.00 70687.51 10226.91 0.00 841.46 3668.29
55 B 190839.70 173808.46 56735.55 48825.91 9261.99 28461.58 5432.25 36437.04 1137.32 197.26
55 C 172080.43 131369.68 40850.07 48795.62 116162.94 46958.70 14190.49 3350.82 1252.62 972.98
55 D 221707.79 179370.96 70934.01 31097.38 16094.33 3923.49 9065.65 4021.65 1647.83 805.87
55 E 244686.65 101790.85 43555.91 46296.23 72798.54 0.00 29985.35 3242.04 2054.84 0.00
56 A 365849.26 71765.64 34141.37 0.00 13549.65 0.00 6247.30 632.90 659.64 1180.59
56 C 229702.77 106772.18 39997.89 53320.87 30834.02 75870.95 13357.54 4115.69 943.18 532.02
56 D 315549.80 121107.42 18820.76 9374.26 31696.58 4985.23 1914.44 156.04 130.23 1118.19
56 E 291569.07 163325.64 30950.84 0.00 0.00 0.00 9846.12 2204.40 600.16 0.00
56 F 234163.17 194055.04 52902.73 11825.22 13834.53 8213.26 5728.65 3484.92 1979.73 802.12
56 G 203954.01 191909.69 79118.15 26133.37 17702.72 17527.07 5007.91 3788.98 2181.52 402.74
57 A 190600.81 122977.66 50602.90 99258.37 0.00 0.00 72925.92 2425.59 250.21 0.00
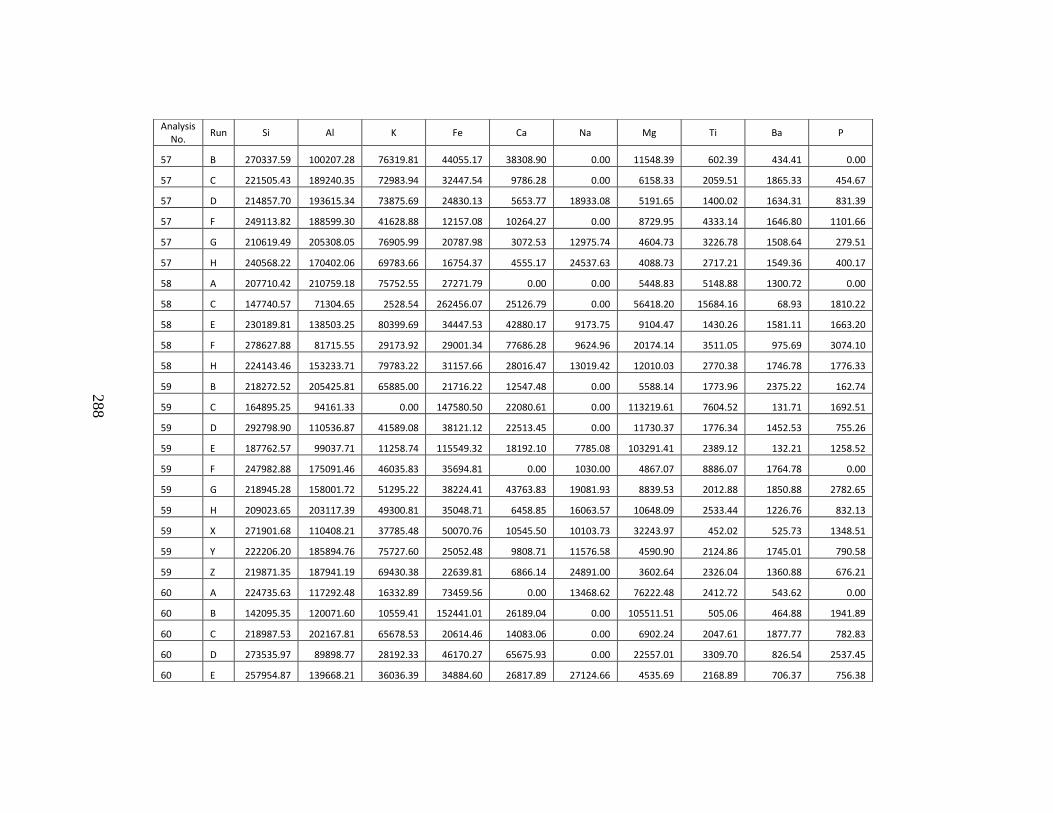
288
Analysis No.
Run Si Al K Fe Ca Na Mg Ti Ba P
57 B 270337.59 100207.28 76319.81 44055.17 38308.90 0.00 11548.39 602.39 434.41 0.00
57 C 221505.43 189240.35 72983.94 32447.54 9786.28 0.00 6158.33 2059.51 1865.33 454.67
57 D 214857.70 193615.34 73875.69 24830.13 5653.77 18933.08 5191.65 1400.02 1634.31 831.39
57 F 249113.82 188599.30 41628.88 12157.08 10264.27 0.00 8729.95 4333.14 1646.80 1101.66
57 G 210619.49 205308.05 76905.99 20787.98 3072.53 12975.74 4604.73 3226.78 1508.64 279.51
57 H 240568.22 170402.06 69783.66 16754.37 4555.17 24537.63 4088.73 2717.21 1549.36 400.17
58 A 207710.42 210759.18 75752.55 27271.79 0.00 0.00 5448.83 5148.88 1300.72 0.00
58 C 147740.57 71304.65 2528.54 262456.07 25126.79 0.00 56418.20 15684.16 68.93 1810.22
58 E 230189.81 138503.25 80399.69 34447.53 42880.17 9173.75 9104.47 1430.26 1581.11 1663.20
58 F 278627.88 81715.55 29173.92 29001.34 77686.28 9624.96 20174.14 3511.05 975.69 3074.10
58 H 224143.46 153233.71 79783.22 31157.66 28016.47 13019.42 12010.03 2770.38 1746.78 1776.33
59 B 218272.52 205425.81 65885.00 21716.22 12547.48 0.00 5588.14 1773.96 2375.22 162.74
59 C 164895.25 94161.33 0.00 147580.50 22080.61 0.00 113219.61 7604.52 131.71 1692.51
59 D 292798.90 110536.87 41589.08 38121.12 22513.45 0.00 11730.37 1776.34 1452.53 755.26
59 E 187762.57 99037.71 11258.74 115549.32 18192.10 7785.08 103291.41 2389.12 132.21 1258.52
59 F 247982.88 175091.46 46035.83 35694.81 0.00 1030.00 4867.07 8886.07 1764.78 0.00
59 G 218945.28 158001.72 51295.22 38224.41 43763.83 19081.93 8839.53 2012.88 1850.88 2782.65
59 H 209023.65 203117.39 49300.81 35048.71 6458.85 16063.57 10648.09 2533.44 1226.76 832.13
59 X 271901.68 110408.21 37785.48 50070.76 10545.50 10103.73 32243.97 452.02 525.73 1348.51
59 Y 222206.20 185894.76 75727.60 25052.48 9808.71 11576.58 4590.90 2124.86 1745.01 790.58
59 Z 219871.35 187941.19 69430.38 22639.81 6866.14 24891.00 3602.64 2326.04 1360.88 676.21
60 A 224735.63 117292.48 16332.89 73459.56 0.00 13468.62 76222.48 2412.72 543.62 0.00
60 B 142095.35 120071.60 10559.41 152441.01 26189.04 0.00 105511.51 505.06 464.88 1941.89
60 C 218987.53 202167.81 65678.53 20614.46 14083.06 0.00 6902.24 2047.61 1877.77 782.83
60 D 273535.97 89898.77 28192.33 46170.27 65675.93 0.00 22557.01 3309.70 826.54 2537.45
60 E 257954.87 139668.21 36036.39 34884.60 26817.89 27124.66 4535.69 2168.89 706.37 756.38
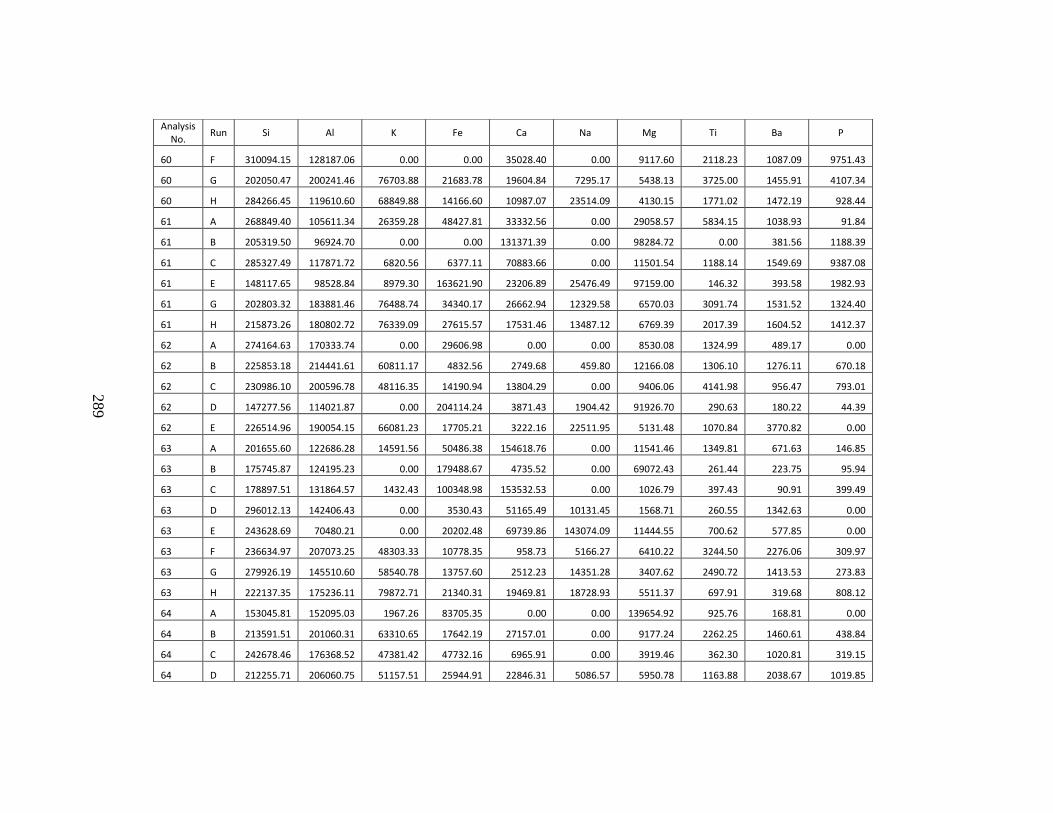
289
Analysis No.
Run Si Al K Fe Ca Na Mg Ti Ba P
60 F 310094.15 128187.06 0.00 0.00 35028.40 0.00 9117.60 2118.23 1087.09 9751.43
60 G 202050.47 200241.46 76703.88 21683.78 19604.84 7295.17 5438.13 3725.00 1455.91 4107.34
60 H 284266.45 119610.60 68849.88 14166.60 10987.07 23514.09 4130.15 1771.02 1472.19 928.44
61 A 268849.40 105611.34 26359.28 48427.81 33332.56 0.00 29058.57 5834.15 1038.93 91.84
61 B 205319.50 96924.70 0.00 0.00 131371.39 0.00 98284.72 0.00 381.56 1188.39
61 C 285327.49 117871.72 6820.56 6377.11 70883.66 0.00 11501.54 1188.14 1549.69 9387.08
61 E 148117.65 98528.84 8979.30 163621.90 23206.89 25476.49 97159.00 146.32 393.58 1982.93
61 G 202803.32 183881.46 76488.74 34340.17 26662.94 12329.58 6570.03 3091.74 1531.52 1324.40
61 H 215873.26 180802.72 76339.09 27615.57 17531.46 13487.12 6769.39 2017.39 1604.52 1412.37
62 A 274164.63 170333.74 0.00 29606.98 0.00 0.00 8530.08 1324.99 489.17 0.00
62 B 225853.18 214441.61 60811.17 4832.56 2749.68 459.80 12166.08 1306.10 1276.11 670.18
62 C 230986.10 200596.78 48116.35 14190.94 13804.29 0.00 9406.06 4141.98 956.47 793.01
62 D 147277.56 114021.87 0.00 204114.24 3871.43 1904.42 91926.70 290.63 180.22 44.39
62 E 226514.96 190054.15 66081.23 17705.21 3222.16 22511.95 5131.48 1070.84 3770.82 0.00
63 A 201655.60 122686.28 14591.56 50486.38 154618.76 0.00 11541.46 1349.81 671.63 146.85
63 B 175745.87 124195.23 0.00 179488.67 4735.52 0.00 69072.43 261.44 223.75 95.94
63 C 178897.51 131864.57 1432.43 100348.98 153532.53 0.00 1026.79 397.43 90.91 399.49
63 D 296012.13 142406.43 0.00 3530.43 51165.49 10131.45 1568.71 260.55 1342.63 0.00
63 E 243628.69 70480.21 0.00 20202.48 69739.86 143074.09 11444.55 700.62 577.85 0.00
63 F 236634.97 207073.25 48303.33 10778.35 958.73 5166.27 6410.22 3244.50 2276.06 309.97
63 G 279926.19 145510.60 58540.78 13757.60 2512.23 14351.28 3407.62 2490.72 1413.53 273.83
63 H 222137.35 175236.11 79872.71 21340.31 19469.81 18728.93 5511.37 697.91 319.68 808.12
64 A 153045.81 152095.03 1967.26 83705.35 0.00 0.00 139654.92 925.76 168.81 0.00
64 B 213591.51 201060.31 63310.65 17642.19 27157.01 0.00 9177.24 2262.25 1460.61 438.84
64 C 242678.46 176368.52 47381.42 47732.16 6965.91 0.00 3919.46 362.30 1020.81 319.15
64 D 212255.71 206060.75 51157.51 25944.91 22846.31 5086.57 5950.78 1163.88 2038.67 1019.85
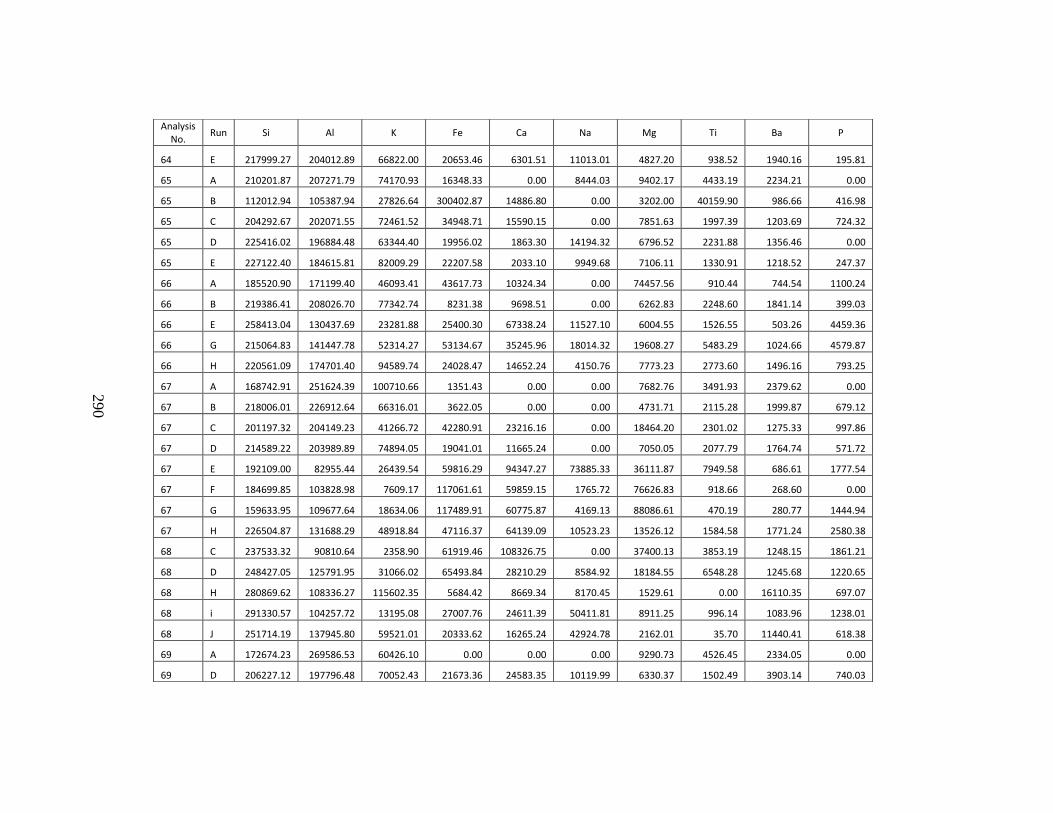
290
Analysis No.
Run Si Al K Fe Ca Na Mg Ti Ba P
64 E 217999.27 204012.89 66822.00 20653.46 6301.51 11013.01 4827.20 938.52 1940.16 195.81
65 A 210201.87 207271.79 74170.93 16348.33 0.00 8444.03 9402.17 4433.19 2234.21 0.00
65 B 112012.94 105387.94 27826.64 300402.87 14886.80 0.00 3202.00 40159.90 986.66 416.98
65 C 204292.67 202071.55 72461.52 34948.71 15590.15 0.00 7851.63 1997.39 1203.69 724.32
65 D 225416.02 196884.48 63344.40 19956.02 1863.30 14194.32 6796.52 2231.88 1356.46 0.00
65 E 227122.40 184615.81 82009.29 22207.58 2033.10 9949.68 7106.11 1330.91 1218.52 247.37
66 A 185520.90 171199.40 46093.41 43617.73 10324.34 0.00 74457.56 910.44 744.54 1100.24
66 B 219386.41 208026.70 77342.74 8231.38 9698.51 0.00 6262.83 2248.60 1841.14 399.03
66 E 258413.04 130437.69 23281.88 25400.30 67338.24 11527.10 6004.55 1526.55 503.26 4459.36
66 G 215064.83 141447.78 52314.27 53134.67 35245.96 18014.32 19608.27 5483.29 1024.66 4579.87
66 H 220561.09 174701.40 94589.74 24028.47 14652.24 4150.76 7773.23 2773.60 1496.16 793.25
67 A 168742.91 251624.39 100710.66 1351.43 0.00 0.00 7682.76 3491.93 2379.62 0.00
67 B 218006.01 226912.64 66316.01 3622.05 0.00 0.00 4731.71 2115.28 1999.87 679.12
67 C 201197.32 204149.23 41266.72 42280.91 23216.16 0.00 18464.20 2301.02 1275.33 997.86
67 D 214589.22 203989.89 74894.05 19041.01 11665.24 0.00 7050.05 2077.79 1764.74 571.72
67 E 192109.00 82955.44 26439.54 59816.29 94347.27 73885.33 36111.87 7949.58 686.61 1777.54
67 F 184699.85 103828.98 7609.17 117061.61 59859.15 1765.72 76626.83 918.66 268.60 0.00
67 G 159633.95 109677.64 18634.06 117489.91 60775.87 4169.13 88086.61 470.19 280.77 1444.94
67 H 226504.87 131688.29 48918.84 47116.37 64139.09 10523.23 13526.12 1584.58 1771.24 2580.38
68 C 237533.32 90810.64 2358.90 61919.46 108326.75 0.00 37400.13 3853.19 1248.15 1861.21
68 D 248427.05 125791.95 31066.02 65493.84 28210.29 8584.92 18184.55 6548.28 1245.68 1220.65
68 H 280869.62 108336.27 115602.35 5684.42 8669.34 8170.45 1529.61 0.00 16110.35 697.07
68 i 291330.57 104257.72 13195.08 27007.76 24611.39 50411.81 8911.25 996.14 1083.96 1238.01
68 J 251714.19 137945.80 59521.01 20333.62 16265.24 42924.78 2162.01 35.70 11440.41 618.38
69 A 172674.23 269586.53 60426.10 0.00 0.00 0.00 9290.73 4526.45 2334.05 0.00
69 D 206227.12 197796.48 70052.43 21673.36 24583.35 10119.99 6330.37 1502.49 3903.14 740.03
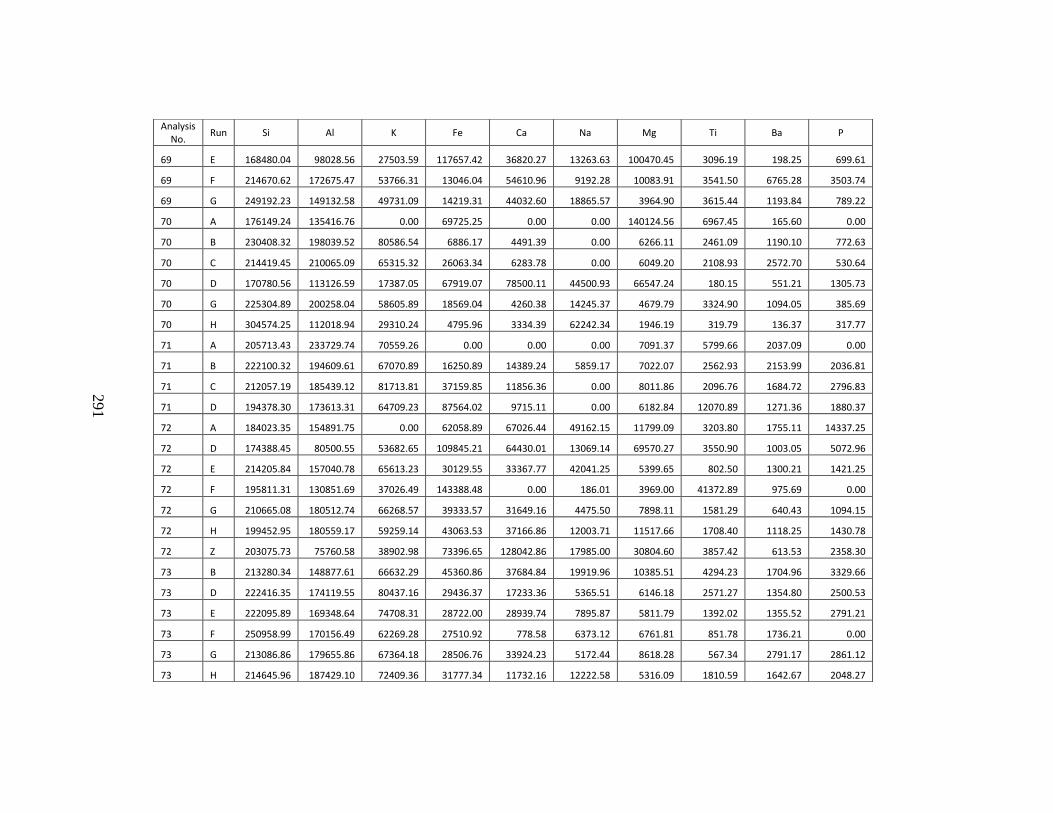
291
Analysis No.
Run Si Al K Fe Ca Na Mg Ti Ba P
69 E 168480.04 98028.56 27503.59 117657.42 36820.27 13263.63 100470.45 3096.19 198.25 699.61
69 F 214670.62 172675.47 53766.31 13046.04 54610.96 9192.28 10083.91 3541.50 6765.28 3503.74
69 G 249192.23 149132.58 49731.09 14219.31 44032.60 18865.57 3964.90 3615.44 1193.84 789.22
70 A 176149.24 135416.76 0.00 69725.25 0.00 0.00 140124.56 6967.45 165.60 0.00
70 B 230408.32 198039.52 80586.54 6886.17 4491.39 0.00 6266.11 2461.09 1190.10 772.63
70 C 214419.45 210065.09 65315.32 26063.34 6283.78 0.00 6049.20 2108.93 2572.70 530.64
70 D 170780.56 113126.59 17387.05 67919.07 78500.11 44500.93 66547.24 180.15 551.21 1305.73
70 G 225304.89 200258.04 58605.89 18569.04 4260.38 14245.37 4679.79 3324.90 1094.05 385.69
70 H 304574.25 112018.94 29310.24 4795.96 3334.39 62242.34 1946.19 319.79 136.37 317.77
71 A 205713.43 233729.74 70559.26 0.00 0.00 0.00 7091.37 5799.66 2037.09 0.00
71 B 222100.32 194609.61 67070.89 16250.89 14389.24 5859.17 7022.07 2562.93 2153.99 2036.81
71 C 212057.19 185439.12 81713.81 37159.85 11856.36 0.00 8011.86 2096.76 1684.72 2796.83
71 D 194378.30 173613.31 64709.23 87564.02 9715.11 0.00 6182.84 12070.89 1271.36 1880.37
72 A 184023.35 154891.75 0.00 62058.89 67026.44 49162.15 11799.09 3203.80 1755.11 14337.25
72 D 174388.45 80500.55 53682.65 109845.21 64430.01 13069.14 69570.27 3550.90 1003.05 5072.96
72 E 214205.84 157040.78 65613.23 30129.55 33367.77 42041.25 5399.65 802.50 1300.21 1421.25
72 F 195811.31 130851.69 37026.49 143388.48 0.00 186.01 3969.00 41372.89 975.69 0.00
72 G 210665.08 180512.74 66268.57 39333.57 31649.16 4475.50 7898.11 1581.29 640.43 1094.15
72 H 199452.95 180559.17 59259.14 43063.53 37166.86 12003.71 11517.66 1708.40 1118.25 1430.78
72 Z 203075.73 75760.58 38902.98 73396.65 128042.86 17985.00 30804.60 3857.42 613.53 2358.30
73 B 213280.34 148877.61 66632.29 45360.86 37684.84 19919.96 10385.51 4294.23 1704.96 3329.66
73 D 222416.35 174119.55 80437.16 29436.37 17233.36 5365.51 6146.18 2571.27 1354.80 2500.53
73 E 222095.89 169348.64 74708.31 28722.00 28939.74 7895.87 5811.79 1392.02 1355.52 2791.21
73 F 250958.99 170156.49 62269.28 27510.92 778.58 6373.12 6761.81 851.78 1736.21 0.00
73 G 213086.86 179655.86 67364.18 28506.76 33924.23 5172.44 8618.28 567.34 2791.17 2861.12
73 H 214645.96 187429.10 72409.36 31777.34 11732.16 12222.58 5316.09 1810.59 1642.67 2048.27
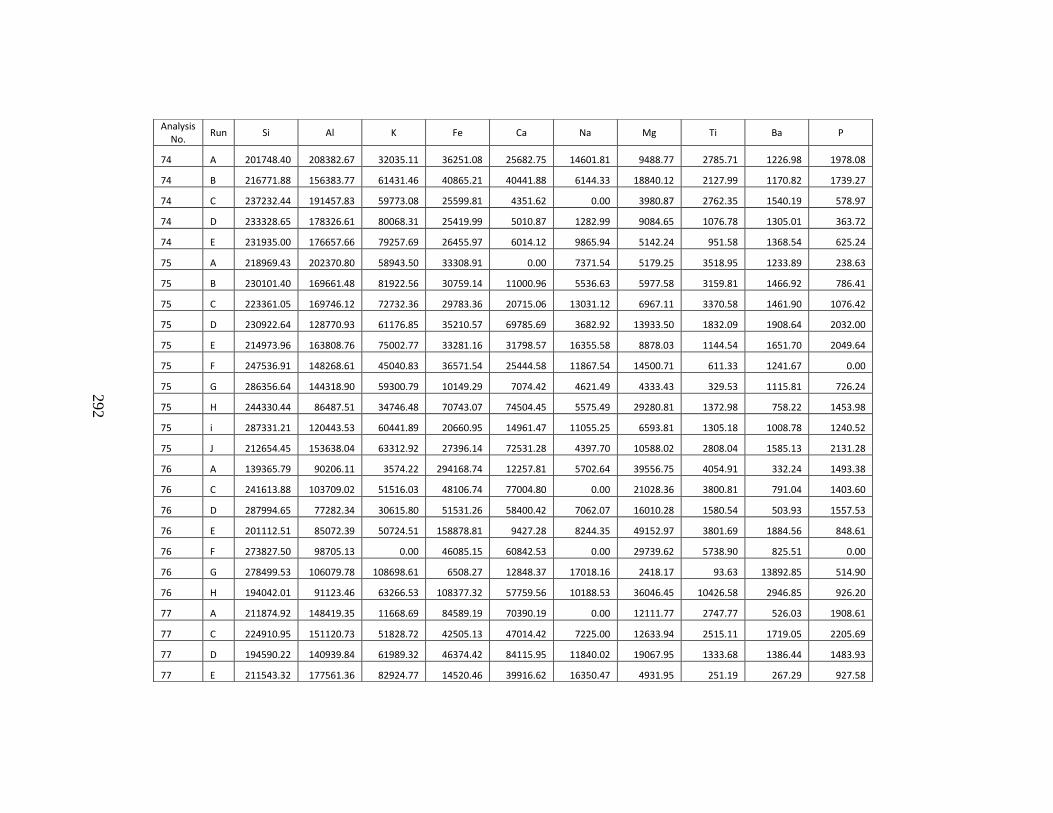
292
Analysis No.
Run Si Al K Fe Ca Na Mg Ti Ba P
74 A 201748.40 208382.67 32035.11 36251.08 25682.75 14601.81 9488.77 2785.71 1226.98 1978.08
74 B 216771.88 156383.77 61431.46 40865.21 40441.88 6144.33 18840.12 2127.99 1170.82 1739.27
74 C 237232.44 191457.83 59773.08 25599.81 4351.62 0.00 3980.87 2762.35 1540.19 578.97
74 D 233328.65 178326.61 80068.31 25419.99 5010.87 1282.99 9084.65 1076.78 1305.01 363.72
74 E 231935.00 176657.66 79257.69 26455.97 6014.12 9865.94 5142.24 951.58 1368.54 625.24
75 A 218969.43 202370.80 58943.50 33308.91 0.00 7371.54 5179.25 3518.95 1233.89 238.63
75 B 230101.40 169661.48 81922.56 30759.14 11000.96 5536.63 5977.58 3159.81 1466.92 786.41
75 C 223361.05 169746.12 72732.36 29783.36 20715.06 13031.12 6967.11 3370.58 1461.90 1076.42
75 D 230922.64 128770.93 61176.85 35210.57 69785.69 3682.92 13933.50 1832.09 1908.64 2032.00
75 E 214973.96 163808.76 75002.77 33281.16 31798.57 16355.58 8878.03 1144.54 1651.70 2049.64
75 F 247536.91 148268.61 45040.83 36571.54 25444.58 11867.54 14500.71 611.33 1241.67 0.00
75 G 286356.64 144318.90 59300.79 10149.29 7074.42 4621.49 4333.43 329.53 1115.81 726.24
75 H 244330.44 86487.51 34746.48 70743.07 74504.45 5575.49 29280.81 1372.98 758.22 1453.98
75 i 287331.21 120443.53 60441.89 20660.95 14961.47 11055.25 6593.81 1305.18 1008.78 1240.52
75 J 212654.45 153638.04 63312.92 27396.14 72531.28 4397.70 10588.02 2808.04 1585.13 2131.28
76 A 139365.79 90206.11 3574.22 294168.74 12257.81 5702.64 39556.75 4054.91 332.24 1493.38
76 C 241613.88 103709.02 51516.03 48106.74 77004.80 0.00 21028.36 3800.81 791.04 1403.60
76 D 287994.65 77282.34 30615.80 51531.26 58400.42 7062.07 16010.28 1580.54 503.93 1557.53
76 E 201112.51 85072.39 50724.51 158878.81 9427.28 8244.35 49152.97 3801.69 1884.56 848.61
76 F 273827.50 98705.13 0.00 46085.15 60842.53 0.00 29739.62 5738.90 825.51 0.00
76 G 278499.53 106079.78 108698.61 6508.27 12848.37 17018.16 2418.17 93.63 13892.85 514.90
76 H 194042.01 91123.46 63266.53 108377.32 57759.56 10188.53 36046.45 10426.58 2946.85 926.20
77 A 211874.92 148419.35 11668.69 84589.19 70390.19 0.00 12111.77 2747.77 526.03 1908.61
77 C 224910.95 151120.73 51828.72 42505.13 47014.42 7225.00 12633.94 2515.11 1719.05 2205.69
77 D 194590.22 140939.84 61989.32 46374.42 84115.95 11840.02 19067.95 1333.68 1386.44 1483.93
77 E 211543.32 177561.36 82924.77 14520.46 39916.62 16350.47 4931.95 251.19 267.29 927.58
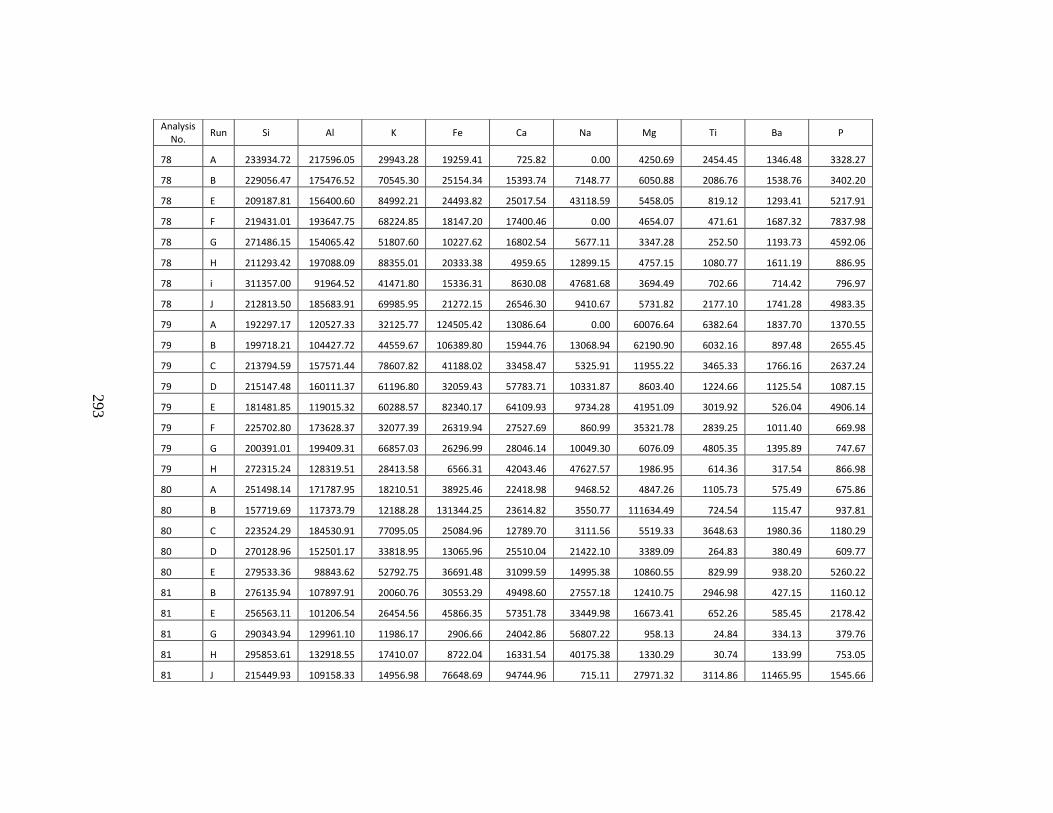
293
Analysis No.
Run Si Al K Fe Ca Na Mg Ti Ba P
78 A 233934.72 217596.05 29943.28 19259.41 725.82 0.00 4250.69 2454.45 1346.48 3328.27
78 B 229056.47 175476.52 70545.30 25154.34 15393.74 7148.77 6050.88 2086.76 1538.76 3402.20
78 E 209187.81 156400.60 84992.21 24493.82 25017.54 43118.59 5458.05 819.12 1293.41 5217.91
78 F 219431.01 193647.75 68224.85 18147.20 17400.46 0.00 4654.07 471.61 1687.32 7837.98
78 G 271486.15 154065.42 51807.60 10227.62 16802.54 5677.11 3347.28 252.50 1193.73 4592.06
78 H 211293.42 197088.09 88355.01 20333.38 4959.65 12899.15 4757.15 1080.77 1611.19 886.95
78 i 311357.00 91964.52 41471.80 15336.31 8630.08 47681.68 3694.49 702.66 714.42 796.97
78 J 212813.50 185683.91 69985.95 21272.15 26546.30 9410.67 5731.82 2177.10 1741.28 4983.35
79 A 192297.17 120527.33 32125.77 124505.42 13086.64 0.00 60076.64 6382.64 1837.70 1370.55
79 B 199718.21 104427.72 44559.67 106389.80 15944.76 13068.94 62190.90 6032.16 897.48 2655.45
79 C 213794.59 157571.44 78607.82 41188.02 33458.47 5325.91 11955.22 3465.33 1766.16 2637.24
79 D 215147.48 160111.37 61196.80 32059.43 57783.71 10331.87 8603.40 1224.66 1125.54 1087.15
79 E 181481.85 119015.32 60288.57 82340.17 64109.93 9734.28 41951.09 3019.92 526.04 4906.14
79 F 225702.80 173628.37 32077.39 26319.94 27527.69 860.99 35321.78 2839.25 1011.40 669.98
79 G 200391.01 199409.31 66857.03 26296.99 28046.14 10049.30 6076.09 4805.35 1395.89 747.67
79 H 272315.24 128319.51 28413.58 6566.31 42043.46 47627.57 1986.95 614.36 317.54 866.98
80 A 251498.14 171787.95 18210.51 38925.46 22418.98 9468.52 4847.26 1105.73 575.49 675.86
80 B 157719.69 117373.79 12188.28 131344.25 23614.82 3550.77 111634.49 724.54 115.47 937.81
80 C 223524.29 184530.91 77095.05 25084.96 12789.70 3111.56 5519.33 3648.63 1980.36 1180.29
80 D 270128.96 152501.17 33818.95 13065.96 25510.04 21422.10 3389.09 264.83 380.49 609.77
80 E 279533.36 98843.62 52792.75 36691.48 31099.59 14995.38 10860.55 829.99 938.20 5260.22
81 B 276135.94 107897.91 20060.76 30553.29 49498.60 27557.18 12410.75 2946.98 427.15 1160.12
81 E 256563.11 101206.54 26454.56 45866.35 57351.78 33449.98 16673.41 652.26 585.45 2178.42
81 G 290343.94 129961.10 11986.17 2906.66 24042.86 56807.22 958.13 24.84 334.13 379.76
81 H 295853.61 132918.55 17410.07 8722.04 16331.54 40175.38 1330.29 30.74 133.99 753.05
81 J 215449.93 109158.33 14956.98 76648.69 94744.96 715.11 27971.32 3114.86 11465.95 1545.66
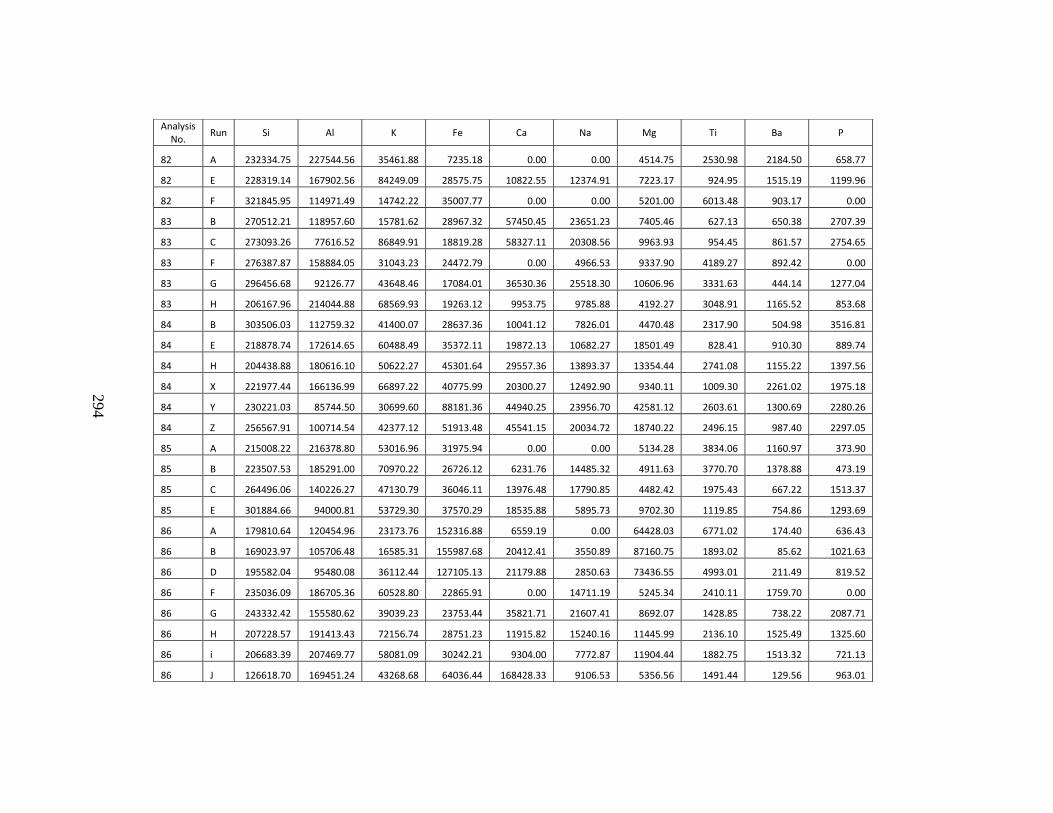
294
Analysis No.
Run Si Al K Fe Ca Na Mg Ti Ba P
82 A 232334.75 227544.56 35461.88 7235.18 0.00 0.00 4514.75 2530.98 2184.50 658.77
82 E 228319.14 167902.56 84249.09 28575.75 10822.55 12374.91 7223.17 924.95 1515.19 1199.96
82 F 321845.95 114971.49 14742.22 35007.77 0.00 0.00 5201.00 6013.48 903.17 0.00
83 B 270512.21 118957.60 15781.62 28967.32 57450.45 23651.23 7405.46 627.13 650.38 2707.39
83 C 273093.26 77616.52 86849.91 18819.28 58327.11 20308.56 9963.93 954.45 861.57 2754.65
83 F 276387.87 158884.05 31043.23 24472.79 0.00 4966.53 9337.90 4189.27 892.42 0.00
83 G 296456.68 92126.77 43648.46 17084.01 36530.36 25518.30 10606.96 3331.63 444.14 1277.04
83 H 206167.96 214044.88 68569.93 19263.12 9953.75 9785.88 4192.27 3048.91 1165.52 853.68
84 B 303506.03 112759.32 41400.07 28637.36 10041.12 7826.01 4470.48 2317.90 504.98 3516.81
84 E 218878.74 172614.65 60488.49 35372.11 19872.13 10682.27 18501.49 828.41 910.30 889.74
84 H 204438.88 180616.10 50622.27 45301.64 29557.36 13893.37 13354.44 2741.08 1155.22 1397.56
84 X 221977.44 166136.99 66897.22 40775.99 20300.27 12492.90 9340.11 1009.30 2261.02 1975.18
84 Y 230221.03 85744.50 30699.60 88181.36 44940.25 23956.70 42581.12 2603.61 1300.69 2280.26
84 Z 256567.91 100714.54 42377.12 51913.48 45541.15 20034.72 18740.22 2496.15 987.40 2297.05
85 A 215008.22 216378.80 53016.96 31975.94 0.00 0.00 5134.28 3834.06 1160.97 373.90
85 B 223507.53 185291.00 70970.22 26726.12 6231.76 14485.32 4911.63 3770.70 1378.88 473.19
85 C 264496.06 140226.27 47130.79 36046.11 13976.48 17790.85 4482.42 1975.43 667.22 1513.37
85 E 301884.66 94000.81 53729.30 37570.29 18535.88 5895.73 9702.30 1119.85 754.86 1293.69
86 A 179810.64 120454.96 23173.76 152316.88 6559.19 0.00 64428.03 6771.02 174.40 636.43
86 B 169023.97 105706.48 16585.31 155987.68 20412.41 3550.89 87160.75 1893.02 85.62 1021.63
86 D 195582.04 95480.08 36112.44 127105.13 21179.88 2850.63 73436.55 4993.01 211.49 819.52
86 F 235036.09 186705.36 60528.80 22865.91 0.00 14711.19 5245.34 2410.11 1759.70 0.00
86 G 243332.42 155580.62 39039.23 23753.44 35821.71 21607.41 8692.07 1428.85 738.22 2087.71
86 H 207228.57 191413.43 72156.74 28751.23 11915.82 15240.16 11445.99 2136.10 1525.49 1325.60
86 i 206683.39 207469.77 58081.09 30242.21 9304.00 7772.87 11904.44 1882.75 1513.32 721.13
86 J 126618.70 169451.24 43268.68 64036.44 168428.33 9106.53 5356.56 1491.44 129.56 963.01
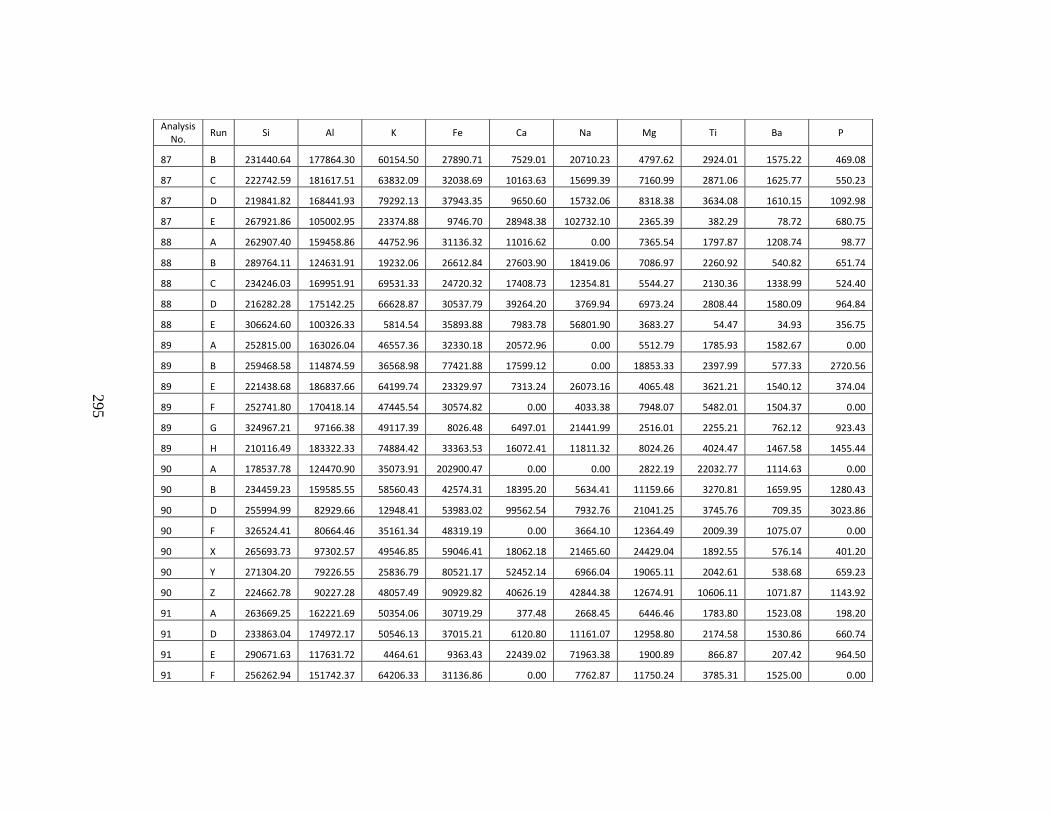
295
Analysis No.
Run Si Al K Fe Ca Na Mg Ti Ba P
87 B 231440.64 177864.30 60154.50 27890.71 7529.01 20710.23 4797.62 2924.01 1575.22 469.08
87 C 222742.59 181617.51 63832.09 32038.69 10163.63 15699.39 7160.99 2871.06 1625.77 550.23
87 D 219841.82 168441.93 79292.13 37943.35 9650.60 15732.06 8318.38 3634.08 1610.15 1092.98
87 E 267921.86 105002.95 23374.88 9746.70 28948.38 102732.10 2365.39 382.29 78.72 680.75
88 A 262907.40 159458.86 44752.96 31136.32 11016.62 0.00 7365.54 1797.87 1208.74 98.77
88 B 289764.11 124631.91 19232.06 26612.84 27603.90 18419.06 7086.97 2260.92 540.82 651.74
88 C 234246.03 169951.91 69531.33 24720.32 17408.73 12354.81 5544.27 2130.36 1338.99 524.40
88 D 216282.28 175142.25 66628.87 30537.79 39264.20 3769.94 6973.24 2808.44 1580.09 964.84
88 E 306624.60 100326.33 5814.54 35893.88 7983.78 56801.90 3683.27 54.47 34.93 356.75
89 A 252815.00 163026.04 46557.36 32330.18 20572.96 0.00 5512.79 1785.93 1582.67 0.00
89 B 259468.58 114874.59 36568.98 77421.88 17599.12 0.00 18853.33 2397.99 577.33 2720.56
89 E 221438.68 186837.66 64199.74 23329.97 7313.24 26073.16 4065.48 3621.21 1540.12 374.04
89 F 252741.80 170418.14 47445.54 30574.82 0.00 4033.38 7948.07 5482.01 1504.37 0.00
89 G 324967.21 97166.38 49117.39 8026.48 6497.01 21441.99 2516.01 2255.21 762.12 923.43
89 H 210116.49 183322.33 74884.42 33363.53 16072.41 11811.32 8024.26 4024.47 1467.58 1455.44
90 A 178537.78 124470.90 35073.91 202900.47 0.00 0.00 2822.19 22032.77 1114.63 0.00
90 B 234459.23 159585.55 58560.43 42574.31 18395.20 5634.41 11159.66 3270.81 1659.95 1280.43
90 D 255994.99 82929.66 12948.41 53983.02 99562.54 7932.76 21041.25 3745.76 709.35 3023.86
90 F 326524.41 80664.46 35161.34 48319.19 0.00 3664.10 12364.49 2009.39 1075.07 0.00
90 X 265693.73 97302.57 49546.85 59046.41 18062.18 21465.60 24429.04 1892.55 576.14 401.20
90 Y 271304.20 79226.55 25836.79 80521.17 52452.14 6966.04 19065.11 2042.61 538.68 659.23
90 Z 224662.78 90227.28 48057.49 90929.82 40626.19 42844.38 12674.91 10606.11 1071.87 1143.92
91 A 263669.25 162221.69 50354.06 30719.29 377.48 2668.45 6446.46 1783.80 1523.08 198.20
91 D 233863.04 174972.17 50546.13 37015.21 6120.80 11161.07 12958.80 2174.58 1530.86 660.74
91 E 290671.63 117631.72 4464.61 9363.43 22439.02 71963.38 1900.89 866.87 207.42 964.50
91 F 256262.94 151742.37 64206.33 31136.86 0.00 7762.87 11750.24 3785.31 1525.00 0.00
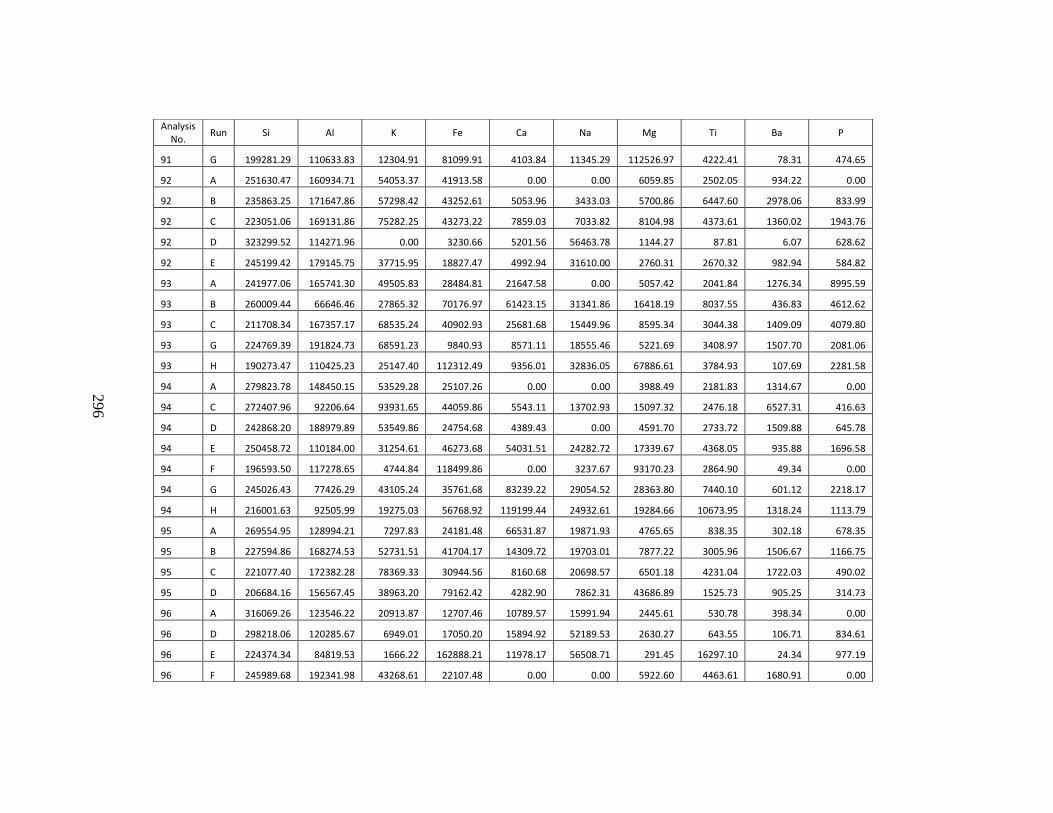
296
Analysis No.
Run Si Al K Fe Ca Na Mg Ti Ba P
91 G 199281.29 110633.83 12304.91 81099.91 4103.84 11345.29 112526.97 4222.41 78.31 474.65
92 A 251630.47 160934.71 54053.37 41913.58 0.00 0.00 6059.85 2502.05 934.22 0.00
92 B 235863.25 171647.86 57298.42 43252.61 5053.96 3433.03 5700.86 6447.60 2978.06 833.99
92 C 223051.06 169131.86 75282.25 43273.22 7859.03 7033.82 8104.98 4373.61 1360.02 1943.76
92 D 323299.52 114271.96 0.00 3230.66 5201.56 56463.78 1144.27 87.81 6.07 628.62
92 E 245199.42 179145.75 37715.95 18827.47 4992.94 31610.00 2760.31 2670.32 982.94 584.82
93 A 241977.06 165741.30 49505.83 28484.81 21647.58 0.00 5057.42 2041.84 1276.34 8995.59
93 B 260009.44 66646.46 27865.32 70176.97 61423.15 31341.86 16418.19 8037.55 436.83 4612.62
93 C 211708.34 167357.17 68535.24 40902.93 25681.68 15449.96 8595.34 3044.38 1409.09 4079.80
93 G 224769.39 191824.73 68591.23 9840.93 8571.11 18555.46 5221.69 3408.97 1507.70 2081.06
93 H 190273.47 110425.23 25147.40 112312.49 9356.01 32836.05 67886.61 3784.93 107.69 2281.58
94 A 279823.78 148450.15 53529.28 25107.26 0.00 0.00 3988.49 2181.83 1314.67 0.00
94 C 272407.96 92206.64 93931.65 44059.86 5543.11 13702.93 15097.32 2476.18 6527.31 416.63
94 D 242868.20 188979.89 53549.86 24754.68 4389.43 0.00 4591.70 2733.72 1509.88 645.78
94 E 250458.72 110184.00 31254.61 46273.68 54031.51 24282.72 17339.67 4368.05 935.88 1696.58
94 F 196593.50 117278.65 4744.84 118499.86 0.00 3237.67 93170.23 2864.90 49.34 0.00
94 G 245026.43 77426.29 43105.24 35761.68 83239.22 29054.52 28363.80 7440.10 601.12 2218.17
94 H 216001.63 92505.99 19275.03 56768.92 119199.44 24932.61 19284.66 10673.95 1318.24 1113.79
95 A 269554.95 128994.21 7297.83 24181.48 66531.87 19871.93 4765.65 838.35 302.18 678.35
95 B 227594.86 168274.53 52731.51 41704.17 14309.72 19703.01 7877.22 3005.96 1506.67 1166.75
95 C 221077.40 172382.28 78369.33 30944.56 8160.68 20698.57 6501.18 4231.04 1722.03 490.02
95 D 206684.16 156567.45 38963.20 79162.42 4282.90 7862.31 43686.89 1525.73 905.25 314.73
96 A 316069.26 123546.22 20913.87 12707.46 10789.57 15991.94 2445.61 530.78 398.34 0.00
96 D 298218.06 120285.67 6949.01 17050.20 15894.92 52189.53 2630.27 643.55 106.71 834.61
96 E 224374.34 84819.53 1666.22 162888.21 11978.17 56508.71 291.45 16297.10 24.34 977.19
96 F 245989.68 192341.98 43268.61 22107.48 0.00 0.00 5922.60 4463.61 1680.91 0.00
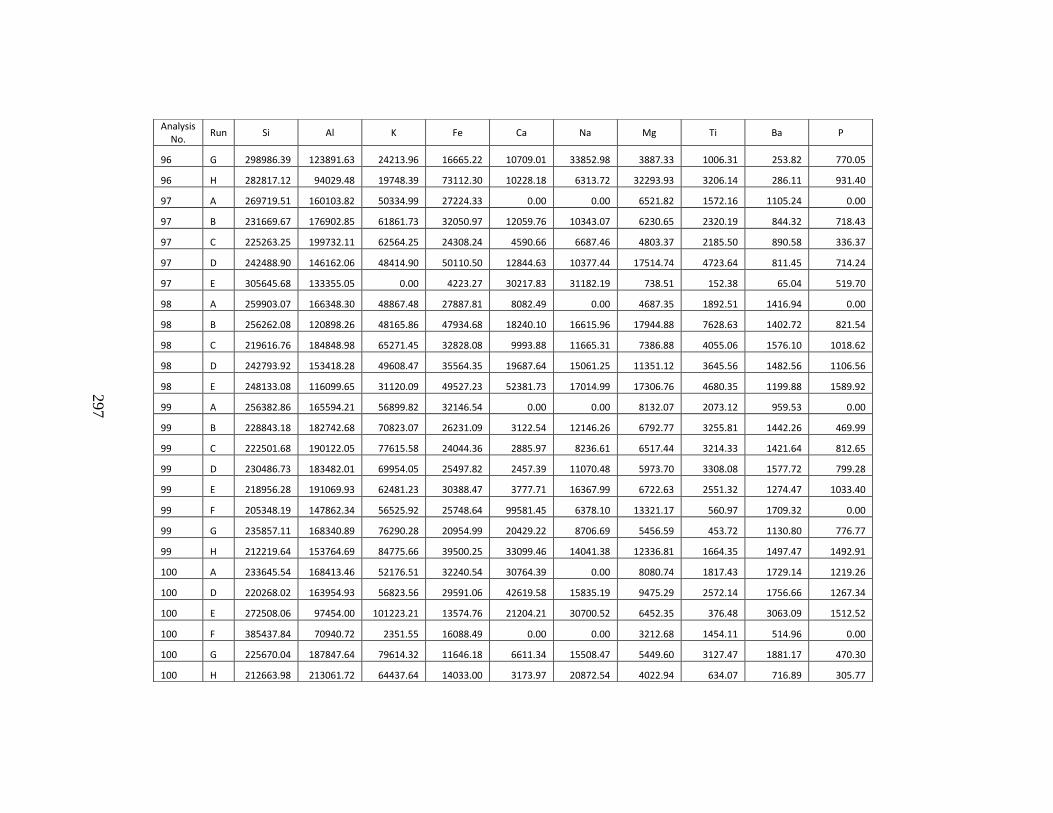
297
Analysis No.
Run Si Al K Fe Ca Na Mg Ti Ba P
96 G 298986.39 123891.63 24213.96 16665.22 10709.01 33852.98 3887.33 1006.31 253.82 770.05
96 H 282817.12 94029.48 19748.39 73112.30 10228.18 6313.72 32293.93 3206.14 286.11 931.40
97 A 269719.51 160103.82 50334.99 27224.33 0.00 0.00 6521.82 1572.16 1105.24 0.00
97 B 231669.67 176902.85 61861.73 32050.97 12059.76 10343.07 6230.65 2320.19 844.32 718.43
97 C 225263.25 199732.11 62564.25 24308.24 4590.66 6687.46 4803.37 2185.50 890.58 336.37
97 D 242488.90 146162.06 48414.90 50110.50 12844.63 10377.44 17514.74 4723.64 811.45 714.24
97 E 305645.68 133355.05 0.00 4223.27 30217.83 31182.19 738.51 152.38 65.04 519.70
98 A 259903.07 166348.30 48867.48 27887.81 8082.49 0.00 4687.35 1892.51 1416.94 0.00
98 B 256262.08 120898.26 48165.86 47934.68 18240.10 16615.96 17944.88 7628.63 1402.72 821.54
98 C 219616.76 184848.98 65271.45 32828.08 9993.88 11665.31 7386.88 4055.06 1576.10 1018.62
98 D 242793.92 153418.28 49608.47 35564.35 19687.64 15061.25 11351.12 3645.56 1482.56 1106.56
98 E 248133.08 116099.65 31120.09 49527.23 52381.73 17014.99 17306.76 4680.35 1199.88 1589.92
99 A 256382.86 165594.21 56899.82 32146.54 0.00 0.00 8132.07 2073.12 959.53 0.00
99 B 228843.18 182742.68 70823.07 26231.09 3122.54 12146.26 6792.77 3255.81 1442.26 469.99
99 C 222501.68 190122.05 77615.58 24044.36 2885.97 8236.61 6517.44 3214.33 1421.64 812.65
99 D 230486.73 183482.01 69954.05 25497.82 2457.39 11070.48 5973.70 3308.08 1577.72 799.28
99 E 218956.28 191069.93 62481.23 30388.47 3777.71 16367.99 6722.63 2551.32 1274.47 1033.40
99 F 205348.19 147862.34 56525.92 25748.64 99581.45 6378.10 13321.17 560.97 1709.32 0.00
99 G 235857.11 168340.89 76290.28 20954.99 20429.22 8706.69 5456.59 453.72 1130.80 776.77
99 H 212219.64 153764.69 84775.66 39500.25 33099.46 14041.38 12336.81 1664.35 1497.47 1492.91
100 A 233645.54 168413.46 52176.51 32240.54 30764.39 0.00 8080.74 1817.43 1729.14 1219.26
100 D 220268.02 163954.93 56823.56 29591.06 42619.58 15835.19 9475.29 2572.14 1756.66 1267.34
100 E 272508.06 97454.00 101223.21 13574.76 21204.21 30700.52 6452.35 376.48 3063.09 1512.52
100 F 385437.84 70940.72 2351.55 16088.49 0.00 0.00 3212.68 1454.11 514.96 0.00
100 G 225670.04 187847.64 79614.32 11646.18 6611.34 15508.47 5449.60 3127.47 1881.17 470.30
100 H 212663.98 213061.72 64437.64 14033.00 3173.97 20872.54 4022.94 634.07 716.89 305.77
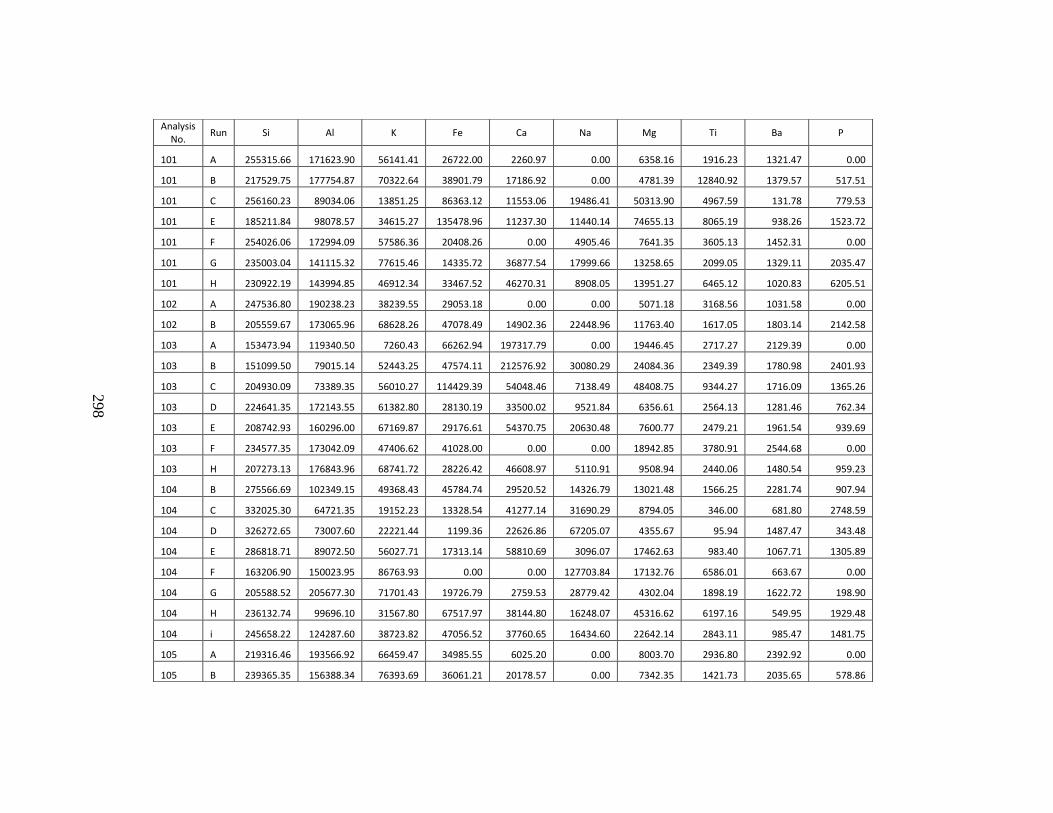
298
Analysis No.
Run Si Al K Fe Ca Na Mg Ti Ba P
101 A 255315.66 171623.90 56141.41 26722.00 2260.97 0.00 6358.16 1916.23 1321.47 0.00
101 B 217529.75 177754.87 70322.64 38901.79 17186.92 0.00 4781.39 12840.92 1379.57 517.51
101 C 256160.23 89034.06 13851.25 86363.12 11553.06 19486.41 50313.90 4967.59 131.78 779.53
101 E 185211.84 98078.57 34615.27 135478.96 11237.30 11440.14 74655.13 8065.19 938.26 1523.72
101 F 254026.06 172994.09 57586.36 20408.26 0.00 4905.46 7641.35 3605.13 1452.31 0.00
101 G 235003.04 141115.32 77615.46 14335.72 36877.54 17999.66 13258.65 2099.05 1329.11 2035.47
101 H 230922.19 143994.85 46912.34 33467.52 46270.31 8908.05 13951.27 6465.12 1020.83 6205.51
102 A 247536.80 190238.23 38239.55 29053.18 0.00 0.00 5071.18 3168.56 1031.58 0.00
102 B 205559.67 173065.96 68628.26 47078.49 14902.36 22448.96 11763.40 1617.05 1803.14 2142.58
103 A 153473.94 119340.50 7260.43 66262.94 197317.79 0.00 19446.45 2717.27 2129.39 0.00
103 B 151099.50 79015.14 52443.25 47574.11 212576.92 30080.29 24084.36 2349.39 1780.98 2401.93
103 C 204930.09 73389.35 56010.27 114429.39 54048.46 7138.49 48408.75 9344.27 1716.09 1365.26
103 D 224641.35 172143.55 61382.80 28130.19 33500.02 9521.84 6356.61 2564.13 1281.46 762.34
103 E 208742.93 160296.00 67169.87 29176.61 54370.75 20630.48 7600.77 2479.21 1961.54 939.69
103 F 234577.35 173042.09 47406.62 41028.00 0.00 0.00 18942.85 3780.91 2544.68 0.00
103 H 207273.13 176843.96 68741.72 28226.42 46608.97 5110.91 9508.94 2440.06 1480.54 959.23
104 B 275566.69 102349.15 49368.43 45784.74 29520.52 14326.79 13021.48 1566.25 2281.74 907.94
104 C 332025.30 64721.35 19152.23 13328.54 41277.14 31690.29 8794.05 346.00 681.80 2748.59
104 D 326272.65 73007.60 22221.44 1199.36 22626.86 67205.07 4355.67 95.94 1487.47 343.48
104 E 286818.71 89072.50 56027.71 17313.14 58810.69 3096.07 17462.63 983.40 1067.71 1305.89
104 F 163206.90 150023.95 86763.93 0.00 0.00 127703.84 17132.76 6586.01 663.67 0.00
104 G 205588.52 205677.30 71701.43 19726.79 2759.53 28779.42 4302.04 1898.19 1622.72 198.90
104 H 236132.74 99696.10 31567.80 67517.97 38144.80 16248.07 45316.62 6197.16 549.95 1929.48
104 i 245658.22 124287.60 38723.82 47056.52 37760.65 16434.60 22642.14 2843.11 985.47 1481.75
105 A 219316.46 193566.92 66459.47 34985.55 6025.20 0.00 8003.70 2936.80 2392.92 0.00
105 B 239365.35 156388.34 76393.69 36061.21 20178.57 0.00 7342.35 1421.73 2035.65 578.86
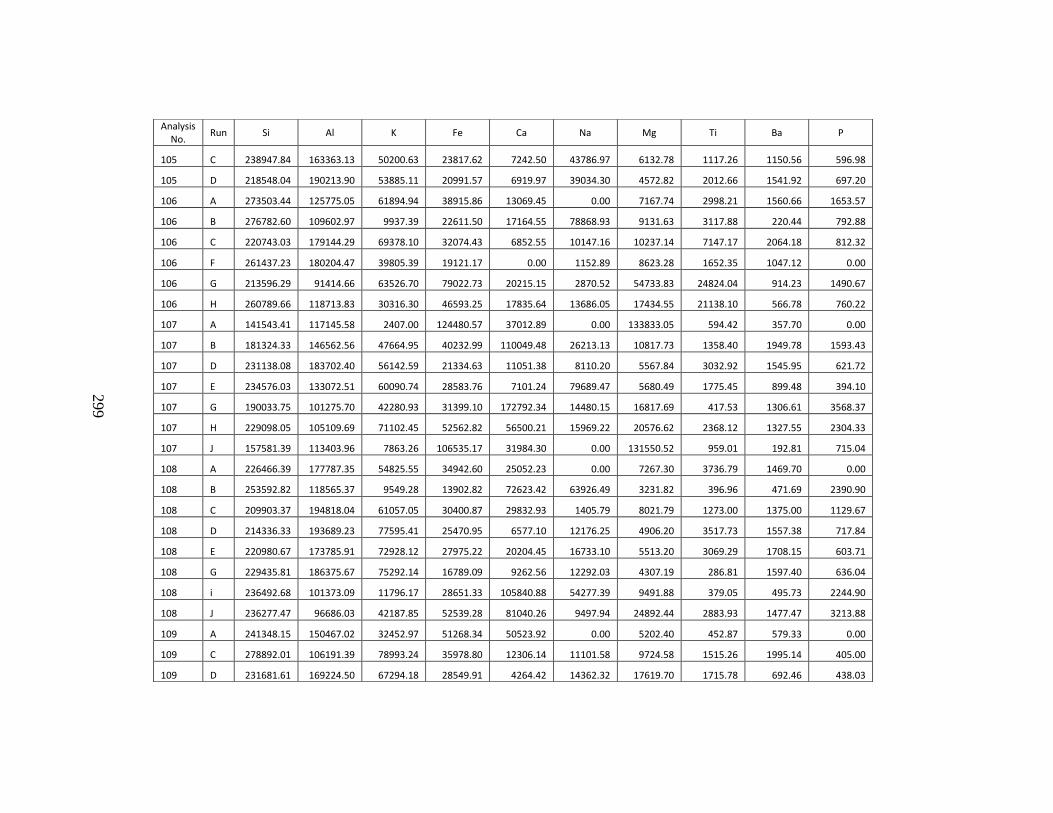
299
Analysis No.
Run Si Al K Fe Ca Na Mg Ti Ba P
105 C 238947.84 163363.13 50200.63 23817.62 7242.50 43786.97 6132.78 1117.26 1150.56 596.98
105 D 218548.04 190213.90 53885.11 20991.57 6919.97 39034.30 4572.82 2012.66 1541.92 697.20
106 A 273503.44 125775.05 61894.94 38915.86 13069.45 0.00 7167.74 2998.21 1560.66 1653.57
106 B 276782.60 109602.97 9937.39 22611.50 17164.55 78868.93 9131.63 3117.88 220.44 792.88
106 C 220743.03 179144.29 69378.10 32074.43 6852.55 10147.16 10237.14 7147.17 2064.18 812.32
106 F 261437.23 180204.47 39805.39 19121.17 0.00 1152.89 8623.28 1652.35 1047.12 0.00
106 G 213596.29 91414.66 63526.70 79022.73 20215.15 2870.52 54733.83 24824.04 914.23 1490.67
106 H 260789.66 118713.83 30316.30 46593.25 17835.64 13686.05 17434.55 21138.10 566.78 760.22
107 A 141543.41 117145.58 2407.00 124480.57 37012.89 0.00 133833.05 594.42 357.70 0.00
107 B 181324.33 146562.56 47664.95 40232.99 110049.48 26213.13 10817.73 1358.40 1949.78 1593.43
107 D 231138.08 183702.40 56142.59 21334.63 11051.38 8110.20 5567.84 3032.92 1545.95 621.72
107 E 234576.03 133072.51 60090.74 28583.76 7101.24 79689.47 5680.49 1775.45 899.48 394.10
107 G 190033.75 101275.70 42280.93 31399.10 172792.34 14480.15 16817.69 417.53 1306.61 3568.37
107 H 229098.05 105109.69 71102.45 52562.82 56500.21 15969.22 20576.62 2368.12 1327.55 2304.33
107 J 157581.39 113403.96 7863.26 106535.17 31984.30 0.00 131550.52 959.01 192.81 715.04
108 A 226466.39 177787.35 54825.55 34942.60 25052.23 0.00 7267.30 3736.79 1469.70 0.00
108 B 253592.82 118565.37 9549.28 13902.82 72623.42 63926.49 3231.82 396.96 471.69 2390.90
108 C 209903.37 194818.04 61057.05 30400.87 29832.93 1405.79 8021.79 1273.00 1375.00 1129.67
108 D 214336.33 193689.23 77595.41 25470.95 6577.10 12176.25 4906.20 3517.73 1557.38 717.84
108 E 220980.67 173785.91 72928.12 27975.22 20204.45 16733.10 5513.20 3069.29 1708.15 603.71
108 G 229435.81 186375.67 75292.14 16789.09 9262.56 12292.03 4307.19 286.81 1597.40 636.04
108 i 236492.68 101373.09 11796.17 28651.33 105840.88 54277.39 9491.88 379.05 495.73 2244.90
108 J 236277.47 96686.03 42187.85 52539.28 81040.26 9497.94 24892.44 2883.93 1477.47 3213.88
109 A 241348.15 150467.02 32452.97 51268.34 50523.92 0.00 5202.40 452.87 579.33 0.00
109 C 278892.01 106191.39 78993.24 35978.80 12306.14 11101.58 9724.58 1515.26 1995.14 405.00
109 D 231681.61 169224.50 67294.18 28549.91 4264.42 14362.32 17619.70 1715.78 692.46 438.03
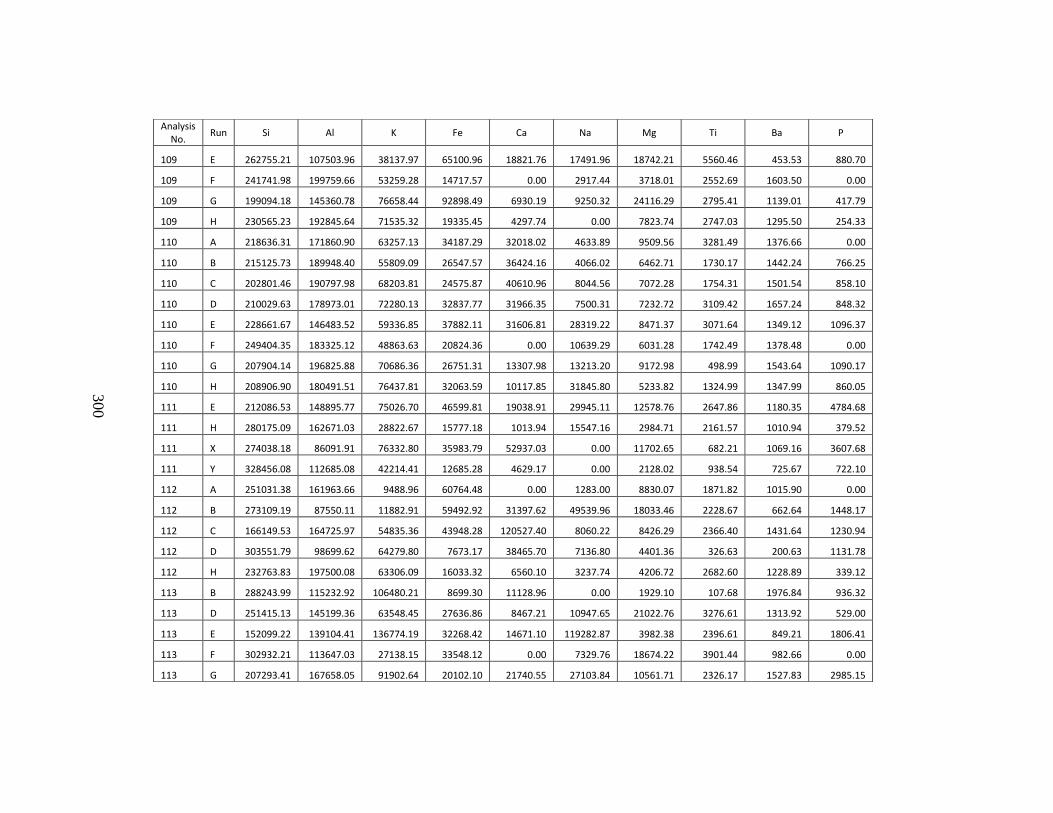
300
Analysis No.
Run Si Al K Fe Ca Na Mg Ti Ba P
109 E 262755.21 107503.96 38137.97 65100.96 18821.76 17491.96 18742.21 5560.46 453.53 880.70
109 F 241741.98 199759.66 53259.28 14717.57 0.00 2917.44 3718.01 2552.69 1603.50 0.00
109 G 199094.18 145360.78 76658.44 92898.49 6930.19 9250.32 24116.29 2795.41 1139.01 417.79
109 H 230565.23 192845.64 71535.32 19335.45 4297.74 0.00 7823.74 2747.03 1295.50 254.33
110 A 218636.31 171860.90 63257.13 34187.29 32018.02 4633.89 9509.56 3281.49 1376.66 0.00
110 B 215125.73 189948.40 55809.09 26547.57 36424.16 4066.02 6462.71 1730.17 1442.24 766.25
110 C 202801.46 190797.98 68203.81 24575.87 40610.96 8044.56 7072.28 1754.31 1501.54 858.10
110 D 210029.63 178973.01 72280.13 32837.77 31966.35 7500.31 7232.72 3109.42 1657.24 848.32
110 E 228661.67 146483.52 59336.85 37882.11 31606.81 28319.22 8471.37 3071.64 1349.12 1096.37
110 F 249404.35 183325.12 48863.63 20824.36 0.00 10639.29 6031.28 1742.49 1378.48 0.00
110 G 207904.14 196825.88 70686.36 26751.31 13307.98 13213.20 9172.98 498.99 1543.64 1090.17
110 H 208906.90 180491.51 76437.81 32063.59 10117.85 31845.80 5233.82 1324.99 1347.99 860.05
111 E 212086.53 148895.77 75026.70 46599.81 19038.91 29945.11 12578.76 2647.86 1180.35 4784.68
111 H 280175.09 162671.03 28822.67 15777.18 1013.94 15547.16 2984.71 2161.57 1010.94 379.52
111 X 274038.18 86091.91 76332.80 35983.79 52937.03 0.00 11702.65 682.21 1069.16 3607.68
111 Y 328456.08 112685.08 42214.41 12685.28 4629.17 0.00 2128.02 938.54 725.67 722.10
112 A 251031.38 161963.66 9488.96 60764.48 0.00 1283.00 8830.07 1871.82 1015.90 0.00
112 B 273109.19 87550.11 11882.91 59492.92 31397.62 49539.96 18033.46 2228.67 662.64 1448.17
112 C 166149.53 164725.97 54835.36 43948.28 120527.40 8060.22 8426.29 2366.40 1431.64 1230.94
112 D 303551.79 98699.62 64279.80 7673.17 38465.70 7136.80 4401.36 326.63 200.63 1131.78
112 H 232763.83 197500.08 63306.09 16033.32 6560.10 3237.74 4206.72 2682.60 1228.89 339.12
113 B 288243.99 115232.92 106480.21 8699.30 11128.96 0.00 1929.10 107.68 1976.84 936.32
113 D 251415.13 145199.36 63548.45 27636.86 8467.21 10947.65 21022.76 3276.61 1313.92 529.00
113 E 152099.22 139104.41 136774.19 32268.42 14671.10 119282.87 3982.38 2396.61 849.21 1806.41
113 F 302932.21 113647.03 27138.15 33548.12 0.00 7329.76 18674.22 3901.44 982.66 0.00
113 G 207293.41 167658.05 91902.64 20102.10 21740.55 27103.84 10561.71 2326.17 1527.83 2985.15
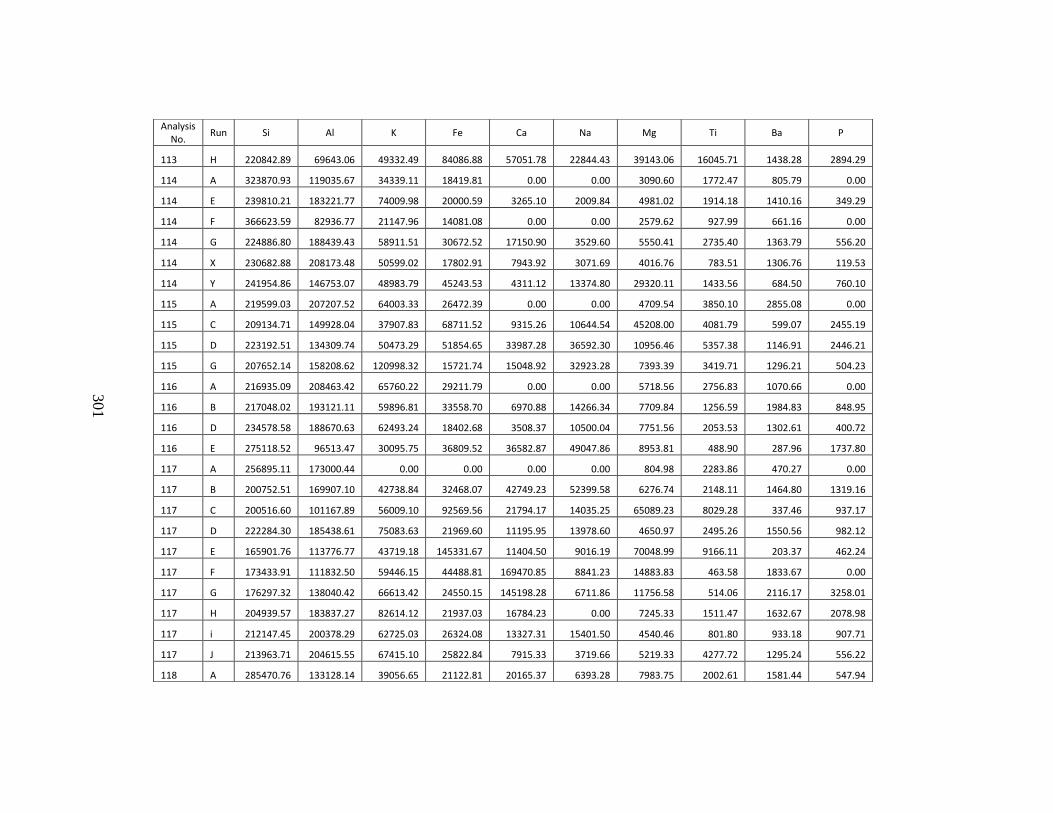
301
Analysis No.
Run Si Al K Fe Ca Na Mg Ti Ba P
113 H 220842.89 69643.06 49332.49 84086.88 57051.78 22844.43 39143.06 16045.71 1438.28 2894.29
114 A 323870.93 119035.67 34339.11 18419.81 0.00 0.00 3090.60 1772.47 805.79 0.00
114 E 239810.21 183221.77 74009.98 20000.59 3265.10 2009.84 4981.02 1914.18 1410.16 349.29
114 F 366623.59 82936.77 21147.96 14081.08 0.00 0.00 2579.62 927.99 661.16 0.00
114 G 224886.80 188439.43 58911.51 30672.52 17150.90 3529.60 5550.41 2735.40 1363.79 556.20
114 X 230682.88 208173.48 50599.02 17802.91 7943.92 3071.69 4016.76 783.51 1306.76 119.53
114 Y 241954.86 146753.07 48983.79 45243.53 4311.12 13374.80 29320.11 1433.56 684.50 760.10
115 A 219599.03 207207.52 64003.33 26472.39 0.00 0.00 4709.54 3850.10 2855.08 0.00
115 C 209134.71 149928.04 37907.83 68711.52 9315.26 10644.54 45208.00 4081.79 599.07 2455.19
115 D 223192.51 134309.74 50473.29 51854.65 33987.28 36592.30 10956.46 5357.38 1146.91 2446.21
115 G 207652.14 158208.62 120998.32 15721.74 15048.92 32923.28 7393.39 3419.71 1296.21 504.23
116 A 216935.09 208463.42 65760.22 29211.79 0.00 0.00 5718.56 2756.83 1070.66 0.00
116 B 217048.02 193121.11 59896.81 33558.70 6970.88 14266.34 7709.84 1256.59 1984.83 848.95
116 D 234578.58 188670.63 62493.24 18402.68 3508.37 10500.04 7751.56 2053.53 1302.61 400.72
116 E 275118.52 96513.47 30095.75 36809.52 36582.87 49047.86 8953.81 488.90 287.96 1737.80
117 A 256895.11 173000.44 0.00 0.00 0.00 0.00 804.98 2283.86 470.27 0.00
117 B 200752.51 169907.10 42738.84 32468.07 42749.23 52399.58 6276.74 2148.11 1464.80 1319.16
117 C 200516.60 101167.89 56009.10 92569.56 21794.17 14035.25 65089.23 8029.28 337.46 937.17
117 D 222284.30 185438.61 75083.63 21969.60 11195.95 13978.60 4650.97 2495.26 1550.56 982.12
117 E 165901.76 113776.77 43719.18 145331.67 11404.50 9016.19 70048.99 9166.11 203.37 462.24
117 F 173433.91 111832.50 59446.15 44488.81 169470.85 8841.23 14883.83 463.58 1833.67 0.00
117 G 176297.32 138040.42 66613.42 24550.15 145198.28 6711.86 11756.58 514.06 2116.17 3258.01
117 H 204939.57 183837.27 82614.12 21937.03 16784.23 0.00 7245.33 1511.47 1632.67 2078.98
117 i 212147.45 200378.29 62725.03 26324.08 13327.31 15401.50 4540.46 801.80 933.18 907.71
117 J 213963.71 204615.55 67415.10 25822.84 7915.33 3719.66 5219.33 4277.72 1295.24 556.22
118 A 285470.76 133128.14 39056.65 21122.81 20165.37 6393.28 7983.75 2002.61 1581.44 547.94
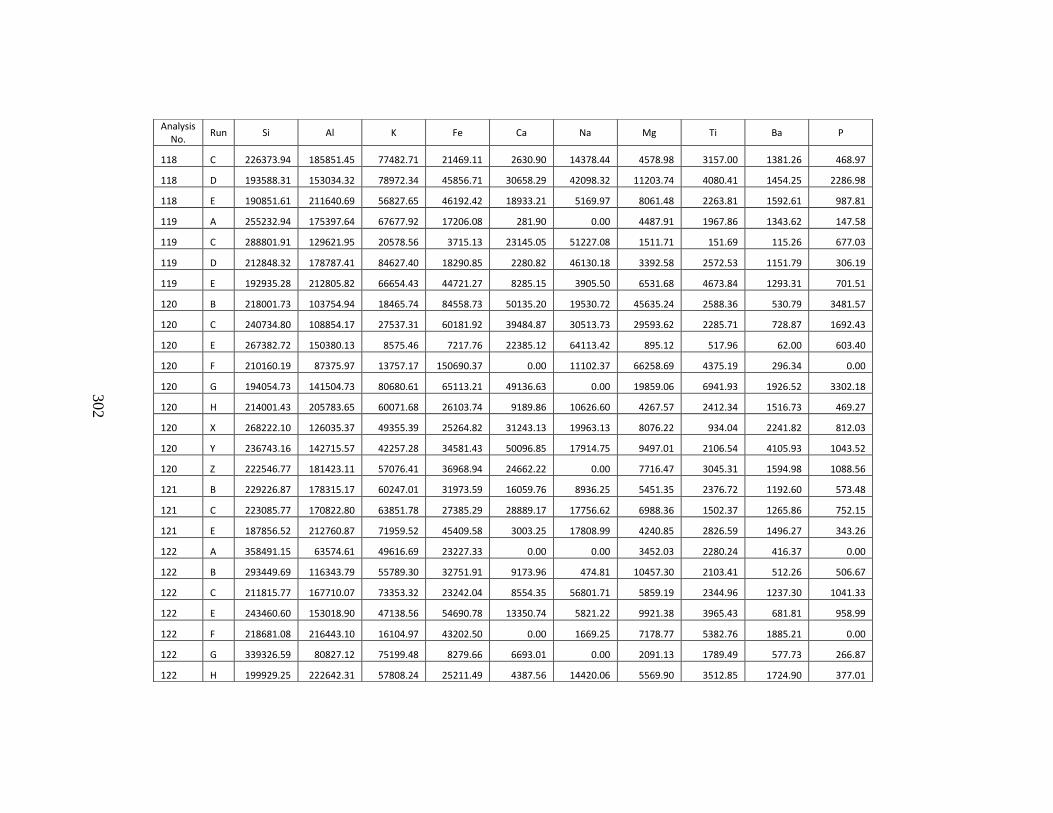
302
Analysis No.
Run Si Al K Fe Ca Na Mg Ti Ba P
118 C 226373.94 185851.45 77482.71 21469.11 2630.90 14378.44 4578.98 3157.00 1381.26 468.97
118 D 193588.31 153034.32 78972.34 45856.71 30658.29 42098.32 11203.74 4080.41 1454.25 2286.98
118 E 190851.61 211640.69 56827.65 46192.42 18933.21 5169.97 8061.48 2263.81 1592.61 987.81
119 A 255232.94 175397.64 67677.92 17206.08 281.90 0.00 4487.91 1967.86 1343.62 147.58
119 C 288801.91 129621.95 20578.56 3715.13 23145.05 51227.08 1511.71 151.69 115.26 677.03
119 D 212848.32 178787.41 84627.40 18290.85 2280.82 46130.18 3392.58 2572.53 1151.79 306.19
119 E 192935.28 212805.82 66654.43 44721.27 8285.15 3905.50 6531.68 4673.84 1293.31 701.51
120 B 218001.73 103754.94 18465.74 84558.73 50135.20 19530.72 45635.24 2588.36 530.79 3481.57
120 C 240734.80 108854.17 27537.31 60181.92 39484.87 30513.73 29593.62 2285.71 728.87 1692.43
120 E 267382.72 150380.13 8575.46 7217.76 22385.12 64113.42 895.12 517.96 62.00 603.40
120 F 210160.19 87375.97 13757.17 150690.37 0.00 11102.37 66258.69 4375.19 296.34 0.00
120 G 194054.73 141504.73 80680.61 65113.21 49136.63 0.00 19859.06 6941.93 1926.52 3302.18
120 H 214001.43 205783.65 60071.68 26103.74 9189.86 10626.60 4267.57 2412.34 1516.73 469.27
120 X 268222.10 126035.37 49355.39 25264.82 31243.13 19963.13 8076.22 934.04 2241.82 812.03
120 Y 236743.16 142715.57 42257.28 34581.43 50096.85 17914.75 9497.01 2106.54 4105.93 1043.52
120 Z 222546.77 181423.11 57076.41 36968.94 24662.22 0.00 7716.47 3045.31 1594.98 1088.56
121 B 229226.87 178315.17 60247.01 31973.59 16059.76 8936.25 5451.35 2376.72 1192.60 573.48
121 C 223085.77 170822.80 63851.78 27385.29 28889.17 17756.62 6988.36 1502.37 1265.86 752.15
121 E 187856.52 212760.87 71959.52 45409.58 3003.25 17808.99 4240.85 2826.59 1496.27 343.26
122 A 358491.15 63574.61 49616.69 23227.33 0.00 0.00 3452.03 2280.24 416.37 0.00
122 B 293449.69 116343.79 55789.30 32751.91 9173.96 474.81 10457.30 2103.41 512.26 506.67
122 C 211815.77 167710.07 73353.32 23242.04 8554.35 56801.71 5859.19 2344.96 1237.30 1041.33
122 E 243460.60 153018.90 47138.56 54690.78 13350.74 5821.22 9921.38 3965.43 681.81 958.99
122 F 218681.08 216443.10 16104.97 43202.50 0.00 1669.25 7178.77 5382.76 1885.21 0.00
122 G 339326.59 80827.12 75199.48 8279.66 6693.01 0.00 2091.13 1789.49 577.73 266.87
122 H 199929.25 222642.31 57808.24 25211.49 4387.56 14420.06 5569.90 3512.85 1724.90 377.01
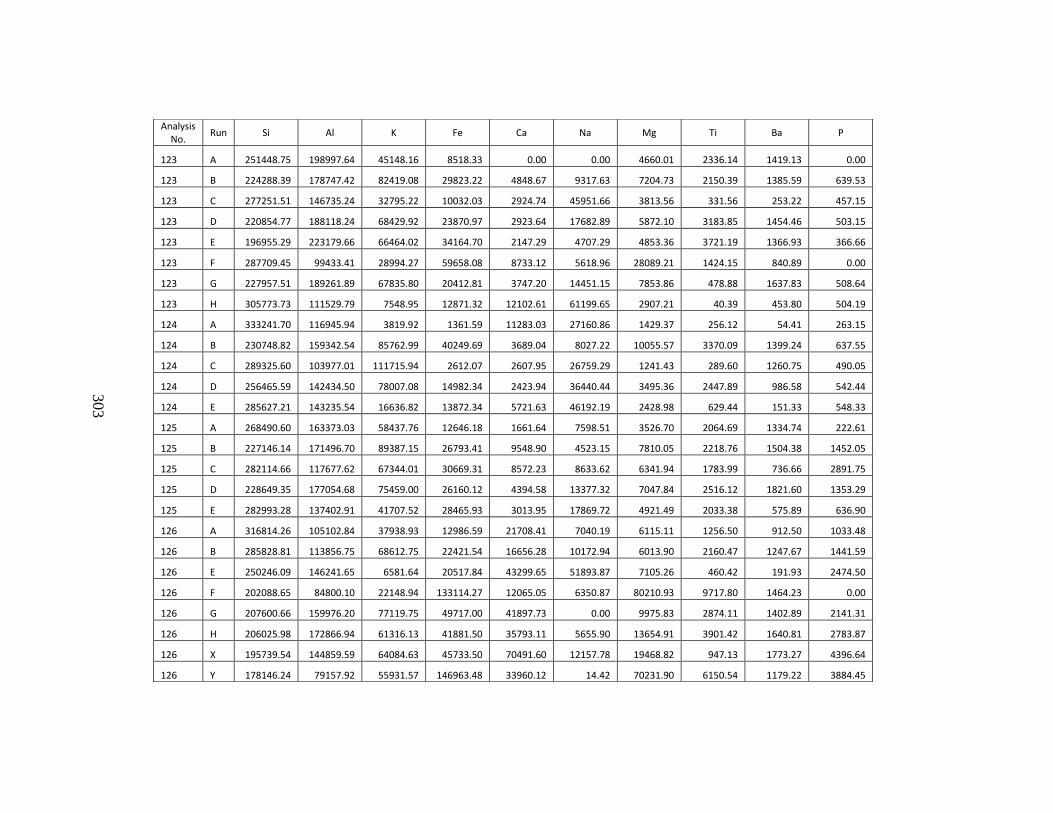
303
Analysis No.
Run Si Al K Fe Ca Na Mg Ti Ba P
123 A 251448.75 198997.64 45148.16 8518.33 0.00 0.00 4660.01 2336.14 1419.13 0.00
123 B 224288.39 178747.42 82419.08 29823.22 4848.67 9317.63 7204.73 2150.39 1385.59 639.53
123 C 277251.51 146735.24 32795.22 10032.03 2924.74 45951.66 3813.56 331.56 253.22 457.15
123 D 220854.77 188118.24 68429.92 23870.97 2923.64 17682.89 5872.10 3183.85 1454.46 503.15
123 E 196955.29 223179.66 66464.02 34164.70 2147.29 4707.29 4853.36 3721.19 1366.93 366.66
123 F 287709.45 99433.41 28994.27 59658.08 8733.12 5618.96 28089.21 1424.15 840.89 0.00
123 G 227957.51 189261.89 67835.80 20412.81 3747.20 14451.15 7853.86 478.88 1637.83 508.64
123 H 305773.73 111529.79 7548.95 12871.32 12102.61 61199.65 2907.21 40.39 453.80 504.19
124 A 333241.70 116945.94 3819.92 1361.59 11283.03 27160.86 1429.37 256.12 54.41 263.15
124 B 230748.82 159342.54 85762.99 40249.69 3689.04 8027.22 10055.57 3370.09 1399.24 637.55
124 C 289325.60 103977.01 111715.94 2612.07 2607.95 26759.29 1241.43 289.60 1260.75 490.05
124 D 256465.59 142434.50 78007.08 14982.34 2423.94 36440.44 3495.36 2447.89 986.58 542.44
124 E 285627.21 143235.54 16636.82 13872.34 5721.63 46192.19 2428.98 629.44 151.33 548.33
125 A 268490.60 163373.03 58437.76 12646.18 1661.64 7598.51 3526.70 2064.69 1334.74 222.61
125 B 227146.14 171496.70 89387.15 26793.41 9548.90 4523.15 7810.05 2218.76 1504.38 1452.05
125 C 282114.66 117677.62 67344.01 30669.31 8572.23 8633.62 6341.94 1783.99 736.66 2891.75
125 D 228649.35 177054.68 75459.00 26160.12 4394.58 13377.32 7047.84 2516.12 1821.60 1353.29
125 E 282993.28 137402.91 41707.52 28465.93 3013.95 17869.72 4921.49 2033.38 575.89 636.90
126 A 316814.26 105102.84 37938.93 12986.59 21708.41 7040.19 6115.11 1256.50 912.50 1033.48
126 B 285828.81 113856.75 68612.75 22421.54 16656.28 10172.94 6013.90 2160.47 1247.67 1441.59
126 E 250246.09 146241.65 6581.64 20517.84 43299.65 51893.87 7105.26 460.42 191.93 2474.50
126 F 202088.65 84800.10 22148.94 133114.27 12065.05 6350.87 80210.93 9717.80 1464.23 0.00
126 G 207600.66 159976.20 77119.75 49717.00 41897.73 0.00 9975.83 2874.11 1402.89 2141.31
126 H 206025.98 172866.94 61316.13 41881.50 35793.11 5655.90 13654.91 3901.42 1640.81 2783.87
126 X 195739.54 144859.59 64084.63 45733.50 70491.60 12157.78 19468.82 947.13 1773.27 4396.64
126 Y 178146.24 79157.92 55931.57 146963.48 33960.12 14.42 70231.90 6150.54 1179.22 3884.45
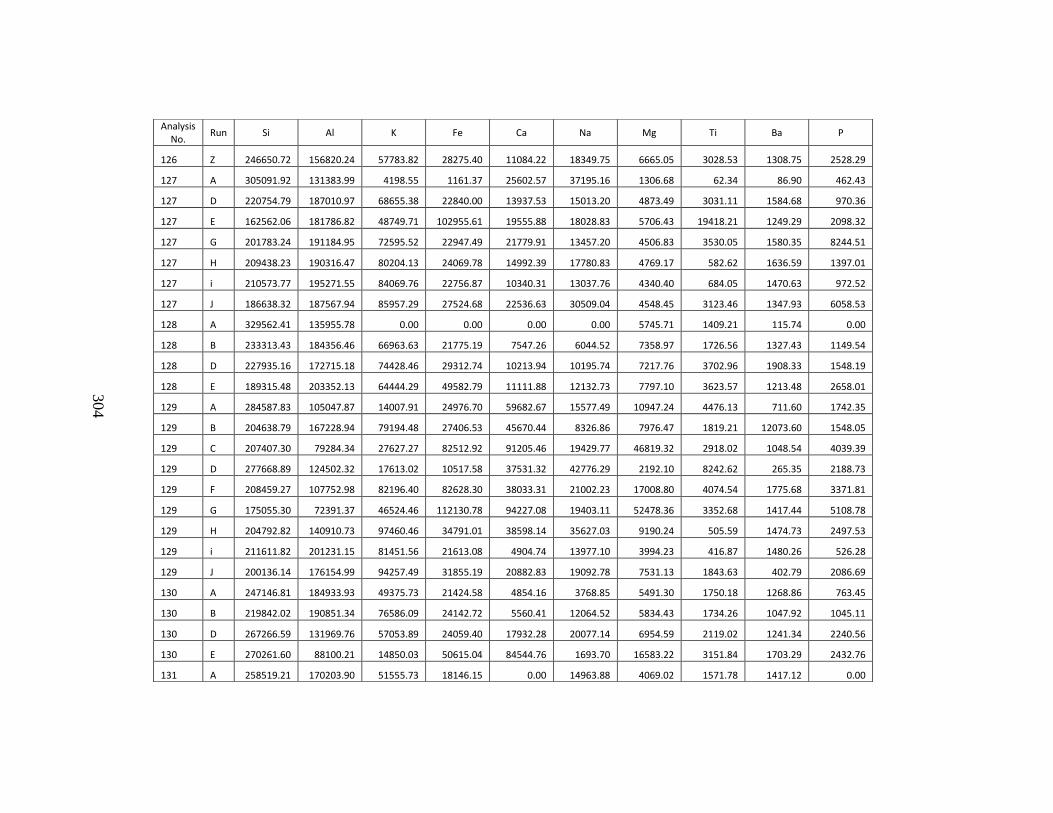
304
Analysis No.
Run Si Al K Fe Ca Na Mg Ti Ba P
126 Z 246650.72 156820.24 57783.82 28275.40 11084.22 18349.75 6665.05 3028.53 1308.75 2528.29
127 A 305091.92 131383.99 4198.55 1161.37 25602.57 37195.16 1306.68 62.34 86.90 462.43
127 D 220754.79 187010.97 68655.38 22840.00 13937.53 15013.20 4873.49 3031.11 1584.68 970.36
127 E 162562.06 181786.82 48749.71 102955.61 19555.88 18028.83 5706.43 19418.21 1249.29 2098.32
127 G 201783.24 191184.95 72595.52 22947.49 21779.91 13457.20 4506.83 3530.05 1580.35 8244.51
127 H 209438.23 190316.47 80204.13 24069.78 14992.39 17780.83 4769.17 582.62 1636.59 1397.01
127 i 210573.77 195271.55 84069.76 22756.87 10340.31 13037.76 4340.40 684.05 1470.63 972.52
127 J 186638.32 187567.94 85957.29 27524.68 22536.63 30509.04 4548.45 3123.46 1347.93 6058.53
128 A 329562.41 135955.78 0.00 0.00 0.00 0.00 5745.71 1409.21 115.74 0.00
128 B 233313.43 184356.46 66963.63 21775.19 7547.26 6044.52 7358.97 1726.56 1327.43 1149.54
128 D 227935.16 172715.18 74428.46 29312.74 10213.94 10195.74 7217.76 3702.96 1908.33 1548.19
128 E 189315.48 203352.13 64444.29 49582.79 11111.88 12132.73 7797.10 3623.57 1213.48 2658.01
129 A 284587.83 105047.87 14007.91 24976.70 59682.67 15577.49 10947.24 4476.13 711.60 1742.35
129 B 204638.79 167228.94 79194.48 27406.53 45670.44 8326.86 7976.47 1819.21 12073.60 1548.05
129 C 207407.30 79284.34 27627.27 82512.92 91205.46 19429.77 46819.32 2918.02 1048.54 4039.39
129 D 277668.89 124502.32 17613.02 10517.58 37531.32 42776.29 2192.10 8242.62 265.35 2188.73
129 F 208459.27 107752.98 82196.40 82628.30 38033.31 21002.23 17008.80 4074.54 1775.68 3371.81
129 G 175055.30 72391.37 46524.46 112130.78 94227.08 19403.11 52478.36 3352.68 1417.44 5108.78
129 H 204792.82 140910.73 97460.46 34791.01 38598.14 35627.03 9190.24 505.59 1474.73 2497.53
129 i 211611.82 201231.15 81451.56 21613.08 4904.74 13977.10 3994.23 416.87 1480.26 526.28
129 J 200136.14 176154.99 94257.49 31855.19 20882.83 19092.78 7531.13 1843.63 402.79 2086.69
130 A 247146.81 184933.93 49375.73 21424.58 4854.16 3768.85 5491.30 1750.18 1268.86 763.45
130 B 219842.02 190851.34 76586.09 24142.72 5560.41 12064.52 5834.43 1734.26 1047.92 1045.11
130 D 267266.59 131969.76 57053.89 24059.40 17932.28 20077.14 6954.59 2119.02 1241.34 2240.56
130 E 270261.60 88100.21 14850.03 50615.04 84544.76 1693.70 16583.22 3151.84 1703.29 2432.76
131 A 258519.21 170203.90 51555.73 18146.15 0.00 14963.88 4069.02 1571.78 1417.12 0.00
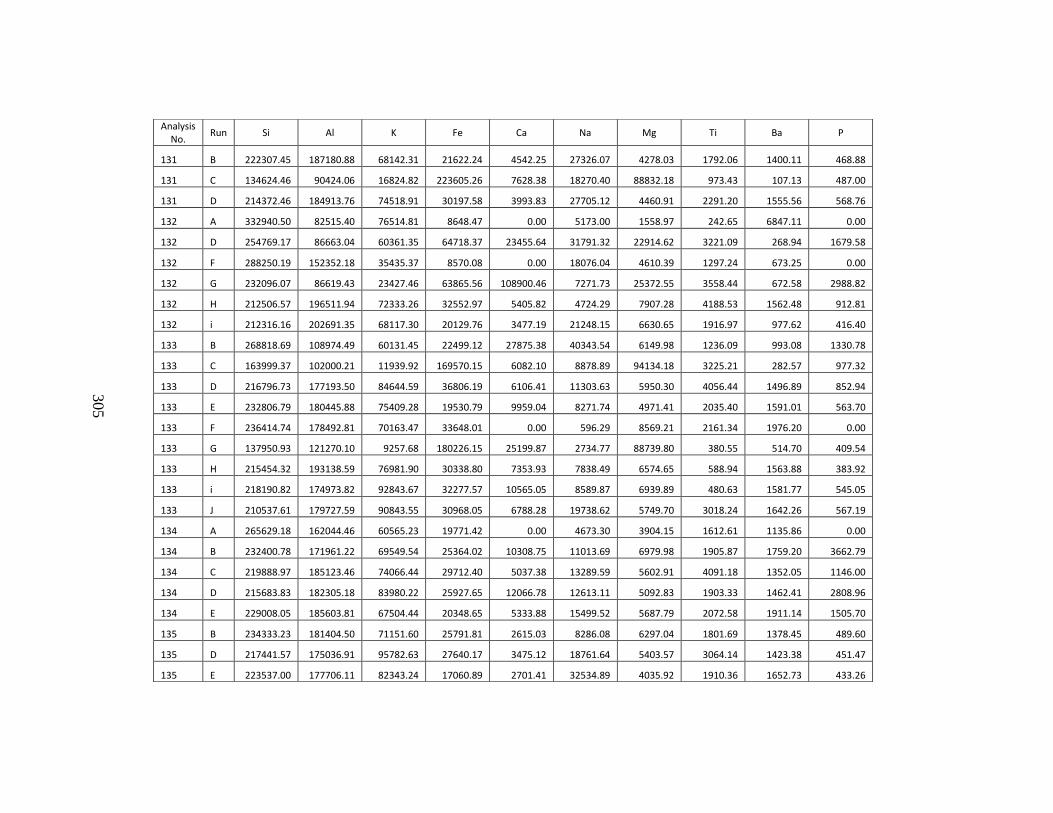
305
Analysis No.
Run Si Al K Fe Ca Na Mg Ti Ba P
131 B 222307.45 187180.88 68142.31 21622.24 4542.25 27326.07 4278.03 1792.06 1400.11 468.88
131 C 134624.46 90424.06 16824.82 223605.26 7628.38 18270.40 88832.18 973.43 107.13 487.00
131 D 214372.46 184913.76 74518.91 30197.58 3993.83 27705.12 4460.91 2291.20 1555.56 568.76
132 A 332940.50 82515.40 76514.81 8648.47 0.00 5173.00 1558.97 242.65 6847.11 0.00
132 D 254769.17 86663.04 60361.35 64718.37 23455.64 31791.32 22914.62 3221.09 268.94 1679.58
132 F 288250.19 152352.18 35435.37 8570.08 0.00 18076.04 4610.39 1297.24 673.25 0.00
132 G 232096.07 86619.43 23427.46 63865.56 108900.46 7271.73 25372.55 3558.44 672.58 2988.82
132 H 212506.57 196511.94 72333.26 32552.97 5405.82 4724.29 7907.28 4188.53 1562.48 912.81
132 i 212316.16 202691.35 68117.30 20129.76 3477.19 21248.15 6630.65 1916.97 977.62 416.40
133 B 268818.69 108974.49 60131.45 22499.12 27875.38 40343.54 6149.98 1236.09 993.08 1330.78
133 C 163999.37 102000.21 11939.92 169570.15 6082.10 8878.89 94134.18 3225.21 282.57 977.32
133 D 216796.73 177193.50 84644.59 36806.19 6106.41 11303.63 5950.30 4056.44 1496.89 852.94
133 E 232806.79 180445.88 75409.28 19530.79 9959.04 8271.74 4971.41 2035.40 1591.01 563.70
133 F 236414.74 178492.81 70163.47 33648.01 0.00 596.29 8569.21 2161.34 1976.20 0.00
133 G 137950.93 121270.10 9257.68 180226.15 25199.87 2734.77 88739.80 380.55 514.70 409.54
133 H 215454.32 193138.59 76981.90 30338.80 7353.93 7838.49 6574.65 588.94 1563.88 383.92
133 i 218190.82 174973.82 92843.67 32277.57 10565.05 8589.87 6939.89 480.63 1581.77 545.05
133 J 210537.61 179727.59 90843.55 30968.05 6788.28 19738.62 5749.70 3018.24 1642.26 567.19
134 A 265629.18 162044.46 60565.23 19771.42 0.00 4673.30 3904.15 1612.61 1135.86 0.00
134 B 232400.78 171961.22 69549.54 25364.02 10308.75 11013.69 6979.98 1905.87 1759.20 3662.79
134 C 219888.97 185123.46 74066.44 29712.40 5037.38 13289.59 5602.91 4091.18 1352.05 1146.00
134 D 215683.83 182305.18 83980.22 25927.65 12066.78 12613.11 5092.83 1903.33 1462.41 2808.96
134 E 229008.05 185603.81 67504.44 20348.65 5333.88 15499.52 5687.79 2072.58 1911.14 1505.70
135 B 234333.23 181404.50 71151.60 25791.81 2615.03 8286.08 6297.04 1801.69 1378.45 489.60
135 D 217441.57 175036.91 95782.63 27640.17 3475.12 18761.64 5403.57 3064.14 1423.38 451.47
135 E 223537.00 177706.11 82343.24 17060.89 2701.41 32534.89 4035.92 1910.36 1652.73 433.26
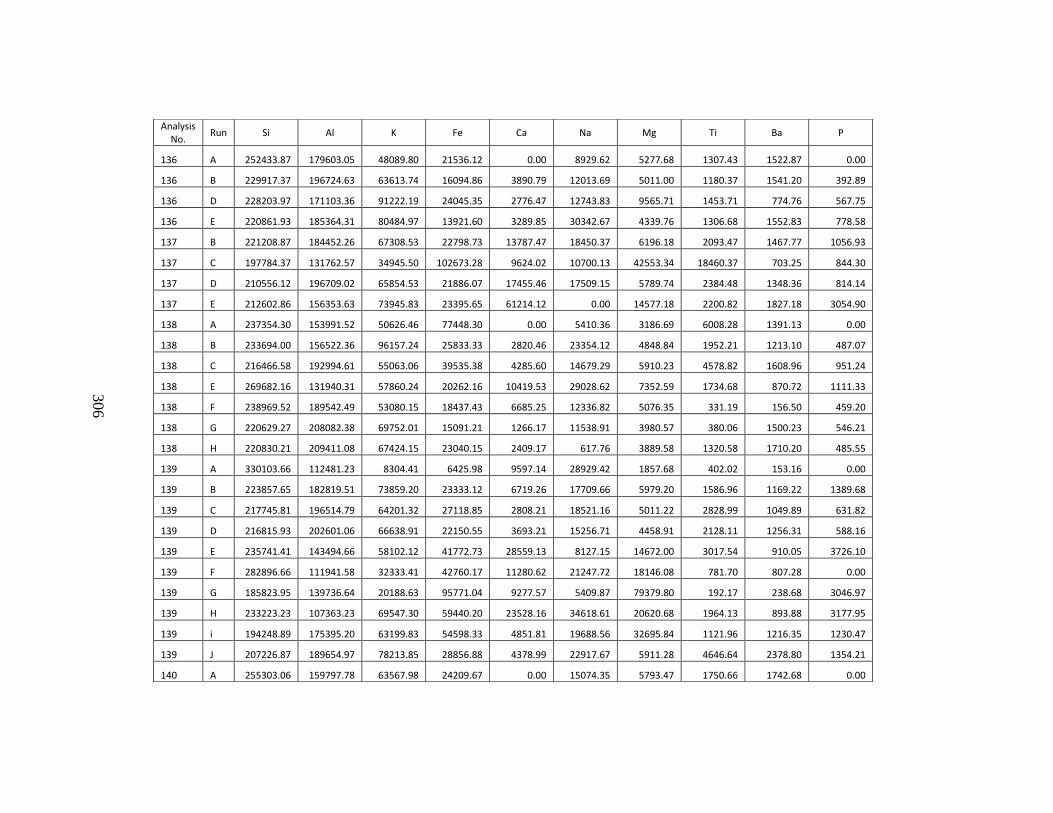
306
Analysis No.
Run Si Al K Fe Ca Na Mg Ti Ba P
136 A 252433.87 179603.05 48089.80 21536.12 0.00 8929.62 5277.68 1307.43 1522.87 0.00
136 B 229917.37 196724.63 63613.74 16094.86 3890.79 12013.69 5011.00 1180.37 1541.20 392.89
136 D 228203.97 171103.36 91222.19 24045.35 2776.47 12743.83 9565.71 1453.71 774.76 567.75
136 E 220861.93 185364.31 80484.97 13921.60 3289.85 30342.67 4339.76 1306.68 1552.83 778.58
137 B 221208.87 184452.26 67308.53 22798.73 13787.47 18450.37 6196.18 2093.47 1467.77 1056.93
137 C 197784.37 131762.57 34945.50 102673.28 9624.02 10700.13 42553.34 18460.37 703.25 844.30
137 D 210556.12 196709.02 65854.53 21886.07 17455.46 17509.15 5789.74 2384.48 1348.36 814.14
137 E 212602.86 156353.63 73945.83 23395.65 61214.12 0.00 14577.18 2200.82 1827.18 3054.90
138 A 237354.30 153991.52 50626.46 77448.30 0.00 5410.36 3186.69 6008.28 1391.13 0.00
138 B 233694.00 156522.36 96157.24 25833.33 2820.46 23354.12 4848.84 1952.21 1213.10 487.07
138 C 216466.58 192994.61 55063.06 39535.38 4285.60 14679.29 5910.23 4578.82 1608.96 951.24
138 E 269682.16 131940.31 57860.24 20262.16 10419.53 29028.62 7352.59 1734.68 870.72 1111.33
138 F 238969.52 189542.49 53080.15 18437.43 6685.25 12336.82 5076.35 331.19 156.50 459.20
138 G 220629.27 208082.38 69752.01 15091.21 1266.17 11538.91 3980.57 380.06 1500.23 546.21
138 H 220830.21 209411.08 67424.15 23040.15 2409.17 617.76 3889.58 1320.58 1710.20 485.55
139 A 330103.66 112481.23 8304.41 6425.98 9597.14 28929.42 1857.68 402.02 153.16 0.00
139 B 223857.65 182819.51 73859.20 23333.12 6719.26 17709.66 5979.20 1586.96 1169.22 1389.68
139 C 217745.81 196514.79 64201.32 27118.85 2808.21 18521.16 5011.22 2828.99 1049.89 631.82
139 D 216815.93 202601.06 66638.91 22150.55 3693.21 15256.71 4458.91 2128.11 1256.31 588.16
139 E 235741.41 143494.66 58102.12 41772.73 28559.13 8127.15 14672.00 3017.54 910.05 3726.10
139 F 282896.66 111941.58 32333.41 42760.17 11280.62 21247.72 18146.08 781.70 807.28 0.00
139 G 185823.95 139736.64 20188.63 95771.04 9277.57 5409.87 79379.80 192.17 238.68 3046.97
139 H 233223.23 107363.23 69547.30 59440.20 23528.16 34618.61 20620.68 1964.13 893.88 3177.95
139 i 194248.89 175395.20 63199.83 54598.33 4851.81 19688.56 32695.84 1121.96 1216.35 1230.47
139 J 207226.87 189654.97 78213.85 28856.88 4378.99 22917.67 5911.28 4646.64 2378.80 1354.21
140 A 255303.06 159797.78 63567.98 24209.67 0.00 15074.35 5793.47 1750.66 1742.68 0.00
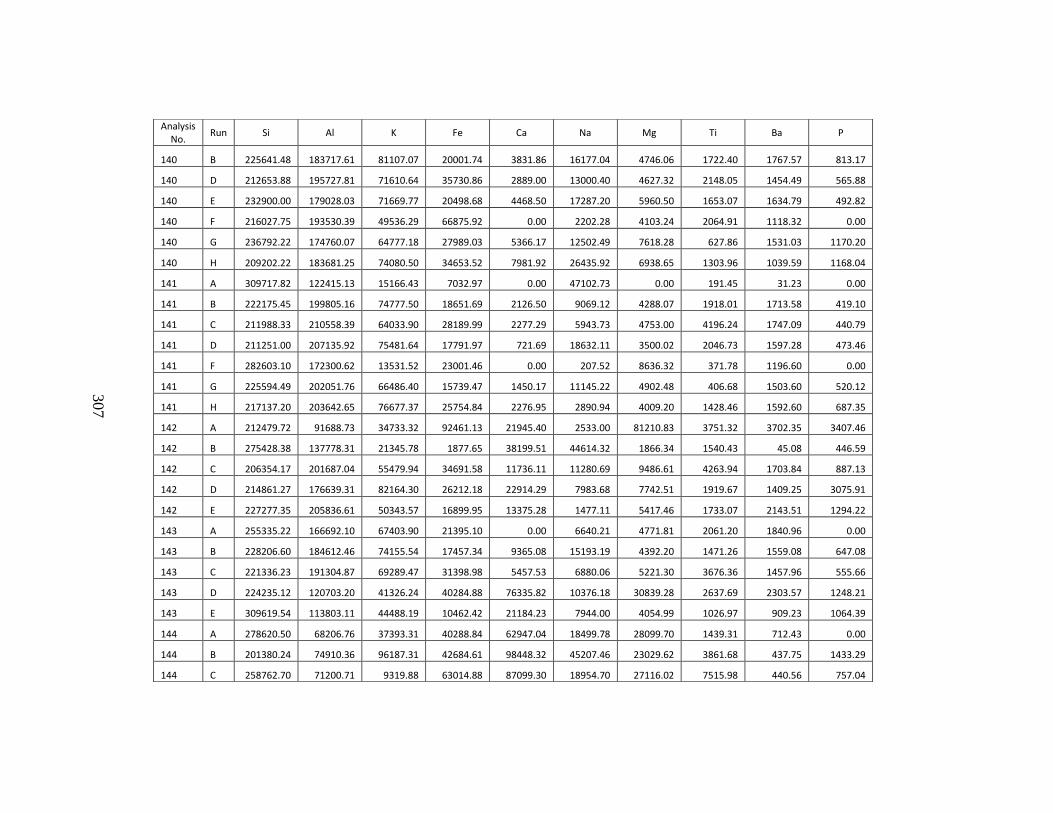
307
Analysis No.
Run Si Al K Fe Ca Na Mg Ti Ba P
140 B 225641.48 183717.61 81107.07 20001.74 3831.86 16177.04 4746.06 1722.40 1767.57 813.17
140 D 212653.88 195727.81 71610.64 35730.86 2889.00 13000.40 4627.32 2148.05 1454.49 565.88
140 E 232900.00 179028.03 71669.77 20498.68 4468.50 17287.20 5960.50 1653.07 1634.79 492.82
140 F 216027.75 193530.39 49536.29 66875.92 0.00 2202.28 4103.24 2064.91 1118.32 0.00
140 G 236792.22 174760.07 64777.18 27989.03 5366.17 12502.49 7618.28 627.86 1531.03 1170.20
140 H 209202.22 183681.25 74080.50 34653.52 7981.92 26435.92 6938.65 1303.96 1039.59 1168.04
141 A 309717.82 122415.13 15166.43 7032.97 0.00 47102.73 0.00 191.45 31.23 0.00
141 B 222175.45 199805.16 74777.50 18651.69 2126.50 9069.12 4288.07 1918.01 1713.58 419.10
141 C 211988.33 210558.39 64033.90 28189.99 2277.29 5943.73 4753.00 4196.24 1747.09 440.79
141 D 211251.00 207135.92 75481.64 17791.97 721.69 18632.11 3500.02 2046.73 1597.28 473.46
141 F 282603.10 172300.62 13531.52 23001.46 0.00 207.52 8636.32 371.78 1196.60 0.00
141 G 225594.49 202051.76 66486.40 15739.47 1450.17 11145.22 4902.48 406.68 1503.60 520.12
141 H 217137.20 203642.65 76677.37 25754.84 2276.95 2890.94 4009.20 1428.46 1592.60 687.35
142 A 212479.72 91688.73 34733.32 92461.13 21945.40 2533.00 81210.83 3751.32 3702.35 3407.46
142 B 275428.38 137778.31 21345.78 1877.65 38199.51 44614.32 1866.34 1540.43 45.08 446.59
142 C 206354.17 201687.04 55479.94 34691.58 11736.11 11280.69 9486.61 4263.94 1703.84 887.13
142 D 214861.27 176639.31 82164.30 26212.18 22914.29 7983.68 7742.51 1919.67 1409.25 3075.91
142 E 227277.35 205836.61 50343.57 16899.95 13375.28 1477.11 5417.46 1733.07 2143.51 1294.22
143 A 255335.22 166692.10 67403.90 21395.10 0.00 6640.21 4771.81 2061.20 1840.96 0.00
143 B 228206.60 184612.46 74155.54 17457.34 9365.08 15193.19 4392.20 1471.26 1559.08 647.08
143 C 221336.23 191304.87 69289.47 31398.98 5457.53 6880.06 5221.30 3676.36 1457.96 555.66
143 D 224235.12 120703.20 41326.24 40284.88 76335.82 10376.18 30839.28 2637.69 2303.57 1248.21
143 E 309619.54 113803.11 44488.19 10462.42 21184.23 7944.00 4054.99 1026.97 909.23 1064.39
144 A 278620.50 68206.76 37393.31 40288.84 62947.04 18499.78 28099.70 1439.31 712.43 0.00
144 B 201380.24 74910.36 96187.31 42684.61 98448.32 45207.46 23029.62 3861.68 437.75 1433.29
144 C 258762.70 71200.71 9319.88 63014.88 87099.30 18954.70 27116.02 7515.98 440.56 757.04
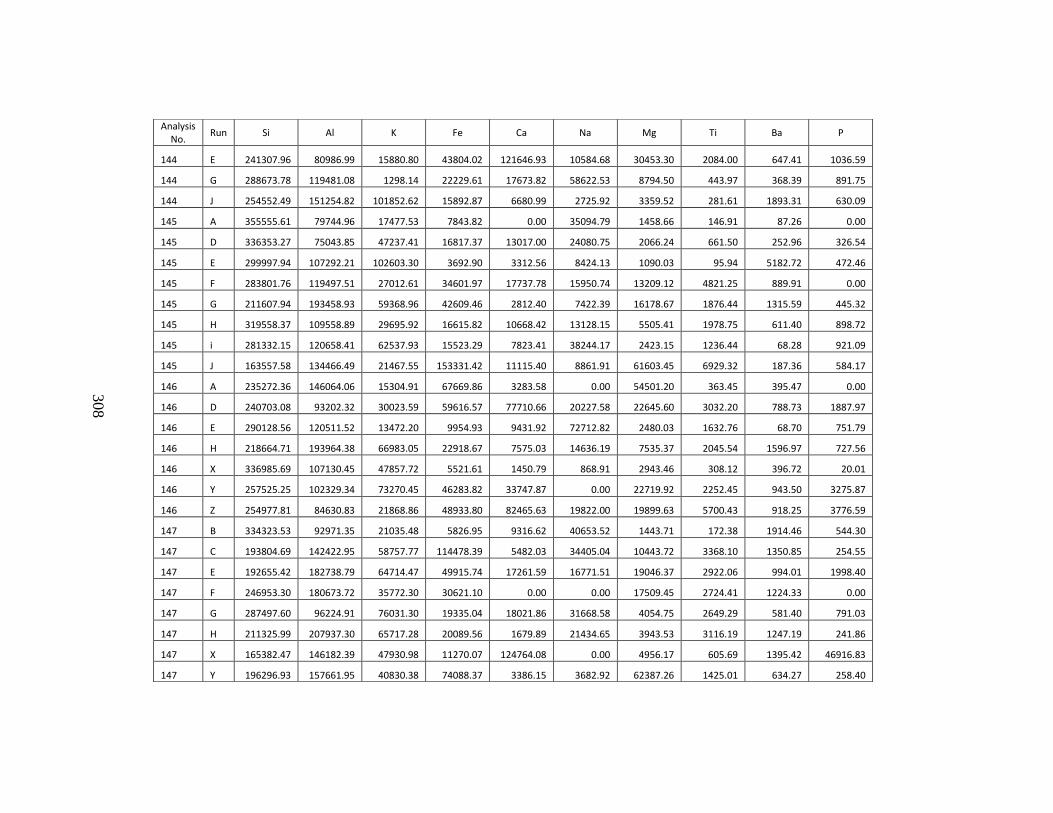
308
Analysis No.
Run Si Al K Fe Ca Na Mg Ti Ba P
144 E 241307.96 80986.99 15880.80 43804.02 121646.93 10584.68 30453.30 2084.00 647.41 1036.59
144 G 288673.78 119481.08 1298.14 22229.61 17673.82 58622.53 8794.50 443.97 368.39 891.75
144 J 254552.49 151254.82 101852.62 15892.87 6680.99 2725.92 3359.52 281.61 1893.31 630.09
145 A 355555.61 79744.96 17477.53 7843.82 0.00 35094.79 1458.66 146.91 87.26 0.00
145 D 336353.27 75043.85 47237.41 16817.37 13017.00 24080.75 2066.24 661.50 252.96 326.54
145 E 299997.94 107292.21 102603.30 3692.90 3312.56 8424.13 1090.03 95.94 5182.72 472.46
145 F 283801.76 119497.51 27012.61 34601.97 17737.78 15950.74 13209.12 4821.25 889.91 0.00
145 G 211607.94 193458.93 59368.96 42609.46 2812.40 7422.39 16178.67 1876.44 1315.59 445.32
145 H 319558.37 109558.89 29695.92 16615.82 10668.42 13128.15 5505.41 1978.75 611.40 898.72
145 i 281332.15 120658.41 62537.93 15523.29 7823.41 38244.17 2423.15 1236.44 68.28 921.09
145 J 163557.58 134466.49 21467.55 153331.42 11115.40 8861.91 61603.45 6929.32 187.36 584.17
146 A 235272.36 146064.06 15304.91 67669.86 3283.58 0.00 54501.20 363.45 395.47 0.00
146 D 240703.08 93202.32 30023.59 59616.57 77710.66 20227.58 22645.60 3032.20 788.73 1887.97
146 E 290128.56 120511.52 13472.20 9954.93 9431.92 72712.82 2480.03 1632.76 68.70 751.79
146 H 218664.71 193964.38 66983.05 22918.67 7575.03 14636.19 7535.37 2045.54 1596.97 727.56
146 X 336985.69 107130.45 47857.72 5521.61 1450.79 868.91 2943.46 308.12 396.72 20.01
146 Y 257525.25 102329.34 73270.45 46283.82 33747.87 0.00 22719.92 2252.45 943.50 3275.87
146 Z 254977.81 84630.83 21868.86 48933.80 82465.63 19822.00 19899.63 5700.43 918.25 3776.59
147 B 334323.53 92971.35 21035.48 5826.95 9316.62 40653.52 1443.71 172.38 1914.46 544.30
147 C 193804.69 142422.95 58757.77 114478.39 5482.03 34405.04 10443.72 3368.10 1350.85 254.55
147 E 192655.42 182738.79 64714.47 49915.74 17261.59 16771.51 19046.37 2922.06 994.01 1998.40
147 F 246953.30 180673.72 35772.30 30621.10 0.00 0.00 17509.45 2724.41 1224.33 0.00
147 G 287497.60 96224.91 76031.30 19335.04 18021.86 31668.58 4054.75 2649.29 581.40 791.03
147 H 211325.99 207937.30 65717.28 20089.56 1679.89 21434.65 3943.53 3116.19 1247.19 241.86
147 X 165382.47 146182.39 47930.98 11270.07 124764.08 0.00 4956.17 605.69 1395.42 46916.83
147 Y 196296.93 157661.95 40830.38 74088.37 3386.15 3682.92 62387.26 1425.01 634.27 258.40
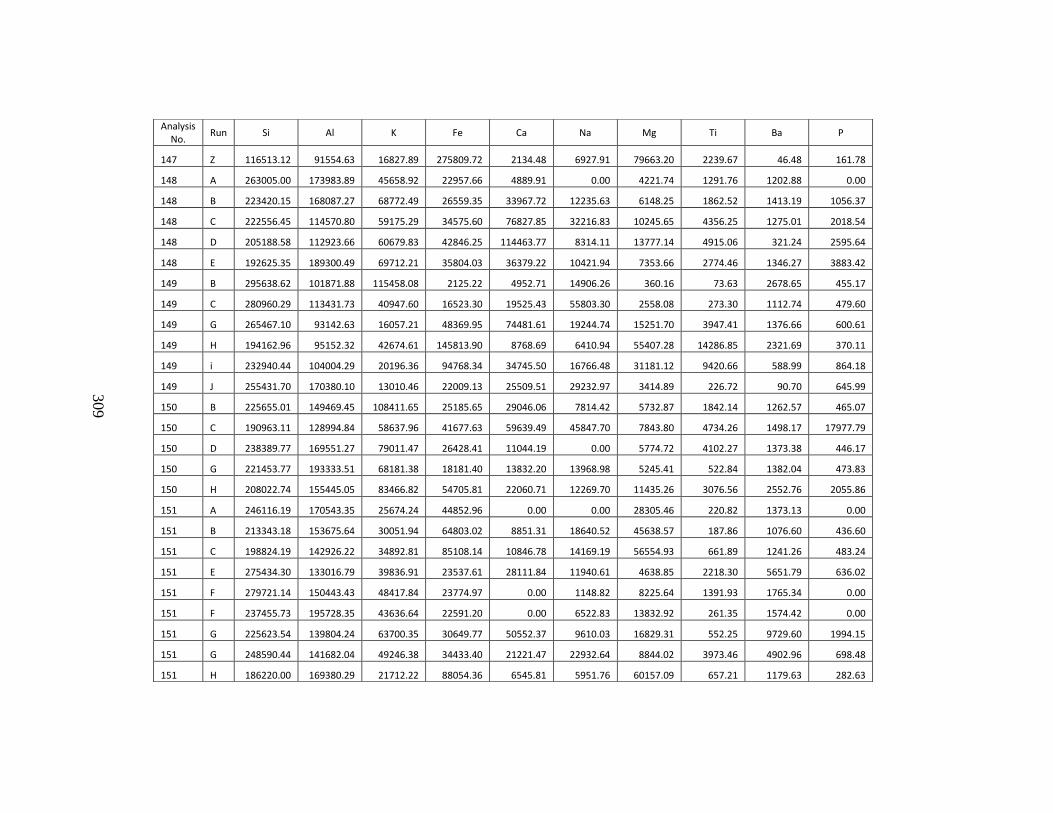
309
Analysis No.
Run Si Al K Fe Ca Na Mg Ti Ba P
147 Z 116513.12 91554.63 16827.89 275809.72 2134.48 6927.91 79663.20 2239.67 46.48 161.78
148 A 263005.00 173983.89 45658.92 22957.66 4889.91 0.00 4221.74 1291.76 1202.88 0.00
148 B 223420.15 168087.27 68772.49 26559.35 33967.72 12235.63 6148.25 1862.52 1413.19 1056.37
148 C 222556.45 114570.80 59175.29 34575.60 76827.85 32216.83 10245.65 4356.25 1275.01 2018.54
148 D 205188.58 112923.66 60679.83 42846.25 114463.77 8314.11 13777.14 4915.06 321.24 2595.64
148 E 192625.35 189300.49 69712.21 35804.03 36379.22 10421.94 7353.66 2774.46 1346.27 3883.42
149 B 295638.62 101871.88 115458.08 2125.22 4952.71 14906.26 360.16 73.63 2678.65 455.17
149 C 280960.29 113431.73 40947.60 16523.30 19525.43 55803.30 2558.08 273.30 1112.74 479.60
149 G 265467.10 93142.63 16057.21 48369.95 74481.61 19244.74 15251.70 3947.41 1376.66 600.61
149 H 194162.96 95152.32 42674.61 145813.90 8768.69 6410.94 55407.28 14286.85 2321.69 370.11
149 i 232940.44 104004.29 20196.36 94768.34 34745.50 16766.48 31181.12 9420.66 588.99 864.18
149 J 255431.70 170380.10 13010.46 22009.13 25509.51 29232.97 3414.89 226.72 90.70 645.99
150 B 225655.01 149469.45 108411.65 25185.65 29046.06 7814.42 5732.87 1842.14 1262.57 465.07
150 C 190963.11 128994.84 58637.96 41677.63 59639.49 45847.70 7843.80 4734.26 1498.17 17977.79
150 D 238389.77 169551.27 79011.47 26428.41 11044.19 0.00 5774.72 4102.27 1373.38 446.17
150 G 221453.77 193333.51 68181.38 18181.40 13832.20 13968.98 5245.41 522.84 1382.04 473.83
150 H 208022.74 155445.05 83466.82 54705.81 22060.71 12269.70 11435.26 3076.56 2552.76 2055.86
151 A 246116.19 170543.35 25674.24 44852.96 0.00 0.00 28305.46 220.82 1373.13 0.00
151 B 213343.18 153675.64 30051.94 64803.02 8851.31 18640.52 45638.57 187.86 1076.60 436.60
151 C 198824.19 142926.22 34892.81 85108.14 10846.78 14169.19 56554.93 661.89 1241.26 483.24
151 E 275434.30 133016.79 39836.91 23537.61 28111.84 11940.61 4638.85 2218.30 5651.79 636.02
151 F 279721.14 150443.43 48417.84 23774.97 0.00 1148.82 8225.64 1391.93 1765.34 0.00
151 F 237455.73 195728.35 43636.64 22591.20 0.00 6522.83 13832.92 261.35 1574.42 0.00
151 G 225623.54 139804.24 63700.35 30649.77 50552.37 9610.03 16829.31 552.25 9729.60 1994.15
151 G 248590.44 141682.04 49246.38 34433.40 21221.47 22932.64 8844.02 3973.46 4902.96 698.48
151 H 186220.00 169380.29 21712.22 88054.36 6545.81 5951.76 60157.09 657.21 1179.63 282.63
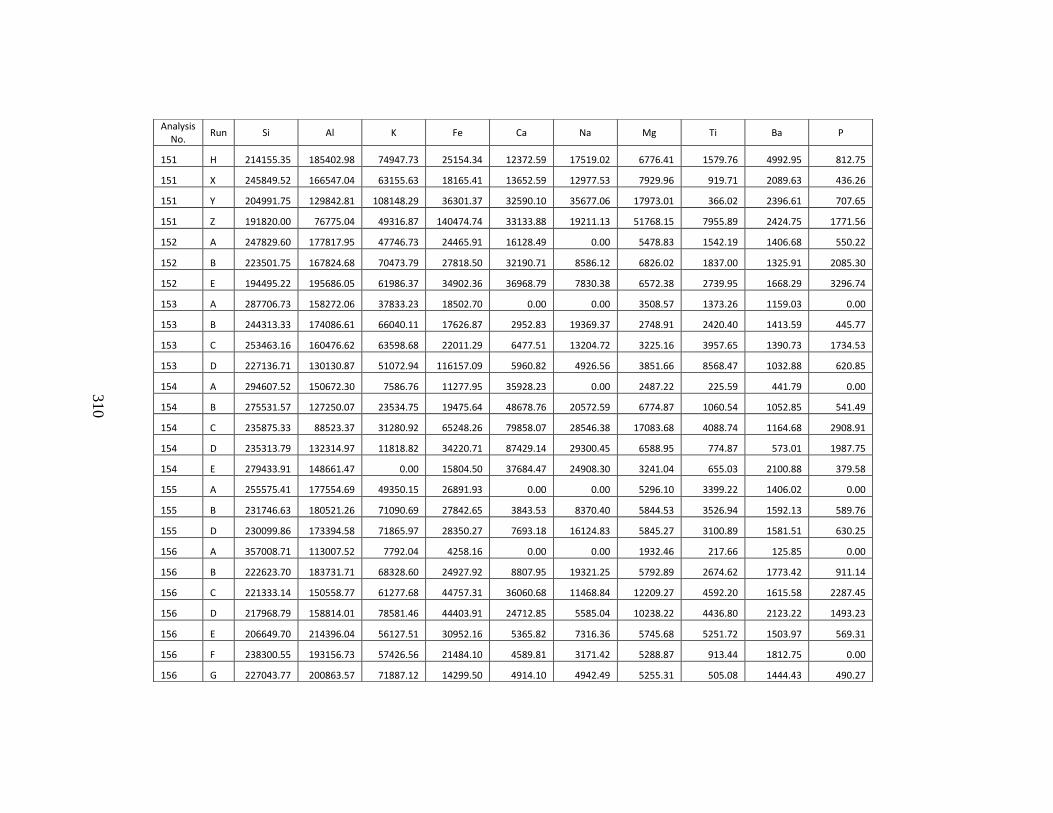
310
Analysis No.
Run Si Al K Fe Ca Na Mg Ti Ba P
151 H 214155.35 185402.98 74947.73 25154.34 12372.59 17519.02 6776.41 1579.76 4992.95 812.75
151 X 245849.52 166547.04 63155.63 18165.41 13652.59 12977.53 7929.96 919.71 2089.63 436.26
151 Y 204991.75 129842.81 108148.29 36301.37 32590.10 35677.06 17973.01 366.02 2396.61 707.65
151 Z 191820.00 76775.04 49316.87 140474.74 33133.88 19211.13 51768.15 7955.89 2424.75 1771.56
152 A 247829.60 177817.95 47746.73 24465.91 16128.49 0.00 5478.83 1542.19 1406.68 550.22
152 B 223501.75 167824.68 70473.79 27818.50 32190.71 8586.12 6826.02 1837.00 1325.91 2085.30
152 E 194495.22 195686.05 61986.37 34902.36 36968.79 7830.38 6572.38 2739.95 1668.29 3296.74
153 A 287706.73 158272.06 37833.23 18502.70 0.00 0.00 3508.57 1373.26 1159.03 0.00
153 B 244313.33 174086.61 66040.11 17626.87 2952.83 19369.37 2748.91 2420.40 1413.59 445.77
153 C 253463.16 160476.62 63598.68 22011.29 6477.51 13204.72 3225.16 3957.65 1390.73 1734.53
153 D 227136.71 130130.87 51072.94 116157.09 5960.82 4926.56 3851.66 8568.47 1032.88 620.85
154 A 294607.52 150672.30 7586.76 11277.95 35928.23 0.00 2487.22 225.59 441.79 0.00
154 B 275531.57 127250.07 23534.75 19475.64 48678.76 20572.59 6774.87 1060.54 1052.85 541.49
154 C 235875.33 88523.37 31280.92 65248.26 79858.07 28546.38 17083.68 4088.74 1164.68 2908.91
154 D 235313.79 132314.97 11818.82 34220.71 87429.14 29300.45 6588.95 774.87 573.01 1987.75
154 E 279433.91 148661.47 0.00 15804.50 37684.47 24908.30 3241.04 655.03 2100.88 379.58
155 A 255575.41 177554.69 49350.15 26891.93 0.00 0.00 5296.10 3399.22 1406.02 0.00
155 B 231746.63 180521.26 71090.69 27842.65 3843.53 8370.40 5844.53 3526.94 1592.13 589.76
155 D 230099.86 173394.58 71865.97 28350.27 7693.18 16124.83 5845.27 3100.89 1581.51 630.25
156 A 357008.71 113007.52 7792.04 4258.16 0.00 0.00 1932.46 217.66 125.85 0.00
156 B 222623.70 183731.71 68328.60 24927.92 8807.95 19321.25 5792.89 2674.62 1773.42 911.14
156 C 221333.14 150558.77 61277.68 44757.31 36060.68 11468.84 12209.27 4592.20 1615.58 2287.45
156 D 217968.79 158814.01 78581.46 44403.91 24712.85 5585.04 10238.22 4436.80 2123.22 1493.23
156 E 206649.70 214396.04 56127.51 30952.16 5365.82 7316.36 5745.68 5251.72 1503.97 569.31
156 F 238300.55 193156.73 57426.56 21484.10 4589.81 3171.42 5288.87 913.44 1812.75 0.00
156 G 227043.77 200863.57 71887.12 14299.50 4914.10 4942.49 5255.31 505.08 1444.43 490.27
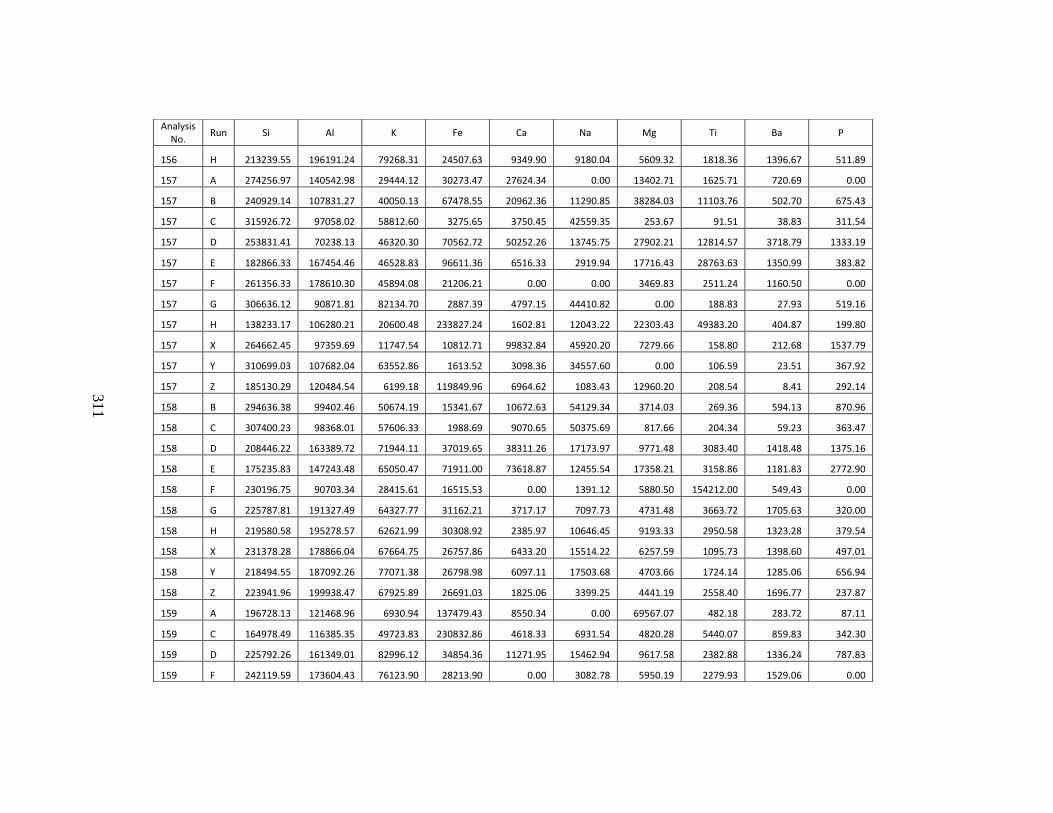
311
Analysis No.
Run Si Al K Fe Ca Na Mg Ti Ba P
156 H 213239.55 196191.24 79268.31 24507.63 9349.90 9180.04 5609.32 1818.36 1396.67 511.89
157 A 274256.97 140542.98 29444.12 30273.47 27624.34 0.00 13402.71 1625.71 720.69 0.00
157 B 240929.14 107831.27 40050.13 67478.55 20962.36 11290.85 38284.03 11103.76 502.70 675.43
157 C 315926.72 97058.02 58812.60 3275.65 3750.45 42559.35 253.67 91.51 38.83 311.54
157 D 253831.41 70238.13 46320.30 70562.72 50252.26 13745.75 27902.21 12814.57 3718.79 1333.19
157 E 182866.33 167454.46 46528.83 96611.36 6516.33 2919.94 17716.43 28763.63 1350.99 383.82
157 F 261356.33 178610.30 45894.08 21206.21 0.00 0.00 3469.83 2511.24 1160.50 0.00
157 G 306636.12 90871.81 82134.70 2887.39 4797.15 44410.82 0.00 188.83 27.93 519.16
157 H 138233.17 106280.21 20600.48 233827.24 1602.81 12043.22 22303.43 49383.20 404.87 199.80
157 X 264662.45 97359.69 11747.54 10812.71 99832.84 45920.20 7279.66 158.80 212.68 1537.79
157 Y 310699.03 107682.04 63552.86 1613.52 3098.36 34557.60 0.00 106.59 23.51 367.92
157 Z 185130.29 120484.54 6199.18 119849.96 6964.62 1083.43 12960.20 208.54 8.41 292.14
158 B 294636.38 99402.46 50674.19 15341.67 10672.63 54129.34 3714.03 269.36 594.13 870.96
158 C 307400.23 98368.01 57606.33 1988.69 9070.65 50375.69 817.66 204.34 59.23 363.47
158 D 208446.22 163389.72 71944.11 37019.65 38311.26 17173.97 9771.48 3083.40 1418.48 1375.16
158 E 175235.83 147243.48 65050.47 71911.00 73618.87 12455.54 17358.21 3158.86 1181.83 2772.90
158 F 230196.75 90703.34 28415.61 16515.53 0.00 1391.12 5880.50 154212.00 549.43 0.00
158 G 225787.81 191327.49 64327.77 31162.21 3717.17 7097.73 4731.48 3663.72 1705.63 320.00
158 H 219580.58 195278.57 62621.99 30308.92 2385.97 10646.45 9193.33 2950.58 1323.28 379.54
158 X 231378.28 178866.04 67664.75 26757.86 6433.20 15514.22 6257.59 1095.73 1398.60 497.01
158 Y 218494.55 187092.26 77071.38 26798.98 6097.11 17503.68 4703.66 1724.14 1285.06 656.94
158 Z 223941.96 199938.47 67925.89 26691.03 1825.06 3399.25 4441.19 2558.40 1696.77 237.87
159 A 196728.13 121468.96 6930.94 137479.43 8550.34 0.00 69567.07 482.18 283.72 87.11
159 C 164978.49 116385.35 49723.83 230832.86 4618.33 6931.54 4820.28 5440.07 859.83 342.30
159 D 225792.26 161349.01 82996.12 34854.36 11271.95 15462.94 9617.58 2382.88 1336.24 787.83
159 F 242119.59 173604.43 76123.90 28213.90 0.00 3082.78 5950.19 2279.93 1529.06 0.00
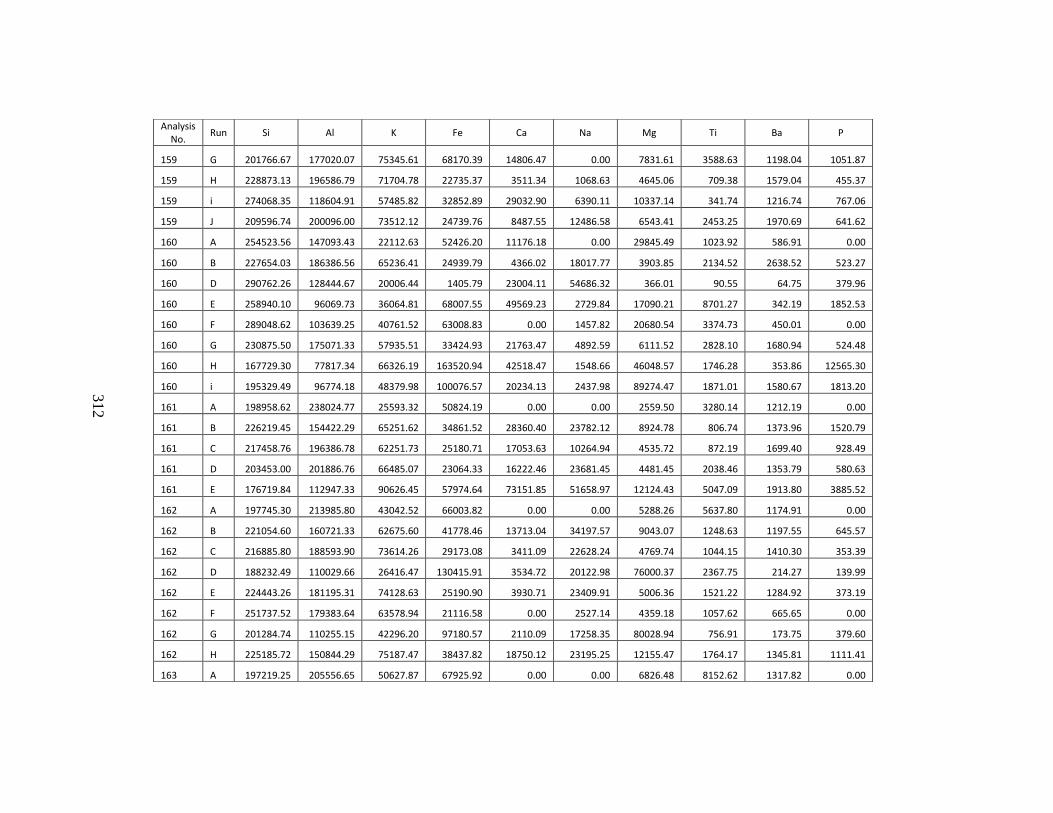
312
Analysis No.
Run Si Al K Fe Ca Na Mg Ti Ba P
159 G 201766.67 177020.07 75345.61 68170.39 14806.47 0.00 7831.61 3588.63 1198.04 1051.87
159 H 228873.13 196586.79 71704.78 22735.37 3511.34 1068.63 4645.06 709.38 1579.04 455.37
159 i 274068.35 118604.91 57485.82 32852.89 29032.90 6390.11 10337.14 341.74 1216.74 767.06
159 J 209596.74 200096.00 73512.12 24739.76 8487.55 12486.58 6543.41 2453.25 1970.69 641.62
160 A 254523.56 147093.43 22112.63 52426.20 11176.18 0.00 29845.49 1023.92 586.91 0.00
160 B 227654.03 186386.56 65236.41 24939.79 4366.02 18017.77 3903.85 2134.52 2638.52 523.27
160 D 290762.26 128444.67 20006.44 1405.79 23004.11 54686.32 366.01 90.55 64.75 379.96
160 E 258940.10 96069.73 36064.81 68007.55 49569.23 2729.84 17090.21 8701.27 342.19 1852.53
160 F 289048.62 103639.25 40761.52 63008.83 0.00 1457.82 20680.54 3374.73 450.01 0.00
160 G 230875.50 175071.33 57935.51 33424.93 21763.47 4892.59 6111.52 2828.10 1680.94 524.48
160 H 167729.30 77817.34 66326.19 163520.94 42518.47 1548.66 46048.57 1746.28 353.86 12565.30
160 i 195329.49 96774.18 48379.98 100076.57 20234.13 2437.98 89274.47 1871.01 1580.67 1813.20
161 A 198958.62 238024.77 25593.32 50824.19 0.00 0.00 2559.50 3280.14 1212.19 0.00
161 B 226219.45 154422.29 65251.62 34861.52 28360.40 23782.12 8924.78 806.74 1373.96 1520.79
161 C 217458.76 196386.78 62251.73 25180.71 17053.63 10264.94 4535.72 872.19 1699.40 928.49
161 D 203453.00 201886.76 66485.07 23064.33 16222.46 23681.45 4481.45 2038.46 1353.79 580.63
161 E 176719.84 112947.33 90626.45 57974.64 73151.85 51658.97 12124.43 5047.09 1913.80 3885.52
162 A 197745.30 213985.80 43042.52 66003.82 0.00 0.00 5288.26 5637.80 1174.91 0.00
162 B 221054.60 160721.33 62675.60 41778.46 13713.04 34197.57 9043.07 1248.63 1197.55 645.57
162 C 216885.80 188593.90 73614.26 29173.08 3411.09 22628.24 4769.74 1044.15 1410.30 353.39
162 D 188232.49 110029.66 26416.47 130415.91 3534.72 20122.98 76000.37 2367.75 214.27 139.99
162 E 224443.26 181195.31 74128.63 25190.90 3930.71 23409.91 5006.36 1521.22 1284.92 373.19
162 F 251737.52 179383.64 63578.94 21116.58 0.00 2527.14 4359.18 1057.62 665.65 0.00
162 G 201284.74 110255.15 42296.20 97180.57 2110.09 17258.35 80028.94 756.91 173.75 379.60
162 H 225185.72 150844.29 75187.47 38437.82 18750.12 23195.25 12155.47 1764.17 1345.81 1111.41
163 A 197219.25 205556.65 50627.87 67925.92 0.00 0.00 6826.48 8152.62 1317.82 0.00
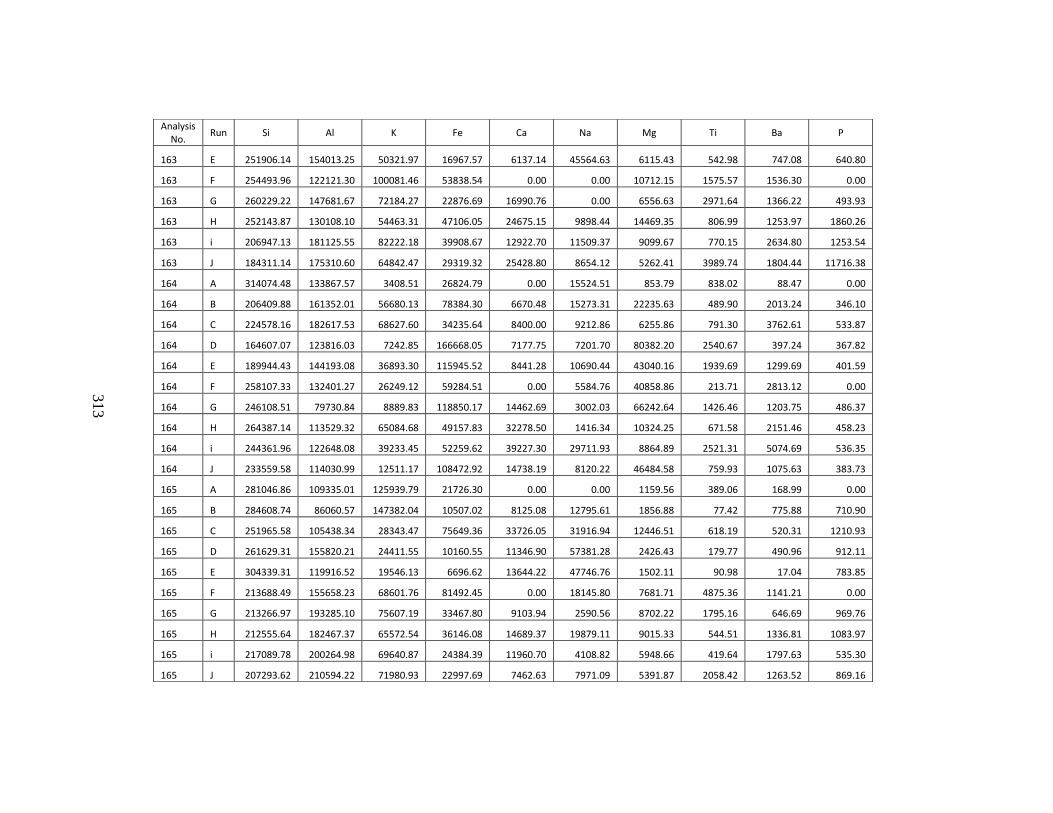
313
Analysis No.
Run Si Al K Fe Ca Na Mg Ti Ba P
163 E 251906.14 154013.25 50321.97 16967.57 6137.14 45564.63 6115.43 542.98 747.08 640.80
163 F 254493.96 122121.30 100081.46 53838.54 0.00 0.00 10712.15 1575.57 1536.30 0.00
163 G 260229.22 147681.67 72184.27 22876.69 16990.76 0.00 6556.63 2971.64 1366.22 493.93
163 H 252143.87 130108.10 54463.31 47106.05 24675.15 9898.44 14469.35 806.99 1253.97 1860.26
163 i 206947.13 181125.55 82222.18 39908.67 12922.70 11509.37 9099.67 770.15 2634.80 1253.54
163 J 184311.14 175310.60 64842.47 29319.32 25428.80 8654.12 5262.41 3989.74 1804.44 11716.38
164 A 314074.48 133867.57 3408.51 26824.79 0.00 15524.51 853.79 838.02 88.47 0.00
164 B 206409.88 161352.01 56680.13 78384.30 6670.48 15273.31 22235.63 489.90 2013.24 346.10
164 C 224578.16 182617.53 68627.60 34235.64 8400.00 9212.86 6255.86 791.30 3762.61 533.87
164 D 164607.07 123816.03 7242.85 166668.05 7177.75 7201.70 80382.20 2540.67 397.24 367.82
164 E 189944.43 144193.08 36893.30 115945.52 8441.28 10690.44 43040.16 1939.69 1299.69 401.59
164 F 258107.33 132401.27 26249.12 59284.51 0.00 5584.76 40858.86 213.71 2813.12 0.00
164 G 246108.51 79730.84 8889.83 118850.17 14462.69 3002.03 66242.64 1426.46 1203.75 486.37
164 H 264387.14 113529.32 65084.68 49157.83 32278.50 1416.34 10324.25 671.58 2151.46 458.23
164 i 244361.96 122648.08 39233.45 52259.62 39227.30 29711.93 8864.89 2521.31 5074.69 536.35
164 J 233559.58 114030.99 12511.17 108472.92 14738.19 8120.22 46484.58 759.93 1075.63 383.73
165 A 281046.86 109335.01 125939.79 21726.30 0.00 0.00 1159.56 389.06 168.99 0.00
165 B 284608.74 86060.57 147382.04 10507.02 8125.08 12795.61 1856.88 77.42 775.88 710.90
165 C 251965.58 105438.34 28343.47 75649.36 33726.05 31916.94 12446.51 618.19 520.31 1210.93
165 D 261629.31 155820.21 24411.55 10160.55 11346.90 57381.28 2426.43 179.77 490.96 912.11
165 E 304339.31 119916.52 19546.13 6696.62 13644.22 47746.76 1502.11 90.98 17.04 783.85
165 F 213688.49 155658.23 68601.76 81492.45 0.00 18145.80 7681.71 4875.36 1141.21 0.00
165 G 213266.97 193285.10 75607.19 33467.80 9103.94 2590.56 8702.22 1795.16 646.69 969.76
165 H 212555.64 182467.37 65572.54 36146.08 14689.37 19879.11 9015.33 544.51 1336.81 1083.97
165 i 217089.78 200264.98 69640.87 24384.39 11960.70 4108.82 5948.66 419.64 1797.63 535.30
165 J 207293.62 210594.22 71980.93 22997.69 7462.63 7971.09 5391.87 2058.42 1263.52 869.16
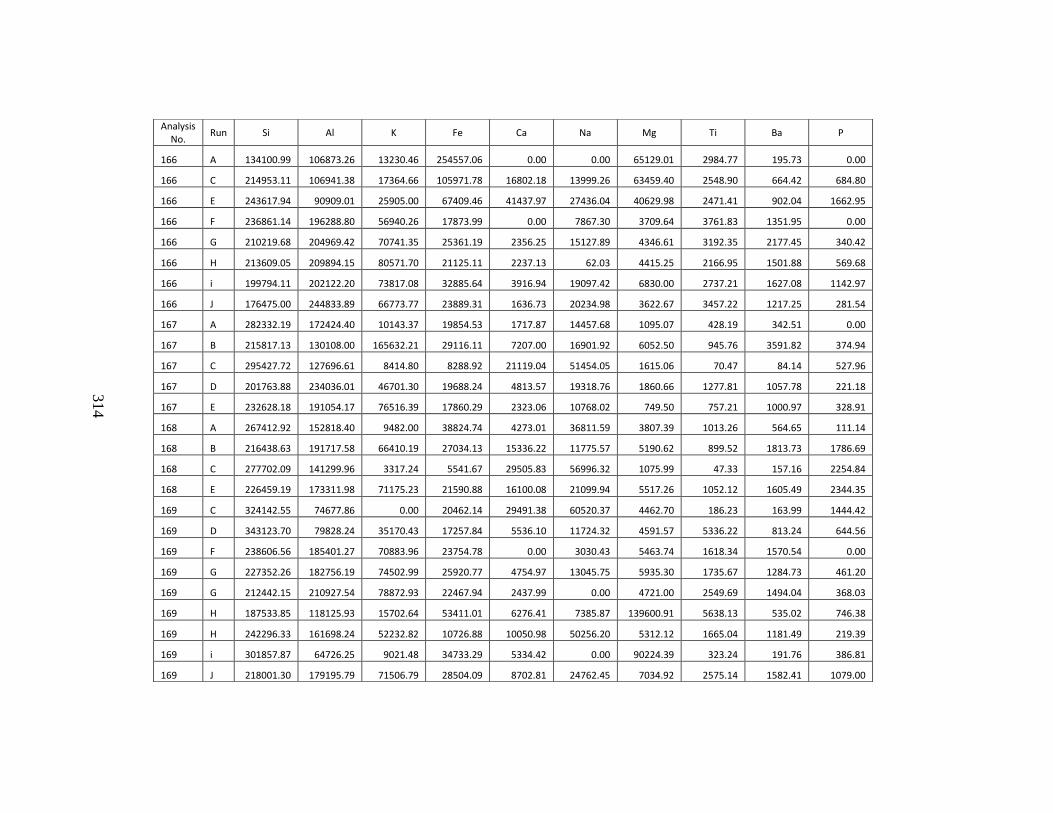
314
Analysis No.
Run Si Al K Fe Ca Na Mg Ti Ba P
166 A 134100.99 106873.26 13230.46 254557.06 0.00 0.00 65129.01 2984.77 195.73 0.00
166 C 214953.11 106941.38 17364.66 105971.78 16802.18 13999.26 63459.40 2548.90 664.42 684.80
166 E 243617.94 90909.01 25905.00 67409.46 41437.97 27436.04 40629.98 2471.41 902.04 1662.95
166 F 236861.14 196288.80 56940.26 17873.99 0.00 7867.30 3709.64 3761.83 1351.95 0.00
166 G 210219.68 204969.42 70741.35 25361.19 2356.25 15127.89 4346.61 3192.35 2177.45 340.42
166 H 213609.05 209894.15 80571.70 21125.11 2237.13 62.03 4415.25 2166.95 1501.88 569.68
166 i 199794.11 202122.20 73817.08 32885.64 3916.94 19097.42 6830.00 2737.21 1627.08 1142.97
166 J 176475.00 244833.89 66773.77 23889.31 1636.73 20234.98 3622.67 3457.22 1217.25 281.54
167 A 282332.19 172424.40 10143.37 19854.53 1717.87 14457.68 1095.07 428.19 342.51 0.00
167 B 215817.13 130108.00 165632.21 29116.11 7207.00 16901.92 6052.50 945.76 3591.82 374.94
167 C 295427.72 127696.61 8414.80 8288.92 21119.04 51454.05 1615.06 70.47 84.14 527.96
167 D 201763.88 234036.01 46701.30 19688.24 4813.57 19318.76 1860.66 1277.81 1057.78 221.18
167 E 232628.18 191054.17 76516.39 17860.29 2323.06 10768.02 749.50 757.21 1000.97 328.91
168 A 267412.92 152818.40 9482.00 38824.74 4273.01 36811.59 3807.39 1013.26 564.65 111.14
168 B 216438.63 191717.58 66410.19 27034.13 15336.22 11775.57 5190.62 899.52 1813.73 1786.69
168 C 277702.09 141299.96 3317.24 5541.67 29505.83 56996.32 1075.99 47.33 157.16 2254.84
168 E 226459.19 173311.98 71175.23 21590.88 16100.08 21099.94 5517.26 1052.12 1605.49 2344.35
169 C 324142.55 74677.86 0.00 20462.14 29491.38 60520.37 4462.70 186.23 163.99 1444.42
169 D 343123.70 79828.24 35170.43 17257.84 5536.10 11724.32 4591.57 5336.22 813.24 644.56
169 F 238606.56 185401.27 70883.96 23754.78 0.00 3030.43 5463.74 1618.34 1570.54 0.00
169 G 227352.26 182756.19 74502.99 25920.77 4754.97 13045.75 5935.30 1735.67 1284.73 461.20
169 G 212442.15 210927.54 78872.93 22467.94 2437.99 0.00 4721.00 2549.69 1494.04 368.03
169 H 187533.85 118125.93 15702.64 53411.01 6276.41 7385.87 139600.91 5638.13 535.02 746.38
169 H 242296.33 161698.24 52232.82 10726.88 10050.98 50256.20 5312.12 1665.04 1181.49 219.39
169 i 301857.87 64726.25 9021.48 34733.29 5334.42 0.00 90224.39 323.24 191.76 386.81
169 J 218001.30 179195.79 71506.79 28504.09 8702.81 24762.45 7034.92 2575.14 1582.41 1079.00
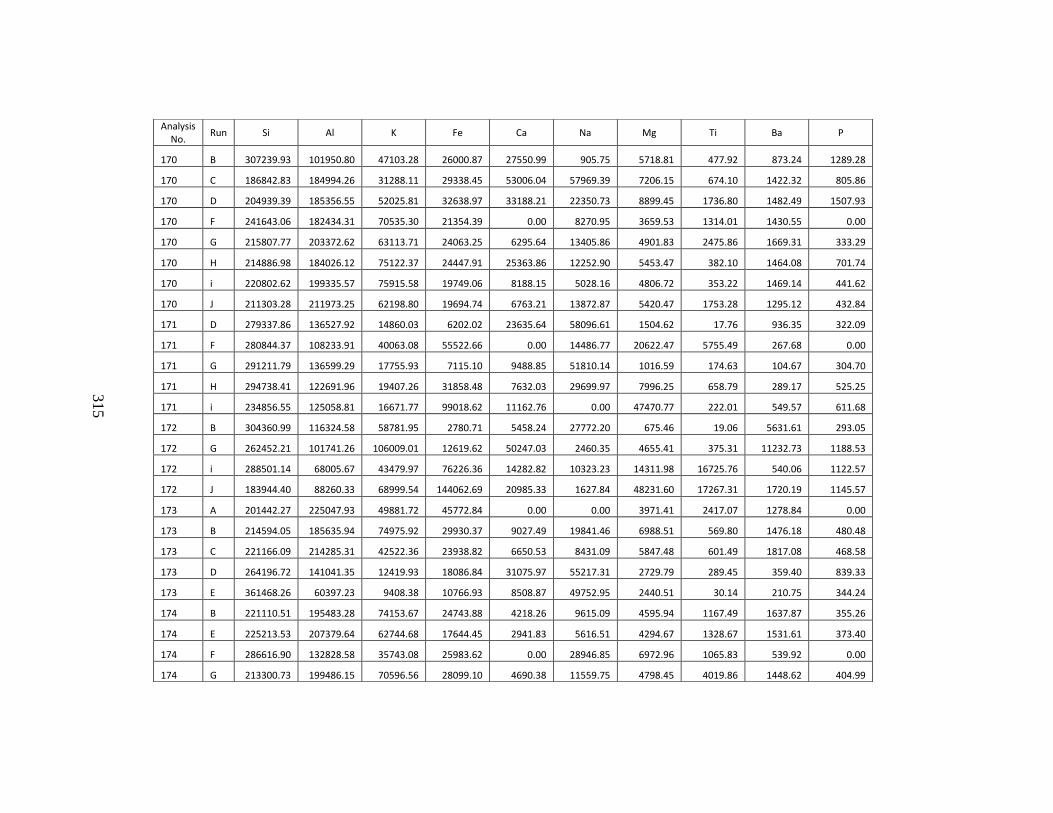
315
Analysis No.
Run Si Al K Fe Ca Na Mg Ti Ba P
170 B 307239.93 101950.80 47103.28 26000.87 27550.99 905.75 5718.81 477.92 873.24 1289.28
170 C 186842.83 184994.26 31288.11 29338.45 53006.04 57969.39 7206.15 674.10 1422.32 805.86
170 D 204939.39 185356.55 52025.81 32638.97 33188.21 22350.73 8899.45 1736.80 1482.49 1507.93
170 F 241643.06 182434.31 70535.30 21354.39 0.00 8270.95 3659.53 1314.01 1430.55 0.00
170 G 215807.77 203372.62 63113.71 24063.25 6295.64 13405.86 4901.83 2475.86 1669.31 333.29
170 H 214886.98 184026.12 75122.37 24447.91 25363.86 12252.90 5453.47 382.10 1464.08 701.74
170 i 220802.62 199335.57 75915.58 19749.06 8188.15 5028.16 4806.72 353.22 1469.14 441.62
170 J 211303.28 211973.25 62198.80 19694.74 6763.21 13872.87 5420.47 1753.28 1295.12 432.84
171 D 279337.86 136527.92 14860.03 6202.02 23635.64 58096.61 1504.62 17.76 936.35 322.09
171 F 280844.37 108233.91 40063.08 55522.66 0.00 14486.77 20622.47 5755.49 267.68 0.00
171 G 291211.79 136599.29 17755.93 7115.10 9488.85 51810.14 1016.59 174.63 104.67 304.70
171 H 294738.41 122691.96 19407.26 31858.48 7632.03 29699.97 7996.25 658.79 289.17 525.25
171 i 234856.55 125058.81 16671.77 99018.62 11162.76 0.00 47470.77 222.01 549.57 611.68
172 B 304360.99 116324.58 58781.95 2780.71 5458.24 27772.20 675.46 19.06 5631.61 293.05
172 G 262452.21 101741.26 106009.01 12619.62 50247.03 2460.35 4655.41 375.31 11232.73 1188.53
172 i 288501.14 68005.67 43479.97 76226.36 14282.82 10323.23 14311.98 16725.76 540.06 1122.57
172 J 183944.40 88260.33 68999.54 144062.69 20985.33 1627.84 48231.60 17267.31 1720.19 1145.57
173 A 201442.27 225047.93 49881.72 45772.84 0.00 0.00 3971.41 2417.07 1278.84 0.00
173 B 214594.05 185635.94 74975.92 29930.37 9027.49 19841.46 6988.51 569.80 1476.18 480.48
173 C 221166.09 214285.31 42522.36 23938.82 6650.53 8431.09 5847.48 601.49 1817.08 468.58
173 D 264196.72 141041.35 12419.93 18086.84 31075.97 55217.31 2729.79 289.45 359.40 839.33
173 E 361468.26 60397.23 9408.38 10766.93 8508.87 49752.95 2440.51 30.14 210.75 344.24
174 B 221110.51 195483.28 74153.67 24743.88 4218.26 9615.09 4595.94 1167.49 1637.87 355.26
174 E 225213.53 207379.64 62744.68 17644.45 2941.83 5616.51 4294.67 1328.67 1531.61 373.40
174 F 286616.90 132828.58 35743.08 25983.62 0.00 28946.85 6972.96 1065.83 539.92 0.00
174 G 213300.73 199486.15 70596.56 28099.10 4690.38 11559.75 4798.45 4019.86 1448.62 404.99
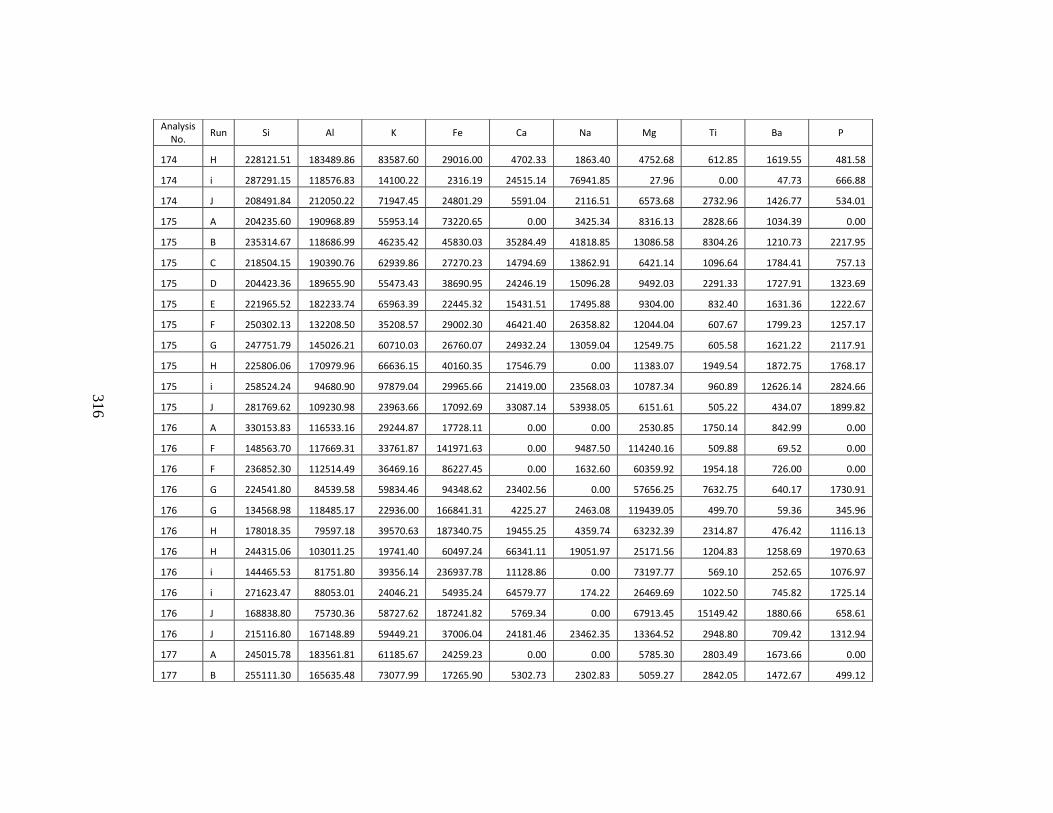
316
Analysis No.
Run Si Al K Fe Ca Na Mg Ti Ba P
174 H 228121.51 183489.86 83587.60 29016.00 4702.33 1863.40 4752.68 612.85 1619.55 481.58
174 i 287291.15 118576.83 14100.22 2316.19 24515.14 76941.85 27.96 0.00 47.73 666.88
174 J 208491.84 212050.22 71947.45 24801.29 5591.04 2116.51 6573.68 2732.96 1426.77 534.01
175 A 204235.60 190968.89 55953.14 73220.65 0.00 3425.34 8316.13 2828.66 1034.39 0.00
175 B 235314.67 118686.99 46235.42 45830.03 35284.49 41818.85 13086.58 8304.26 1210.73 2217.95
175 C 218504.15 190390.76 62939.86 27270.23 14794.69 13862.91 6421.14 1096.64 1784.41 757.13
175 D 204423.36 189655.90 55473.43 38690.95 24246.19 15096.28 9492.03 2291.33 1727.91 1323.69
175 E 221965.52 182233.74 65963.39 22445.32 15431.51 17495.88 9304.00 832.40 1631.36 1222.67
175 F 250302.13 132208.50 35208.57 29002.30 46421.40 26358.82 12044.04 607.67 1799.23 1257.17
175 G 247751.79 145026.21 60710.03 26760.07 24932.24 13059.04 12549.75 605.58 1621.22 2117.91
175 H 225806.06 170979.96 66636.15 40160.35 17546.79 0.00 11383.07 1949.54 1872.75 1768.17
175 i 258524.24 94680.90 97879.04 29965.66 21419.00 23568.03 10787.34 960.89 12626.14 2824.66
175 J 281769.62 109230.98 23963.66 17092.69 33087.14 53938.05 6151.61 505.22 434.07 1899.82
176 A 330153.83 116533.16 29244.87 17728.11 0.00 0.00 2530.85 1750.14 842.99 0.00
176 F 148563.70 117669.31 33761.87 141971.63 0.00 9487.50 114240.16 509.88 69.52 0.00
176 F 236852.30 112514.49 36469.16 86227.45 0.00 1632.60 60359.92 1954.18 726.00 0.00
176 G 224541.80 84539.58 59834.46 94348.62 23402.56 0.00 57656.25 7632.75 640.17 1730.91
176 G 134568.98 118485.17 22936.00 166841.31 4225.27 2463.08 119439.05 499.70 59.36 345.96
176 H 178018.35 79597.18 39570.63 187340.75 19455.25 4359.74 63232.39 2314.87 476.42 1116.13
176 H 244315.06 103011.25 19741.40 60497.24 66341.11 19051.97 25171.56 1204.83 1258.69 1970.63
176 i 144465.53 81751.80 39356.14 236937.78 11128.86 0.00 73197.77 569.10 252.65 1076.97
176 i 271623.47 88053.01 24046.21 54935.24 64579.77 174.22 26469.69 1022.50 745.82 1725.14
176 J 168838.80 75730.36 58727.62 187241.82 5769.34 0.00 67913.45 15149.42 1880.66 658.61
176 J 215116.80 167148.89 59449.21 37006.04 24181.46 23462.35 13364.52 2948.80 709.42 1312.94
177 A 245015.78 183561.81 61185.67 24259.23 0.00 0.00 5785.30 2803.49 1673.66 0.00
177 B 255111.30 165635.48 73077.99 17265.90 5302.73 2302.83 5059.27 2842.05 1472.67 499.12
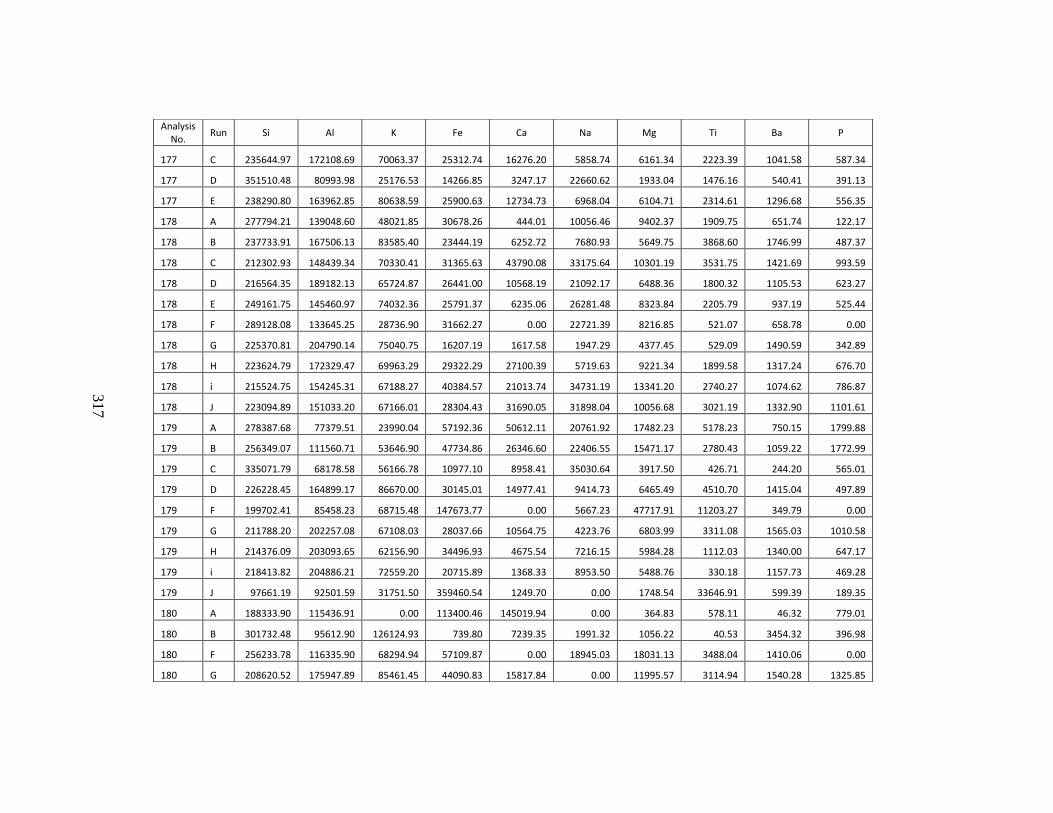
317
Analysis No.
Run Si Al K Fe Ca Na Mg Ti Ba P
177 C 235644.97 172108.69 70063.37 25312.74 16276.20 5858.74 6161.34 2223.39 1041.58 587.34
177 D 351510.48 80993.98 25176.53 14266.85 3247.17 22660.62 1933.04 1476.16 540.41 391.13
177 E 238290.80 163962.85 80638.59 25900.63 12734.73 6968.04 6104.71 2314.61 1296.68 556.35
178 A 277794.21 139048.60 48021.85 30678.26 444.01 10056.46 9402.37 1909.75 651.74 122.17
178 B 237733.91 167506.13 83585.40 23444.19 6252.72 7680.93 5649.75 3868.60 1746.99 487.37
178 C 212302.93 148439.34 70330.41 31365.63 43790.08 33175.64 10301.19 3531.75 1421.69 993.59
178 D 216564.35 189182.13 65724.87 26441.00 10568.19 21092.17 6488.36 1800.32 1105.53 623.27
178 E 249161.75 145460.97 74032.36 25791.37 6235.06 26281.48 8323.84 2205.79 937.19 525.44
178 F 289128.08 133645.25 28736.90 31662.27 0.00 22721.39 8216.85 521.07 658.78 0.00
178 G 225370.81 204790.14 75040.75 16207.19 1617.58 1947.29 4377.45 529.09 1490.59 342.89
178 H 223624.79 172329.47 69963.29 29322.29 27100.39 5719.63 9221.34 1899.58 1317.24 676.70
178 i 215524.75 154245.31 67188.27 40384.57 21013.74 34731.19 13341.20 2740.27 1074.62 786.87
178 J 223094.89 151033.20 67166.01 28304.43 31690.05 31898.04 10056.68 3021.19 1332.90 1101.61
179 A 278387.68 77379.51 23990.04 57192.36 50612.11 20761.92 17482.23 5178.23 750.15 1799.88
179 B 256349.07 111560.71 53646.90 47734.86 26346.60 22406.55 15471.17 2780.43 1059.22 1772.99
179 C 335071.79 68178.58 56166.78 10977.10 8958.41 35030.64 3917.50 426.71 244.20 565.01
179 D 226228.45 164899.17 86670.00 30145.01 14977.41 9414.73 6465.49 4510.70 1415.04 497.89
179 F 199702.41 85458.23 68715.48 147673.77 0.00 5667.23 47717.91 11203.27 349.79 0.00
179 G 211788.20 202257.08 67108.03 28037.66 10564.75 4223.76 6803.99 3311.08 1565.03 1010.58
179 H 214376.09 203093.65 62156.90 34496.93 4675.54 7216.15 5984.28 1112.03 1340.00 647.17
179 i 218413.82 204886.21 72559.20 20715.89 1368.33 8953.50 5488.76 330.18 1157.73 469.28
179 J 97661.19 92501.59 31751.50 359460.54 1249.70 0.00 1748.54 33646.91 599.39 189.35
180 A 188333.90 115436.91 0.00 113400.46 145019.94 0.00 364.83 578.11 46.32 779.01
180 B 301732.48 95612.90 126124.93 739.80 7239.35 1991.32 1056.22 40.53 3454.32 396.98
180 F 256233.78 116335.90 68294.94 57109.87 0.00 18945.03 18031.13 3488.04 1410.06 0.00
180 G 208620.52 175947.89 85461.45 44090.83 15817.84 0.00 11995.57 3114.94 1540.28 1325.85
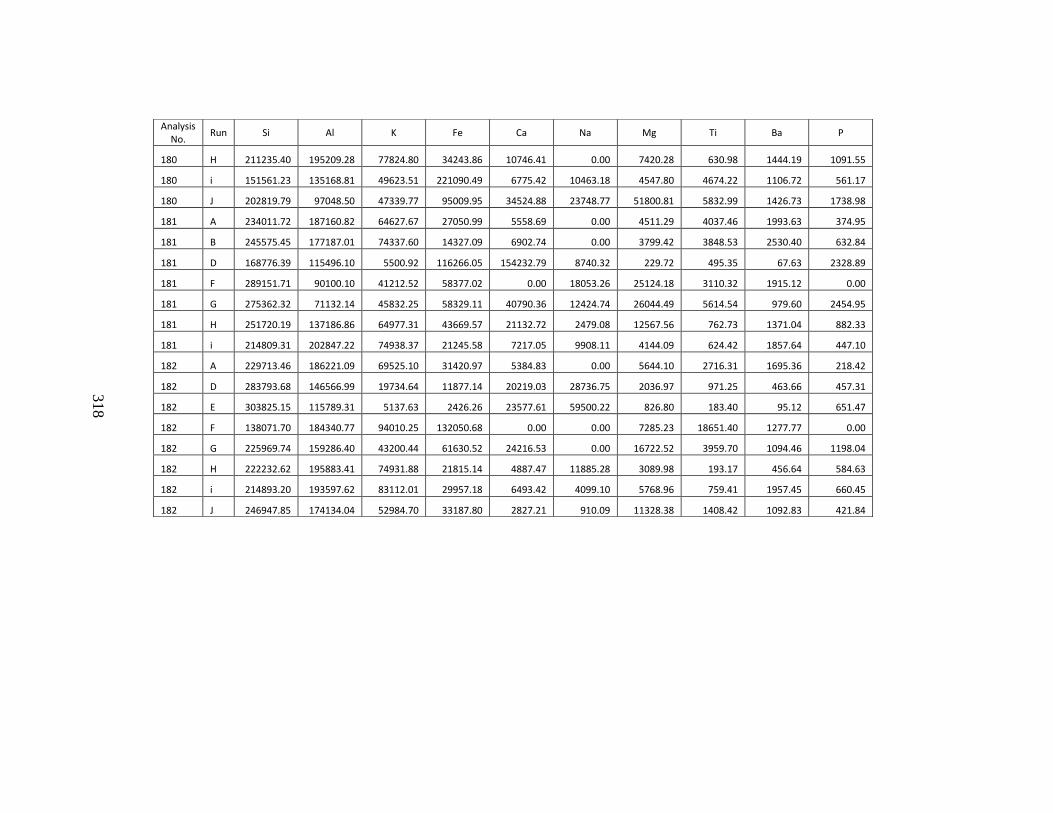
318
Analysis No.
Run Si Al K Fe Ca Na Mg Ti Ba P
180 H 211235.40 195209.28 77824.80 34243.86 10746.41 0.00 7420.28 630.98 1444.19 1091.55
180 i 151561.23 135168.81 49623.51 221090.49 6775.42 10463.18 4547.80 4674.22 1106.72 561.17
180 J 202819.79 97048.50 47339.77 95009.95 34524.88 23748.77 51800.81 5832.99 1426.73 1738.98
181 A 234011.72 187160.82 64627.67 27050.99 5558.69 0.00 4511.29 4037.46 1993.63 374.95
181 B 245575.45 177187.01 74337.60 14327.09 6902.74 0.00 3799.42 3848.53 2530.40 632.84
181 D 168776.39 115496.10 5500.92 116266.05 154232.79 8740.32 229.72 495.35 67.63 2328.89
181 F 289151.71 90100.10 41212.52 58377.02 0.00 18053.26 25124.18 3110.32 1915.12 0.00
181 G 275362.32 71132.14 45832.25 58329.11 40790.36 12424.74 26044.49 5614.54 979.60 2454.95
181 H 251720.19 137186.86 64977.31 43669.57 21132.72 2479.08 12567.56 762.73 1371.04 882.33
181 i 214809.31 202847.22 74938.37 21245.58 7217.05 9908.11 4144.09 624.42 1857.64 447.10
182 A 229713.46 186221.09 69525.10 31420.97 5384.83 0.00 5644.10 2716.31 1695.36 218.42
182 D 283793.68 146566.99 19734.64 11877.14 20219.03 28736.75 2036.97 971.25 463.66 457.31
182 E 303825.15 115789.31 5137.63 2426.26 23577.61 59500.22 826.80 183.40 95.12 651.47
182 F 138071.70 184340.77 94010.25 132050.68 0.00 0.00 7285.23 18651.40 1277.77 0.00
182 G 225969.74 159286.40 43200.44 61630.52 24216.53 0.00 16722.52 3959.70 1094.46 1198.04
182 H 222232.62 195883.41 74931.88 21815.14 4887.47 11885.28 3089.98 193.17 456.64 584.63
182 i 214893.20 193597.62 83112.01 29957.18 6493.42 4099.10 5768.96 759.41 1957.45 660.45
182 J 246947.85 174134.04 52984.70 33187.80 2827.21 910.09 11328.38 1408.42 1092.83 421.84
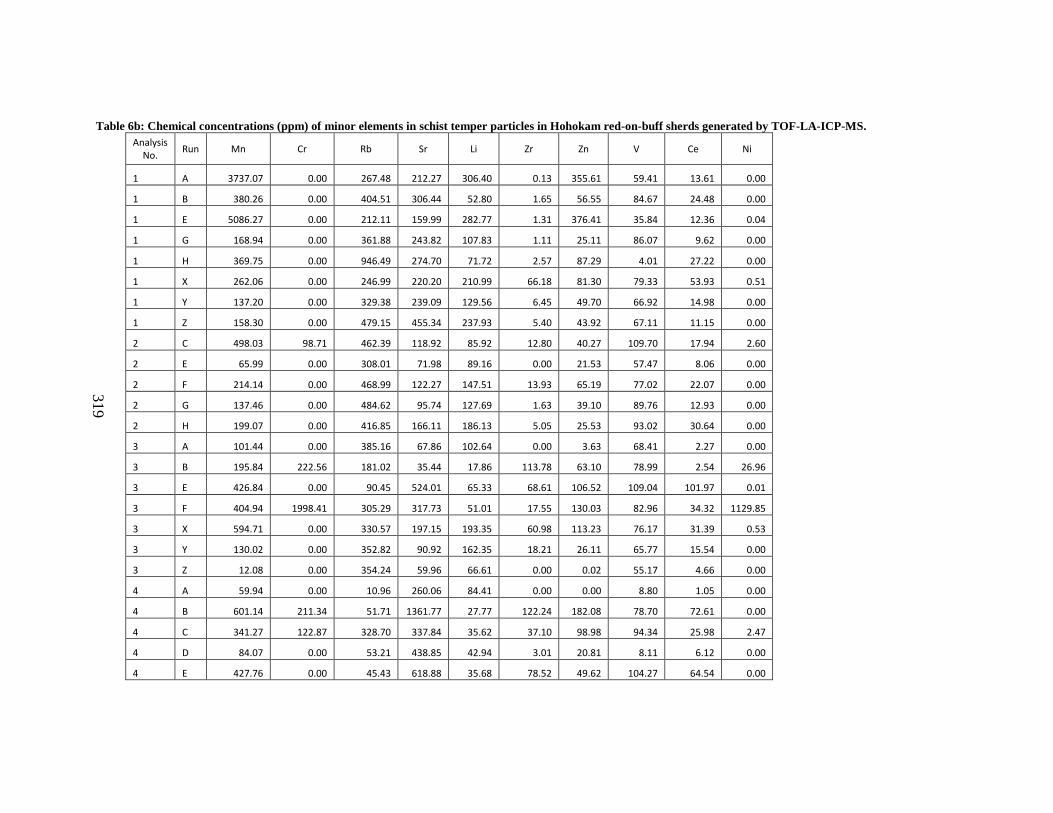
319
Table 6b: Chemical concentrations (ppm) of minor elements in schist temper particles in Hohokam red-on-buff sherds generated by TOF-LA-ICP-MS. Analysis
No. Run Mn Cr Rb Sr Li Zr Zn V Ce Ni
1 A 3737.07 0.00 267.48 212.27 306.40 0.13 355.61 59.41 13.61 0.00
1 B 380.26 0.00 404.51 306.44 52.80 1.65 56.55 84.67 24.48 0.00
1 E 5086.27 0.00 212.11 159.99 282.77 1.31 376.41 35.84 12.36 0.04
1 G 168.94 0.00 361.88 243.82 107.83 1.11 25.11 86.07 9.62 0.00
1 H 369.75 0.00 946.49 274.70 71.72 2.57 87.29 4.01 27.22 0.00
1 X 262.06 0.00 246.99 220.20 210.99 66.18 81.30 79.33 53.93 0.51
1 Y 137.20 0.00 329.38 239.09 129.56 6.45 49.70 66.92 14.98 0.00
1 Z 158.30 0.00 479.15 455.34 237.93 5.40 43.92 67.11 11.15 0.00
2 C 498.03 98.71 462.39 118.92 85.92 12.80 40.27 109.70 17.94 2.60
2 E 65.99 0.00 308.01 71.98 89.16 0.00 21.53 57.47 8.06 0.00
2 F 214.14 0.00 468.99 122.27 147.51 13.93 65.19 77.02 22.07 0.00
2 G 137.46 0.00 484.62 95.74 127.69 1.63 39.10 89.76 12.93 0.00
2 H 199.07 0.00 416.85 166.11 186.13 5.05 25.53 93.02 30.64 0.00
3 A 101.44 0.00 385.16 67.86 102.64 0.00 3.63 68.41 2.27 0.00
3 B 195.84 222.56 181.02 35.44 17.86 113.78 63.10 78.99 2.54 26.96
3 E 426.84 0.00 90.45 524.01 65.33 68.61 106.52 109.04 101.97 0.01
3 F 404.94 1998.41 305.29 317.73 51.01 17.55 130.03 82.96 34.32 1129.85
3 X 594.71 0.00 330.57 197.15 193.35 60.98 113.23 76.17 31.39 0.53
3 Y 130.02 0.00 352.82 90.92 162.35 18.21 26.11 65.77 15.54 0.00
3 Z 12.08 0.00 354.24 59.96 66.61 0.00 0.02 55.17 4.66 0.00
4 A 59.94 0.00 10.96 260.06 84.41 0.00 0.00 8.80 1.05 0.00
4 B 601.14 211.34 51.71 1361.77 27.77 122.24 182.08 78.70 72.61 0.00
4 C 341.27 122.87 328.70 337.84 35.62 37.10 98.98 94.34 25.98 2.47
4 D 84.07 0.00 53.21 438.85 42.94 3.01 20.81 8.11 6.12 0.00
4 E 427.76 0.00 45.43 618.88 35.68 78.52 49.62 104.27 64.54 0.00
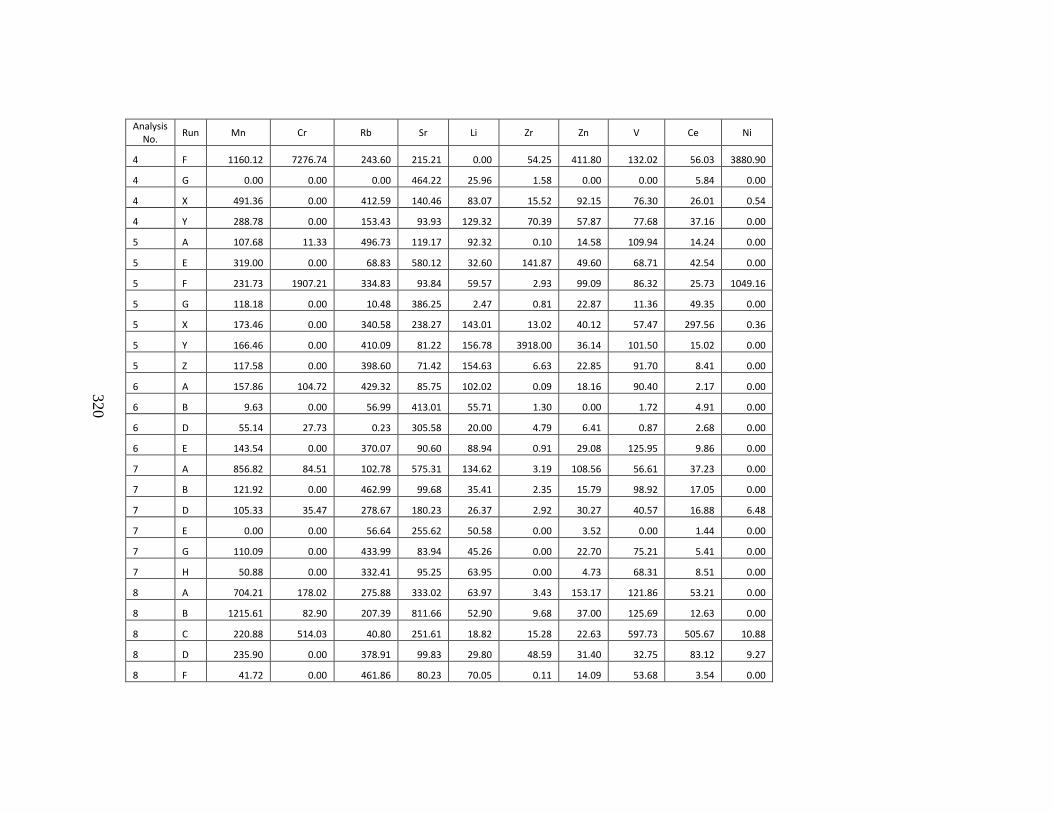
320
Analysis No.
Run Mn Cr Rb Sr Li Zr Zn V Ce Ni
4 F 1160.12 7276.74 243.60 215.21 0.00 54.25 411.80 132.02 56.03 3880.90
4 G 0.00 0.00 0.00 464.22 25.96 1.58 0.00 0.00 5.84 0.00
4 X 491.36 0.00 412.59 140.46 83.07 15.52 92.15 76.30 26.01 0.54
4 Y 288.78 0.00 153.43 93.93 129.32 70.39 57.87 77.68 37.16 0.00
5 A 107.68 11.33 496.73 119.17 92.32 0.10 14.58 109.94 14.24 0.00
5 E 319.00 0.00 68.83 580.12 32.60 141.87 49.60 68.71 42.54 0.00
5 F 231.73 1907.21 334.83 93.84 59.57 2.93 99.09 86.32 25.73 1049.16
5 G 118.18 0.00 10.48 386.25 2.47 0.81 22.87 11.36 49.35 0.00
5 X 173.46 0.00 340.58 238.27 143.01 13.02 40.12 57.47 297.56 0.36
5 Y 166.46 0.00 410.09 81.22 156.78 3918.00 36.14 101.50 15.02 0.00
5 Z 117.58 0.00 398.60 71.42 154.63 6.63 22.85 91.70 8.41 0.00
6 A 157.86 104.72 429.32 85.75 102.02 0.09 18.16 90.40 2.17 0.00
6 B 9.63 0.00 56.99 413.01 55.71 1.30 0.00 1.72 4.91 0.00
6 D 55.14 27.73 0.23 305.58 20.00 4.79 6.41 0.87 2.68 0.00
6 E 143.54 0.00 370.07 90.60 88.94 0.91 29.08 125.95 9.86 0.00
7 A 856.82 84.51 102.78 575.31 134.62 3.19 108.56 56.61 37.23 0.00
7 B 121.92 0.00 462.99 99.68 35.41 2.35 15.79 98.92 17.05 0.00
7 D 105.33 35.47 278.67 180.23 26.37 2.92 30.27 40.57 16.88 6.48
7 E 0.00 0.00 56.64 255.62 50.58 0.00 3.52 0.00 1.44 0.00
7 G 110.09 0.00 433.99 83.94 45.26 0.00 22.70 75.21 5.41 0.00
7 H 50.88 0.00 332.41 95.25 63.95 0.00 4.73 68.31 8.51 0.00
8 A 704.21 178.02 275.88 333.02 63.97 3.43 153.17 121.86 53.21 0.00
8 B 1215.61 82.90 207.39 811.66 52.90 9.68 37.00 125.69 12.63 0.00
8 C 220.88 514.03 40.80 251.61 18.82 15.28 22.63 597.73 505.67 10.88
8 D 235.90 0.00 378.91 99.83 29.80 48.59 31.40 32.75 83.12 9.27
8 F 41.72 0.00 461.86 80.23 70.05 0.11 14.09 53.68 3.54 0.00
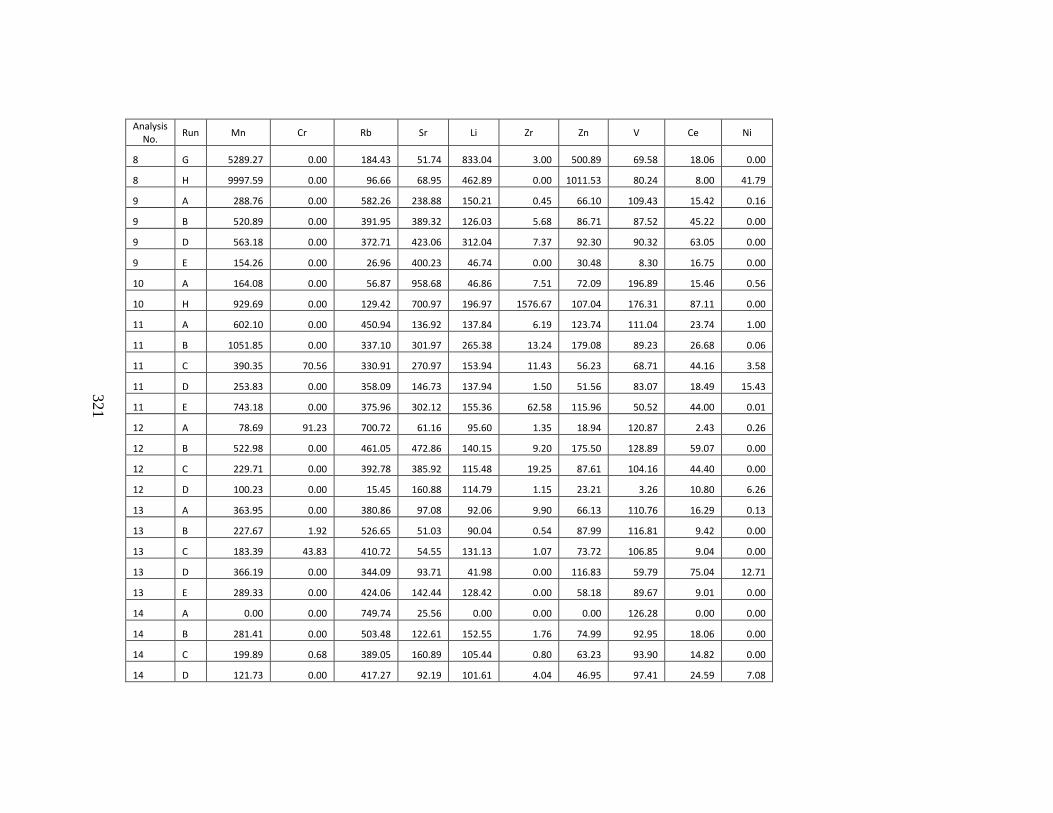
321
Analysis No.
Run Mn Cr Rb Sr Li Zr Zn V Ce Ni
8 G 5289.27 0.00 184.43 51.74 833.04 3.00 500.89 69.58 18.06 0.00
8 H 9997.59 0.00 96.66 68.95 462.89 0.00 1011.53 80.24 8.00 41.79
9 A 288.76 0.00 582.26 238.88 150.21 0.45 66.10 109.43 15.42 0.16
9 B 520.89 0.00 391.95 389.32 126.03 5.68 86.71 87.52 45.22 0.00
9 D 563.18 0.00 372.71 423.06 312.04 7.37 92.30 90.32 63.05 0.00
9 E 154.26 0.00 26.96 400.23 46.74 0.00 30.48 8.30 16.75 0.00
10 A 164.08 0.00 56.87 958.68 46.86 7.51 72.09 196.89 15.46 0.56
10 H 929.69 0.00 129.42 700.97 196.97 1576.67 107.04 176.31 87.11 0.00
11 A 602.10 0.00 450.94 136.92 137.84 6.19 123.74 111.04 23.74 1.00
11 B 1051.85 0.00 337.10 301.97 265.38 13.24 179.08 89.23 26.68 0.06
11 C 390.35 70.56 330.91 270.97 153.94 11.43 56.23 68.71 44.16 3.58
11 D 253.83 0.00 358.09 146.73 137.94 1.50 51.56 83.07 18.49 15.43
11 E 743.18 0.00 375.96 302.12 155.36 62.58 115.96 50.52 44.00 0.01
12 A 78.69 91.23 700.72 61.16 95.60 1.35 18.94 120.87 2.43 0.26
12 B 522.98 0.00 461.05 472.86 140.15 9.20 175.50 128.89 59.07 0.00
12 C 229.71 0.00 392.78 385.92 115.48 19.25 87.61 104.16 44.40 0.00
12 D 100.23 0.00 15.45 160.88 114.79 1.15 23.21 3.26 10.80 6.26
13 A 363.95 0.00 380.86 97.08 92.06 9.90 66.13 110.76 16.29 0.13
13 B 227.67 1.92 526.65 51.03 90.04 0.54 87.99 116.81 9.42 0.00
13 C 183.39 43.83 410.72 54.55 131.13 1.07 73.72 106.85 9.04 0.00
13 D 366.19 0.00 344.09 93.71 41.98 0.00 116.83 59.79 75.04 12.71
13 E 289.33 0.00 424.06 142.44 128.42 0.00 58.18 89.67 9.01 0.00
14 A 0.00 0.00 749.74 25.56 0.00 0.00 0.00 126.28 0.00 0.00
14 B 281.41 0.00 503.48 122.61 152.55 1.76 74.99 92.95 18.06 0.00
14 C 199.89 0.68 389.05 160.89 105.44 0.80 63.23 93.90 14.82 0.00
14 D 121.73 0.00 417.27 92.19 101.61 4.04 46.95 97.41 24.59 7.08
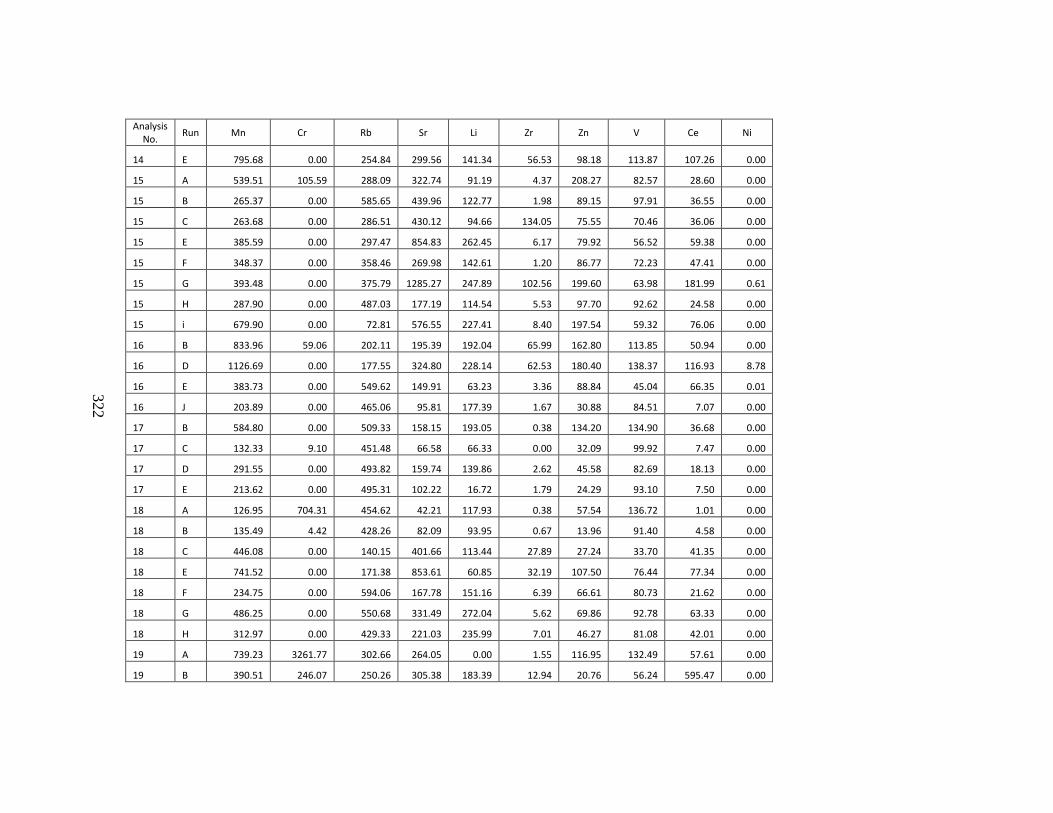
322
Analysis No.
Run Mn Cr Rb Sr Li Zr Zn V Ce Ni
14 E 795.68 0.00 254.84 299.56 141.34 56.53 98.18 113.87 107.26 0.00
15 A 539.51 105.59 288.09 322.74 91.19 4.37 208.27 82.57 28.60 0.00
15 B 265.37 0.00 585.65 439.96 122.77 1.98 89.15 97.91 36.55 0.00
15 C 263.68 0.00 286.51 430.12 94.66 134.05 75.55 70.46 36.06 0.00
15 E 385.59 0.00 297.47 854.83 262.45 6.17 79.92 56.52 59.38 0.00
15 F 348.37 0.00 358.46 269.98 142.61 1.20 86.77 72.23 47.41 0.00
15 G 393.48 0.00 375.79 1285.27 247.89 102.56 199.60 63.98 181.99 0.61
15 H 287.90 0.00 487.03 177.19 114.54 5.53 97.70 92.62 24.58 0.00
15 i 679.90 0.00 72.81 576.55 227.41 8.40 197.54 59.32 76.06 0.00
16 B 833.96 59.06 202.11 195.39 192.04 65.99 162.80 113.85 50.94 0.00
16 D 1126.69 0.00 177.55 324.80 228.14 62.53 180.40 138.37 116.93 8.78
16 E 383.73 0.00 549.62 149.91 63.23 3.36 88.84 45.04 66.35 0.01
16 J 203.89 0.00 465.06 95.81 177.39 1.67 30.88 84.51 7.07 0.00
17 B 584.80 0.00 509.33 158.15 193.05 0.38 134.20 134.90 36.68 0.00
17 C 132.33 9.10 451.48 66.58 66.33 0.00 32.09 99.92 7.47 0.00
17 D 291.55 0.00 493.82 159.74 139.86 2.62 45.58 82.69 18.13 0.00
17 E 213.62 0.00 495.31 102.22 16.72 1.79 24.29 93.10 7.50 0.00
18 A 126.95 704.31 454.62 42.21 117.93 0.38 57.54 136.72 1.01 0.00
18 B 135.49 4.42 428.26 82.09 93.95 0.67 13.96 91.40 4.58 0.00
18 C 446.08 0.00 140.15 401.66 113.44 27.89 27.24 33.70 41.35 0.00
18 E 741.52 0.00 171.38 853.61 60.85 32.19 107.50 76.44 77.34 0.00
18 F 234.75 0.00 594.06 167.78 151.16 6.39 66.61 80.73 21.62 0.00
18 G 486.25 0.00 550.68 331.49 272.04 5.62 69.86 92.78 63.33 0.00
18 H 312.97 0.00 429.33 221.03 235.99 7.01 46.27 81.08 42.01 0.00
19 A 739.23 3261.77 302.66 264.05 0.00 1.55 116.95 132.49 57.61 0.00
19 B 390.51 246.07 250.26 305.38 183.39 12.94 20.76 56.24 595.47 0.00
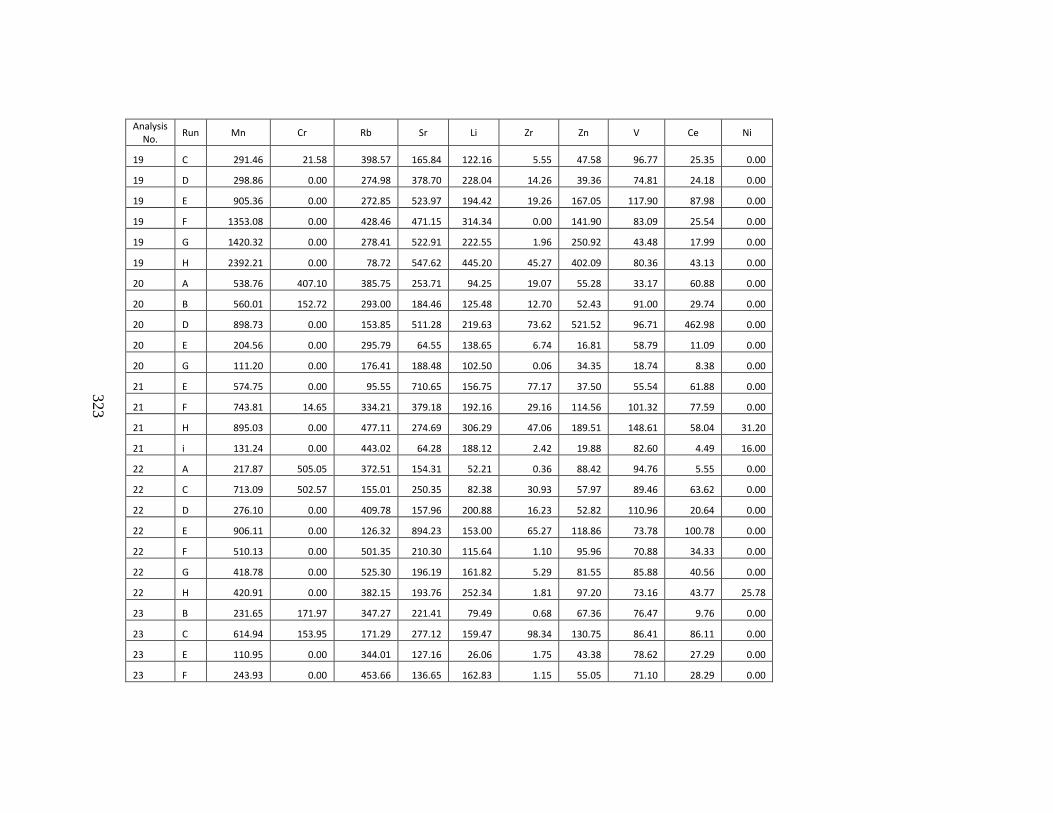
323
Analysis No.
Run Mn Cr Rb Sr Li Zr Zn V Ce Ni
19 C 291.46 21.58 398.57 165.84 122.16 5.55 47.58 96.77 25.35 0.00
19 D 298.86 0.00 274.98 378.70 228.04 14.26 39.36 74.81 24.18 0.00
19 E 905.36 0.00 272.85 523.97 194.42 19.26 167.05 117.90 87.98 0.00
19 F 1353.08 0.00 428.46 471.15 314.34 0.00 141.90 83.09 25.54 0.00
19 G 1420.32 0.00 278.41 522.91 222.55 1.96 250.92 43.48 17.99 0.00
19 H 2392.21 0.00 78.72 547.62 445.20 45.27 402.09 80.36 43.13 0.00
20 A 538.76 407.10 385.75 253.71 94.25 19.07 55.28 33.17 60.88 0.00
20 B 560.01 152.72 293.00 184.46 125.48 12.70 52.43 91.00 29.74 0.00
20 D 898.73 0.00 153.85 511.28 219.63 73.62 521.52 96.71 462.98 0.00
20 E 204.56 0.00 295.79 64.55 138.65 6.74 16.81 58.79 11.09 0.00
20 G 111.20 0.00 176.41 188.48 102.50 0.06 34.35 18.74 8.38 0.00
21 E 574.75 0.00 95.55 710.65 156.75 77.17 37.50 55.54 61.88 0.00
21 F 743.81 14.65 334.21 379.18 192.16 29.16 114.56 101.32 77.59 0.00
21 H 895.03 0.00 477.11 274.69 306.29 47.06 189.51 148.61 58.04 31.20
21 i 131.24 0.00 443.02 64.28 188.12 2.42 19.88 82.60 4.49 16.00
22 A 217.87 505.05 372.51 154.31 52.21 0.36 88.42 94.76 5.55 0.00
22 C 713.09 502.57 155.01 250.35 82.38 30.93 57.97 89.46 63.62 0.00
22 D 276.10 0.00 409.78 157.96 200.88 16.23 52.82 110.96 20.64 0.00
22 E 906.11 0.00 126.32 894.23 153.00 65.27 118.86 73.78 100.78 0.00
22 F 510.13 0.00 501.35 210.30 115.64 1.10 95.96 70.88 34.33 0.00
22 G 418.78 0.00 525.30 196.19 161.82 5.29 81.55 85.88 40.56 0.00
22 H 420.91 0.00 382.15 193.76 252.34 1.81 97.20 73.16 43.77 25.78
23 B 231.65 171.97 347.27 221.41 79.49 0.68 67.36 76.47 9.76 0.00
23 C 614.94 153.95 171.29 277.12 159.47 98.34 130.75 86.41 86.11 0.00
23 E 110.95 0.00 344.01 127.16 26.06 1.75 43.38 78.62 27.29 0.00
23 F 243.93 0.00 453.66 136.65 162.83 1.15 55.05 71.10 28.29 0.00
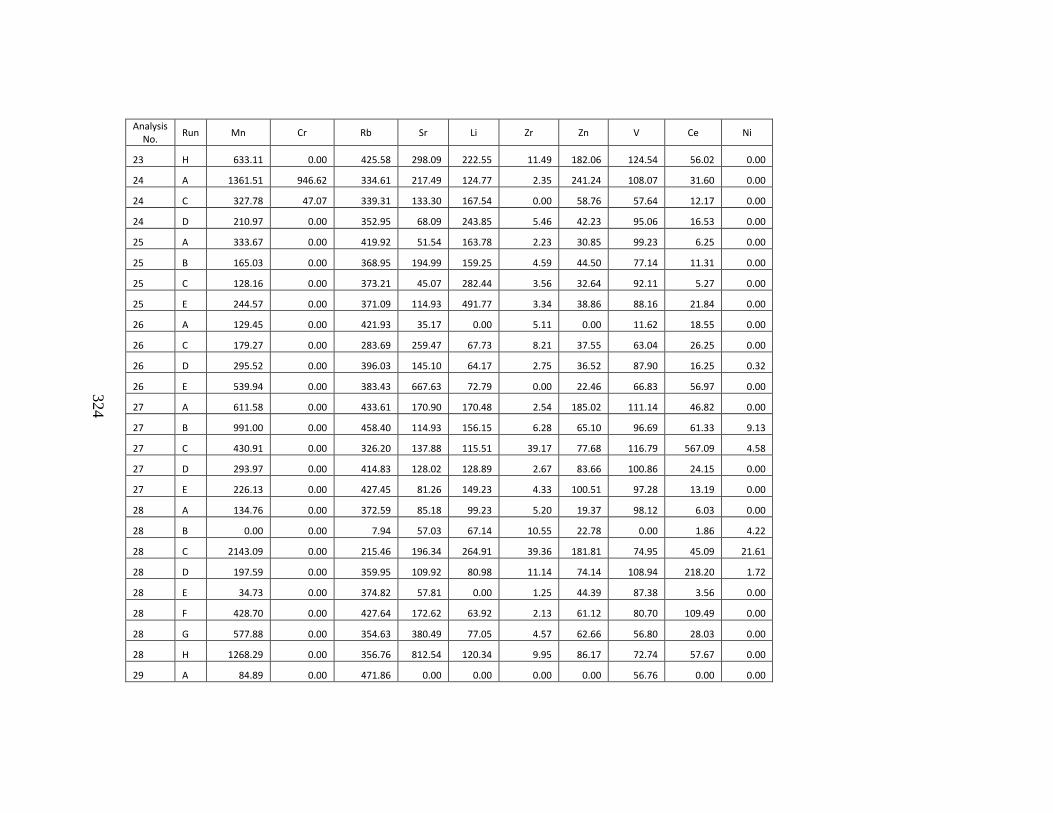
324
Analysis No.
Run Mn Cr Rb Sr Li Zr Zn V Ce Ni
23 H 633.11 0.00 425.58 298.09 222.55 11.49 182.06 124.54 56.02 0.00
24 A 1361.51 946.62 334.61 217.49 124.77 2.35 241.24 108.07 31.60 0.00
24 C 327.78 47.07 339.31 133.30 167.54 0.00 58.76 57.64 12.17 0.00
24 D 210.97 0.00 352.95 68.09 243.85 5.46 42.23 95.06 16.53 0.00
25 A 333.67 0.00 419.92 51.54 163.78 2.23 30.85 99.23 6.25 0.00
25 B 165.03 0.00 368.95 194.99 159.25 4.59 44.50 77.14 11.31 0.00
25 C 128.16 0.00 373.21 45.07 282.44 3.56 32.64 92.11 5.27 0.00
25 E 244.57 0.00 371.09 114.93 491.77 3.34 38.86 88.16 21.84 0.00
26 A 129.45 0.00 421.93 35.17 0.00 5.11 0.00 11.62 18.55 0.00
26 C 179.27 0.00 283.69 259.47 67.73 8.21 37.55 63.04 26.25 0.00
26 D 295.52 0.00 396.03 145.10 64.17 2.75 36.52 87.90 16.25 0.32
26 E 539.94 0.00 383.43 667.63 72.79 0.00 22.46 66.83 56.97 0.00
27 A 611.58 0.00 433.61 170.90 170.48 2.54 185.02 111.14 46.82 0.00
27 B 991.00 0.00 458.40 114.93 156.15 6.28 65.10 96.69 61.33 9.13
27 C 430.91 0.00 326.20 137.88 115.51 39.17 77.68 116.79 567.09 4.58
27 D 293.97 0.00 414.83 128.02 128.89 2.67 83.66 100.86 24.15 0.00
27 E 226.13 0.00 427.45 81.26 149.23 4.33 100.51 97.28 13.19 0.00
28 A 134.76 0.00 372.59 85.18 99.23 5.20 19.37 98.12 6.03 0.00
28 B 0.00 0.00 7.94 57.03 67.14 10.55 22.78 0.00 1.86 4.22
28 C 2143.09 0.00 215.46 196.34 264.91 39.36 181.81 74.95 45.09 21.61
28 D 197.59 0.00 359.95 109.92 80.98 11.14 74.14 108.94 218.20 1.72
28 E 34.73 0.00 374.82 57.81 0.00 1.25 44.39 87.38 3.56 0.00
28 F 428.70 0.00 427.64 172.62 63.92 2.13 61.12 80.70 109.49 0.00
28 G 577.88 0.00 354.63 380.49 77.05 4.57 62.66 56.80 28.03 0.00
28 H 1268.29 0.00 356.76 812.54 120.34 9.95 86.17 72.74 57.67 0.00
29 A 84.89 0.00 471.86 0.00 0.00 0.00 0.00 56.76 0.00 0.00
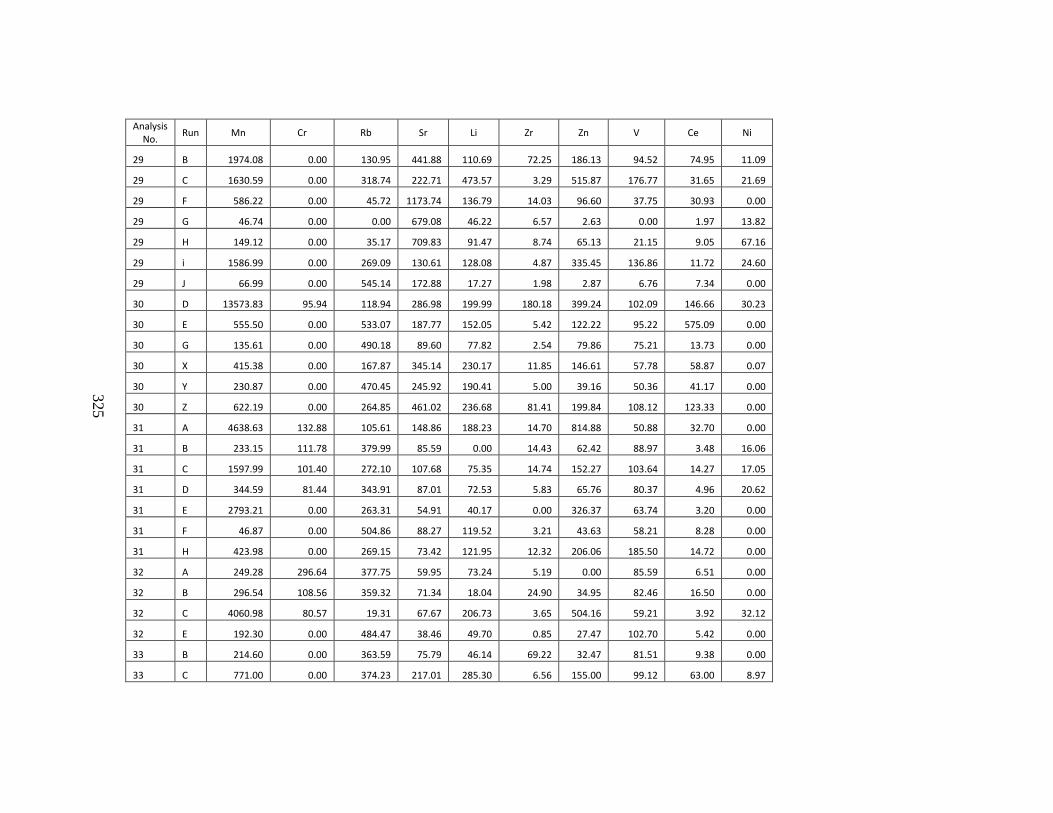
325
Analysis No.
Run Mn Cr Rb Sr Li Zr Zn V Ce Ni
29 B 1974.08 0.00 130.95 441.88 110.69 72.25 186.13 94.52 74.95 11.09
29 C 1630.59 0.00 318.74 222.71 473.57 3.29 515.87 176.77 31.65 21.69
29 F 586.22 0.00 45.72 1173.74 136.79 14.03 96.60 37.75 30.93 0.00
29 G 46.74 0.00 0.00 679.08 46.22 6.57 2.63 0.00 1.97 13.82
29 H 149.12 0.00 35.17 709.83 91.47 8.74 65.13 21.15 9.05 67.16
29 i 1586.99 0.00 269.09 130.61 128.08 4.87 335.45 136.86 11.72 24.60
29 J 66.99 0.00 545.14 172.88 17.27 1.98 2.87 6.76 7.34 0.00
30 D 13573.83 95.94 118.94 286.98 199.99 180.18 399.24 102.09 146.66 30.23
30 E 555.50 0.00 533.07 187.77 152.05 5.42 122.22 95.22 575.09 0.00
30 G 135.61 0.00 490.18 89.60 77.82 2.54 79.86 75.21 13.73 0.00
30 X 415.38 0.00 167.87 345.14 230.17 11.85 146.61 57.78 58.87 0.07
30 Y 230.87 0.00 470.45 245.92 190.41 5.00 39.16 50.36 41.17 0.00
30 Z 622.19 0.00 264.85 461.02 236.68 81.41 199.84 108.12 123.33 0.00
31 A 4638.63 132.88 105.61 148.86 188.23 14.70 814.88 50.88 32.70 0.00
31 B 233.15 111.78 379.99 85.59 0.00 14.43 62.42 88.97 3.48 16.06
31 C 1597.99 101.40 272.10 107.68 75.35 14.74 152.27 103.64 14.27 17.05
31 D 344.59 81.44 343.91 87.01 72.53 5.83 65.76 80.37 4.96 20.62
31 E 2793.21 0.00 263.31 54.91 40.17 0.00 326.37 63.74 3.20 0.00
31 F 46.87 0.00 504.86 88.27 119.52 3.21 43.63 58.21 8.28 0.00
31 H 423.98 0.00 269.15 73.42 121.95 12.32 206.06 185.50 14.72 0.00
32 A 249.28 296.64 377.75 59.95 73.24 5.19 0.00 85.59 6.51 0.00
32 B 296.54 108.56 359.32 71.34 18.04 24.90 34.95 82.46 16.50 0.00
32 C 4060.98 80.57 19.31 67.67 206.73 3.65 504.16 59.21 3.92 32.12
32 E 192.30 0.00 484.47 38.46 49.70 0.85 27.47 102.70 5.42 0.00
33 B 214.60 0.00 363.59 75.79 46.14 69.22 32.47 81.51 9.38 0.00
33 C 771.00 0.00 374.23 217.01 285.30 6.56 155.00 99.12 63.00 8.97
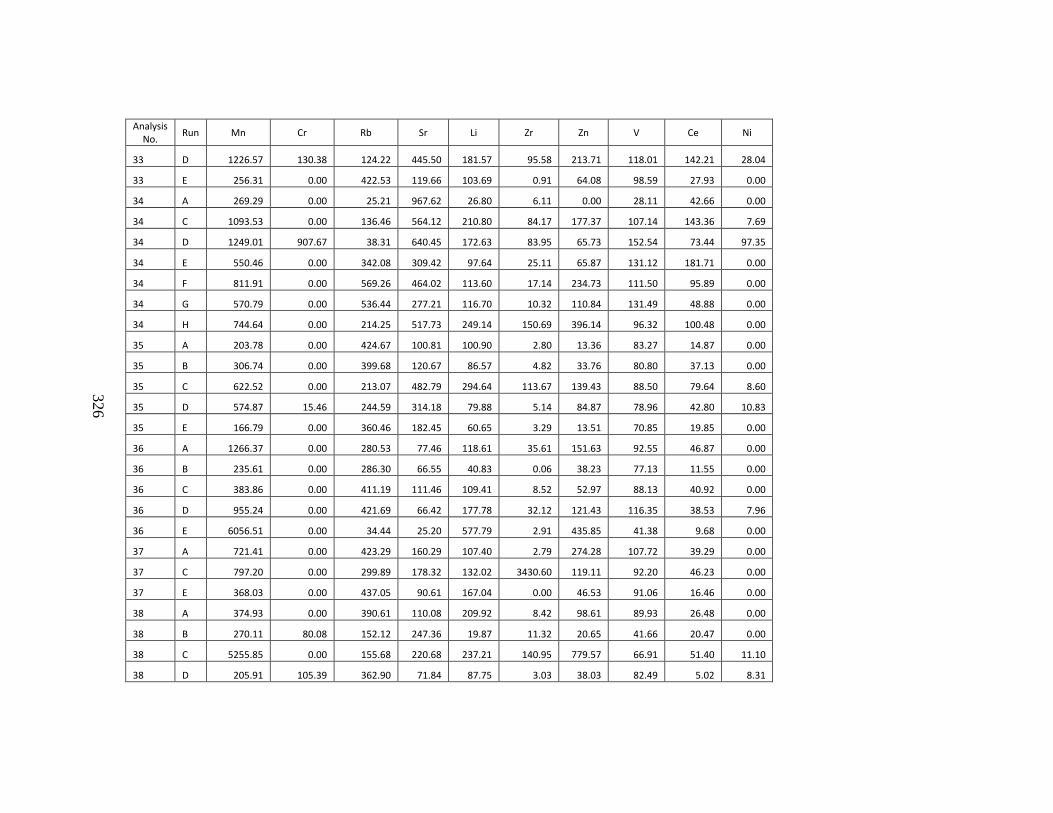
326
Analysis No.
Run Mn Cr Rb Sr Li Zr Zn V Ce Ni
33 D 1226.57 130.38 124.22 445.50 181.57 95.58 213.71 118.01 142.21 28.04
33 E 256.31 0.00 422.53 119.66 103.69 0.91 64.08 98.59 27.93 0.00
34 A 269.29 0.00 25.21 967.62 26.80 6.11 0.00 28.11 42.66 0.00
34 C 1093.53 0.00 136.46 564.12 210.80 84.17 177.37 107.14 143.36 7.69
34 D 1249.01 907.67 38.31 640.45 172.63 83.95 65.73 152.54 73.44 97.35
34 E 550.46 0.00 342.08 309.42 97.64 25.11 65.87 131.12 181.71 0.00
34 F 811.91 0.00 569.26 464.02 113.60 17.14 234.73 111.50 95.89 0.00
34 G 570.79 0.00 536.44 277.21 116.70 10.32 110.84 131.49 48.88 0.00
34 H 744.64 0.00 214.25 517.73 249.14 150.69 396.14 96.32 100.48 0.00
35 A 203.78 0.00 424.67 100.81 100.90 2.80 13.36 83.27 14.87 0.00
35 B 306.74 0.00 399.68 120.67 86.57 4.82 33.76 80.80 37.13 0.00
35 C 622.52 0.00 213.07 482.79 294.64 113.67 139.43 88.50 79.64 8.60
35 D 574.87 15.46 244.59 314.18 79.88 5.14 84.87 78.96 42.80 10.83
35 E 166.79 0.00 360.46 182.45 60.65 3.29 13.51 70.85 19.85 0.00
36 A 1266.37 0.00 280.53 77.46 118.61 35.61 151.63 92.55 46.87 0.00
36 B 235.61 0.00 286.30 66.55 40.83 0.06 38.23 77.13 11.55 0.00
36 C 383.86 0.00 411.19 111.46 109.41 8.52 52.97 88.13 40.92 0.00
36 D 955.24 0.00 421.69 66.42 177.78 32.12 121.43 116.35 38.53 7.96
36 E 6056.51 0.00 34.44 25.20 577.79 2.91 435.85 41.38 9.68 0.00
37 A 721.41 0.00 423.29 160.29 107.40 2.79 274.28 107.72 39.29 0.00
37 C 797.20 0.00 299.89 178.32 132.02 3430.60 119.11 92.20 46.23 0.00
37 E 368.03 0.00 437.05 90.61 167.04 0.00 46.53 91.06 16.46 0.00
38 A 374.93 0.00 390.61 110.08 209.92 8.42 98.61 89.93 26.48 0.00
38 B 270.11 80.08 152.12 247.36 19.87 11.32 20.65 41.66 20.47 0.00
38 C 5255.85 0.00 155.68 220.68 237.21 140.95 779.57 66.91 51.40 11.10
38 D 205.91 105.39 362.90 71.84 87.75 3.03 38.03 82.49 5.02 8.31
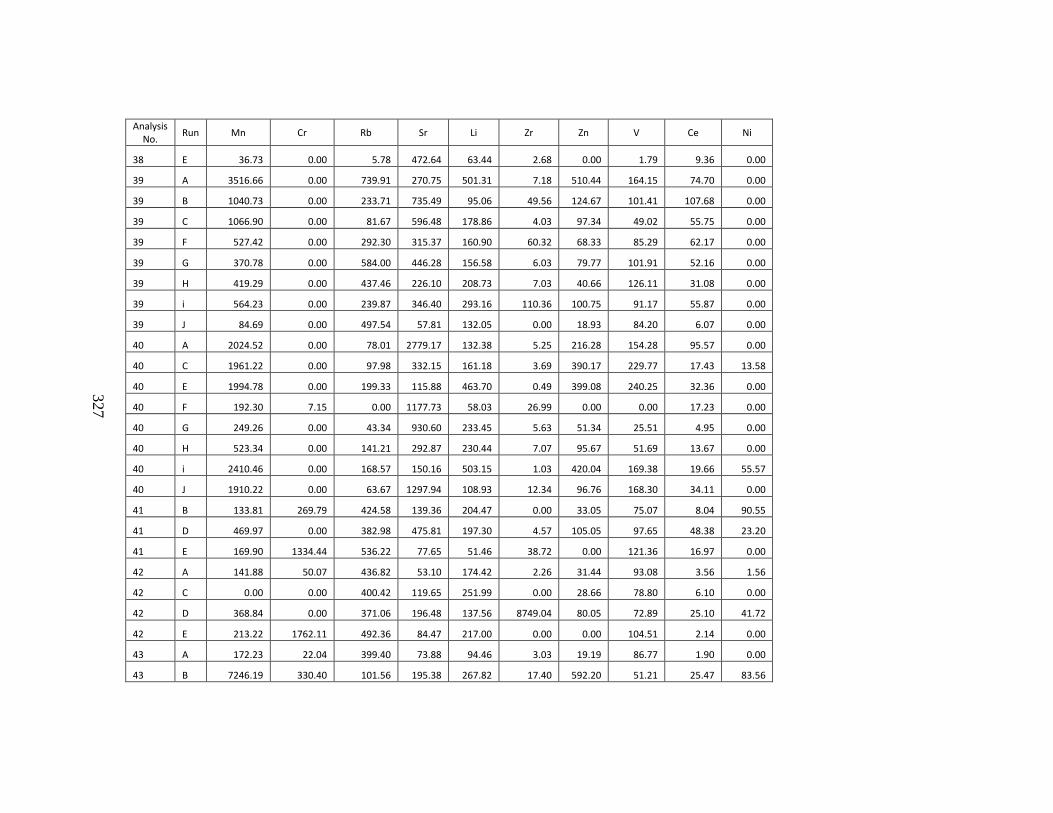
327
Analysis No.
Run Mn Cr Rb Sr Li Zr Zn V Ce Ni
38 E 36.73 0.00 5.78 472.64 63.44 2.68 0.00 1.79 9.36 0.00
39 A 3516.66 0.00 739.91 270.75 501.31 7.18 510.44 164.15 74.70 0.00
39 B 1040.73 0.00 233.71 735.49 95.06 49.56 124.67 101.41 107.68 0.00
39 C 1066.90 0.00 81.67 596.48 178.86 4.03 97.34 49.02 55.75 0.00
39 F 527.42 0.00 292.30 315.37 160.90 60.32 68.33 85.29 62.17 0.00
39 G 370.78 0.00 584.00 446.28 156.58 6.03 79.77 101.91 52.16 0.00
39 H 419.29 0.00 437.46 226.10 208.73 7.03 40.66 126.11 31.08 0.00
39 i 564.23 0.00 239.87 346.40 293.16 110.36 100.75 91.17 55.87 0.00
39 J 84.69 0.00 497.54 57.81 132.05 0.00 18.93 84.20 6.07 0.00
40 A 2024.52 0.00 78.01 2779.17 132.38 5.25 216.28 154.28 95.57 0.00
40 C 1961.22 0.00 97.98 332.15 161.18 3.69 390.17 229.77 17.43 13.58
40 E 1994.78 0.00 199.33 115.88 463.70 0.49 399.08 240.25 32.36 0.00
40 F 192.30 7.15 0.00 1177.73 58.03 26.99 0.00 0.00 17.23 0.00
40 G 249.26 0.00 43.34 930.60 233.45 5.63 51.34 25.51 4.95 0.00
40 H 523.34 0.00 141.21 292.87 230.44 7.07 95.67 51.69 13.67 0.00
40 i 2410.46 0.00 168.57 150.16 503.15 1.03 420.04 169.38 19.66 55.57
40 J 1910.22 0.00 63.67 1297.94 108.93 12.34 96.76 168.30 34.11 0.00
41 B 133.81 269.79 424.58 139.36 204.47 0.00 33.05 75.07 8.04 90.55
41 D 469.97 0.00 382.98 475.81 197.30 4.57 105.05 97.65 48.38 23.20
41 E 169.90 1334.44 536.22 77.65 51.46 38.72 0.00 121.36 16.97 0.00
42 A 141.88 50.07 436.82 53.10 174.42 2.26 31.44 93.08 3.56 1.56
42 C 0.00 0.00 400.42 119.65 251.99 0.00 28.66 78.80 6.10 0.00
42 D 368.84 0.00 371.06 196.48 137.56 8749.04 80.05 72.89 25.10 41.72
42 E 213.22 1762.11 492.36 84.47 217.00 0.00 0.00 104.51 2.14 0.00
43 A 172.23 22.04 399.40 73.88 94.46 3.03 19.19 86.77 1.90 0.00
43 B 7246.19 330.40 101.56 195.38 267.82 17.40 592.20 51.21 25.47 83.56
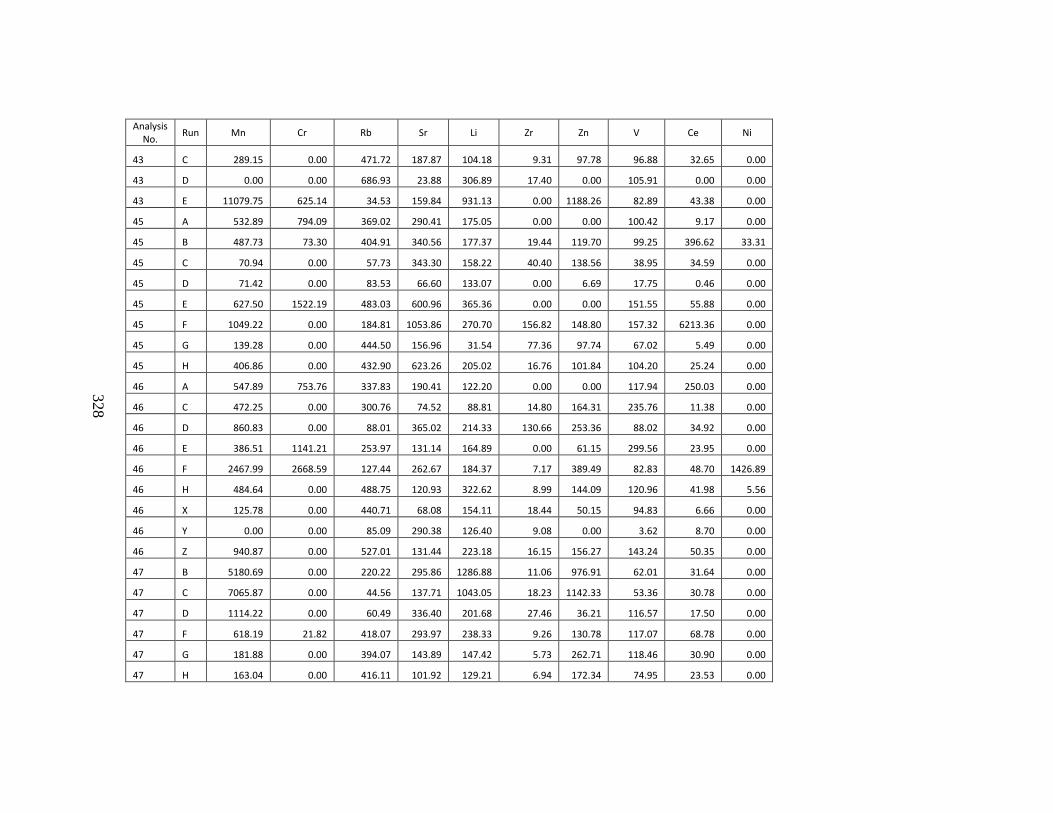
328
Analysis No.
Run Mn Cr Rb Sr Li Zr Zn V Ce Ni
43 C 289.15 0.00 471.72 187.87 104.18 9.31 97.78 96.88 32.65 0.00
43 D 0.00 0.00 686.93 23.88 306.89 17.40 0.00 105.91 0.00 0.00
43 E 11079.75 625.14 34.53 159.84 931.13 0.00 1188.26 82.89 43.38 0.00
45 A 532.89 794.09 369.02 290.41 175.05 0.00 0.00 100.42 9.17 0.00
45 B 487.73 73.30 404.91 340.56 177.37 19.44 119.70 99.25 396.62 33.31
45 C 70.94 0.00 57.73 343.30 158.22 40.40 138.56 38.95 34.59 0.00
45 D 71.42 0.00 83.53 66.60 133.07 0.00 6.69 17.75 0.46 0.00
45 E 627.50 1522.19 483.03 600.96 365.36 0.00 0.00 151.55 55.88 0.00
45 F 1049.22 0.00 184.81 1053.86 270.70 156.82 148.80 157.32 6213.36 0.00
45 G 139.28 0.00 444.50 156.96 31.54 77.36 97.74 67.02 5.49 0.00
45 H 406.86 0.00 432.90 623.26 205.02 16.76 101.84 104.20 25.24 0.00
46 A 547.89 753.76 337.83 190.41 122.20 0.00 0.00 117.94 250.03 0.00
46 C 472.25 0.00 300.76 74.52 88.81 14.80 164.31 235.76 11.38 0.00
46 D 860.83 0.00 88.01 365.02 214.33 130.66 253.36 88.02 34.92 0.00
46 E 386.51 1141.21 253.97 131.14 164.89 0.00 61.15 299.56 23.95 0.00
46 F 2467.99 2668.59 127.44 262.67 184.37 7.17 389.49 82.83 48.70 1426.89
46 H 484.64 0.00 488.75 120.93 322.62 8.99 144.09 120.96 41.98 5.56
46 X 125.78 0.00 440.71 68.08 154.11 18.44 50.15 94.83 6.66 0.00
46 Y 0.00 0.00 85.09 290.38 126.40 9.08 0.00 3.62 8.70 0.00
46 Z 940.87 0.00 527.01 131.44 223.18 16.15 156.27 143.24 50.35 0.00
47 B 5180.69 0.00 220.22 295.86 1286.88 11.06 976.91 62.01 31.64 0.00
47 C 7065.87 0.00 44.56 137.71 1043.05 18.23 1142.33 53.36 30.78 0.00
47 D 1114.22 0.00 60.49 336.40 201.68 27.46 36.21 116.57 17.50 0.00
47 F 618.19 21.82 418.07 293.97 238.33 9.26 130.78 117.07 68.78 0.00
47 G 181.88 0.00 394.07 143.89 147.42 5.73 262.71 118.46 30.90 0.00
47 H 163.04 0.00 416.11 101.92 129.21 6.94 172.34 74.95 23.53 0.00
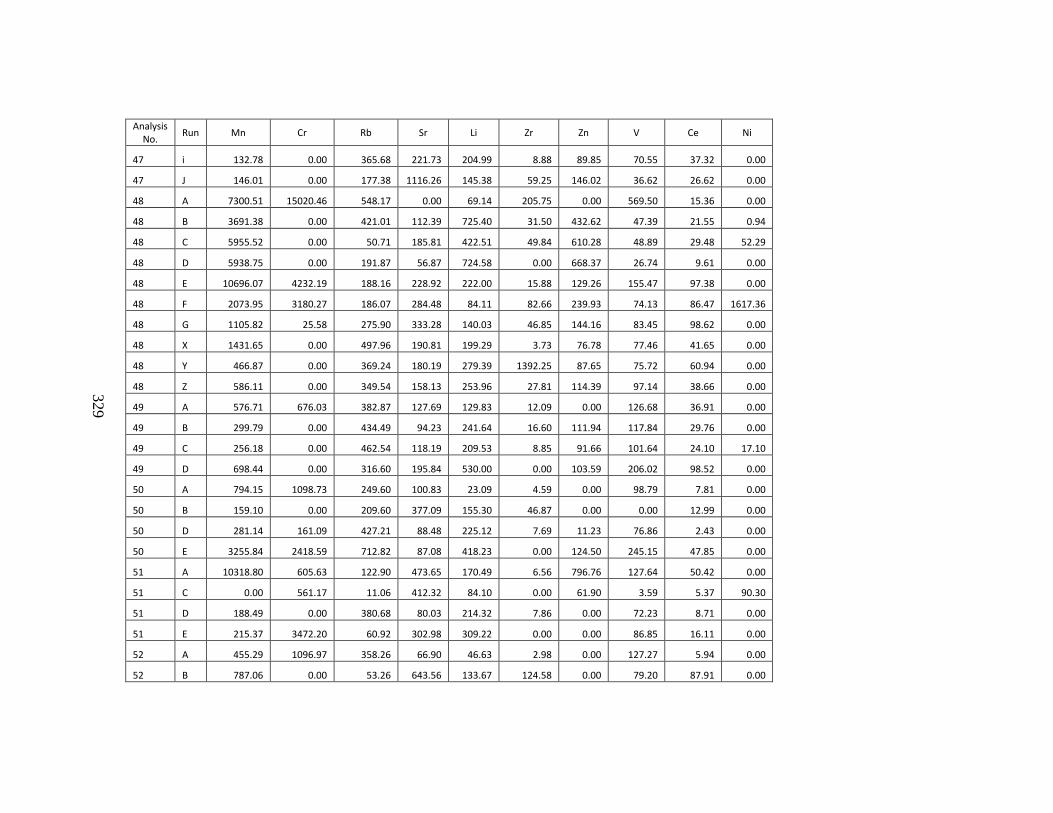
329
Analysis No.
Run Mn Cr Rb Sr Li Zr Zn V Ce Ni
47 i 132.78 0.00 365.68 221.73 204.99 8.88 89.85 70.55 37.32 0.00
47 J 146.01 0.00 177.38 1116.26 145.38 59.25 146.02 36.62 26.62 0.00
48 A 7300.51 15020.46 548.17 0.00 69.14 205.75 0.00 569.50 15.36 0.00
48 B 3691.38 0.00 421.01 112.39 725.40 31.50 432.62 47.39 21.55 0.94
48 C 5955.52 0.00 50.71 185.81 422.51 49.84 610.28 48.89 29.48 52.29
48 D 5938.75 0.00 191.87 56.87 724.58 0.00 668.37 26.74 9.61 0.00
48 E 10696.07 4232.19 188.16 228.92 222.00 15.88 129.26 155.47 97.38 0.00
48 F 2073.95 3180.27 186.07 284.48 84.11 82.66 239.93 74.13 86.47 1617.36
48 G 1105.82 25.58 275.90 333.28 140.03 46.85 144.16 83.45 98.62 0.00
48 X 1431.65 0.00 497.96 190.81 199.29 3.73 76.78 77.46 41.65 0.00
48 Y 466.87 0.00 369.24 180.19 279.39 1392.25 87.65 75.72 60.94 0.00
48 Z 586.11 0.00 349.54 158.13 253.96 27.81 114.39 97.14 38.66 0.00
49 A 576.71 676.03 382.87 127.69 129.83 12.09 0.00 126.68 36.91 0.00
49 B 299.79 0.00 434.49 94.23 241.64 16.60 111.94 117.84 29.76 0.00
49 C 256.18 0.00 462.54 118.19 209.53 8.85 91.66 101.64 24.10 17.10
49 D 698.44 0.00 316.60 195.84 530.00 0.00 103.59 206.02 98.52 0.00
50 A 794.15 1098.73 249.60 100.83 23.09 4.59 0.00 98.79 7.81 0.00
50 B 159.10 0.00 209.60 377.09 155.30 46.87 0.00 0.00 12.99 0.00
50 D 281.14 161.09 427.21 88.48 225.12 7.69 11.23 76.86 2.43 0.00
50 E 3255.84 2418.59 712.82 87.08 418.23 0.00 124.50 245.15 47.85 0.00
51 A 10318.80 605.63 122.90 473.65 170.49 6.56 796.76 127.64 50.42 0.00
51 C 0.00 561.17 11.06 412.32 84.10 0.00 61.90 3.59 5.37 90.30
51 D 188.49 0.00 380.68 80.03 214.32 7.86 0.00 72.23 8.71 0.00
51 E 215.37 3472.20 60.92 302.98 309.22 0.00 0.00 86.85 16.11 0.00
52 A 455.29 1096.97 358.26 66.90 46.63 2.98 0.00 127.27 5.94 0.00
52 B 787.06 0.00 53.26 643.56 133.67 124.58 0.00 79.20 87.91 0.00
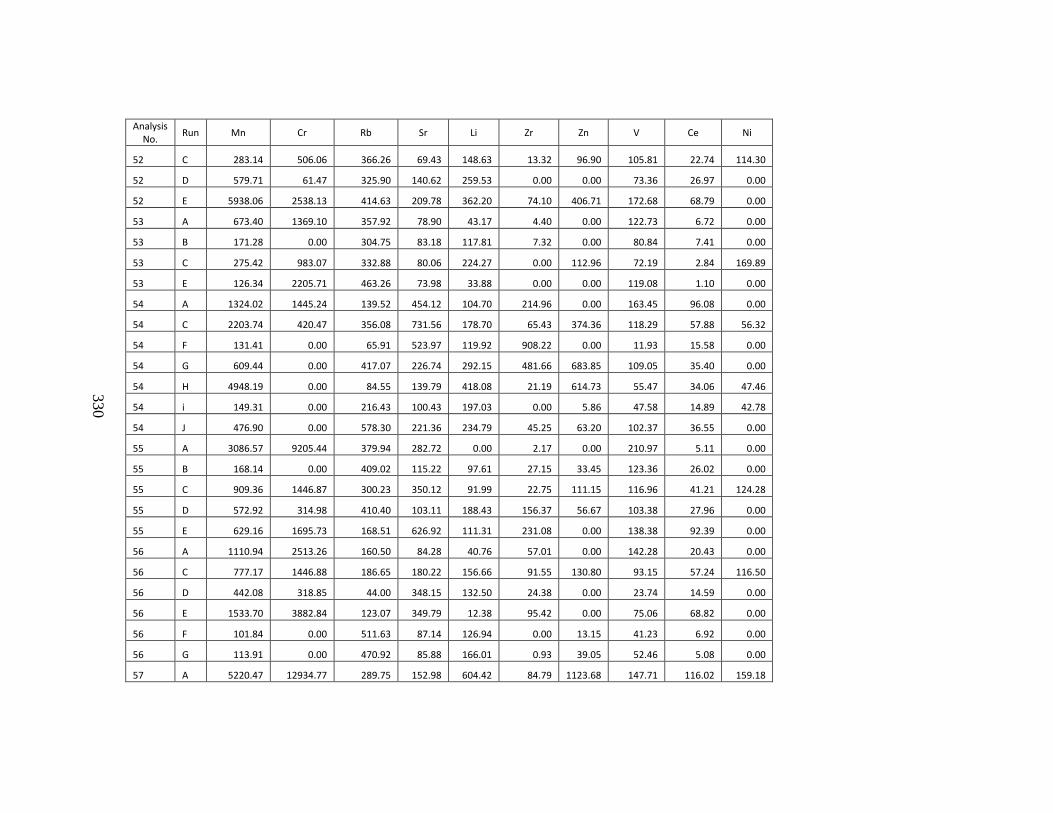
330
Analysis No.
Run Mn Cr Rb Sr Li Zr Zn V Ce Ni
52 C 283.14 506.06 366.26 69.43 148.63 13.32 96.90 105.81 22.74 114.30
52 D 579.71 61.47 325.90 140.62 259.53 0.00 0.00 73.36 26.97 0.00
52 E 5938.06 2538.13 414.63 209.78 362.20 74.10 406.71 172.68 68.79 0.00
53 A 673.40 1369.10 357.92 78.90 43.17 4.40 0.00 122.73 6.72 0.00
53 B 171.28 0.00 304.75 83.18 117.81 7.32 0.00 80.84 7.41 0.00
53 C 275.42 983.07 332.88 80.06 224.27 0.00 112.96 72.19 2.84 169.89
53 E 126.34 2205.71 463.26 73.98 33.88 0.00 0.00 119.08 1.10 0.00
54 A 1324.02 1445.24 139.52 454.12 104.70 214.96 0.00 163.45 96.08 0.00
54 C 2203.74 420.47 356.08 731.56 178.70 65.43 374.36 118.29 57.88 56.32
54 F 131.41 0.00 65.91 523.97 119.92 908.22 0.00 11.93 15.58 0.00
54 G 609.44 0.00 417.07 226.74 292.15 481.66 683.85 109.05 35.40 0.00
54 H 4948.19 0.00 84.55 139.79 418.08 21.19 614.73 55.47 34.06 47.46
54 i 149.31 0.00 216.43 100.43 197.03 0.00 5.86 47.58 14.89 42.78
54 J 476.90 0.00 578.30 221.36 234.79 45.25 63.20 102.37 36.55 0.00
55 A 3086.57 9205.44 379.94 282.72 0.00 2.17 0.00 210.97 5.11 0.00
55 B 168.14 0.00 409.02 115.22 97.61 27.15 33.45 123.36 26.02 0.00
55 C 909.36 1446.87 300.23 350.12 91.99 22.75 111.15 116.96 41.21 124.28
55 D 572.92 314.98 410.40 103.11 188.43 156.37 56.67 103.38 27.96 0.00
55 E 629.16 1695.73 168.51 626.92 111.31 231.08 0.00 138.38 92.39 0.00
56 A 1110.94 2513.26 160.50 84.28 40.76 57.01 0.00 142.28 20.43 0.00
56 C 777.17 1446.88 186.65 180.22 156.66 91.55 130.80 93.15 57.24 116.50
56 D 442.08 318.85 44.00 348.15 132.50 24.38 0.00 23.74 14.59 0.00
56 E 1533.70 3882.84 123.07 349.79 12.38 95.42 0.00 75.06 68.82 0.00
56 F 101.84 0.00 511.63 87.14 126.94 0.00 13.15 41.23 6.92 0.00
56 G 113.91 0.00 470.92 85.88 166.01 0.93 39.05 52.46 5.08 0.00
57 A 5220.47 12934.77 289.75 152.98 604.42 84.79 1123.68 147.71 116.02 159.18

331
Analysis No.
Run Mn Cr Rb Sr Li Zr Zn V Ce Ni
57 B 0.00 0.00 142.83 250.75 188.35 88.41 372.10 41.42 28.88 46.55
57 C 0.00 0.00 424.49 75.94 206.13 922.90 78.53 94.10 76.88 3.86
57 D 21.55 0.00 404.89 61.65 148.13 5.30 46.07 95.98 8.60 10.29
57 F 139.36 0.00 533.74 107.68 300.13 17.59 31.44 87.45 43.68 0.00
57 G 64.49 0.00 468.86 49.50 197.62 3.70 24.83 79.93 6.08 0.00
57 H 51.04 0.00 325.06 70.51 232.94 2.66 18.11 70.03 7.33 3.78
58 A 105.39 3820.99 334.58 118.25 134.48 155.17 191.37 103.43 8.03 39.83
58 C 3421.18 0.00 42.27 87.26 1871.07 0.00 822.61 134.99 15.08 62.77
58 E 1329.65 6.27 405.29 161.16 231.19 20.85 151.22 111.53 32.44 23.93
58 F 620.41 0.00 229.63 353.50 198.59 136.20 248.92 79.97 114.91 0.00
58 H 398.02 0.00 431.63 132.63 232.36 4.10 176.36 104.08 31.64 0.00
59 B 0.00 0.00 377.04 96.39 74.53 0.00 13.09 86.11 0.00 1.59
59 C 11321.35 261.71 49.70 119.47 1339.84 0.00 1524.93 1.11 12.93 88.56
59 D 283.28 123.19 231.09 267.64 104.79 43.14 111.86 62.98 40.94 18.44
59 E 9321.03 152.90 82.59 90.91 982.37 13.07 801.07 55.66 17.76 68.55
59 F 268.54 1563.51 335.88 139.56 136.28 187.21 127.28 86.06 8.40 758.86
59 G 458.29 0.00 380.63 443.51 259.32 3.02 83.80 81.12 26.55 0.00
59 H 565.49 343.30 416.12 76.47 313.77 2.90 66.77 66.24 10.40 118.81
59 X 2662.25 0.00 215.57 86.18 381.22 7.28 341.23 47.92 7.75 0.00
59 Y 82.21 0.00 473.57 91.70 192.89 0.00 23.61 77.46 3.54 0.00
59 Z 154.59 0.00 462.94 83.31 278.44 4.75 40.35 92.45 6.47 0.00
60 A 5160.83 8717.23 66.51 349.92 220.75 30.83 884.68 120.23 41.83 62.15
60 B 11940.24 0.00 33.85 178.36 475.67 362.48 969.90 18.20 25.14 3.82
60 C 123.75 72.90 377.65 123.42 248.73 0.58 68.12 87.04 3.65 20.55
60 D 707.61 23.32 177.19 389.21 127.57 61.88 145.63 73.77 77.78 3.50
60 E 330.66 245.57 269.08 228.69 278.46 10.78 0.00 89.87 9.20 23.01
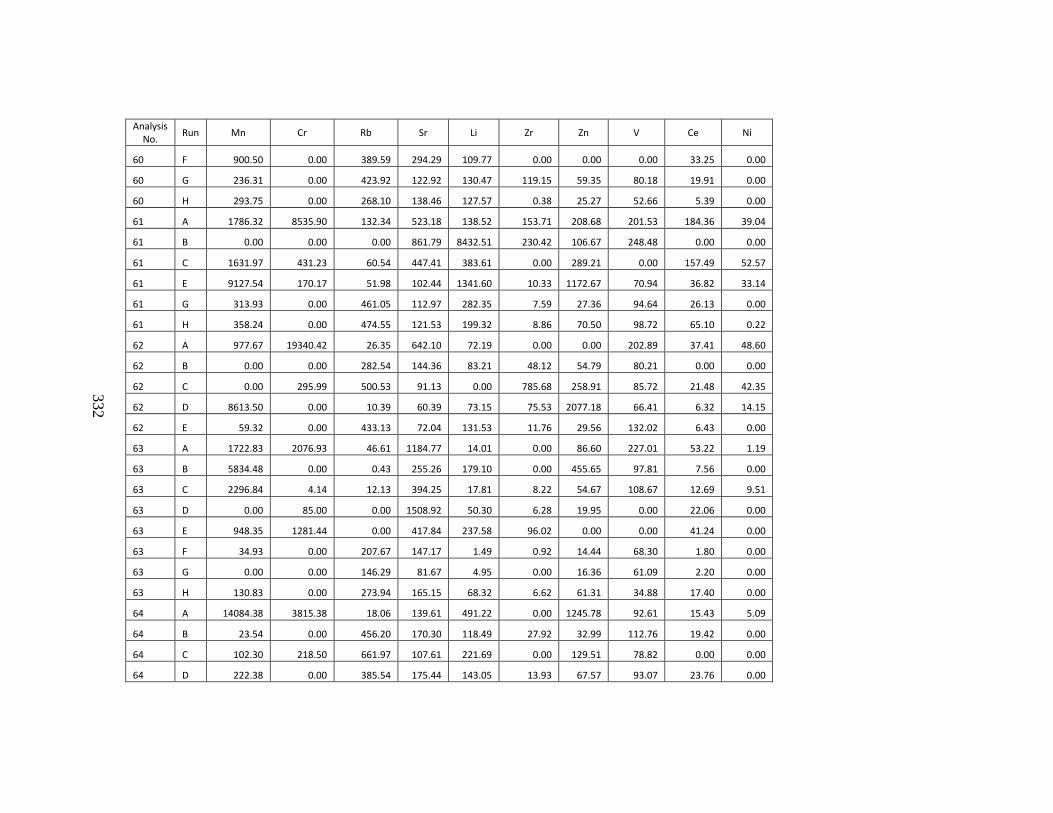
332
Analysis No.
Run Mn Cr Rb Sr Li Zr Zn V Ce Ni
60 F 900.50 0.00 389.59 294.29 109.77 0.00 0.00 0.00 33.25 0.00
60 G 236.31 0.00 423.92 122.92 130.47 119.15 59.35 80.18 19.91 0.00
60 H 293.75 0.00 268.10 138.46 127.57 0.38 25.27 52.66 5.39 0.00
61 A 1786.32 8535.90 132.34 523.18 138.52 153.71 208.68 201.53 184.36 39.04
61 B 0.00 0.00 0.00 861.79 8432.51 230.42 106.67 248.48 0.00 0.00
61 C 1631.97 431.23 60.54 447.41 383.61 0.00 289.21 0.00 157.49 52.57
61 E 9127.54 170.17 51.98 102.44 1341.60 10.33 1172.67 70.94 36.82 33.14
61 G 313.93 0.00 461.05 112.97 282.35 7.59 27.36 94.64 26.13 0.00
61 H 358.24 0.00 474.55 121.53 199.32 8.86 70.50 98.72 65.10 0.22
62 A 977.67 19340.42 26.35 642.10 72.19 0.00 0.00 202.89 37.41 48.60
62 B 0.00 0.00 282.54 144.36 83.21 48.12 54.79 80.21 0.00 0.00
62 C 0.00 295.99 500.53 91.13 0.00 785.68 258.91 85.72 21.48 42.35
62 D 8613.50 0.00 10.39 60.39 73.15 75.53 2077.18 66.41 6.32 14.15
62 E 59.32 0.00 433.13 72.04 131.53 11.76 29.56 132.02 6.43 0.00
63 A 1722.83 2076.93 46.61 1184.77 14.01 0.00 86.60 227.01 53.22 1.19
63 B 5834.48 0.00 0.43 255.26 179.10 0.00 455.65 97.81 7.56 0.00
63 C 2296.84 4.14 12.13 394.25 17.81 8.22 54.67 108.67 12.69 9.51
63 D 0.00 85.00 0.00 1508.92 50.30 6.28 19.95 0.00 22.06 0.00
63 E 948.35 1281.44 0.00 417.84 237.58 96.02 0.00 0.00 41.24 0.00
63 F 34.93 0.00 207.67 147.17 1.49 0.92 14.44 68.30 1.80 0.00
63 G 0.00 0.00 146.29 81.67 4.95 0.00 16.36 61.09 2.20 0.00
63 H 130.83 0.00 273.94 165.15 68.32 6.62 61.31 34.88 17.40 0.00
64 A 14084.38 3815.38 18.06 139.61 491.22 0.00 1245.78 92.61 15.43 5.09
64 B 23.54 0.00 456.20 170.30 118.49 27.92 32.99 112.76 19.42 0.00
64 C 102.30 218.50 661.97 107.61 221.69 0.00 129.51 78.82 0.00 0.00
64 D 222.38 0.00 385.54 175.44 143.05 13.93 67.57 93.07 23.76 0.00
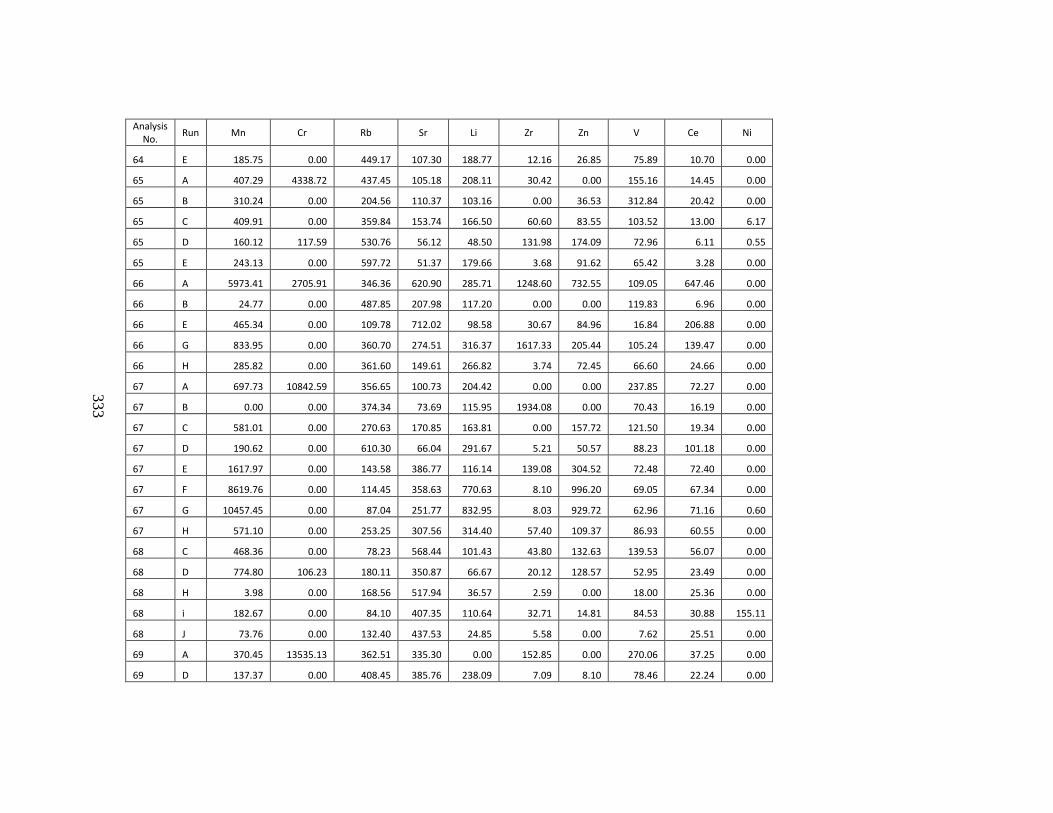
333
Analysis No.
Run Mn Cr Rb Sr Li Zr Zn V Ce Ni
64 E 185.75 0.00 449.17 107.30 188.77 12.16 26.85 75.89 10.70 0.00
65 A 407.29 4338.72 437.45 105.18 208.11 30.42 0.00 155.16 14.45 0.00
65 B 310.24 0.00 204.56 110.37 103.16 0.00 36.53 312.84 20.42 0.00
65 C 409.91 0.00 359.84 153.74 166.50 60.60 83.55 103.52 13.00 6.17
65 D 160.12 117.59 530.76 56.12 48.50 131.98 174.09 72.96 6.11 0.55
65 E 243.13 0.00 597.72 51.37 179.66 3.68 91.62 65.42 3.28 0.00
66 A 5973.41 2705.91 346.36 620.90 285.71 1248.60 732.55 109.05 647.46 0.00
66 B 24.77 0.00 487.85 207.98 117.20 0.00 0.00 119.83 6.96 0.00
66 E 465.34 0.00 109.78 712.02 98.58 30.67 84.96 16.84 206.88 0.00
66 G 833.95 0.00 360.70 274.51 316.37 1617.33 205.44 105.24 139.47 0.00
66 H 285.82 0.00 361.60 149.61 266.82 3.74 72.45 66.60 24.66 0.00
67 A 697.73 10842.59 356.65 100.73 204.42 0.00 0.00 237.85 72.27 0.00
67 B 0.00 0.00 374.34 73.69 115.95 1934.08 0.00 70.43 16.19 0.00
67 C 581.01 0.00 270.63 170.85 163.81 0.00 157.72 121.50 19.34 0.00
67 D 190.62 0.00 610.30 66.04 291.67 5.21 50.57 88.23 101.18 0.00
67 E 1617.97 0.00 143.58 386.77 116.14 139.08 304.52 72.48 72.40 0.00
67 F 8619.76 0.00 114.45 358.63 770.63 8.10 996.20 69.05 67.34 0.00
67 G 10457.45 0.00 87.04 251.77 832.95 8.03 929.72 62.96 71.16 0.60
67 H 571.10 0.00 253.25 307.56 314.40 57.40 109.37 86.93 60.55 0.00
68 C 468.36 0.00 78.23 568.44 101.43 43.80 132.63 139.53 56.07 0.00
68 D 774.80 106.23 180.11 350.87 66.67 20.12 128.57 52.95 23.49 0.00
68 H 3.98 0.00 168.56 517.94 36.57 2.59 0.00 18.00 25.36 0.00
68 i 182.67 0.00 84.10 407.35 110.64 32.71 14.81 84.53 30.88 155.11
68 J 73.76 0.00 132.40 437.53 24.85 5.58 0.00 7.62 25.51 0.00
69 A 370.45 13535.13 362.51 335.30 0.00 152.85 0.00 270.06 37.25 0.00
69 D 137.37 0.00 408.45 385.76 238.09 7.09 8.10 78.46 22.24 0.00
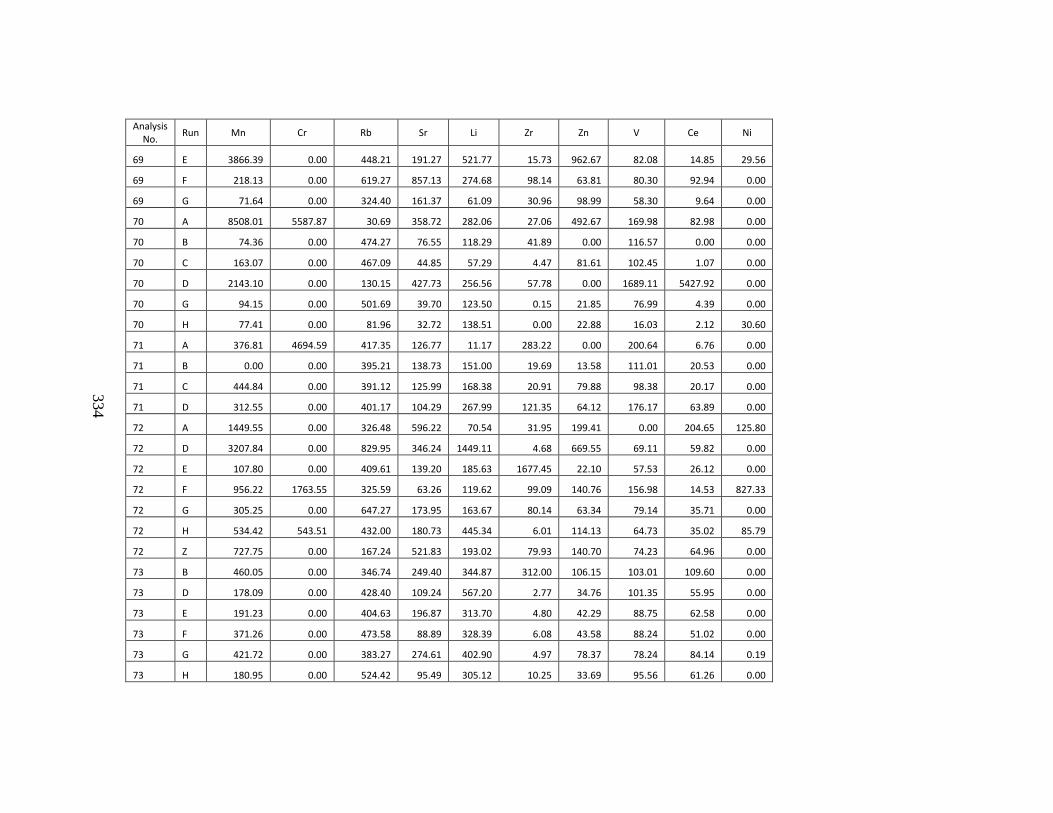
334
Analysis No.
Run Mn Cr Rb Sr Li Zr Zn V Ce Ni
69 E 3866.39 0.00 448.21 191.27 521.77 15.73 962.67 82.08 14.85 29.56
69 F 218.13 0.00 619.27 857.13 274.68 98.14 63.81 80.30 92.94 0.00
69 G 71.64 0.00 324.40 161.37 61.09 30.96 98.99 58.30 9.64 0.00
70 A 8508.01 5587.87 30.69 358.72 282.06 27.06 492.67 169.98 82.98 0.00
70 B 74.36 0.00 474.27 76.55 118.29 41.89 0.00 116.57 0.00 0.00
70 C 163.07 0.00 467.09 44.85 57.29 4.47 81.61 102.45 1.07 0.00
70 D 2143.10 0.00 130.15 427.73 256.56 57.78 0.00 1689.11 5427.92 0.00
70 G 94.15 0.00 501.69 39.70 123.50 0.15 21.85 76.99 4.39 0.00
70 H 77.41 0.00 81.96 32.72 138.51 0.00 22.88 16.03 2.12 30.60
71 A 376.81 4694.59 417.35 126.77 11.17 283.22 0.00 200.64 6.76 0.00
71 B 0.00 0.00 395.21 138.73 151.00 19.69 13.58 111.01 20.53 0.00
71 C 444.84 0.00 391.12 125.99 168.38 20.91 79.88 98.38 20.17 0.00
71 D 312.55 0.00 401.17 104.29 267.99 121.35 64.12 176.17 63.89 0.00
72 A 1449.55 0.00 326.48 596.22 70.54 31.95 199.41 0.00 204.65 125.80
72 D 3207.84 0.00 829.95 346.24 1449.11 4.68 669.55 69.11 59.82 0.00
72 E 107.80 0.00 409.61 139.20 185.63 1677.45 22.10 57.53 26.12 0.00
72 F 956.22 1763.55 325.59 63.26 119.62 99.09 140.76 156.98 14.53 827.33
72 G 305.25 0.00 647.27 173.95 163.67 80.14 63.34 79.14 35.71 0.00
72 H 534.42 543.51 432.00 180.73 445.34 6.01 114.13 64.73 35.02 85.79
72 Z 727.75 0.00 167.24 521.83 193.02 79.93 140.70 74.23 64.96 0.00
73 B 460.05 0.00 346.74 249.40 344.87 312.00 106.15 103.01 109.60 0.00
73 D 178.09 0.00 428.40 109.24 567.20 2.77 34.76 101.35 55.95 0.00
73 E 191.23 0.00 404.63 196.87 313.70 4.80 42.29 88.75 62.58 0.00
73 F 371.26 0.00 473.58 88.89 328.39 6.08 43.58 88.24 51.02 0.00
73 G 421.72 0.00 383.27 274.61 402.90 4.97 78.37 78.24 84.14 0.19
73 H 180.95 0.00 524.42 95.49 305.12 10.25 33.69 95.56 61.26 0.00
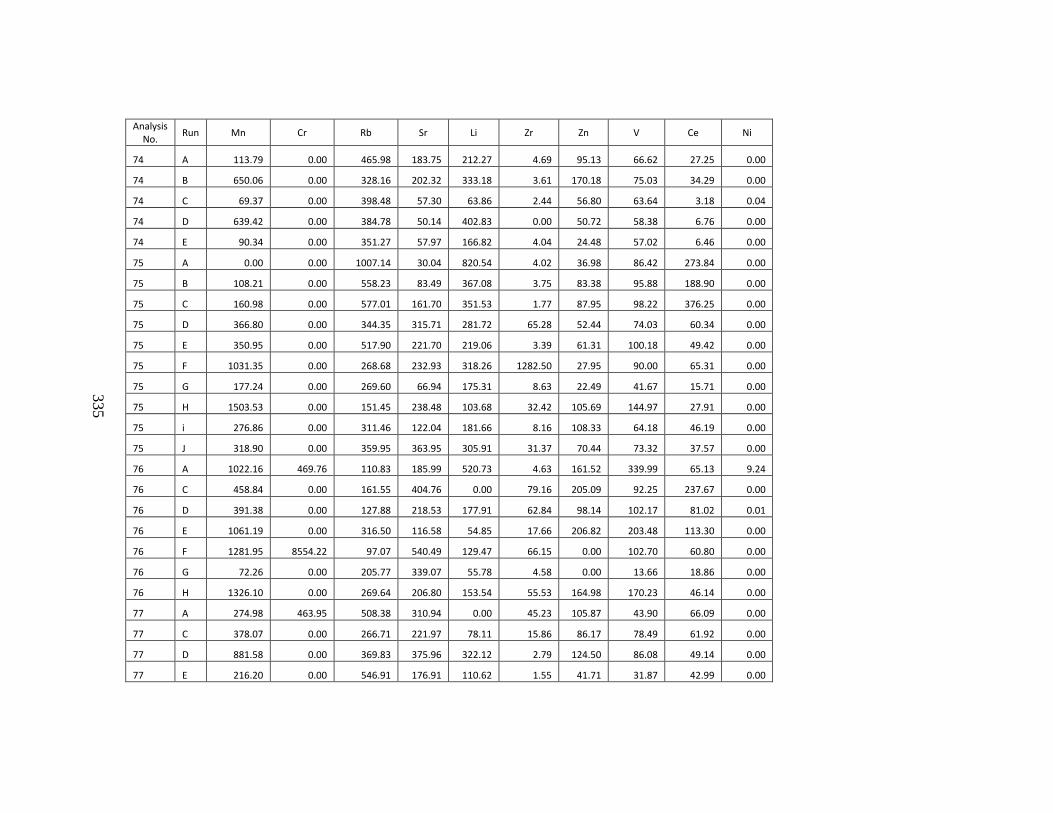
335
Analysis No.
Run Mn Cr Rb Sr Li Zr Zn V Ce Ni
74 A 113.79 0.00 465.98 183.75 212.27 4.69 95.13 66.62 27.25 0.00
74 B 650.06 0.00 328.16 202.32 333.18 3.61 170.18 75.03 34.29 0.00
74 C 69.37 0.00 398.48 57.30 63.86 2.44 56.80 63.64 3.18 0.04
74 D 639.42 0.00 384.78 50.14 402.83 0.00 50.72 58.38 6.76 0.00
74 E 90.34 0.00 351.27 57.97 166.82 4.04 24.48 57.02 6.46 0.00
75 A 0.00 0.00 1007.14 30.04 820.54 4.02 36.98 86.42 273.84 0.00
75 B 108.21 0.00 558.23 83.49 367.08 3.75 83.38 95.88 188.90 0.00
75 C 160.98 0.00 577.01 161.70 351.53 1.77 87.95 98.22 376.25 0.00
75 D 366.80 0.00 344.35 315.71 281.72 65.28 52.44 74.03 60.34 0.00
75 E 350.95 0.00 517.90 221.70 219.06 3.39 61.31 100.18 49.42 0.00
75 F 1031.35 0.00 268.68 232.93 318.26 1282.50 27.95 90.00 65.31 0.00
75 G 177.24 0.00 269.60 66.94 175.31 8.63 22.49 41.67 15.71 0.00
75 H 1503.53 0.00 151.45 238.48 103.68 32.42 105.69 144.97 27.91 0.00
75 i 276.86 0.00 311.46 122.04 181.66 8.16 108.33 64.18 46.19 0.00
75 J 318.90 0.00 359.95 363.95 305.91 31.37 70.44 73.32 37.57 0.00
76 A 1022.16 469.76 110.83 185.99 520.73 4.63 161.52 339.99 65.13 9.24
76 C 458.84 0.00 161.55 404.76 0.00 79.16 205.09 92.25 237.67 0.00
76 D 391.38 0.00 127.88 218.53 177.91 62.84 98.14 102.17 81.02 0.01
76 E 1061.19 0.00 316.50 116.58 54.85 17.66 206.82 203.48 113.30 0.00
76 F 1281.95 8554.22 97.07 540.49 129.47 66.15 0.00 102.70 60.80 0.00
76 G 72.26 0.00 205.77 339.07 55.78 4.58 0.00 13.66 18.86 0.00
76 H 1326.10 0.00 269.64 206.80 153.54 55.53 164.98 170.23 46.14 0.00
77 A 274.98 463.95 508.38 310.94 0.00 45.23 105.87 43.90 66.09 0.00
77 C 378.07 0.00 266.71 221.97 78.11 15.86 86.17 78.49 61.92 0.00
77 D 881.58 0.00 369.83 375.96 322.12 2.79 124.50 86.08 49.14 0.00
77 E 216.20 0.00 546.91 176.91 110.62 1.55 41.71 31.87 42.99 0.00
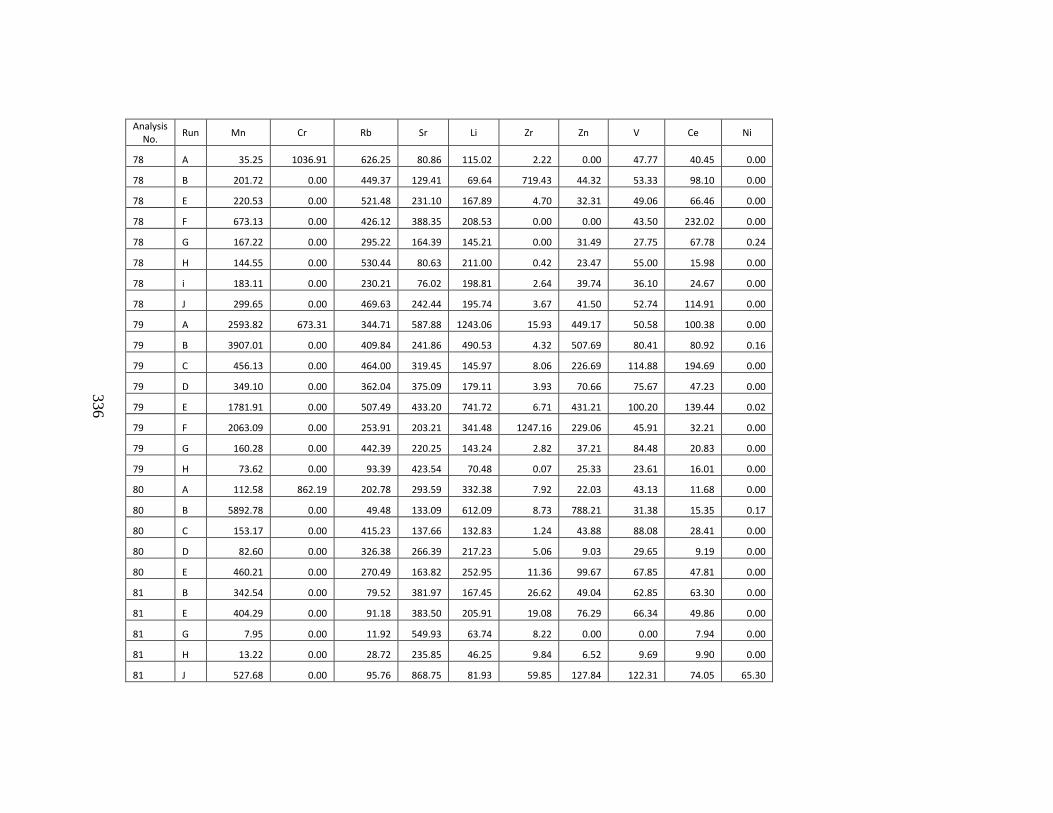
336
Analysis No.
Run Mn Cr Rb Sr Li Zr Zn V Ce Ni
78 A 35.25 1036.91 626.25 80.86 115.02 2.22 0.00 47.77 40.45 0.00
78 B 201.72 0.00 449.37 129.41 69.64 719.43 44.32 53.33 98.10 0.00
78 E 220.53 0.00 521.48 231.10 167.89 4.70 32.31 49.06 66.46 0.00
78 F 673.13 0.00 426.12 388.35 208.53 0.00 0.00 43.50 232.02 0.00
78 G 167.22 0.00 295.22 164.39 145.21 0.00 31.49 27.75 67.78 0.24
78 H 144.55 0.00 530.44 80.63 211.00 0.42 23.47 55.00 15.98 0.00
78 i 183.11 0.00 230.21 76.02 198.81 2.64 39.74 36.10 24.67 0.00
78 J 299.65 0.00 469.63 242.44 195.74 3.67 41.50 52.74 114.91 0.00
79 A 2593.82 673.31 344.71 587.88 1243.06 15.93 449.17 50.58 100.38 0.00
79 B 3907.01 0.00 409.84 241.86 490.53 4.32 507.69 80.41 80.92 0.16
79 C 456.13 0.00 464.00 319.45 145.97 8.06 226.69 114.88 194.69 0.00
79 D 349.10 0.00 362.04 375.09 179.11 3.93 70.66 75.67 47.23 0.00
79 E 1781.91 0.00 507.49 433.20 741.72 6.71 431.21 100.20 139.44 0.02
79 F 2063.09 0.00 253.91 203.21 341.48 1247.16 229.06 45.91 32.21 0.00
79 G 160.28 0.00 442.39 220.25 143.24 2.82 37.21 84.48 20.83 0.00
79 H 73.62 0.00 93.39 423.54 70.48 0.07 25.33 23.61 16.01 0.00
80 A 112.58 862.19 202.78 293.59 332.38 7.92 22.03 43.13 11.68 0.00
80 B 5892.78 0.00 49.48 133.09 612.09 8.73 788.21 31.38 15.35 0.17
80 C 153.17 0.00 415.23 137.66 132.83 1.24 43.88 88.08 28.41 0.00
80 D 82.60 0.00 326.38 266.39 217.23 5.06 9.03 29.65 9.19 0.00
80 E 460.21 0.00 270.49 163.82 252.95 11.36 99.67 67.85 47.81 0.00
81 B 342.54 0.00 79.52 381.97 167.45 26.62 49.04 62.85 63.30 0.00
81 E 404.29 0.00 91.18 383.50 205.91 19.08 76.29 66.34 49.86 0.00
81 G 7.95 0.00 11.92 549.93 63.74 8.22 0.00 0.00 7.94 0.00
81 H 13.22 0.00 28.72 235.85 46.25 9.84 6.52 9.69 9.90 0.00
81 J 527.68 0.00 95.76 868.75 81.93 59.85 127.84 122.31 74.05 65.30
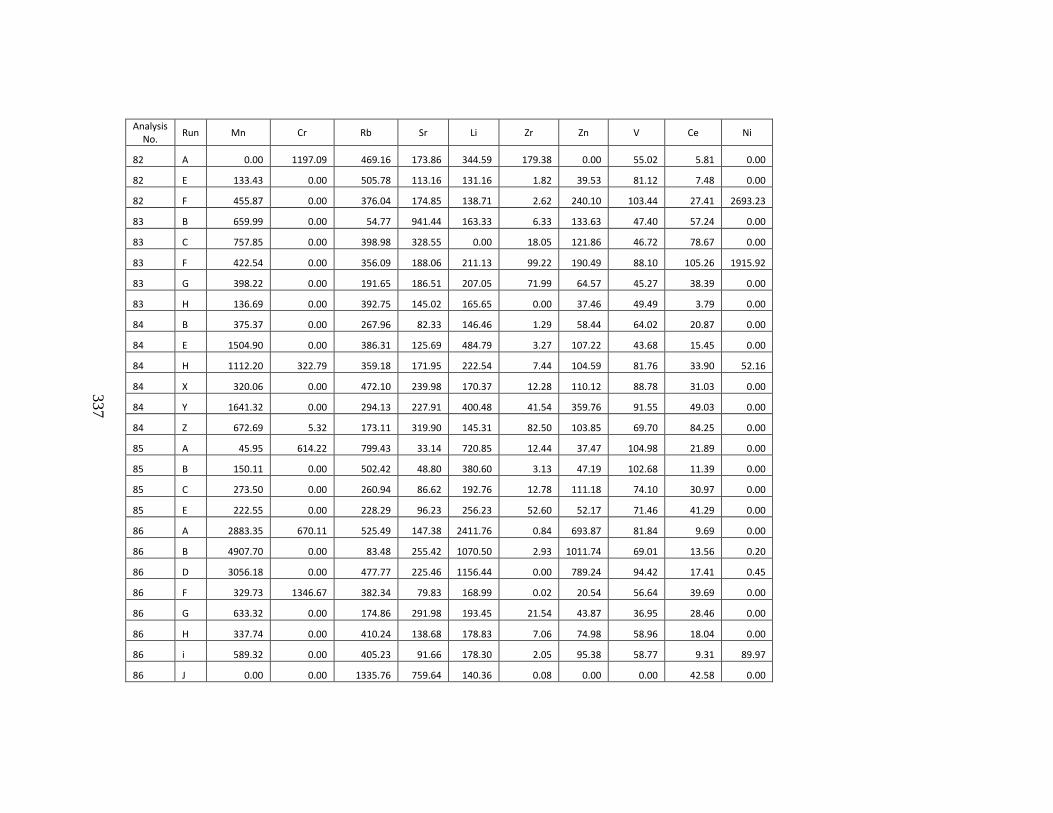
337
Analysis No.
Run Mn Cr Rb Sr Li Zr Zn V Ce Ni
82 A 0.00 1197.09 469.16 173.86 344.59 179.38 0.00 55.02 5.81 0.00
82 E 133.43 0.00 505.78 113.16 131.16 1.82 39.53 81.12 7.48 0.00
82 F 455.87 0.00 376.04 174.85 138.71 2.62 240.10 103.44 27.41 2693.23
83 B 659.99 0.00 54.77 941.44 163.33 6.33 133.63 47.40 57.24 0.00
83 C 757.85 0.00 398.98 328.55 0.00 18.05 121.86 46.72 78.67 0.00
83 F 422.54 0.00 356.09 188.06 211.13 99.22 190.49 88.10 105.26 1915.92
83 G 398.22 0.00 191.65 186.51 207.05 71.99 64.57 45.27 38.39 0.00
83 H 136.69 0.00 392.75 145.02 165.65 0.00 37.46 49.49 3.79 0.00
84 B 375.37 0.00 267.96 82.33 146.46 1.29 58.44 64.02 20.87 0.00
84 E 1504.90 0.00 386.31 125.69 484.79 3.27 107.22 43.68 15.45 0.00
84 H 1112.20 322.79 359.18 171.95 222.54 7.44 104.59 81.76 33.90 52.16
84 X 320.06 0.00 472.10 239.98 170.37 12.28 110.12 88.78 31.03 0.00
84 Y 1641.32 0.00 294.13 227.91 400.48 41.54 359.76 91.55 49.03 0.00
84 Z 672.69 5.32 173.11 319.90 145.31 82.50 103.85 69.70 84.25 0.00
85 A 45.95 614.22 799.43 33.14 720.85 12.44 37.47 104.98 21.89 0.00
85 B 150.11 0.00 502.42 48.80 380.60 3.13 47.19 102.68 11.39 0.00
85 C 273.50 0.00 260.94 86.62 192.76 12.78 111.18 74.10 30.97 0.00
85 E 222.55 0.00 228.29 96.23 256.23 52.60 52.17 71.46 41.29 0.00
86 A 2883.35 670.11 525.49 147.38 2411.76 0.84 693.87 81.84 9.69 0.00
86 B 4907.70 0.00 83.48 255.42 1070.50 2.93 1011.74 69.01 13.56 0.20
86 D 3056.18 0.00 477.77 225.46 1156.44 0.00 789.24 94.42 17.41 0.45
86 F 329.73 1346.67 382.34 79.83 168.99 0.02 20.54 56.64 39.69 0.00
86 G 633.32 0.00 174.86 291.98 193.45 21.54 43.87 36.95 28.46 0.00
86 H 337.74 0.00 410.24 138.68 178.83 7.06 74.98 58.96 18.04 0.00
86 i 589.32 0.00 405.23 91.66 178.30 2.05 95.38 58.77 9.31 89.97
86 J 0.00 0.00 1335.76 759.64 140.36 0.08 0.00 0.00 42.58 0.00
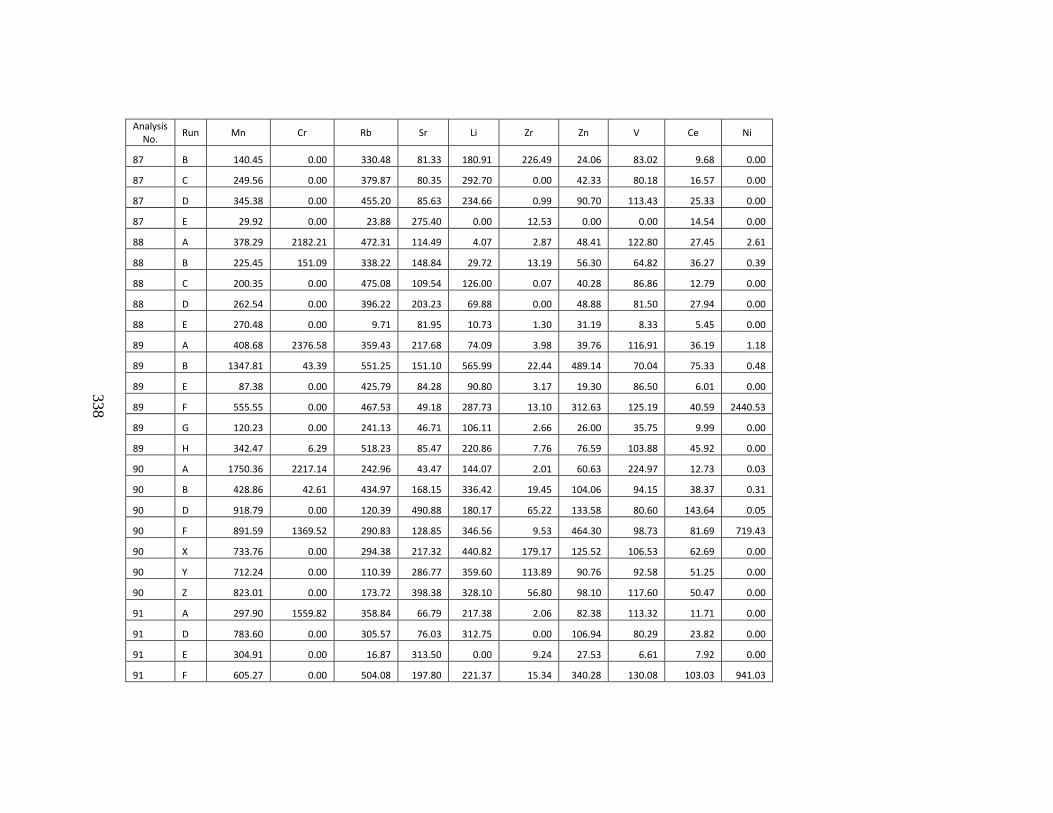
338
Analysis No.
Run Mn Cr Rb Sr Li Zr Zn V Ce Ni
87 B 140.45 0.00 330.48 81.33 180.91 226.49 24.06 83.02 9.68 0.00
87 C 249.56 0.00 379.87 80.35 292.70 0.00 42.33 80.18 16.57 0.00
87 D 345.38 0.00 455.20 85.63 234.66 0.99 90.70 113.43 25.33 0.00
87 E 29.92 0.00 23.88 275.40 0.00 12.53 0.00 0.00 14.54 0.00
88 A 378.29 2182.21 472.31 114.49 4.07 2.87 48.41 122.80 27.45 2.61
88 B 225.45 151.09 338.22 148.84 29.72 13.19 56.30 64.82 36.27 0.39
88 C 200.35 0.00 475.08 109.54 126.00 0.07 40.28 86.86 12.79 0.00
88 D 262.54 0.00 396.22 203.23 69.88 0.00 48.88 81.50 27.94 0.00
88 E 270.48 0.00 9.71 81.95 10.73 1.30 31.19 8.33 5.45 0.00
89 A 408.68 2376.58 359.43 217.68 74.09 3.98 39.76 116.91 36.19 1.18
89 B 1347.81 43.39 551.25 151.10 565.99 22.44 489.14 70.04 75.33 0.48
89 E 87.38 0.00 425.79 84.28 90.80 3.17 19.30 86.50 6.01 0.00
89 F 555.55 0.00 467.53 49.18 287.73 13.10 312.63 125.19 40.59 2440.53
89 G 120.23 0.00 241.13 46.71 106.11 2.66 26.00 35.75 9.99 0.00
89 H 342.47 6.29 518.23 85.47 220.86 7.76 76.59 103.88 45.92 0.00
90 A 1750.36 2217.14 242.96 43.47 144.07 2.01 60.63 224.97 12.73 0.03
90 B 428.86 42.61 434.97 168.15 336.42 19.45 104.06 94.15 38.37 0.31
90 D 918.79 0.00 120.39 490.88 180.17 65.22 133.58 80.60 143.64 0.05
90 F 891.59 1369.52 290.83 128.85 346.56 9.53 464.30 98.73 81.69 719.43
90 X 733.76 0.00 294.38 217.32 440.82 179.17 125.52 106.53 62.69 0.00
90 Y 712.24 0.00 110.39 286.77 359.60 113.89 90.76 92.58 51.25 0.00
90 Z 823.01 0.00 173.72 398.38 328.10 56.80 98.10 117.60 50.47 0.00
91 A 297.90 1559.82 358.84 66.79 217.38 2.06 82.38 113.32 11.71 0.00
91 D 783.60 0.00 305.57 76.03 312.75 0.00 106.94 80.29 23.82 0.00
91 E 304.91 0.00 16.87 313.50 0.00 9.24 27.53 6.61 7.92 0.00
91 F 605.27 0.00 504.08 197.80 221.37 15.34 340.28 130.08 103.03 941.03
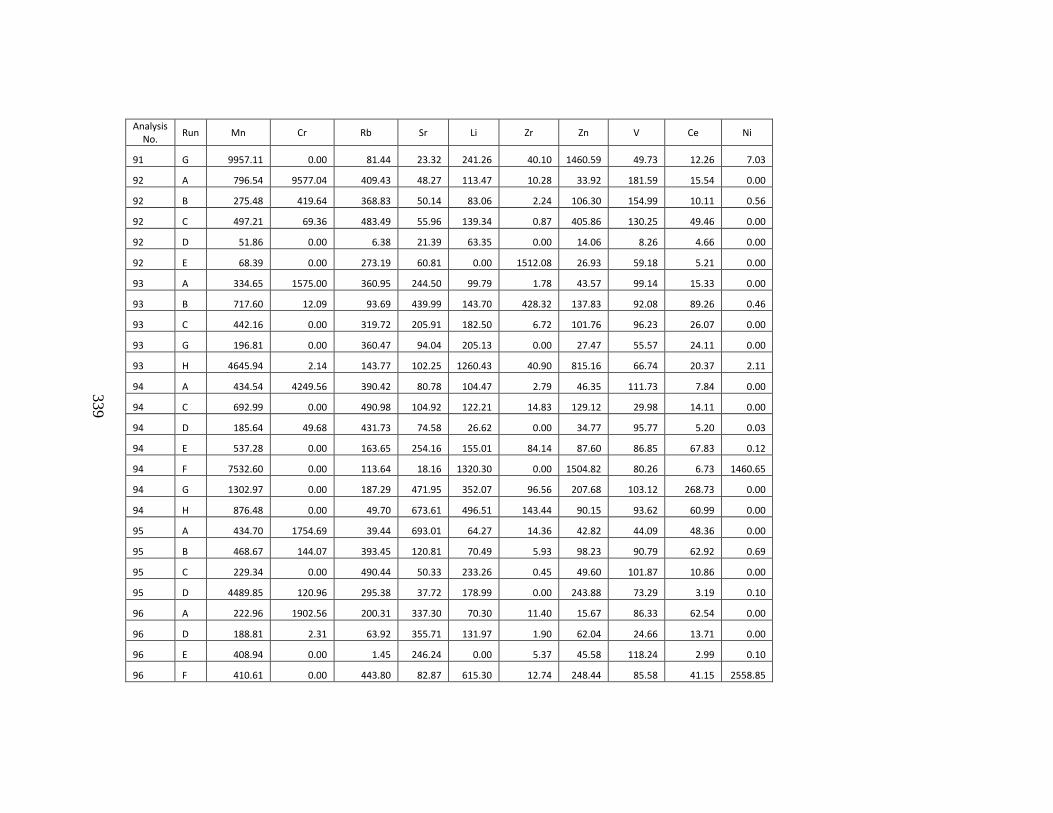
339
Analysis No.
Run Mn Cr Rb Sr Li Zr Zn V Ce Ni
91 G 9957.11 0.00 81.44 23.32 241.26 40.10 1460.59 49.73 12.26 7.03
92 A 796.54 9577.04 409.43 48.27 113.47 10.28 33.92 181.59 15.54 0.00
92 B 275.48 419.64 368.83 50.14 83.06 2.24 106.30 154.99 10.11 0.56
92 C 497.21 69.36 483.49 55.96 139.34 0.87 405.86 130.25 49.46 0.00
92 D 51.86 0.00 6.38 21.39 63.35 0.00 14.06 8.26 4.66 0.00
92 E 68.39 0.00 273.19 60.81 0.00 1512.08 26.93 59.18 5.21 0.00
93 A 334.65 1575.00 360.95 244.50 99.79 1.78 43.57 99.14 15.33 0.00
93 B 717.60 12.09 93.69 439.99 143.70 428.32 137.83 92.08 89.26 0.46
93 C 442.16 0.00 319.72 205.91 182.50 6.72 101.76 96.23 26.07 0.00
93 G 196.81 0.00 360.47 94.04 205.13 0.00 27.47 55.57 24.11 0.00
93 H 4645.94 2.14 143.77 102.25 1260.43 40.90 815.16 66.74 20.37 2.11
94 A 434.54 4249.56 390.42 80.78 104.47 2.79 46.35 111.73 7.84 0.00
94 C 692.99 0.00 490.98 104.92 122.21 14.83 129.12 29.98 14.11 0.00
94 D 185.64 49.68 431.73 74.58 26.62 0.00 34.77 95.77 5.20 0.03
94 E 537.28 0.00 163.65 254.16 155.01 84.14 87.60 86.85 67.83 0.12
94 F 7532.60 0.00 113.64 18.16 1320.30 0.00 1504.82 80.26 6.73 1460.65
94 G 1302.97 0.00 187.29 471.95 352.07 96.56 207.68 103.12 268.73 0.00
94 H 876.48 0.00 49.70 673.61 496.51 143.44 90.15 93.62 60.99 0.00
95 A 434.70 1754.69 39.44 693.01 64.27 14.36 42.82 44.09 48.36 0.00
95 B 468.67 144.07 393.45 120.81 70.49 5.93 98.23 90.79 62.92 0.69
95 C 229.34 0.00 490.44 50.33 233.26 0.45 49.60 101.87 10.86 0.00
95 D 4489.85 120.96 295.38 37.72 178.99 0.00 243.88 73.29 3.19 0.10
96 A 222.96 1902.56 200.31 337.30 70.30 11.40 15.67 86.33 62.54 0.00
96 D 188.81 2.31 63.92 355.71 131.97 1.90 62.04 24.66 13.71 0.00
96 E 408.94 0.00 1.45 246.24 0.00 5.37 45.58 118.24 2.99 0.10
96 F 410.61 0.00 443.80 82.87 615.30 12.74 248.44 85.58 41.15 2558.85
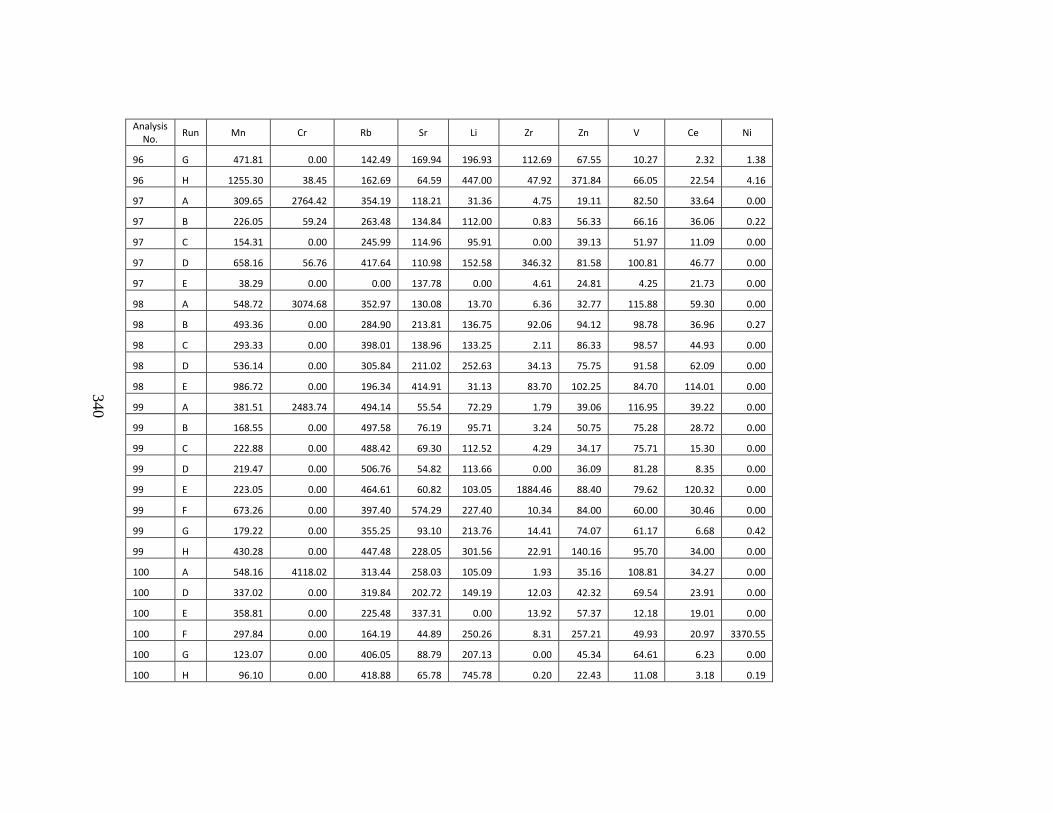
340
Analysis No.
Run Mn Cr Rb Sr Li Zr Zn V Ce Ni
96 G 471.81 0.00 142.49 169.94 196.93 112.69 67.55 10.27 2.32 1.38
96 H 1255.30 38.45 162.69 64.59 447.00 47.92 371.84 66.05 22.54 4.16
97 A 309.65 2764.42 354.19 118.21 31.36 4.75 19.11 82.50 33.64 0.00
97 B 226.05 59.24 263.48 134.84 112.00 0.83 56.33 66.16 36.06 0.22
97 C 154.31 0.00 245.99 114.96 95.91 0.00 39.13 51.97 11.09 0.00
97 D 658.16 56.76 417.64 110.98 152.58 346.32 81.58 100.81 46.77 0.00
97 E 38.29 0.00 0.00 137.78 0.00 4.61 24.81 4.25 21.73 0.00
98 A 548.72 3074.68 352.97 130.08 13.70 6.36 32.77 115.88 59.30 0.00
98 B 493.36 0.00 284.90 213.81 136.75 92.06 94.12 98.78 36.96 0.27
98 C 293.33 0.00 398.01 138.96 133.25 2.11 86.33 98.57 44.93 0.00
98 D 536.14 0.00 305.84 211.02 252.63 34.13 75.75 91.58 62.09 0.00
98 E 986.72 0.00 196.34 414.91 31.13 83.70 102.25 84.70 114.01 0.00
99 A 381.51 2483.74 494.14 55.54 72.29 1.79 39.06 116.95 39.22 0.00
99 B 168.55 0.00 497.58 76.19 95.71 3.24 50.75 75.28 28.72 0.00
99 C 222.88 0.00 488.42 69.30 112.52 4.29 34.17 75.71 15.30 0.00
99 D 219.47 0.00 506.76 54.82 113.66 0.00 36.09 81.28 8.35 0.00
99 E 223.05 0.00 464.61 60.82 103.05 1884.46 88.40 79.62 120.32 0.00
99 F 673.26 0.00 397.40 574.29 227.40 10.34 84.00 60.00 30.46 0.00
99 G 179.22 0.00 355.25 93.10 213.76 14.41 74.07 61.17 6.68 0.42
99 H 430.28 0.00 447.48 228.05 301.56 22.91 140.16 95.70 34.00 0.00
100 A 548.16 4118.02 313.44 258.03 105.09 1.93 35.16 108.81 34.27 0.00
100 D 337.02 0.00 319.84 202.72 149.19 12.03 42.32 69.54 23.91 0.00
100 E 358.81 0.00 225.48 337.31 0.00 13.92 57.37 12.18 19.01 0.00
100 F 297.84 0.00 164.19 44.89 250.26 8.31 257.21 49.93 20.97 3370.55
100 G 123.07 0.00 406.05 88.79 207.13 0.00 45.34 64.61 6.23 0.00
100 H 96.10 0.00 418.88 65.78 745.78 0.20 22.43 11.08 3.18 0.19
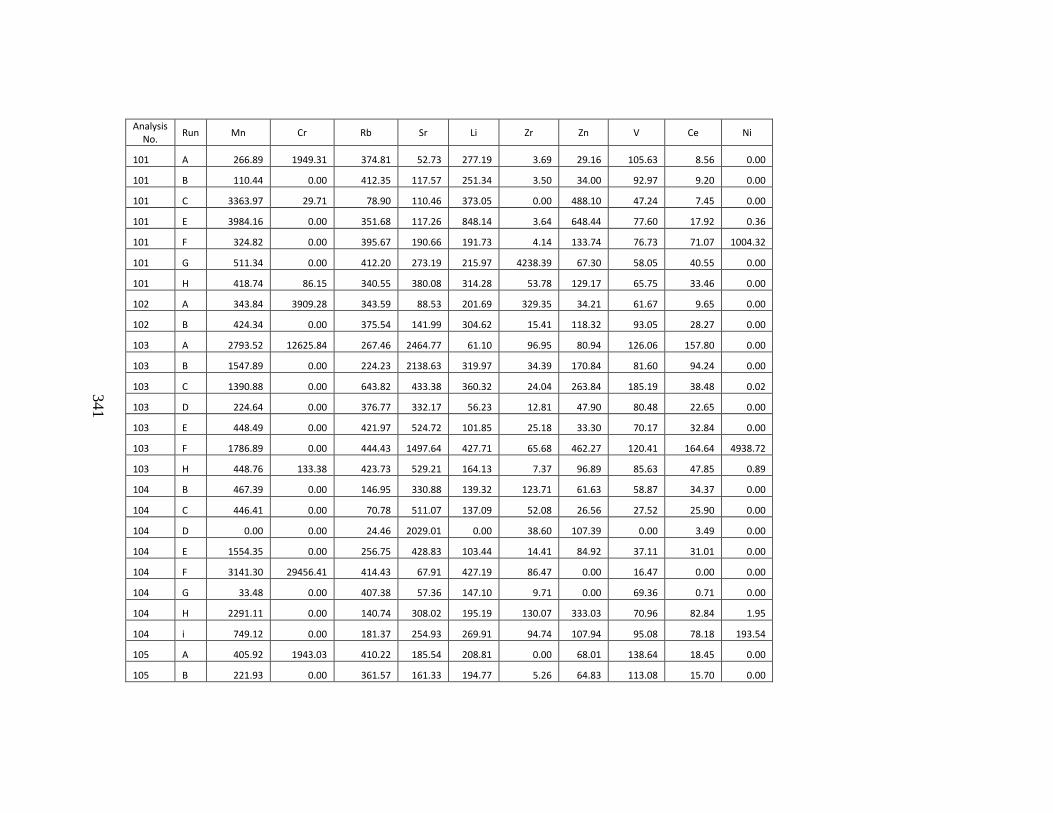
341
Analysis No.
Run Mn Cr Rb Sr Li Zr Zn V Ce Ni
101 A 266.89 1949.31 374.81 52.73 277.19 3.69 29.16 105.63 8.56 0.00
101 B 110.44 0.00 412.35 117.57 251.34 3.50 34.00 92.97 9.20 0.00
101 C 3363.97 29.71 78.90 110.46 373.05 0.00 488.10 47.24 7.45 0.00
101 E 3984.16 0.00 351.68 117.26 848.14 3.64 648.44 77.60 17.92 0.36
101 F 324.82 0.00 395.67 190.66 191.73 4.14 133.74 76.73 71.07 1004.32
101 G 511.34 0.00 412.20 273.19 215.97 4238.39 67.30 58.05 40.55 0.00
101 H 418.74 86.15 340.55 380.08 314.28 53.78 129.17 65.75 33.46 0.00
102 A 343.84 3909.28 343.59 88.53 201.69 329.35 34.21 61.67 9.65 0.00
102 B 424.34 0.00 375.54 141.99 304.62 15.41 118.32 93.05 28.27 0.00
103 A 2793.52 12625.84 267.46 2464.77 61.10 96.95 80.94 126.06 157.80 0.00
103 B 1547.89 0.00 224.23 2138.63 319.97 34.39 170.84 81.60 94.24 0.00
103 C 1390.88 0.00 643.82 433.38 360.32 24.04 263.84 185.19 38.48 0.02
103 D 224.64 0.00 376.77 332.17 56.23 12.81 47.90 80.48 22.65 0.00
103 E 448.49 0.00 421.97 524.72 101.85 25.18 33.30 70.17 32.84 0.00
103 F 1786.89 0.00 444.43 1497.64 427.71 65.68 462.27 120.41 164.64 4938.72
103 H 448.76 133.38 423.73 529.21 164.13 7.37 96.89 85.63 47.85 0.89
104 B 467.39 0.00 146.95 330.88 139.32 123.71 61.63 58.87 34.37 0.00
104 C 446.41 0.00 70.78 511.07 137.09 52.08 26.56 27.52 25.90 0.00
104 D 0.00 0.00 24.46 2029.01 0.00 38.60 107.39 0.00 3.49 0.00
104 E 1554.35 0.00 256.75 428.83 103.44 14.41 84.92 37.11 31.01 0.00
104 F 3141.30 29456.41 414.43 67.91 427.19 86.47 0.00 16.47 0.00 0.00
104 G 33.48 0.00 407.38 57.36 147.10 9.71 0.00 69.36 0.71 0.00
104 H 2291.11 0.00 140.74 308.02 195.19 130.07 333.03 70.96 82.84 1.95
104 i 749.12 0.00 181.37 254.93 269.91 94.74 107.94 95.08 78.18 193.54
105 A 405.92 1943.03 410.22 185.54 208.81 0.00 68.01 138.64 18.45 0.00
105 B 221.93 0.00 361.57 161.33 194.77 5.26 64.83 113.08 15.70 0.00

342
Analysis No.
Run Mn Cr Rb Sr Li Zr Zn V Ce Ni
105 C 191.56 0.00 372.85 70.97 0.00 9.15 45.62 55.40 9.04 0.00
105 D 91.35 0.00 385.95 88.24 0.00 1.67 6.41 67.66 8.30 0.00
106 A 561.24 1978.02 396.86 269.24 281.90 0.00 103.14 96.61 55.50 0.00
106 B 620.32 0.00 45.28 279.12 181.21 14.15 114.21 28.97 73.81 0.00
106 C 557.46 0.00 503.09 100.82 309.68 4.82 90.30 133.78 13.06 0.00
106 F 397.97 0.00 350.11 144.25 312.25 7.13 149.75 47.17 13.91 1301.87
106 G 5033.23 0.00 807.55 169.58 635.65 61.77 585.78 151.18 38.15 0.00
106 H 987.91 150.81 185.55 253.93 363.14 117.27 181.88 99.72 90.56 3.34
107 A 8652.54 2060.82 12.89 406.96 597.51 7.31 1103.47 37.46 54.54 89.67
107 B 781.80 0.00 343.83 1038.36 179.04 184.12 117.12 89.54 160.23 0.00
107 D 214.43 0.00 421.75 151.34 64.13 10131.07 25.12 86.48 63.70 0.05
107 E 100.47 0.00 488.60 60.68 45.21 0.00 16.53 88.43 4.64 0.00
107 G 1455.93 0.00 206.32 1481.24 169.27 70.78 165.21 52.10 356.82 0.07
107 H 1212.00 0.00 283.99 505.41 303.79 59.13 182.35 121.14 143.45 0.00
107 J 11067.01 0.00 51.19 263.10 658.95 0.97 1183.82 39.14 49.70 0.00
108 A 544.49 2381.99 488.44 270.96 408.53 0.00 31.33 118.90 671.98 0.00
108 B 303.88 0.00 120.80 520.07 37.54 53.11 17.49 10.16 64.79 0.00
108 C 275.65 0.00 323.53 224.78 292.10 6.14 45.76 62.93 33.52 0.00
108 D 114.57 0.00 461.93 66.29 219.39 5.09 22.50 94.79 46.29 0.00
108 E 151.98 0.00 411.33 123.63 341.60 4.71 37.88 83.95 24.02 0.00
108 G 94.36 0.00 319.17 97.21 164.73 0.53 7.06 52.12 7.81 0.00
108 i 926.34 0.00 42.85 766.21 288.18 6.08 73.41 26.76 134.90 0.00
108 J 969.45 0.00 284.95 509.62 366.40 67.45 135.03 100.52 111.75 0.00
109 A 1040.75 1535.00 266.26 684.13 240.35 1.39 31.73 36.62 17.70 0.00
109 C 166.06 0.00 375.17 96.22 64.56 56.14 70.76 57.78 28.04 0.00
109 D 1025.70 0.00 500.03 54.30 233.31 3.71 88.84 49.21 2.89 0.00
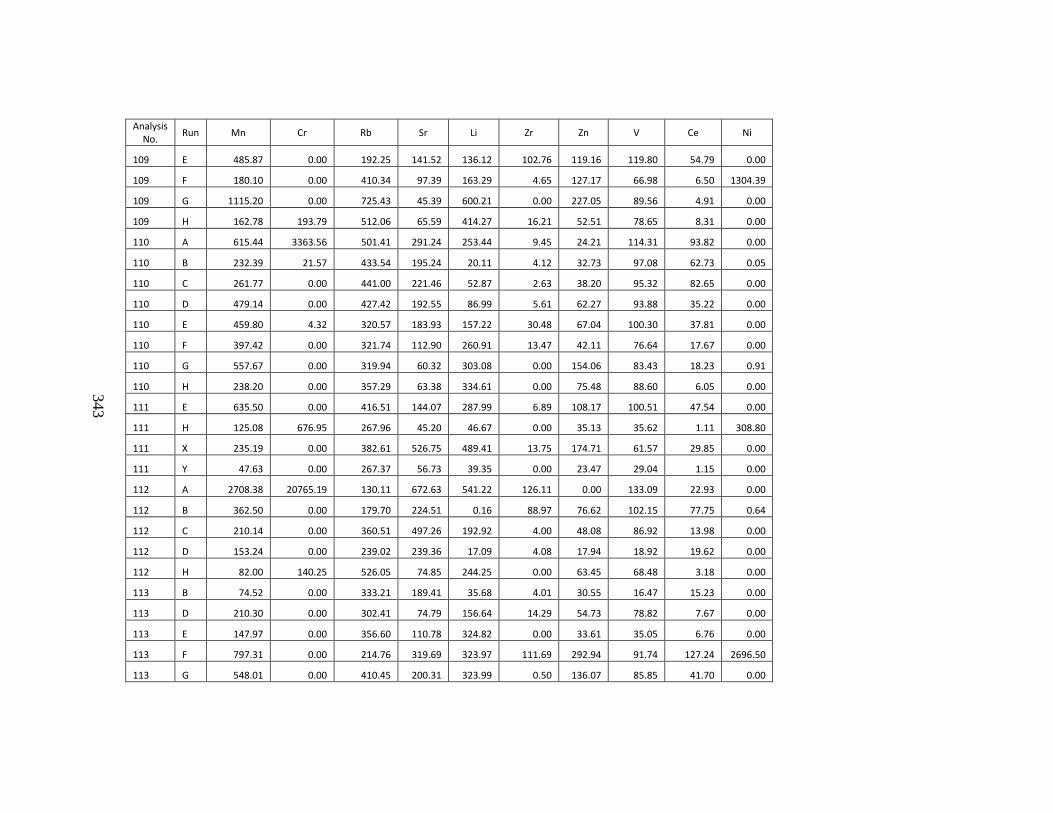
343
Analysis No.
Run Mn Cr Rb Sr Li Zr Zn V Ce Ni
109 E 485.87 0.00 192.25 141.52 136.12 102.76 119.16 119.80 54.79 0.00
109 F 180.10 0.00 410.34 97.39 163.29 4.65 127.17 66.98 6.50 1304.39
109 G 1115.20 0.00 725.43 45.39 600.21 0.00 227.05 89.56 4.91 0.00
109 H 162.78 193.79 512.06 65.59 414.27 16.21 52.51 78.65 8.31 0.00
110 A 615.44 3363.56 501.41 291.24 253.44 9.45 24.21 114.31 93.82 0.00
110 B 232.39 21.57 433.54 195.24 20.11 4.12 32.73 97.08 62.73 0.05
110 C 261.77 0.00 441.00 221.46 52.87 2.63 38.20 95.32 82.65 0.00
110 D 479.14 0.00 427.42 192.55 86.99 5.61 62.27 93.88 35.22 0.00
110 E 459.80 4.32 320.57 183.93 157.22 30.48 67.04 100.30 37.81 0.00
110 F 397.42 0.00 321.74 112.90 260.91 13.47 42.11 76.64 17.67 0.00
110 G 557.67 0.00 319.94 60.32 303.08 0.00 154.06 83.43 18.23 0.91
110 H 238.20 0.00 357.29 63.38 334.61 0.00 75.48 88.60 6.05 0.00
111 E 635.50 0.00 416.51 144.07 287.99 6.89 108.17 100.51 47.54 0.00
111 H 125.08 676.95 267.96 45.20 46.67 0.00 35.13 35.62 1.11 308.80
111 X 235.19 0.00 382.61 526.75 489.41 13.75 174.71 61.57 29.85 0.00
111 Y 47.63 0.00 267.37 56.73 39.35 0.00 23.47 29.04 1.15 0.00
112 A 2708.38 20765.19 130.11 672.63 541.22 126.11 0.00 133.09 22.93 0.00
112 B 362.50 0.00 179.70 224.51 0.16 88.97 76.62 102.15 77.75 0.64
112 C 210.14 0.00 360.51 497.26 192.92 4.00 48.08 86.92 13.98 0.00
112 D 153.24 0.00 239.02 239.36 17.09 4.08 17.94 18.92 19.62 0.00
112 H 82.00 140.25 526.05 74.85 244.25 0.00 63.45 68.48 3.18 0.00
113 B 74.52 0.00 333.21 189.41 35.68 4.01 30.55 16.47 15.23 0.00
113 D 210.30 0.00 302.41 74.79 156.64 14.29 54.73 78.82 7.67 0.00
113 E 147.97 0.00 356.60 110.78 324.82 0.00 33.61 35.05 6.76 0.00
113 F 797.31 0.00 214.76 319.69 323.97 111.69 292.94 91.74 127.24 2696.50
113 G 548.01 0.00 410.45 200.31 323.99 0.50 136.07 85.85 41.70 0.00
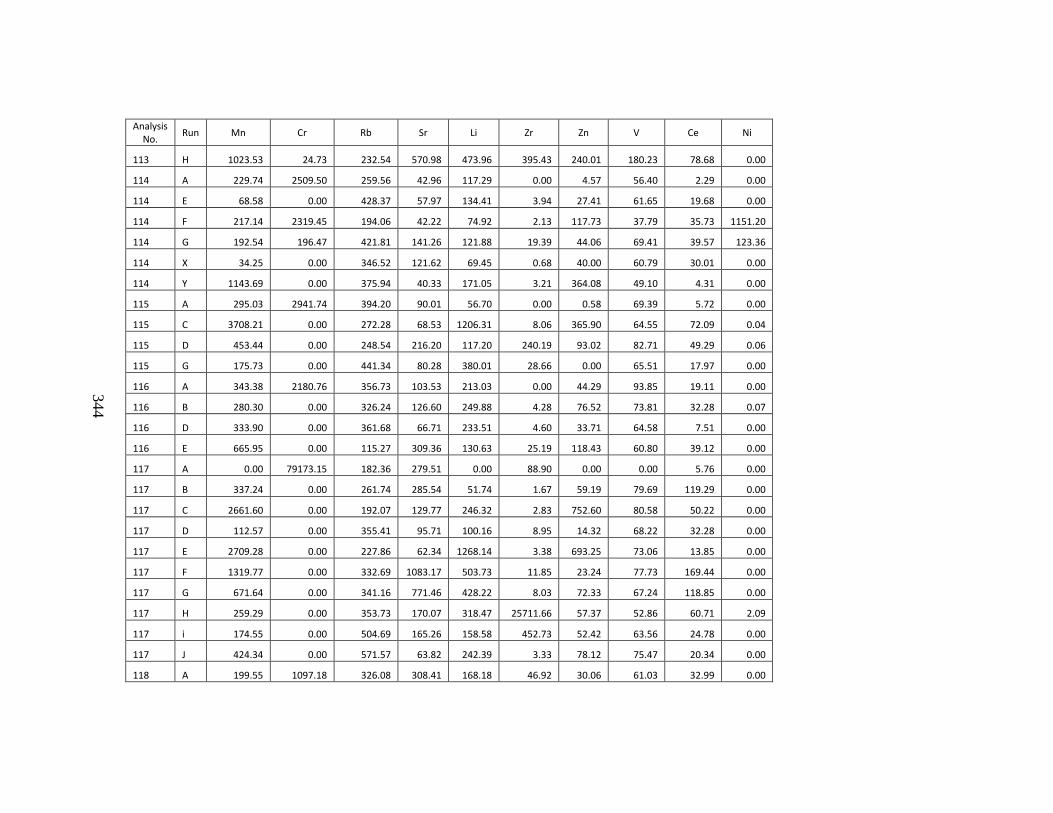
344
Analysis No.
Run Mn Cr Rb Sr Li Zr Zn V Ce Ni
113 H 1023.53 24.73 232.54 570.98 473.96 395.43 240.01 180.23 78.68 0.00
114 A 229.74 2509.50 259.56 42.96 117.29 0.00 4.57 56.40 2.29 0.00
114 E 68.58 0.00 428.37 57.97 134.41 3.94 27.41 61.65 19.68 0.00
114 F 217.14 2319.45 194.06 42.22 74.92 2.13 117.73 37.79 35.73 1151.20
114 G 192.54 196.47 421.81 141.26 121.88 19.39 44.06 69.41 39.57 123.36
114 X 34.25 0.00 346.52 121.62 69.45 0.68 40.00 60.79 30.01 0.00
114 Y 1143.69 0.00 375.94 40.33 171.05 3.21 364.08 49.10 4.31 0.00
115 A 295.03 2941.74 394.20 90.01 56.70 0.00 0.58 69.39 5.72 0.00
115 C 3708.21 0.00 272.28 68.53 1206.31 8.06 365.90 64.55 72.09 0.04
115 D 453.44 0.00 248.54 216.20 117.20 240.19 93.02 82.71 49.29 0.06
115 G 175.73 0.00 441.34 80.28 380.01 28.66 0.00 65.51 17.97 0.00
116 A 343.38 2180.76 356.73 103.53 213.03 0.00 44.29 93.85 19.11 0.00
116 B 280.30 0.00 326.24 126.60 249.88 4.28 76.52 73.81 32.28 0.07
116 D 333.90 0.00 361.68 66.71 233.51 4.60 33.71 64.58 7.51 0.00
116 E 665.95 0.00 115.27 309.36 130.63 25.19 118.43 60.80 39.12 0.00
117 A 0.00 79173.15 182.36 279.51 0.00 88.90 0.00 0.00 5.76 0.00
117 B 337.24 0.00 261.74 285.54 51.74 1.67 59.19 79.69 119.29 0.00
117 C 2661.60 0.00 192.07 129.77 246.32 2.83 752.60 80.58 50.22 0.00
117 D 112.57 0.00 355.41 95.71 100.16 8.95 14.32 68.22 32.28 0.00
117 E 2709.28 0.00 227.86 62.34 1268.14 3.38 693.25 73.06 13.85 0.00
117 F 1319.77 0.00 332.69 1083.17 503.73 11.85 23.24 77.73 169.44 0.00
117 G 671.64 0.00 341.16 771.46 428.22 8.03 72.33 67.24 118.85 0.00
117 H 259.29 0.00 353.73 170.07 318.47 25711.66 57.37 52.86 60.71 2.09
117 i 174.55 0.00 504.69 165.26 158.58 452.73 52.42 63.56 24.78 0.00
117 J 424.34 0.00 571.57 63.82 242.39 3.33 78.12 75.47 20.34 0.00
118 A 199.55 1097.18 326.08 308.41 168.18 46.92 30.06 61.03 32.99 0.00
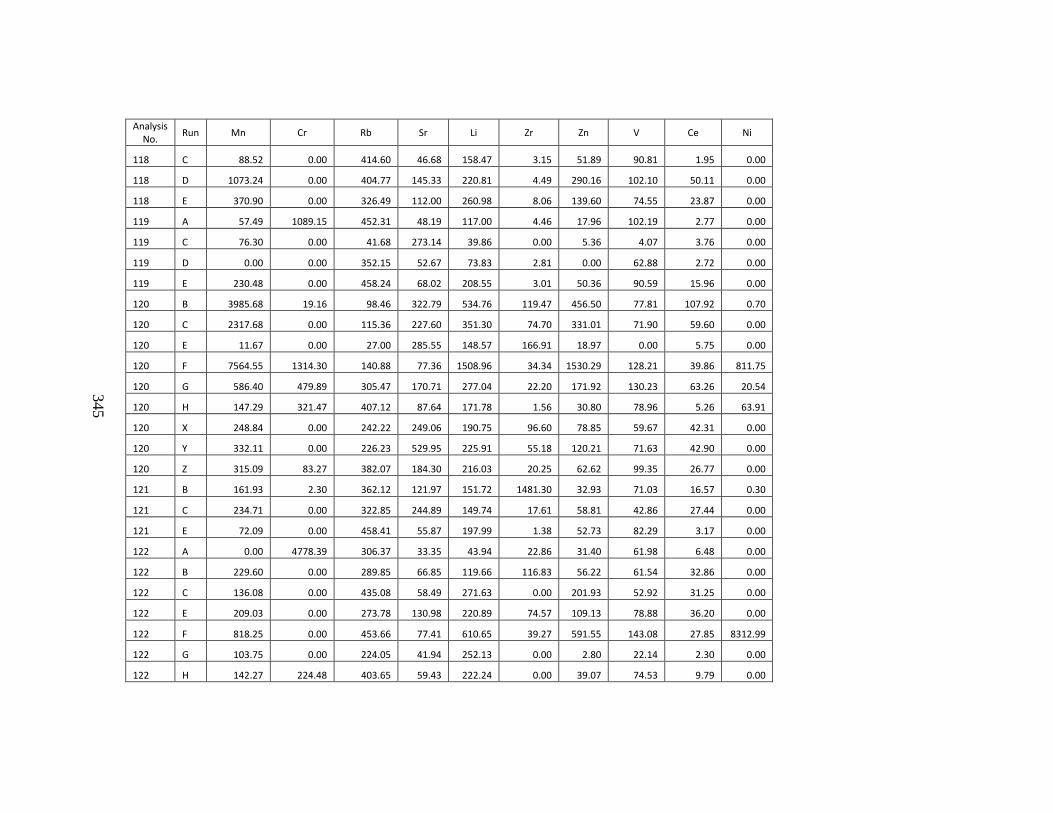
345
Analysis No.
Run Mn Cr Rb Sr Li Zr Zn V Ce Ni
118 C 88.52 0.00 414.60 46.68 158.47 3.15 51.89 90.81 1.95 0.00
118 D 1073.24 0.00 404.77 145.33 220.81 4.49 290.16 102.10 50.11 0.00
118 E 370.90 0.00 326.49 112.00 260.98 8.06 139.60 74.55 23.87 0.00
119 A 57.49 1089.15 452.31 48.19 117.00 4.46 17.96 102.19 2.77 0.00
119 C 76.30 0.00 41.68 273.14 39.86 0.00 5.36 4.07 3.76 0.00
119 D 0.00 0.00 352.15 52.67 73.83 2.81 0.00 62.88 2.72 0.00
119 E 230.48 0.00 458.24 68.02 208.55 3.01 50.36 90.59 15.96 0.00
120 B 3985.68 19.16 98.46 322.79 534.76 119.47 456.50 77.81 107.92 0.70
120 C 2317.68 0.00 115.36 227.60 351.30 74.70 331.01 71.90 59.60 0.00
120 E 11.67 0.00 27.00 285.55 148.57 166.91 18.97 0.00 5.75 0.00
120 F 7564.55 1314.30 140.88 77.36 1508.96 34.34 1530.29 128.21 39.86 811.75
120 G 586.40 479.89 305.47 170.71 277.04 22.20 171.92 130.23 63.26 20.54
120 H 147.29 321.47 407.12 87.64 171.78 1.56 30.80 78.96 5.26 63.91
120 X 248.84 0.00 242.22 249.06 190.75 96.60 78.85 59.67 42.31 0.00
120 Y 332.11 0.00 226.23 529.95 225.91 55.18 120.21 71.63 42.90 0.00
120 Z 315.09 83.27 382.07 184.30 216.03 20.25 62.62 99.35 26.77 0.00
121 B 161.93 2.30 362.12 121.97 151.72 1481.30 32.93 71.03 16.57 0.30
121 C 234.71 0.00 322.85 244.89 149.74 17.61 58.81 42.86 27.44 0.00
121 E 72.09 0.00 458.41 55.87 197.99 1.38 52.73 82.29 3.17 0.00
122 A 0.00 4778.39 306.37 33.35 43.94 22.86 31.40 61.98 6.48 0.00
122 B 229.60 0.00 289.85 66.85 119.66 116.83 56.22 61.54 32.86 0.00
122 C 136.08 0.00 435.08 58.49 271.63 0.00 201.93 52.92 31.25 0.00
122 E 209.03 0.00 273.78 130.98 220.89 74.57 109.13 78.88 36.20 0.00
122 F 818.25 0.00 453.66 77.41 610.65 39.27 591.55 143.08 27.85 8312.99
122 G 103.75 0.00 224.05 41.94 252.13 0.00 2.80 22.14 2.30 0.00
122 H 142.27 224.48 403.65 59.43 222.24 0.00 39.07 74.53 9.79 0.00
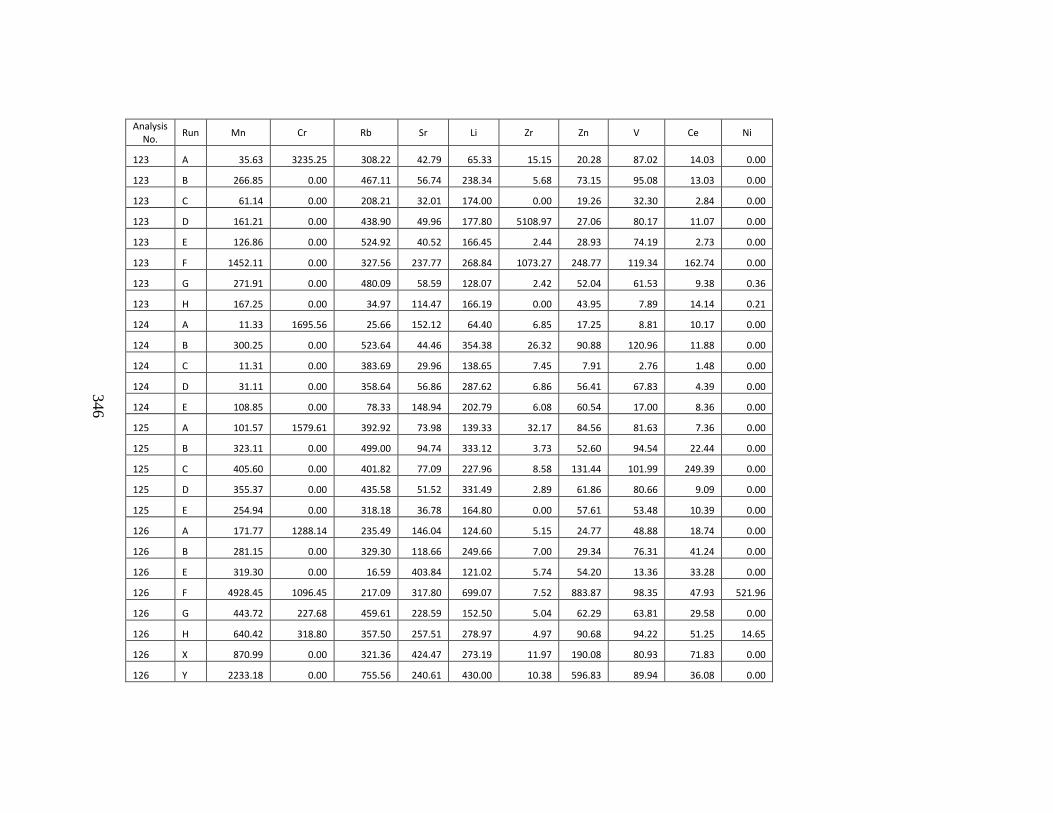
346
Analysis No.
Run Mn Cr Rb Sr Li Zr Zn V Ce Ni
123 A 35.63 3235.25 308.22 42.79 65.33 15.15 20.28 87.02 14.03 0.00
123 B 266.85 0.00 467.11 56.74 238.34 5.68 73.15 95.08 13.03 0.00
123 C 61.14 0.00 208.21 32.01 174.00 0.00 19.26 32.30 2.84 0.00
123 D 161.21 0.00 438.90 49.96 177.80 5108.97 27.06 80.17 11.07 0.00
123 E 126.86 0.00 524.92 40.52 166.45 2.44 28.93 74.19 2.73 0.00
123 F 1452.11 0.00 327.56 237.77 268.84 1073.27 248.77 119.34 162.74 0.00
123 G 271.91 0.00 480.09 58.59 128.07 2.42 52.04 61.53 9.38 0.36
123 H 167.25 0.00 34.97 114.47 166.19 0.00 43.95 7.89 14.14 0.21
124 A 11.33 1695.56 25.66 152.12 64.40 6.85 17.25 8.81 10.17 0.00
124 B 300.25 0.00 523.64 44.46 354.38 26.32 90.88 120.96 11.88 0.00
124 C 11.31 0.00 383.69 29.96 138.65 7.45 7.91 2.76 1.48 0.00
124 D 31.11 0.00 358.64 56.86 287.62 6.86 56.41 67.83 4.39 0.00
124 E 108.85 0.00 78.33 148.94 202.79 6.08 60.54 17.00 8.36 0.00
125 A 101.57 1579.61 392.92 73.98 139.33 32.17 84.56 81.63 7.36 0.00
125 B 323.11 0.00 499.00 94.74 333.12 3.73 52.60 94.54 22.44 0.00
125 C 405.60 0.00 401.82 77.09 227.96 8.58 131.44 101.99 249.39 0.00
125 D 355.37 0.00 435.58 51.52 331.49 2.89 61.86 80.66 9.09 0.00
125 E 254.94 0.00 318.18 36.78 164.80 0.00 57.61 53.48 10.39 0.00
126 A 171.77 1288.14 235.49 146.04 124.60 5.15 24.77 48.88 18.74 0.00
126 B 281.15 0.00 329.30 118.66 249.66 7.00 29.34 76.31 41.24 0.00
126 E 319.30 0.00 16.59 403.84 121.02 5.74 54.20 13.36 33.28 0.00
126 F 4928.45 1096.45 217.09 317.80 699.07 7.52 883.87 98.35 47.93 521.96
126 G 443.72 227.68 459.61 228.59 152.50 5.04 62.29 63.81 29.58 0.00
126 H 640.42 318.80 357.50 257.51 278.97 4.97 90.68 94.22 51.25 14.65
126 X 870.99 0.00 321.36 424.47 273.19 11.97 190.08 80.93 71.83 0.00
126 Y 2233.18 0.00 755.56 240.61 430.00 10.38 596.83 89.94 36.08 0.00
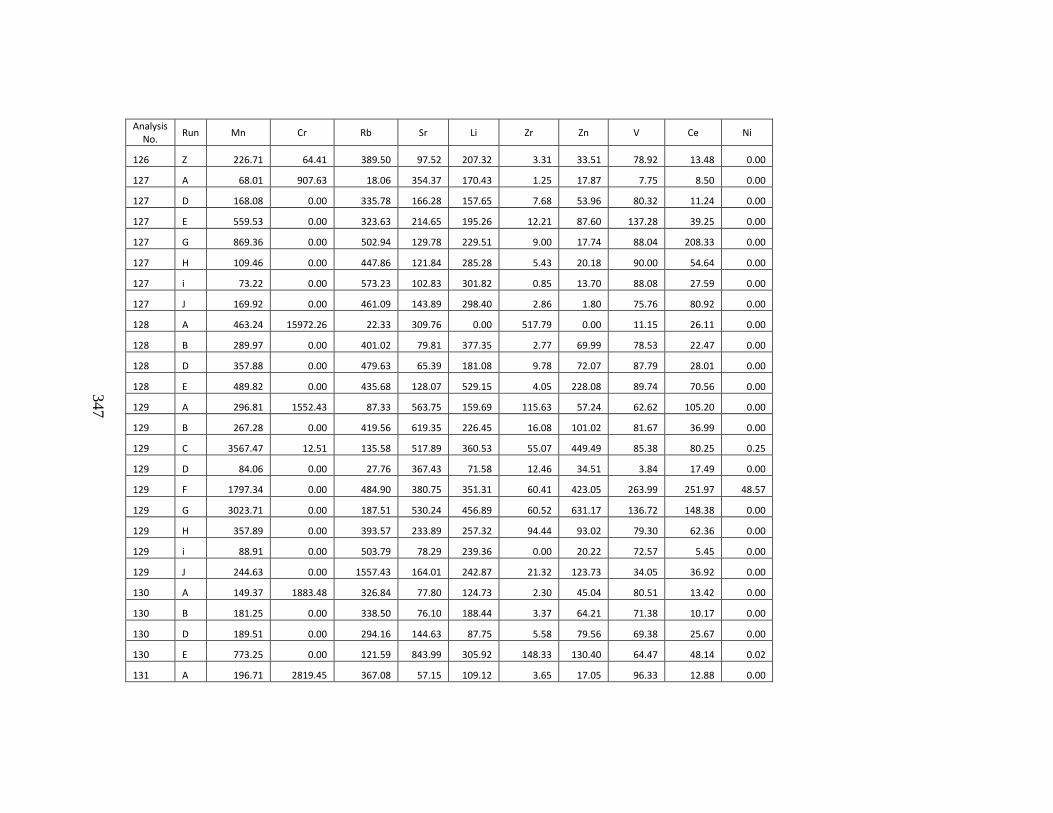
347
Analysis No.
Run Mn Cr Rb Sr Li Zr Zn V Ce Ni
126 Z 226.71 64.41 389.50 97.52 207.32 3.31 33.51 78.92 13.48 0.00
127 A 68.01 907.63 18.06 354.37 170.43 1.25 17.87 7.75 8.50 0.00
127 D 168.08 0.00 335.78 166.28 157.65 7.68 53.96 80.32 11.24 0.00
127 E 559.53 0.00 323.63 214.65 195.26 12.21 87.60 137.28 39.25 0.00
127 G 869.36 0.00 502.94 129.78 229.51 9.00 17.74 88.04 208.33 0.00
127 H 109.46 0.00 447.86 121.84 285.28 5.43 20.18 90.00 54.64 0.00
127 i 73.22 0.00 573.23 102.83 301.82 0.85 13.70 88.08 27.59 0.00
127 J 169.92 0.00 461.09 143.89 298.40 2.86 1.80 75.76 80.92 0.00
128 A 463.24 15972.26 22.33 309.76 0.00 517.79 0.00 11.15 26.11 0.00
128 B 289.97 0.00 401.02 79.81 377.35 2.77 69.99 78.53 22.47 0.00
128 D 357.88 0.00 479.63 65.39 181.08 9.78 72.07 87.79 28.01 0.00
128 E 489.82 0.00 435.68 128.07 529.15 4.05 228.08 89.74 70.56 0.00
129 A 296.81 1552.43 87.33 563.75 159.69 115.63 57.24 62.62 105.20 0.00
129 B 267.28 0.00 419.56 619.35 226.45 16.08 101.02 81.67 36.99 0.00
129 C 3567.47 12.51 135.58 517.89 360.53 55.07 449.49 85.38 80.25 0.25
129 D 84.06 0.00 27.76 367.43 71.58 12.46 34.51 3.84 17.49 0.00
129 F 1797.34 0.00 484.90 380.75 351.31 60.41 423.05 263.99 251.97 48.57
129 G 3023.71 0.00 187.51 530.24 456.89 60.52 631.17 136.72 148.38 0.00
129 H 357.89 0.00 393.57 233.89 257.32 94.44 93.02 79.30 62.36 0.00
129 i 88.91 0.00 503.79 78.29 239.36 0.00 20.22 72.57 5.45 0.00
129 J 244.63 0.00 1557.43 164.01 242.87 21.32 123.73 34.05 36.92 0.00
130 A 149.37 1883.48 326.84 77.80 124.73 2.30 45.04 80.51 13.42 0.00
130 B 181.25 0.00 338.50 76.10 188.44 3.37 64.21 71.38 10.17 0.00
130 D 189.51 0.00 294.16 144.63 87.75 5.58 79.56 69.38 25.67 0.00
130 E 773.25 0.00 121.59 843.99 305.92 148.33 130.40 64.47 48.14 0.02
131 A 196.71 2819.45 367.08 57.15 109.12 3.65 17.05 96.33 12.88 0.00
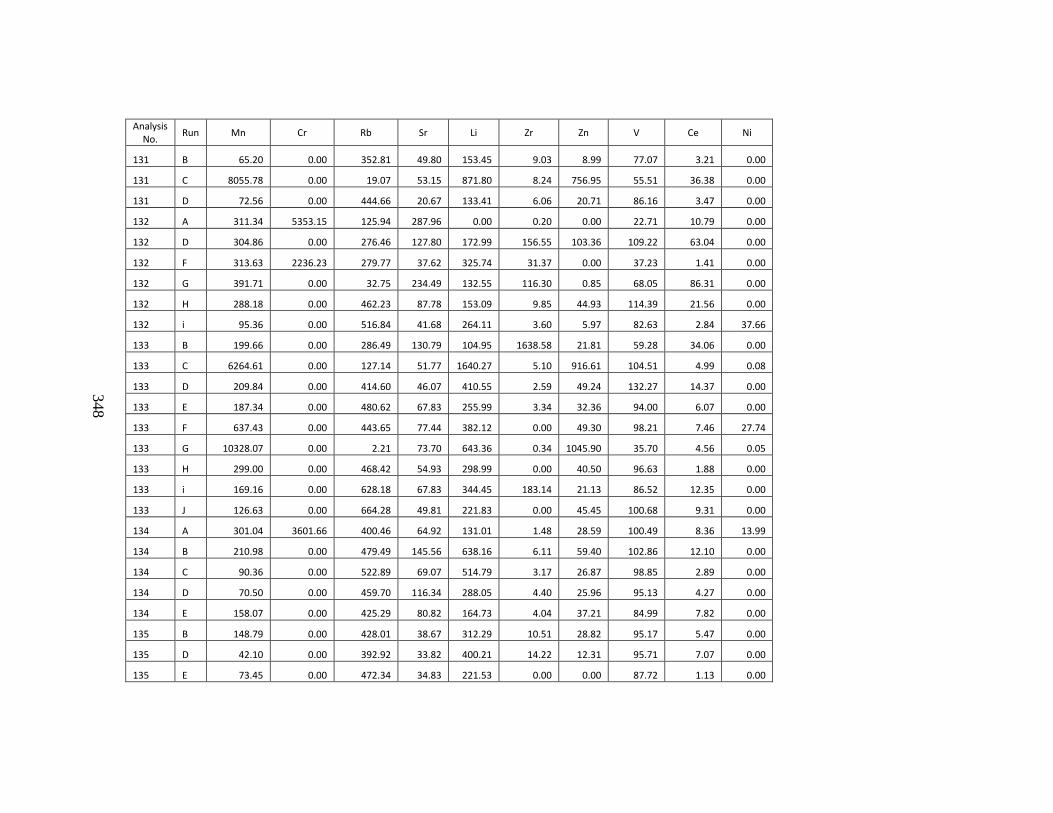
348
Analysis No.
Run Mn Cr Rb Sr Li Zr Zn V Ce Ni
131 B 65.20 0.00 352.81 49.80 153.45 9.03 8.99 77.07 3.21 0.00
131 C 8055.78 0.00 19.07 53.15 871.80 8.24 756.95 55.51 36.38 0.00
131 D 72.56 0.00 444.66 20.67 133.41 6.06 20.71 86.16 3.47 0.00
132 A 311.34 5353.15 125.94 287.96 0.00 0.20 0.00 22.71 10.79 0.00
132 D 304.86 0.00 276.46 127.80 172.99 156.55 103.36 109.22 63.04 0.00
132 F 313.63 2236.23 279.77 37.62 325.74 31.37 0.00 37.23 1.41 0.00
132 G 391.71 0.00 32.75 234.49 132.55 116.30 0.85 68.05 86.31 0.00
132 H 288.18 0.00 462.23 87.78 153.09 9.85 44.93 114.39 21.56 0.00
132 i 95.36 0.00 516.84 41.68 264.11 3.60 5.97 82.63 2.84 37.66
133 B 199.66 0.00 286.49 130.79 104.95 1638.58 21.81 59.28 34.06 0.00
133 C 6264.61 0.00 127.14 51.77 1640.27 5.10 916.61 104.51 4.99 0.08
133 D 209.84 0.00 414.60 46.07 410.55 2.59 49.24 132.27 14.37 0.00
133 E 187.34 0.00 480.62 67.83 255.99 3.34 32.36 94.00 6.07 0.00
133 F 637.43 0.00 443.65 77.44 382.12 0.00 49.30 98.21 7.46 27.74
133 G 10328.07 0.00 2.21 73.70 643.36 0.34 1045.90 35.70 4.56 0.05
133 H 299.00 0.00 468.42 54.93 298.99 0.00 40.50 96.63 1.88 0.00
133 i 169.16 0.00 628.18 67.83 344.45 183.14 21.13 86.52 12.35 0.00
133 J 126.63 0.00 664.28 49.81 221.83 0.00 45.45 100.68 9.31 0.00
134 A 301.04 3601.66 400.46 64.92 131.01 1.48 28.59 100.49 8.36 13.99
134 B 210.98 0.00 479.49 145.56 638.16 6.11 59.40 102.86 12.10 0.00
134 C 90.36 0.00 522.89 69.07 514.79 3.17 26.87 98.85 2.89 0.00
134 D 70.50 0.00 459.70 116.34 288.05 4.40 25.96 95.13 4.27 0.00
134 E 158.07 0.00 425.29 80.82 164.73 4.04 37.21 84.99 7.82 0.00
135 B 148.79 0.00 428.01 38.67 312.29 10.51 28.82 95.17 5.47 0.00
135 D 42.10 0.00 392.92 33.82 400.21 14.22 12.31 95.71 7.07 0.00
135 E 73.45 0.00 472.34 34.83 221.53 0.00 0.00 87.72 1.13 0.00
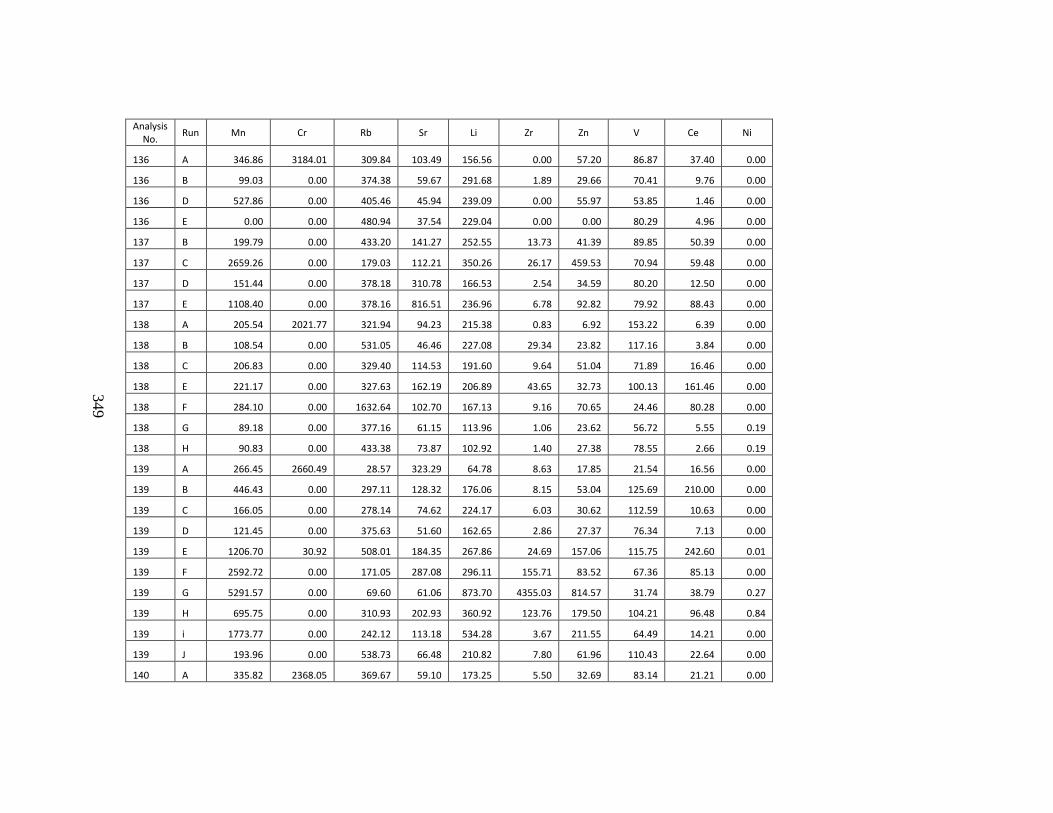
349
Analysis No.
Run Mn Cr Rb Sr Li Zr Zn V Ce Ni
136 A 346.86 3184.01 309.84 103.49 156.56 0.00 57.20 86.87 37.40 0.00
136 B 99.03 0.00 374.38 59.67 291.68 1.89 29.66 70.41 9.76 0.00
136 D 527.86 0.00 405.46 45.94 239.09 0.00 55.97 53.85 1.46 0.00
136 E 0.00 0.00 480.94 37.54 229.04 0.00 0.00 80.29 4.96 0.00
137 B 199.79 0.00 433.20 141.27 252.55 13.73 41.39 89.85 50.39 0.00
137 C 2659.26 0.00 179.03 112.21 350.26 26.17 459.53 70.94 59.48 0.00
137 D 151.44 0.00 378.18 310.78 166.53 2.54 34.59 80.20 12.50 0.00
137 E 1108.40 0.00 378.16 816.51 236.96 6.78 92.82 79.92 88.43 0.00
138 A 205.54 2021.77 321.94 94.23 215.38 0.83 6.92 153.22 6.39 0.00
138 B 108.54 0.00 531.05 46.46 227.08 29.34 23.82 117.16 3.84 0.00
138 C 206.83 0.00 329.40 114.53 191.60 9.64 51.04 71.89 16.46 0.00
138 E 221.17 0.00 327.63 162.19 206.89 43.65 32.73 100.13 161.46 0.00
138 F 284.10 0.00 1632.64 102.70 167.13 9.16 70.65 24.46 80.28 0.00
138 G 89.18 0.00 377.16 61.15 113.96 1.06 23.62 56.72 5.55 0.19
138 H 90.83 0.00 433.38 73.87 102.92 1.40 27.38 78.55 2.66 0.19
139 A 266.45 2660.49 28.57 323.29 64.78 8.63 17.85 21.54 16.56 0.00
139 B 446.43 0.00 297.11 128.32 176.06 8.15 53.04 125.69 210.00 0.00
139 C 166.05 0.00 278.14 74.62 224.17 6.03 30.62 112.59 10.63 0.00
139 D 121.45 0.00 375.63 51.60 162.65 2.86 27.37 76.34 7.13 0.00
139 E 1206.70 30.92 508.01 184.35 267.86 24.69 157.06 115.75 242.60 0.01
139 F 2592.72 0.00 171.05 287.08 296.11 155.71 83.52 67.36 85.13 0.00
139 G 5291.57 0.00 69.60 61.06 873.70 4355.03 814.57 31.74 38.79 0.27
139 H 695.75 0.00 310.93 202.93 360.92 123.76 179.50 104.21 96.48 0.84
139 i 1773.77 0.00 242.12 113.18 534.28 3.67 211.55 64.49 14.21 0.00
139 J 193.96 0.00 538.73 66.48 210.82 7.80 61.96 110.43 22.64 0.00
140 A 335.82 2368.05 369.67 59.10 173.25 5.50 32.69 83.14 21.21 0.00
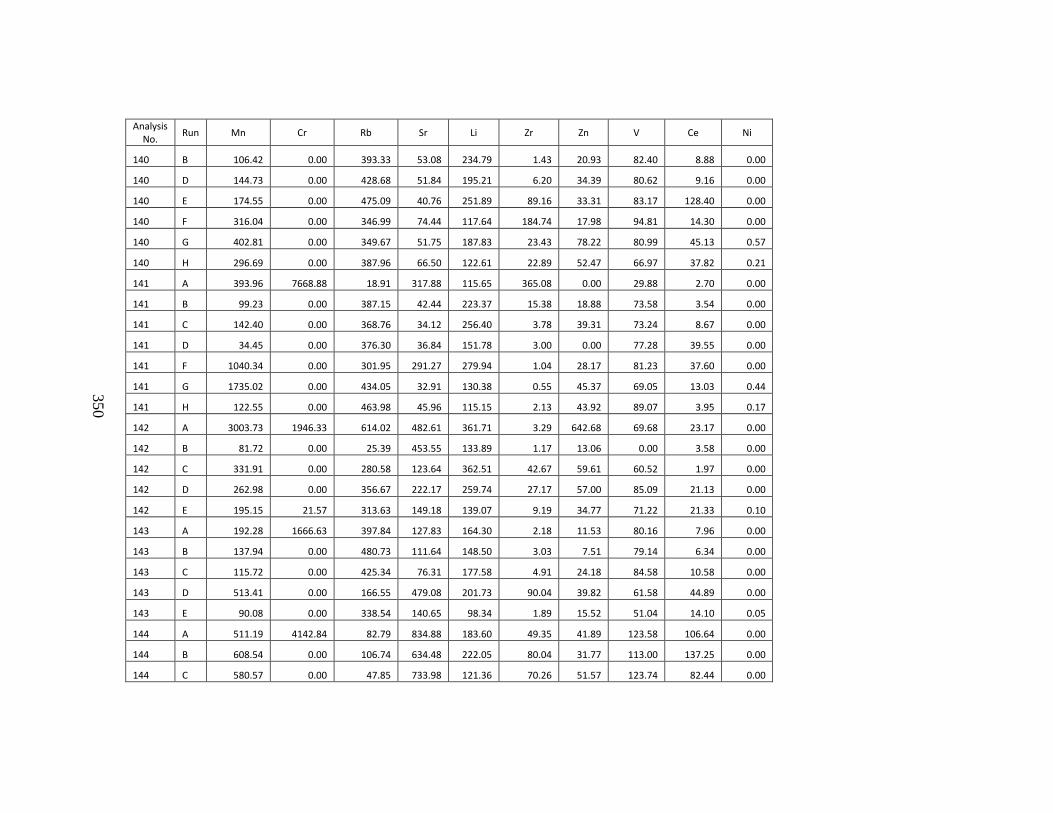
350
Analysis No.
Run Mn Cr Rb Sr Li Zr Zn V Ce Ni
140 B 106.42 0.00 393.33 53.08 234.79 1.43 20.93 82.40 8.88 0.00
140 D 144.73 0.00 428.68 51.84 195.21 6.20 34.39 80.62 9.16 0.00
140 E 174.55 0.00 475.09 40.76 251.89 89.16 33.31 83.17 128.40 0.00
140 F 316.04 0.00 346.99 74.44 117.64 184.74 17.98 94.81 14.30 0.00
140 G 402.81 0.00 349.67 51.75 187.83 23.43 78.22 80.99 45.13 0.57
140 H 296.69 0.00 387.96 66.50 122.61 22.89 52.47 66.97 37.82 0.21
141 A 393.96 7668.88 18.91 317.88 115.65 365.08 0.00 29.88 2.70 0.00
141 B 99.23 0.00 387.15 42.44 223.37 15.38 18.88 73.58 3.54 0.00
141 C 142.40 0.00 368.76 34.12 256.40 3.78 39.31 73.24 8.67 0.00
141 D 34.45 0.00 376.30 36.84 151.78 3.00 0.00 77.28 39.55 0.00
141 F 1040.34 0.00 301.95 291.27 279.94 1.04 28.17 81.23 37.60 0.00
141 G 1735.02 0.00 434.05 32.91 130.38 0.55 45.37 69.05 13.03 0.44
141 H 122.55 0.00 463.98 45.96 115.15 2.13 43.92 89.07 3.95 0.17
142 A 3003.73 1946.33 614.02 482.61 361.71 3.29 642.68 69.68 23.17 0.00
142 B 81.72 0.00 25.39 453.55 133.89 1.17 13.06 0.00 3.58 0.00
142 C 331.91 0.00 280.58 123.64 362.51 42.67 59.61 60.52 1.97 0.00
142 D 262.98 0.00 356.67 222.17 259.74 27.17 57.00 85.09 21.13 0.00
142 E 195.15 21.57 313.63 149.18 139.07 9.19 34.77 71.22 21.33 0.10
143 A 192.28 1666.63 397.84 127.83 164.30 2.18 11.53 80.16 7.96 0.00
143 B 137.94 0.00 480.73 111.64 148.50 3.03 7.51 79.14 6.34 0.00
143 C 115.72 0.00 425.34 76.31 177.58 4.91 24.18 84.58 10.58 0.00
143 D 513.41 0.00 166.55 479.08 201.73 90.04 39.82 61.58 44.89 0.00
143 E 90.08 0.00 338.54 140.65 98.34 1.89 15.52 51.04 14.10 0.05
144 A 511.19 4142.84 82.79 834.88 183.60 49.35 41.89 123.58 106.64 0.00
144 B 608.54 0.00 106.74 634.48 222.05 80.04 31.77 113.00 137.25 0.00
144 C 580.57 0.00 47.85 733.98 121.36 70.26 51.57 123.74 82.44 0.00
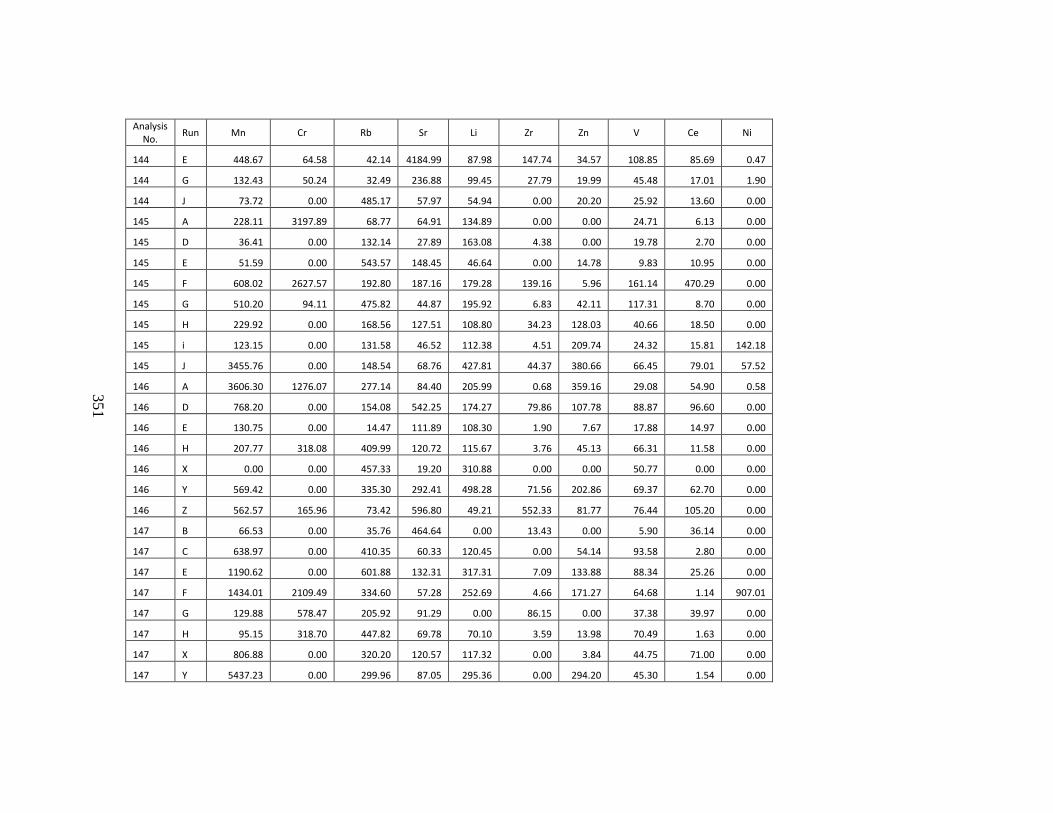
351
Analysis No.
Run Mn Cr Rb Sr Li Zr Zn V Ce Ni
144 E 448.67 64.58 42.14 4184.99 87.98 147.74 34.57 108.85 85.69 0.47
144 G 132.43 50.24 32.49 236.88 99.45 27.79 19.99 45.48 17.01 1.90
144 J 73.72 0.00 485.17 57.97 54.94 0.00 20.20 25.92 13.60 0.00
145 A 228.11 3197.89 68.77 64.91 134.89 0.00 0.00 24.71 6.13 0.00
145 D 36.41 0.00 132.14 27.89 163.08 4.38 0.00 19.78 2.70 0.00
145 E 51.59 0.00 543.57 148.45 46.64 0.00 14.78 9.83 10.95 0.00
145 F 608.02 2627.57 192.80 187.16 179.28 139.16 5.96 161.14 470.29 0.00
145 G 510.20 94.11 475.82 44.87 195.92 6.83 42.11 117.31 8.70 0.00
145 H 229.92 0.00 168.56 127.51 108.80 34.23 128.03 40.66 18.50 0.00
145 i 123.15 0.00 131.58 46.52 112.38 4.51 209.74 24.32 15.81 142.18
145 J 3455.76 0.00 148.54 68.76 427.81 44.37 380.66 66.45 79.01 57.52
146 A 3606.30 1276.07 277.14 84.40 205.99 0.68 359.16 29.08 54.90 0.58
146 D 768.20 0.00 154.08 542.25 174.27 79.86 107.78 88.87 96.60 0.00
146 E 130.75 0.00 14.47 111.89 108.30 1.90 7.67 17.88 14.97 0.00
146 H 207.77 318.08 409.99 120.72 115.67 3.76 45.13 66.31 11.58 0.00
146 X 0.00 0.00 457.33 19.20 310.88 0.00 0.00 50.77 0.00 0.00
146 Y 569.42 0.00 335.30 292.41 498.28 71.56 202.86 69.37 62.70 0.00
146 Z 562.57 165.96 73.42 596.80 49.21 552.33 81.77 76.44 105.20 0.00
147 B 66.53 0.00 35.76 464.64 0.00 13.43 0.00 5.90 36.14 0.00
147 C 638.97 0.00 410.35 60.33 120.45 0.00 54.14 93.58 2.80 0.00
147 E 1190.62 0.00 601.88 132.31 317.31 7.09 133.88 88.34 25.26 0.00
147 F 1434.01 2109.49 334.60 57.28 252.69 4.66 171.27 64.68 1.14 907.01
147 G 129.88 578.47 205.92 91.29 0.00 86.15 0.00 37.38 39.97 0.00
147 H 95.15 318.70 447.82 69.78 70.10 3.59 13.98 70.49 1.63 0.00
147 X 806.88 0.00 320.20 120.57 117.32 0.00 3.84 44.75 71.00 0.00
147 Y 5437.23 0.00 299.96 87.05 295.36 0.00 294.20 45.30 1.54 0.00
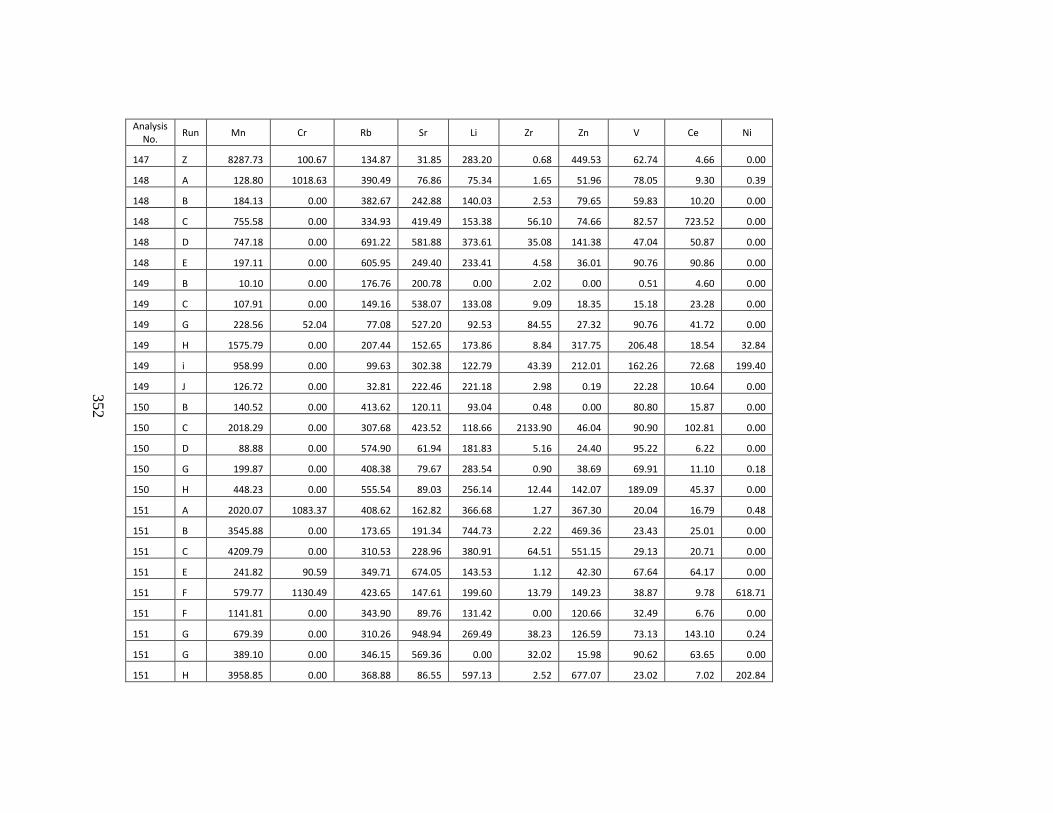
352
Analysis No.
Run Mn Cr Rb Sr Li Zr Zn V Ce Ni
147 Z 8287.73 100.67 134.87 31.85 283.20 0.68 449.53 62.74 4.66 0.00
148 A 128.80 1018.63 390.49 76.86 75.34 1.65 51.96 78.05 9.30 0.39
148 B 184.13 0.00 382.67 242.88 140.03 2.53 79.65 59.83 10.20 0.00
148 C 755.58 0.00 334.93 419.49 153.38 56.10 74.66 82.57 723.52 0.00
148 D 747.18 0.00 691.22 581.88 373.61 35.08 141.38 47.04 50.87 0.00
148 E 197.11 0.00 605.95 249.40 233.41 4.58 36.01 90.76 90.86 0.00
149 B 10.10 0.00 176.76 200.78 0.00 2.02 0.00 0.51 4.60 0.00
149 C 107.91 0.00 149.16 538.07 133.08 9.09 18.35 15.18 23.28 0.00
149 G 228.56 52.04 77.08 527.20 92.53 84.55 27.32 90.76 41.72 0.00
149 H 1575.79 0.00 207.44 152.65 173.86 8.84 317.75 206.48 18.54 32.84
149 i 958.99 0.00 99.63 302.38 122.79 43.39 212.01 162.26 72.68 199.40
149 J 126.72 0.00 32.81 222.46 221.18 2.98 0.19 22.28 10.64 0.00
150 B 140.52 0.00 413.62 120.11 93.04 0.48 0.00 80.80 15.87 0.00
150 C 2018.29 0.00 307.68 423.52 118.66 2133.90 46.04 90.90 102.81 0.00
150 D 88.88 0.00 574.90 61.94 181.83 5.16 24.40 95.22 6.22 0.00
150 G 199.87 0.00 408.38 79.67 283.54 0.90 38.69 69.91 11.10 0.18
150 H 448.23 0.00 555.54 89.03 256.14 12.44 142.07 189.09 45.37 0.00
151 A 2020.07 1083.37 408.62 162.82 366.68 1.27 367.30 20.04 16.79 0.48
151 B 3545.88 0.00 173.65 191.34 744.73 2.22 469.36 23.43 25.01 0.00
151 C 4209.79 0.00 310.53 228.96 380.91 64.51 551.15 29.13 20.71 0.00
151 E 241.82 90.59 349.71 674.05 143.53 1.12 42.30 67.64 64.17 0.00
151 F 579.77 1130.49 423.65 147.61 199.60 13.79 149.23 38.87 9.78 618.71
151 F 1141.81 0.00 343.90 89.76 131.42 0.00 120.66 32.49 6.76 0.00
151 G 679.39 0.00 310.26 948.94 269.49 38.23 126.59 73.13 143.10 0.24
151 G 389.10 0.00 346.15 569.36 0.00 32.02 15.98 90.62 63.65 0.00
151 H 3958.85 0.00 368.88 86.55 597.13 2.52 677.07 23.02 7.02 202.84
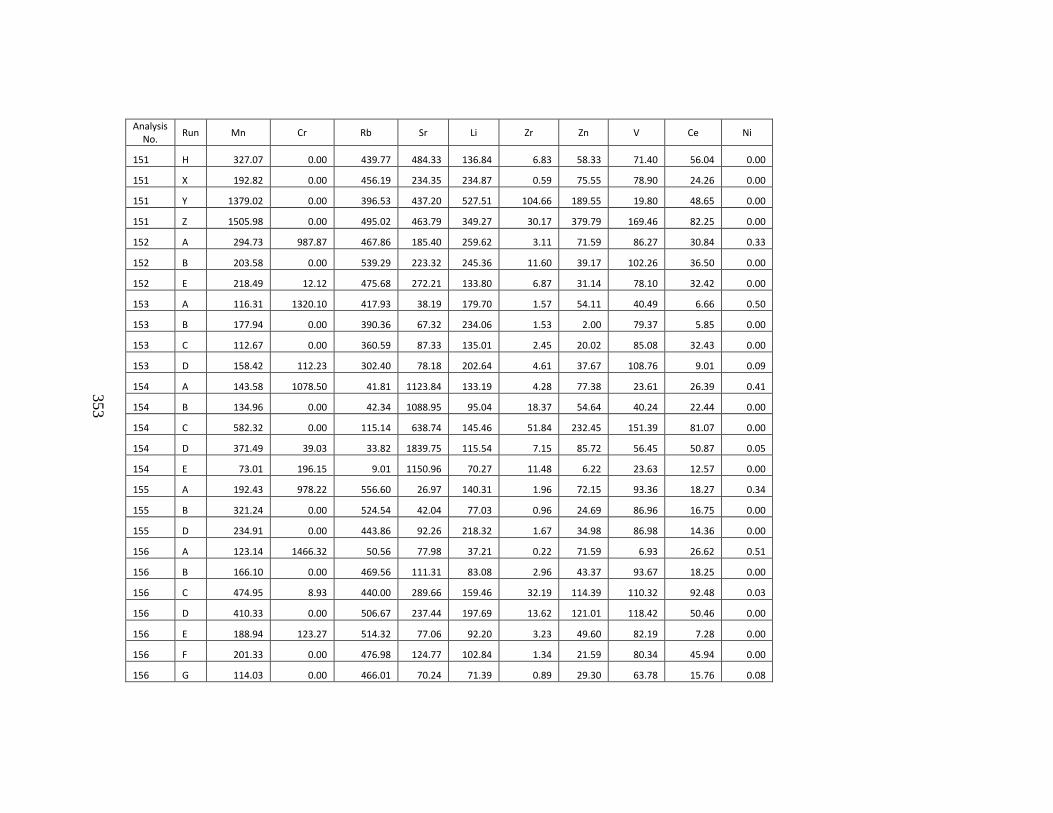
353
Analysis No.
Run Mn Cr Rb Sr Li Zr Zn V Ce Ni
151 H 327.07 0.00 439.77 484.33 136.84 6.83 58.33 71.40 56.04 0.00
151 X 192.82 0.00 456.19 234.35 234.87 0.59 75.55 78.90 24.26 0.00
151 Y 1379.02 0.00 396.53 437.20 527.51 104.66 189.55 19.80 48.65 0.00
151 Z 1505.98 0.00 495.02 463.79 349.27 30.17 379.79 169.46 82.25 0.00
152 A 294.73 987.87 467.86 185.40 259.62 3.11 71.59 86.27 30.84 0.33
152 B 203.58 0.00 539.29 223.32 245.36 11.60 39.17 102.26 36.50 0.00
152 E 218.49 12.12 475.68 272.21 133.80 6.87 31.14 78.10 32.42 0.00
153 A 116.31 1320.10 417.93 38.19 179.70 1.57 54.11 40.49 6.66 0.50
153 B 177.94 0.00 390.36 67.32 234.06 1.53 2.00 79.37 5.85 0.00
153 C 112.67 0.00 360.59 87.33 135.01 2.45 20.02 85.08 32.43 0.00
153 D 158.42 112.23 302.40 78.18 202.64 4.61 37.67 108.76 9.01 0.09
154 A 143.58 1078.50 41.81 1123.84 133.19 4.28 77.38 23.61 26.39 0.41
154 B 134.96 0.00 42.34 1088.95 95.04 18.37 54.64 40.24 22.44 0.00
154 C 582.32 0.00 115.14 638.74 145.46 51.84 232.45 151.39 81.07 0.00
154 D 371.49 39.03 33.82 1839.75 115.54 7.15 85.72 56.45 50.87 0.05
154 E 73.01 196.15 9.01 1150.96 70.27 11.48 6.22 23.63 12.57 0.00
155 A 192.43 978.22 556.60 26.97 140.31 1.96 72.15 93.36 18.27 0.34
155 B 321.24 0.00 524.54 42.04 77.03 0.96 24.69 86.96 16.75 0.00
155 D 234.91 0.00 443.86 92.26 218.32 1.67 34.98 86.98 14.36 0.00
156 A 123.14 1466.32 50.56 77.98 37.21 0.22 71.59 6.93 26.62 0.51
156 B 166.10 0.00 469.56 111.31 83.08 2.96 43.37 93.67 18.25 0.00
156 C 474.95 8.93 440.00 289.66 159.46 32.19 114.39 110.32 92.48 0.03
156 D 410.33 0.00 506.67 237.44 197.69 13.62 121.01 118.42 50.46 0.00
156 E 188.94 123.27 514.32 77.06 92.20 3.23 49.60 82.19 7.28 0.00
156 F 201.33 0.00 476.98 124.77 102.84 1.34 21.59 80.34 45.94 0.00
156 G 114.03 0.00 466.01 70.24 71.39 0.89 29.30 63.78 15.76 0.08
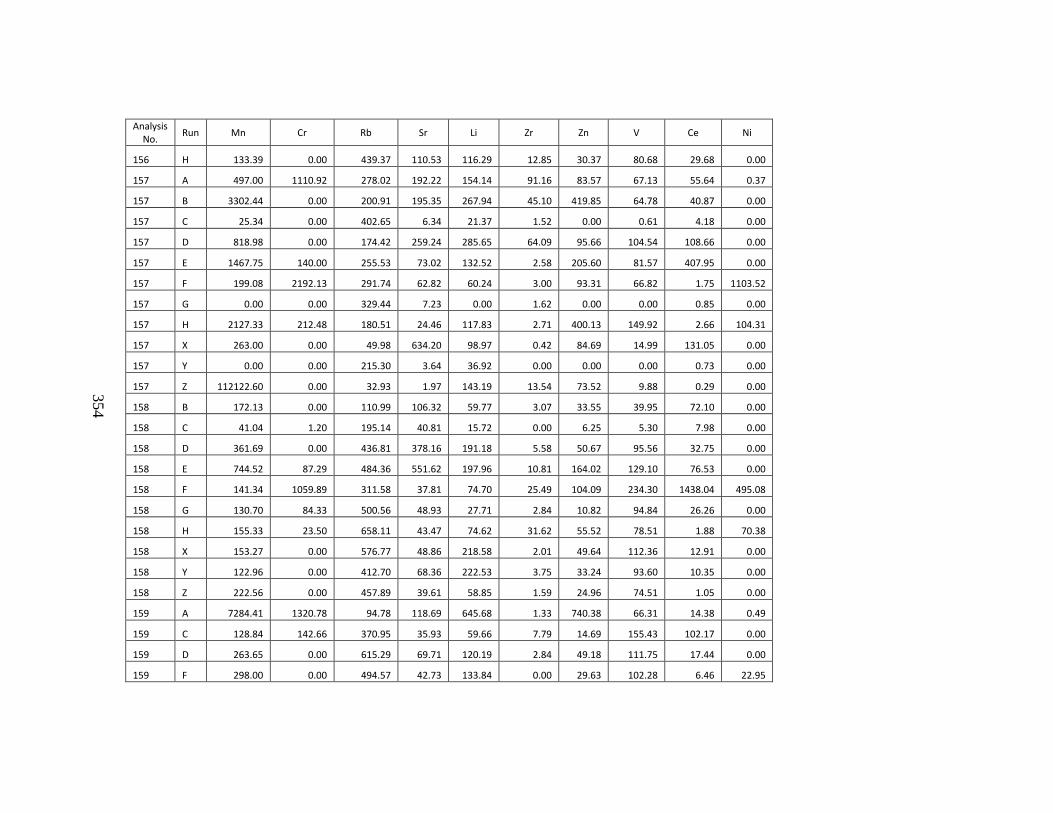
354
Analysis No.
Run Mn Cr Rb Sr Li Zr Zn V Ce Ni
156 H 133.39 0.00 439.37 110.53 116.29 12.85 30.37 80.68 29.68 0.00
157 A 497.00 1110.92 278.02 192.22 154.14 91.16 83.57 67.13 55.64 0.37
157 B 3302.44 0.00 200.91 195.35 267.94 45.10 419.85 64.78 40.87 0.00
157 C 25.34 0.00 402.65 6.34 21.37 1.52 0.00 0.61 4.18 0.00
157 D 818.98 0.00 174.42 259.24 285.65 64.09 95.66 104.54 108.66 0.00
157 E 1467.75 140.00 255.53 73.02 132.52 2.58 205.60 81.57 407.95 0.00
157 F 199.08 2192.13 291.74 62.82 60.24 3.00 93.31 66.82 1.75 1103.52
157 G 0.00 0.00 329.44 7.23 0.00 1.62 0.00 0.00 0.85 0.00
157 H 2127.33 212.48 180.51 24.46 117.83 2.71 400.13 149.92 2.66 104.31
157 X 263.00 0.00 49.98 634.20 98.97 0.42 84.69 14.99 131.05 0.00
157 Y 0.00 0.00 215.30 3.64 36.92 0.00 0.00 0.00 0.73 0.00
157 Z 112122.60 0.00 32.93 1.97 143.19 13.54 73.52 9.88 0.29 0.00
158 B 172.13 0.00 110.99 106.32 59.77 3.07 33.55 39.95 72.10 0.00
158 C 41.04 1.20 195.14 40.81 15.72 0.00 6.25 5.30 7.98 0.00
158 D 361.69 0.00 436.81 378.16 191.18 5.58 50.67 95.56 32.75 0.00
158 E 744.52 87.29 484.36 551.62 197.96 10.81 164.02 129.10 76.53 0.00
158 F 141.34 1059.89 311.58 37.81 74.70 25.49 104.09 234.30 1438.04 495.08
158 G 130.70 84.33 500.56 48.93 27.71 2.84 10.82 94.84 26.26 0.00
158 H 155.33 23.50 658.11 43.47 74.62 31.62 55.52 78.51 1.88 70.38
158 X 153.27 0.00 576.77 48.86 218.58 2.01 49.64 112.36 12.91 0.00
158 Y 122.96 0.00 412.70 68.36 222.53 3.75 33.24 93.60 10.35 0.00
158 Z 222.56 0.00 457.89 39.61 58.85 1.59 24.96 74.51 1.05 0.00
159 A 7284.41 1320.78 94.78 118.69 645.68 1.33 740.38 66.31 14.38 0.49
159 C 128.84 142.66 370.95 35.93 59.66 7.79 14.69 155.43 102.17 0.00
159 D 263.65 0.00 615.29 69.71 120.19 2.84 49.18 111.75 17.44 0.00
159 F 298.00 0.00 494.57 42.73 133.84 0.00 29.63 102.28 6.46 22.95
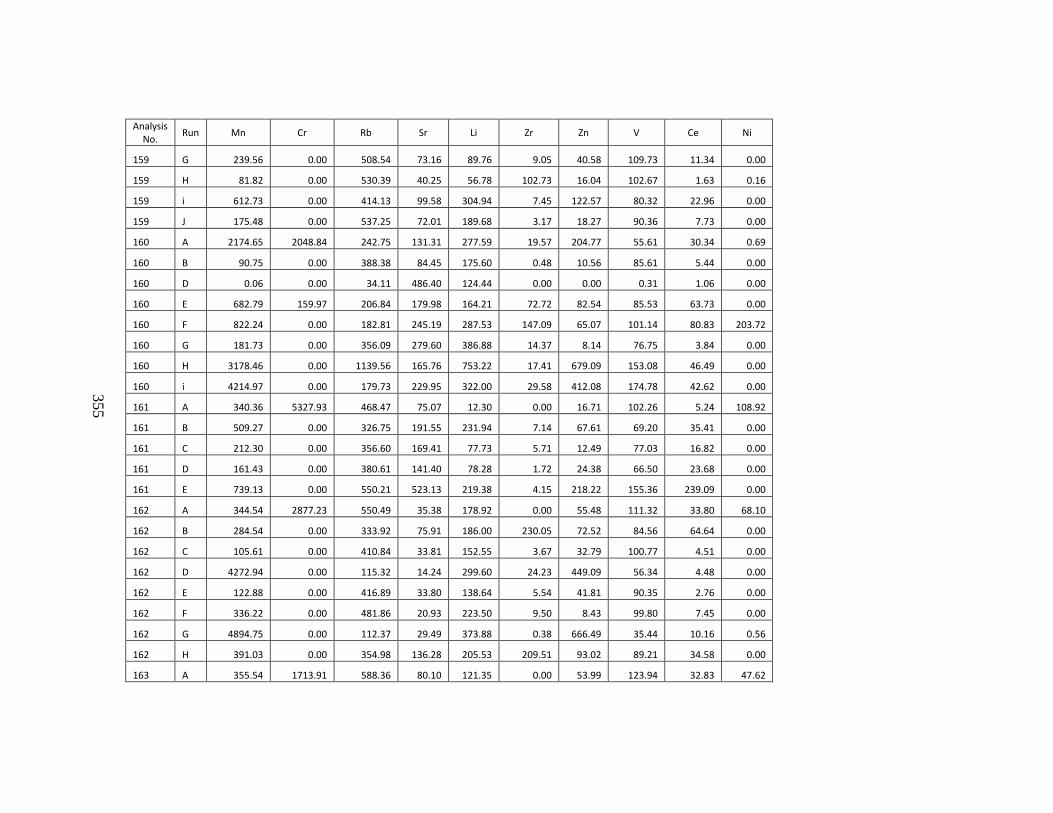
355
Analysis No.
Run Mn Cr Rb Sr Li Zr Zn V Ce Ni
159 G 239.56 0.00 508.54 73.16 89.76 9.05 40.58 109.73 11.34 0.00
159 H 81.82 0.00 530.39 40.25 56.78 102.73 16.04 102.67 1.63 0.16
159 i 612.73 0.00 414.13 99.58 304.94 7.45 122.57 80.32 22.96 0.00
159 J 175.48 0.00 537.25 72.01 189.68 3.17 18.27 90.36 7.73 0.00
160 A 2174.65 2048.84 242.75 131.31 277.59 19.57 204.77 55.61 30.34 0.69
160 B 90.75 0.00 388.38 84.45 175.60 0.48 10.56 85.61 5.44 0.00
160 D 0.06 0.00 34.11 486.40 124.44 0.00 0.00 0.31 1.06 0.00
160 E 682.79 159.97 206.84 179.98 164.21 72.72 82.54 85.53 63.73 0.00
160 F 822.24 0.00 182.81 245.19 287.53 147.09 65.07 101.14 80.83 203.72
160 G 181.73 0.00 356.09 279.60 386.88 14.37 8.14 76.75 3.84 0.00
160 H 3178.46 0.00 1139.56 165.76 753.22 17.41 679.09 153.08 46.49 0.00
160 i 4214.97 0.00 179.73 229.95 322.00 29.58 412.08 174.78 42.62 0.00
161 A 340.36 5327.93 468.47 75.07 12.30 0.00 16.71 102.26 5.24 108.92
161 B 509.27 0.00 326.75 191.55 231.94 7.14 67.61 69.20 35.41 0.00
161 C 212.30 0.00 356.60 169.41 77.73 5.71 12.49 77.03 16.82 0.00
161 D 161.43 0.00 380.61 141.40 78.28 1.72 24.38 66.50 23.68 0.00
161 E 739.13 0.00 550.21 523.13 219.38 4.15 218.22 155.36 239.09 0.00
162 A 344.54 2877.23 550.49 35.38 178.92 0.00 55.48 111.32 33.80 68.10
162 B 284.54 0.00 333.92 75.91 186.00 230.05 72.52 84.56 64.64 0.00
162 C 105.61 0.00 410.84 33.81 152.55 3.67 32.79 100.77 4.51 0.00
162 D 4272.94 0.00 115.32 14.24 299.60 24.23 449.09 56.34 4.48 0.00
162 E 122.88 0.00 416.89 33.80 138.64 5.54 41.81 90.35 2.76 0.00
162 F 336.22 0.00 481.86 20.93 223.50 9.50 8.43 99.80 7.45 0.00
162 G 4894.75 0.00 112.37 29.49 373.88 0.38 666.49 35.44 10.16 0.56
162 H 391.03 0.00 354.98 136.28 205.53 209.51 93.02 89.21 34.58 0.00
163 A 355.54 1713.91 588.36 80.10 121.35 0.00 53.99 123.94 32.83 47.62
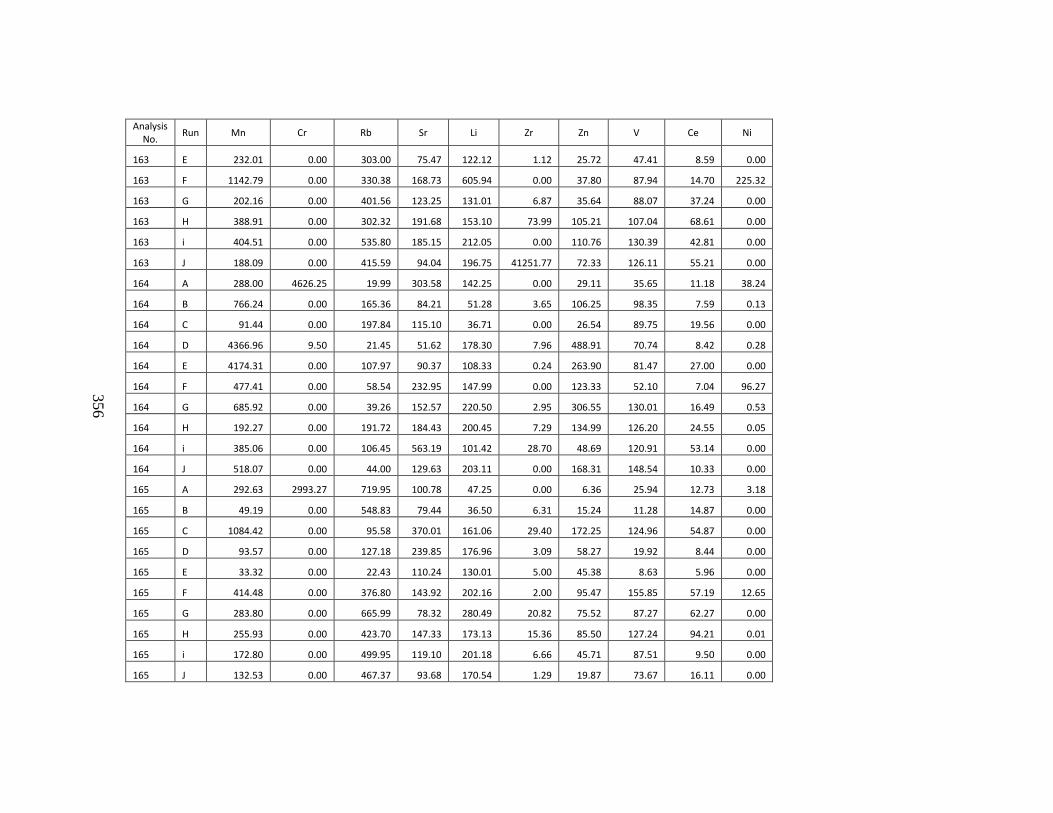
356
Analysis No.
Run Mn Cr Rb Sr Li Zr Zn V Ce Ni
163 E 232.01 0.00 303.00 75.47 122.12 1.12 25.72 47.41 8.59 0.00
163 F 1142.79 0.00 330.38 168.73 605.94 0.00 37.80 87.94 14.70 225.32
163 G 202.16 0.00 401.56 123.25 131.01 6.87 35.64 88.07 37.24 0.00
163 H 388.91 0.00 302.32 191.68 153.10 73.99 105.21 107.04 68.61 0.00
163 i 404.51 0.00 535.80 185.15 212.05 0.00 110.76 130.39 42.81 0.00
163 J 188.09 0.00 415.59 94.04 196.75 41251.77 72.33 126.11 55.21 0.00
164 A 288.00 4626.25 19.99 303.58 142.25 0.00 29.11 35.65 11.18 38.24
164 B 766.24 0.00 165.36 84.21 51.28 3.65 106.25 98.35 7.59 0.13
164 C 91.44 0.00 197.84 115.10 36.71 0.00 26.54 89.75 19.56 0.00
164 D 4366.96 9.50 21.45 51.62 178.30 7.96 488.91 70.74 8.42 0.28
164 E 4174.31 0.00 107.97 90.37 108.33 0.24 263.90 81.47 27.00 0.00
164 F 477.41 0.00 58.54 232.95 147.99 0.00 123.33 52.10 7.04 96.27
164 G 685.92 0.00 39.26 152.57 220.50 2.95 306.55 130.01 16.49 0.53
164 H 192.27 0.00 191.72 184.43 200.45 7.29 134.99 126.20 24.55 0.05
164 i 385.06 0.00 106.45 563.19 101.42 28.70 48.69 120.91 53.14 0.00
164 J 518.07 0.00 44.00 129.63 203.11 0.00 168.31 148.54 10.33 0.00
165 A 292.63 2993.27 719.95 100.78 47.25 0.00 6.36 25.94 12.73 3.18
165 B 49.19 0.00 548.83 79.44 36.50 6.31 15.24 11.28 14.87 0.00
165 C 1084.42 0.00 95.58 370.01 161.06 29.40 172.25 124.96 54.87 0.00
165 D 93.57 0.00 127.18 239.85 176.96 3.09 58.27 19.92 8.44 0.00
165 E 33.32 0.00 22.43 110.24 130.01 5.00 45.38 8.63 5.96 0.00
165 F 414.48 0.00 376.80 143.92 202.16 2.00 95.47 155.85 57.19 12.65
165 G 283.80 0.00 665.99 78.32 280.49 20.82 75.52 87.27 62.27 0.00
165 H 255.93 0.00 423.70 147.33 173.13 15.36 85.50 127.24 94.21 0.01
165 i 172.80 0.00 499.95 119.10 201.18 6.66 45.71 87.51 9.50 0.00
165 J 132.53 0.00 467.37 93.68 170.54 1.29 19.87 73.67 16.11 0.00
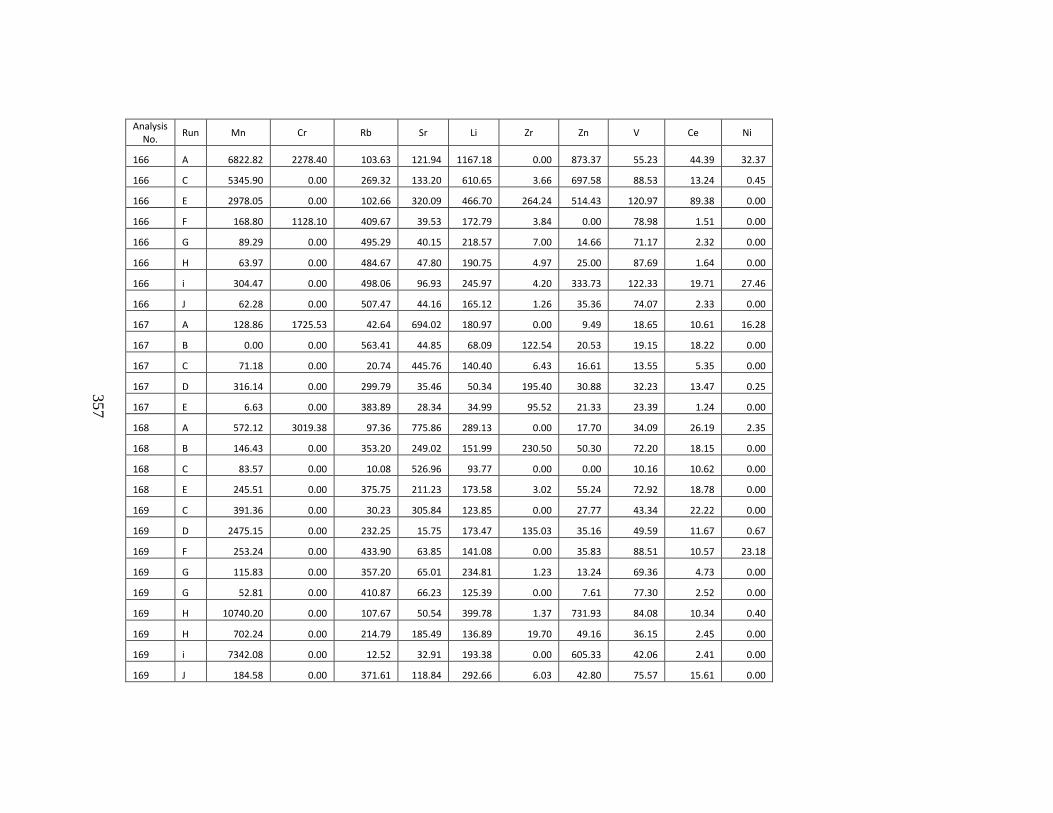
357
Analysis No.
Run Mn Cr Rb Sr Li Zr Zn V Ce Ni
166 A 6822.82 2278.40 103.63 121.94 1167.18 0.00 873.37 55.23 44.39 32.37
166 C 5345.90 0.00 269.32 133.20 610.65 3.66 697.58 88.53 13.24 0.45
166 E 2978.05 0.00 102.66 320.09 466.70 264.24 514.43 120.97 89.38 0.00
166 F 168.80 1128.10 409.67 39.53 172.79 3.84 0.00 78.98 1.51 0.00
166 G 89.29 0.00 495.29 40.15 218.57 7.00 14.66 71.17 2.32 0.00
166 H 63.97 0.00 484.67 47.80 190.75 4.97 25.00 87.69 1.64 0.00
166 i 304.47 0.00 498.06 96.93 245.97 4.20 333.73 122.33 19.71 27.46
166 J 62.28 0.00 507.47 44.16 165.12 1.26 35.36 74.07 2.33 0.00
167 A 128.86 1725.53 42.64 694.02 180.97 0.00 9.49 18.65 10.61 16.28
167 B 0.00 0.00 563.41 44.85 68.09 122.54 20.53 19.15 18.22 0.00
167 C 71.18 0.00 20.74 445.76 140.40 6.43 16.61 13.55 5.35 0.00
167 D 316.14 0.00 299.79 35.46 50.34 195.40 30.88 32.23 13.47 0.25
167 E 6.63 0.00 383.89 28.34 34.99 95.52 21.33 23.39 1.24 0.00
168 A 572.12 3019.38 97.36 775.86 289.13 0.00 17.70 34.09 26.19 2.35
168 B 146.43 0.00 353.20 249.02 151.99 230.50 50.30 72.20 18.15 0.00
168 C 83.57 0.00 10.08 526.96 93.77 0.00 0.00 10.16 10.62 0.00
168 E 245.51 0.00 375.75 211.23 173.58 3.02 55.24 72.92 18.78 0.00
169 C 391.36 0.00 30.23 305.84 123.85 0.00 27.77 43.34 22.22 0.00
169 D 2475.15 0.00 232.25 15.75 173.47 135.03 35.16 49.59 11.67 0.67
169 F 253.24 0.00 433.90 63.85 141.08 0.00 35.83 88.51 10.57 23.18
169 G 115.83 0.00 357.20 65.01 234.81 1.23 13.24 69.36 4.73 0.00
169 G 52.81 0.00 410.87 66.23 125.39 0.00 7.61 77.30 2.52 0.00
169 H 10740.20 0.00 107.67 50.54 399.78 1.37 731.93 84.08 10.34 0.40
169 H 702.24 0.00 214.79 185.49 136.89 19.70 49.16 36.15 2.45 0.00
169 i 7342.08 0.00 12.52 32.91 193.38 0.00 605.33 42.06 2.41 0.00
169 J 184.58 0.00 371.61 118.84 292.66 6.03 42.80 75.57 15.61 0.00
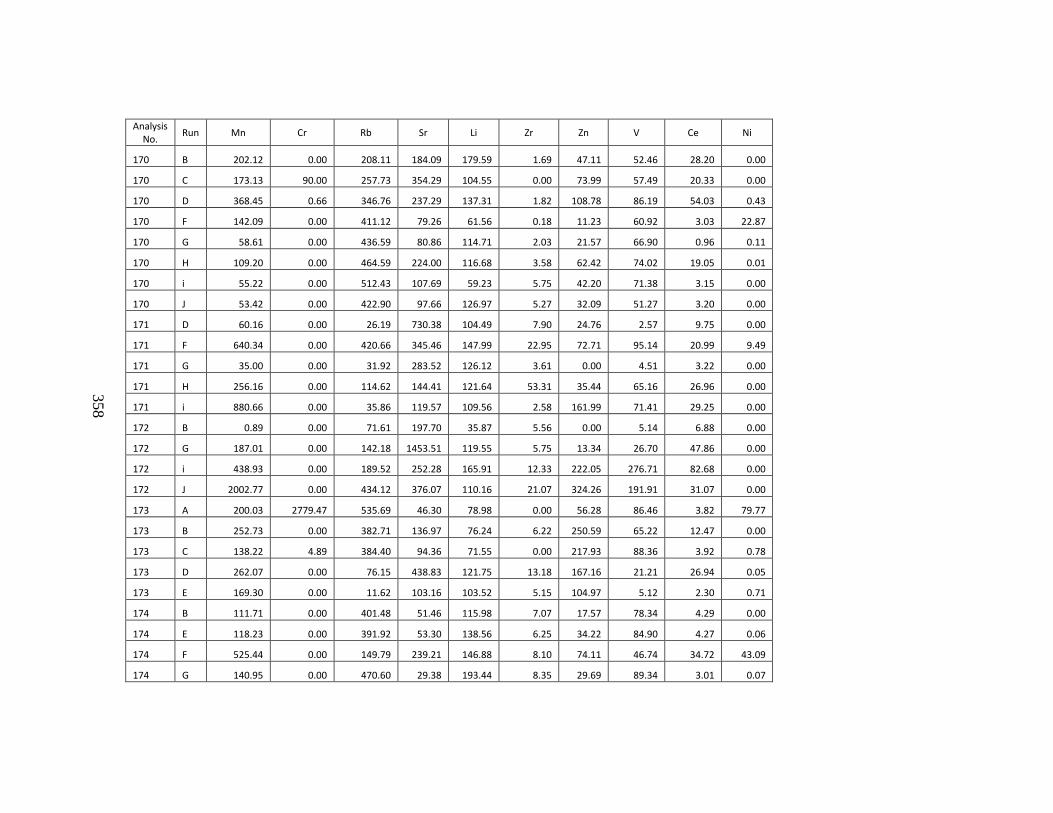
358
Analysis No.
Run Mn Cr Rb Sr Li Zr Zn V Ce Ni
170 B 202.12 0.00 208.11 184.09 179.59 1.69 47.11 52.46 28.20 0.00
170 C 173.13 90.00 257.73 354.29 104.55 0.00 73.99 57.49 20.33 0.00
170 D 368.45 0.66 346.76 237.29 137.31 1.82 108.78 86.19 54.03 0.43
170 F 142.09 0.00 411.12 79.26 61.56 0.18 11.23 60.92 3.03 22.87
170 G 58.61 0.00 436.59 80.86 114.71 2.03 21.57 66.90 0.96 0.11
170 H 109.20 0.00 464.59 224.00 116.68 3.58 62.42 74.02 19.05 0.01
170 i 55.22 0.00 512.43 107.69 59.23 5.75 42.20 71.38 3.15 0.00
170 J 53.42 0.00 422.90 97.66 126.97 5.27 32.09 51.27 3.20 0.00
171 D 60.16 0.00 26.19 730.38 104.49 7.90 24.76 2.57 9.75 0.00
171 F 640.34 0.00 420.66 345.46 147.99 22.95 72.71 95.14 20.99 9.49
171 G 35.00 0.00 31.92 283.52 126.12 3.61 0.00 4.51 3.22 0.00
171 H 256.16 0.00 114.62 144.41 121.64 53.31 35.44 65.16 26.96 0.00
171 i 880.66 0.00 35.86 119.57 109.56 2.58 161.99 71.41 29.25 0.00
172 B 0.89 0.00 71.61 197.70 35.87 5.56 0.00 5.14 6.88 0.00
172 G 187.01 0.00 142.18 1453.51 119.55 5.75 13.34 26.70 47.86 0.00
172 i 438.93 0.00 189.52 252.28 165.91 12.33 222.05 276.71 82.68 0.00
172 J 2002.77 0.00 434.12 376.07 110.16 21.07 324.26 191.91 31.07 0.00
173 A 200.03 2779.47 535.69 46.30 78.98 0.00 56.28 86.46 3.82 79.77
173 B 252.73 0.00 382.71 136.97 76.24 6.22 250.59 65.22 12.47 0.00
173 C 138.22 4.89 384.40 94.36 71.55 0.00 217.93 88.36 3.92 0.78
173 D 262.07 0.00 76.15 438.83 121.75 13.18 167.16 21.21 26.94 0.05
173 E 169.30 0.00 11.62 103.16 103.52 5.15 104.97 5.12 2.30 0.71
174 B 111.71 0.00 401.48 51.46 115.98 7.07 17.57 78.34 4.29 0.00
174 E 118.23 0.00 391.92 53.30 138.56 6.25 34.22 84.90 4.27 0.06
174 F 525.44 0.00 149.79 239.21 146.88 8.10 74.11 46.74 34.72 43.09
174 G 140.95 0.00 470.60 29.38 193.44 8.35 29.69 89.34 3.01 0.07
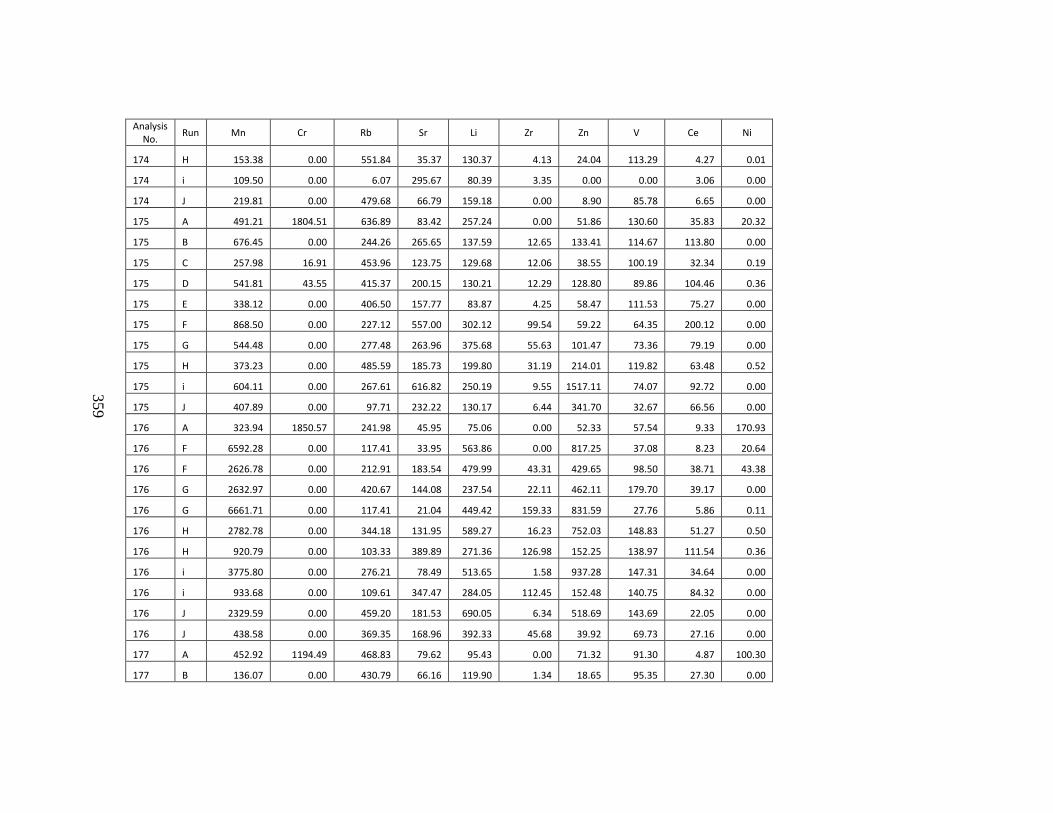
359
Analysis No.
Run Mn Cr Rb Sr Li Zr Zn V Ce Ni
174 H 153.38 0.00 551.84 35.37 130.37 4.13 24.04 113.29 4.27 0.01
174 i 109.50 0.00 6.07 295.67 80.39 3.35 0.00 0.00 3.06 0.00
174 J 219.81 0.00 479.68 66.79 159.18 0.00 8.90 85.78 6.65 0.00
175 A 491.21 1804.51 636.89 83.42 257.24 0.00 51.86 130.60 35.83 20.32
175 B 676.45 0.00 244.26 265.65 137.59 12.65 133.41 114.67 113.80 0.00
175 C 257.98 16.91 453.96 123.75 129.68 12.06 38.55 100.19 32.34 0.19
175 D 541.81 43.55 415.37 200.15 130.21 12.29 128.80 89.86 104.46 0.36
175 E 338.12 0.00 406.50 157.77 83.87 4.25 58.47 111.53 75.27 0.00
175 F 868.50 0.00 227.12 557.00 302.12 99.54 59.22 64.35 200.12 0.00
175 G 544.48 0.00 277.48 263.96 375.68 55.63 101.47 73.36 79.19 0.00
175 H 373.23 0.00 485.59 185.73 199.80 31.19 214.01 119.82 63.48 0.52
175 i 604.11 0.00 267.61 616.82 250.19 9.55 1517.11 74.07 92.72 0.00
175 J 407.89 0.00 97.71 232.22 130.17 6.44 341.70 32.67 66.56 0.00
176 A 323.94 1850.57 241.98 45.95 75.06 0.00 52.33 57.54 9.33 170.93
176 F 6592.28 0.00 117.41 33.95 563.86 0.00 817.25 37.08 8.23 20.64
176 F 2626.78 0.00 212.91 183.54 479.99 43.31 429.65 98.50 38.71 43.38
176 G 2632.97 0.00 420.67 144.08 237.54 22.11 462.11 179.70 39.17 0.00
176 G 6661.71 0.00 117.41 21.04 449.42 159.33 831.59 27.76 5.86 0.11
176 H 2782.78 0.00 344.18 131.95 589.27 16.23 752.03 148.83 51.27 0.50
176 H 920.79 0.00 103.33 389.89 271.36 126.98 152.25 138.97 111.54 0.36
176 i 3775.80 0.00 276.21 78.49 513.65 1.58 937.28 147.31 34.64 0.00
176 i 933.68 0.00 109.61 347.47 284.05 112.45 152.48 140.75 84.32 0.00
176 J 2329.59 0.00 459.20 181.53 690.05 6.34 518.69 143.69 22.05 0.00
176 J 438.58 0.00 369.35 168.96 392.33 45.68 39.92 69.73 27.16 0.00
177 A 452.92 1194.49 468.83 79.62 95.43 0.00 71.32 91.30 4.87 100.30
177 B 136.07 0.00 430.79 66.16 119.90 1.34 18.65 95.35 27.30 0.00
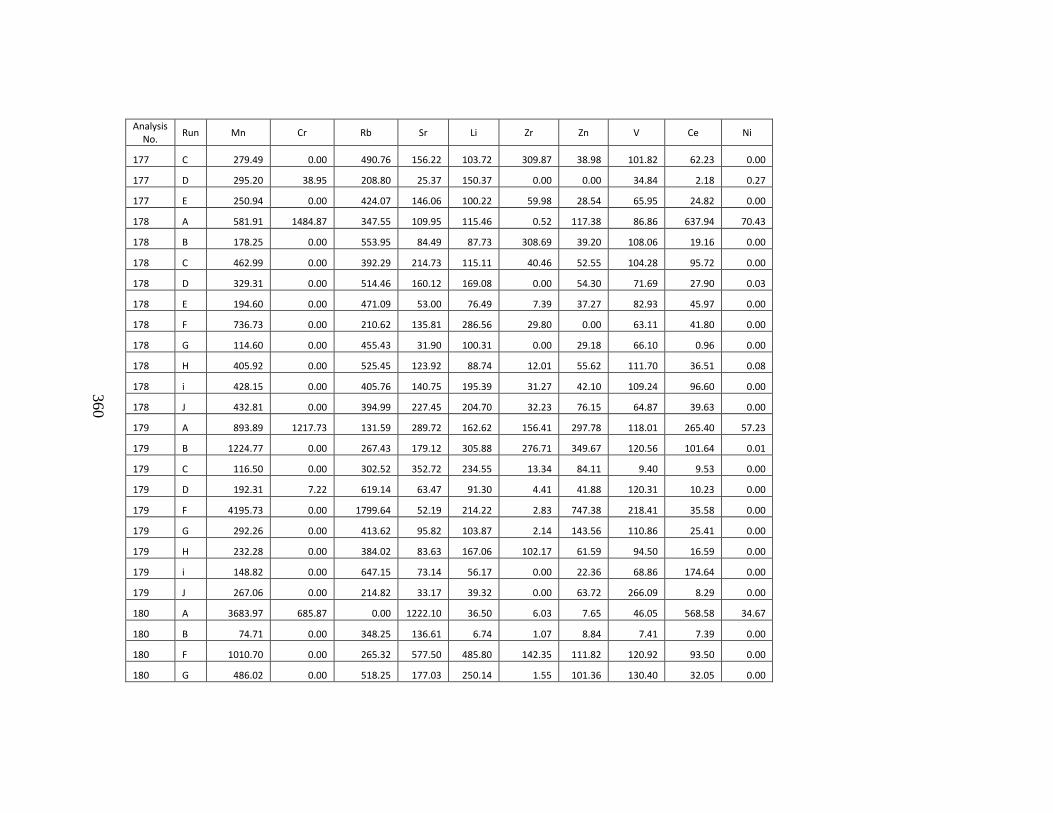
360
Analysis No.
Run Mn Cr Rb Sr Li Zr Zn V Ce Ni
177 C 279.49 0.00 490.76 156.22 103.72 309.87 38.98 101.82 62.23 0.00
177 D 295.20 38.95 208.80 25.37 150.37 0.00 0.00 34.84 2.18 0.27
177 E 250.94 0.00 424.07 146.06 100.22 59.98 28.54 65.95 24.82 0.00
178 A 581.91 1484.87 347.55 109.95 115.46 0.52 117.38 86.86 637.94 70.43
178 B 178.25 0.00 553.95 84.49 87.73 308.69 39.20 108.06 19.16 0.00
178 C 462.99 0.00 392.29 214.73 115.11 40.46 52.55 104.28 95.72 0.00
178 D 329.31 0.00 514.46 160.12 169.08 0.00 54.30 71.69 27.90 0.03
178 E 194.60 0.00 471.09 53.00 76.49 7.39 37.27 82.93 45.97 0.00
178 F 736.73 0.00 210.62 135.81 286.56 29.80 0.00 63.11 41.80 0.00
178 G 114.60 0.00 455.43 31.90 100.31 0.00 29.18 66.10 0.96 0.00
178 H 405.92 0.00 525.45 123.92 88.74 12.01 55.62 111.70 36.51 0.08
178 i 428.15 0.00 405.76 140.75 195.39 31.27 42.10 109.24 96.60 0.00
178 J 432.81 0.00 394.99 227.45 204.70 32.23 76.15 64.87 39.63 0.00
179 A 893.89 1217.73 131.59 289.72 162.62 156.41 297.78 118.01 265.40 57.23
179 B 1224.77 0.00 267.43 179.12 305.88 276.71 349.67 120.56 101.64 0.01
179 C 116.50 0.00 302.52 352.72 234.55 13.34 84.11 9.40 9.53 0.00
179 D 192.31 7.22 619.14 63.47 91.30 4.41 41.88 120.31 10.23 0.00
179 F 4195.73 0.00 1799.64 52.19 214.22 2.83 747.38 218.41 35.58 0.00
179 G 292.26 0.00 413.62 95.82 103.87 2.14 143.56 110.86 25.41 0.00
179 H 232.28 0.00 384.02 83.63 167.06 102.17 61.59 94.50 16.59 0.00
179 i 148.82 0.00 647.15 73.14 56.17 0.00 22.36 68.86 174.64 0.00
179 J 267.06 0.00 214.82 33.17 39.32 0.00 63.72 266.09 8.29 0.00
180 A 3683.97 685.87 0.00 1222.10 36.50 6.03 7.65 46.05 568.58 34.67
180 B 74.71 0.00 348.25 136.61 6.74 1.07 8.84 7.41 7.39 0.00
180 F 1010.70 0.00 265.32 577.50 485.80 142.35 111.82 120.92 93.50 0.00
180 G 486.02 0.00 518.25 177.03 250.14 1.55 101.36 130.40 32.05 0.00
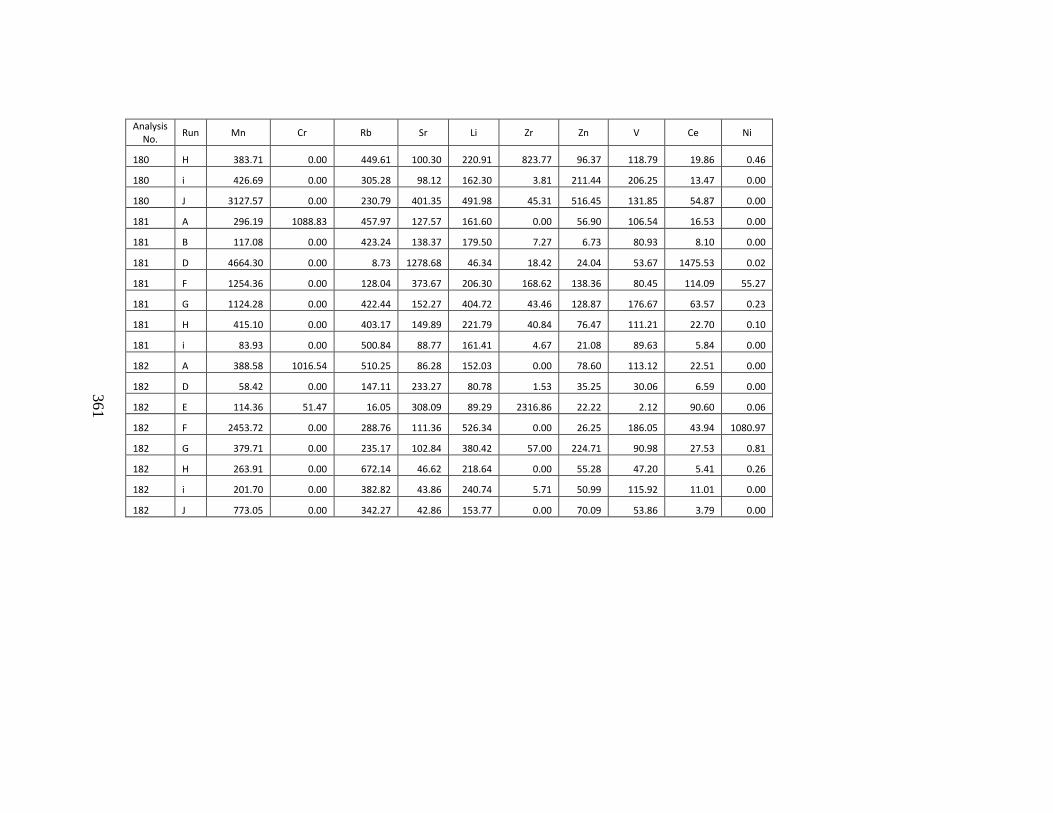
361
Analysis No.
Run Mn Cr Rb Sr Li Zr Zn V Ce Ni
180 H 383.71 0.00 449.61 100.30 220.91 823.77 96.37 118.79 19.86 0.46
180 i 426.69 0.00 305.28 98.12 162.30 3.81 211.44 206.25 13.47 0.00
180 J 3127.57 0.00 230.79 401.35 491.98 45.31 516.45 131.85 54.87 0.00
181 A 296.19 1088.83 457.97 127.57 161.60 0.00 56.90 106.54 16.53 0.00
181 B 117.08 0.00 423.24 138.37 179.50 7.27 6.73 80.93 8.10 0.00
181 D 4664.30 0.00 8.73 1278.68 46.34 18.42 24.04 53.67 1475.53 0.02
181 F 1254.36 0.00 128.04 373.67 206.30 168.62 138.36 80.45 114.09 55.27
181 G 1124.28 0.00 422.44 152.27 404.72 43.46 128.87 176.67 63.57 0.23
181 H 415.10 0.00 403.17 149.89 221.79 40.84 76.47 111.21 22.70 0.10
181 i 83.93 0.00 500.84 88.77 161.41 4.67 21.08 89.63 5.84 0.00
182 A 388.58 1016.54 510.25 86.28 152.03 0.00 78.60 113.12 22.51 0.00
182 D 58.42 0.00 147.11 233.27 80.78 1.53 35.25 30.06 6.59 0.00
182 E 114.36 51.47 16.05 308.09 89.29 2316.86 22.22 2.12 90.60 0.06
182 F 2453.72 0.00 288.76 111.36 526.34 0.00 26.25 186.05 43.94 1080.97
182 G 379.71 0.00 235.17 102.84 380.42 57.00 224.71 90.98 27.53 0.81
182 H 263.91 0.00 672.14 46.62 218.64 0.00 55.28 47.20 5.41 0.26
182 i 201.70 0.00 382.82 43.86 240.74 5.71 50.99 115.92 11.01 0.00
182 J 773.05 0.00 342.27 42.86 153.77 0.00 70.09 53.86 3.79 0.00