Embed Size (px)
Citation preview

THE ELECTRICAL AND MAGNETIC PROPERTIES
OF AMORPHOUS Pd-Cu-P ALLOYS
Thesis by
Gregory Ligot Tangonan
In Partial Fulfillment of the Requirements
For the Degree of
Doctor of Philosophy
California Institute of Technology
Pasadena, California
1976
(Submitted December 12, 1975)

-ii-
ACKNOWLEDGMENTS
The author wishes to express his deepest gratitude to Professor
Pol Duwez for his constant advice and encouragement of this work.
Professor Duwez•s kindness and generosity is a characteristic cer
tainly reflected by his group. The author is thankful for the many
close friends he has made as a result of this association. He is es
pecially indebted to S. Kotake for his excellent technical help on
the cryomagnetic system. The assistance of J. Wysocki in preparing
the alloys and assuring that liquid helium was always available is
greatly appreciated. C. Geremia is thanked for his help in making
fibers, baskets, etc. and the assistance in the electrical resistivity
measurements of P. Lebrun, M. Ma, M. Yung and C. Thompson is grate
fully acknowledged. The author is also grateful for the assistance
of Mrs. Angela Bressan in typing manuscripts, reports, and the rough
draft of this thesis, and to Mrs. Ruth Stratton for typing the final
version.
The financial support of the Hughes Aircraft Company by Hughes
Research Laboratories received by the author while at Caltech i s
gratefully acknowledged. As a Howard Hughes Fellow this association
with the Hughes Research Laboratories has been extremely beneficial
to the author and his family. The financial support of the U. S.
Atomic Energy Commission is also recognized.
The encouragement of my wife Diana during these difficult days
has been gratefully received.

-iii-
ABSTRACT
The amorphous phases of the Pd-Cu-P system has been obtained
us ing the technique of rapidly quenching from the liquid state.
Broad maxima in the diffraction pattern were obtained in the X-ray
diffraction studies which are indicative of a glass-like structure.
The composition range over which the amorphous solid phase is retained
for the Pd-Cu-P system is (Pd100 _xcux) 80P20 with 10 < x < 50 and
(Pd65cu35 )100 _YPY with 15 .s_ y .s_24 and (Pd60 cu40 )100 _YPY with
15.s_y.s_24.
The electrical resistivity for the Pd-Cu-P alloys decreases with
temperature as T2 at low temperatures and as T at high temperatures
up to the crystallization temperature. The structural scattering
model of the resistivity proposed by Sinha and the spin-fluctuation
resistivity model proposed by Hasegawa are re-examined in the light
of the similarity of this result to the Pt-Ni-P and Pd-Ni-P systems.
Objections are raised to these interpretations of the resist ivity re-
s ults and an alternate model is proposed consi s tent with the new
results on Pd-Cu-P and the observation of simi lar effects in crystal-
line transition metal alloys. The observed negative temperature
coeffici ents of resisti vi ty in these amorphous alloys are thus inter
preted as being due to the modification of the dens ity of states with
temperature through the electron-phonon interaction. The weak Pauli
paramagnetism of the Pd-Cu-P, Pt-Ni-P and Pd-Ni-P alloys i s interpreted
as being modifications of the transition d-states as a result of the
formation of strong transition metal-metalloid bonds rather than a

-iv-
large transfer of electrons from the glass fonner atoms (P in this
case) to the d-band of the transition metal in a rigid band picture.

-v-
TABLE OF CONTENTS
I INTRODUCTION
II EXPERIMENTAL PROCEDURES
Alloy Preparation
Quenching Technique
Verification of the Amorphous Phase
Composition Range of (Pd100_xCux)lOO-ypy Alloys
Electrical Resistivity Measurements
Magnetic Susceptibility Measurements
Main field and Gradient Field Coils Variable Temperature Insert The Microbalance Calibration
III ELECTRICAL RESISTIVITY RESULTS AND DISCUSSION
3
3
4
4
5
5
6
7
8
13
14
15
Electrical Resistivity Results 15
(NixPt1_x) 75 P25 Alloys Studied by Sinha 46
Spin Fluctuation Model for Amorphous Metals 53
Comparison with Crystalline Transition Metal Alloys 62
An Alternate Explanation of the Resistivity Behavior 70
Magnitude of the Observed Resistivities 70 Concentration Dependence of p 76 Temperature Dependence of p 78
IV THE MAGNETIC SUSCEPTIBILITY RESULTS AND DISCUSSION 83
V SUMf'lARY AND CONCLUSIONS 90
REFERENCES 91

-1-
I. INTRODUCTION
The increased interest of solid state physicists and engineers
in amorphous metals is a relatively recent occurrence. This rise in
interest has been caused by the discoveries that bulk amorphous metals
can exhibit ferromagnetism, (l) superconductivity, (2 ) useful mechanical
properties,( 3) and oftentimes demonstrate "anomalous" resistivity
properties (like very low temperature coefficients of r~sistivity).
The possibilities of practical application of these materials as well
as the possibilities of testing the basic concepts of solid state
physics for over-emphasis on the existence of long range crystalline
order account for the recent increase of interest in these amorphous
metals.
Direct attempts to obtain amorphous metals by drastic cooling
from the liquid state( 4) have been successful in yielding numerous
amorphous systems. Glass forming in these rapidly quenched alloys
seems to be closely related to the existence of deep eutectics as well
as rather high viscosity in the liquid state. The existence of rather
low eutectics in the binary transition metal phosphides (like Fe-P,
Ni-P, and Pd-P) at about 20 atomic % is the reason that this particu
lar class of compounds has been investigated in considerable detail.
Of particular interest in this study is the fonnation of amorphous
Pd-Cu-P alloys and a study of the effects on the electrical and mag-
netic properties of substituting for Pd in the metal matrix the
noble metal copper.

-2-
Amorphous alloys have been obtained for the Pd-Cu-P system
within the composition ranges {Pd100 _xcux) 80P20 where 10 < x < 50 and
(Pd65cu35 )100 _YPY and (Pd60 cu40 )100_YPY with 15 ~ y ~ 24 . The decrease
of the electrical resistivity with temperature and the weak magnetic be
havior of these alloys are the subjects of this study. It is shown that
the decrease of the resistivity with temperature is similar to the be-
havior of Pd-Ni-P and Pt-Ni-P alloys and that this similarity of behavior
necessitates a re-examination of previously proposed models for the
electrical resistivity behavior. An alternate explanation is given for
the electrical resistivity behavior as a result of the realization that
this property is also common to disordered transition metal alloys in
the crystalline state. The phonon modification of the density of states
with temperature is suggested to be the cause of the observed negative
temperature coefficients of resistivity in the Pd-Cu-P, Pd-Ni-P and
Pt-Ni-P systems.
The level of the resistivity as well as the concentration depen-
dence of the resistivity is explained in terms of the Evans, Greenwood and
Lloyd formalism( 32 ) for liquid transition metal alloys. The low mag-
netic susceptibilities of these alloys are interpreted as being due to
the reduction of the spin-paramagnetism enhancement and orbital para
magnetism as a result of the formation of strong transition metal
metalloid bonds and not due to a large transfer of electrons from the
glass-forming metalloid (in this case P) to the transition metal d
band in a rigid band model.

-3-
II. EXPERII~ENTAL PROCEDURES
Alloy Preparation
The materials used in preparing the ternary alloys of Pd-Cu-P
were 99.99% palladium powder from Engelhard Industries Inc., 99.Q+%
copper powder from Alcan Metal Powders, Inc., and red amorphous phos
phorus from Allied Chemical Co . The coppP.r pm-1der was hydrogen reduced
at 300°C and stored along with red phosphorus in a vacuum dessicator.
Samples of 2g total mass were prepared from these powders.
Powder metallurgical methods involving reactive sintering were
used for the alloy preparation. It i s of critical importance to form
stable phosphides and to avoid a large vapor prP.ssure of phosphorus
during this process. The powders were thoroughly mixed and then com
pacted under a pressure of 3.50 Kbar (50,000 psi) into 1/2 em diameter
and approximately 1 em high briquets. The sampl es were sealed in pyrex
tubes and then slowly heated up to 350°C and kept for two days at this
temperature. At this temperature the reaction in the solid state pro
ceeds fairly rapidly and the pure red phosphorus vapor pressure is still
< 100 nrn Hg. The pyrex tubes were subsequently opened, and the samples
were placed in evacuated quartz tubes for higher temperature s interinq.
The tubes are heated up to ~ 800°C for two more days until compl~tion
of the sintering process. The sintered briquets are then placed in a
quartz crucible in an argon gas atmosphere and completely mP.lted us ing
an induction furnace. The molten alloys are then cast into rods by s uck
ing the liquid alloys into quartz tubes 2 mm in diameter.
-4-
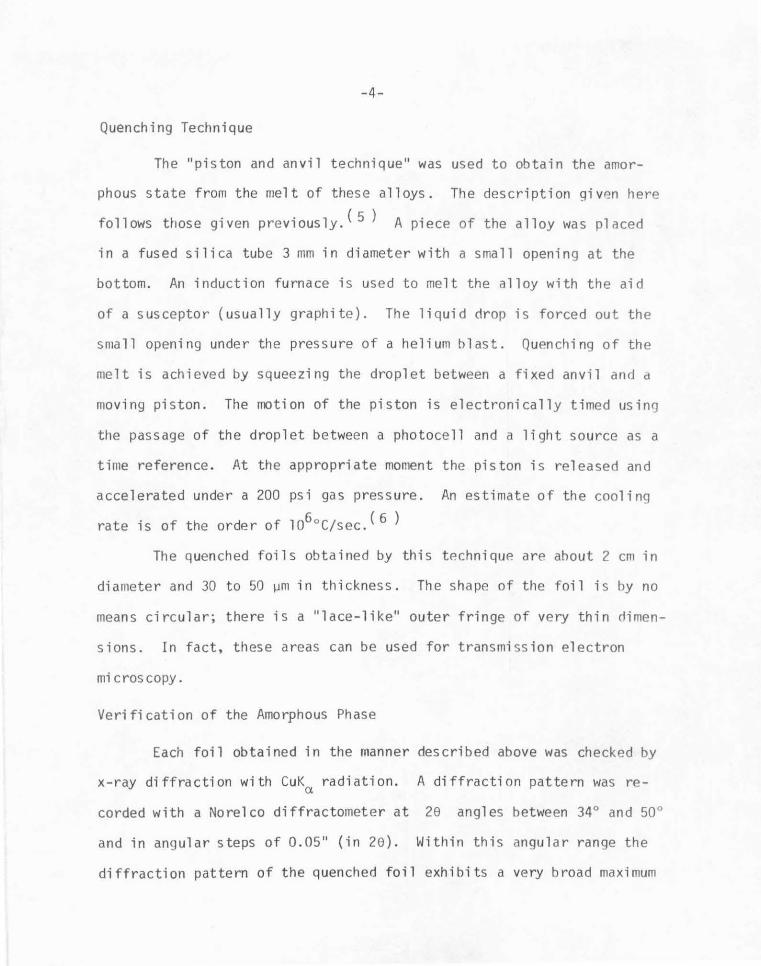
Quenching Technique
The "pi ston and anvil t echnique" was used to obtain the amor-
phous state from the melt of these alloys. The description given here
follows those given previously. ( 5 ) A piece of the alloy was placed
in a fused silica tube 3 mm in diameter with a small opening at the
bottom. An induct ion furnace i s used to melt the alloy with the aid
of a susceptor (usually graphite). The liquid drop is forced out the
sma ll opening under the pressure of a helium blast. Quenching of the
melt is achieved by squeezing the droplet between a fixed anvil and d
moving piston. The motion of the piston is electronically timed using
the passage of the droplet between a photocell and a light source as a
time reference. At the appropriate moment the piston i s released and
accelerated under a 200 psi gas pressure. An estimate of the cooling
rate is of the order of 1 o6oc;sec. ( 6 )
The quenched foils obtained by this technique are about 2 em in
diameter and 30 to 50 ~min thickness. The shape of the foil is by no
means circular; there is a "lace-like" outer fringe of very thin dimen-
sions. In fact, th ese areas can be used for transmission electron
mi eros copy.
Verification of the Amorphous Phase
Each foil obtained in the rnanner described above was checked by
x-ray diffraction with CuKa radiation. A diffraction pattern was re
corded with a Norelco diffractometer at 28 angles between 34° and 50°
and in angular steps of 0.05" (in 28). Within this angular range the
diffraction pattern of the quenched foil exhibits a very broad maximum
-5-
typical of a liquid structure. The presence of microcrystals in the
foil can be detected by weak Bragg reflections superimposed on a broad
maximum. The quenched foils which show any deviation from the liquid
structure diffraction pattern were eliminatPd from further study.
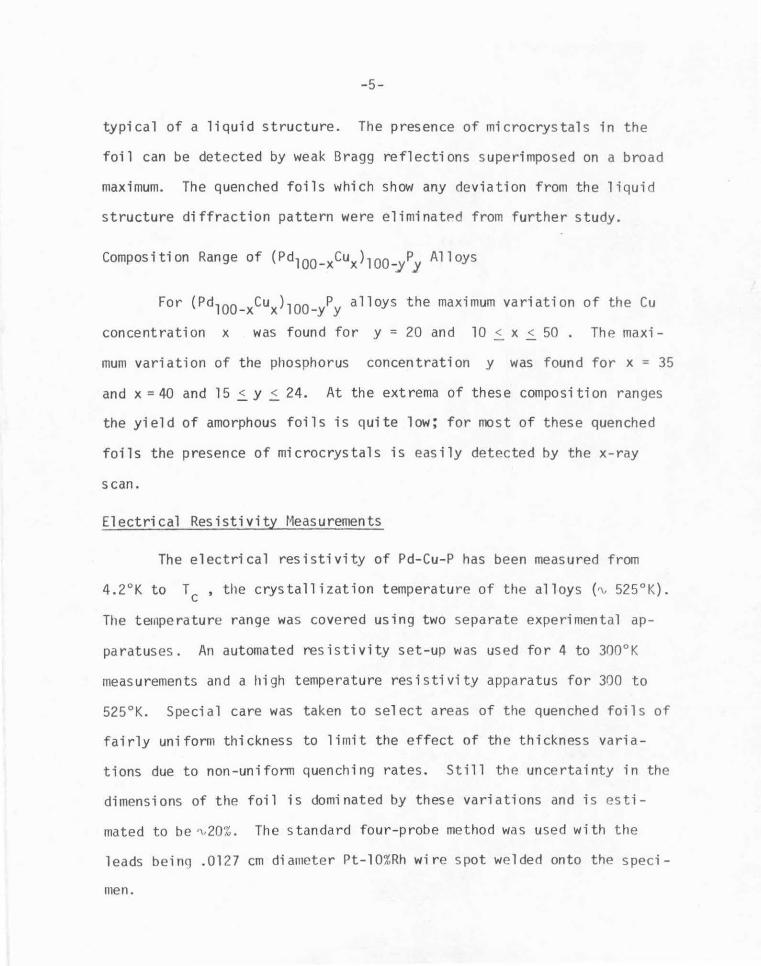
For (PdlOO-xCux)lOO-ypy alloys the maximum variation of the Cu
concentration x was found for y = 20 and 10 ~ x ~50 . Th e maxi
mum variation of the phosphorus concentration y was found for x = 35
and x = 40 and 15 ~ y ~ 24. At the extrema of these composition ranges
the yield of amorphous foils is quite low; for most of these quenched
foils the presence of microcrystals is easily detected by the x-ray
scan.
Electrical Resistivity t1easurements
The electrical resistivity of Pd-Cu-P has been measured from
4.2°K to Tc, the crystallization temperature of the alloys {rv 525°K).
The t~nperature range was covered using two separate experimental ap
paratuses. An automated resistivity set-up was used for 4 to 300°K
measurements and a high temperature resistivity apparatus for 300 to
525°K. Special care was taken to select areas of the quenched foils of
fairly uniform thickness to limit the effect of the thickness varia
tions due to non-uniform quenching rates. Still the uncertainty in the
dimensions of the foil is dominated by these variations and is esti
mated to be rv20%. The standard four-probe method was used with the
leads being .0127 em diameter Pt-10%Rh wire s pot welded onto the s peci-
men.

-6-
The automatic data acquisition system utilized for low temper
ature measurements is the same apparatus described by Chen. ( 7 ) The
system consists of a micro-processor, a relay array, and ASR-33 tele-
type and a digital voltmeter. Analog channel selection is controll ed
by the micro-processor through the relay array. The selected analog
signal is sent to the digital voltmeter and converted to parallel BCD
data. The data are then fed back to the micro-processor, transcribed
into ASCII characters there, and transmitted serially to the teletype
unit. The data are recorded on punched paper tape for later computPr
data reduction.
The digital voltmeter used in the data acquisition system is a
7-1/2 digit Hewlett Packard 3462A digital voltmeter. The analog signal
is amplified by a Keithley 150 AR micro-ammeter 1 amplifier before it
i5 fed to the digital voltmeter. The constant current source used i s
a North Hi 11 t·1odel TC-1002 BR voltage/current reference source.
Of importance to this study of materials with small temperature
coefficients of resistivity is the stability of the apparatus over the
12-hour duration it nonnally takes for a resistivity experiment. By
measuring a san~le with our apparatus at fixed temperature, a stability
of the measured res istivity ±5 x 10⁻⁴ was measured over 12 hours .
Magnetic Susceptibility Measurements
The magnetic susceptibility of the alloys has been measured ove r
the temperature range of 4.2 to 300°K using a Faraday magnetic balan ce
apparatus. The magnet system consists of a superconductinq magnet,
superconducting gradient coils, and a variable temperature insert

-7-
mounted in a helium dewar. The construction and design of the magnet
system was done by Oxford Instrument Company, England. The vacuum
microbalance system and the auxiliary vacuum system for the dewar and
variable temperature insert were designed around the magnet system as
delivered by Oxford Instruments. The neces sary designing was done so
as to utilize the high field and high field gradient capabilities of
this magnet system for s tudying \'/eakly magnetic alloys.
The t~ain Field a11d Gradient Field Coils
The main field i s provided by a superconducting magnet made of
NbTi filamentary wires. The bore was designed to be ~2.5 em, which is suf
ficiently large to permit measurements from l °K to 300°K. The magnet
remains immersed in liquid helium under normal operating conditions and
a maximum field of 75 kG is attainable. The 2.5 em bore allows for
sufficient sample isolation from the helium bath so that room tempera
ture measurements can be performed without large helium consumption.
The effect of turning the gradient coils on and off does not quench the
magnet when operating at 75 kG. The magnet can be operated in persis
tent mode by closing a superconducting path in parallel with the magnet.
The opening and closing of the path, which i s a s uperconducting wire, is
controlled by a heater wound around this wire which raises the tempera
ture of the wire above its critical temperature. By operating in per
sistent mode, measurements at fixed field and varying temperature can
be made with low liquid He consumption.
The gradient coils are independent in operation from the main
solenoid. The maximum field gradient of 1 kG/em is attained at a

-8-
current of 47 A, with a linearity of 1% over 2 em. The gradient
field can be switched on and, with a constant voltage input, made to
come to full value in 5 seconds. These coils are connected in series
opposition. A homogeneous field gradient is obtained between two non
distributed coaxial wires when they are separated by a distance /:3 R
when R is the radius of each coil, and the gradient is given by
= 0.8058 ni R2
where n =number of turns on each coil.
Variable Temperature Insert
The variable temperature insert provides a sample environment
in which measurements from 1 to 300°K can be performed while the mag
net system is kept at 4.2°K in an external helium bath. Samples are
suspended down the center of the variable insert, which has a tail
which fits into the solenoid bore. The description of this system i s
aided by referring to Figs. 1 and 2.
The sample is suspended in an inner sample tube chamber made of
stainless steel. Near the bottom of the tube are three small holes
through which helium gas can be admitted while changing samples at low
temperatures. This gas flow prohibits air, which may cause a suscepti
bility run to be stopped, from condensing in the sample tube. Helium
exchange gas is allowed into this tube during normal measuring condi
tions to equilibrate the san~le temperature with the inner wall tem
perature of the variable temperature insert. The wall temperature of

-9-
Legend for Figure 1
l. Belljar
2. Mirror
3. Electro-Microbalance
4. Sapphire
5. Innertube Gas Purge
6. Liquid Helium Transfer Tube
7. Sample Tube
8. Inner Tube
9. Outer Vacuum Chamber
10. Liquid Nitrogen Chamber
11. Helium Pot Needle Valve
12. Inner Vacuum Chamber
13. Helium Pot
14. Specimen
15. Superconducting Magnet and Gradient Coils
16. Lamp

-10-
101)----++--
®>~----~
Fig. 1 Cryomagnetic system with microbalance.

-11-
Legend for Figure 2
1. Liquid Nitrogen Reservoir
2. Helium Pot Needle Valve
3. Helium Pot Chamber
4. Inner Vacuum Chamber
5. Liquid Helium Chamber
6. Outer Vacuum Chamber
7. Heater
8. Superconducting Magnet
9. Carbon Resistor
10. Specimen
11. Differentia 1 Thermocouple
12. Temperature Sensor
13. Radiation Shield
14. Sapphire Rod
15. Center Tube
16. Sample Tube
17. He 1 i um Pot Pump-Out
18. Inner Vacuum Chamber Pump-Out

- 12-
0-
(~ -~ Q~ ~ ~ I=
I = J:: 16
3 15
®--- ._ 14
5 1 .. ~
®--~h I L:...:,.; ~
~i ~~ 1\ I ~ I 7
8 II
9 v 10
7\ /\ -@
II
1/\ 7 \ 7
1/ \ r+ ~
~
Fig. 2 Variabl e temp~rature insert o f cryostat.
-13-
the insert is monitored by a Au-0.03 at.% Fe/chromel thermocouple
which has its reference junction in the outer helium bath. The inside
sample tube has wound on it, in the region of the sample position, a
heater which is used to reduce the temperature gradients over the
sample space. The gradients are measured by a differential thermo
couple with junctions 3 em above and below the correct sample pos ition .
Liquid he 1 i um may be drawn into the he 1 i urn pot through the
needle valve from the helium bath. The system is operated down to l°K
by pumping on the liquid helium in the pot. By carefully choosing the
inner vacuum chamber gas pressure as well as that of the helium pot,
temperatures from 4°K up to 300°K can be maintained for extended
periods using simple temperature control circuitry.
The Mi croba 1 ance
The vacuum microbalance used for the sample weight measurements
is a Cahn microbalance Model RG. This balance is designed expressly
for use in high vacuum systems and in a controlled environment situa
tion. The materials used in the construction are specially chosen to
minimize outgassing. In the configuration used in this system, the
balance capacity is 1 gram total weight of sample + s uspens ion fiber
with a sensitivity of 0.1 ~g. The sample weight can be continuously
monitored on a digital voltmeter and the weight changes caused by
switching the gradient coils on and off are directly measurable. In
practice, the effects of sample motion, gas movement in the sampl e
tube chamber and vibrations limit the sensiti vi ty of the balance to
.5 ~g. The sensiti vity to vibration was minimized using vibration

-14-
isolation pads obtained from Acoustic Technology, Columbus, Ohio, and
weighting down the balance table with lead bars.
Ca 1 ibrati on
The apparatus, when finally made operational, was tested by
measuring the susceptibility of palladium, platinum, and copper at
various temperatures. These results agreed reasonably well with re
ported data for these materials. Using a mechanical movement con-
trolled outside the bell jar, the sample could be positioned at the
center of the magnetic' s homogeneous region to within ±1 mm by moni
toring the effective weight of the sample with position. The correct
positioning of the sample is perhaps the most important factor affect-
ing accuracy and reproducibility of results. For paramagnetic samples
the position of maximum weight with the gradient field on is deter-
mined, and the linearity of the weight change with field is checked as
a further confirmation of correct centering of the sample with respect
to the main solenoid and gradient coils. The sensitivity of this sys-
tern is such that the easily detectable change of weight of 1.0 ~g of a
sample of 250 mg s tudied at 50 kG and 1 kG/em gradient corresponds to
a susceptibility of 2 x l0- 11 emu/gm.

-15-
III ELECTRICAL RESISTIVITY RESULTS AND DISCUSSION
Electrical Resistivity Results
The electrical resistivity of the amorphous alloys
(Pd100_xCux)lOO-ypy was measured over the temperature ranqe of 4°K
to T g' the crystallization temperature of the alloys (rv 550°K). The
measurements were perfonned in three parts. First, the room temper-
ature resistivity of at leas t nine samples of each compos ition ob -
tained from four or more different quenched foils was measured. In
Fiy. 3 and Fig. 4 the res istivity at room temperature for various
concentrations of th~ amorphous phase i s shown. It is clear that,
despite the error(_+- 20%) due to thickness variations of the samp les,
a definite trend in the data is observable. The data point s hown i s
the average of the measured resistivity for the different foil s and
the bars indicate the extent of the variation of the data points.
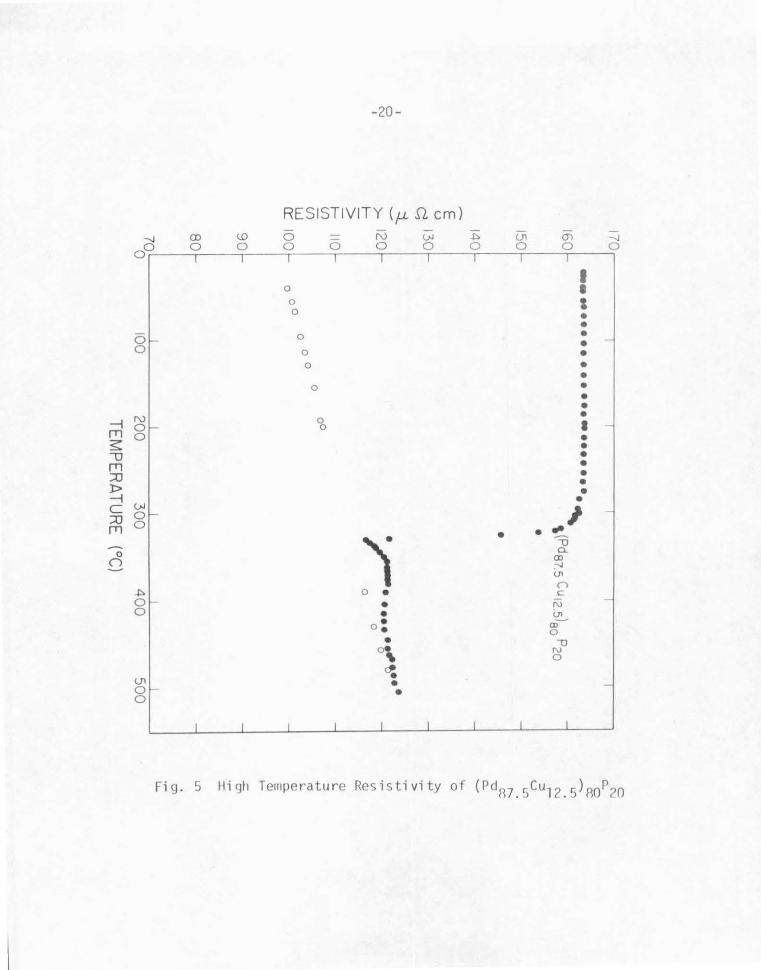
Secondly, the resistivity from room temperature to above the
crystallization tempe ra tu r e of the alloys was measured. The res is-
tivity data are plotted in Figs. 5 to 17. Of interest is the
linear decr ease of res istivity with temperature up to Tq (rv 550°K)
and the compos i tiona 1 dependen ce of the t empPrature coefficients of
res istivity at the crystallization. The parameters of interest ob
tained by these high temperature measurements for alloys of different
compositions are given in Table 1. The determination of the temper
ature coefficient of resi s tivity near Tg i s complicated by the effects
of inhomogeneity of tile quenched samples . The a111orphous sampl es do
not crystallize uniformly at a given temperature T9
. Portions of
the samples may crystallize at 20 to 30 degrees centrigrade l ess than

-16-
the major portion of the sample. These crystallized portions provide
low resistivity paths and may cause large errors in the estimated
temperature coefficients. Nonetheless, clear trends are visible in
the data. The temperature coefficients of resistivity decrease (be-
come more negative) with increases of Cu concentration x or P con-
centration y, withy and x fixed respectively. The resistivity at
T g follows the same compositional trends observed at room temperature.
For the crystallized samples, which contain phosphides of palladium
and copper, as well as solid solutions of palladium and copper, the
temperature coefficients of resistivity are positive and 5 to 30 times
larger in magnitude than for the amorphous alloys. With x fixed, the
effect of increasing the phosphorus concentration is to decrease the
crystalline temperature coefficient of resistivity for both the
(Pd65 cu35 )100 _YPY and the (Pd60 cu40 )100 _YPY series. For the
(Pd100_xCux) 80P20 alloys a maximum in the measured a's occur in the
x = 20 to 35 range.
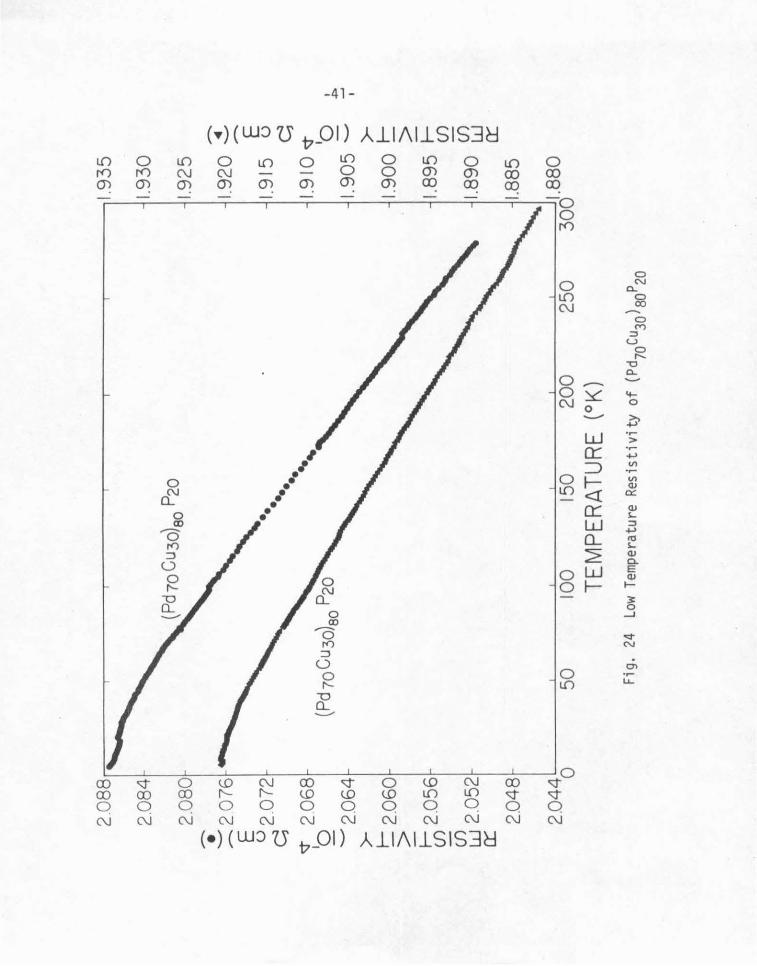
Lastly, the resistivity from 4.2°K to room temperature was
measured using a computerized data acquic;ition system. The results of
these measurements are shown in Figs. 18 to 26. The decrease of the
resistivity with temperature observed for hiqh temperatures is also
seen at low temperatures. At very low temperature (4 to l5°K) a local
resistivity minimum is observed and can be accounted for by the presence
of up to 100 ppm Fe impurities which give rise to a "Kondo-like" mini
mum (a true Kondo minimum is impossible in the case of negative a).
Further increases of temperature cause a T2 decrease of resistivity up

-17-
to ~ 120 ° K. This is followed by aT decrease of resistivity which, as
we have already seen, continues up to Tg The effects of increasing
the phosphorus and copper concentrations are to increase the resistiv
ity and to make a more negative. For all phosphorus concentrations
studied with x = 35 or 40, the measured a 's at room temperature are
negative. By increasing the Cu concentration above x = 10%, the room
temperature slope can be made to change sign at around x = 15. For
the alloys studied, the alloys (Pd65cu35 )85P15 and (Pd85cu15 )80P20 ex
hibit the least sensitive resistivity behavior to temperature. The
experimental results are shown in Fig. 18 and Fig. 23. These curves
serve to denonstrate the ability of the apparatus to measure the small
variations in temperature without difficulty.
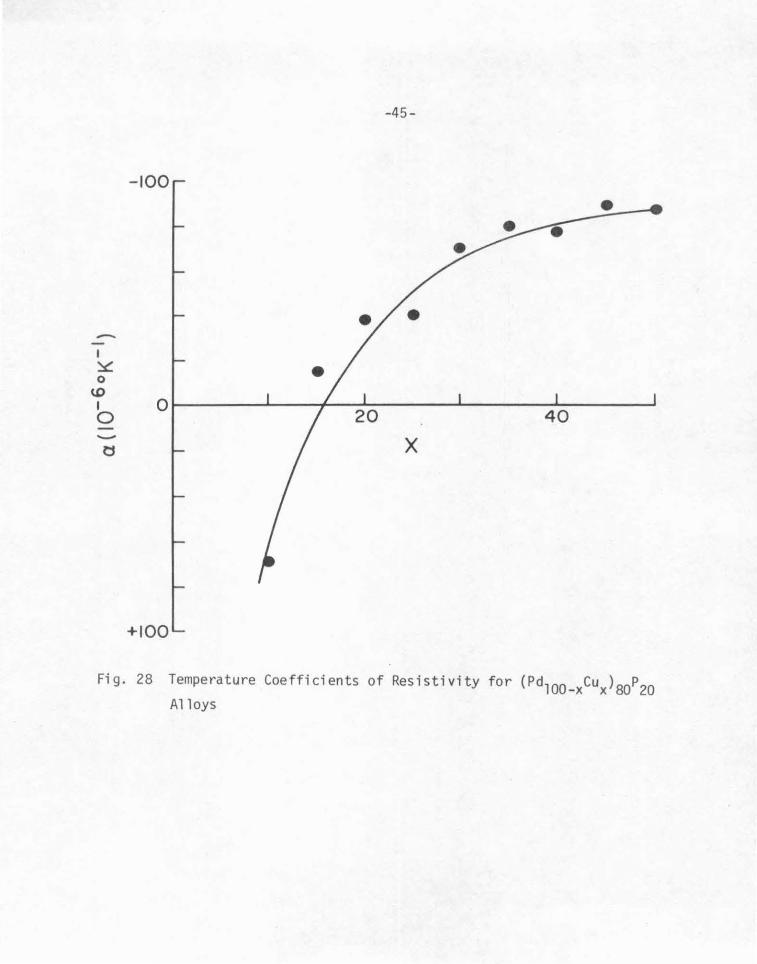
The temperature coefficients of res is ti vi ty measured at room
temperature are shown for the series (Pd65cu35 )100 _YPY and )Pd100_xcux) 80 P20 in Figs. 27 and 28, respectively. A clear trend of increasingly more
negative a's with increasing Cu and P concentrations is observed.

•
0 w N
• •
0 N N
-18-
• •
0 (X)
• •
I
I
•
L() N
0 >-N
t/1 >, 0
.--<t:
>, 0..
::;-. 0 0 .---U') ("")
~ u
U')
1..0 "'0 0..
~ 0
~ ·.->
·.-+> t/1
t/1 QJ
0::
QJ ~ ~ ....., n:s ~ QJ c.. E QJ I-
E 0 0
0::
("")
. 0"1 ·.-l.J....

300
260
I
! -
f E
(.
)
~
220
f I ~
ID
:t
I
- Q.. I
180
l--
f !
f I
• 14
0 0 10
20
30
40
50
X
Fig.
4
Room
Tem
pera
ture
Res
isti
vity
of
(Pd 10
0_xCu
x)80
P 20 A
lloys
-20 -
RESISTIVITY (J-L D. em)
--J (X) U) 0 N (jJ 4:> (}1 CJ) --J
00 0 0 0 0 0 0 0 0 0 0 I I I I I I I I I
I 0 • 0 I
0 • • 6 0 • 1- • -0 0 •
0 • • 0 • • • •
~ N 0 I -0 1- 0
fT1 0 • s: • -o • fT1 • • ::::0 • l> • ~ • c (jJ
_.1 -::::0 0 1-
fT1 0 •
l • -:u - 0..
0 (X) (} -.j - U1
n 4:> 0 • c 0 1- • N -0 • U1
o• CD~
• 0 • -u 0 \ N
0
~ (}1 • -0 1- • 0
I I I 1 I I I _l I

E u
~ ::1.. -
>~
> ~ (/)
(/) w 0::
230
220
- 21-
(Pdao Cu2olao P2o ••• • •••••••
0 0
0
0 0
0
•
•
•
• •
-- .. -. • •• 0
• • •••••• 0
0 0
•• • .. ~
• • • ~
\
0 • • : .····
•• ••• • • 0
- - ___L - - _._ __ -- ___L_
100 200 300 4 00 501)
TEMPERATURE (°C)
600

- 22 -
220.-------,--------,-,------~,--------r-l-------r------~,------~
E (..)
210t- .... (Pd 7o Cu3ol80 P2o ...................
200 '-
.. , • • • 190- -._ • • • (Pd75 Cu2sl80 P2o
• • • • •• • • • .. ··- ..... . IBOf- ~
1701-•
1601- • •
q 150 :::1..
1-
->- 140 1- -> ~
130 (/) -(/) w cr 120 t-
II Ot-
100 1-
90 t-
80 1-
•
• • • .\ • • • •
•
• • • •
~ .. --,.·
sam ple mel ted
•••••
• •
•
• ~
I sample melted
• • ••• ••
• • •• ......... , ·-··· 70 1-
600 I _l 100 200 300 400 500 600
TEMPERATURE (oC)
-
-
-
-
-
-
-
·-
-
-
-
-
-
700

E u
>t-> tU)
U) w a:::
- 23-
210~------~------,-------.------~r-------~------,
-. ..... . _ (Pd6o Cu4ol8 0 P2o ............... -·~ • ....
• I • • • •• • •• • • • . ·"'-~·· 0 ~
0 0
0 0
0 0
00
0
_i ____ _..L
0
0 oo
~:: 0 \··
0 0 0
0
~~
100 200 300 4 00
TEMPERATURE ( °C )
o•~
500 600
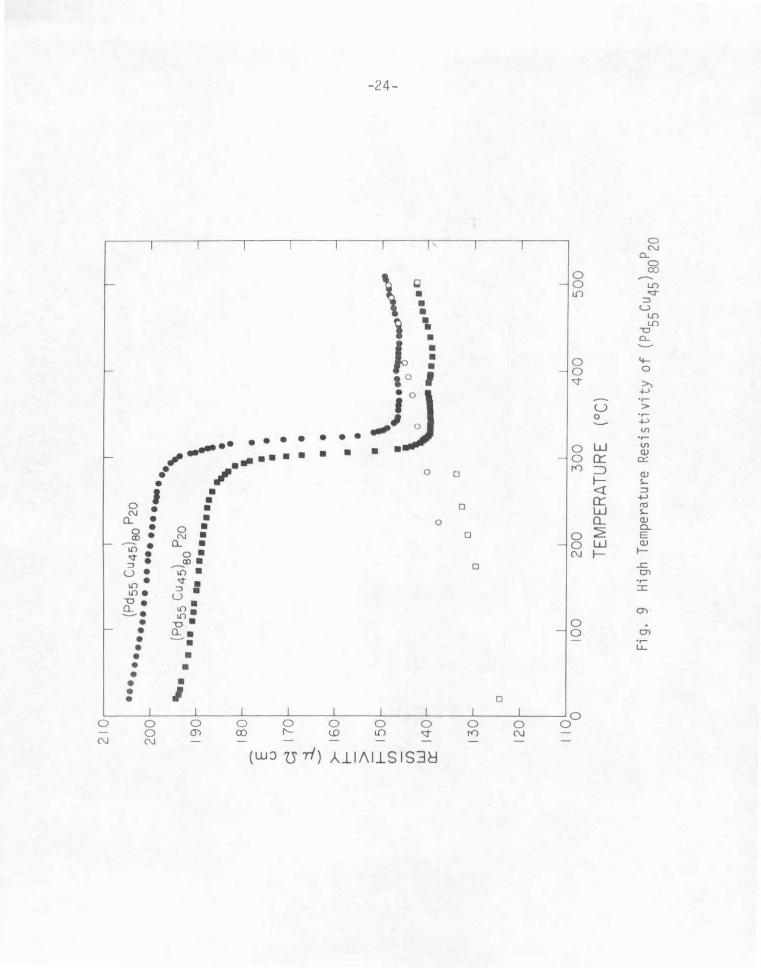
210.-------,--------.-------.-------.--------~~
(Pds
s C
u4s)
ao P
2o
··········
· .......
····-···
20
01-
) p
' (P
dss
Cu4
5 so
20
\
""· ....
..... ···
·······
19
0f-
'· ~
ISO
f-••
E
u ~
1701
-::
l .....
>-
1601
-I- - >
I-
150~
({) - ({) ~ 1
401-
0
0
1100
10
0
0 0
0 0
0
' .
• •
• • •
• •
• • • . \ . '-
-·-----
~0~-~
............ o
I I
I I
200
30
0
40
0
50
0
TEM
PER
ATU
RE
(°C
)
- - - - - - , - -
Fig.
g
Hig
h T
empe
ratu
re R
esis
tiv
ity
of
(Pd 55
cu45
) 80P 20
I N ~
I

-25-
0 0 !..D
• -.. \ I • • (1)-o
\ • 0..(1) 0 • E ~ 0 0 (I) l{) cn E • )6
,. 0
0 •
'· 0 <:j • . .... u
0 0 .. - ~ .. ..
0 ·:) ") w 0:::
0 0 ~
•• 0 I-• • • •• r0 <{ •• •• 0::: 0 • ~ 0
N • • w 0.. • • Cl.
0 • • 0 ~ a> • 0 • w o • ~ • • 0 I-U) • o . 0 0 8 • .-::? . 0 N o • o .
U) . U) . :J • -o e u • .e:.. . o •
• U) •
• -o •
• ~ · 0
• • 0
• • • • • • • I • • t I
0 0 0 0 0 N 0 N N N N
( W::> U -rf) J.-_l l /\ l_l_SIS3Cl
Fig. 10 Hi gh Temperat ure Res istivi ty of (Pd50
cu50
)80
P20

E u q ::l
r I-
> I-(j)
(j)
w a::
-26-
ISO ••• I I I I
••••••••••••••••••••• I
••••• • 170 r- \ (Pd65 Cu35)65
P15
140t-
130 r-
120 r-
I lOr
100 t-
90 t-
80 r-
70 t-
60 t-0
50 0 r- 0 0 0
40 D D
t--D 0
D
30 t--
I 200 100
0
0
0 D
D D
I
200
D
l
•
I
• • • • • • • • • • •• • • • • • •
• '····· • 0
• 0
.. ~· 0
\ ao •
0
•••••• "llltl~ 0
0 0
1 I 300 400 500
TEMPERATURE (oC)
-
-
-
-
-
-
-
-
-
-
-
-
-

E u q ::i...
>-I-
> I-(/)
(/) w 0:::
-27-
190 •• ••• •••I•• •••• ••••I•••• •••• •I I • \ (Pd6o Cu4o)84 P16
180 ••••• • r •••••••••••••••••• • ••••• 170 r
160 r
150 r
140
130 -
120 -
110 -
100 -
90 -
80 -
70 ,_
60 r
50 t- 0
400
(Pd6s Cu3s)82 P1s • •
oD oo oo
0
0
I
100
0
I
200
0 o oo o
oD o
I
• • •
• •
•
• •
• • , • \
300
TEMPERATURE (oC)
0
I
400
Fi g. 12 High Temperature Resistivity of (Pd60cu 40) 84P16 and
( Pd65cu35) sl1s
I
-
-
-
-
-
-
-
-
-
-
-
-
-
-
I
500

E u
q ::1..
>~
> i= (f)
(f) w a::
-28-
• • (Pdso Cu4ol81 P19 2 4 0 - •••••••••••••••••• . ,
•
.. • • •
(Pd6o Cu4ol83 Pt7 • ••••••••• ••••••••••••
0
130 0
0
120 0
• ·····t ••
0
0
• • • • • • • • • • • • • •
0
' • " • • • • • 90 \ • ··~e o •
,..... 0
0 0
0 80 0 0
0 0
0 0
0
n
.J_
100 200 300 400
TEMPERATURE (oC) 500
Fig. 1 3 High Temperature Res istivity of ( Pd60cu40 ) 8l 17 and
(Pd60Cu40) 8lpl9

E u
~ ::l
>-I-
> I-(f) -(f)
w 0::
-29-
190.--------,--------,---------r-------~--------~
ISO (Pd6o Cu4o)8 , P19 .......................... .,.
• (Pd6o Cu4ol82 P1s • •••••• • ••••• •• • • • • • ••
• • • I •
140 •
~~ • • • • • "" .....
" 0 • 0 •
• 0
• 0 • • •• • • • .. ~ 0 0
0
0 0
0
0
70 u 0
600 __l_ -
100 200 300 400
TEMPERATURE (oC)
Fig. 14 lliqh Teu1perature Res i sti vity of (Pd60
cu40 )82
P18 and
(PdGOC u40)8lpl9
500

-30-
280.--------,--------,---------,--------.--------,
E 210 u
Cl :::i.. 200
>-1- 190 > 1-(f)
(f) 180 w ct::
170
160
150
140
130
120
Fig. 15
••• •••• ••• ( Pd6oCu4ol 78 P22 ••• ••••••••• •• • •
• • • •
•
• ••• ( Pd6oCu4ol 79 P21 ••• • •••••••••• •
' • • ..... • 0
0
0
0
• 0
0
0
0
[J
0
__L _L
100 200 300
TEMPERATURE (0()
o oo ooo
0
400 500
Hi gh Temperature Res i stivity of (Pd60cu40 ) 79 P21 and
( Pd60Cut10) nt 2L

E u q ::l
>f-> f(f)
(/) w 0::::
- 31-
260~-------.--------,--------r--------~------~
250
240
230
0
0
•• •••••• •
(Pd 6o Cu4o)7~0
0
100
0
• • • • • • • •
200 300
TEMPERATURE (°C )
400
Fig. 16 High Temperature Res i sti vity of (Pd60cu40
)7l
23 and
( Pd60Cu40) 76p 24
500

>-1-
> 1-(/)
(/)
w 0:::
280
2 70
260
250
240
230
170
... •• ••• (Pd65 Cu 35) P24
•••• 76 ••• ••••••••
••• (Pd65 Cu3sl78 P22 ••••
• • • •
•
-32-
••••••••••• •••••• ... •
•
• •
• •
l ---
•
•• ·~ . " • ·sample
• melted • I • •
, • ••
0
0
cP 0
• • •• ••• •••• ..... •
• 0
• 0 0
• • • • • • ••• • • • ....,.
~·· . o . o
0~ I • •
110oL--------10~0------~2~0-0------~3~0~0-------4~0~0-------=50~0------_J600
TEMPERATURE (°C)
Fig . 17 High Temperature Resistivi ty of (Pd65cu35 ) 78r22 and
(Pd65Cu35)76p24

-33-
Table l. High Temperature Resistivity Parameters
Tg P crys t. Damorph. a crys t. a amorph . ( 0 ~q ( ct:l Clll) (p\2 em) (l0-6oK-l) (lo-6oK-1)
..;.'c.
(Pd87.5Cul2.5)80p20 320 115 164 606 0
(Pd85cu,5)80P20 320 125 240 705
(Pd80Cu20)80p20 310 85 192 1406 -15
(Pd75Cu35)80p20 350 72 182 761 -110
(Pd70Cu30)80p20 340 205 -3<J
(Pd65Cu35)80p20 380 109 195 781 -94
(Pd60Cu40)80p20 350 125 185 461 -44
(Pd55Cu45)80p20 300 135 188 307 -121
(Pd5~cu45)80P20 320 142 198 300 -93
(Pd50Cu50)80p20 290 162 208 306 - l 09
(Pd50Cu50)80p20 290 130 195 -75
(Pd65Cu35)85p15 320 75 175 131 8 - 50
(Pd6 5Cu35)8ll6 320 55 155 1000 -36
(Pd65Cu35)72P18 320 75 175 1314 -76
(Pd65Cu35)78P22 290 156 230 740 -109
(Pd60Cu40)7l23 280 170 241 625 - 122
(Pd65Cu35)76p24 250 280 272 353 -158
(Pd60Cu40)76p24 260 160 230 468 -126
(Pd60Cu40)8l lG 340 70 186 1045 - 113
( Pd60cu40) sl17 320 75 1 RO 1151 -116

-34-
Tab 1 e 1 - continued
Tg Pcryst. Pamo rph. aery st. aamorph.
( o K) (llfl em) ( ~n em) (10-6oK-1) {10-6oK-1)
(Pd60Cu40)82p18 310 85 168 931 -26
(Pd60Cu40)81p19 310 110 179 671 -44
(Pd60Cu40)81p19 310 150 240 535 -54
( Pd60Cu40) 79p 21 300 150 204 466 -62
(Pd60Cu50)78p22 290 176 268 764 -64

1.68
28
1.68
24
E' 1.
6820
u c; 1
.681
6 ~
I 0 .:::::.
1.68
12
>- ~ > 1
.680
8
~
(f)
1.68
04
(f
) w
0:::
1.67
96
( Pd6
sCu3
s)as
P,s
•
I
1.67
92
0 5
0
I 00
1
50
,
20
0
25
0
30
0
TEM
PE
RA
TUR
E (
°K)
Fig.
18
Lo
w T
empe
ratu
re R
esis
tivi
ty o
f (P
d 65cu
35) 85
P 15
I w
U'l
I

1.67
2 1.
484
1.67
0~
0
-~1
.482
....
.......
..........
. • ~
1.66
8 1.
480 ~
..........
.
E
(Pd
6s C
u35)
84
P16
~ 1
.666
\..
~ .....
..... , ,...
.,,...
,., , ...
... ,
E
1.47
8 (.)
~
~
1.66
4 ~..
1.47
6 1
0 ....
........
. , 0
.::::
1.66
2
~...
1.47
4 .:::
::: >-
.... ,
......
. >-
~ 1
.660
(P
d6s
Cu3
sl8
4 P
16
....
....
....
....
....
_
'-I
1.47
2 ~
tn 1.
658
....
....
....
...
1.47
0 tn_
~
~
~
~ 1
.656
'
1.46
8 ~
1654
1.
466
. 0
50
10
0 15
0 2
00
2
50
3
00
TEM
PE
RA
TUR
E (
°K)
Fig
. 19
Lo
w Te
mpe
ratu
re R
esis
tivi
ty o
f (P
d 65cu
35) 84
Pl6
I ~
I

2.0
401
'--._
__
I I
I I
I 12
.020
........
..... E 2.
o2
8
l)
~ 2.
024
~ b -
2.0
20
.....
........ >-
2.0
16
~
> 2
.012
~ ~ 2
.00
8
w
0:::
2.0
04
2.0
000
(Pd
65 C
u3s)
82 P1
a
(Pd
65 C
u35)
80
P2o
50
10
0 15
0 2
00
25
0 TE
MP
ER
ATU
RE
(°
K)
2.0
15
2.0
10 ~
..........
... __
..._,
2.0
05
E
l)
2.0
00
~
~
I
1.9
95
0 .....
........
I
1.9
90
>-
~ r-
I
1.98
5 >
r-1.9
80
(f
) (f
) w
1.97
5 0::
:
3001
.970
Fig.
20
Lo
w T
empe
ratu
re R
esis
tivi
ty o
f (P
d 65cu
35) 80
P 20 an
d (P
d65Cu
35)8
2Pl8

2.62
0 r-----r-------r------r-------r----.--------. 2
.270
2.6
00
.....
.......
~ 2
.580
E
(.)
2.56
0 ~
1 2.
540
0 -2
.520
>- 1
-2.
500
> tn 2.
480
(j) w 2
.460
a:
2.44
0 0
2.26
0
(Pd6
5 C
u35)
76 P2
4 2.
250
2.24
0
2.23
0
(Pd
65 C
u35)
78 P2
2 2.
220
2.21
0
2.20
0
50
100
150
20
0
TEM
PE
RA
TUR
E
(°K
) Fi
g.
21
Low
Tem
pera
ture
Res
isti
vity
of
(Pd 65
cu35
) 78P 22
and
(Pd 65
cu35
) 76P 24
-~ ...._.., ..........
.. E
(.)
~
'1\t 10
...._
.., >-I
1-
w
-co
>
I
- 1-
(j)
(j) w
n::

1.712
I
1.49
6
• 1.
708
........ - E
1.70
4 (P
d 9oC
u,o)
80
P2o
u '
~ ~
.. c;
1.7
00
....
....
.. ~···
··
'o 1
.696
..
..
-.
. .. ~
.........
>-1.
692
1- > 1
.688
•••
• )
P
•••
(Pd 8
0 C
u2o
80
20
....
...
1-
(j)
1.68
4 (j
) ·~
w
0:::
1.68
00
50
10
0 15
0 2
00
2
50
TEM
PE
RA
TU
RE
(°K
)
Fig
. 22
Lo
w T
empe
ratu
re R
esis
tiv
ity
of
(Pd 90
cu10
) 80P 20
an
d (P
daaC
u20)
80P2
0
1.492
~
...__ -
1.48
8 E
(.
)
1.48
4 q
~
I
1.480
0 ..._
_
1.47
6 >- 1
--
1.47
2 >
1
-1.
468
(j)
(j)
1.46
4 ~
30
0
I w
1.0 I

1.65
8.-
-----,-
-------,-
----.-
---.-
--------,.
-------,
...._
__
,...
....
....
....
. )P
~ 1.
657
·~-a
...._, (Pd
ssC
uls
eo
20
. ~
:::::::
1.65
6 ••
••
E
•• •• 0
I 65
5
"•
~ .
'~
•• '--
' ...
1 1.
654
0 .._ 1.6
53~
>- t--1.6
52
> tn
1.65
1
~ 1.
650
(L 1.
6490
_
_l_
__
__
I
I
50
100
150
20
0
TEM
PE
RA
TUR
E
(°K
) Fi
g.
23
Low
Tem
pera
ture
Res
isti
vity
of
(Pd 85
cu15
) 80 P 20
• ••• ... ..
.
I
250
- - -
.... ... - " - -
30
0 I .,. 0 I
..--..
•
2.0
84
2.0
80
:::::
2 0
76
E
~2
.072
"f 2
06
8
0 _.. 2
.06
4
> r-2
.06
0
> tn 2
.05
6
(j) w 2
.05
2
0::
2.0
48
2. 0
44
0
50
•• •• •• •• ....
100
150
20
0
TEM
PE
RA
TUR
E (
°K)
25
0
Fig.
24
Lo
w T
empe
ratu
re R
esis
tivi
ty o
f (P
d 70cu
30) 80
P 20
1.93
5
1.93
0
1.92
5 ..-
-..
1.92
0 ~
....--
1.91
5 E
(.
)
q 1.
910 ~ •o
I
I. 9
05
.::::
: ~
-'
I
>-1.9
00
r- >
1.8
95
t- (j
)
1.89
0 ~
0::
1.88
5
3o
d·8
80

2.5
8r----,-
---
--r----r------,-----.-------. 2.
110
.._....
- E 2.5
4 u ~ 2
.53
~ 'o 2
.52
.._....
:r 2
.51
~
> 2
.50
~
(f)
2 49
(f
)'
w
0:::
2.48
2.47
2.46
0
2.10
5
2.10
0
2.09
5 -;
' .._
....
• (P
dss
Cu4
5)8
0 P2
o - E
....
u
-'
2.08
5 ~
.. ,..
' ~ 'o
•• •• - .._.
...
(Pd6
o C
u4o)
80
P2o
••••• .
..
2.07
5 ~
..... • -
--
2.07
0 ~
... - ' .
(f)
'" 2.
065
(f) w
2.06
0 0:
::
_j2.
055
•
2.05
0 50
10
0 15
0 2
00
25
0 3
00
TE
MP
ER
ATU
RE
(°K
)
Fig.
25
Lo
w T
empe
ratu
re R
esis
tivi
ty o
f (P
d 60cu
40) 80
P 20 an
d (P
d 55cu
45)8
0P20
I ~
N I

2.62
0 .-----.------.----.-------r----.------.
2.61
0 ....
....... • :::::::
2.60
0 E
(.
) q 2.
590
1 2.
580
0 -....
2.57
0 >- ~ 2
.560
>
tn 2.
550
(f) w 2
.540
0::
:
~Pds
o Cu
so) 8
0 P2
o
2.2
80
2.2
70
.....
........
2.2
60
~ -
2.2
50
E
(.
)
q 2
.24
0 ~ 'o
2.23
0 .::
:: >-2
.220
~
>
2.2
10 ~
(f)
-2
.20
0 ~
0:::
2 ·53
0
50
I 00
15
0 2
00
TE
MP
ER
ATU
RE
(°
K)
250
3002
.190
Fig.
26
Lo
w T
empe
ratu
re R
esis
tivi
ty o
f (P
d 55cu
45)
80P 20
and
(Pd5
0Cu5
0)80
P20
I .;:.
w
I

-44-
-200
- • I ~ 0
U) -100 I • •
0 -~ •
•
• • 15
y
Fig. 27 Temperature Coefficients of Resistivity for (Pd65Cu35)100-ypy
Alloys
-45-
Fig. 28 Temperature Coefficients of Resistivity for (Pd100_xCux)80
P20
Alloys

-46-
In the following sections the results of the experimental measure
ments are co~pared to the results of previous studies on the Pd-Ni-P
and Pt-Ni-P alloys. The different models for the electrical resistiv
ity decrease with temperature proposed by Sinha( 8) and Hasegawa(9)
discussed in the light of the present results and objections are gfven
based on theoretical results. Both models are found to be unsatisfac
tory and an alternate approach is given. This approach is based on
the realization that the negative temperature coefficients observed
in these alloys follow the Mooij correlation for numerous cyrstalline
transition metal alloys, there being a commonality of behavior of
these amorphous alloys with the crystalline alloys. The model of the
phonon induced modification of the density of states discussed by Chen
et al. and Brouers and Brauwers is used to explain the origin of the
negative temperature coefficient of resistivity.
Sinha has studied the structure and measured the electrical prop
erties of the amorphous alloy having the composition (NixPt1_x) 75P25 where 0. 20 .s_ x .s_ 0. 60. The x-ray diffraction measurements indicated
a higher degree of structural disorder in these alloys and an atomic
arrangement similar to the liquid metals, in that the RDF does not have
a double peak beyond the first maximum as evidenced by the absence of a
shoulder on the high angle side of the second peak of a(k). At room

-47-
cr O I 00.0 t-.Ma-.,....r::.oc · -c:e ~ 0 ~ <t a::: >~
> ~ (/)
(/) L&.J a:::
0 100 200 300 400 TEMPERATURE ( °K)
Fig. 29 Resistivity ratio p(T)/p(o) for (Pt1
_xNix)75
P25
alloys (Sinha).

- :
-48-
0 0 a:_N
c{:J I / -~I -~ /
I I
2 I ~ / /o 3 I 3 / /~ g/ g / I o
d: I d: / I 000
-1 / / 8 I / I o
I I $ I / I a:: I / / I ,' I
I / I I I
I / I I / I I / I
I / / I / I I / I I / I
I / / I / I
I I I / I
: I I I d ,' i ~ I ,'I ~ I /I : 1 \It ~I
0 l[)
N
0 0 N
0 0
0 l[)
N~------~~--------o~--------~m~--------L-------~0 Q Q o m ~ ~
0 0 0
I-
=:Jx u
X
' C> C> ......
-o CL.
N . v a. ---.. f-
a.
.,.... ..... Vl
Vl Q)
a:: -o Q) u =:J -o Q)
a::
. O'l .,....
LL.

-49-
I I / I I ,' I
OJ I 0 IN / I~ a_- lc:EJ lei! / /cf! ~ I~ I p / / ~ ~~~ · li") / 1/F :::JI:::J I~, .....
uli") I ~ I ~ ,/ I I u<.Oli") "' ,,... ,,... f -o I -o; -o, . -o ~ I ~ ~/ ;/ .fh
I I / 1 I I / / I I / I I / / I I / I I / / I I I / I I I / I I I / I I / I I I / I I I / I
I I / 1
/ I / / I I / I I I / 1
I I /1/ I I / / I/// II // I /I
: /1,' I 'It/ I
· I I
"' .,'I I
0 Lf)
N
0 0 N
w 0:::
o::::> LDf
<! 0::: w Q_
~ w
oro
0 Lf)
L-------~--------~--------~--------~--------~.0 co 1'-- lO 0 0 0
(J) (J)
0 (J) (J) (J)
0 0 0
VI >, 0
So 4-
N . o:;t-..........
a_ -.......... a_
..... > ..... +> VI ..... VI QJ
0:::
-o QJ u ::::::1 -o QJ
0:::
...-("')
. 0') .,... u..

-50-
2.0
~
0 1.0
0
2.0
~
0 1.0
0 2 3 4 56 7 K <A-1)
Fig. 32 a(K) versus temperature and composition for (Pt 1 _xN~) 75P25 alloys. The dashed curve represents higher temperature a(K). (Sinha)

-5.1-
temperature the electrical resistivity p in these alloys lies be
tween 160 and 185 ~ em. On increasing x , no obvious trend in
p at room temperature is seen over the 0.20 < x < 0.60 change in
x , and the spread in the measured resistivity at room temperature
is mostly experimental in origin due to the thickness uncertainty.
On increasing the temperature from 4 to 420°K (T g) the resistivity
of the alloys with X = 0.20 decreases by about 2%; the value of
l.9.e. progressively increases with increasing Ni content, becoming p dT positive at 0.50 < X < 60 . The resistivity ratio p(T}/p(O) is
shown in Fig. 29 for Pt-Ni-P alloys, the value p(O) being obtained
by subtracting the Kondo-like portion of p at low temperatures and
extrapolating to zero. For comparison the uncorrected values of
p{T)/P(4.2) for Pd-Cu-P is shown in Figs. 30 and 31.
Sinha proposed that the electron scattering in the disordered
structures may be treated in a manner analogous to Ziman's theory of
electron transport in liquid metals. The Ziman theory predicts that
negative temperature coefficients of resistivity occur for liquids with
the average valency of z of l < z < 2 as shown in Fig. 32 . Sinha
asserts that the dp/dT of the Pt-Ni-P alloys i s then qualitatively
explained in terms of the temperature and composition dependence of the
x-ray interference function a(k), assuming an average number of 1.3
conduction electrons per atom in these alloys. For the alloy with
x = 0.20 this implies a Fermi energy of 6.9 eV,which for a free elec-
tron model positions 2kF at the first peak of a(k) An increase in
Ni content of the alloy causes a shift in the first peak in the a(k)
toward higher k values. This fact is established from the increase in
-52-
J 3 density f rom 0 . 063 iltoms/A to 0.067 ato111s/A in going f rom x = 0 .20 to
X = 0.50. Thi s sh ift of the a(k) peak has tr.e effect of shifting 2k F
toward a region where a(k) increases with te.-perature as shm-m in Fig .
32 , thus ~* becomes more positive with increasing 'li concentration.
Several objections t o Sinha's interpretat ion may be raised. The
general question of the applicab ili ty of Ziman theory to an amorohous
solid i s worth di scussion. The first peak of a(k) i s presumed in
li quid meta l s to decrease and broaden with inc reasing temperature enough
t o account for t he decrease in p o,.fith temperat ure. Such a ter.perature
dependence of a( k) has been experimentally es tab 1 ished by Halder et
al.(l O) f or liquid Cu-Sn alloys . The value of 2kF falls at the pos i
tion of the peak of a(k) and the observed decrease of 1 8~ of the peak
height over a 360°C temperature increase is enough to exp l ain t he nega
tive dp/dT in these alloys. Wingfi eld and Er.derby(ll) have p=rformed
ne ut ron diffl·action measurements on li qui d zi nc and have observed a
decrease of a(q) with temperature which is too small to explain the
- 130 x l 0-6oK- l temperature coeffi cient of r esisting for liquid zinc.
\·lh ile the alloy (Ni 0 _20Pt 0_80 )0 _75P0_25 has a rate of decrease of
of only -49 x l0- 6°K-l, it i s difficult to envisage structural rear-
rangements of the frozen amorphous sol id being in any w::J.y comparable
in magni t ude to that in liqui d meta l s . More i mpo rtantly, fo r the
Pd-Cu-P, a's of up to - 120 x l0-6°K-l are observed , which must
be expl ained . I t is worth noting that in the Pt -Ni-P and Pd-Cu-P the
resi stivity i s decreas ing al most as r ap idly at 100°K to 150°K as it
i s at the r ange of crystalli zation temperatures of 400°K- 550°K. At
-53-
low temperatures the solid has hardly achieved the full degrees of
freedom of the liquid,and yet the rates of decrease of resistivity
with temperature are as high as the high temperature rates.
Further objections can be traced to the assumption of the
valency of 1.3 conduction electrons per atom for these transition
metal-rich alloys, where normally only 'V0.5 conduction electrons are
expected. To achi eve the 1.3 value of z for the Pt-Ni-P alloys ,
the phosphorus atoms must contribute up to 4 electrons per atom to
the transition metal energy band states. The electronegativity values
of Pd and P do not differ appreciably (Pd 2.2 , and P 2.4}, and yet,
if the z = 1.3 is admitted, a very large charge transfer must occur
in these alloys.
Spin Fluctuation Model for Amorphous Metals
Following the s tudy of (NixPt 100_x) 75P25 alloys by Sinha,
Boucher(l 2) and Maitrepierre(l 3) studied the amorphous alloys
(PdxNi 1_x)l-yPy. In Maitrepierre's work on (Pd100_xNix)80
P20
alloys
(16 ~ x ~ 91} no systematic variation in the temperature coefficient
of resistivity between 40°K and about 550°K was found within the
rather large uncertainty range resulting from the variation in the
average rate of quenching from specimen to specimen. In Fig. 33 is
shown the result of ~~aitrepierre and Boucher's work for alloys of
fixed phosphorus concentration; the data points due to Boucher's work

>~-200 -e >u ~· (/)c:: u;::s.. wa::
100 0
-54-
x•25 -i--..O---~--
x•20-f-§-- f--L -+~---1---i---1-10 20 30 40 50 60 10 80 90 100
Ni/(Ni+Pd) RATIO
Fig. 33a Transition metal conlposilion dependence of p and a for
(Pd10 1
Ni )100
P alloys (Houclwr and Maitn! picrr·c). ( -y y -X X

-55·
30
15 20 25 30 PHOSPHORUS CONTENT X (at 0/o)
Fi 9 · 33b Meta l ! oid composition dependence of p and a for
(Pd 50Ni50 ) l OO-x P x alloys (Boucher) .

-56-
are those with a phosphorus concentration of 25. For the alloys
studied by Maitrepierre, the low temperature(4-20°K) resistivity
behavior shows a Kondo minimum. The resistivity increases with in
creasing temperature at T2 up to about 40°K, after which a T-
dependent increase of resistivity is observed up to T . The average g
temperature coefficient of resistivity of +60 x l0-60 k-l was attri-
buted to the large disorder of the amorphous structure whi ch makes
the contribution of phonon scattering small. The main temperature
dependence of the resistivity was interpreted as being due to the tem
perature dependence of a(k), as discussed by Sinha. To explain the
positive coefficient, an average valence of 0.5 to 1.0 electrons per
atom was assumed by Maitrepierre. Boucher's measurement of the depen
dence of the resistivity behavior with phosphorus concentration is
most interesting. The changes in P concentration have a strong ef
fect on the temperature coefficient of resistivity with a change of
sign from positive to negative at around 24% P, the phosphorus range
In Fig. 33
are plotted the results of Boucher's measurements of the room tempera-
ture values of p and a. This marked sensiti vity of both p and
a to phosphorus concentration is in co ntrast to the insensitivity of
both p and a to changes in Ni concentration with p constant as
found by Maitrepierre. The p(T)/p(293 ) plot for these alloys i~ given
in Fig. 34.
Any interpretation of the Pd-Ni-P data along the lines of
Sinha's structural scattering model must meet the same objections men
tioned previously . Hasegawa(g) has attempted to explain the Pt-Ni-P

-57-
1.01
.... . . . . . . . . 1.001--------.. -.-. . ---:-:~~--------;
x= 23 .. .. · · · · -········ .....
x·= 20 .. ·· · ..
I 00 200 300 400 500
TEMPERATURE (°K) Fig. 34 Reduced Resisti vity p(T)/p(293} f or (Pd
50Ni
50)100
_xPx
Alloys (Boucher) .

-58-
and Pd-Ni-P results in terms of a spin fluctuation model discussed by
Lederer and Mills(l4) and Kaiser and Doniach. (l 5) The basic assump-
tions and results of this theory are discussed in this section along
with their application to palladium-based amorphous alloys.
For a metal-like Pd, if we denote the density of states at the
Fermi level in the d-band by N(O), and the intra-atomic Coulomb inter-
action between two electrons in the same unit cell by V0
, then a
simple Hartree-Fock theory(l 6} indicates that the susceptibility of the
metal is larger than the Pauli free electron susceptibility by the fac--1 tor [1- V
0N(O)] . If V0N(O) > 1 the theory predicts the system is
unstable with respect to the ferromagnetic state. For Pd,
V0
N(O) ~ 0.9 (l7), and because of this the repulsive intra-atomic
Coulomb interactions are so strong that the d-band is near the thresh-
old of instability. The addition of less than 2% Ni into the Pd matrix
leaves the alloy nonmagnetic, while if the Ni concentration exceeds 2%
the Ni sites acquire a moment and the spins order. With only such
small concentration being involved, it is clear that the intra-atomic
Coulomb interaction v1 associated with a Ni cell is very close to the
critical value required for moment formation. If v1 > V0
then one
can expect the region of space in the vicinity of the Ni cell to be
much closer to the magnetic instability than in the Pd matrix. So it
is plausible to expect the low frequency fluctuations in spin density
in the d-band are enhanced considerably in the vicinity of the Ni cell.
The s-electrons, which in Pd carry the major portion of the current,
can scatter from these local spin fluctuations. Since the amplitude of

-59-
the fluctuations varies with the temperature. Thi s can l ead to a
single-impurity contribution to the resistivity which is temperature
dependent.
In dilute alloys like PdNi, AlMn, ill_Cr, PtCr, IrFe and RhFe,
evidence for the occurrence of large amplitude spin fluctuations caus-
ing "anomalous" resistivity behavior has been given. For instance, in
the AlCr and AlMn alloys studied by Caplin and Rizzuto(lB) the low t em
perature resistance goes as p = p0[1- (T/8)2] \'/here e = 530°K and
1200°K for Mn and Cr,respectively. This behavior has been correlated
with the enhanced Pauli susceptibility of these alloys for these nearly
magnetic impurities. A clear prerequisite for large spin fluctuation
contributions to the resistivity to be observed is that either the im
purity is very nearly magnetic as discussed by Friedel(lg) and
Anderson( 20), or that the magnetic impurity enhances the local intra-
atomic Coulomb interaction betv1een two e lectrons of a nearly ferromag
netic matrix like Pd.
Hasegawa has fitted the Pt-Ni-P and Pd-Ni-P re sist ivity results
to a temperature dependence of:
Pphonon = A + BT2 for low T
= C + DT for high T
Pspin = E - FT2 for low T fluctuations
= G- HT for high T
where all coefficients are p.ositive. The calcul ations of Kaiser and . ( 15) .
Don1ach show that a un1versal curve for the spin fluctuation exhibits

-60-
resistivity in which the temperature dependence changes from T2
to T at temperatures of the order of 0.25 of the characteristic
Ts , where K8Ts is the energy of the peak of the localized spin
fluctuation excitation spectrum. In the presence of resonance scat
tering,the effects of spin fluctuations is to force the scattering
off resonance, and negative coefficients can occur. Hasegawa obtains
for Pt-Ni-P, Ts = 120°K, and for Pd-Ni-P, Ts = 450°K, which agree some
what with the observed results.
It is, however, very difficult to envisage that the spin fluc
tuation model holds true at all in the Pd-Cu-P alloys, and even its
application to Pd-Ni-P and Pt-Ni-P alloys leaves unexplained certain
experimental facts. The Pd-Ni-P and Pt-Ni-P alloys are weakly magnet
ic, X= l0-7emu/g, and show no enhanced exchange susceptibility. The
resistivity and the negative temperature coefficients of resistivity
in these alloys are insensitive to the changes in Ni concentration.
Only in dilute alloys have large spi n fluctuation effects been ob
served. In fact for PdNi alloys the addition of more Ni (above 2%)
has the effect of limiting the range of temperature over which the
spin fluctuation component is dominant over the phonon scattering (T5).
For the Pd-Cu-P alloys the use of the spin fluctuation model
meets an obvious difficulty: Cu cannot serve to enhance the local
intra-atomic Coulomb interaction as Ni is presumed to do for Pd-Ni-P
and Pt-~i-P alloys. The non-magnetic nature of Cu certainly precludes
this from happening. The experimental results on Pd-Cu-P indicate:
the temperature coefficient of resistivity and the resistivity are
quite sensitive to variations of Cu concentration; the temperature

-61-
coefficients of resistivity are all negative for alloys with x > 15
and the temperature dependence of resistivity is quite similar in
shape to the Pd-Ni-P and Pt-Ni-P alloys. These results are certainly
difficult to explain using the spin fluctuation model.
It is worth noting that scattering off giant polarization
clouds in crystalline Ni 35cu6J alloys has been proposed by Houghton
et al. (2l) to explain the anomalous resistivity behavior of this al
loy. Ahmad and Greig( 22 ) have sho~n that an alloy of Pd60
Ag40
,
which is certainly not even almost magnetic,has similar behavior.
This situation is quite similar to that described here between the
measured Pd-Cu-P data results and their similarity to the Pd-Ni-P
and Pt-Ni-P data which are explained by a similar spin-fluctuation
model also.
The comparison we have made of the Pd-Cu-P data with the sys
tems Pt-Ni-P and Pd-Ni-P point out the relevance of this work to
past studies of amorphous materials. Both the structural scattering
model proposed by Sinha and the spin-fluctuation model proposed by
Hasegawa have inherent difficulties when applied to the resistivity
behavior of the amorphous alloys Pt-Ni-P, Pd-Ni-P and Pd-Cu-P and
yet, in a general sense, the temperature dependence of the electrical
is quite similar. This commonality of behavior of these amorphous
materials will be shown to be shared with numerous crystalline tran-
sition metal alloys in the following section. Recognition of this
fact leads quite naturally to an explanation of the electrical prop
erties of these materials.

-62-
Comparison with Crystalline Transition Metal Alloys
Metallic systems with high resistivity due to strong s-d scat
tering and low temperature coefficients of resistivity are of
interest in the production of high-quality resistors. Perhaps best
known for these applications are the Ni Cr1 alloys, for which the X -X
temperature coefficient of resistivity is far below that expected
(for pure Ni a is 7 x 10⁻³oK-l). In the concentration range
20 < x < 80, p is about llO~n em and a i s around 100 x l0-6oK-l,
with thi s low a persisting down to low temperatures (4°K). In thin
films of NiCr, three different crystal structures have been observed:
up to x =50 the fcc structure is found, between x = 25 and
x = 50 an unidentified phase is found, and for x < 25
the bee structure is found. Despite these variations in structure, no
influence of the phase changes on the measured resistivity is observ
able, and a remains at 100 x 10-6oK-l for 60 < x < 80. Several other
material s with high p and low a are known such as CuNi , FeCrAl and
TaN, all having properties res ernb 1 i n g NiCr. Mooi / 23 ) has surveyed
the literature and listed the systems for which a < 100 X 10-6 oK-l is
found for s orne composition range. In a 11 the a 11 oys 1 is ted the weak
temperature dependence of the resistivity persists to low temperature,
with exceptions for those systems with order-disorder transitions
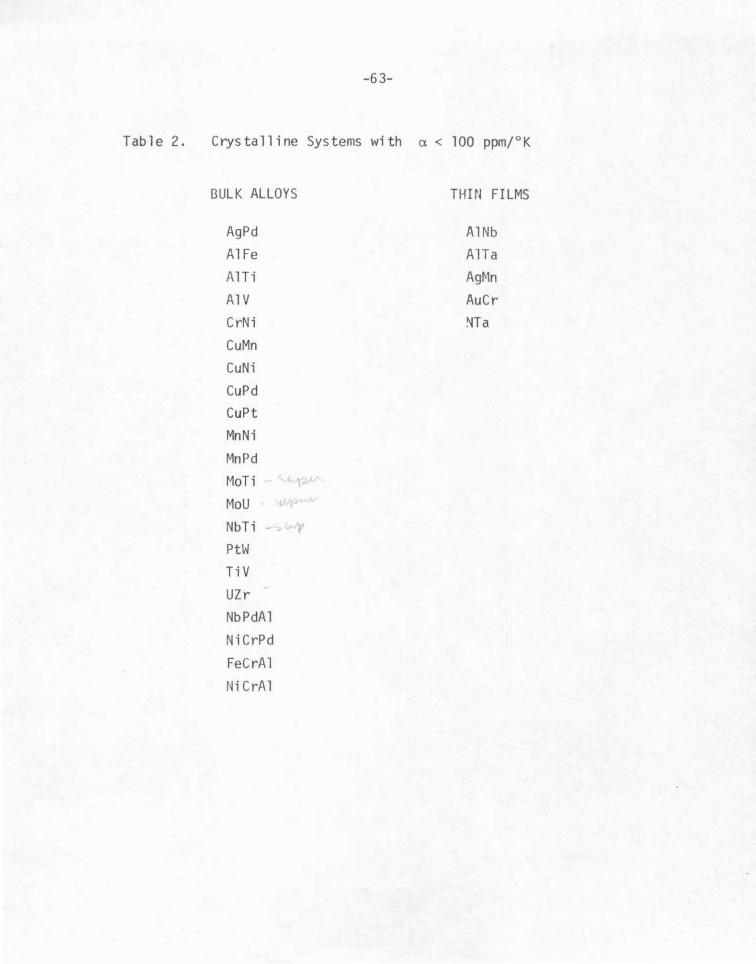
occurring. In Table 2 are li s ted the many systems which have
a< 100 x lo-6oK-l in either bulk or thin film form. In all cases the
low a is found in concentrated alloys; usually at least 20% admixture
is required. Ternary systems have also been studied and, in general,
-63-
Table 2. Crystalline Systems with a< 100 ppm/°K
UULK ALLOYS
AgPd
AlFe
AlTi
AlV
CrNi
CuMn
CuNi
CuPd
CuPt
MnNi
MnPd
MoTi (,.r. MoU v, NbTi ~
Pt\~
TiV
UZr
NbPdAl
Ni CrPd
FeCrAl
NiCrAl
THIN FILMS
AlNb
AlTa
Ag~~n
AuCr
NT a

-64-
the addition of a third element to a binary alloy with low a has
not been found to cause the disappearance of the low a . The addi
tion of a third element to a sys tern with high a causes p to in
crease or be constant, while a may decrease markedly. In the FeCr
system , the addition of 10% Al increases p (from 50~n em to l25~n
em) and lowers a from 1000 x 10-6oK-l to 100 x l0-6oK-1. Mooij also
points out that negative a's occur in a number of alloys. For some,
like CuNi alloys,above the Curie point,and Ni 80cr20 around 600°C
where short range orderings occur, negative a ' s occur over a.re-
stricted temperature range. For many systems a negative temperature
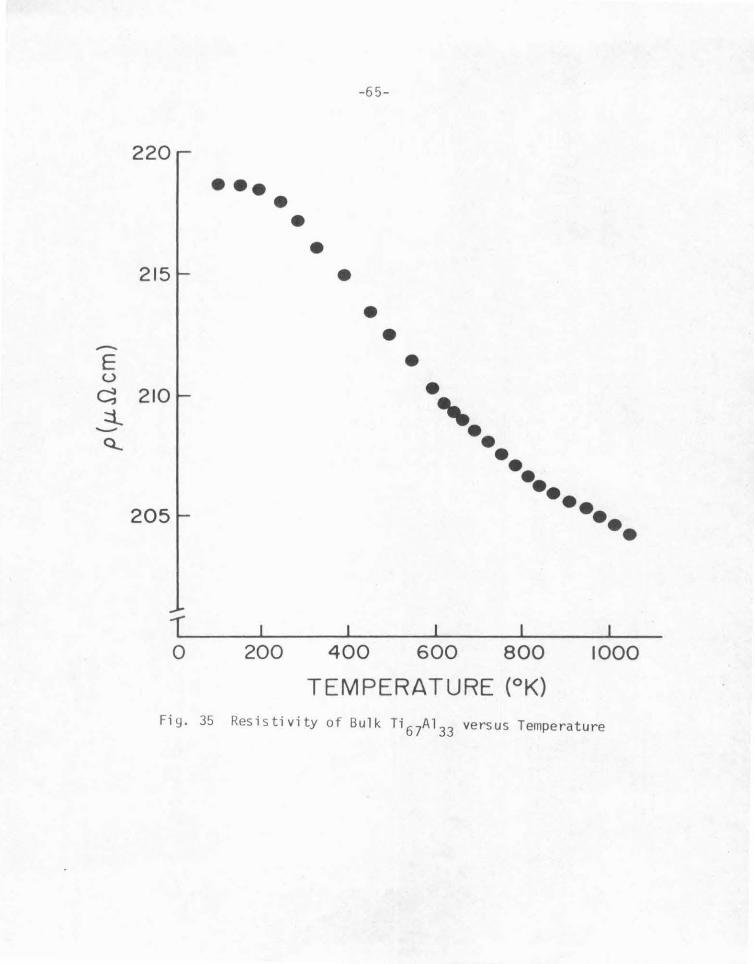
dependence of resistance is found over a wide temperature range. In
Fig. 35 is plotted the resistivity versus temperature for bulk Ti 67Al 33 for which negative temperature coefficients of resistivity occur for
. ( 24) the 80°K to ll00°K range. Similar results are found for T1 80v20 •
u30
zr70
(2S), VA1( 26 ) in bulk alloys, and for TaAl(27 ), TaN(2B), and
NiCrAl(24) in thin film.
Most s urprising is the existence of a correlation between a
and p (which we refer to as the Mooij correlation). In Fig. 36 are
plotted the measured temperature coefficients of resistivity for bulk
alloys and thin film alloys. It is clear that no negative a is ob
served for res istivities below lOO~n em, whil e above 150~n em hardly
any positive a is found.
Any explanation of this behavior based on the structural de
pendence of the d -band structure i s certainly ruled out due to the
varieties of structures involved in the Mooij correlation. The
-E u q ::i_ --Q_
220
215
210
205
1 0
-65-
••• • • •
• • • •
• '· • •• •• ••
I I I
200 400 600 800
TEMPERATURE (°K)
•• ••
1000
Fiy. 35 Resistivity of Bulk Ti 67A133 versus Temperature

J.H
. M oo
ij -1
973
• •
Bul
k A
lloys
2
oo
r-•
+T
hin
Film
s
• +
+
+
•
+ l.
•• -
100
• -
• ':::
t:: •
0 .. ..
, <D
'o
+
,.,
-0
I
-••
0'
1 0'
1 I C
j I
. ~ ·~
.. •
•i. •
,. .,
• ...
. •
-100
I-• •
•••• -+
(-..
• r
•Y •
• •
• •
• I
• •
• I
I I
I I
I I
-20
0 0
100
20
0
30
0
p(f
kilc
m)
Fig
. 36
T
empe
ratu
re C
oef
fici
ent
of
Res
isti
vit
y v
ersu
s R
esis
tiv
ity
for
Bul
k A
lloy
s an
d T
hin
Film
s (M
ooij
).

-67-
occurrence of negative temperature coefficients of resistivity is a
consequence of the same causes which yield low values of a . The
mean free path for these resistivity levels is small, and for NiCr
alloys has been calculated to be approximately 4~ or slightly larger
than the interatomic distance. (2g) Certainly for these small values of
the mean free path, differences of structural properties have a mini-
mal effect on the temperature dependence of the resistivity.
In Fig . 37 the a versus p plot for amorphous Pd-Ni-P, Pt-Ni-P
and Pd-Cu-P alloys is shown. A comparison of these results with the
Mooij correlation shown in Fig. 36 reveals a remarkable conformity of
the data for amorphous alloys with those for the numerous crystalline
transition metal alloys surveyed by ~1ooij. Thus the "anomalous" be-
havior of p(T) in these amorphous alloys is not due to the unique
amorphous nature, as the explanation of Sinha suggests, and not due to
their magnetic properties as the spin fluctuation model of Hasegawa
suggests. The variety of structural and magnetic properties involved
in the Mooij correlation of numerous alloys establishes this fact.
The observation of negative temperature coefficients of resis
tivity over large temperature ranges indicates that in these very
strong scattering cases the role of lattice vibrations is actually to
assist the conduction of electrons. Chen et al. (30) and very recently
Brouers and Brauwers ( 31) have shown that the effect of phonons in
modifying the d-density of states at the Fermi level through the elec-
tron-phonon interaction is significant and can cause the resistivity
to decrease with temperature due to the blurring of the density of

+2
00
•
{Pds
oNis
o)lo
o-vP
v r-
o ( P
d 10
0-x
Cux
)aoP
2o
z :-
o { P
dss
Cu3
5) 1
00-v
Py
W'
-:::s
::: * (N
i4sP
tss)
75P
2s
u 0
Y=
l5•
-w
+1
00
x { N
i2oP
tao)
75P
2s
LL
, L
LQ
•
oX
= 1
0 w
- -R
ES
ISTI
VIT
Y {f
.L.D
,cm
) 0 U
>-
I r-
"' 0
o:>
w-
30
0
I
0:::
>
100
:JI-
r-(f
) <t
- (f
) 0:
:: w
-1
00
wo:
:: Q
.. ~LL
wo
~
-20
0
Fig
. 37
Te
mpe
ratu
re C
oeff
icie
nts
of
Resi
stiv
ity
of
Am
orph
ous
Pd-N
i-P,
Pt
-Ni-
P an
d Pd
-Cu-
P A
lloys

-69-
states with temperature. Details of these calculations will be
given in a later section. It suffices to say that the comparison
of the experimental results with crystalline systems leads to a
natural re-interpretation of the "anomalous" resistivity behavior
in the amorphous systems which emphasizes the commonality of this
behavior of p(T) with disordered crystalline transition metal al
loys.

-70-
An Alternate Explanation of the Resistivity Behavior
An alternate explanation of the resistivity behavior of the
amorphous alloy Pd-Cu-P, Pd-Ni-P and Pt-Ni-P is given along the follow-
ing lines. First the order of magnitude of the resistivity for these
alloys is explained using the Evans, Greenwood and Lloyd(EGL)fonnalism
for the resistivity in liquid transition metal alloys. Second, the concen
tration dependence of p is discussed in the context of the EGL formal-
ism to point out how the interplay of structural scattering and
resonance scattering 1 eads to the observed concentration dependencies
in amorphous alloys. Lastly, the negative temperature coefficients of
resistivity is explained along the lines of the modification of density
of states at EF through the thermal blurring of the d-state energies by
the electron-phonon interaction.
The Magnitude of the Observed Resistivities
From the experimentally determined resistivities of the
(Pd100 _xcux) 80P20 and (Pd100 _xNix) 80P20 alloys, an extrapolated value
of p for an amorphous Pd80
P20 alloy of == 130 J.ln is obtained. For
(Pt100_xNix) 75P25 the resistivity for a Pt75P25 alloy is == 175 lln em. It
is of interest to ascertain whether a level of resistivity of
::: 150 J.Jr2 em can be calculated from first principles using the theoreti
cally derived formulas for the resistivity of liquid transition metals
obtained by EGL. (32 )

-71-
EGL extended Ziman's formula using physical arguments by replac
ing the pseudopotential by the t matrix of the muffin tin potential for
one ion. An exact expression for the resistivity in terms of the phase
shifts and the ion positions in agreement with Ziman's formula is de-
rived:
where n0
is the atomic volume, VF is the Fermi velocity, and t(k)
is the si ngl e site t-matrix which is defined in the partial wave repre-
sentati on as
where m is the electron mass, EF is the Fermi energy (measured rela
tive to the muffin tin zero), and the sum is over all the various partial
waves contributing to the scattering. P~(cos e) is the Legendre poly
nomial of order ~ and the n~ are the partial wave phase shifts des
scribing the scattering of the conduction electrons by the ion cores. If
the n2
phase shift is dominant, as it is expected to be in transition
metals, the electrical resistivity can be written in the following ways:
p =
or

3
a (K) 2
Z•l/2 I 2
I I
/T2>T,
I
I\ I ' I
- 72-
K
lrr----------------------------
;1 7}2
7r/2
Mn FeNi Cu I I I I
I
E
Fig. 38 Schematic diagram of the parameters a(K) and Tlz involved in
determining the e lectrical resistivity in liquid transition metals.
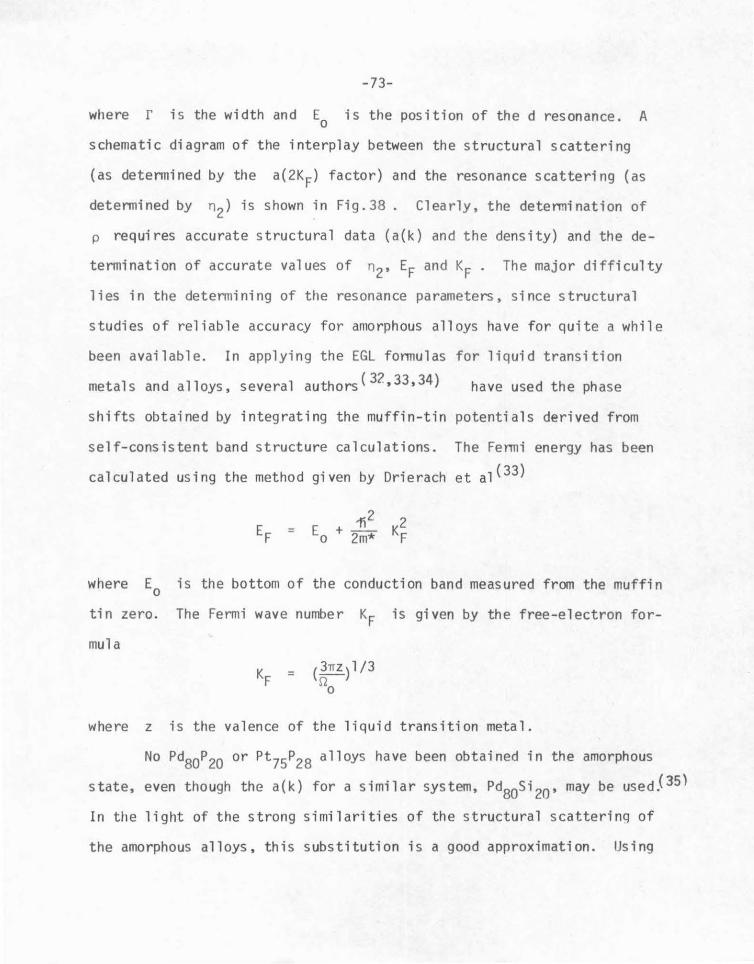
-73-
where r is the width and E0
is the position of the d resonance. A
schematic diagram of the interplay between the structural scattering
(as determined by the a(2KF) factor) and the resonance scattering (as
determined by n2) is shown in Fig.38. Clearly, the determination of
p requires accurate structural data (a(k) and the density) and the de
termination of accurate values of n2• EF and KF . The major difficulty
lies in the determining of the resonance parameters, since structural
studies of reliable accuracy for amorphous alloys have for quite a while
been available. In applying the EGL formulas for liquid transition
metals and alloys, several authors( 32 •33 •34) have used the phase
shifts obtained by integrating the muffin-tin potentials derived from
self-consistent band structure calculations. The Fermi energy has been
calculated using the method given by Drierach et al(JJ)
where E0
is the bottom of the conduction band measured from the muffin
tin zero. The Fermi wave number KF is given by the free-electron for
mula
where z is the valence of the liquid transition metal.
No Pd80P20 or Pt75P28 alloys have been obtained in the amorphous
state, even though the a(k) for a similar system, Pd80si 20 , may be usedJ35)
In the light of the strong similarities of the structural scattering of
the amorphous alloys, this substitution is a good approximation. Using

-74-
the structural data a(k) and the density, a resistivity of 150llncm
for a Pd80P20 alloy with EF = 7.5 eV and z = 0.50 is found to cor
respond to n2 = 3.02. These values are shown in Table 3, where other
calculation results based on this n2 value are also shown. The choice
of z = 0.50 used here is consistent with the assumption of z = 0.36
for Pd (the crystalline Pd value) and z = 1.00 for the glass former.
This is felt to be more suitable a value of z than the value of
z = 1.3 which is necessitated in Sinha's explanation of the high resis
tivity in these alloys as being due to the strong structural scattering
(a(2KF) = 2.2). This large value of z requires that the glass former
atoms exist in the amorphous alloys in highly ionized states, a require
ment that makes the formation of a strong metal-metalloid bond and the
stabilization of the amorphous phase highly unlikely. The calculated
phase shift n2 = 3.02 can be compared with the values obtained by dif
ferent authors for Pd metal: 3.06 from Kaga( 3G) and 2.80 from Evans et
al. (37) Very recently GUntherodt and Ohtani( 3S) have measured the resistiv
ity of liquid Pd and obtained p = 80 lln em. Using n2 = 3.02 and the
recent results of Waseda et al. (39 ) on the structure factor a(K) for
z = 0.36, one obtains p = 95 lln em, which is in reasonable agreement
with the measured results. This agreement of n2 with the calculated
values of n2 taken from muffin tin potentials used in actual band
structure calculations on pure Pd metal should be understood as an
indication that the EGL formalism for p gives reasonable phase shifts,
an agreement which demonstrates the consistency of this approach when
applied to calculatinq p for these amorphous alloys.

-75-
Table 3. THE CALCULATED RESISTIVITY FOR AN AMORPHOUS Pd80
P20
ALLOY
z
0.36
0.50
0.75
1.00
.898
1.002
1.147
1. 263
0.125
0.193
0.386
1. 000
3.02
3.02
3.02
3.02
7.5
7.5
7.5
7.5
P(;-< .(2 c.n. )
116
150
220
470

-76-
It is interesting to note that if th is value of n2 = 3.02 is
used to calculate the number of filled d-states below the energy EF, us
; ng the formula z d = 6o;rr } 2, one obtains z,( 9. 6. Furthermore, accord
ing to Klein and Heeger,( 40 )the effective density of states at EF can
be obtained from the following formula:
. 2 20 s1n n2 = -rr r
For Pd the value r = 0.17 eV is obtained by Kaga,(36) and this yields an
effective density of states at the Fermi level of 0.55/eV-atom. This
value of zd is close to the 0.36 holes in the crystalline Pd d-band,
while the density of states at EF is significantly lower than the crys
talline Pd value of 2.2 ev-1. ( 4l} This reduction of the effective den-
sity of states is in agreement with the present understanding of the
band structure of fcc metals like Pd and Pt. In these metals the high
density of states at EF is due to a saddle point in the d-like part of
the 5th band slightly below EF,( 42 ) a property which is certainly not
expected in the amorphous alloys. This reduced density of states is
also consistent with the low value of the Pauli paramagnetism observed
in the Pd-Cu-P, Pd-Ni-P and Pt-Ni-P alloys.
Concentration Dependence of p
The experimental results which must be explained are: the sensi
tivity of p in the (Pd100_xcux) 80P20 alloys, where a near doubling of
p is observed for increasing x with 10 ~ x ~50; the insensitivity
of p to changes in Ni concentration for both the (Pd100_xNix)80
P20
alloys, 10 ~ x ~ 90, and the (Pt 100_xNix) 75P25 alloys with 20 ~ x ~50;
and the s imilar increase of p with phosphorus concentration in the
(Pd65cu35)100_YPY, 15 ~ y ~ 24 and the (Pd50N; 50 )100_YPY, 15 ~ y ~ 27.5
a 11 oys.

-77-
A proper explanation of the concentration dependence of p in
these alloys necessitates a detailed understanding of the variation of the
a(2KF) factor with concentration as well as the effects of concentration
on the resonance parameters E0
, r and EF . While the former can be
given reasonable treatment, the latter requires considerable insight
i-nto the complexities of the formation of the transition metal-metalloid
bonds. The concentration dependence of the Pd muffin-tin potential, the
variation of the relative position of the d-band of states and the s-p
conduction band are among other difficult problems. It is, however,
possible to show, based on the assumption that the transition metal
glass former interactions fix the value of the ~ = 2 phase shift n2 ,
that the variation of the a(2KF) factor with concentration can explain
the resistivity behavior of the (Pd100_xcux) 80P20 , (Pd100_xNix) 80P20 and (Pt100_xNix) 75P25 alloys.
The results of the calculation of p for varying z with
n2 = 3.02 are shown in Table 3. It is of interest to note that the
variation of the Cu concentration x over 10 ~ x ..:5.. 50 in the
(Pd100_xcux) 80P20 alloys corresponds to variations of 0.54 < z ~ 0.74,
assuming zPd = 0.36, zcu = 1.00, Zp = 1.00. The increase of the calcu
lated resistivity from 144llrl em to 220uQcm for z = 0.50 and z = 0.75
respectively is directly traceable to the doubling of the a{2KF) factor
(0.193 to 0.386). This behavior for the (Pd100_xcux) 80P20 alloys is in
contrast to the· (Pd100_xNix) 80P20 and (Pt100_xNix) 75P25 alloys, where
there is little change in z due to the similarity of the z values for
Pd, Ni and Pt (0.36, 0.46, 0.40, respectively). Thus the difference in
the concentration dependence of the Pd-Cu-P al l oys to changes in metal

-78-
concentration is due to the change in structural scattering through the
increase of a(2KF) as KF is increased toward the first peak in the a(K)
function. The increase of p with phosphorus concentration in these
alloys seems to indicate a marked sensitivity of the resonance param
eters to the glass former concentration . This is due to the hybrid
ization of the transition metal d states to form strong bonds with
the glass former atoms. It is conceivable that the increase in the
resistivity is then due to increase in the density of states at EF
· · t 1 d t t t· ht b t Ehdyb, the energy of as the trans1t1on me a s a es 1g en a ou
the hybridized sta tes, with increasing phosphorus concentration.
Temperature Dependence of p
Perhaps the most interesting aspect of this study is the obser-
vation that the negative temperature coefficients of resistivity in
the amorphous Pd-Cu-P, Pd-Ni-P and Pt-Ni-P alloys is in accordance
with the Mooij correlation found for concentrated substitutionally
disordered transition metal alloys as s hown in Figs. 36 and 37.
Metallic systems that exhibit a high resistivity and temperature inde
pendent resistivity are of great interest for producing high-quali.ty
resistors. The alloys NiCr, CuNi, FeCrAl and AgPd are examples of
alloys for which low temperature coefficients of resistivity
(a < 100 x 10-GoK-l) are observed for the concentrated alloys. Of
note is the fact that the low a's are not observed in the pure metals
but rather only in the concentrated alloys. Negative a's are observed
in many alloys; in some cases over only temperature restricted ranges
close to some magnetic or structural transition (like CuNi just above
the ferromagnetic Curie point), in others (like TiV) the decrease of p
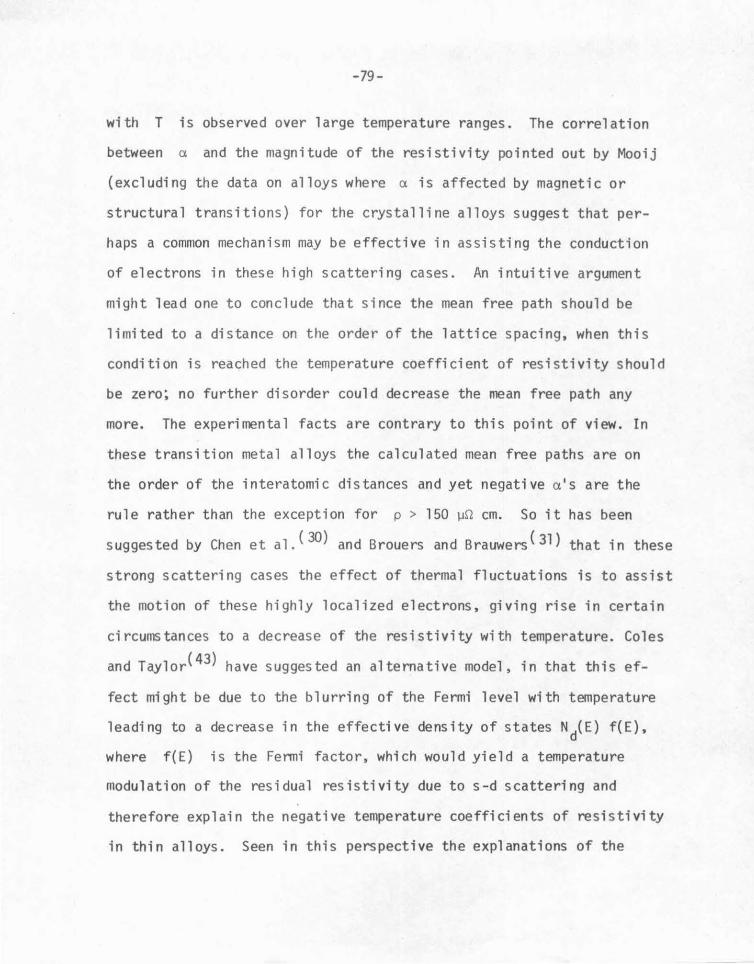
-79-
with T is observed over large temperature ranges. The correlation
between a and the magnitude of the resistivity pointed out by Mooij
(excluding the data on alloys where a is affected by magnetic or
structural transitions) for the crystalline alloys suggest that per-
haps a common mechanism may be effective in assisting the conduction
of electrons in these high scattering cases. An intuitive argument
might lead one to conclude that since the mean free path should be
limited to a distance on the order of the lattice spacing, when this
condition is reached the temperature coefficient of resistivity should
be zero; no further disorder could decrease the mean free path any
more. The experimental facts are contrary to this point of view. In
these transition metal alloys the calculated mean free paths are on
the order of the interatomic distances and yet negative a's are the
rule rather than the exception for p > 150 ~n em. So it has been
suggested by Chen et al. (30) and Brouers and Brauwers(31) that in these
strong scattering cases the effect of thermal fluctuations is to assist
the motion of these highly localized electrons, giving rise in certain
circumstances to a decrease of the resistivity with temperature. Coles
and Taylor< 43) have suggested an alternative model, in that this ef
fect might be due to the blurring of the Fermi level with temperature
leading to a decrease in the effective density of states Nd(E) f(E),
where f(E) is the Fermi factor, which would yield a temperature
modulation of the residual resistivity due to s-d scattering and
therefore explain the negative temperature coefficients of resistivity
in thin alloys. Seen in this perspective the explanations of the

en w a::
-80-
-0.2 0 0.2 ENERGY/HALF s-BANDWIDTH
0.20,...-----------
.... ,, --------------~~
,,'' --~ ,
r•7 ----------------------0 0.0005 0.001 0.0015 /3
Fig. 39 Phonon induced modification of the density of states and the electrical resistivity. The dashed curve is for EF fixed; dotted curve for EF shifted to preserve occupancy; and
solid curve for the total resistivity.

-81-
negative temperature coefficients of resistivity concentrate sepa-
rate ly on the different factors in the effective density of states
Nd(E) f(E). Chen et al. (30) and Brouers and Brauwers(31) show that
the electron-phonon interaction can cause blurring of Nd(E) with
temperature which is indeed significant; Coles and Taylor< 43 ) among
others< 45) state that the blurring of the Fermi level with tempera-
ture accounts for the negative temperature coefficients.
While it is certainly true that the latter mechanism does
hold, it is however difficult to conceive that such a mechanism should
be effective in such a generally occurring phenomenon, since it is
based on the fact that the density of states must vary considerably
fast with respect to kT in each circumstance. On the contrary, the
highly disordered nature of these alloys (structurally disordered too,
since the amorphous alloys are in conformity with Mooij's correlation)
suggest that the grosser effect--phonon modification of the density of
states--is more effective in determining the temperature dependence of
the resistivity.
The results of Brouers and Brauwers •( 31 >very recent calculations
on the temperature dependence of the resistivity in concentrated dis
ordered transition binary alloys are shown in Fig. 39. In
the particular example shown the t 2g sub-band of a bee alloy of 50-50
composition is simulated using the parameters shown. The combined
effects on the resistivity of the blurring of the density of states by
the electron-phonon interaction and the subsequent shift of EF as a
result of this blurring are clearly shown in Fig. 39. A direct com
parison of these results with an experimental study requires

-82-
considerable information about the nature of the d states, the d-d
interactions which are neglected here, and the s-d hybridization
parameters. These results must then be understood as indications
that such a general mechanism as the blurring of the density of
states by electron-phonon interactions can be significant and may
account for the Mooij correlation more satisfactorily than the
simple blurring of EF as proposed by Coles and Taylor and others. (44)
Considering the amorphous alloys in particular, it has been
shown that the level of the resistivity can be explained by consider
ing the interplay of structural scattering and resonance scattering
according to the EGL formulation. The role of the glass former in
determining the resonance scattering factor has been recognized as
being quite significant due to the strong transition metal-glass
former interactions which stabilize the amorphous structure. In
these amorphous structures the glass former atoms are surrounded by
metal atoms with no glass former nearest neighbors. The environment
about a glass former atom may be thought of as being similar to a
tetrakaidecahedron formed of a triangular prism with six metal atoms
at the corners and three metal atoms situated above the rectangular
faces of the prism in half-octahedral positions. The modification of
this environmental arrangement by phonons which may compress or ex
pand the metal-glass former distance must be given special theoreti
cal emphasis to determine the effects of temperature on the resonance
characteristics, and therefore the electrical resisti vity.
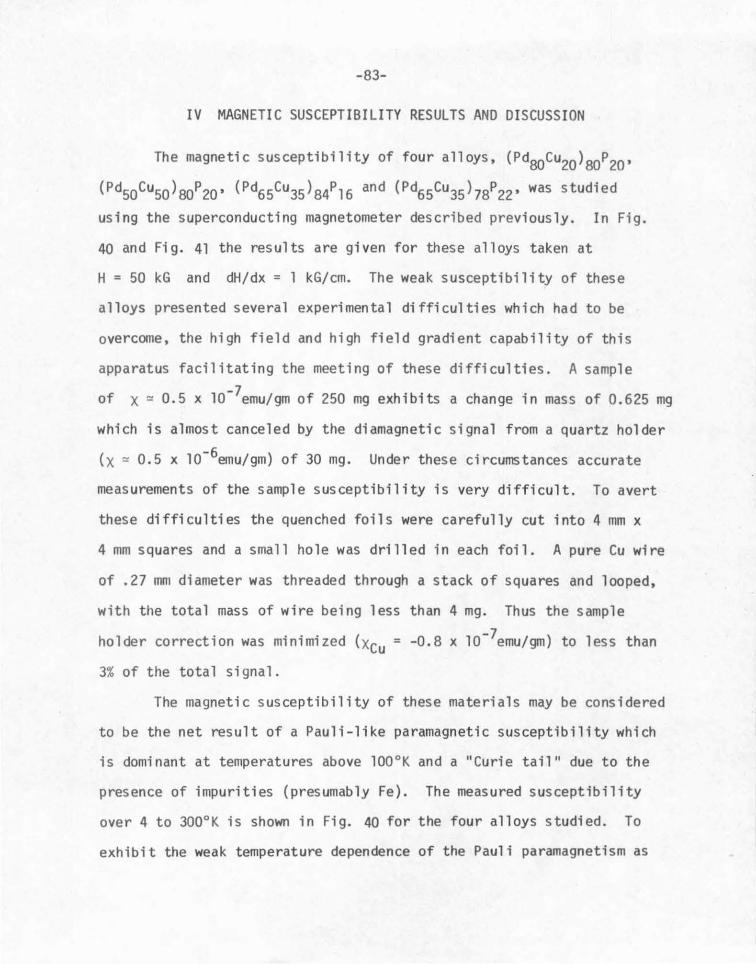
-83-
IV MAGNETIC SUSCEPTIBILITY RESULTS AND DISCUSSION
The magnetic susceptibility of four alloys, (Pd80cu20 }80P20 ,
{Pd50cu50 }80P20 , (Pd65cu35 )84P16 and (Pd65cu35 )78P22 • was studied
using the superconducting magnetometer described previously. In Fig.
40 and Fig. 41 the results are given for these alloys taken at
H = 50 kG and dH/dx = 1 kG/em. The weak susceptibility of these
alloys presented several experimental difficulties which had to be
overcome, the high field and high field gradient capability of this
apparatus facilitating the meeting of these difficulties. A sample
of x = 0.5 x l0-7emu/gm of 250 mg exhibits a change in mass of 0.625 mg
which is almost canceled by the diamagnetic signal from a quartz holder
(x = 0.5 x l0-6emu/gm) of 30 mg. Under these circumstances accurate
measurements of the sample susceptibility is very difficult. To avert
these difficulties the quenched foils were carefully cut into 4 mm x
4 mm squares and a small hole was drilled in each foil. A pure Cu wire
of .27 mm diameter was threaded through a stack of squares and looped,
with the total mass of wire being less than 4 mg. Thus the sample
holder correction was minimized (xcu = -0.8 x l0-7emu/gm) to less than
3% of the total signal .
The magnetic susceptibility of these materials may be considered
to be the net result of a Pauli-like paramagnetic susceptibility which
is dominant at temperatures above l00°K and a "Curie tail" due to the
presence of impurities (presumably Fe). The measured susceptibility
over 4 to 300°K is shown in Fig. 40 for the four alloys studied. To
exhibit the weak temperature dependence of the Pauli paramagnetism as

-84-
measured, the susceptibility is plotted on an expanded scale in Fig.
41 . From the low temperature portion of x(T) a concentration of
70 to 100 ppm Fe was deduced (using g = 2 and s = 5/2) .
The level of the observed susceptibil i ty of these alloys can be
contrasted with the strong paramagnetism of crystalline Pd (x =
5.3 x l0-6emu/gm) . To discuss this difference correctly, it is im
portant to review the reasons for the large susceptibility of Pd. If
the measured static susceptibility of Pd is compared with the value
computed from the band structure density of states, according to
X = 2~~ N(E)E=E F
with N(EF) = 1.99/eV·atom, the calculated value of x is found to be
0.6 x l0-6emu/gm, which is considerably smaller than the measured sus
ceptibility. It is believed that short-range, intra-atomic Coulomb
interactions between the d electrons strongly enhance the suscepti
bility of Pd. Denoting the intra-atomic Coulomb interaction between
two electrons in the s ame unit cell by U0
, the enhancement factor is
If U0
Nd(EF) > 1 , the system i s unstable with respect to the ferro
magnetic state. If Nd(E) is deduced from the specific heat data where
the mass-renormalization effects are included, U0Nd(EF) is found to be
~ 0. 9 for Pd. This situation is further complicated by the observa
tion of Shimizu et al _( 45) who showed that there exists in Ni, Pd and Pt
additional paramagnetic components due to orbital paramagnetism and the
spin-orbit paramagnetism which make significant contributions to the

-85-
1.0
o.e
E C' 0.6 X ( Pd50 C~Jso )80 P20
' ::3 E
o ( Pd6~ Cu3~ )78 P22 Q)
U) 6 ( Pdee Cu3e>84 P16
'o 0.4 • ( Pdeo ClJ2o)80 P20
X
0.2
Fig. 40 Measured Magnetic Susceptibility of Pd-Cu-P Alloys

-E CJI
' :;::) E Cl)
t'j 0
2.0
1.0
0 0 \00
-86-
x ( Pd~0 Cu~0)80 P20
o ( Pd~ Cu3~l78 P22
A ( Pd6~ Cu35le4 p 16
• ( Pdeo Cu20l80 P2o
200 300
Fig. 41 Measured Magnetic Susceptibility of Pd-Cu-P Alloys on
Expanded Sea 1 e

-87-
total susceptibility. Mori(46 ) has calculated the total susceptibil
ity of these elements and shows in the case of Pd that the spin suscep
tibility and the orbital susceptibility are approximately equal, and
the spin-orbit susceptibility makes up 20% of the total susceptibility.
It is important to note that the amorphous alloys Pd-Ni-P and
Pt-Ni-P have magnetic susceptibilities estimated to be in the 10-7-lo-8
emu/gm range, (8 ,13) so it is not simply the addition of the noble metal
Cu to the Pd matrix in Pd-Cu-P alloys which causes the reduced suscep
tibility. Perhaps the most relevant works on crystalline transition
metal phosphides are those of Gambino et al. (47) and Albert et al. (48)
on the Ni-P system. Gambino et al. studied the compound Ni 3P and -6 found a Pauli-type paramagnetism with X= 8 x 10 emu/gm. Albert et al.
have investigated the disappearance of ferromagnetism in Ni-P
alloys in the 0 to 14 atomic % range and concluded that the electron
transfer model s ufficiently explains the disappearance of ferromagnet
ISm \-l ith the ass umption of 0 . 5 holes in the Ni d-band and an effective
transfer of up to 5 phosphorus valence electrons to the Ni d-band.
Maitrepierre(lJ) has used this electron transfer model to explain the
low value of the Pauli-type paramagnetism in amorphous Pd-Ni-P; here
again two or more electrons must be trans ferred to the Pd d-states .
Clearly the validity of the use of electron transfer model for
this circumstance res t s on whether it is indeed true that no major
change in the band structure occurs upon alloying with the glass
former and the retention of a local ordering considerably different
from the fcc environment of the pure transition element for both

-88-
situations of the Ni 3P crystalline compound and the amorphous Pd-Cu-P
Pd-Ni-P and Pt-Ni-P alloys . Furthermore, the large transfer of elec
trons from phosphorus to the transition metal d-states necessitates
that the crystalline Ni 3P structure and the amorphous structure are
stabilized by having the glass former atoms in highly ionized states .
There are at present numerous indications that the rigid band model
of the density of states is not valid from photo-emission studies on
transition metal-nonmetal systems,(49) magnetic studies on amorphous
transition metal-noble metal systems,(SO) as well as theoreti cal
studies on the band structure of these systems( 51 •52). With respect
to the large electron transfer from phosphorus to the transition metal,
the electronegativities of Ni, Pd, and Pt are 1.8, 2.2, and 2.2, res-
pectively, while that of P is 2. 1. For transition metal-metalloid
alloys when the metalloids are boron, carbon or nitrogen and the
ratio of the radius of the metalloid to the transition metal is less
than about 0.6, interstitial structures occur in which the metal atoms
form a close-packed cubic or hexagonal array. When it is greater
(when Si or P are the metalloids, for instance) much more complex
structures occur in which there is evidence of directed chemical
bonds. (SJ) Thi s rule i s probably due to the fact that when the metal-
loids are small enough the transition metal band structure still
obtains, but when they are larger so that the transition metals are
too far separated, it breaks down and structures with directed bonds
from the metalloids occur. The metal-metal distances for the Pd3P
and Ni 3P compounds are in excess of the fcc metal-metal distance

-89-
by 7% and 17% respectively, and for the "amorphous" Pd4P and Nil
alloys(l3) these are in excess by 9% and 14% respectively. These
indications make the use of the electron transfer model for explain
ing the reduced susceptibility in the Pd-Ni-P, Pt-Ni-P and Pd-Cu-P
amorphous alloys difficult to justify.
Instead the effects of the complex process of the formation
of strong covalent bonds between transition metal elements and the
metalloids on the exchange enhancement as well as the orbital and
spin-orbit contributions must be investigated. The extreme diffi
culties of this approach preclude, at the present time. any detailed
presentation along these lines.

-90-
v. SUMMARY AND CONCLUSIONS
The electrical resistivity and magnetic susceptibility of
Pd-Cu-P amorphous alloys obtained by the rapid quenching technique
have been measured. The observed resistivity behavior is found to
be similar to the Pd-Ni-P and Pt-Ni-P systems in that p decreases
linearly with increasing temperature from 120°K to 550°K (Tg)' while
at lower temperatures p decreases as T2 with increasing temperature.
The proposed explanations for this behavior, the structural scattering
roodel of Sinha and the spin fluctuation scattering model of Has'egawa,
have been re-examined in the light of these results and found to be
unsatisfactory for a number of reasons. An alternate explanation of
the level of resistivity, the concentration dependence of resistivity,
and the observed negative temperature coefficients of resistivity has
been given. The approach is based on the Evans, Greenwood and Lloyd
formulation for the electrical resistivity of liquid transition metals
and alloys and the phonon induced modification of the density of
states in transition metal alloys. The weak Pauli paramagnetism ob
served for the Pd-Cu-P system is interpreted as being due to the
effects of covalent bond formation in these amorphous systems and not
to a large transfer of electrons from the metalloid to the transition
meta 1 d-band.

-91-REFERENCES
1. P. Duwez and S. Lin, J. Appl. Phys. 38, 4096 (1967).
2. W. L. Johnson, S. J. Poon and P. Duwez, Phys. Rev. B 11, 150 (1975).
3. J. J. Gilman, Physics Today 28, 46 (1975).
4. W. Klement, Jr., R. Willens and P. Duwez, Nature 187, 869 (1960).
5. P. Duwez and R. H. Willens, Trans. AIME (Met), 227,326 (1962);
P. Pietrokowsky, Rev. Sci. Instr. 34, 445 (1962).
6. D. Harbur, J. Anderson and W. Maraman, Rapid Quenching Drop Smasher, Los Alamos Scientific Laboratory of the University of California, Report No. LA-3584 (1966}.
7. w. Y-K. Chen, Ph.D. thesis, California Institute of Technology (1975).
8. A. K. Sinha, Phys. Rev. B l• 4541 (1970).
9. R. Hasegawa, Phys. Lett. 38, 5 (1972}.
10. N. C. Halder, D. M. North and C.N.J. Wagner, Phys. Rev. 177, 47 (1969}.
11. B. F. Wingfield and J. E. Enderby, Phys. Lett. 27A, 704 (1968).
12. B. Y. Boucher, J. Non-Crystalline Solids z, 113 (1972).
13. P. L. Maitrepierre, J. Appl. Phys. ~. 498 (1970).
14. P. Lederer and D. L. Mills, Phys. Rev. 165, 837 {1968).
15. A. B. Kaiser and Doniach, Int. J. Magn. l· 11 (1970) .
16. E. C. Stoner, Proc. Roy. Soc. A 154, 656 (19B6).
17. A. I. Schindler and M. J. Rice, Phys. Rev. 164, 759 (1967).
18. A. D. Caplin and C. Rizzuto, Phys. Rev. Lett. £1, 746 (1968).
19. J. Friedel, J. Phys. Chern. Solids l· 175 (1956).
20. P. w. Anderson, Phys. Rev. 109, 1492 (1958); ibid 164, 352 (1967).

-92-
21. R. W. Houghton, M. P. Sarachik and J. S. Kouvel, Phys. Rev. Lett. ~, 238 (1970).
22. H. M. Ahmad and D. Greig, Phys. Rev. Lett. 32, 833 (1974)
23. J. H. Mooij, Phys. Stat. Sol. (a) ll, 521 (1973).
24. F. R. Brotzen, E. L. Hannon, Jr. and A. R. Troiano, J. Metals l_,
413 (1955).
25.
26.
27.
28.
R.
c. D.
J.
G. Loasby, Proc. Phys. Soc. 72, 425 (1958).
A. Steidel, J. Vac. Sci. Technol. §_, 694 ( 1969).
Gerstenberg and C. J. Calbick, J. Appl. Phys. 35, 402 ( 1964).
H. Mooij and M. de Jong, J. Vac. Sci. Technol. ~. 446 (1972) .
29. J. M. Ziman, Electrons and Phonons, Clarendon Press, Oxford, 1960.
30. A. B. Chen, G. Weisz, A. Sher, Phys. Rev. B i, 2897 (1972).
31. F. Brouers and M. Brauwers, J. de Physique Lett. 36, L-17 (1975).
32. R. Evans, D. A. Greenwood and P. Lloyd, Phys. Lett. A 35, 57 (1971).
33. 0. Drierach, R. Evans, H. J. Gundtherodt and H. U. Kunzi, J. Phys. F: Metals Phys. £, 709 (1972).
34. J. S. Brown, J. Phys. F: t~etal Phys. _l, 1003 (1972).
35. R. C. Crewdson, Ph.D. thesis, California Institute of Technology
(1966).
36. H. Kaga, Phys. Lett. 37A, 373 (1971).
37. R. Evans, G. D. Gaspari and B. L. Gyorffy, J. Phys. F: Metals Phys . _l, 39 ( 19 7 3) .
38. H. J. Guntherodt, E. Hauser, H. U. Kunzi, R. Muller, Phys. Lett. 54A, 291 (1975).
39. Y. Waseda and M. Ohtani, Z. Physik B £L, 229 (1975).
40. A. P. Klein and T. J. Heeger, Phys. Rev. 144, 458 (1966).

-93-
41. F. M. Mueller, A. J. Freeman, J. 0. Dimmock and A. M. Furdyna, Phys. Rev. B l• 4617 (1970).
42. F. M. Mueller, Phys. Rev. 153, 659 (1967).
43. B. R. Coles and J. C. Taylor, Proc. Roy Soc. A 267, 139 (1962).
44. N. F. Mott, Phil. Mag. 26, 1249 (1972).
45. M. Shimizu, A. Katzuki and K. Ohmari, J. Phys. Soc. Japan~. 1922 (1966) .
46. N. Mori, J. Phys. Soc. Japan 20, 1383 (1965).
47. R. J. Gambino, T. R. McGuire andY. Nakamura, J . Appl . Phys. 38, 1253 (1967) .
48. P. A. Albert, Z. Kovac, H. R. Lilienthal, T. R. McGuire andY. Nakamura, J. Appl. Phys. 38, 1258 (1967).
49. D. H. Seib and W. E. Spicer, Phys. Rev . Lett. 20, 1441 (1968) .
50. J. J. Hauser, to be published in Physical Review (1975) .
51. N. 0. Lang and H. Ehrenreich, Phys. Rev. 168, 605 (1968).
52. A. c. Switendick, Solid State Corrmun. ~. 146 3 ( 19 70) .
53. w. B. Pearson, in Treatise on Solid State Chemistrl (N. B. Hannay,
ed.), Plenum Press, New York (1973), p. 115.

![[XLS] · Web viewROMAN MILAGROS PAUIG 060 ROXAS MONICA ORDONIO 061 SAGASAG HAYDEE TANGONAN SAN FRANCISCO ELEMENTARY SCHOOL, SAN FRANCISCO , CAUAYAN CITY 062 SAMSON VILMA 063 FLORANTE](https://img.pdfslide.us/doc/110x75/5aa3dcd47f8b9a84398eea2f/xls-viewroman-milagros-pauig-060-roxas-monica-ordonio-061-sagasag-haydee-tangonan.jpg)