Embed Size (px)
Citation preview

The Efficient Investor | 1
The Efficient Investor: A New, Low-Cost Approach to Investing and Managing Wealth Matt Fellowes, Lara Langdon, Lincoln Plews, and Davey Quinn
Executive Summary
Retail investment management prices have dropped by more than 50 percent over the past 35 years, which is widely seen as a boon to investors because they maintain more of their wealth over time. But the benefits of lower prices may be undermined by other, non-fee costs created from features that are oversimplified or imprecise in investment products and wealth management services. To assess this potential, we analyzed 62 different retirement solutions in the market and over 26,000 potential combi-nations of future market returns (from highly bearish to bullish), finding:
Non-fee costs incurred by investors from their investment products and wealth management services can include higher taxes, stunted investment returns, and reduced money from public benefits. These largely hidden non-fee expenses arise from oversimplified or imprecise approaches that suboptimally invest and disperse money for individuals, particularly in retirement.
More than 75 percent of the retiremement solutions we analyzed have low relative prices, but also include potentially high non-fee costs created by oversimplifications or imprecisions. About 96 percent of the 62 solutions we analyzed do not strive to minimize some or all non-fee costs generated by their approaches, including costs created from inflated tax bills and deflated investment returns and public benefits.
Reducing non-fee costs generated seven times more wealth in retirement for a typical retiree com-pared to the effect of reducing investment management fees by 100 basis points (bps). Larger wealth gains for retirees are the result of greater tax savings from increased use of the tax code, a higher equity premium from more accurate management of an investor’s risk preferences, and the greater relative ability of these approaches to anticipate and plan for more diverse future outcomes, including health spending shocks that increase in likelihood during retirement.
On average, retirement solutions with lower non-fee costs have a 42 percent better chance of generating enough money for typical retirees compared to products that just have a low rela-tive price. Increases in wealth are the result of greater use of public policies to increase retirement income (e.g., higher Social Security benefits, lower tax bills), higher investment returns from more

The Efficient Investor | 2
accurate management of an investor’s risk preferences in retirement, and other factors that reduce costly inaccuracies.
The typical retiree accumulated an average of 124 percent more wealth during retirement when using a solution with lower non-fee costs compared to solutions that just have a low relative price. Improved financial outcomes were due to the greater relative use of public policies that can increase or protect income in retirement, as well as the use of more information to diversify a retiree’s finances to survive in a higher number of potential future market outcomes.
There have been broad and nearly universal reductions in investment fees in recent decades, but most in-vestment products and wealth management services have high non-fee costs if used as a sole retirement solution. Added together, these non-fee costs can be more expensive for an investor than product fees. In response, we developed a framework for a new, low-cost approach to investing and managing wealth that we call Efficient Investing. In short, our approach at United Income picks up the legacy of the low-cost investing pioneers by extending their thesis to other forms of (non-fee) costs in a portfolio. The result for clients is an approach that wrings out costly inefficiencies from investing and managing wealth, which can lead to improved financial outcomes for households.
The Efficient Investor | 3
Introduction Retail investment management prices have dropped by more than 50 percent over the past 35 years.1 Initially led by Vanguard, most investment management firms have now lowered fees, while consumers are electing in growing numbers to buy the lowest priced products in the market.2 In fact, over 95 per-cent of all U.S retail investments made since 2005 were in products that were the cheapest 20 percent in the market.3 This trend is propelled by the fact that falling prices are viewed as a boon to investors’ wealth-building potential because consumers retain more of their wealth as fees fall.4
But the benefits of lower investment prices may be curbed by other non-fee costs created from features that are oversimplified or imprecise in investment products and wealth management services. An investor might pay higher than nec-essary taxes, for instance, if a retirement solution ignores or minimizes the tax implications of its product or recommendations. Similarly, an investor might lose money in the market if the solution over-invests them in underperforming or highly risky investments. An investor might also lose money if the solution did not prepare a household for large, future health care costs, forcing a withdrawal of more wealth from investment accounts. And by failing to optimize public benefits like Social Security and Medicare, retirement solutions can drive up reliance on withdrawals from investment accounts, further
depressing future investment returns.
To assess the prevalence and impact of these types of non-fee costs, we began with a review of differ-ent types of non-fee costs and their prevalence in 62 broadly available retirement-focused investment products and wealth management services.5 We found that there is a preponderance of relatively low-fee solutions in the market today, but most products and services have high non-fee costs if used as a sole retirement solution – an outcome made more probable by marketing language.6 In fact, only a few broadly available solutions currently have low fees and low non-fee costs.
Next, we assessed the importance of non-fee costs to financial outcomes. To do this analysis, we used data from the Federal Reserve Board to build two different investor profiles: (a) a typical recent US retiree and (b) a typical wealthy recent US retiree. We focused on financial outcomes for US retirees be-cause the public, representative data are more complete for retirees compared to workers who are still working and saving money.7 We find that solutions with low non-fee costs have a 42 percent greater chance of generating enough money for a typical recent retiree to last through retirement compared to approaches that just have low fees. These superior results were maintained in historically weak (bearish), average, and strong (bullish) future markets. We also found that wealth accumulation during retirement for the typical retiree increases as the value of non-fee costs decreases, and that, in the ag-gregate, non-fee costs have more impact on financial outcomes than the price of an investment prod-uct or wealth management service. These improved and sustainably better outcomes were the result of
0.00%
0.20%
0.40%
0.60%
0.80%
1.00%
1.20%
1990 1992 1994 1996 1998 2000 2002 2004 2006 2008 2010 2012 2014 2016
Active Passive All Funds
FIGURE 1. Average Asset-Weighted Expense Ratios, 1990-2016
Source: Morningstar, Inc.

The Efficient Investor | 4
lower tax liabilities, higher expected investment returns, more valuable public benefits, and improved investment allocations that prepared retirees’ finances to survive in a higher number of potential future market outcomes.
In response, we developed a framework for a low non-fee cost approach to investing and managing wealth that we call Efficient Investing. The principle of this approach is that costly inefficiencies can be wrung out of investment products and wealth management services by using new technology and data to improve their accuracy and accounting of contingencies. In short, Efficient Investing picks up the legacy of the low-fee pioneers by extending that thesis to other forms of costs in a portfolio that hurts performance and financial outcomes for investors. The result for individual consumers is an approach more tightly aligned with their best interests and better positioned to reach their financial goals.
Sources of Non-Fee Costs
There are a broad range of non-fee costs incurred by investors because of oversimplifications in invest-ment products and wealth management solutions. We broke these costs into four types: costs created from overly simplified public policy, risk preference assessments, an individual’s profile, and expecta-tions of how the future could change. While disparate, these oversimplifications in how an investor’s in-vestments are allocated and dispersed can each generate costly errors, including higher taxes, stunted investment returns, and reduced money from public benefits like Social Security.
FIGURE 2. Sources of Non-Fee Costs in Investment and Wealth Management Approaches
Sources of Non-Fee Costs Types of Oversimplifications Costs Incurred by Investors
Investor Risk Preferences • Existing investments do not influence investment allocations • Low-risk income does not influence investment allocations• Investor risk preferences for different spending needs do
not influence investment allocations• Changes in income or spending needs do not influence
investment allocations
• Inaccurate investment allocation (over or under-exposure to market risk) that depresses investment returns or overexposes clients to risky investments
Investor Profile • Spending needs are not personalized or informed by peer spending behaviors
• Longevity estimates are not personalized or informed by an investor’s health
• Investor health profile does not influence investment allocations
• Future health changes do not influence investment allocations.
• Advice or management focuses on an individual instead of a household
• Inaccurate investment allocation (over or under-exposure to market risk) that depresses investment returns or overexposes clients to risky investments
• Higher tax bills
Public Policy • Tax considerations of account withdrawal sequence in retirement are omitted
• Tax considerations of investment locations are omitted• Tax considerations of trading decisions are omitted• Social security claiming strategies are omitted or do not
influence investment decisions• Retirement date strategies are omitted
• Inaccurate investment allocation (over or under-exposure to market risk) that depresses investment returns or overexposes clients to risky investments
• Higher tax bills• Lower value benefits (e.g., Social Security,
Medicare)
Planning • Broad range of potential negative and positive market out-comes are not simulated prior to investment allocation
• Potential changes to spending outcomes are not simulated prior to investment allocation
• Broad range of retirement dates are not simulated prior to investment allocation
• Broad range of Social Security claiming strategies are not simulated prior to investment allocation
• Inaccurate investment allocation (over or under-exposure to market risk) that depresses investment returns or overexposes clients to risky investments
• Higher tax bills• Lower value benefits (e.g., Social Security,
Medicare)

The Efficient Investor | 5
Costs Incurred by Risk Preference Simplifications
Imprecise approaches to risk preference assessments create non-fee costs for investors by triggering avoidable investment losses and limiting investment returns. One way this can happen is when an investment product allocates risk for a household without regard for risks the household is already taking in other investments. Just like a doctor prescribes drugs to a patient by first considering other prescriptions already being taken, investment allocations should ideally be prescribed by considering risks the client is already managing.8 For instance, imagine a risk-averse, 30-year-old client who funds an IRA with inherited money–a windfall 20 percent of US households receive.9 Upon discovery of the risk aversion, the wealth management provider might invest 80 percent of the IRA’s value in relatively lower risk investments, like bonds and money market savings accounts. But that same client may al-ready have the majority of their investments in their 401k plan’s default target-date fund, where most of the portfolio has been automatically allocated to higher risk investments because the client is relatively young and has a high level of human capital. In this case, the client would be overexposed to higher risk investments by both the target-date fund and IRA provider, since the IRA provider should allocate 100 percent of the portfolio to low-risk investments to compensate for the 401k investment risk. In turn, the investor is exposed to avoidable investment losses from two overly risky portfolios.
Non-fee costs can also be created for investors when a retirement solution oversimplifies the role of household income in risk preference assessments, which can create mistakes in investment alloca-tions. For instance, imagine a scenario where an individual who is retiring reports a high risk aversion when asked about how much risk to take in retirement to make sure there is enough money to cover essential expenses. Given that preference, an investment product or wealth management service may recommend a portfolio that has 80 percent of its value in relatively lower risk investments, like bonds and money market savings accounts. But that same client might be less risk averse when it comes to lifestyle expenses and might also already have 100 percent of retirement liability covered by a relatively low-risk annuity and Social Security income. In this case, the investor would potentially pay a hefty cost in depressed investment returns and quality of life because the solution over-invested the household in lower risk investments because of an oversimplified approach to measuring risk preferences. At the very least, investment products and wealth management services that focus on the concept of a single measure of risk can obscure underlying preferences that vary by the reasons why the risk needs to be taken. Risk preferences to pay for maintaining food and housing in retirement, e.g., can be very differ-ent from preferences for risk taken to fund lifestyle or future healthcare costs.
Similar non-fee costs can be created for investors when retirement solutions hold risk preferences constant on a single glide path or a single number through time without regard to changes in income, spending, or preferences. As in the other examples, these costs are generated for investors by unneces-sarily depressed investment returns or overexposure to relatively more risky investments. For instance, imagine this same risk-averse retiree has a spouse who dies during their fifth year of retirement, creating excess income from Social Security and an annuity provider. Since the retiree’s living expenses are already being funded by existing, low-risk income and they have a higher investment risk tolerance to pay for other expenses in retirement, those changes should trigger more allocations to higher-risk, higher potential return investments. Absent that reassessment, investment products and wealth man-agement services will artificially stunt investment returns. Costs levied by an overly simple approach to managing investment preferences are particularly important in retirement due to the arrival of required income in the financial life of a household, like required minimum distributions or pension income. When not considered, investment products and wealth management services can further depress

The Efficient Investor | 6
future investment returns, both by overinvesting in relatively lower risk and lower performing asset classes, as well as by causing future withdrawals that represent a greater share of wealth than what was possible.
Costs Incurred by Public Policy Simplifications
Non-fee costs can also arise from oversimplification of public policies in retirement solutions. This in-cludes tax policies, such as rules that govern tax rates on deposits, withdrawals, trading, and bequests. Oversimplifying or disregarding these rules can unnecessarily raise the cost of tax bills for investors. For instance, some retirees can reduce their tax bill by first withdrawing money from their brokerage account and delaying withdrawals from their tax-deferred accounts, such as a defined contribution account. But other retired households pay lower taxes by withdrawing from tax-deferred accounts first, and then spending money out of their brokerage accounts, such as when a household’s expenses can be met by required minimum distributions and other existing income. By disregarding these types of tax implications associated with investments, retirement solutions can drive up the tax assessed to their customers, even while they may save them money from lower prices.
Oversimplifying or disregarding Medicare, Medicaid, and Social Security policies can also unneces-sarily drive up costs for investors. Social Security income, for instance, is a low-risk income source in retirement that can be used to offset the portion of a portfolio allocated to low-risk investments. When that income is ignored, solutions can overinvest in lower risk asset classes, which depresses investor returns. Similarly, failing to optimize the type and amount of Social Security benefits clients apply for can lead to an overreliance on withdrawals from investment accounts in retirement, further curbing investment returns. That effect occurs as well when households make suboptimal decisions about Medicare and Medicaid benefits, leading to potentially higher withdrawal amounts, which further reduce future returns.
Costs Incurred by Investor Profile Simplifications
Investor profiles used to make recommenda-tions about deposits, withdrawals, investments, and bequests can create avoidable costs if oversimplified or mismeasured. One way this can happen is by relying on incorrect spending assumptions about investors. For instance, the US Government Accountability Office found that wealth management services generally assume that retirees spend between 70 and 85 percent of their inflation-adjusted, preretirement income for the duration of their retirement, even though there is broadly available research and data (a sample of which is included in Figure 3) that in-dicate spending is neither constant nor smooth, particularly for wealthy retirees.10 Costs can be created for an investor in a variety of ways by
these imprecise assumptions. Tax bills, for example, can unnecessarily increase when investment prod-ucts and wealth management services fail to anticipate and plan in a tax optimal manner for non-in-cremental spending shocks, such as long-term care. Similarly, investment products and wealth man-
-60%
-40%
-20%
0%
20%
40%
60%
60 61 62 63 64 65 66 67 68 69 70 71 72 73 74 75 76 77 78 79 80 81 82 83 84 85
Expected Spending Change Over 12 Years Using Popular 80% Replacement Ratio Assumption
Actually Observed Change in Spending Over 12 Years Using Time Series Panel Data
FIGURE 3. Expected vs. Actual Change in Retiree Spending Over 12 Years, by Initial Age of Retiree
Source: Health and Retirement Survey

The Efficient Investor | 7
agement services can withdraw too much money in retirement for households because their spending needs are overstated, depressing investment returns. Probably most importantly, though, lumping retirement liability into a single dollar amount that is empirically wrong leads to an incorrect invest-ment allocation because deposit and withdrawal expectations are wrong. This problem is amplified when investment products and wealth management services also manage risk preference imprecisely, since underlying differences in the risk preferences households have about different spending needs in retirement are obscured, leading to an over-investment in low-performing or high-risk products.
In the same way, spending shocks can depress investment returns if the investment product or wealth management service does not anticipate these future changes to spending. To illustrate, imagine a scenario where a retiree indicates a high risk aversion and wants to make sure money lasts through retirement. Using a generic approach such as what the GAO found common in the market today (e.g., the retiree is expected to spend 80 percent of inflation-adjusted preretirement income), a retirement solution might estimate that the investor’s retirement liability could be covered with a 100 percent bond portfo-lio. But if the approach instead personalized this spending estimate and factored in the probability of a health expense shock, it might very well conclude that the investor needed at least a 30 percent exposure to equities to afford that future shock. Absent this step to personalize this estimate, an investor would artificially depress investment returns in retirement and run the risk of a greater share of wealth being consumed by a future non-incremental expense, which would further depress future returns. Worse, re-search has found that these types of health spending surprises are a leading cause of bankruptcies, which raise the price of credit. In this way, spending shocks can have an equivalent financial effect of a Black Swan market event like the Great Depression if not anticipated and planned for as part of the approach.11 Unfortunately, while Black Swan market events are highly unlikely; Black Swan life events are much more likely, raising the probability that this non-fee cost will be incurred by a retiree if their retirement solution ignores how changes in life also affect investment outcomes.
Longevity estimates can also create avoidable costs for investors if oversimplified or mismeasured. One way this can happen is by retirement solutions relying on simple mortality tables based on age and gender, rather than more sophisticated actuarial models that take into account health indicators, such as disease and smoking habits. Non-fee costs are incurred when these simplified approaches fail to anticipate clients who will live longer lives than most, leading to potential overreliance on expensive home equity debt or tax-inefficient withdrawals. Worse, these same solutions can artificially depress investment returns by recommending lower than needed equity exposures in retirement, since they can underestimate the size of the retirement liability that needs to be funded.
Costs Incurred by Simplifications About the Future
Simplifications about how the future may change can create non-fee costs for investors by lowering the value of public benefits, reducing income, and artificially depressing investment returns. For example, the value of public benefits like Social Security is dependent on both the date on which it is claimed as well as the type of benefit that is claimed. By not running simulations that assess which of these future options is optimal for an investor, retirement solutions can create costs for investors. In some cases, costs are incurred because the value of Social Security is lower than what it might otherwise be if a different type of benefit was claimed or if the claiming date was suspended. In other cases, costs are incurred because a household had delayed claiming Social Security and become overly reliant on making withdrawals from their taxable accounts, increasing their tax bill and depressing future returns. In both cases, the failure to assess future combinations of decisions to find the optimal mix of claiming and withdrawal choices creates avoidable costs for investors. Then, too, costs can be generated for

The Efficient Investor | 8
investors by not considering different retirement dates, leading people to retire too early and reduce their income in retirement. Costs can also be created by a failure to consider how a portfolio allocation strategy will fare in different markets, leading to allocations that are too risky or not risky enough. And costs can be created by failing to model the probability of different future expenses, which can lead to stunted investment returns and tax-inefficient withdrawals, as discussed earlier. Together, these exam-ples point to how easy it is to generate additional costs for investors through oversimplifying expecta-tions about the future.
MethodologyTo assess the impact of non-fee costs on financial outcomes, we first took a survey of the market and found 62 investment products and wealth management services that are marketed as a retirement or retirement income solution. For solutions that directly manage money, we’ve included only those from companies that have more than $100M in assets under management. We then assessed their price and non-fee costs to understand the geography of cost in the market. Next, we selected five of these prod-ucts to assess the financial impact of prices and non-fee costs on three financial outcomes: the proba-bility that an investor’s money will last throughout retirement, the amount of wealth they generate in retirement, and the value of the account balances. These products represent a broad range of both price and non-fee costs in the market, varying from low-fee, high non-cost solutions to high fee, high non-cost solutions. This section will explain in more depth each of these components of the methodology.
Household Profiles
To assess the impact of prices and non-fee costs on financial outcomes, we focused on recently retired households, where the data was much richer and required fewer assumptions compared to individuals who are still working. Saving is less common among retirees, for instance, which meant we avoided needing to make assumptions about savings rates on account types that are not tracked by public data resources.12 In addition, we used the recommended investment allocations of the different products we tested, so we did not need to make assumptions about past allocation decisions, which are also not tracked for the U.S. population by public data sets.
FIGURE 4. Profile of Typical and Typical Wealthy Recent Retiree
Typical Recent Retiree Typical Recent Wealthy Retiree
Pre-retirement Income $105,242 $291,392
Retirement Age 64 64
SS Claim Age 65 66
SS Benefit Amount $15,710 $20,316
Pensions $11,516 $19,216
Brokerage Balance $238,329 $897,569
DC Balance $162,536 $578,259
Roth Balance $5,815 $19,520
Education Some College Bachelors Degree
Death Age 90 90
Marital Status Single Single
Mortgage/Housing Paid Off Paid Off
State VA VA
Smoker No No
Drinking None None
Self-rated Health Excellent Excellent
Gender Male Male
Race White White
Children None None

The Efficient Investor | 9
We then selected two household profiles to assess how financial outcomes would vary based on the different approaches. The first was a typical household that retired within two years of the 2013 Survey of Consumer Finances and is headed by an adult over 50 years old.13 To build this profile, we estimated the average balance of different account types for this consumer segment, including 401k accounts, IRAs, Roth IRAs, savings accounts, brokerage accounts, and other financial accounts.14 We then took this same approach to identify a typical wealthy recent retiree, which we defined as a recent retiree who had a gross wealth greater than 75 percent of all other recent retirees. These data allowed us to sim-ulate how the finances of a typical retiree and typical wealthy retiree would vary depending on which solution they used in retirement.
In the analysis, we held constant numerous other variables, which are summarized in Figure 4. This included the retirement age, Social Security claim age and benefit amount, educational attainment, an individual’s health, state tax rate, federal tax rate, household size, retirement spending, and other similar variables. Although each of these variables can be used to reduce non-fee costs for retirees, each of these factors also was dependent on exogenous client decisions or characteristics. For instance, a retirement solution may optimize the recommended claim date for Social Security, but an individual decides when to actually file for the benefit, and this may vary from the optimal date. Similarly, a solu-tion may optimally manage a projected surge in long-term health care costs, but the need to do that is dependent on the health profile of the household. For these reasons, we decided to hold all of these variables constant when assessing the comparative impact of different solutions on financial outcomes in retirement. The result is an analysis that understates the value of a more accurate retirement solu-tion that minimizes errors.
Investment Products and Wealth Management Services
We assessed the prevalence of potential non-fee costs in the market by looking for any investment product or wealth management service that markets itself as a retirement or retirement income solution. For solutions that directly manage money, we’ve included only those from companies that have more than $100M in assets under management. To build this list, we first considered a number of different reports, such as the US News and World Report retirement income fund list and the Robo Re-port. We then searched for key words, like financial planning, financial advice, and retirement income.15 In total, we found 62 different investment products and wealth management services, ranging from software, investment, insurance, advisor-supported, purely automated solutions, or a combination of these characteristics. The full list of considered products is in Appendix 1. Together, this population of products represented a broad cross section of the market across methodology, fees, services, and mar-ket adoption. Importantly, some of these solutions can be integrated into other solutions, like invest-ment funds. But because each product is marketed or referenced as retirement or retirement income solution, we assessed non-fee costs potentially created in each of these different approaches.
We then took a sample of five products to assess how financial outcomes for the typical retiree and the typical wealthy retiree would potentially vary based on the methodologies used by each solution. This included a low-fee target-date fund marketed as a retirement income solution (15 bps all inclusive), a robo product marketed as a retirement solution (45 bps all in), United Income (68 bps all in), an average-priced target-date fund (80 bps), and an investment advisor approach that uses average cost passive and active funds (171 bps). Among the sampled products, we found the lowest-priced product does little to minimize other non-fee costs; the advisor approach takes some steps to reduce non-fee costs; and United Income is the most comprehensive solution at reducing non-fee costs.

The Efficient Investor | 10
Investment Market Returns
We next needed to make assumptions about the expected returns of different asset classes, like large cap US stocks or emerging market bonds. This was important since there were broadly varied approaches to investment management as people age, with different asset classes and allocations across those different retirement solutions.16 For this section of the analysis, we started with Morningstar’s geometric mean and standard deviation expectations for 11 different asset classes, from emerging and US bonds to small and large value cap stocks. We then sim-ulated 1,000 random market returns for each of the 11 asset classes in each year of the retire-
ment, allowing us to study how the level of efficiency and the price of a solution would vary in bearish, average, and bullish markets. As a further step to validate the results, we also simulated systematically weak, historically average, and strong markets across all of the solutions, finding that the results were directionally the same across each of these different methods.
Measuring the Number of Non-Fee Cost Sources
Since non-fee costs arise from oversimplifications of wealth management, we scored each of the 62 solutions on the degree to which they simplified their approach in a manner that could create costs for their clients. First, we considered four different risk preference simplifications, including if investment preferences are determined for each of the major types of spending that the investments will need to cover (e.g., essential spending on utilities, or long-term health care spending) or if just a general query or assumption is used. We also determined if investment allocations in the product controlled for exter-nal investment allocations that are not managed by the provider, external income that is not managed by the provider, and expected future changes in spending. We assigned a value of one to each of these indicators if the solution included this feature, indicating that the solution took steps to avoid generat-ing non-fee costs for their customers.
Next, we considered four different simplifications made in the information profile of investors, which can also create non-fee costs for customers. This includes if the solution provided a personalized spending forecast, longevity estimate, health spending forecast, and an opportunity for the member to include personalized health information in their profile. Each indicator was assigned a value of one if this step for accuracy was taken by the retirement solution, which reduced the likelihood that a non-fee cost would be incurred by their customer.
Third, we considered numerous ways that public policy implications associated with investment deci-sions are simplified in a manner that can generate avoidable non-fee costs for investors. This includes whether the retirement solution provides personalized account withdrawal optimization in retirement, investment asset location optimization, tax-minimization lot optimization, tax-loss harvesting, Social Security claiming strategy optimization, and retirement date optimization. As discussed earlier, simpli-fying or disregarding these policy considerations can create non-fee costs for investors. We assigned a value of one if the solution included these public policy considerations in our survey of the efficiency of the retirement solution market.
-40
-30
-20
-10
0
10
20
30
40
50
60
FIGURE 5. Sample of Simulated Large Cap Stock Returns, by Year
Source: Morningstar Inc. Note: Time has been omitted from the time-series, since these are proprietary data owned by Morningstar Inc.

The Efficient Investor | 11
Finally, we considered four ways retirement solutions simplified the future, which can create non-fee costs for customers. This included whether the solution forecasted potential market outcomes, chang-es to spending, retirement dates, and Social Security claiming strategies. Like the other measures, we assigned a value of one if the solution took these extra steps to improve the accuracy of its recommen-dations and reduce the likelihood that their customer would pay a non-fee cost.
FindingsMore than 75 percent of the different investment products and wealth management services we ana-lyzed have low relative prices, but also include potentially high non-fee costs created by oversimpli-fications.17 About 96 percent of the 62 retirement solutions we analyzed do not strive to minimize some or all non-fee costs, including costs created from inflated tax bills and deflated investment returns and
public benefits generated from oversimplifica-tions in their approaches.
We found 62 different investment products and wealth management services that market themselves as retirement or retirement income solutions. This included low-fee options, like discount target-date funds and financial plan-ning software. It also included other fund types, software that automatically invests and rebal-ances investments, insurance products, invest-ment advisor approaches, workplace-sponsored solutions, and retail solutions, among other options. In total, this universe of products rep-resents a broad range of the advertising that US
retirees will experience during the transition to retirement from both their employers and the various companies that market directly to consumers.
Overall, we found that more than 75 percent of the solutions we analyzed have low relative prices, which we defined as below the reported averages for financial advice and investment products.18 But most of these solutions also created potentially high non-fee costs for their customers, particularly if these products are used as a sole solution – an outcome made more likely by the way some of these solutions are marketed. In fact, about 95 percent of the 62 retirement solutions we analyzed oversim-plify their approaches in a manner that can generate non-fee costs for their customers. Only about five percent of retirement income solutions are both low priced and take a broad number of steps to also lower non-fee costs.
Non-fee costs in these products can be created from their overly simplified approaches to public policy, risk preference assessments, an individual’s profile, and expectations of how the future could change. For instance, all but four of the solutions imprecisely measure or manage risk preferences, failing to measure risk preferences for the specific reason why the investor needs to take the risk; not taking into account investments in external accounts; not offsetting low-risk investment preferences with low-risk income the household already earns or is expected to earn, like Social Security; or not modifying future risk allocations based on expected changes, such as long-term care, in spending needs during retire-ment. Instead, the majority of the retirement solutions we analyzed ascribe a single risk preference
0%
10%
20%
30%
40%
50%
60%
70%
80%
90%
100%
0 20 40 60 80 100 120 140 160 180
All-In Basis Point Charge
Perc
enta
ge o
f Cos
tly
Ove
rsim
plifi
catio
ns
Low Fee, High Non-Fee High Fee, High Non-Fee
Low Fee, Low Non-Fee High Fee, Low Non-Fee
FIGURE 6. 62 U.S. Retirement Solutions, by Cost

The Efficient Investor | 12
measure to a household during retirement that is held constant through time, regardless of changes to income, spending, assets, public policy, or underlying risk preferences for different spending needs. As we discussed earlier, this can lead to an over-allocation in risky or conservative investments, causing an investor to lose money.
Similarly, we found all but one of the 62 retirement solutions oversimplified the investor profile and public policy implications of wealth management decisions in a manner that can create avoidable non-fee costs for clients. In particular, that single solution – out of 62 – provided tax-optimized and person-alized financial account withdrawal sequences; minimized taxes associated with investing; optimized Social Security income and retirement dates for both a client as well as a partner; and asks questions about diabetes or smoking, which can be used to personalize spending projections and reduce tax inefficient withdrawals. These steps can each lead to improved investment returns and lower taxes, as discussed earlier. For instance, taking steps to more accurately account for likely future spending can avoid over-allocations to under-performing investments (since solutions might under-estimate costs and invest too much in cash and bonds) or overly risky investments (since solutions might over-esti-mate costs and invest too much in stocks and alternatives). It also can position investors to proactively
invest in a manner that will lower their future taxes (e.g., since different account types have different tax treatments). We also found only two solutions that simulate the interaction of potential changes to a household’s life with potential market outcomes, which can position investors to manage their money in a manner that will survive a broader range of potential future outcomes.
There are numerous reasons why non-fee costs are so prevalent in the market. Some have a strong academic foundation that has only re-cently deteriorated. For example, some impre-cise approaches to an investor profile stem from Milton Friedman’s work on consumption in the 1950s.19 It led economists to think for much of the past 60 years that consumers spend a rela-tively consistent amount of money through their
lifetime, which can justify costly oversimplifications about future spending. In the same way, Jacob Mincer’s, Gary Becker’s, and Joseph Williams’ work on human capital between 1950 and 1980 was used to justify costly oversimplifications about how the future may change, which, among other things, now explains why many solutions systematically reduce risk exposure as clients age (or hold risk constant at a low number after 65).20 And costly simplifications about risk preferences can be traced back to Harry Markowitz’s and James Tobin’s work in the 1950s on how to maximize returns at different levels of risk, which used a single concept of risk tolerance.21
Other causes of non-fee costs are likely more practical. For instance, many of the steps we have re-viewed to prevent costly public policy simplifications are absent from the tests that certify wealth management professionals, like CFA, Series 7, or Series 65. Costly simplifications may result from the institutional delegates in the market, too, like home offices or investment product manufacturers,
38% 39%
14%
5%
2%
0% 1-25% 26-50% 51-75% More than 75%
FIGURE 7. Percent of Financial Service Apps Modernized for NextGen Computing, by Company
Source: EMC Note: Thirty eight percent of financial services companies responded, for instance, that 0% of their apps have been modernized for NextGen computing

The Efficient Investor | 13
lacking the technology to address these issues. While financial services were early adopters of more recent technologies in some areas of business management (such as back-office support and commu-nications), adoption in consumer-facing product development (asset management and the web) is limited.22 As an example, all but one retirement income solution in the market either does not simulate potential outcomes in the future or refers on their marketing website to “thousands” of simulations. Since simulating not only a range of market outcomes, but also the combination of each of those differ-ent outcomes with life outcomes, can change a simulation from a few hundred cases to a few million, this type of non-fee cost-reducing step is probably beyond the scope of technology relied on by most institutions.
Reducing non-fee costs generated seven times more wealth in retirement for a typical retiree com-pared to the effect of reducing investment management fees by 100 bps. Larger wealth gains for retirees are the result of greater tax savings from increased use of the tax code, a higher equity premium from more accurate management of an investor’s risk preferences, and the greater relative ability of these ap-proaches to anticipate and plan for more diverse future outcomes, including health spending shocks that increase in likelihood during retirement.
To assess how the impact on financial outcomes changes as fee and non-fee costs vary, we held all household and market variables constant, including all exogenous decisions that the provider could not control, like when to claim Social Security and begin retirement. We then varied only the price of the investment solution, by 100 bps, and looked at how wealth accumulation during retirement
changed as the fees charged for the solution varied. Next, we held fees constant, and only varied three non-fee costs to see how wealth outcomes varied as these values changed. This included taxes paid when deposits, withdrawals, and investment allocations in retirement were first suboptimally, then optimally managed. In all cases, we made the suboptimal allocations of popular products or well publicized rules of thumb. For instance, we adopted the target-date fund methodology used by one of the largest asset management companies (that manages $4T in assets) as the suboptimal investment allo-cation (e.g., using a single measure of risk that is ignorant of outside income, assets, and invest-ments). We also (generously) assumed that the suboptimal withdrawal strategy was to first with-draw from brokerage accounts, then tax-deferred
accounts, then non-taxed accounts. This presumably reduced the estimated impact of non-fee costs, since there is no evidence from the consumer finance literature that consumers are likely to use these cost-reducing tactics independent of an investment product or wealth management service doing it for them.23 But relaxing this assumption would have required data, which we could not find, on what con-sumers actually do in the absence of guidance. For that reason, we chose a conservative baseline for these non-fee costs. Finally, we then varied investment returns for both analyses, looking at over 26,000 potential combinations of future market returns (from highly bearish to bullish).
$40,583
$340,098
Lowering Investment Fees by 100 basis points
Lowering Non-Fee Costs (Account Sequencing Tax Optimization,
Measuring Risk More Accurately)
FIGURE 8. Additional Wealth Created for the Typical Retiree from Lowering Fees and Non-Fee Costs
Note: Median result for the typical recent retiree after 1,000 simulations of 26,000 possible future market returns (including historically weak, average, and strong markets). Note that this figure captures a small share of the non-fee costs created from over-simplifications in retirement solutions.

The Efficient Investor | 14
Importantly, this approach does not consider many of the other non-fee costs that can be created for clients by their retirement solutions, including other potentially costly simplifications to pub-lic policy, investor profiles, risk preferences, and the future. This means we likely further under-state the impact of non-fee costs on financial outcomes for investors. But we felt this was import-ant because either these non-fee costs were particular to non-generalizable use-cases or were driven by exogenous events or decisions without generalizable benchmarks. As an example, vary-ing the health of the client could illuminate how costly it is for investment products and wealth management services to disregard health, since it can lead to higher taxes and curbed investment returns. Doing this, however, would require the selection of a health outcome that affects a (large) minority of the population of retirees, which would have made it impossible to make inferences about how financial outcomes vary for the typical outcome based on fees and non-fee costs. Similarly, we would have liked to have illustrated the high costs of not personalizing longevity es-timates, but here too, we would have needed to focus on a minority use case, further biasing the results from a generalizable conclusion. Instead, we chose to focus on a limited subset of non-fee costs, each within the power of the product or service provider to control and each generalizable across typical retirees.
Even with this limited sample of non-fee costs, we found that these types of costs added togeth-er can be more impactful on the financial outcomes of retirees than product fees. In particular, a typical retiree is expected to generate about $40,000 in extra wealth in their retirement in the median market scenario (out of 1,000 that were considered) if their investment management fees are lowered by 100bps. That added wealth is the result of fewer fees being deducted in the account throughout their retirement – money that can then continue to grow in value as invested assets. In this way, we were able to isolate the individual contribution to wealth created by lowering fees. The amount of additional wealth did vary by markets, although consumers saved money in any future market scenario.
The median expected savings from lowering non-fee costs was much greater, however. Where lower fees increased wealth for the typical retiree by $40,000, we found that those same median market outcomes could generate more than $340,000 if the solution instead reduced non-fee costs creat-ed from taxes and lost investment returns.24 Taxes are lowered by using the tax code to optimally sequence the withdrawal of money in retirement from different accounts and to locate investments in a tax-efficient manner. Just like fees, lower tax bills allow consumers to hold on to more of their wealth, which compounds in value over time. Since retirees are withdrawing more than workers, tax savings from optimally withdrawing money become more impactful as people age. Similarly, investment losses are minimized by factoring in external, low-risk income from Social Security and required minimum distributions, which is used to offset the portion of a portfolio that would otherwise be allocated to low-risk investments. This created a larger equity premium for retirees in the majority of simulated markets. And when combined with the tax savings, the total impact of an approach that minimizes non-fee costs is sustained in markets that are historically bearish, aver-age, and bullish. Results from bearish markets were particularly interesting. Although higher equity exposures did lead to higher investment losses in the low non-fee approach, lower tax bills offset those losses. In addition, investment gains from market recoveries were swifter and more impactful than the approach that just minimized fees. In this way, an approach that minimizes non-fee costs created better financial outcomes for investors in more market scenarios compared to an approach that oversimplifies wealth management, even when its fee is 100 bps less expensive.

The Efficient Investor | 15
On average, investment products and wealth management services with lower non-fee costs have a 42 percent greater chance of generating enough money for typical retirees compared to prod-ucts and services that just have a low relative price. Increases in wealth are the result of greater use of public policies to increase retirement income (e.g., higher Social Security benefits, lower tax bills), higher investment returns from more accurate management of an investor’s risk preferences in retirement, and other factors that reduce costly inaccuracies.
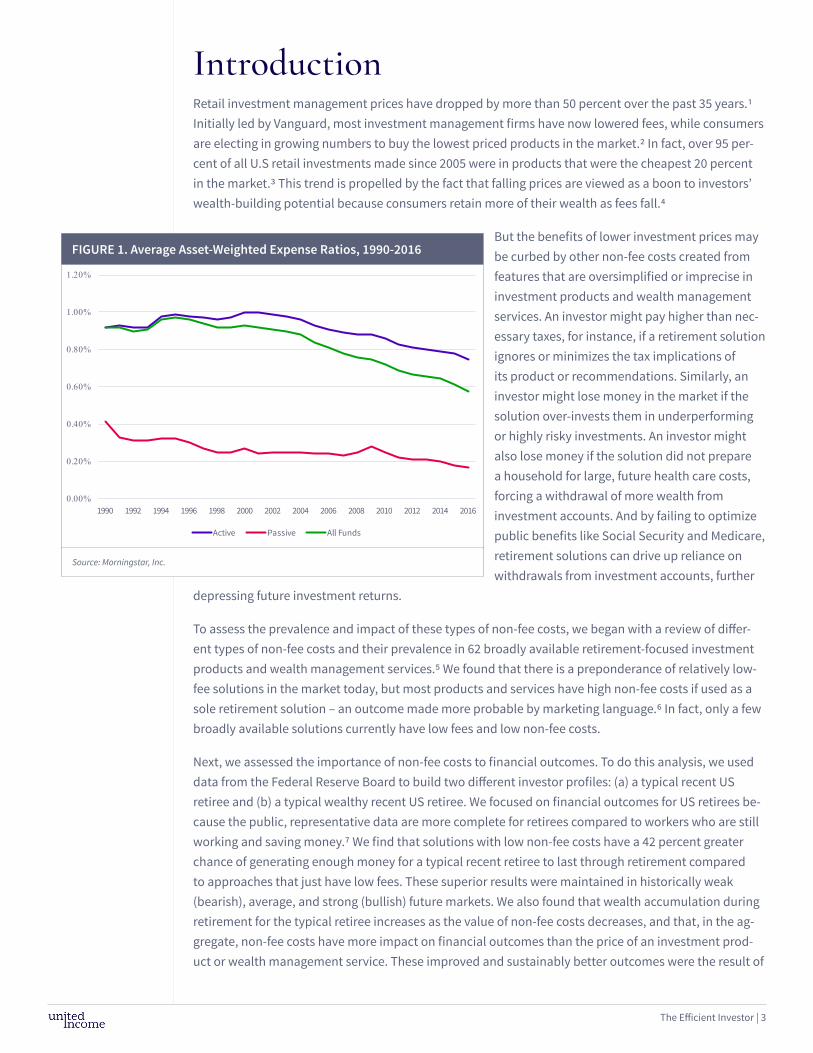
We next wanted to consider how a retiree’s chance of having enough money in retirement varied based on the use of different market solutions. Since so many of the 62 retirement and retirement income solutions are very similar to each other, we condensed the market into five solutions that are emblem-atic of the overall market. This included a low-fee target-date fund marketed as a retirement income solution (15 bps all in), which oversimplifies public policy, risk preference assessments, an individual’s profile, and expectations of how the future could change. But it is cheap. The second approach was a so-called robo solution, a software product available in the retail market that takes some steps to minimize taxes, but otherwise is identical to the target-date fund, aside from a more expensive fee (45 bps all in). The third approach was a hybrid software-financial advisor solution that is more expensive (68 bps all in), but takes the most number of steps to minimize non-fee costs out of the 62 solutions in the market.25 The fourth was an average target-date fund (71 bps all in) that also oversimplifies public policy, risk preference assessments, an individual’s profile, and expectations of how the future could change. Finally, we looked at the approach of a sample investment advisor that has an average admin-istration fee (100 bps) and relies on a combination of average-priced passive and active funds (71 bps). As in the previous analysis, we considered a broad range of market scenarios and held all but a few non-fee costs constant across the analysis.
For each of these solutions, we logged into the solution, entered the household profiles in the Methods section, and recorded the recommended investment allocations of the solution. We then did this for each year the retiree was in retirement, and used Morningstar’s capital market assumptions to simulate 26,000 different future market scenarios, allowing us to test these recommended investment alloca-tions in a broad range of markets, including historically weak, average, and strong. We also used the solution’s recommended risk preference, accounting of external income and assets (if relevant), and management of tax implications associated with the recommended investment allocations. In this way, we were able to account for the variance in fees and non-fees, and how both varied in a broad range of market scenarios.
On average, investment products and wealth management services with lower non-fee costs have a 42 percent greater chance of generating enough money for typical retirees compared to products that just have a low relative price. This improved outcome for investors holds up in historically bearish, average, and bullish markets. In particular, the average TDF generates a 37 percent chance of success for the typical retiree, the discount TDF generates a 49 percent chance of success, and the robo solution generates a 56 percent chance of success, even with a price point that is three times higher than the discount TDF. However, the most successful solution was the low-fee and low non-fee solution. It gen-erated a 65 percent chance of success in retirement for the typical retiree, or enough money to pay for expected retirement costs in the majority of potential future markets, from weak to strong. This was a somewhat surprising result, since this solution also has a higher price point than the discount TDF. But the discount TDF can generate additional costs for investors, including depressed investment returns and higher tax bills, if used as a sole solution for retirement income. For instance, the risk assessment in a discount target-date fund is ignorant of risk being taken in external investment accounts and

The Efficient Investor | 16
existing, low-risk income, like Social Security that can be used to offset the low-risk allocation made in investments during retirement. Both features depress investment returns and accelerate the exhaus-tion of wealth. Added together, these non-fee costs erode all of the advantages of a discounted, low-fee approach and can leave investors with less money that survives retirement in a fewer number of market scenarios, even though their investment fees are lower.
The least successful approach was the sample investment advisor approach we tested. It generat-ed enough money for the typical retiree in just 17 percent of the 26,000 future market scenarios we considered. Since there are at least 36,000 investment advisors in the US, this is not intended to be a general statement about the relative efficacy of those approaches. Instead, it is taking the average price charged by those advisors, the average price of active and passive funds, and a standard TDF alloca-
65 70 75 80 85 90$0
$200,000
$400,000
$600,000
$800,000
$1,000,000
$1,200,000
$1,400,000
Valu
e of
Fin
anci
al A
sset
s for
a T
ypic
al R
etire
e
Age
1,000 Possible Future Market Returns Median Future Outcome
FIGURE 9b. What Happens if a Low-Fee, Low Non-Fee Solution Manages a Retiree’s Money (United Income)
65 70 75 80 85 90$0
$200,000
$400,000
$600,000
$800,000
$1,000,000
$1,200,000
$1,400,000
Valu
e of
Fin
anci
al A
sset
s for
a T
ypic
al R
etire
e
Age
1,000 Possible Future Market Conditions Median Future Outcome
FIGURE 9a. What Happens if a Low-Fee, High Non-Fee Solution Manages a Retiree’s Money (Discount Target Date Fund)
The Efficient Investor | 17
tion that reduces risk exposure as people age, an allocation that we have found to be common among investment advisors–and among money managers of retirees’ assets more generally. Due to both the higher cost (171 bps all in) and the limited focus on non-fee costs, this approach was the least success-ful at generating enough money to last through retirement.
We next considered what would happen if we took into account the fact that the discount TDF, average TDF, robo, and investment advisor approaches all were either silent on projected retirement liability or used generic assumptions that the GAO found were common in the market, like default replacement rates. If we assume that a household spends 80 percent of preretirement income in the absence of guidance from a retirement income solution, the only solution that generated a chance of success was
65 70 75 80 85 90$0
$200,000
$400,000
$600,000
$800,000
$1,000,000
$1,200,000
$1,400,000
Valu
e of
Fin
anci
al A
sset
s for
a T
ypic
al R
etire
e
Age
1,000 Possible Future Market Conditions Median Future Outcome
FIGURE 9d. What Happens if a High-Fee, High Non-Fee Solution Manages a Retiree’s Money (Sample Investment Advisor)
65 70 75 80 85 90$0
$200,000
$400,000
$600,000
$800,000
$1,000,000
$1,200,000
$1,400,000
Valu
e of
Fin
anci
al A
sset
s for
a T
ypic
al R
etire
e
Age
1,000 Possible Future Market Returns Median Future Outcome
FIGURE 9c. What Happens if a Low-Fee, High Non-Fee Solution Manages a Retiree’s Money (Robo)

The Efficient Investor | 18
the approach that minimizes non-fee costs, which was found to provide enough money for a retiree in the majority of the 1,000 market scenarios we tested. Assuming instead that retirees choose to spend four percent of their account balances at retirement for the rest of their lives, the chance of success improves for the other approaches. But the chance of success for the low non-fee solution is still four times higher than the lowest priced solution.
The differences across the solutions were even more stark for the typical higher income retiree, primar-ily because, in the absence of realistic spending advice, the rule-of thumb assumptions drive unsustain-able consumption through retirement. In particular, the typical wealthy retiree has over a 90 percent chance of success with the solution that takes the most number of steps to minimize non-fee costs. But the retiree has between a zero and 13 percent chance with the other low-fee solutions, assuming spending is at 80 percent of preretirement levels or four percent of the client’s financial account value at retirement. If you hold spending constant across the solutions, thus artificially reducing some of the non-fee costs, odds of success improve in all of the solutions, although the best performing solution is still the solution that minimizes non-fee costs.
In summary, we considered how five different retirement solutions fared for the typical and typical wealthy recent retiree in historically weak, average, and strong markets during their retirement, and with three different assumptions about future spending. In all cases, the approach that minimizes non-fee costs, including tax bills and stunted investment returns, generated enough wealth to cover spend-ing needs in the most number of potential future market environments, even though it has a higher fee. Cost, in short, is agnostic about its source, making no distinction between fees, tax bills, or lost money in the market. Added together, non-fee costs erode any wealth advantage generated from lower fees and can leave investors with less money compared to approaches that strive to minimize both fees and non-fee costs.
The typical retiree accumulated an average of 124 percent more wealth during retirement when using a solution with lower non-fee costs, compared to products that just have a low price. Improved financial outcomes were due to the greater relative use of public policies that can increase or protect income in retirement, as well as the use of more information to diversify a retiree’s finances to survive in a higher number of potential future market outcomes.
The final question we considered is how a retiree’s wealth accumulation would vary in retirement based on the solution used to manage money. To do this analysis, we took the average account balance of near-retirees and measured the net value of investment returns and tax bills generated from invest-ment accounts. This allowed us to isolate the added or lost financial value of the retirement solution, independent of savings and withdrawal decisions. We considered the same five retirement solutions reviewed in the previous section, including a wide variation in price, features, and non-fee costs that we found in our survey of 62 retirement and retirement income solutions. We then considered 26,000 different combinations of future market scenarios, from historically weak, average, and strong markets. This way, we were able to consider the impact of minimizing fees and non-fee costs in a broad range of potential future market scenarios.
As we found in previous sections, the solution that minimizes non-fee costs generated the most wealth for the typical retiree in the broadest range of potential future markets, even when compared to the lowest priced solution. In the median market out of the 26,000 future scenarios that we considered, the lowest non-fee cost solution generated between 88 and 159 percent more wealth in retirement compared to the low-fee solutions that also have high, potential non-fee costs. In particular, the av-

The Efficient Investor | 19
erage-priced target-date fund was predicted to generate about $189,000 in additional wealth for the typical retiree, who retires with a financial asset balance of about $400,000. The discount target-date fund approach with a 14 basis point fee generated about $220,000, exclusively through its lower prices, which allowed for more capital to remain invested over longer periods of time than the more expensive target-date fund. The robo solution was even better, generating $260,000 in additional wealth for the typical retiree in the median market, since it also focuses on some tax savings tactics. But the solution with the lowest non-fee costs generated over $460,000 in wealth for the typical retiree, or an average wealth gain that is 124 percent higher than the other low-fee approaches. As in the other analyses, these additional wealth gains were from the reduction of additional taxes not considered by the other solutions, such as the tax implications of withdrawing from different account types. More gains were also the product of more accurate risk measurement that took into account external income to offset the risk being taken in retirement to generate low-risk income for spending needs.
As in the previous analysis, we found that these differences were further magnified when we let spend-ing vary across the solutions, using instead default assumptions that the GAO found are common in the retirement market. For instance, the solution with the lowest non-fee costs was projected in the median market to generate between 300 and 450 percent more wealth for the typical near-retiree compared to low-fee, high non-fee solutions if households relied on the four percent rule. This difference increased by several times if we instead assumed that the retiree nominally spends 80 percent of pre-retirement income through retirement. But since it is impossible to know how consumers actually spend their money in the absence of any advice from their retirement income solution, we think the initial analysis where spending is held constant across the solutions is likely the most reliable way to assess the differ-ence between the solutions. However, it is important to keep in mind that this does not include most of the potential benefits of the low, non-fee cost approach, reviewed in the Methodology section, since these sources of variance in performance across solutions are held constant.
These results were replicated when we considered the relative financial outcomes of wealthier recent retirees. In particular, whether spending was held constant or assumed to be at a constant rate in the absence of guidance, the more efficient retirement solutions generated more wealth in the same amount of time relative to less efficient solutions. This was true of both low- and high-cost inefficient solutions. Here, too, the relative additional value of the efficient solution is generated because invest-ment risk is measured relatively more accurately and more tax efficiencies are utilized.
ConclusionThis paper considered 62 different retirement-focused investment products and wealth management services, and analyzed how the expected financial outcomes for retirees varied across a sample of those solutions. We found that most of the solutions we analyzed have relatively low fees. But most also create potentially high non-fee costs for their customers if used as a sole solution in retirement. These hidden expenses are generated from oversimplified or imprecise approaches to wealth management that can lead to higher than necessary tax bills, lower than possible investment returns, and less value from public benefits like Social Security or Medicare. When added together, reducing even a small sample of hidden non-fee costs, rather than just lowering investment fees, resulted in better financial outcomes for retir-ees. In particular, investment products and wealth management services with lower non-fee costs have a 42 percent greater chance of generating enough money for typical retirees, compared to products that only have a low relative price in a median market return scenario. The typical retiree also accumulated

The Efficient Investor | 20
an average of 124 percent more wealth during retirement when using a solution with lower non-fee costs, compared to products that just have a low price. These improved outcomes persisted in historically weak, average, and strong market environments and in a broad range of future spending scenarios. In short, financial outcomes improve for households by reducing taxes associated with investment management, improving the accuracy of investment allocations, and increasing the value of public benefits affected by investing decisions.
In response, we have a developed a new approach to investing and wealth management that we call Efficient Investing. Non-fee costs in retirement solutions act as a hidden hole in the wallet of house-holds that reduces the amount of wealth they can accumulate and can prevent them from having enough money to pay for their retirement expenses. In this way, these hidden non-fee costs reduce the efficiency of retirement solutions, since their potential to help investors is curbed by the higher costs they create for households, decreasing their balances and overall wealth. Plugging these holes in investing and wealth managment represents a commonsense way to help investors make more money for longer periods of time and are available to money managers in good and bad markets. In fact, the tax consequences of investment management become more important in extremely weak and strong markets.
The central principle of efficient investing is a belief that financial decisions are interconnected and operate in a unified system driven by individual, public, and market dynamics. By ignoring those inter-connections, as we have found is common in the market today, investment products and wealth man-agement services create inefficiencies that are costly to their customers and, for that matter, to their own bottom line as well. By accounting for how these dynamics interact with each other, we can create additional wealth for households that can be used to extend the longevity of their money in retire-ment. In this paper, for instance, we outlined how tax rates, investment returns, and the value of public benefits are dependent on investment and wealth management decisions. Taking those contingencies into account added wealth during retirement and, we found, was even more important than the fees of the product they relied on. With life continuing to extend in length, wringing these inefficiencies out of investment and wealth management will become increasingly important. We also anticipate that hid-den non-fee costs associated with investment products and wealth management services will become increasingly important as regulators and companies seek to define the best interest of a client.

The Efficient Investor | 21
Appendix 1
Retirement Solution
Advicent Naviplan Advizr AllianzGI Retirment Income Fund American Century One Choice In Retirement Portfolio American Funds Reitrement Income Portfolios Betterment RetireGuide BlackRock CoRI Funds BlackRock iRetire BlackRock LifePath Dynamic Retirment Fund BlackRock LifePath Index Retirement Fund BlackRock LifePath Smart Beta Retirement Fund BMO In-Retirement Fund Bucket Bliss ClearTrack Retirement Income Fund Dimensional Reitrement Income Fund Economic Security Planning Maxifi Economic Security Planning Planner eMoney Advisor Fidelity Advisor Freedom Income Fund Fidelity Deferred Income Annuity Fidelity Freedom Income Fund Fidelity Freedom Index Income Fund Fidelity Managed Retirement Income Fund Fidelity Multi-Manager Income Fund Investment Advisor Financial Engines Franklin LifeSmart Retirement Income Fund Franklin Payout Funds FutureAdvisor Harbor Target Retirement Income Fund Jhancock Multi-Index Income Preservation Portfolio
JPMorgan SmartRetirement Income Fund Manning and Napier Target Income Series Fd MFS Lifetime Income Fund Money Tree MoneyGuide Pro Morningstar Retirement Manager with Income Secure Personal Capital PIMCO RealPath Blend Income Fund PIMCO RealPath Income Fund Principal LifeTime Hybrid Income Fund Principal LifeTime Strategic Income Fud Prudential Day One Income Fund Putnam Retirment Income Lifestyle 1 Fund RetireUp RightCaptial Schwab Monthly Income Payout Funds Schwab Retirement Income Variable Annuity SigFig Retirement Income State Farm Lifepath Retirement Fund State Street Target Retirement Fund TIAA-CREF Lifecyle Retirement Income Fund United Income USAA Target Retirement Income Fund Vanguard Managed Payout Vanguard Target Retirement Income Voya Global Target Payment Voya Index Solution Income Portfolio Voya Single Premium Immediate Annuity Voya Solution Income Portfolio Wealthfront + Path Wells Fargo Target Today Fund

The Efficient Investor | 22
Appendix 2
Low Fee, High Non-Fee
Low Fee, Low Non-Fee
High Fee, High Non-Fee
Solution Discount Retirement Income Fund
Hybrid-Robo Average Target Date Fund
United Income Sample Investment Advisor and Product
Product Price 15 bps 15 bps 71 bps 18 bps 71 bps
Advice Price 0 25 bps 0 50 bps 100 bps
All-in Price 15 bps 40 bps 71 bps 68 bps 171 bps
Efficiency 0% 25% 0% 100% 0%
Investment Products
US/international stock and bond etfs
US/international stock and bond etfs
US/international stock and bond etfs
US/international stock and bond etfs
US/international stock and bond actively and passively managed funds
Strategy Glide Path in Retirement
Static Static Static Dynamic based on income, assets, and spending.
Static
Spending Estimate N.A. Percentage of Income
N.A. Personalized Estimate Based on Proprietary Model
Client provided
Longevity Esti-mate
N.A. Default is 90 N.A. Personalized Estimate Based on Proprietary Model
SSA Mortality Table (Gender)
Note: Efficiency is defined as the percentage of steps (defined in the Methodology section) that are taken by the provider to reduce non-fee costs.

The Efficient Investor | 23
Notes1 Michael Rawson and Ben Johnson, “2015 Fee Study: Investors Are Driving Expense Ratios Down,” Morningstar, Inc. (2015).
2 Lewis Braham, The House That Bogle Built: How John Bogle and Vanguard Reinvented the Mutual Fund Industry (New York: McGraw-Hill, 2011).
3 Rawson and Johnson, “2015 Fee Study.”
4 Securities and Exchange Commission, “How Fees and Expenses Affect Your Investment Portfolio,” Investor Bulletin, Office of Investor Education and Advocacy: https://www.sec.gov/investor/alerts/ib_fees_expenses.pdf
5 For this analysis, we only considered investment management solutions from companies that are managing at least $100M in assets as of September 2017 and are registered with the SEC; we also included financial planning solutions that were discovered using one of the processes defined in the Methods section.
6 This conclusion is based on the following benchmark data: Cerulli Associates estimates that the average investment advisor charges 100 bps; Morningstar estimates that the average simple average expense ratio (of the largest 2,000 funds) was 0.72% in 2016. For more, see Patricia Oey, “US Fund Fee Study: Average Fund Fees Paid by Investors Continued to Decline in 2016,” Morningstar, Inc. (2017); Cerulli Associates, “US Advisor Metrics 2016: Combatting Fee and Margin Pressure,” The Cerulli Report.
7 This is addressed in more detail in the Methodology section of this paper.
8 This point has been made by others. See, for instance, David Blanchett and Philip Straehl, “No Portfolio Is an Island” Morn-ingstar, Inc. (2014).
9 Survey of Consumer Finances, 2013, Board of Governors of the Federal Reserve System.
10 US Government Accountability Office, “Retirement Security: Better Information on Income Replacement Rates Needed to Help Workers Plan for Retirement,” GAO-16-242 (March 2016) . On spending trends, see, for instance, Matt Fellowes,“Living Too Frugally? Economic Sentiment & Spending Among Older Americans,” United Income (2017); Sudipto Banerjee “Change in Household Spending After Retirement: Results From a Longitudinal Sample,” EBRI, Issue Brief no. 420 (November 2015); Emma Aguila, Orazio Attanasio, and Costas Meghir, “Changes in Consumption at Retirement: Evidence From Panel Data.” Review of Economics and Statistics, 93(3) (July 2011): 1094-1099; Michael Hurd and Susan Rohwedder, “The Retirement Con-sumption Puzzle: Actual Spending Change in Panel Data,” NBER Working Paper no. 13929 (2008); David Blanchett, “Estimat-ing the True Cost of Retirement,” Morningstar, Inc.., White Paper (November 2013).
11 Sebastian Devlin-Foltz and John Sabelhaus, “Heterogeneity in Economic Shocks and Household Spending,” Finance and Economics Discussion Series, Divisions of Research & Statistics and Monetary Affairs, Federal Reserve Board (2015); G. Nathan Dong, “Informal Bankruptcy: Health Expenditure Shocks and Financial Distress Avoidance,” Columbia University Working Paper (July 2014).
12 For instance, the Federal Reserve Board triannual survey of consumer finances asks for savings contribution data for only some of the accounts owned by households.
13 The distinction between typical and average is important. Although we took the average balances for different account types held by this group, that average is not necessarily a description of an actual average person, since account ownership and utilization is variable across the sample of US households. For this reason, we use averages to characterize a typical house-hold, but avoid the mathematically precise word “average” wherever possible.
14 Other accounts include accounts like pensions, cash value of annuities, and CDs, among other types.
15 “The Robo Report,” Q2 2017; “Best Mutual Funds: Target-Date Retirement,” US News & World Report; “Financial Advisor’s Guide to Choosing The Best Financial Planning Software (For You),” Kitces.com; and Google searches for: robo advisor retire-ment; retirement income; retirement income solution; deaccumulation products; deaccumulation advice; retirement income fund; managed payout fund; and financial planning software.

The Efficient Investor | 24
16 Across the 62 different investment products and wealth management services we reviewed, most investment strategies followed an index-based, market-capitalization weighted approach. However, some solutions incorporated a home bias to-ward the US or had limited exposure to emerging markets. The United Income approach is globally diversified with no home bias and includes exposure to factor, or “smart beta,” investment strategies. The investment strategy for the chosen sample solutions is based on their reported asset allocation and investment selection.
17 Since relative price comparisons across different pricing models are difficult, and the vast majority of the solutions we exam-ined use a basis point pricing model, this figure only includes solutions that use basis point pricing.
18 Average financial advice prices are from Cerulli Associates; average product prices are from Morningstar, Inc.
19 Milton Friedman, A Theory of the Consumption Function: The Permanent Income Hypothesis (Princeton, NJ: Princeton University Press, 1957). The academic basis for that claim stems from the influential work in the 1870s by a trio of econo-mists who argued that individuals maximize their quality of life, or utility, and are fully informed about their preferences and prospects for the future: W.S. Jevons, The Theory of Political Economy (London: Macmillan and Company, 1871); Carl Menger, Principles of Economics (1871. Republished New York: New York University Press, 1981); Leon Walras, Elements of Pure Economics (1874. Republished by Routledge).
20 Jacob Mincer, “Investment in Human Capital and Personal Income Distribution,” Journal of Political Economy, vol. 66, issue 45 (1958); Gary S. Becker, “Investment in Human Capital: A Theoretical Analysis,” Journal of Political Economy, vol. 70, issue 5 (1962); Joseph T. Williams, “Risk, Human Capital, and the Investor’s Portfolio,” The Journal of Business, vol. 51, issue 1 (1978). Also see W.T. Schultz, “Investment in Human Capital,” The American Economic Review, vol. 51, issue 1 (1961).
21 Harry Markowitz, “Portfolio Selection,” The Journal of Finance, vol. 7, issue 1; J. Tobin, “Liquidity Preference as Behavior Towards Risk,” The Review of Economic Studies, vol. 25, issue 2 (1961).
22 Dell EMC and VMware, “The State of IT Transformation for Financial Services.” Also see: Nagendra Bommadevara, James Ka-plan, and Irina Starikova.,“Leaders and Laggards in Enterprise Cloud Infrastructure Adoption,” McKinsey & Company (2016).
23 There is a lot of literature here. See, for instance, John Y. Campbell, “Restoring Rational Choice: The Challenge of Consumer Financial Regulation,” American Economic Review: Papers & Proceedings (1961); Annamaria Lusardi and Olivia S. Mitchell, “Financial Literacy and Retirement Preparedness: Evidence and Implications for Financial Education,” Business Economics, vol. 42, issue 1 (2007).
24 This was the maximum amount that we could increase the efficiency by, since most of the components of efficiency had to be held constant across the solutions–e.g., we could not use the ability of the efficient solution to optimize Social Security and retirement dates, since this would have created an exogenous dependency on human behavior, which would have biased the results in favor of the efficient model. Importantly, this means we are underestimating the impact of the efficient approach throughout this analysis. Please refer to the Methodology section for more detail.
25 United Income. We decided to stay silent on the other solutions we tested, but do list out all 62 different retirement or retire-ment income solutions we tested in Appendix 1.

The Efficient Investor | 25
About the AuthorsMatt Fellowes is the founder and CEO of United Income. Prior to founding United Income, Matt was the Chief Innovation Officer at Morningstar and the founder and CEO of HelloWallet, an award-winning fi-nancial guidance software company acquired by Morningstar Inc. in 2014. He currently sits on the Board of Directors of Fellowes Inc. and the Advisory Board of the Stanford Center on Longevity. A native of Chicago, he holds a PhD from the University of North Carolina at Chapel Hill, an MPP from Georgetown University, and a B.A. from St. Lawrence University.
Lara Langdon is the Director of Methodology at United Income. Lara joined United Income with 10 years of experience in algorithm development and combinatorial optimization. Previously, Lara taught mathematics at George Washington University. She holds a Ph.D. in Mathematics from George Washing-ton University and a B.S. from the American University in Cairo.
Lincoln Plews is a Research Assistant at United Income. Previously, Lincoln worked as a field organiz-er for Hillary for America in Ohio and served as a fellow with Princeton in Asia in Shanghai, China. He has also interned with Sen. Joe Donnelly, Sen. Sherrod Brown, and Raymond James Financial. Lincoln holds a B.A. from The College of Wooster.
Davey Quinn is the Director of Investments at United Income. Previously, he served as a portfolio man-ager for Dimensional Fund Advisors. He has an MBA in Analytical Finance from The University of Chicago Booth School of Business, and a B.S. in Mechanical Engineering from Carnegie Mellon University.
About United IncomeUnited Income is a wealth management solution that extends the life and potential of money to com-pliment the innovations that have extended human life. Our unified system of wealth management reflects a deeply held belief that financial decisions are interconnected. New data and technology allow us to observe and understand these relationships in new ways. We translate that unique understand-ing into powerful and personalized wealth management for our members that brings their retirement dreams to life.
Our team brings decades of experience leading the finance and technology markets. We have written or overseen the laws governing the retirement and financial markets in places like the White House and Department of Treasury, helped to invent technologies that have changed the world at places like Amazon and Tesla, and won awards like the Webby for the best financial software website in the world. We are all at United Income to pursue the ambitious goal of understanding how the consumer finance world works as a unified system. This unique understanding of how the world works allows us to bring hope, meaning, simplicity, and empowerment to our members.