Embed Size (px)
Citation preview

The efficacy of an antimicrobial peptide-
polymer gel preparation on common
endodontic pathogens
Shreya Aggarwala
A thesis submitted in partial fulfilment for the degree of
Doctor of Clinical Dentistry in Endodontics
University of Otago, Dunedin, New Zealand
2016
ii
Abstract
Background: Reduction of the microbial load within the root canal system and intraradicular
dentine to an acceptable level is crucial for successful endodontic therapy. Mechanical
debridement significantly reduces the bacterial load, however, the adjunctive use of
antimicrobial agents can further reduce the number of viable microorganisms. Currently used
irrigants and medicaments have the potential to be cytotoxic by causing local tissue irritation
or hypersensitivity. Antimicrobial peptides are polypeptides which can possess a broad-
spectrum of antimicrobial activity providing a host defence system to combat infections whilst
being minimally toxic to host cells. BM2 is a D-decameric cationic peptide. The antimicrobial
potential of BM2 in a medium suitable for use as an intracanal medicament needs to be
investigated.
Aim: The aim of the present study was to assess the in vitro antimicrobial efficacy of BM2 in
an injectable polymer gel matrix against common endodontic pathogens.
Materials and Methods: Strains of Candida albicans, Streptococcus gordonii, Streptococcus
mutans, and Enterococcus faecalis were grown from frozen glycerol stocks and confirmed.
Dilutions of BM2 were prepared in aqueous solution and the minimum inhibitory concentration
(MIC) determined using the broth microdilution assay. The minimum bactericidal/fungicidal
concentration (MBC/MFC) was established by subculturing the broth dilution onto culture
media. Poloxamer 407 (P407) gels, at 25% (w/v) were loaded with BM2 and the gel stability
evaluated. The in vitro release profile of BM2 from the P407 formulations and the gel
dissolution profile were obtained. The antimicrobial efficacy of BM2 in a P407 gel formulation
was assessed on planktonic cell cultures and on 24 h monospecies biofilms using a crystal violet
biofilm assay over 72 h. Comparisons were made between BM2 in aqueous solution, P407 gel
alone, BM2 in P407 gel formulations, and saturated calcium hydroxide.
Results: Aqueous BM2 at 128 µg/mL completely inhibited the growth of all four strains after
24 h exposure. S. mutans NG8 was the most susceptible (MIC 4 µg/mL, MBC 8 µg/mL) while
E. faecalis JH2-2 was the least susceptible (MIC 64 µg/mL). P407 gels containing BM2 were

iii
prepared with no marked alteration to the stability of P407. BM2 release increased with time
and demonstrated a linear correlation with P407 dissolution. BM2 retained its antimicrobial
activity when incorporated into P407 gels exhibiting bacteriostatic activity. S. mutans NG8 was
the most susceptible to P407 with BM2 (MIC 32 µg/mL) while E. faecalis JH2-2 was the most
resistant (MIC >512 µg/mL). The MIC values of BM2 in P407 were 8-fold higher than those
required for aqueous BM2 and although higher concentrations were required, it demonstrated
more sustained effects on cell cultures over 72 h. BM2 incorporated into P407 gels gave dose-
dependent growth impairment and significantly disrupted biofilm detachment at 512 µg/mL.
Saturated calcium hydroxide inhibited growth of the S. mutans 24 h biofilm, slowed growth of
S. gordonii and C. albicans biofilms, but was ineffective against the E. faecalis biofilm.
Conclusions: BM2 in a P407 gel possesses antimicrobial activity against planktonic cultures
and monospecies biofilms of C. albicans, S. gordonii, S. mutans and E. faecalis at
concentrations 8-fold higher than that in solution. Antimicrobial activity was greater than
saturated calcium hydroxide. Within the limitations of this study, BM2 in a polymer gel has
demonstrated potential for use as an antimicrobial agent in the treatment of root canal
infections.

iv
Acknowledgements
This study was supported by the Fuller Scholarship, Sir John Walsh Research Institute,
University of Otago over the years 2014-2016.
First and foremost, I would like to express my sincerest gratitude to my primary supervisor,
Professor Robert Love, for his continuous support throughout my research and the program. It
has been such a privilege to be under your tutelage. Your immense knowledge, dedication, and
enthusiasm for endodontics and research is contagious. Without your hard work and patience,
this work would not have been possible.
I would also like to thank my secondary supervisor, Dr Brian Monk. I appreciate your diligence
and valuable guidance. You provided me with direction and support in the Molecular
Biosciences Laboratory and remained patient throughout the entire process. You certainly have
instilled in me a passion for research.
To Dr Shakila Rizwan, Dr Sharan Bobbala, and Sasi Yarragudi from the School of Pharmacy:
your help was invaluable and without it, the experiments could not have gone ahead.
To my colleagues and friends, thank you for your companionship and collegiality throughout
the program. To Arpana, I am grateful to have gone through this program with you. All those
endless hours in the laboratory would not have been the same. I could not have picked a better
person to share this journey with.
Last but not least, a special thanks to my family. To my parents, your unconditional love and
support is what has gotten me through this. You have always given me the confidence and
encouragement that I can achieve whatever I put my mind to. You are a true inspiration. To my
sisters, thank you for sticking by me and keeping me sane.
This has been an amazing journey and I look forward to what the next chapter holds in store.

v
Table of Contents
Abstract ............................................................................................................... ii
Acknowledgements ............................................................................................ iv
Table of Contents ................................................................................................v
List of Tables ...................................................................................................... ix
List of Figures .................................................................................................... xi
List of Abbreviations ........................................................................................ xv
Chapter 1: Introduction ...................................................................................1
Chapter 2: Literature Review ..........................................................................3
2.1 Overview of root canal microbiology ....................................................................... 3
2.1.1 Post-treatment disease .......................................................................................... 5
2.1.2 Biofilms ................................................................................................................ 6
2.1.3 Invasion of dentinal tubules .................................................................................. 7
2.2 Root canal medication ............................................................................................... 9
2.2.1 Calcium hydroxide ............................................................................................. 10
2.2.2 Ledermix® paste .................................................................................................. 11
2.2.3 Odontopaste® ...................................................................................................... 12
2.3 Antimicrobial peptides ............................................................................................ 12
2.3.1 Mechanism of action .......................................................................................... 14
2.3.2 Relevance of AMPs to dentistry ......................................................................... 19
2.3.3 BM2 .................................................................................................................... 20
2.4 Hydrogels .................................................................................................................. 22
2.4.1 Poloxamer 407 .................................................................................................... 24
2.4.2 In vitro stability testing ....................................................................................... 27
2.4.3 In vitro release studies ........................................................................................ 27
2.5 In vitro testing ........................................................................................................... 27

vi
2.5.1 Confirmation of bacterial strains ........................................................................ 27
2.5.2 Planktonic cells ................................................................................................... 28
2.5.3 Biofilms .............................................................................................................. 29
2.6 Aims ........................................................................................................................... 31
2.7 Hypotheses ................................................................................................................ 31
Chapter 3: Materials and methods .............................................................. 32
3.1 Selection of microbes ............................................................................................... 32
3.2 Selection and preparation of growth media .......................................................... 33
3.2.1 Agar plates .......................................................................................................... 33
3.2.2 Broths ................................................................................................................. 35
3.3 Confirmation of species ........................................................................................... 36
3.3.1 Bacterial species ................................................................................................. 36
3.3.2 Fungal species .................................................................................................... 38
3.4 Preparation of glycerol stocks ................................................................................ 38
3.5 Preparation of inocula ............................................................................................. 39
3.5.1 Bacterial inoculums ............................................................................................ 39
3.5.2 Fungal inoculums ............................................................................................... 39
3.6 Preparation of antimicrobial solutions .................................................................. 39
3.6.1 Preparation of BM2 ............................................................................................ 39
3.6.2 Preparation of calcium hydroxide....................................................................... 40
3.6.3 Preparation of polymer gel ................................................................................. 40
3.7 Antimicrobial concentrations of BM2 .................................................................... 42
3.7.1 Minimum inhibitory concentration ..................................................................... 42
3.7.2 Minimum bactericidal and fungicidal concentration .......................................... 43
3.8 Susceptibility testing of microbial cells .................................................................. 43
3.8.1 Planktonic cells ................................................................................................... 43
3.8.2 Monospecies biofilms ......................................................................................... 44

vii
3.9 Statistical analysis .................................................................................................... 45
Chapter 4: Results ......................................................................................... 47
4.1 Poloxamer 407 .......................................................................................................... 47
4.1.1 Formulation characterisation .............................................................................. 47
4.1.2 In vitro gel stability studies ................................................................................ 47
4.1.3 In vitro gel release studies .................................................................................. 48
4.2 Minimum inhibitory concentration of aqueous BM2 ........................................... 50
4.2.1 Candida albicans ................................................................................................. 50
4.2.2 Streptococcus gordonii ....................................................................................... 51
4.2.3 Streptococcus mutans ......................................................................................... 52
4.2.4 Enterococcus faecalis ......................................................................................... 53
4.3 Minimum fungicidal and bactericidal concentration ........................................... 54
4.4 Minimum inhibitory concentration of BM2-loaded P407 gel .............................. 55
4.4.1 Candida albicans ................................................................................................. 56
4.4.2 Streptococcus gordonii ....................................................................................... 56
4.4.3 Streptococcus mutans ......................................................................................... 57
4.4.4 Enterococcus faecalis ......................................................................................... 58
4.5 Susceptibility testing of planktonic cells ................................................................ 59
4.5.1 Candida albicans ................................................................................................. 60
4.5.2 Streptococcus gordonii ....................................................................................... 62
4.5.3 Streptococcus mutans ......................................................................................... 65
4.5.4 Enterococcus faecalis ......................................................................................... 68
4.6 Susceptibility testing of monospecies biofilms ....................................................... 70
4.6.1 Candida albicans ................................................................................................. 70
4.6.2 Streptococcus gordonii ....................................................................................... 73
4.6.3 Streptococcus mutans ......................................................................................... 75
4.6.4 Enterococcus faecalis ......................................................................................... 78

viii
4.6.5 Summary ............................................................................................................. 80
Chapter 5: Discussion .................................................................................... 81
5.1 Poloxamer gel formulation ...................................................................................... 81
5.2 Planktonic cell cultures ........................................................................................... 83
5.3 Antimicrobial activity against monospecies biofilms ........................................... 85
5.4 Experimental design and limitations ...................................................................... 86
5.5 Future research ........................................................................................................ 88
5.5.1 Antimicrobial efficacy ........................................................................................ 88
5.5.2 Poloxamer 407 .................................................................................................... 90
5.5.3 BM2 .................................................................................................................... 90
5.5.4 Toxicity ............................................................................................................... 90
5.6 Conclusions ............................................................................................................... 91
References ......................................................................................................... 92
Appendices ...................................................................................................... 118

ix
List of Tables
Table 3.1 Microorganism panel………….……….……….……….……….………………...32
Table 3.3.1 Components of PCR.……….……….……….……….…….…….…….………...36
Table 4.2 MIC values of BM2..…….….……….……….……….…….…….…….………….50
Table 4.3 MFC/MBC values of BM2. ..…….….……….……….……….…….…….……….55
Table 4.4 MIC values of BM2-loaded P407 gel.……….……….……….…….…….………..55
Table 4.6.1a C. albicans biofilm biomass following exposure to varying concentrations of BM2
in P407 over 72 hours and representative microtitre plate wells with crystal violet stain after
exposure for 72 hours. The OD values are mean ± standard deviation where n=15.….………..71
Table 4.6.1b C. albicans biofilm biomass following exposure to controls over 72 hours and
representative microtitre plate wells with crystal violet stain after exposure for 72 hours. The
OD values are mean ± standard deviation where n=15..……….……….…….…….…………72
Table 4.6.2a S. gordonii biofilm biomass following exposure to varying concentrations of BM2
in P407 over 72 hours and representative microtitre plate wells with crystal violet stain after
exposure for 72 hours. The OD values are mean ± standard deviation where n=15..….……….73
Table 4.6.2b S. gordonii biofilm biomass following exposure to controls over 72 hours and
representative microtitre plate wells with crystal violet stain after exposure for 72 hours. The
OD values are mean ± standard deviation where n=15..……….……….…….…….…………74
Table 4.6.3a S. mutans biofilm biomass following exposure to varying concentrations of BM2
in P407 over 72 hours and representative microtitre plate wells with crystal violet stain after
exposure for 72 hours. The OD values are mean ± standard deviation where n=15……………76
Table 4.6.3b S. mutans biofilm biomass following exposure to controls over 72 hours and
representative microtitre plate wells with crystal violet stain after exposure for 72 hours. The
OD values are mean ± standard deviation where n=15...……….……….…….…….………...77
Table 4.6.4a E. faecalis biofilm biomass following exposure to varying concentrations of BM2
in P407 over 72 hours and representative microtitre plate wells with crystal violet stain after
exposure for 72 hours. The OD values are mean ± standard deviation where n=15.…………78

x
Table 4.6.4b E. faecalis biofilm biomass following exposure to controls over 72 hours and
representative microtitre plate wells with crystal violet stain after exposure for 72 hours. The
OD values plotted are ± standard deviation where n=15.…….…….…….…………………..79
Table A1 Concentrations of BM2 after serial dilutions with theoretical and experimental
absorbance values attained at 280 nm.….……….……….……….…….…….…….………..118
Table H1 Difference in absorbance after exposure to varying concentrations for aqueous
BM2 for 24 hours. The OD values plotted are mean ± standard deviation.…….…….…….126
Table H2 Difference in absorbance after exposure to varying concentrations of BM2-loaded
P407 gels for 24 hours. The OD values plotted are mean ± standard deviation.…….……...126
Table I1 Absorbance values attained at 600 nm for C. albicans ATCC 10261 after exposure to
aqueous BM2. The OD values plotted are mean ± standard deviation.…….…….…………..127
Table I2 Absorbance values attained at 600 nm for C. albicans ATCC 10261 after exposure to
BM2-loaded P407 gels. The OD values plotted are mean ± standard deviation..…….………127
Table J1 Absorbance values attained at 600 nm for S. gordonii DL1 after exposure to aqueous
BM2. The OD values plotted are mean ± standard deviation………………………………...128
Table J2 Absorbance values attained at 600 nm for S. gordonii DL1 after exposure to BM2-
loaded P407 gels. The OD values plotted are mean ± standard deviation…………………….128
Table K1 Absorbance values attained at 600 nm for S. mutans NG8 after exposure to aqueous
BM2. The OD values plotted are mean ± standard deviation………………………………...129
Table K2 Absorbance values attained at 600 nm for S. mutans NG8 after exposure to BM2-
loaded P407 gels. The OD values plotted are mean ± standard deviation..…….……………..129
Table L1 Absorbance values attained at 600 nm for E. faecalis JH2-2 after exposure to aqueous
BM2. The OD values plotted are mean ± standard deviation………………………………...130
Table L2 Absorbance values attained at 600 nm for E. faecalis JH2-2 after exposure to BM2-
loaded P407 gels. The OD values plotted are mean ± standard deviation..…….……………..130

xi
List of Figures
Figure 2.3.1.1 Barrel-stave model……..………………………………………..……………16
Figure 2.3.1.2 Toroidal pore model………………………………..………..………….........17
Figure 2.3.1.3 Carpet model………………………………...………..………..……………..18
Figure 2.4 Structure of polymer gels.………..………..………..………..………..………….23
Figure 2.4.1 Poloxamer gelation……………………………………….………..…………...24
Figure 2.4.2 Crystalline structures produced with the varying concentrations of P407..........25
Figure 4.1.2 In vitro gel stability of triblock copolymer hydrogel (P407) at 37°C in PBS over
time. The values plotted are mean ± standard deviation where n=9.………..………………..48
Figure 4.1.3a Time dependence of in vitro release of BM2 from P407 in PBS at 37°C. The
percentages shown are calculated as a proportion of the initial BM2 loaded into P407 gel (400
µg/mL). The values plotted are mean ± standard deviation where n=9.…..………………….49
Figure 4.1.3b Correlation between gel dissolution and cumulative release of BM2 in PBS at
37°C…………………….…………………….…………………….………………………...49
Figure 4.2.1 Growth of C. albicans ATCC 10261 after 24 hour exposure to varying
concentrations of aqueous BM2. The OD values plotted are mean ± standard deviation where
n=21…...………………….…………………….…………………….………………………51
Figure 4.2.2 Growth of S. gordonii DL1 after 24 hour exposure to varying concentrations of
aqueous BM2. The OD values plotted are mean ± standard deviation where n=21……………52
Figure 4.2.3 Growth of S. mutans NG8 after 24 hour exposure to varying concentrations of
aqueous BM2. The OD values plotted are mean ± standard deviation where n=21………….53
Figure 4.2.4 Growth of E. faecalis JH2-2 after 24 hour exposure to varying concentrations of
aqueous BM2. The OD values plotted are mean ± standard deviation where n=21………….54
Figure 4.4.1 Growth of C. albicans ATCC 10261 after 24 hour exposure to varying
concentrations of BM2 in P407 gel. The OD values plotted are mean ± standard deviation
where n=15.……………….…………………….…………………………………………….56

xii
Figure 4.4.2 Growth of S. gordonii DL1 after 24 hour exposure to varying concentrations of
BM2 in P407 gel. The OD values plotted are mean ± standard deviation where n=15………57
Figure 4.4.3 Growth of S. mutans NG8 after 24 hour exposure to varying concentrations of
BM2 in P407 gel. The OD values plotted are mean ± standard deviation where n=15………58
Figure 4.4.4 Growth of E. faecalis JH2-2 after 24 hour exposure to varying concentrations of
BM2 in P407 gel medium. The OD values plotted are mean ± standard deviation where
n=15…………………………………………………………………………………………..59
Figure 4.5.1a Growth of C. albicans ATCC 10261 after exposure to P407 gel, P407 gel with
256 µg/mL and 512 µg/mL, and controls (calcium hydroxide and sterile water) over 72 hours.
The OD values plotted are mean ± standard deviation where n=15……………………………60
Figure 4.5.1b Growth of C. albicans ATCC 10261 after exposure to 256 µg/mL BM2
incorporated into P407 compared to corresponding aqueous concentrations over 72 hours. The
OD values plotted are mean ± standard deviation where n=15………………………………61
Figure 4.5.1c Growth of C. albicans ATCC 10261 after exposure to 512 µg/mL BM2 in P407
compared to corresponding concentrations in solution over 72 hours. The OD values plotted
are mean ± standard deviation where n=15……………………………………………………62
Figure 4.5.2a Growth of S. gordonii DL1 after exposure to P407 gel, P407 gel with 128 µg/mL,
256 µg/mL and 512 µg/mL, and controls (calcium hydroxide and sterile water) over 72 hours.
The OD values plotted are mean ± standard deviation where n=15……………………………63
Figure 4.5.2b Growth of S. gordonii DL1 after exposure to 128 µg/mL BM2 in P407 compared
to corresponding concentrations in solution over 72 hours. The OD values plotted are mean ±
standard deviation where n=15………………………………………………………………..64
Figure 4.5.2c Growth of S. gordonii DL1 after exposure to 256 µg/mL BM2 in P407 compared
to corresponding concentrations in solution over 72 hours. The OD values plotted are mean ±
standard deviation where n=15………………………………………………………………..65
Figure 4.5.3a Growth of S. mutans NG8 after exposure to P407 gel, P407 gel with 16 µg/mL,
32 µg/mL and 64 µg/mL, and controls (calcium hydroxide and sterile water) over 72 hours. The
OD values plotted are mean ± standard deviation where n=15………………………………...66

xiii
Figure 4.5.3b Growth of S. mutans NG8 after exposure to 32 µg/mL BM2 in P407 compared
to corresponding aqueous concentrations over 72 hours. The OD values plotted are mean ±
standard deviation where n=15………………………………………………………………..67
Figure 4.5.4a Growth of E. faecalis JH2-2 after exposure to P407 gel, P407 gel with 256 µg/mL
and 512 µg/mL, and controls (calcium hydroxide and sterile water) over 72 hours. The OD
values plotted are mean ± standard deviation where n=15…………………………………….68
Figure 4.5.4b Growth of E. faecalis JH2-2 after exposure to 512 µg/mL BM2 in P407
compared to corresponding aqueous concentrations over 72 hours. The OD values plotted are
mean ± standard deviation where n=15………………………………………………………..69
Figure 4.6.1 C. albicans biofilm biomass following exposure to experimental agents and
controls for 72 hours. The OD values plotted are mean ± standard deviation where n=15…..72
Figure 4.6.2 S. gordonii biofilm biomass following exposure to experimental agents and
controls for 72 hours. The OD values plotted are mean ± standard deviation where n=15…..75
Figure 4.6.3 S. mutans biofilm biomass following exposure to experimental agents and
controls for 72 hours. The OD values plotted are mean ± standard deviation where n=15. …77
Figure 4.6.4 E. faecalis biofilm biomass following exposure to experimental agents and
controls for 72 hours. The OD values plotted are mean ± standard deviation where n=15…….80
Figure A1 Standard curve of BM2. The values plotted are the theoretical and experimental
absorbance values attained at 280 nm……………………………………………………….119
Figure B1 Microtitre plate set up to assess minimum inhibitory concentrations of aqueous
BM2……………………………………………………………………...………………….120
Figure C1 Microtitre plate set up to assess minimum inhibitory concentrations of BM2-loaded
P407 gels…………………………………………………………………………….………121
Figure D1 Microtitre plate set up to assess antimicrobial activity of BM2-loaded P407 gels
against planktonic cultures…………………………………………………………….…….122
Figure E1 Microtitre plate set up to assess antimicrobial activity of aqueous BM2 against
planktonic cultures…………………………………………………………………………..123
Figure F1 Microtitre plate set up to assess antimicrobial activity of BM2-loaded P407 gels
against monospecies biofilms. Separate plates were set up for each exposure period……...124

xiv
Figure G1 Microtitre plate set up to assess antimicrobial activity of aqueous BM2 against
monospecies biofilms. Separate plates were set up for each exposure period…………...….125

xv
List of Abbreviations
AMP Antimicrobial peptide
ANOVA Analysis of variance test
ATCC American Type Culture Collection
ATP Adenosine triphosphate
BHY Brain heart yeast infusion
bp Base pair
Ca(OH)2 Calcium hydroxide
CBA Columbia sheep blood agar
CFU Colony forming units
CLSM Confocal laser scanning microscopy
cm Centimetres
CSM Complete supplement mixture
CV Crystal violet
d Days
dH2O Distilled water
DNA Deoxyribonucleic acid
Ɛ Molar absorption coefficient
EDTA Ethylenediamenetetraacetic acid
g Grams
h Hours
HCl Hydrochloric acid
HEPES 4-(2-hydroxyethyl)-1-piperazineethanesulfonic acid
HSD Honest significant difference
L Litres
M Mole
MBC Minimum bactericidal concentration
MES 2-(N-morpholino)ethanesulfonic acid
MFC Minimum fungicidal concentration
mg Milligram
MIC Minimum inhibitory concentration
min Minutes
mL Millilitre

xvi
mm Millimetre
mM Millimole
MSM Mutans selective media
ng Nanograms
nm Nanometres
OD Optical density
P407 Poloxamer 407
PBS Phosphate buffered saline
PCR Polymerase chain reaction
PEO Polyoxyethylene
pH Potential of hydrogen
PPO Polyoxypropylene
RNA Ribonucleic acid
rRNA Ribosomal ribonucleic acid
SD Synthetic defined
sec Seconds
sp/spp Species
TRIS Tris(hydroxymethyl)aminomethane
TSB Tryptic soy broth
µg Micrograms
µL Microlitres
µm Micrometres
µM Micromoles
UV Ultraviolet
vol/vol Volume by volume
w/v Weight by volume
x g Centrifugal force
YPD Yeast extract peptone dextrose
°C Degrees Celsius

1
Chapter 1: Introduction
Microorganisms play a vital role in the development and progression of pulp and periapical
disease (Kakehashi et al. 1965, Möller et al. 1981). Reduction of the microbial load within the
root canal system and intraradicular dentine to an acceptable level is crucial for successful
endodontic therapy. This is accomplished through mechanical debridement and chemical
irrigation, which aims to remove vital or necrotic tissue and eliminate infection (Byström &
Sundqvist 1981, Vertucci 1984). Microorganisms have the ability to survive in areas not
directly accessible to conventional methods of cleaning and shaping. Once in the root canal
system, bacteria can invade radicular dentinal tubules where they are shielded from
instrumentation and irrigation. The placement of intracanal medicaments may facilitate further
disinfection of the complex root canal system and radicular dentinal tubules between
appointments (Byström et al. 1985, Sjögren et al. 1991, Shuping et al. 2000).
Persistent or emerging post-treatment disease can, however, occur despite thorough chemo-
mechanical debridement and the placement of antimicrobial dressings (Nair et al. 1990, Nair
2004). Species such as Enterococcus faecalis have frequently been isolated from root canals of
teeth that have undergone root canal treatment, even under the most ideal conditions (Molander
et al. 1998, Sundqvist et al. 1998). It has been found to show resistance to most intracanal
medicaments, particularly calcium hydroxide (Byström et al. 1985).
Current intracanal medicaments used are toxic to the host tissues or have a limited bactericidal
effect. The development of an antimicrobial agent with low host toxicity and which is effective
at reducing the microbial load in biofilms would be advantageous.
Antimicrobial peptides (AMPs) are a diverse group of molecules expressed by many life forms
in host defence settings (Brogden 2005). They are important effector molecules and a major
component of the innate immune system of most living organisms (Jenssen et al. 2006). Various
AMPs have been studied as alternative antibiotics due to their potency, rapid onset of action,
and broad-spectrum activity against gram-negative and gram-positive bacteria, viruses, fungi,
and parasites (Dosler & Mataraci 2013). Due to their antimicrobial selectivity and unique mode
of action, these peptides can be promising candidates for the development of a new class of
antimicrobials.
Preliminary studies using the synthetic cationic peptide, BM2, in solution found microbicidal
activity against planktonic cultures and biofilms of endodontic pathogens. The clinical

2
suitability of an aqueous delivery system may, however, be compromised in a root canal model.
In situ polymer gel-forming systems have been used to prolong the residence time of drugs and
improve bioavailability. The thermoresponsive class of gels provides the advantage of
convenient administration by involving a phase transition upon change in temperature. The use
of a thermoresponsive gel may be beneficial for delivery of an antimicrobial into the root canal
system for use as an intracanal medicament. The aim of this thesis is to evaluate the in vitro
antimicrobial efficacy of BM2 in a thermoresponsive gel matrix.
The next chapter of this thesis will include a review of the literature including an overview of
root canal microbiology, intracanal medications used in endodontics, antimicrobial peptides,
thermoresponsive hydrogels as carriers, and the in vitro tests used to assess the efficacy of this
antimicrobial peptide.

3
Chapter 2: Literature Review
2.1 Overview of root canal microbiology
The oral cavity is populated by a diverse range of bacteria with the vast majority being
considered harmless. Most of these are tolerated by our immune system. Some species may be
opportunistic under certain conditions, resulting in various diseases including pulp and
periradicular disease. The occurrence of disease depends on the virulence of the
microorganisms, its population, and the resistance of the host. Strategies to control such disease
must be based on a thorough knowledge of their microbiological basis.
The role of bacteria in the pathogenesis of endodontic infections has been extensively studied.
Bacteria have been shown to be essential for the progression of apical periodontitis (Möller et
al. 1981, Fabricius et al. 1982a, Ricucci & Siqueira Jr 2010). Kakehashi et al. (1965)
demonstrated that pulp and periapical disease developed in surgically exposed rat molar pulps
only when bacteria were present in the oral cavity. In a germ-free environment on the other
hand, exposed pulps remained healthy and demonstrated a reparative response involving
dentinogenesis.
The oral microflora has over 700 indigenous species but only a finite group are responsible for
infection of the pulp. It was initially thought that gram-positive aerobic bacteria were the most
prevalent microorganisms in infected pulps. However, this was due to the use of aerobic
incubation chambers which favoured the growth of facultative aerobes and hence, anaerobic
species such as Staphylococcus and Bacteroides were less frequently isolated (Leavitt et al.
1958). Environmental and symbiotic relationships within the root canal system pose challenges
for cultivation. Advances in sampling and culturing techniques have led to a better
understanding of the microbiota harboured in the root canal system (Möller et al. 1981). The
development of strict anaerobic culturing and transport methods (Kantz & Henry 1974,
Wittgow Jr & Sabiston Jr 1975, Sundqvist 1976) and the advent of polymerase chain reaction
(PCR) techniques have led to the recognition of anaerobic microorganisms as important
endodontic pathogens. Facultative anaerobic bacteria such as streptococci and lactobacilli have
been demonstrated in infected pulps (Baumgartner & Falkler 1991). Endodontic infections are
now well established as polymicrobial infections (Zavistoski et al. 1980, Sundqvist 1992).
Streptococci and Actinomyces species are major components of dental plaque (Nyvad & Kilian
1987, Jenkinson & Lamont 1997) and may be responsible for the initiation of pulpal infection

4
through invasion of dentinal tubules. As the environmental conditions change, so does the
specificity of the root canal flora. The relative proportions of anaerobic microorganisms
increases with time as the oxygen tension declines and the nutritional availability changes. This
occurs due to the consumption of oxygen by microorganisms and the development of a low
reduction-oxidation potential favouring the growth of more fastidious microorganisms. Further
oxygen supply is lacking due to the loss of blood circulation associated with a necrotic pulp.
Although the availability of carbohydrates declines within the root canal system,
microorganisms are able to derive their nutrients from other sources. This includes degradation
of remaining necrotic pulp tissue and endogenous proteins and glycoproteins which are derived
through influx of exudate from the periapical tissues. Furthermore, studies have shown that
metabolism of one species found in the root canal supplies essential nutrients for the growth of
other species (Sundqvist 1992, Marsh 2005). Consequently, the earlier colonising
microorganisms become outnumbered by obligate anaerobic species such as Bacteroides,
Fusobacterium, Porphyromonas, Peptostreptococcus, Prevotella, and Veillonella (Sundqvist
1976, Zavistoski et al. 1980, Möller et al. 1981, Fabricius et al. 1982a, 1982b, Byström &
Sundqvist 1983). The isolation of multiple species has demonstrated the complex nature of the
root canal microbiota with selective pressures allowing certain species to thrive in symbiotic
relationships while others cannot survive due to antagonistic interactions.
Fungi are considered commensal organisms of the oral cavity, however, studies have cultivated
fungi from infected root canals (Macdonald et al. 1957, Sen et al. 1995, Baumgartner et al.
2000). Fungi such as Candida spp. have been shown to become pathogenic in certain
environments, the most commonly isolated strain being Candida albicans (Baumgartner et al.
2000, Siqueira Jr & Rôças 2009). Several studies have associated the presence of certain fungal
species with root-filled teeth with chronic apical periodontitis (Waltimo et al. 1997, Cheung &
Ho 2001, Peciuliene et al. 2001).
Gram-negative bacteria within the root canal system such as black-pigmented Bacteroides or
Fusobacterium undergo lysis and release endotoxins from the cell wall (Dahlén & Bergenholtz
1980). Previous studies on lipopolysaccharides extracted from gram-negative strains showed
inflammatory reactions when injected under the skin (Dahlén & Hofstad 1977), with the degree
of inflammation showing strain-dependence. Later studies identified a correlation between the
number of particular bacteria in the root canal system and the endotoxic activity (Dahlén &
Bergenholtz 1980, Schein & Schilder 2006). These endotoxins have been shown to play a role
in the induction and development of periapical lesions (Dwyer & Torabinejad 1981, Pitts et al.
1982). Infected pulps have been shown to induce inflammatory reactions in the periapical

5
tissues. This appears to be a prerequisite for the development of apical periodontitis (Möller et
al. 1981, Eggink 1982).
2.1.1 Post-treatment disease
The microbiota harboured within the root-filled tooth associated with post-treatment disease
differs from that in primary root canal infections. Intraradicular infection has been deemed to
be the most common cause of post-treatment disease with microorganisms commonly persisting
in the apical portions of obturated root canals (Nair et al. 1990, Siqueira Jr 2001) and in the
dentinal tubules.
Primary root canal infections are generally made up of several microbial species, as mentioned
previously (Wittgow Jr & Sabiston Jr 1975, Möller et al. 1981, Baumgartner & Falkler 1991,
Gomes et al. 1996b), with high numbers of obligate anaerobes. On the other hand, the
microflora of persistent or emerging disease comprises predominantly gram-positive facultative
anaerobic bacteria with one or two strains frequently isolated (Sundqvist 1976, Molander et al.
1998, Pinheiro et al. 2003). Compared to obligate anaerobes, facultative anaerobes are able to
withstand antimicrobial agents better and consequently, can persist after root canal treatment.
The ability of some species to survive root canal treatment may be related to their limited
nutritional requirements.
Enterococcus spp. have been implicated in primary root canal infections but have only been
found to make up a small proportion of the initial flora (Weiger et al. 1995, Le Goff et al. 1997).
The most commonly isolated strain has been found to be Enterococcus faecalis. Studies have
shown that Enterococcus spp. have the potential to evade current treatment protocols and have
been frequently cultivated from obturated root canals of teeth with persistent periapical pathosis
(Molander et al. 1998, Sundqvist et al. 1998, Hancock III et al. 2001), even when root canal
treatment is carried out under ideal conditions. It has been found that E. faecalis may be a
commensal microorganism of the root-filled tooth which survives initial treatment but may not
be causative of failure (Fabricius et al. 1982a, Kaufman et al. 2005). The idea that E. faecalis
may increase the survival and pathogenicity of other root canal microbiota has been shown by
Möller et al. (2004). E. faecalis possesses the ability to survive as a planktonic organism without
the need for synergism from other species. It has been found to colonise and adapt to the harsh
environment of the dentinal tubule (Haapasalo & Ørstavik 1987). This has been attributed to a
number of reasons such as its ability to adhere to host cells and extracellular matrix, competition
with other bacterial species, its ability to resist host defence mechanisms, and the production of

6
toxins resulting in damage. Once established in the root canal system, E. faecalis can be difficult
to eradicate as intracanal medicaments such as calcium hydroxide have been found to be
ineffective at killing it (Stevens & Grossman 1983, Byström et al. 1985, Haapasalo & Ørstavik
1987, Ørstavik & Haapasalo 1990, Safavi et al. 1990, Saleh et al. 2004). Some studies have
suggested more effective agents to eliminate it such as chlorhexidine (Gomes et al. 2003) and
camphorated paramonochlorophenol (Byström et al. 1985, Ørstavik & Haapasalo 1990, Safavi
et al. 1990). This ability of E. faecalis to tolerate and adapt to the environmental stresses may
explain its persistence and pathogenicity in root canal infections (Love 2001).
Other species which have frequently been cultivated in post-treatment disease include
Propionibacterium, Prevotella, Peptostreptococcus, Eubacterium, Lactobacillus spp,
Streptococcus spp (Gomes et al. 1996a, Molander et al. 1998, Sundqvist et al. 1998). Fungal
species have also been isolated from root-filled teeth with chronic apical periodontitis (Waltimo
et al. 1997, Sundqvist et al. 1998, Hancock III et al. 2001).
2.1.2 Biofilms
A biofilm is a sessile and diverse community of microorganisms embedded in an extracellular
polysaccharide matrix that is attached to a surface (Costerton et al. 1999). Bacterial populations
exist as separate microcolonies forming ecological niches. This synergistic relationship allows
microorganisms to establish a broader habitat range for growth, increase metabolic diversity
and efficiency, enhance pathogenicity, and allows them to withstand environmental stresses,
antimicrobial agents, and host immune responses (Marsh 2005). It constitutes one of the main
strategies for bacterial survival. Understanding the formation of biofilms and the properties of
microorganisms in a biofilm community is essential for the development of effective
management strategies.
Biofilm formation is a dynamic process. It involves attachment of planktonic cells initially by
weak van der Waals forces between the bacteria and the host surface followed by receptor-
mediated interactions between the host and microbial cell surface adhesins. Initial binding
occurs between planktonic cells and a complex proteinaceous pellicle which acts as an adhesive
substratum for these primary bacterial colonisers (Love 2010). Streptococcal strains are among
the early colonisers and provide additional binding sites for the subsequent attachment of gram-
positive and -negative microorganisms (Svensäter & Bergenholtz 2004). Further growth and
aggregation results in the development of microcolonies. Channels produced as cells proliferate
and aggregate help to distribute plasmids, nutrients, gases, and quorum sensing molecules (Leid

7
2009, Dufour et al. 2010). Strong inter-relationships develop between different microbial
species. Population shifts in the flora are produced as a result of these interactions as well as
environmental changes and selective pressures within the complex root canal system (Sundqvist
1992).
Studies of the endodontic microbiota involved in primary and secondary infections have
demonstrated that bacterial colonisation of the root canal system resembles that of a biofilm
structure (Noiri et al. 2002, Siqueira Jr et al. 2002, Ricucci & Siqueira Jr 2010). Bacterial
aggregations consisting predominantly of cocci and rods have been demonstrated on the walls
of infected root canals and in the dentinal tubules (Nair 1987, Molven et al. 1991, Perez et al.
1993, Sen et al. 1995).
Microorganisms in biofilms have several advantages over their planktonic state. They have a
stronger pathogenic potential and become much less susceptible to antimicrobial agents through
quorum sensing and reduced diffusion. Quorum sensing signalling occurs by the diffusion of
molecules which modify gene expression and optimise phenotypic properties of bacteria in root
canals. Bacteria are thus able to resist host immune responses by limiting penetration of
leukocytes and their bactericidal products into the biofilm architecture (Leid 2009).
Microorganisms in mature biofilms have proved difficult to eradicate, being 10-1000 times
more resistant to the effects of antimicrobial agents compared to planktonic cells (Ceri et al.
1999). The dense polysaccharide matrix provides a barrier, limiting the diffusion of
antimicrobials into the deeper layers of the biofilm. The lack of nutrients results in a phase
transition from active to quiescent, slowing bacterial growth and increasing resistance to
antimicrobials (Gilbert et al. 1997, Desai et al. 1998). Therapeutic measures should consider
the reduced efficacy of antimicrobial agents on microorganisms in a biofilm community.
2.1.3 Invasion of dentinal tubules
Several hundred commensal organisms exist within the oral cavity, however, only certain
species are able to survive the environmental conditions within the dentinal tubules and the root
canal space (Wittgow Jr & Sabiston Jr 1975, Sundqvist 1976). Although streptococci,
lactobacilli and Actinomyces have been shown to be prevalent in high numbers in dental plaque
(Sundqvist 1976, Möller et al. 1981, Jenkinson & Lamont 1997), the infected root canal is
dominated by obligate anaerobic bacterial species of Fusobacterium, Peptostreptococcus,
Eubacterium, Propionibacterium, Veillonella, Wolinella, Prevotella, and Porphyromonas

8
(Fabricius et al. 1982b, Sundqvist & Figdor 2003) and occasionally by fungal species such as
C. albicans (Baumgartner et al. 2000). Bacteria and their byproducts are able to diffuse through
the coronal dentinal tubules towards the pulp when there is a breach of the dentino-enamel
junction, exposing the dentine to the oral cavity (Love & Jenkinson 2002). The pulp-dentine
complex reacts to the invading bacteria with immunocompetent cells. When the host defence
becomes overwhelmed, pulp disease ensues, and if left untreated, this can lead to periapical
disease. Once bacteria become established within the root canal space, they can penetrate the
radicular dentinal tubules to varying depths depending on the tubule dimensions, the clinical
history of the tooth, and the virulence of the bacteria.
The tubular structure of dentine is responsible for its permeability, providing channels for
bacteria between the dentine and pulp. The tubule contains odontoblastic processes, nerve
fibres, and unmineralised collagen fibrils (Dai et al. 1991, Siqueira Jr et al. 1996) which direct
the flow of dentinal fluid in a vital tooth (Michelich et al. 1980). Degeneration of odontoblastic
processes and a loss of collagen fibres in a non-vital tooth may be responsible for the reduction
in fluid flow and a subsequent decrease in bacterial invasion due to the loss of nutrients. The
composition of tubular fluid is not well understood but is believed to contain proteins such as
albumin, immunoglobulins, and fibrinogen. In vitro studies have shown a decrease in fluid flow
associated with these molecules to reduce diffusion of microorganisms to the pulp (Pashley et
al. 1982, Hahn & Overton 1997). Antibodies may increase in the dentinal fluid in the case of
bacterial invasion of a vital tooth (Okamura et al. 1980, Nagaoka et al. 1995).
The invasion of coronal dentine by microorganisms from the oral cavity occurs in the presence
of carious lesions, restorative or periodontal procedures, tooth wear, cracks or dental trauma
(Love 1996, 2004). Once bacteria reach the dentino-enamel junction, they are able to travel
through the tubules and multiply to evoke pulpal inflammatory responses. The diameter of the
tubule influences the depth of invasion. They can range from 0.5 µm at the periphery to 3.0 µm
at the pulpal surface (Garberoglio & Brännström 1976, Gomes et al. 1996a). Microorganisms
able to colonise the root canal space are approximately one third the diameter of the coronal
dentinal tubules. Different regions of carious dentine contain different proportions of bacterial
components in their microflora due to the nutritional requirements of the bacteria. Greater
numbers of bacteria are isolated from the more superficial layers of carious dentine. Intrapulpal
pressures resulting in outward fluid flow from the pulp to the periphery may play a role in
mechanically hindering bacterial ingrowth into the exposed dentinal tubules (Johnson et al.
1973, Olgart et al. 1974).

9
Once bacteria infiltrate the root canal system, they are able to permeate through the radicular
dentinal tubules where they are protected from the action of mechanical debridement and
antimicrobial agents. Recalcitrant pulpal infection may be caused by the retention of
microorganisms in the radicular dentinal tubules (Akpata & Blechman 1982, Haapasalo &
Ørstavik 1987, Safavi et al. 1990). In vitro studies have attempted to demonstrate the
penetration of dentinal tubules by a diverse range of microorganisms typically seen in infected
pulps. Akpata and Blechman (1982) inoculated extracted human teeth with two obligate
anaerobic bacteria – Bacteroides melaninogenicus and Peptostreptococcus asaccharolyticus –
and two facultative anaerobic bacteria – E. faecalis and Streptococcus sanguis (now sanguinis)
– and related the depth of invasion to the time of incubation and growth rate of the
microorganisms. Depth of penetration differs along the root surface with higher numbers of
bacteria invading the cervical third of the root compared to the apical (Akpata & Blechman
1982) and differs amongst species depending on the size and virulence (Safavi et al. 1990,
Siqueira Jr et al. 1996). Microbial penetration has been found to range from 50 to 600 µm
(Haapasalo & Ørstavik 1987, Ørstavik & Haapasalo 1990, Safavi et al. 1990, Perez et al. 1993).
Studies have demonstrated that bacterial invasion of dentinal tubules occurs more readily when
the smear layer is removed as debris may occlude the orifices of the tubules and reduce
permeability (Michelich et al. 1980, Meryon et al. 1986, Drake et al. 1994). Authors have
suggested that the presence of cementum on the external surface of the root affects the ability
of microorganisms to penetrate the radicular tubules from the pulpal surface (Haapasalo &
Ørstavik 1987, Safavi et al. 1990). The loss of cementum increases the patency of the tubules
and enhances the penetration of microorganisms.
Conventional mechanical debridement significantly reduces the bacterial load of the root canal.
However, microorganisms present within the dentinal tubules may be inaccessible. The
adjunctive use of antimicrobial agents is likely to further reduce the number of viable
microorganisms harboured in the canal and the dentinal tubules. The penetration of currently
used medicaments into the dentinal tubules however, varies greatly and has been questioned
(Wang & Hume 1988, Cwikla et al. 2005). This will be discussed in the following section.
2.2 Root canal medication
The concept of chemo-mechanical preparation, utilising a chemical irrigant as an adjunct to
mechanical instrumentation, maximises soft tissue and microorganism removal. Although this
can greatly reduce the bacterial population, bacteria can survive and multiply within the

10
complex root canal system and dentinal tubules between appointments (Gomes et al. 1996b).
Previous studies have found that bacteria were still harboured in the root canals of teeth treated
with mechanical instrumentation and an antimicrobial irrigant (Byström & Sundqvist 1981,
1983, 1985). The application of calcium hydroxide as an intracanal dressing helped to eliminate
surviving bacteria (Byström et al. 1985). Thus, effective reduction of bacteria cannot be
achieved without the additional use of intracanal medicaments.
Intracanal medicaments have been advocated for many purposes. Current medicaments serve
to eliminate or reduce microorganisms remaining after instrumentation, reduce inflammation
of the periapical tissues and pulp remnants, and prevent post-operative pain (Walton 1984,
Chong & Pitt Ford 1992). Furthermore, they can be used to promote healing of calcified tissues
(Heithersay 1975) and can be used to manage inflammatory root resorption (Pierce & Lindskog
1987).
The properties of an ideal intracanal medicament are well documented (Martin 1979). The ideal
medicament should have a wide and prolonged antimicrobial spectrum, be non-irritating to the
periapical tissues, be capable of dissolving pulp remnants (Andersen et al. 1992, Silver 1997),
remain stable in solution, be easily introduced into the canal, be miscible with water so it may
penetrate the dentinal tubules, be easily washed from the canal prior to obturation, and be non-
staining. To date, no single medicament possesses these ideal properties and consequently,
many different agents have been tried and tested as intracanal medicaments. Some of the many
medicaments that have been used include paraformaldehyde, parachlorophenol, camphorated
paramonochlorophenol, formocresol, cresol, creosote, thymol, eugenol, glutaraldehyde
metacresylacetate (Cresatin), sodium hypochlorite, iodine compounds, chlorhexidine
gluconate, chlorine compounds, quaternary ammonium compounds, Cresophene, calcium
hydroxide non-setting paste, Ledermix® paste, Septomixine Forte paste, Pulpomixine paste, and
Odontopaste® (Abbott 1990, Kawashima et al. 2009). The most common, currently used
intracanal medicaments are discussed in detail below.
2.2.1 Calcium hydroxide
Calcium hydroxide is the most commonly used medicament in root canal treatment. It was first
introduced in endodontics by Hermann in 1920 and was initially used in vital pulp therapy.
It is a strong alkaline substance with a pH of approximately 12.5. Most pathogens involved in
pulp and periapical disease are unable to survive this highly alkaline environment and are
11
therefore eliminated when in contact with calcium hydroxide (Heithersay 1975, Byström et al.
1985). It is a white odourless powder and has low solubility in water. It must be mixed with a
liquid for ease of placement into the canal. Calcium hydroxide dissociates into calcium and
hydroxyl ions in an aqueous environment. The efficacy of calcium hydroxide is highly
dependent on the availability of hydroxyl ions. These ions damage the phospholipid component
of bacterial cell membranes, react with bacterial DNA inhibiting its replication, and result in
the denaturation of proteins.
In order to reduce the bacterial load sufficiently, hydroxyl ions must be able to diffuse through
the dentinal tubules at sufficient concentrations. Nerwich et al. (1993) studied the diffusion
dynamics of calcium hydroxide by measuring pH changes across different levels in the radicular
dentine. They found that calcium hydroxide diffused into the inner radicular dentinal tubules
within a few hours but took up to 7 days to reach the outer tubules. Ørstavik and Haapasalo
(1990) found that disinfection of the dentinal tubules with calcium hydroxide can take up to 10
days. The ability of the hydroxyl ions to diffuse into the tubules is affected by tubule diameter
and density which decreases as the distance from the root canal increases. In addition to this,
dentine has the capacity to buffer the hydroxyl ions by the presence of hydroxyapatite (Wang
& Hume 1988).
Calcium hydroxide was shown to have a superior antibacterial effect compared to camphorated
paramonochlorophenol and camphorated phenol (Byström et al. 1985). Stevens and Grossman
(1983), however, found that it was inferior to camphorated paramonochlorophenol in
eliminating E. faecalis in experimentally infected root canals in cats. Other studies have also
supported the finding that calcium hydroxide is ineffective at eliminating E. faecalis (Byström
et al. 1985, Ørstavik & Haapasalo 1990, Safavi et al. 1990, Evans et al. 2002). Microbiological
investigations have demonstrated the presence of fungal species in recalcitrant apical
periodontitis. An in vitro study by Waltimo et al. (1999) demonstrated the resistance of Candida
spp. to calcium hydroxide. This highlights the problem of relying upon current intracanal
medicaments such as calcium hydroxide as no medicament to date is effective against all
microorganisms in the root canal system.
2.2.2 Ledermix® paste
Ledermix® paste is another medicament occasionally used in root canal treatment, consisting
of 1% triamcinolone acetonide (corticosteroid) and 3% demeclocycline (antibiotic). It has
commonly been used in cases of severe inflammation for relief of pain (Ehrmann 1965,

12
Ehrmann et al. 2003), for inflammatory root resorption (Pierce & Lindskog 1987), and as an
antibacterial agent (Taylor et al. 1989). Topical corticosteroids have been advocated for use as
anti-inflammatory agents in root canal treatment.
Studies have highlighted the issues surrounding the use of Ledermix® paste, specifically the
discolouration associated with its use (Kim et al. 2000). This has been attributed to the
tetracycline component which has been shown to result in changes in colour of the hard tissues.
In addition to this, demeclocycline acts as a bacteriostatic rather than a bactericidal agent.
A study by Abbott et al. (1988) on the diffusion of corticosteroid and tetracycline tracer
molecules through dentine reported a peak in concentration of demeclocycline through the
radicular dentinal tubules within the first day after placement. This declined exponentially over
7 days, suggesting that demeclocycline may only be effective against microorganisms in the
first few days.
2.2.3 Odontopaste®
An alternative intracanal medicament to Ledermix® paste was developed, called Odontopaste®,
which has the benefit of being non-staining (Adamidou 2010, Chen et al. 2012). It is a zinc
oxide-based paste containing 1% triamcinolone acetonide as the corticosteroid and 5%
clindamycin hydrochloride as the antibiotic. It has similar properties to Ledermix® paste in that
it is bacteriostatic, reduces inflammation, and reduces post-operative pain. Clindamycin has
been shown to be effective against many endodontic pathogens but its effectiveness compared
to calcium hydroxide in inhibiting bacterial growth is still unclear (Molander et al. 1990).
Odontopaste® is being increasingly used, however, literature on its use is still limited.
2.3 Antimicrobial peptides
The extensive use of antibiotics to target infections has been thought to be the cause of an
increase in antibiotic resistance among gram-negative, gram-positive, and fungal pathogens
(Brogden et al. 2003). Concerns have been raised about the progressive decrease in efficacy of
antibiotics. The development of new classes of anti-infective therapeutics which are fast-acting,
possess a broad-spectrum, have limited side effects, and which overcome this emerging
problem of antibiotic resistance is warranted.

13
The host response to invasion by harmful pathogens involves activation of the innate immune
system with production of a diverse range of cells including phagocytic neutrophils,
macrophages, and leukocytes such as mast cells. A major component of this system is the
synthesis of antimicrobial peptides (AMPs) within granules of resident neutrophils. AMPs are
polypeptides found in many life forms, ranging from bacterial and fungal cells to human. The
induction of these peptides may be a primeval equivalent of the immune response (Hancock
1997), and is used as a first line of immune defence by many organisms. In mammals, including
humans, AMPs are found in neutrophils and on the surface of the tongue, trachea, lungs and
upper intestine (Giacometti et al. 2000). They are thought to be major factors in antibacterial
defence on mucosal surfaces (Hancock 1997). Their antimicrobial potency and specificity has
therapeutic potential in the treatment of infections, including infections resistant to
conventional antibiotics (Falla & Hancock 1997, Giacometti et al. 1998, De Lucca & Walsh
1999, Giacometti et al. 2000). Due to their surface charge, they do not bind to the cholesterol-
rich and neutral plasma membrane surfaces (Monk et al. 2005). As a result, they do not attack
host cells and are minimally toxic to host tissues (Brogden 2005, Klotman & Chang 2006, Aerts
et al. 2008).
AMPs have been a popular topic of research with the discovery of over 800 naturally occurring
peptides, especially within the realm of medicine. Although their existence has been known for
several decades, recent evidence has drawn attention to the potential role of AMPs in preventing
the onset of infection by pathogenic microorganisms (Giacometti et al. 1999, Turner et al. 2004,
Tong et al. 2010). Some of these peptides possess a broad-spectrum of antimicrobial activity
against gram-positive and -negative bacteria, viruses, mycoplasma, and fungi (Hancock 1997),
providing a host defence system to combat infections whilst being minimally toxic to host cells
(Giacometti et al. 1999). Certain AMPs are induced by bacterial products in the case of acute
inflammation.
AMPs are typically short, consisting of 12 to 50 amino acid residues and carry a net positive
charge of 2 to 9 (Wang & Wang 2004, Brown & Hancock 2006, Jenssen et al. 2006). These
cationic AMPs are ribosomally synthesised amphipathic molecules folded in three dimensions
with a hydrophobic face or core, bordered by positively charged hydrophilic amino acid
residues. A diverse range of AMPs have been reported and these have been classified into four
main classes based on their structure: alpha (α) helices, beta (β) sheets, extended helices, and
loop structures (Jenssen et al. 2006). Some peptides, such as the AMP magainin secreted from
the skin of the African clawed frog Xenopus laevis (Zasloff 1987), only adopt an amphipathic
α-helical structure once they enter a membrane (Zasloff 2002).

14
Despite many AMPs being potent antimicrobials, the microbicidal effect of some have been
questioned. This effect may be negated by physiological conditions, degradation by host
proteases, the presence of negatively charged ions such as glycosaminoglycans or salt, and low
local peptide concentrations (Jenssen et al. 2006). As a result, thousands of cationic peptides
have been synthesised using protein chemistry and recombinant DNA technology in order to
optimise activity (Hancock 1997). Although expensive to produce, some of these synthetic
congeners of naturally occurring AMPs have been shown to be promising candidates for
antimicrobial therapy (Brogden et al. 2003).
2.3.1 Mechanism of action
The precise mechanism of action of AMPs remains to be determined. The structure and
composition of most AMPs allow them to bind with high affinity to the lipid in the membrane,
resulting in the displacement of lipids, alteration of the membrane structure creating “pores”,
with subsequent entry of the AMP into the target cell (Matsuzaki 1999, Shai 1999, Yang et al.
2000). Due to their mode of interaction with cell membranes, AMPs preferentially target
enveloped viruses, gram-negative and gram-positive bacteria, fungi, and parasites rather than
host membranes. The formation of channels eventually results in cell death (Falla & Hancock
1997). AMPs do not always form pores when binding to membranes. Some may remain in a
functionally inactive state where they are adsorbed on lipid headgroups while others are active
and able to form pores in some cell membranes and not others (Yang et al. 2001).
The most commonly studied class of AMPs are those possessing antibacterial activity. Initial
attraction to bacterial surfaces occurs through electrostatic bonding between peptides and
bacterial surface structures. It is likely that cationic AMPs, by virtue of their positive charge,
are attracted to the net negative charges which exist on the outer envelope of gram-negative and
gram-positive bacteria (Brogden 2005). The available evidence suggests that AMPs recognise
and target bacterial lipopolysaccharide and lipoteichoic acid, exerting their cell-lytic effect by
binding to the cell surface and permeating the membrane (Dathe & Wieprecht 1999). AMPs
must traverse a lipopolysaccharide layer before interacting with the outer membrane in gram-
negative bacteria and traverse polysaccharides, lipoteichoic acids, and teichoic acids before
interaction can occur with the cytoplasmic membrane in gram-positive bacteria (Brogden
2005).
Knowledge of the mechanism of action of peptides possessing antifungal activity is limited. It
is believed that antifungal peptides, such as the histatins, involve either fungal cell lysis,

15
membrane permeabilisation, disruption of the structure of the cell membrane, interference with
cell wall synthesis, and/or direct effects on intracellular targets such as mitochondria or DNA
and RNA metabolism (De Lucca & Walsh 1999).
Several models have been proposed for AMP membrane permeability: the barrel-stave, toroidal
pore, and carpet model (Shai 1999, Brogden 2005). When the concentration of peptide is low
in relation to the lipids in the membrane, the peptides are orientated parallel to the lipid bilayer
and can be functionally inactive. With increasing concentrations of peptide, they orientate
perpendicularly and insert into the membrane. It is also possible that peptides adsorbed to the
surface may translocate across the membrane without forming a pore (Sengupta et al. 2008).
Models that successfully explain the pore structures may provide a better understanding of the
activities of AMPs.
2.3.1.1 Barrel-stave model
This model was the first to explain peptide-induced pores and was proposed by Baumann &
Mueller (1974). The model proposes that peptides insert into the membrane bilayer and
aggregate, forming a cluster surrounding a central pore (Figure 2.3.1.1). The hydrophobic
regions of the peptide align with the lipid bilayer and the hydrophilic regions interact with the
lumen of the pore. Monomers bind to the membrane in an α-helical structure and recognise each
other once bound to the membrane. After insertion, progressive recruitment of additional
monomers occurs and increases the pore size (Shai 1999). The association of the helices with
the membrane bilayer forms a barrel structure made up of staves surrounding a central lumen.
This model only applies to amphipathic α-helical peptides such as alamethicin (He et al. 1996).

16
Figure 2.3.1.1 Barrel-stave model (Image courtesy of M. Flynn. Adapted from Brogden
2005).
2.3.1.2 Toroidal pore model
This model differs from the barrel-stave model in that the peptides interact with the lipid
headgroups, even when inserted perpendicularly (Yang et al. 2001). The lipid heads bend
continuously and merge in a toroidal manner to make a pore that is lined by the peptides and
lipid headgroups (Figure 2.3.1.2). The polar ends of the peptide monomers associate with the
polar lipid headgroups (Yamaguchi et al. 2002). Examples of AMPs which have been shown
to induce toroidal-shaped pores include magainins (Matsuzaki et al. 1996, 1998), protegrins
which are found in porcine leukocytes (Nguyen et al. 2011), and melittins, the major active
component of bee venom (Yang et al. 2001).

17
In molecular dynamics simulations, the disordered toroidal pore model has also been observed
whereby only a few peptides have been found near the pore centre while others remain close to
the edge (Leontiadou et al. 2006, Sengupta et al. 2008). This model, however, has only been
observed in simulations. It is possible that this is an intermediate step to pore formation for all
AMPs.
Figure 2.3.1.2 Toroidal pore model (Image courtesy of M. Flynn. Adapted from Brogden
2005).

18
2.3.1.3 Carpet model
This model was first described by Pouny et al. (1992) to explain the mechanism of action of
dermaseptin, an AMP produced in the skin of frogs. It involves the binding and aggregation of
peptides parallel to the lipid bilayer with localised ‘carpeting’ of the membrane. Peptides are
always in contact with the phospholipid headgroup (Figure 2.3.1.3).
Figure 2.3.1.3 Carpet model (Image courtesy of M. Flynn. Adapted from Brogden 2005).

19
Permeation of the membrane only occurs above the threshold concentration of the peptide. High
concentrations of peptide on the membrane surface occurs in one of two ways: the membrane
is either covered in peptide monomers or there is a direct association between the peptides.
Above this threshold concentration, micelles are formed and pieces of the membrane separate
(Figure 2.3.1.3). It is at this stage that a transient pore is formed. This is followed by complete
membrane lysis. In this model, peptides do not necessarily need to adopt a specific structure
(Shai 1999).
2.3.2 Relevance of AMPs to dentistry
The susceptibility of cariogenic and periodontal pathogens to a few AMPs has been studied.
Antimicrobial agents such as histatin, lactoferrin, and lysozyme are produced in the oral cavity
by epithelial cells and within the saliva, providing a first line of defence against opportunistic
pathogens. Gingival epithelial cells present at the base of periodontal pockets have been
reported to produce human β-defensins. Some of these AMPs have been shown to be effective
against oral bacteria such as S. mutans (Nishimura et al. 2004), P. gingivalis, and F. nucleatum,
but antibacterial activity was found to vary with the different strains and species depending on
the net charge of the bacteria and the bacterial cell wall structure (Ouhara et al. 2005).
Dommisch et al. (2005) demonstrated the expression of human β-defensin 1 and 2 by
odontoblasts, possibly reflecting the role these cells play in the innate host defence of the dental
pulp.
Antimicrobial activity is of particular interest to the field of endodontics because the oral cavity
is regularly colonised by a diverse range of microorganisms which can become opportunistic
and because of the contribution of these microbes in the aetiology of pulp and periapical disease
(Kakehashi et al. 1965). Commonly used intraradicular medicaments are non-specific
antimicrobial compounds with varying degrees of host toxicity. There is a need for an
intraradicular medicament which is able to effectively kill bacteria within the root canal system
and which is well-tolerated by host tissues. AMPs appear to be promising therapeutic agents
that can effectively reduce bacterial loads. There is, however, limited literature on their use in
endodontics. Turner et al. (2004) assessed the ex vivo efficacy of the naturally occurring AMP,
nisin, against E. faecalis and S. gordonii cells in solution and within the root canal system. Nisin
is a class I bacteriocin produced by strains of Lactococcus lactis. It was found to be microbicidal
against cultures of both strains with no significant difference when compared to calcium
hydroxide.

20
Several AMPs have been developed and tested as their properties make them attractive
candidates to combat infections and they offer several advantages over currently used
therapeutics. Side-chain and/or backbone modifications to existing AMPs have been carried out
to produce variants with enhanced microbicidal activities that overcome problems associated
with natural peptides such as duration of activity, poor bioavailability, and susceptibility to
proteolytic degradation. These modified peptides mimic natural peptides by interacting with
the cell membrane and producing improved biological effects (Vagner et al. 2008). One such
approach is peptide D-enantiomerisation (Zhao & Lu 2011). Amino acids can occur in two
isomeric forms: L- and D- forms, according to the configuration around the alpha carbon atom
in the amino acid. L-amino acids occur naturally and are susceptible to degradation by
proteases. D-amino acids are mirror images of L-amino acids, rarely occur naturally, are
resistant to proteolytic degradation (Wade et al. 1990) and are less immunogenic. D-peptide
drugs should consequently exhibit significantly improved stability (Wade et al. 1990).
2.3.3 BM2
A drug discovery strategy was developed by Monk and colleagues to inhibit the essential fungal
enzyme, the plasma membrane proton pumping ATPase (Pma1p), required for fungal energy
transduction (Monk et al. 2005). A combinatorial library comprising 1.8 million D-octapeptides
was constructed and screened for inhibitors of the fungal species Saccharomyces cerevisiae and
C. albicans by using Pma1p as the target. This identified the peptide, BM0 (D-NH2-
RFWWFRRR-CONH2). Optimisation of BM0 led to the synthesis of the D-decapeptide, BM2
(D-NH2-RRRFWWFRRR-CONH2) which was found to possess broad-spectrum fungicidal
activity. BM2 is composed of a triarginine motif and a core of phenylalanine and tryptophan
with amidation of the C-terminus.
Peptides rich in arginine and tryptophan have been shown to possess broad and potent
antimicrobial activity (Vogel et al. 2002, Chan et al. 2006). Tryptophan residues have a
preference for the interfacial region of lipid bilayers (Yau et al. 1998) while arginine residues
provide the peptides with cationic charges and hydrogen bonding properties necessary for
interaction with the abundant anionic components of bacterial cell membranes (Chan et al.
2006). Arginine and tryptophan make the peptides highly active even at very short peptide
lengths, such as with BM2.
Preliminary in vitro studies found BM2 inhibits the growth of the common endodontic
pathogens S. mutans, S. gordonii, and C. albicans in their planktonic state and against

21
monospecies biofilms, including E. faecalis which is frequently isolated in refractory disease
(Yoganathan 2012, Othman 2014). It showed microbicidal activity at concentrations
significantly lower than the currently used endodontic irrigant, sodium hypochlorite and
antimicrobial effects that were comparable to saturated calcium hydroxide. Sodium
hypochlorite was more effective at E. faecalis biofilm detachment compared to aqueous BM2
using the crystal violet biofilm assay, however, concentrations several hundred-fold higher
were required. Assessment of E. faecalis biofilms using confocal laser scanning microscopy
(CLSM) revealed almost complete loss of cell viability with BM2 at a concentration of 160
µg/mL. Only a slight reduction in biofilm height was observed with limited cell detachment
using the crystal violet biofilm assay (Yoganathan 2012). Othman (2014) showed, using the
crystal violet biofilm assay and CLSM assessment, that aqueous BM2 at 20 µg/mL significantly
reduced the thickness of C. albicans biofilms with total viable cells comprising only 10% after
exposure for 72 hours. BM2 at 40 µg/mL almost completely eliminated S. gordonii and S.
mutans biofilms with viable cells of the remaining biomass comprising 25% and 10%
respectively. E. faecalis biofilms subjected to aqueous BM2 at 40 µg/mL were significantly
reduced after 72 hours with viable cells comprising 40% of the remaining biomass. The in vitro
antimicrobial potential of BM2 was highlighted in both studies, however, the clinical efficacy
within the complex root canal system and penetration into the radicular dentinal tubules still
needs to be investigated.
Treatment of infections in poorly vascularised sites remains difficult with conventional
systemic antibiotic therapy. Systemic therapy has the potential for adverse effects and is
ineffective in endodontics due to the lack of vascularisation in pulpless or necrotic teeth.
Consequently, systemic antimicrobials are not favoured in the management of root canal
infections. The local application of intracanal therapeutic agents is likely to be a more effective
method to achieve controlled and sustained release with broad-spectrum antimicrobial activity
and low systemic side effects. The antimicrobial efficacy of currently used irrigants and
medicaments is well established, however, they have the potential to be cytotoxic by causing
local tissue irritation or hypersensitivity. An endodontic medicament able to effectively kill
therapy-resistant bacteria within root canals and radicular dentine with minimal or no host
toxicity would be a valuable addition to endodontic treatment (Turner et al. 2004).

22
2.4 Hydrogels
The ideal matrix for local delivery of antimicrobials should provide sufficient drug carriage,
good tolerability by host tissues, be biodegradable, and sustain a controlled release over time
(Veyries et al. 1999).
Hydrogels are crosslinked polymers which possess the ability to swell in an aqueous medium.
Crosslinking occurs by either chemical or physical means, depending on the properties of the
polymer as well as the experimental conditions. Physical gels are crosslinked via processes such
as hydrophobic association, chain aggregation, crystallisation, ion-polymer or polymer-
polymer complexation, or hydrogen bonding. These gels are reversible. In contrast, chemical
gels are prepared via chemical covalent crosslinking and are irreversible (Omidian & Park
2012). In their swollen state, hydrogels exhibit excellent water affinity, high thermal and
mechanical stability and biocompatibility which makes them of great interest in the fields of
medicine, pharmaceuticals and dentistry (Hoffman 2012).
In situ polymer gel-forming systems prolong the residence time of drugs and improve
bioavailability. They were introduced in the early 1950s and have been used as food additives,
detergent formulations, in cosmetics, and for a diverse range of pharmaceutical applications
(Veyries et al. 1999). Within the pharmaceutical industry, they have been used as defoaming
and foaming agents, detergents, dispersing agents, emulsifying agents, gelling agents and
solubilising agents (Garcia Sagrado et al. 1994). They are water-soluble, stable, non-toxic, and
inert surfactants.
These polymer-based gels involve a reversible phase transition from solution to gel in response
to changes in temperature or pH. Thermoresponsive hydrogels undergo transitions upon heating
or cooling due to changes in intermolecular interactions (Chen et al. 2013). These gels are
soluble in water at low temperatures and become insoluble when temperature rises and involves
a change from hydrogen bonding to hydrophobic interactions (Omidian & Park 2012).
Examples include poly(N-isopropyl acryl-amide), cellulose derivatives, and polyoxyethylene-
polyoxypropylene-polyoxyethylene polymers. Polymers sensitive to pH changes include those
containing carboxyl or amino groups. Ionisation and hydration changes depending on the pH
of the medium (Omidian & Park 2012). Polymer gels involving phase transitions in response
to pH changes may take a longer time to form a gel when administered into a root canal system
due to the lack of an appropriate pH gradient. The faster the gel transformation occurs, the
smaller the risk of the gel being diluted with physiological fluid at the site of application
(Charrueau et al. 2001, Kojarunchitt et al. 2011). A longer setting time of the polymer gel could

23
Polyoxypropylene core Polyoxyethylene block Polyoxyethylene block
result in dose dumping, an undesired side effect. This has been defined as unintended and rapid
drug release in a short period of time of the entire amount or a significant fraction of the drug
contained in a modified release dosage form (Meyer & Hussain 2005). The use of a
thermoresponsive gel for administration of a drug into the root canal system may provide a
more apt and precise method for drug delivery than pH responsive gels.
One widely studied class of thermoresponsive polymer gels are the poloxamers, also known as
pluronics. These copolymers are composed of a central hydrophobic core of polyoxypropylene
(PPO) surrounded by hydrophilic blocks of polyoxyethylene (PEO) to produce a triblock
structure as shown in Figure 2.4 (Dumortier et al. 2006). They are synthesised by sequential
anionic polymerisation of PPO and PEO monomers in the presence of sodium or potassium
hydroxide (Schmolka 1977, Kabanov et al. 2002). Different ratios of the hydrophobic and
hydrophilic components can be used to produce polymers of different molecular weights with
modified lipophilicity and hydrophilicity.
Figure 2.4 Structure of polymer gels.
The unique property of thermogelation permits dispersion of a drug within a medium able to be
administered by syringe as a solution that forms a semi-solid gel at physiological temperatures.
As the sol-gel transition temperature is reached, the viscosity increases by virtue of the
formation of micelles which aggregate. Below this temperature, they remain fluid. These gels
possess the ability to be reversed back to a fluid state at lower temperatures without alteration
of their properties (Schmolka 1972).
Poloxamers are free-flowing injectable solutions which should be advantageous for
administration into a root canal system. One such example is Poloxamer 407. Its unique
thermoreversible gelation properties have made it one of the most extensively studied
poloxamer gels. These gels are expected to transform into a gel shortly after administration into
the root canal system due to their superior thermoresponsive behaviour at body temperature.
They have been shown to form strong gels which are efficient in the slow release of active

24
components (Bhardwaj & Blanchard 1996). Furthermore, these gels are readily available on the
market and are economical.
2.4.1 Poloxamer 407
Poloxamer 407 (P407 or Pluronic® F127) gels are non-toxic colourless gels, consisting of 70%
PEO and 30% PPO and have a molecular weight of approximately 12,600 as determined by
mass spectrometry (Takáts et al. 2001). The ratio of PEO to PPO is approximately 2:1
(Schmolka 1972) where the values of a and b, as in Figure 2.4, are 101 and 56, respectively
(Takáts et al. 2001).
P407 aqueous solution exists as a free-flowing liquid at temperatures around 5-10°C and forms
a semi-solid solution when the temperature is increased to ambient temperatures, around 24-
25°C, depending on the concentration of the polymer used. When the solution is brought to
physiological temperatures at around 37°C, it forms a gel (Johnston & Miller 1985).
P407, an amphiphilic block copolymer, self-assembles in water to form micelles due to
dehydration of the PPO hydrophobic core, producing a spherical structure (Chen-Chow &
Frank 1981, Juhasz et al. 1989). These micelles possess a dehydrated core with an outer
structure of swollen chains (Cabana et al. 1997, Moore et al. 2000). The aggregation of micelles
at higher temperatures is driven by the hydrophobic interactions between the dehydrated PPO
blocks which results in gelation as shown in Figure 2.4.1. Apart from aggregated micelles, P407
gels also consist of aqueous channels in which the incorporated drug may be released into.
Figure 2.4.1 Poloxamer gelation (Image courtesy of M. Flynn. Adapted from Dumortier et al.
2006).

25
One of the limitations of P407 is its low mechanical strength and limited micellar stability in
aqueous environments, resulting in erosion (Kojarunchitt et al. 2011). This occurs due to
dilution of P407 copolymers upon contact with excess solvent leading to a drop below the
critical gelation concentration (Chun et al. 2005).
P407 can be used at different concentrations, depending on the desired viscosity. It has been
reported that different types of crystalline structures are produced depending on the
concentration. At concentrations ranging from 20-40% w/v, a face centred cubic structure is
obtained. At higher concentrations, such as 50% w/v, a body centred cubic packing of micelles
is seen (Liu & Chu 2000). This configuration is shown in Figure 2.4.2.
Figure 2.4.2 Crystalline structures produced with the varying concentrations of P407 (Image
courtesy of M. Flynn).

26
This results in a higher viscosity, greater level of rigidity and slow dissolution of the gel. This
occurs due to a shorter intermicellar distance with increased cross-linking between micelles and
a greater number of micelles per unit volume (Bhardwaj & Blanchard 1996). Furthermore, it
has been reported that increasing the polymer concentration results in a decreased sol-gel
transition temperature (Ricci et al. 2002) as the degree of micellar swelling and aggregation
needed to form a network is smaller.
P407 gels have been used for transdermal, injectable and ocular applications (Miller & Donovan
1982, Miyazaki et al. 1995, Paavola et al. 1998). Actives such as drugs and vaccines can be
incorporated into the gels by simply mixing with the temperature-sensitive polymer solution at
lower temperatures (Bobbala et al. 2016). P407 is the most commonly used gel-forming
polymer matrix to deliver proteins (Morikawa et al. 1987, Juhasz et al. 1989, Gombotz & Pettit
1995). However, literature on the use of Poloxamers in dentistry and more specifically,
endodontics, is lacking. Within dentistry, Poloxamers have been tested as dentifrice surfactants
(Zinner et al. 1977, Ong & Strahan 1989), formulations for direct intrapocket administration
for the treatment of periodontitis (Medlicott et al. 1994, Esposito et al. 1996, Garala et al. 2013)
and as thickening agents in bleaching systems (Soldani et al. 2010). To date, only one paper
has reported on the use of Poloxamer in a root canal model. P407 was used as a vehicle for
delivery of Artocarpus lakoocha extract, a tropical tree species commonly found in India and
Thailand (Teanpaisan et al. 2013). The authors found administration of A. lakoocha extract in
a P407 carrier had superior antimicrobial properties to calcium hydroxide paste against E.
faecalis.
Poloxamer 407 will be used for the present study as it has been reported to be biocompatible,
stable, the most non-toxic of the poloxamer gels and possess weak immunogenic properties
(Ricci et al. 2002). It is expected to provide a novel drug delivery system which will allow
controlled and sustained release over a given period of time. Incorporation of BM2 into this
gel-forming system may provide a suitable medium to deliver BM2 into the root canal system
and for subsequent sustained release from the matrix it forms. Studies of the rheological
characteristics are needed as this will determine the rate of gel dissolution and rate of release of
drug from the gel. Determination of the stability of P407 with and without the incorporation of
BM2 is needed to assess whether BM2 impacts on the stability and in addition to this, measure
the rate of release of BM2 from the gel matrix.

27
2.4.2 In vitro stability testing
It is essential to investigate the behaviour of the formulations through in vitro stability testing
of the gel with and without inclusion of the drug. Poloxamer dissolution involves the hydration
of water-insoluble side groups that are converted to water-soluble polymers as a result of
ionisation, protonation, or hydrolysis of the groups (Gombotz & Pettit 1995). A dissolution
profile can be obtained through measurement of change in polymer weight over time with the
use of a release medium (Bobbala et al. 2016).
2.4.3 In vitro release studies
Several studies have assessed the rheological properties of polymer gels and their in vitro
release characteristics (Chen-Chow & Frank 1981, Veyries et al. 1999, Moore et al. 2000).
Release of the active drug is controlled by the surface hydration rate. The more lipophilic the
drug, the more it becomes incorporated within the micelles due to more hydrophobic
interactions with the PPO core, with less present in the aqueous channels to be released.
Increasing concentrations of P407 may be associated with a reduced rate of release which is
attributed to the higher degree of micellar aggregation resulting in a stronger gel. This results
in a greater tortuosity in the aqueous phase of the gel structure and a resultant slower dissolution
rate (Gilbert et al. 1986, Zhang et al. 2002).
2.5 In vitro testing
2.5.1 Confirmation of bacterial strains
The use of 16S ribosomal RNA (rRNA) gene sequencing is a well-established and common
method to study bacterial phylogeny and taxonomy as it provides species-specific sequences
which are useful for bacterial identification. The technique was pioneered by Woese and Fox
(1977) who established that phylogenetic relationships of bacteria could be determined by
comparing a stable part of the genetic code. This included the genes that code for the 5S, 16S,
and 23S rRNA, the most commonly used being the 16S rRNA gene. The sequences are used as
a genetic marker as the 16S rRNA gene is critical for cell function and is present in most
microbes. It has played a pivotal role in the accurate identification of strains and the discovery
of novel bacteria in clinical microbiology (Woo et al. 2008). Using this technique, numerous

28
bacterial genera have been reclassified and renamed, classification of uncultivable bacteria has
been made possible, and phylogenetic relationships have been determined.
The 16S rRNA gene sequence has been determined for a large number of strains and deposited
in several databases. GenBank® is one of the largest databases of nucleotide sequences with
over 20 million entries. These databases can be used to compare sequences of unknown strains
(Clarridge 2004).
The steps involved in identification of bacterial species includes extraction of DNA,
amplification of the 16S rRNA genes by PCR, purification, sequencing and finally, comparison
with the GenBank® database (Kolbert & Persing 1999).
2.5.2 Planktonic cells
2.5.2.1 Minimum inhibitory concentration
The minimum inhibitory concentration (MIC) of an antimicrobial has been defined as the
lowest concentration able to inhibit the visible growth of a microorganism after a defined
incubation period (Andrews 2001), as determined by turbidity. MICs have been considered the
gold standard for determining the susceptibility of microorganisms and have been used as a
diagnostic laboratory tool for assessing the in vitro activity of new antimicrobials (Turnidge
2015).
Typically, two techniques are utilised in the laboratory to determine MIC: agar and broth
dilution methods (Weigand et al. 2008). A stock solution of the antimicrobial of known
concentration is prepared with serial 2-fold dilutions to produce a range of concentrations. The
microbial suspension is grown as a pure culture and the optical density adjusted to a density
comparable to a McFarland turbidity 0.5 standard (McFarland 1907). Knowing the cell number
in the final inoculum is of critical importance for obtaining accurate and reproducible results,
the recommendation being 5 x 10⁵ colony forming units (CFU)/mL (Weigand et al. 2008). Agar
dilution involves the use of a nutrient agar medium with the different antimicrobial
concentrations incorporated onto which the microbial inoculum is then placed. Broth dilution,
on the other hand, is carried out in a microtitre plate using liquid medium (Weigand et al. 2008).
The MIC can be determined after exposing the microbial inoculum to the range of antimicrobial
concentrations and incubation. The broth microdilution assay, recommended by the Clinical
and Laboratory Standards Institute (CLSI) (2008), allows the use of smaller quantities of test

29
antimicrobial and growth medium and is consequently the technique employed in this research
(Griffin et al. 2000).
The limitation with the use of MICs is that current techniques are semi-quantitative and give an
approximation of the lowest concentration. Consequently, values should be used as an indicator
of activity rather than as a substantive value (Lambert & Pearson 2000). Furthermore, it does
not give an indication of the mode of action, that is, whether the agent is static or cidal. Further
testing needs to be conducted on the lowest concentration to establish the exact mode of action.
This is described in further detail in the next section.
2.5.2.2 Minimum bactericidal/fungicidal concentration
The minimum bactericidal concentration (MBC) or minimum fungicidal concentration (MFC)
is the lowest concentration of the antimicrobial able to prevent complete growth and kill a
microorganism after incubation and subculturing onto appropriate medium (Andrews 2001).
The MBC/MFC can be established by subculturing the broth dilution from the microtitre plate
onto appropriate nutrient agar and checking for the absence of growth (Mah 2014) .
Cationic peptides have been reported to be bactericidal with the MBC and MIC coinciding or
differing by no more than 2-fold (Hancock 2001). The mechanism of action owing to their
bactericidal activity has been attributed to interaction with the cytoplasmic membrane,
however, this mechanism of action is yet to be confirmed for the peptide, BM2. Previous
research found BM2 to exhibit microbicidal activity in solution against certain endodontic
pathogens (Yoganathan 2012, Othman 2014). The efficacy of this peptide incorporated into a
gel medium has not been tested and it is unknown whether it will demonstrate comparative
antimicrobial properties to BM2 in solution against planktonic cultures and monospecies
biofilms.
2.5.3 Biofilms
2.5.3.1 Crystal violet assay
Crystal violet, also previously termed gentian violet, is a basic dye which stains the nuclei of
cells by binding externally to the DNA. It also binds to negatively charged surface molecules
and polysaccharides in the extracellular matrix (Li et al. 2003, Peeters et al. 2008). The

30
irreversible fixation of this dye by gram-positive bacteria is the basis of the Gram-stain
(Docampo & Moreno 1990).
The microtitre plate biofilm formation assay is used to study the early stages in biofilm
formation and has been utilised in the study of predominantly bacterial biofilms but also to a
lesser extent fungal biofilms (O’Toole 2011).
The crystal violet assay can be used to obtain quantitative information regarding the density of
cells adhering to the wells of a microtitre plate (Stepanovic et al. 2000). The cells are stained
with the dye and any excess dye and unstained cells are washed off. Quantification can be
carried out by solubilising the absorbed dye and determining the optical density using
spectrophotometry (Gillies et al. 1986). The technique has been shown to be a reliable and
reproducible method demonstrating a linear relationship between absorbance, measured as
optical density, and cell number (Gillies et al. 1986, Saotome et al. 1989).
The limitation with the use of crystal violet staining is that it stains the entire biofilm biomass
including cells and extracellular polysaccharide matrix. This is not limited to viable cells but
also cells in a quiescent state as well as dead cells.

31
2.6 Aims
Preliminary in vitro studies have found the stable cationic AMP, BM2, to be an effective AMP
against certain planktonic endodontic pathogens and monospecies biofilms when tested in the
form of a solution. The antimicrobial efficacy of BM2 in an injectable gel matrix needs to be
investigated.
The aims of this research are:
1) To develop a sustained release delivery system suitable for the intracanal delivery of
BM2 which is stable in vitro.
2) To evaluate the in vitro release of BM2 from P407 gel.
3) To assess the susceptibility of certain species of the endodontic microflora to BM2 in a
gel medium.
4) To assess the antimicrobial effect of BM2 in a gel medium on monospecies biofilms by
comparison with the currently used intraradicular medicament, calcium hydroxide.
2.7 Hypotheses
The following hypotheses will be tested:
1) BM2 incorporated into a P407 matrix will be stable and suitable as an intracanal
delivery system.
2) BM2 will be released over a clinically effective period of time from P407.
3) The species tested will be susceptible to BM2-loaded P407 gels in planktonic cultures.
4) BM2-loaded P407 gels will demonstrate antimicrobial activity against monospecies
biofilms.
5) BM2-loaded P407 gels will be as effective as calcium hydroxide.

32
Chapter 3: Materials and methods
3.1 Selection of microbes
All microorganisms used in this study were sourced from the Molecular Biosciences Laboratory
Culture Collection (School of Dentistry, University of Otago, NZ). Strains representing species
of microorganisms frequently isolated from an infected root canal system were chosen, namely
Streptococcus mutans NG8, Streptococcus gordonii DL1 (also known as strain Challis),
Enterococcus faecalis JH2-2 and Candida albicans ATCC 10261. Strains were obtained from
frozen 15% (vol/vol) glycerol stocks stored at -80ºC. These strains and their general
characteristics are shown in Table 3.1. The stocks were thawed and a loop of stock was streaked
onto appropriate agar plates using an aseptic technique. Bacterial strains were initially streaked
onto brain heart yeast infusion (BHY) agar (Difco Laboratories, Detroit, MI, USA) plates then
subcultured onto Columbia sheep blood agar (CBA) (Fort Richard Laboratories, Auckland, NZ)
plates, mitis salivarius agar (Fort Richard Laboratories) plates, and mutans selective media
(MSM) (Fort Richard Laboratories). All bacteria were cultivated at 37ºC for 48 h under
anaerobic conditions in a Gas-Pak™ EZ Gas Generating Container System (Becton, Dickinson
and Co., Sparks Maryland, USA). C. albicans were routinely subcultured onto yeast extract
peptone dextrose (YPD) agar (Difco Laboratories) plates and incubated at 30oC aerobically.
Table 3.1 Microorganism panel.
Strain Gram stain Growth conditions Role in endodontics
Streptococcus mutans NG8 Positive Facultative anaerobe Initiation of primary infection
Streptococcus gordonii DL1 Positive Facultative anaerobe Initiation of primary infection
Enterococcus faecalis JH2-2 Positive Facultative anaerobe Refractory infection
Candida albicans ATCC 10261 Positive Aerobe Refractory infection
33
3.2 Selection and preparation of growth media
3.2.1 Agar plates
Brain heart infusion agar
Brain heart yeast infusion (BHY) agar (brain heart infusion 37 g/L, yeast extract 5 g/L, and
bacteriological agar 15 g/L, Difco Laboratories) is a non-selective medium used for the
cultivation of a wide variety of fastidious microorganisms including streptococcal species. The
brain heart infusion, peptone and dextrose components provide the nutrients for BHY agar.
A solution was prepared by dissolving the respective components in 1 L of distilled water and
was stirred using a magnetic stirrer. The solution was autoclaved at 121ºC in a high pressure
steam autoclave (Tomy Seiko Co., Ltd, Tokyo, Japan) for 20 min, allowed to cool, and poured
into petri dishes. Plates were left to set overnight and then stored at 2-4ºC until required.
Columbia sheep blood agar
Columbia blood agar with sheep blood medium (CBA) (Fort Richard Laboratories) is used for
the isolation and cultivation of a wide variety of fastidious microorganisms. It was first
developed by Ellner et al. (1966). Sheep red blood cells provide the heme needed for detection
of haemolysis and allows differentiation between alpha and beta haemolytic species. Alpha-
haemolytic Streptococcus spp. such as S. mutans or S. gordonii oxidise the iron in haemoglobin
producing a greenish colour on blood agar. Beta-haemolytic species, such as E. faecalis cause
complete lysis of red blood cells, producing a translucent zone clear of blood cells surrounding
colonies. CBA was used to differentiate between S. mutans, S. gordonii, and E. faecalis through
pigment production.
Mitis salivarius agar
Mitis salivarius agar (Fort Richard Laboratories) medium is used for selective isolation of
certain species of streptococci and enterococci. The inclusion of crystal violet dye and 1%
potassium tellurite inhibits the growth of most gram-negative bacilli and gram-positive bacteria
except streptococcal and enterococcal species. The trypan blue is absorbed by Streptococcus
colonies, producing a blue colour.

34
Mitis salivarius agar was used to differentiate between S. mutans and E. faecalis through the
characteristic appearance of colonies. E. faecalis produces blue-black colonies whilst S. mutans
produces blue colonies with a frosted appearance.
Mutans selective agar
Mutans selective medium (Fort Richard Laboratories) was developed for the isolation of S.
mutans and is a modification of Mitis salivarius agar containing 0.2 units/mL bacitracin with
an increase in the sucrose concentration to 20% (Gold et al. 1973, Emilson & Bratthall 1976).
This optimal concentration of sucrose and bacitracin allows maximum inhibition of other
streptococci without inhibition of S. mutans.
Yeast extract peptone dextrose agar
Yeast extract peptone dextrose (YPD) agar (yeast extract 10 g/L, bacteriological peptone 20
g/L, glucose 20 g/L, and bacteriological agar 15 g/L, Difco Laboratories) is used for
maintaining and propagating yeast.
A solution was prepared by dissolving the respective components in 1 L of distilled water and
was stirred using a magnetic stirrer. The solution was autoclaved at 121ºC (Tomy Seiko Co.,
Ltd) for 20 min, allowed to cool, and poured into petri dishes. Plates were left to set overnight
and then stored at 2-4ºC until required.
CHROMagar™
CHROMagar™ Candida (peptone 10.2 g/L, chloramphenicol 0.5 g/L, chromogenic mix 22 g/L
and agar 15 g/L, Fort Richard Laboratories) is a selective chromogenic medium for isolating
and differentiating yeasts and filamentous fungi by colour and morphology. The presence of
green colonies is indicative of the presence of C. albicans.

35
3.2.2 Broths
Tryptic Soy Broth
Tryptic soy broth (TSB) (Difco Laboratories) is an all-purpose liquid medium used for the
enrichment and cultivation of a wide variety of microorganisms, especially for the preparation
of inocula.
TSB was prepared by dissolving 30 g in 1 L of distilled water, stirred with a magnetic stirrer.
The solution was autoclaved at 121ºC (Tomy Seiko Co., Ltd) for 20 min, allowed to cool, and
stored at room temperature until required.
Synthetic Defined Medium
Complete synthetic defined (SD) media is a mixture of amino acids, vitamins, and other
essential components that together with yeast nitrogen base and glucose, supports the vigorous
growth of yeast cells. SD medium contains yeast nitrogen base without amino acid 6.7 g/L,
complete supplement mixture (CSM) 0.77 g/L and glucose 20 g/L. It is buffered with 10 mM
MES buffer (2-(N-morpholino)ethanesulfonic acid) 1.95 g/L, 20 mM HEPES buffer (4-(2-
hydroxyethyl)-1-piperazineethanesulfonic acid) 4.77 g/L, TRIS (Tris(hydroxymethyl)
aminomethane) 1.67 g/L.
SD media was prepared by dissolving the respective components in 1 L of distilled water, stirred
using a magnetic stirrer. The solution was autoclaved at 119ºC (Tomy Seiko Co., Ltd) for 17
min, allowed to cool, and stored at room temperature until required. When required for use, the
SD medium was adjusted to pH 6.8 by adding 1 M TRIS solution and filtered aseptically using
a sterile 25 mm diameter 0.22 µm syringe filter (Millex®, Merck Millipore, Darmstadt,
Germany) into a sterile 50 mL Falcon tube (Greiner Bio-One GmbH, Frickenhausen, Germany).
TSB broth and SD medium were used in the cultivation of bacterial and fungal cells
respectively.

36
3.3 Confirmation of species
3.3.1 Bacterial species
16S ribosomal RNA (rRNA) gene sequencing was used to confirm bacterial species prior to
use. Isolates were identified by amplifying the 16S rRNA genes from selected colonies of each
strain of interest followed by DNA sequencing using the Sanger method (Sanger et al. 1977).
Single colonies of each isolate were obtained using a toothpick and resuspended in 50 μL of
sterile deionised water (Molecular Biology Grade, 5 Prime, Germany). One microlitre of each
cell suspension was then subjected to colony PCR experiments to amplify the 16S rRNA gene
using primers IonTor-U8FP1 (5’- CTAAGGTAACAGAGTTTGATCMTGGCTCAG -3’) and
IonTor-RP1 (5’- CTAAGGTAACCTGCTGCCTYCCGTA -3’). PCR was conducted in 50 μL
reactions (in 0.2 mL PCR tubes) that contained the following components:
Table 3.3.1 Components of PCR.
10× DNA polymerase buffer B2 (detergent- and MgCl2-free) 5 μL
10 mM dNTP mix (Roche, Germany) 1 μL
50 mM MgCl2 2 µL
Primer IonTor-U8FP1 (Life Technologies, Auckland) 1 µL
Primer IonTor-RP1 (Life Technologies, Auckland) 1 µL
HOT FIREPol DNA polymerase (Solis Biodyne, Estonia) 0.5 µL
DNA template, i.e., cell suspension 1 μL
Molecular biology grade water (5 Prime, Germany) 38.5 μL
Total 50 μL
The PCRs were carried out in an Eppendorf Mastercycler® Gradient apparatus (Eppendorf AG,
Hamburg, Germany) using the following thermal cycling parameters:
1) Initial denaturation at 95oC for 15 min
2) 30 cycles of the following:
a. Denaturation: 95oC for 30 sec
b. Annealing: 55oC for 30 sec
c. Elongation: 72oC for 20 sec
3) Final elongation at 72oC for 10 min

37
Purification of the PCR products of the expected size (380 bp) was carried out using
NucleoSpin® Gel and PCR Clean-up spin columns (Macharey-Nagel GmbH & Co., Germany)
and the purified amplicons sent for Sanger sequencing (Genetic Analysis Services, Department
of Anatomy, University of Otago) (Sanger et al. 1977) as described in the following sections.
PCR Clean-up Procedure
One volume of the PCR product was mixed with two volumes of Buffer NTI in a NucleoSpin®
column (Macharey-Nagel GmbH & Co.). The column was then placed in a 2 mL collection
tube, centrifuged at 11,000 x g for 30 secs to bind the DNA and the flow-through discarded.
The silica membrane with the bound DNA was washed twice: first by adding 700 μL of NT3
buffer to the column, centrifuging at 11,000 x g for 30 secs and discarding the flow-through
and then a second time by adding 700 μL of NT3 buffer to the column, centrifuging at 11,000
x g for 1 min and discarding the flow-through to remove any remaining ethanol and dry the
membrane. The NucleoSpin® column was placed in a sterile 1.5 mL microcentrifuge tube and
30 μL of NE elution buffer was applied to the centre of the column. After incubation at room
temperature for 1 min, the column was centrifuged at 11,000 x g for 1 min to elute the purified
PCR amplicon DNA.
PCR Quantification
Quantification and purity of all DNA samples was determined by absorption spectrophotometry
using a NanoVue™ spectrophotometer (GE Healthcare Life Sciences, U.K.) and NucleoSpin®
elution buffer as a blank. The amount of DNA present in each sample was determined by
measuring the absorbance at 260 nm (A260). The purity of the DNA sample was estimated from
the A260 (nucleic acid) /A280 (protein) ratio. A ratio of 1.8-1.9 was obtained for all samples,
indicating a high purity level.
Agarose gel electrophoresis
The quality and quantity of the purified PCR products was analysed by agarose gel
electrophoresis (Green & Sambrook 2012). The concentration of agarose used was 1.0% (w/v).
The gels were run in Tris-acetate-EDTA buffer (40 mM Tris-HCl, 1 mM EDTA, 20 mM acetic
acid) (Green & Sambrook 2012). Five microlitres of each DNA sample was mixed with 1 µL
of 6× loading dye (30% (w/v) glycerol, 0.1% bromophenol blue and 0.001% xylene cyanol)

38
prior to loading (Green & Sambrook 2012). Gels were run at 100 volts for 45 min. The gels
were stained with ethidium bromide (5 µg/mL) and visualised under ultraviolet (UV)
transillumination with a Gel Doc™ EZ Imager (Bio-Rad Laboratories, USA). Gel images were
captured by using Image Lab™ version 3.0 (Bio-Rad Laboratories).
Sequencing of colony-derived PCR amplicons
Purified amplicons (10 ng of each sample) derived from colony PCRs were sequenced by
Genetic Analysis Services (Department of Anatomy, University of Otago) using conventional
Sanger chemistry with a 3730XL DNA Analyzer (Applied Biosystems, USA). The sequencing
primer used was primer IonTor-U8FP1. Each DNA sequence was visualised and any basecall
errors edited with FinchTV version 1.4 (Geospiza Inc., U.S.A.). Species identification of each
16S rRNA sequence was then accomplished using the BLASTN algorithm (Altschul et al.
1997) to query the GenBank® DNA database for identical or very similar entries.
All species were confirmed as is described in Table 3.1.
3.3.2 Fungal species
Single colonies were aseptically removed from the previously inoculated YPD agar plates and
routinely subcultured onto CHROMagar™ plates (Fort Richard Laboratories). The presence of
green colonies confirmed the strain to be C. albicans.
3.4 Preparation of glycerol stocks
Single colonies of S. mutans NG8, S. gordonii DL1, and E. faecalis JH2-2 were removed from
each previously streaked CBA plate, resuspended in 10 mL TSB in 20 mL glass universal bottle
and incubated at 37°C without shaking for 24 h. The broth was harvested by centrifugation
(11,500 x g for 8 min) and the pellet resuspended in 5 mL TSB containing 15% (vol/vol)
glycerol using a vortex mixer. The bacterial glycerol stocks were stored as 1 mL samples in 1.5
mL sterile tubes (Raylab, Glendene, Auckland, NZ) at -80°C until required.
A single colony of C. albicans ATCC 10261 (American Type Culture Collection, Manassas,
VS, USA) was removed from the previously streaked YPD agar plate, resuspended in 10 mL

39
YPD broth in a 20 mL glass universal bottle and incubated at 30°C with shaking for 24 h. The
broth was harvested by centrifugation (11,500 x g for 8 min) and the pellet resuspended in 5
mL YPD broth containing 15% (vol/vol) glycerol. The C. albicans ATCC 10261 glycerol stock
was stored as a 1 mL sample in a 1.5 mL sterile tube (Raylab) at -80°C until required.
3.5 Preparation of inocula
3.5.1 Bacterial inoculums
Suspensions of S. mutans NG8, S. gordonii DL1, and E. faecalis JH2-2 were streaked onto
BHY agar (Difco Laboratories) plates and incubated at 37°C for 48 h under anaerobic
conditions to obtain isolated colonies. Two or three colonies were transferred aseptically into 3
mL sterile TSB and incubated for 16 h. The overnight microbial suspension was adjusted to an
optical density at 600 nm (OD600nm) of 0.5. This contained approximately 5 x 10⁸ colony
forming units (CFU)/mL. The starting inoculum was obtained by adding 200 µL to 19.8 mL of
TSB to dilute the culture 1:100, giving approximately 5 x 10⁶ CFU/mL.
3.5.2 Fungal inoculums
A suspension of C. albicans ATCC 10261 was streaked onto a YPD agar plate and incubated
at 30°C for 48 h aerobically to obtain isolated colonies. Two or three colonies were transferred
aseptically into 3 mL sterile, pH-adjusted SD medium and incubated for 16 h. The overnight
fungal suspension was adjusted to an OD600nm of 0.5. This contained approximately 107
CFU/mL. The starting inoculum was obtained by adding 200 µL to 19.8 mL of SD medium to
dilute the culture 1:100, giving approximately 105 CFU/mL.
3.6 Preparation of antimicrobial solutions
3.6.1 Preparation of BM2
The D-decameric peptide BM2 (sequence: D-NH2-RRRFWWFRRR-CONH2) synthesised by
GenScript® (Piscataway, New Jersey, USA) at a purity estimated by high performance liquid
chromatography to be 95-99%, was stored at -20°C.

40
Three hundred milligrams of the peptide was solubilised in 9.25 mL of sterile deionised water,
as recommended by the manufacturer, to give an estimated concentration of 20 mM. The
peptide solution was stored as 1 mL aliquots at -20°C until required.
3.6.1.1 Determination of the net peptide amount
Two microlitres of the thawed peptide solution was pipetted into the first well of a 96 well
microtitre plate (Greiner Bio-One GmbH) together with 198 µL phosphate buffer saline (PBS).
Serial 2-fold dilutions were carried out to produce samples in the range 3.125 – 200 µM (See
Appendix A). Samples were transferred to plastic cuvettes suitable for UV measurements and
subjected to spectrophotometric analysis to determine their absorbance at 280 nm, with PBS
serving as a blank. A molar extinction coefficient of 11,500 M-1cm-1 (Ɛ280nm = 11,500 M-1cm-1)
was used to calculate the theoretical concentration of the BM2.
The theoretical values equated to twice the experimental absorbance indicating an overall
concentration of 10 mM.
3.6.2 Preparation of calcium hydroxide
A saturated solution of calcium hydroxide (Ca(OH)₂) (Sigma-Aldrich®, St. Louis, MO, USA)
was prepared by mixing 16 mg of Ca(OH)₂ powder with 10 mL of sterile distilled water. The
mixture was centrifuged at 3000 RPM (1077 x g) for 15 min to clarify the solution. The aqueous
supernatant layer was filtered aseptically using a sterile 25 mm diameter 0.22 µm syringe filter
(Millex®, Merck Millipore) into a sterile 15 mL falcon tube (Greiner Bio-One GmbH). The pH
of the saturated solution was determined using a pH meter to be 12. The saturated Ca(OH)₂
solution was prepared as required for subsequent experiments.
3.6.3 Preparation of polymer gel
Poloxamer 407 (P407) (Sigma-Aldrich®) solution was prepared by the cold method described
by Schmolka (1972). Solutions of P407 in the range of 15 - 50% (w/v) were prepared by slowly
dissolving the required amount of P407 over 2-3 min in 5 mL sterile distilled water at 2-4°C in
20 mL glass vials and stirred using a magnetic stirrer. The vial was capped and left to stir for
24 h at 2-4°C to ensure complete dissolution. The following tests were carried out at 24 h, 48

41
h, 72 h and at 7 days with the vials refrigerated at 2-4°C between each test. Three independent
tests were carried out in triplicate to produce 9 sets of data.
3.6.3.1 Injectability
The ability to inject 1 mL aliquots of P407 at 24°C (room temperature) was tested using a sterile
10 mL syringe (Becton, Dickinson and Co.) fitted with a 27-gauge Monoject™ needle
(Sherwood Medical, St Louis, MO, USA).
3.6.3.2 Tube inversion method
Gelation of P407 samples was assessed at 37°C by inverting the vial to assess formulation flow.
P407 at 25% (w/v) was found to be injectable at 24°C and gel at 37°C.
3.6.3.3 In vitro gel stability studies
In vitro stability testing was carried out to assess the rate of dissolution of P407 gel. One
millilitre samples of 25% (w/v) P407 solution were incubated at 37°C in Eppendorf tubes to
induce gelation. The initial weight of the gel was recorded as W1. Two hundred microlitres of
PBS pre-warmed to 37°C was slowly added to the surface of the gel. The PBS was removed at
pre-determined time intervals, the weight of the remaining gel recorded (W2) and the
percentage gel weight loss calculated. This was repeated until the gel was completely degraded.
P407 was found to be completely degraded after 6 days. The dissolution profile was obtained
by plotting the cumulative weight of P407 gel formulations dissolved against time.
3.6.3.4 In vitro release studies
In vitro release of BM2 from P407 gel was assessed over 6 days, based on stability testing. An
aliquot of BM2 solution was thawed and diluted to produce a concentration of 400 µg/mL. P407
(2.5 g) was slowly added over 2-3 min to 8 mL sterile distilled water at 2-4°C in 20 mL glass
vials and stirred using a magnetic stirrer for 24 h to ensure complete dissolution. Eight hundred
µL aliquots of P407 solution were placed into 1 mL Eppendorf tubes together with either 200
µL of BM2 solution or 200 µL of sterile distilled water which served as a control to produce 1
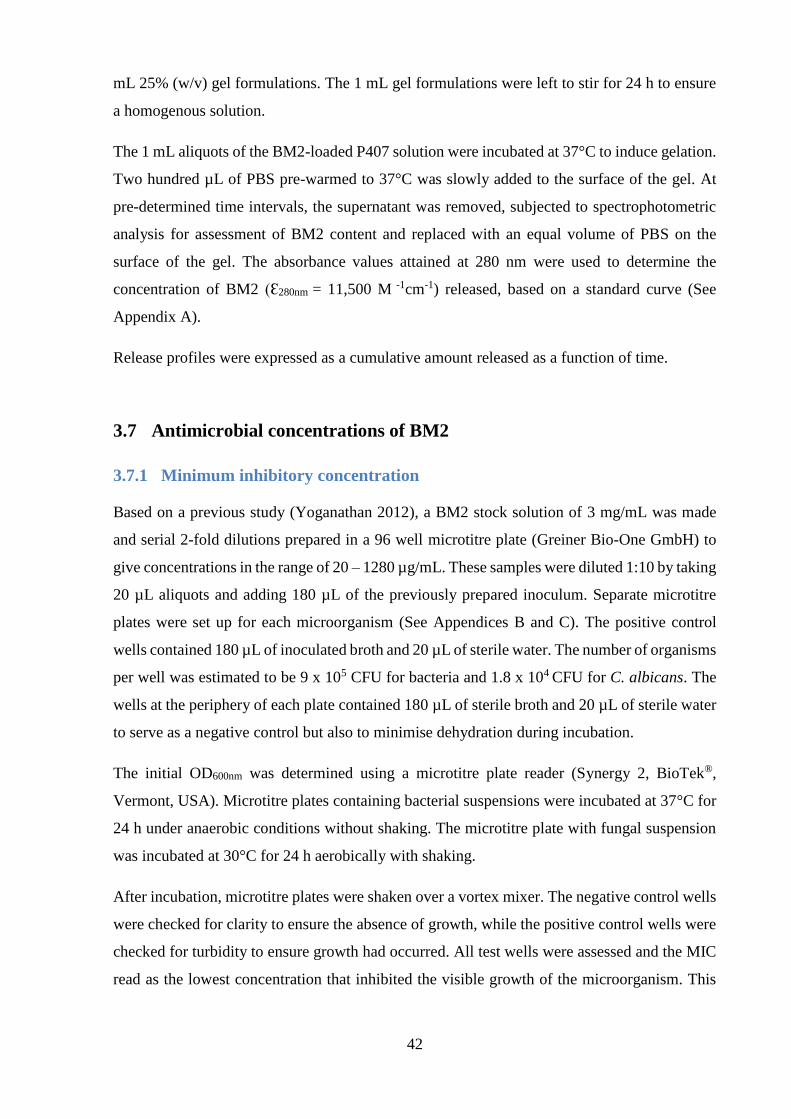
42
mL 25% (w/v) gel formulations. The 1 mL gel formulations were left to stir for 24 h to ensure
a homogenous solution.
The 1 mL aliquots of the BM2-loaded P407 solution were incubated at 37°C to induce gelation.
Two hundred µL of PBS pre-warmed to 37°C was slowly added to the surface of the gel. At
pre-determined time intervals, the supernatant was removed, subjected to spectrophotometric
analysis for assessment of BM2 content and replaced with an equal volume of PBS on the
surface of the gel. The absorbance values attained at 280 nm were used to determine the
concentration of BM2 (Ɛ280nm = 11,500 M -1cm-1) released, based on a standard curve (See
Appendix A).
Release profiles were expressed as a cumulative amount released as a function of time.
3.7 Antimicrobial concentrations of BM2
3.7.1 Minimum inhibitory concentration
Based on a previous study (Yoganathan 2012), a BM2 stock solution of 3 mg/mL was made
and serial 2-fold dilutions prepared in a 96 well microtitre plate (Greiner Bio-One GmbH) to
give concentrations in the range of 20 – 1280 µg/mL. These samples were diluted 1:10 by taking
20 µL aliquots and adding 180 µL of the previously prepared inoculum. Separate microtitre
plates were set up for each microorganism (See Appendices B and C). The positive control
wells contained 180 µL of inoculated broth and 20 µL of sterile water. The number of organisms
per well was estimated to be 9 x 10⁵ CFU for bacteria and 1.8 x 10⁴ CFU for C. albicans. The
wells at the periphery of each plate contained 180 µL of sterile broth and 20 µL of sterile water
to serve as a negative control but also to minimise dehydration during incubation.
The initial OD600nm was determined using a microtitre plate reader (Synergy 2, BioTek®,
Vermont, USA). Microtitre plates containing bacterial suspensions were incubated at 37°C for
24 h under anaerobic conditions without shaking. The microtitre plate with fungal suspension
was incubated at 30°C for 24 h aerobically with shaking.
After incubation, microtitre plates were shaken over a vortex mixer. The negative control wells
were checked for clarity to ensure the absence of growth, while the positive control wells were
checked for turbidity to ensure growth had occurred. All test wells were assessed and the MIC
read as the lowest concentration that inhibited the visible growth of the microorganism. This

43
was confirmed quantitatively by scanning the microtitre plates using a plate reader (Synergy 2,
BioTek®) and recording the final cell density at OD600nm.
This was repeated for P407 gel loaded with BM2 with concentrations in the range of 0 – 512
µg/mL to determine the minimum inhibitory concentration required for each strain. Three
independent tests were carried out for aqueous BM2 and P407 gel with BM2.
3.7.2 Minimum bactericidal and fungicidal concentration
Ten microlitre aliquots from the wells showing absence of growth were plated onto BHY agar
for bacterial strains and YPD agar for C. albicans to determine the MBC and MFC, respectively.
The agar plates were incubated accordingly for 24 h and assessed for growth. The lowest
concentration in which no colonies were observed after incubation was determined to be the
MBC or MFC.
3.8 Susceptibility testing of microbial cells
Based on determined MBC and MFC values and release studies, P407 gel was loaded with
varied concentrations of BM2 and tested for its effects on planktonic cells and reduction in
biofilm biomass. Three independent tests were carried out for each strain (n=15).
3.8.1 Planktonic cells
An aliquot of BM2 solution was thawed and serial 2-fold dilutions were carried out to produce
concentrations in the range of 2 – 512 µg/mL of BM2. P407 was prepared as previously
mentioned and was added to each prepared BM2 concentration ensuring a final concentration
of 25% (w/v) P407.
Six plates were set up for each strain, three for the P407 gel loaded with BM2 and three for
aqueous BM2, incubated for either 24 h, 48 h, or 72 h. Plates were set up as shown in Table
3.8.1 (See Appendices D and E).

44
3.8.2 Monospecies biofilms
3.8.2.1 Microtitre plate biofilm assay
3.8.2.1.1 Biofilm formation
Bacterial biofilms
Bacterial cells were inoculated in 3 mL of TSB and grown to a stationary phase overnight. One
mL of suspension was adjusted to OD600nm = 0.5 (~5 x 10⁸ CFU/mL). The culture was diluted
1:100 to 5 x 10⁶ CFU/mL by adding 200 L to 19.8 mL of TSB. An inoculum of 180 L of the
broth was added to each well of a 96 well microtitre plate (Greiner Bio-One GmbH) using a
multi-channel pipette. The number of cells per well was estimated to be ~9 x 10⁵ CFU. As a
negative control, wells at the periphery of the microtitre plate were filled with 180 L of sterile
TSB.
The sterile plastic lids were replaced on the microtitre plates and the plates incubated at 37°C
for 24 h in a modular atmosphere controlled system (Don Whitney Scientific Ltd, Stipley, West
Yorkshire, UK). Planktonic microbes were removed from the microtitre plates after 12 h by
removing 150 L of the growth medium and replacing it with 150 L sterile TSB.
Fungal biofilms
Fungal cells were inoculated in 3 mL of SD medium and grown to a stationary phase overnight.
One mL of suspension was adjusted to OD600nm = 0.5 (~107 CFU/mL).The culture was diluted
1:100 to 105 CFU/mL by adding 200 L to 19.8 mL of SD medium. An inoculum of 180 L of
the broth was added to each well of a 96 well microtitre plate (Greiner Bio-One GmbH) using
a multi-channel pipette. The number of cells per well is estimated to be 1.8 x 10⁴ CFU. As a
negative control, wells at the periphery of the microtitre plate were filled with 180 L of sterile
SD medium.
The sterile plastic lids were replaced on the microtitre plates and the plates incubated at 30°C
aerobically with shaking. Planktonic microbes were removed from the microtitre plates after 12
h by removing 150 L of the growth medium and replacing it with 150 L sterile SD medium.
After incubation for 24 h, the growth medium was removed. Wells were washed at least twice
with PBS. The removal of unattached microbes was considered complete once the PBS discard
appeared clear.

45
3.8.2.1.2 Exposure of biofilm to antimicrobials
An aliquot of BM2 solution was thawed and serial 2-fold dilutions were carried out to produce
concentrations in the range of 2 – 512 µg/mL of BM2. P407 was prepared as previously
mentioned and was added to each prepared BM2 concentration ensuring a final concentration
of 25% (w/v) P407. Biofilms grown in microtitre plates were exposed to BM2-P407
preparations, P407 gel, aqueous BM2 and saturated Ca(OH)₂ solution. Sterile PBS and sterile
growth media (TSB or SD medium) served as controls. Washed wells with attached biofilms
had 200 µL of test material added for 24, 48 or 72 h. Plates were set up as shown in Appendix
F. Microtitre plates with bacterial biofilms were incubated anaerobically at 37°C and fungal
biofilms incubated aerobically at 30°C with shaking.
After each exposure period, the antimicrobials and controls were removed, wells washed 3
times with sterile PBS and plates left to dry for 15 min. The effects of the substances on the
biofilm were assessed using a crystal violet assay.
3.8.2.2 Crystal violet assay
A 0.1% crystal violet solution (Sigma-Aldrich®) was prepared and filtered aseptically using a
sterile 25 mm diameter 0.22 µm syringe filter (Millex®, Merck Millipore) into a sterile glass
universal bottle. 125 µL of crystal violet solution was added to each well and left to stain for
10 min. Each plate was then inverted to remove the excess crystal violet solution. Wells were
washed 3 times with PBS, the microtitre plate inverted on a paper towel, briskly tapped to
remove excess liquid and left for 24 h to dry.
200 µL of 95% ethanol was added to each well to solubilise the bound crystal violet. The lids
of the microtitre plates were replaced and the ethanol left in the wells for 15 min at room
temperature. The contents of the wells were mixed using a vortex mixer and the absorbance of
each well was read at OD600nm (Synergy 2, BioTek®).
3.9 Statistical analysis
Continuous variables are represented as means and standard deviation from the OD results,
calculated using Microsoft Office Excel software. Statistical analysis was carried out using
SPSS (IBM® SPSS® Statistics for Windows, Version 24.0. Armonk, NY: IBM Corp).

46
Independent-samples t-tests were used to compare the means between two groups. One-way
analysis of variance (ANOVA) tests with post-hoc Tukey’s honest significant difference (HSD)
tests were carried out to compare the effects of concentration between more than two groups. P
values of < 0.05 were considered statistically significant.

47
Chapter 4: Results
4.1 Poloxamer 407
4.1.1 Formulation characterisation
P407 containing the cationic AMP, BM2, was successfully prepared by the cold method as
described by Schmolka (1972). A 25% (w/v) concentration of the polymer was chosen based
on preliminary studies that assessed viscosity and injectability. At P407 concentrations below
20% (w/v), the formulations existed as free-flowing liquids at ambient temperatures which were
too flowable and not suitable to be syringed. At concentrations above 25% (w/v), the
formulations were found to be too viscous at ambient temperatures and were not able to be
syringed. All the P407 formulations formed gels within 2 minutes at 37°C.
4.1.2 In vitro gel stability studies
The in vitro dissolution profiles of the P407 gels with and without incorporated BM2 at 37°C
are shown in Figure 4.1.2. For the control gel, 73.5%, 46.7%, and 33.6% of the gel remained
intact after 24 h, 48 h, and 72 h respectively. For the BM2-loaded gel, 78.2%, 58.3%, and 32.4%
of the gel remained intact after 24 h, 48 h, and 72 h respectively. Both formulations showed a
similar dissolution profile and were completely dissolved by 132 h, indicating that BM2 caused
no significant alteration to the stability of P407. In fact, a minor increase in the stability of P407
was observed.

48
Figure 4.1.2 In vitro gel stability of triblock copolymer hydrogel (P407) at 37°C in PBS over
time. The values plotted are mean ± standard deviation where n=9.
4.1.3 In vitro gel release studies
The time dependence of in vitro release of BM2 from the P407 gel was determined by
measuring the absorbance at 280nm associated with the tryptophan and phenylalanine of BM2.
The supernatant obtained from P407 vials without BM2 served as a blank.
Figure 4.1.3a illustrates the cumulative in vitro release of BM2 from P407 at 37°C. The amount
released is shown as a percentage of the total BM2 initially loaded into the gel. The mean
amount of BM2 released after 24 h, 48 h and 72 h was 17.4%, 26.1%, and 34.9% respectively.
Figure 4.1.3b shows the linear correlation between the proportion of BM2 released and P407
dissolution, measured by gel weight loss.
0
10
20
30
40
50
60
70
80
90
100
0 10 20 30 40 50 60 70 80 90 100 110 120 130 140
Gel
wei
gh
t lo
ss (
%)
Time (h)
P407
P407 + BM2

49
Figure 4.1.3a Time dependence of in vitro release of BM2 from P407 in PBS at 37°C. The
percentages shown are calculated as a proportion of the initial BM2 loaded into P407 gel (400
µg/mL). The values plotted are mean ± standard deviation where n=9.
Figure 4.1.3b Correlation between gel dissolution and cumulative release of BM2 in PBS at
37°C.
0
10
20
30
40
50
60
70
0 20 40 60 80 100 120 140
Cum
ula
te r
elea
se o
f B
M2 (
%)
Time (h)
0
10
20
30
40
50
60
70
0 20 40 60 80 100
Rel
ease
of
BM
2 (
%)
Gel weight loss (%)

50
4.2 Minimum inhibitory concentration of aqueous BM2
The MIC values for BM2 against a panel of important endodontic pathogens are shown in Table
4.2. These measurements were made as described in the materials and methods chapter by
detecting light scattering using a microtitre plate reader to read optical density at 600nm (See
Appendix H). Aqueous BM2 showed bacteriostatic activity against the different bacterial
strains tested and fungistatic activity against Candida albicans.
A BM2 concentration of 128 µg/mL completely inhibited the growth of all four strains. No
growth was observed at this concentration after 24 h of incubation. Streptococcus mutans NG8
was the most susceptible to BM2 with a MIC of 4 µg/mL. Enterococcus faecalis JH2-2 was the
least susceptible to BM2 with a MIC of 64 µg/mL. The initial OD values appeared to be higher
for concentrations of 64 µg/mL and 128 µg/mL for the three bacterial strains (See Appendices
J-L). Although the OD values after 24 h were still high, they were significantly lower than the
initial values. This, however, did not occur for C. albicans ATCC 10261 (See Appendix I).
Table 4.2 MIC values of BM2.
4.2.1 Candida albicans
The growth of C. albicans ATCC 10261 (Figure 4.2.1) after 24 h incubation was found to be
significantly higher at concentrations <32 µg/mL, as compared to concentrations ≥32 µg/mL (p
< 0.001) (See Appendix I). There was a statistically significant difference between growth at
16 µg/mL and 32 µg/mL (p = 0.001) but no significant difference between 32 µg/mL and 64
µg/mL (p = 0.07). The overall growth at 64 µg/mL and 128 µg/mL, as shown in the graph, was
negligible.
Strain Minimum inhibitory concentration BM2
(µg/mL)
Candida albicans ATCC 10261 32
Streptococcus gordonii DL1 16
Streptococcus mutans NG8 4
Enterococcus faecalis JH2-2 64

51
Figure 4.2.1 Growth of C. albicans ATCC 10261 after 24 hour exposure to varying
concentrations of aqueous BM2. The OD values plotted are mean ± standard deviation where
n=21.
4.2.2 Streptococcus gordonii
The growth of S. gordonii DL1 after exposure to aqueous BM2 is shown in Figure 4.2.2.
Exposure to BM2 at concentrations <16 µg/mL resulted in significantly higher growth as
compared to concentrations ≥16 µg/mL (p < 0.001) (See Appendix J). Negative OD values of
S. gordonii DL1 were observed at a concentration of 128 µg/mL.
-0.1
0.1
0.3
0.5
0.7
0.9
1.1
1.3
1.5
1.7
0 2 4 8 16 32 64 128
Cel
l gro
wth
(O
D6
00
nm
)
Concentration of BM2 (µg/mL)

52
Figure 4.2.2 Growth of S. gordonii DL1 after 24 hour exposure to varying concentrations of
aqueous BM2. The OD values plotted are mean ± standard deviation where n=21.
4.2.3 Streptococcus mutans
The mean OD values of S. mutans NG8 after exposure to aqueous BM2 for 24 h are shown in
Figure 4.2.3. There was a significant difference between cell growth after exposure to 2 µg/mL
and 4 µg/mL BM2 (p < 0.001) (See Appendix K). Similar to S. gordonii DL1, the OD values
of S. mutans NG8 at 128 µg/mL BM2 were negative.
-0.05
0.05
0.15
0.25
0.35
0.45
0.55
0.65
0 2 4 8 16 32 64 128
Cel
l gro
wth
(O
D6
00
nm
)
Concentration of BM2 (µg/mL)

53
Figure 4.2.3 Growth of S. mutans NG8 after 24 hour exposure to varying concentrations of
aqueous BM2. The OD values plotted are mean ± standard deviation where n=21.
4.2.4 Enterococcus faecalis
The growth of E. faecalis JH2-2 after exposure to aqueous BM2 for 24 h is shown in Figure
4.2.4. The mean growth at concentrations <64 µg/mL was significantly higher as compared to
concentrations ≥64 µg/mL (p < 0.001) (See Appendix L). At 64 µg/mL, the mean initial OD
values were not significantly different from OD values after 24 h (p = 0.084). Similar to S.
gordonii DL1 and S. mutans NG8, OD values at 600nm were negative when exposed to 128
µg/mL BM2.
-0.1
0
0.1
0.2
0.3
0.4
0.5
0 2 4 8 16 32 64 128
Cel
l gro
wth
(O
D6
00
nm
)
Concentration of BM2 (µg/mL)

54
Figure 4.2.4 Growth of E. faecalis JH2-2 after 24 hour exposure to varying concentrations of
aqueous BM2. The OD values plotted are mean ± standard deviation where n=21.
4.3 Minimum fungicidal and bactericidal concentration
The MFC and MBC values for BM2 are shown in Table 4.3. The most susceptible strain to
BM2 was S. mutans NG8 with an MBC value of 8 µg/mL, while E. faecalis JH2-2 was found
to be resistant to BM2 at the tested concentrations. BM2 demonstrated bacteriostatic and
bactericidal activity within the same range against S. gordonii DL1.
-0.05
0
0.05
0.1
0.15
0.2
0.25
0.3
0.35
0.4
0.45
0 2 4 8 16 32 64 128
Cel
l gro
wth
(O
D6
00
nm
)
Concentration of BM2 (µg/mL)

55
Table 4.3 MFC/MBC values of BM2.
4.4 Minimum inhibitory concentration of BM2-loaded P407 gel
P407 loaded with BM2 exhibited bacteriostatic activity against the panel of microbial strains
tested. The MIC values are shown in Table 4.4 and demonstrate that the combination of BM2
with P407 retained antimicrobial activity. The MIC values were found to be 8-fold higher than
those required for aqueous BM2 (See Appendix H). As was observed with aqueous BM2, S.
mutans NG8 was the most susceptible of the strains tested to P407 with BM2 requiring a BM2
concentration of 32 µg/mL. E. faecalis JH2-2 was the least susceptible requiring a BM2
concentration >512 µg/mL. It is noted that the growth of E. faecalis JH2-2 was substantially
(>90%) inhibited at 512 µg/mL BM2.
Table 4.4 MIC values of BM2-loaded P407 gel.
Strain
Minimum bactericidal/fungicidal
concentration of BM2
(µg/mL)
Candida albicans ATCC 10261 128
Streptococcus gordonii DL1 16
Streptococcus mutans NG8 8
Enterococcus faecalis JH2-2 > 128
Strain Minimum inhibitory concentration of BM2-P407
(µg/mL)
Candida albicans ATCC 10261 256
Streptococcus gordonii DL1 128
Streptococcus mutans NG8 32
Enterococcus faecalis JH2-2 >512
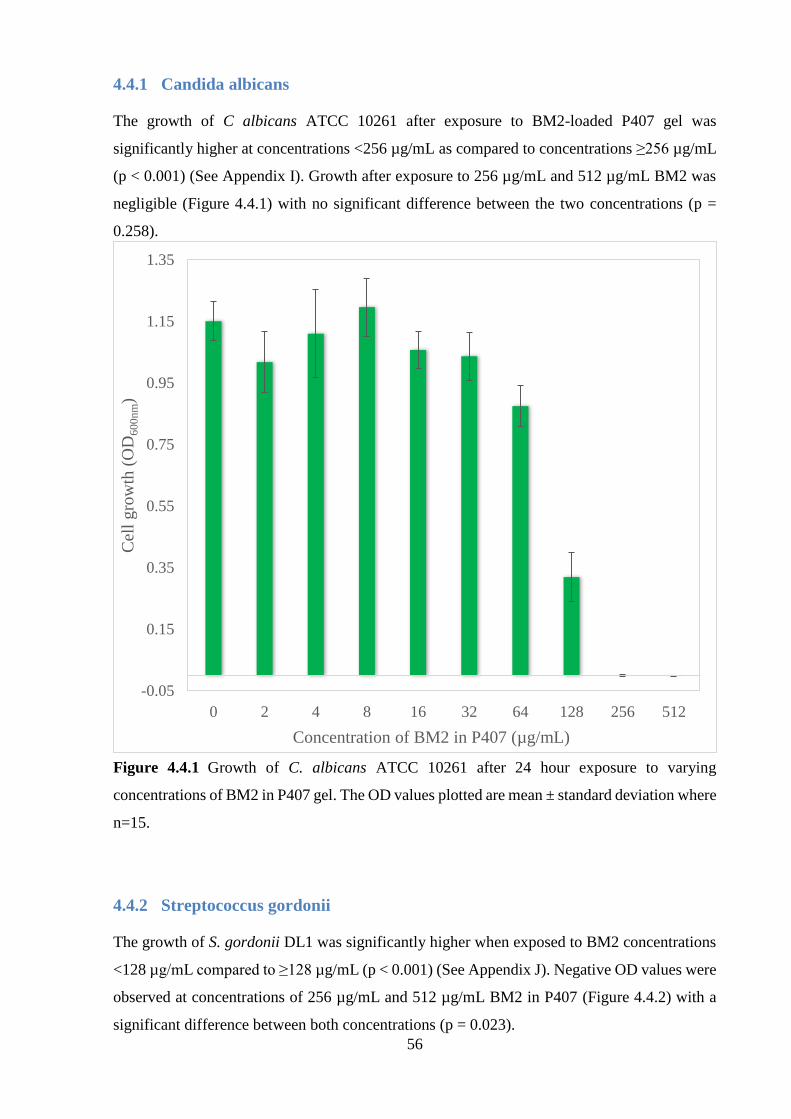
56
4.4.1 Candida albicans
The growth of C albicans ATCC 10261 after exposure to BM2-loaded P407 gel was
significantly higher at concentrations <256 µg/mL as compared to concentrations ≥256 µg/mL
(p < 0.001) (See Appendix I). Growth after exposure to 256 µg/mL and 512 µg/mL BM2 was
negligible (Figure 4.4.1) with no significant difference between the two concentrations (p =
0.258).
Figure 4.4.1 Growth of C. albicans ATCC 10261 after 24 hour exposure to varying
concentrations of BM2 in P407 gel. The OD values plotted are mean ± standard deviation where
n=15.
4.4.2 Streptococcus gordonii
The growth of S. gordonii DL1 was significantly higher when exposed to BM2 concentrations
<128 µg/mL compared to ≥128 µg/mL (p < 0.001) (See Appendix J). Negative OD values were
observed at concentrations of 256 µg/mL and 512 µg/mL BM2 in P407 (Figure 4.4.2) with a
significant difference between both concentrations (p = 0.023).
-0.05
0.15
0.35
0.55
0.75
0.95
1.15
1.35
0 2 4 8 16 32 64 128 256 512
Cel
l g
row
th (
OD
60
0n
m)
Concentration of BM2 in P407 (µg/mL)

57
Figure 4.4.2 Growth of S. gordonii DL1 after 24 hour exposure to varying concentrations of
BM2 in P407 gel. The OD values plotted are mean ± standard deviation where n=15.
4.4.3 Streptococcus mutans
The growth of S. mutans NG8 was found to be significantly higher at BM2 concentrations in
P407 <32 µg/mL compared to ≥32 µg/mL (p < 0.001) (See Appendix K). Similar to S. gordonii
DL1, the OD values at 512 µg/mL BM2 were negative (Figure 4.4.3).
-0.03
0.02
0.07
0.12
0.17
0.22
0.27
0.32
0 2 4 8 16 32 64 128 256 512
Cel
l gro
wth
(O
D6
00
nm
)
Concentration of BM2 in P407 (µg/mL)

58
Figure 4.4.3 Growth of S. mutans NG8 after 24 hour exposure to varying concentrations of
BM2 in P407 gel. The OD values plotted are mean ± standard deviation where n=15.
4.4.4 Enterococcus faecalis
The growth of E. faecalis JH2-2 after exposure to BM2 in P407 gel is shown in Figure 4.4.4.
Exposure to BM2, in gel, at all concentrations was found to result in statistically significant
growth (p < 0.001) (See Appendix L). Growth at 512 µg/mL BM2 was significantly lower than
concentrations <512 µg/mL but the OD values at 24 h were still statistically significant when
compared to initial OD values (p < 0.001).
-0.04
-0.02
0
0.02
0.04
0.06
0.08
0.1
0.12
0.14
0 2 4 8 16 32 64 128 256 512
Cel
l gro
wth
(O
D6
00
nm
)
Concentration of BM2 in P407 (µg/mL)

59
Figure 4.4.4 Growth of E. faecalis JH2-2 after 24 hour exposure to varying concentrations of
BM2 in P407 gel medium. The OD values plotted are mean ± standard deviation where n=15.
4.5 Susceptibility testing of planktonic cells
The sets of OD600nm values obtained from susceptibility testing of planktonic cells of the test
panel over 72 h are shown in Appendices D and E. The experimental agents (BM2, P407 gel
alone, and BM2 incorporated into P407 gel) showed differing antimicrobial activities compared
with the controls (sterile water and calcium hydroxide). The antimicrobial activity of BM2-
loaded P407 gel was compared to corresponding aqueous concentrations of the peptide,
according to preliminary in vitro release studies using concentrations of BM2 expected to be
released from the gel (Figures 4.1.3a and 4.1.3b).
0
0.02
0.04
0.06
0.08
0.1
0.12
0.14
0.16
0.18
0.2
0 2 4 8 16 32 64 128 256 512
Cel
l gro
wth
(O
D6
00
nm
)
Concentration of BM2 in P407 (µg/mL)

60
4.5.1 Candida albicans
The growth of C. albicans ATCC 10261 incubated for 72 h with BM2 concentrations of 256
µg/mL or 512 µg/mL in P407 was negligible (Figure 4.5.1a). Growth was significantly lower
at these concentrations compared to P407 gel alone, calcium hydroxide and the sterile water
control after 72 h (p < 0.001). No significant difference in growth was observed between BM2
concentrations of 256 µg/mL or 512 µg/mL at any time period (p > 0.05).
At concentrations of BM2 below 256 µg/mL, growth was highly statistically significant as
compared to 256 µg/mL and 512 µg/mL (p < 0.001) (data not shown).
After 24 h, growth of C. albicans was significantly lower with calcium hydroxide compared to
P407 gel alone, BM2 in P407 at concentrations <256 µg/mL (data not shown), and sterile water
(p < 0.001). Growth, however, increased after 24 h to a level that was higher than all gel
formulations up to 72 h. All gel formulations, including P407 without the incorporation of BM2
as well as calcium hydroxide, showed significantly less growth compared to sterile water at all
time periods (p < 0.001) (Figure 4.5.1a).
Figure 4.5.1a Growth of C. albicans ATCC 10261 after exposure to P407 gel, P407 gel with
256 µg/mL and 512 µg/mL, and controls (calcium hydroxide and sterile water) over 72 hours.
The OD values plotted are mean ± standard deviation where n=15.
-0.1
0.1
0.3
0.5
0.7
0.9
1.1
1.3
1.5
1.7
1.9
0 24 48 72
Cel
l g
row
th (
OD
60
0n
m)
Time (h)
BM2 256
BM2 512
Ca(OH)2
P407
Sterile water

61
When compared to aqueous BM2, higher concentrations of BM2 were required when
incorporated into a gel medium in order to elicit the same antimicrobial effects. After exposure
for 24 h, an aqueous concentration of 32 µg/mL BM2 was required to inhibit growth of C.
albicans. After 48 h and 72 h exposure, however, growth began to occur which was statistically
significant from that after 24 h (p < 0.001) (Figure 4.5.1b). Figure 4.5.1b shows the growth of
C. albicans when exposed to 256 µg/mL BM2 in P407 with the corresponding concentrations
in solution, taking into consideration proportion of BM2 release from the gel (Figure 4.1.3a).
A concentration of 128 µg/mL aqueous BM2 was required to block growth completely at a
level comparable to 256 µg/mL BM2 incorporated into P407 (p = 0.5).
Figure 4.5.1b Growth of C. albicans ATCC 10261 after exposure to 256 µg/mL BM2
incorporated into P407 compared to corresponding aqueous concentrations over 72 hours. The
OD values plotted are mean ± standard deviation where n=15.
-0.05
0.05
0.15
0.25
0.35
0.45
0.55
0.65
0.75
0 24 48 72
Cel
l g
row
th (
OD
60
0n
m)
Time (h)
256 µg/mL BM2-P407
32 µg/mL BM2
64 µg/mL BM2
128 µg/mL BM2

62
Figure 4.5.1c shows the growth of C. albicans when exposed to 512 µg/mL BM2 in P407 with
the corresponding concentrations in solution. After 48 h exposure to 512 µg/mL BM2-loaded
P407 gel, growth was significantly lower when compared to 64, 128, and 256 µg/mL aqueous
BM2 (p < 0.001). After 72 h exposure, growth was significantly lower than 64 µg/mL and 128
µg/mL BM2 (p < 0.001) but comparable to 256 µg/mL BM2 (p = 0.106).
Figure 4.5.1c Growth of C. albicans ATCC 10261 after exposure to 512 µg/mL BM2 in P407
compared to corresponding concentrations in solution over 72 hours. The OD values plotted
are mean ± standard deviation where n=15.
4.5.2 Streptococcus gordonii
All gel formulations, including P407 alone, diminished cell growth significantly when S.
gordonii DL1 was exposed for 72 h compared to 48 h (p < 0.001). The mean OD was found to
be inversely proportional to the concentration of BM2 incorporated into P407 gel. Increasing
-0.05
0.05
0.15
0.25
0.35
0.45
0.55
0.65
0.75
0 24 48 72
Cel
l g
row
th (
OD
60
0n
m)
Time (h)
512 µg/mL BM2-P407
64 µg/mL BM2
128 µg/mL BM2
256 µg/mL BM2

63
concentrations were associated with decreasing mean OD values with a significant reduction in
OD with concentrations ≥64 µg/mL.
The growth of S. gordonii DL1 after incubation for 72 h was negligible when exposed to BM2
concentrations ≥128 µg/mL in P407 with negative overall OD values observed at 256 µg/mL
and 512 µg/mL (Figure 4.4.2a). Significant differences were observed between 128 µg/mL, 256
µg/mL, and 512 µg/mL BM2 (p < 0.001). Growth at these concentrations was significantly
lower when compared to BM2 concentrations <128 µg/mL, P407 gel alone, calcium hydroxide
and sterile water over the 72 h period (p < 0.001).
Calcium hydroxide slightly inhibited the growth of S. gordonii DL1 when exposed for 24 h
with OD values nearly comparable to that of the sterile water control. After 24 h, however,
growth in the presence of calcium hydroxide was significantly higher as compared to all P407
gel formulations and sterile water (Figure 4.5.2a) (p < 0.001).
Figure 4.5.2a Growth of S. gordonii DL1 after exposure to P407 gel, P407 gel with 128 µg/mL,
256 µg/mL and 512 µg/mL, and controls (calcium hydroxide and sterile water) over 72 hours.
The OD values plotted are mean ± standard deviation where n=15.
-0.05
0.05
0.15
0.25
0.35
0.45
0.55
0.65
0 24 48 72
Cel
l g
row
th (
OD
60
0n
m)
Time (h)
BM2 128
BM2 256
BM2 512
Ca(OH)2
P407
Sterile water

64
Aqueous BM2 demonstrated antimicrobial activity at concentrations significantly lower than
that of BM2-loaded P407, however, when taking into consideration proportion of release of
BM2 from the gel, both mediums demonstrated comparable results. After exposure for 24 h, a
concentration of 16 µg/mL BM2 in aqueous form elicited negligible growth. However, when
exposed for a period of 72 h, an increase in growth was observed which was found to be
significant from that after 24 h (p < 0.001) (Figure 4.5.2b). It was only at 64 µg/mL BM2 in
solution that a bacteriostatic effect was observed over the 72 h time period. Aqueous
concentrations >64 µg/mL resulted in no growth.
Figure 4.5.2b shows the growth of S. gordonii when exposed to 128 µg/mL BM2 in P407.
Preliminary release studies showed that approximately 26% and 35% of BM2 should be
released from P407 after 48 h and 72 h respectively. When compared to the corresponding
aqueous preparations of BM2 up to 32 µg/mL, BM2 in P407 gel medium at a concentration of
128 µg/mL demonstrated significantly less growth after 48 h and 72 h (Figure 4.5.2b) (p <
0.001). As expected, aqueous BM2 at 64 µg/mL was slightly more effective than 128 µg/mL
BM2 in P407 gel (Figure 4.5.2b) and not as effective as 256 µg/mL BM2 in P407 gel (Figure
4.5.2c).
Figure 4.5.2b Growth of S. gordonii DL1 after exposure to 128 µg/mL BM2 in P407 compared
to corresponding concentrations in solution over 72 hours. The OD values plotted are mean ±
standard deviation where n=15.
-0.005
0
0.005
0.01
0.015
0.02
0.025
0.03
0.035
0.04
0 24 48 72
Cel
l g
row
th (
OD
60
0n
m)
Time (h)
128 µg/mL BM2-P407
16 µg/mL BM2
32 µg/mL BM2
64 µg/mL BM2

65
Figure 4.5.2c shows the growth of S. gordonii DL1 after exposure to 256 µg/mL BM2 in P407
with the equivalent aqueous concentrations. After 48 h, S. gordonii exhibited significantly less
growth with 256 µg/mL BM2 in a gel medium compared to 64 µg/mL BM2 in aqueous form
(p < 0.001).
Figure 4.5.2c Growth of S. gordonii DL1 after exposure to 256 µg/mL BM2 in P407 compared
to corresponding concentrations in solution over 72 hours. The OD values plotted are mean ±
standard deviation where n=15.
.
4.5.3 Streptococcus mutans
P407 alone appeared to have no antimicrobial effect on S. mutans NG8 with OD values
comparable to sterile water (p = 0.670). The incorporation of BM2, however, into P407
demonstrated significantly lower OD values compared to sterile water (p < 0.001).
-0.01
-0.005
0
0.005
0.01
0.015
0.02
0.025
0.03
0 24 48 72
Cel
l g
row
th (
OD
60
0n
m)
Time (h)
256 µg/mL BM2-P407
32 µg/mL BM2
64 µg/mL BM2

66
The growth of S. mutans NG8 after incubation for 72 h was negligible when exposed to BM2
in P407 gel at concentrations ≥32 µg/mL. When compared to P407 gel, P407 gel with BM2
concentrations <32 µg/mL, calcium hydroxide and sterile water, there was significantly less
growth with BM2 concentrations ≥32 µg/mL (p < 0.001). No significant differences were
observed between concentrations of 32-256 µg/mL (p > 0.05) at any time period but a
significant reduction in OD was found for 512 µg/mL (p < 0.001) (data not shown).
Growth was significantly higher with calcium hydroxide compared to all experimental groups
as well as P407 gel alone and sterile water at all time periods (p < 0.001) (Figure 4.5.3a).
Figure 4.5.3a Growth of S. mutans NG8 after exposure to P407 gel, P407 gel with 16 µg/mL,
32 µg/mL and 64 µg/mL, and controls (calcium hydroxide and sterile water) over 72 hours. The
OD values plotted are mean ± standard deviation where n=15.
When compared to aqueous BM2, higher concentrations of BM2 were required when using a
gel medium to elicit the same antimicrobial effects. After exposure for 24 h, a concentration of
4 µg/mL aqueous BM2 demonstrated antimicrobial activity that was significantly different
-0.02
0.02
0.06
0.1
0.14
0.18
0.22
0.26
0 24 48 72
Cel
l g
row
th (
OD
60
0n
m)
Time (h)
BM2 16
BM2 32
BM2 64
Ca(OH)2
Sterile water
P407

67
from 2 µg/mL (p < 0.001). After 48 h and 72 h exposure, however, growth began to occur which
was statistically significant from that after 24 h (p < 0.001). Concentrations ≥8 µg/mL resulted
in negligible growth at all time periods.
The growth of S. mutans when exposed to BM2 at a concentration of 32 µg/mL in P407 gel is
shown in Figure 4.5.3b, together with the aqueous counterparts. After 48 h, approximately 8
µg/mL of BM2 should be released from P407 loaded with 32 µg/mL BM2, according to in vitro
release testing. The growth of S. mutans when exposed to P407 loaded with 32 µg/mL BM2 for
48 h, however, was found to be significantly lower than growth after exposure to 8 µg/mL
aqueous BM2. After 72 h, there was no significant difference between BM2-loaded P407 at a
concentration of 32 µg/mL and 16 µg/mL BM2 in solution (p = 0.418).
Figure 4.5.3b Growth of S. mutans NG8 after exposure to 32 µg/mL BM2 in P407 compared
to corresponding aqueous concentrations over 72 hours. The OD values plotted are mean ±
standard deviation where n=15.
-0.005
0.015
0.035
0.055
0.075
0.095
0 24 48 72
Cel
l g
row
th (
OD
60
0n
m)
Time (h)
32 µg/mL BM2-P407
4 µg/mL BM2
8 µg/mL BM2
16 µg/mL BM2

68
4.5.4 Enterococcus faecalis
The growth of E. faecalis JH2-2 was negligible only when exposed to P407 loaded with 512
µg/mL BM2. Slight growth occurred after 24 h, however, after 48 h and 72 h no growth was
observed (Figure 4.5.4a). Considerable growth occurred in the presence of P407 gel alone,
calcium hydroxide, and sterile water within 24 h (p < 0.001).
All gel formulations including P407 alone demonstrated some antimicrobial activity,
represented by mean OD values which were significantly lower as compared to calcium
hydroxide and sterile water (p < 0.001). All formulations resulted in OD values which decreased
with time.
When exposed to calcium hydroxide, the growth of E. faecalis was found to be significantly
lower compared to sterile water (p < 0.001) but still significantly higher than all gel
formulations (p < 0.001).
Figure 4.5.4a Growth of E. faecalis JH2-2 after exposure to P407 gel, P407 gel with 256 µg/mL
and 512 µg/mL, and controls (calcium hydroxide and sterile water) over 72 hours. The OD
values plotted are mean ± standard deviation where n=15.
-0.01
0.04
0.09
0.14
0.19
0.24
0.29
0 24 48 72
Cel
l g
row
th (
OD
60
0n
m)
Time (h)
BM2 256
BM2 512
Ca(OH)2
P407
Sterile water

69
The growth of E. faecalis after exposure to 512 µg/mL BM2 in P407 gel was compared to the
aqueous BM2 concentrations expected to be released from the gel. After 48 h, growth was
completely inhibited when exposed to 512 µg/mL BM2 in P407, which was significantly lower
than the corresponding aqueous BM2 concentration of 128 µg/mL (Figure 4.5.4b).
Figure 4.5.4b Growth of E. faecalis JH2-2 after exposure to 512 µg/mL BM2 in P407
compared to corresponding aqueous concentrations over 72 hours. The OD values plotted are
mean ± standard deviation where n=15.
-0.02
0
0.02
0.04
0.06
0.08
0.1
0 24 48 72
Cel
l g
row
th (
OD
60
0n
m)
Time (h)
512 µg/mL BM2-P407
64 µg/mL BM2
128 µg/mL BM2
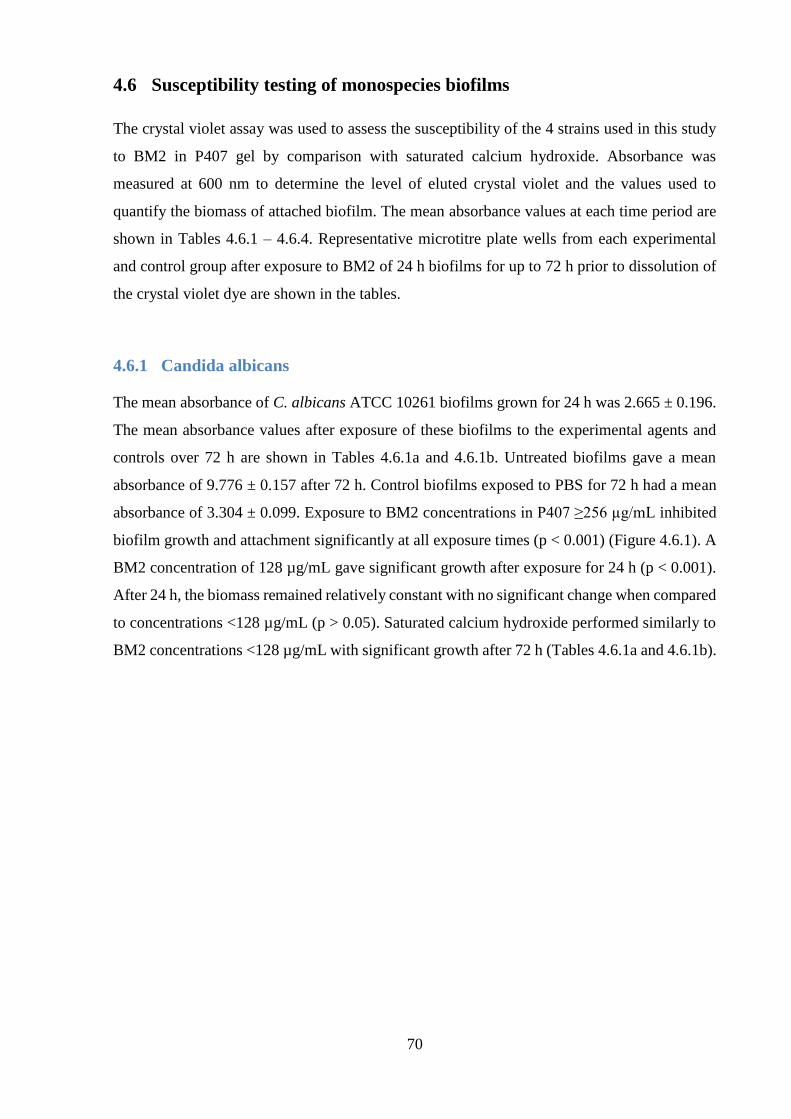
70
4.6 Susceptibility testing of monospecies biofilms
The crystal violet assay was used to assess the susceptibility of the 4 strains used in this study
to BM2 in P407 gel by comparison with saturated calcium hydroxide. Absorbance was
measured at 600 nm to determine the level of eluted crystal violet and the values used to
quantify the biomass of attached biofilm. The mean absorbance values at each time period are
shown in Tables 4.6.1 – 4.6.4. Representative microtitre plate wells from each experimental
and control group after exposure to BM2 of 24 h biofilms for up to 72 h prior to dissolution of
the crystal violet dye are shown in the tables.
4.6.1 Candida albicans
The mean absorbance of C. albicans ATCC 10261 biofilms grown for 24 h was 2.665 ± 0.196.
The mean absorbance values after exposure of these biofilms to the experimental agents and
controls over 72 h are shown in Tables 4.6.1a and 4.6.1b. Untreated biofilms gave a mean
absorbance of 9.776 ± 0.157 after 72 h. Control biofilms exposed to PBS for 72 h had a mean
absorbance of 3.304 ± 0.099. Exposure to BM2 concentrations in P407 ≥256 µg/mL inhibited
biofilm growth and attachment significantly at all exposure times (p < 0.001) (Figure 4.6.1). A
BM2 concentration of 128 µg/mL gave significant growth after exposure for 24 h (p < 0.001).
After 24 h, the biomass remained relatively constant with no significant change when compared
to concentrations <128 µg/mL (p > 0.05). Saturated calcium hydroxide performed similarly to
BM2 concentrations <128 µg/mL with significant growth after 72 h (Tables 4.6.1a and 4.6.1b).

71
Table 4.6.1a C. albicans biofilm biomass following exposure to varying concentrations of BM2
in P407 over 72 hours and representative microtitre plate wells with crystal violet stain after
exposure for 72 hours. The OD values are mean ± standard deviation where n=15.
Concentration
of BM2 in P407
(µg/mL)
Time (h) CV stain
after 72 h 0 24 48 72
0 2.640 ± 0.139 4.098 ± 0.182 5.100 ± 0.107 5.970 ± 0.121
2 2.678 ± 0.311 4.002 ± 0.145 5.080 ± 0.131 5.890 ± 0.105
4 2.762 ± 0.179 4.028 ± 0.145 5.074 ± 0.109 5.728 ± 0.192
8 2.736 ± 0.250 4.012 ± 0.104 4.920 ± 0.148 5.502 ± 0.126
16 2.686 ± 0.122 4.090 ± 0.167 4.950 ± 0.155 5.560 ± 0.157
32 2.652 ± 0.191 4.026 ± 0.117 4.840 ± 0.119 5.528 ± 0.113
64 2.708 ± 0154 3.964 ± 0.077 4.756 ± 0.137 5.636 ± 0.128
128 2.742 ± 0.144 3.554 ± 0.121 3.676 ± 0.093 3.806 ± 0.102
256 2.566 ± 0.119 1.314 ± 0.146 0.870 ± 0.052 0.634 ± 0.017
512 2.734 ± 0.188 1.060 ± 0.126 0.828 ± 0.156 0.484 ± 0.030

72
Table 4.6.1b C. albicans biofilm biomass following exposure to controls over 72 hours and
representative microtitre plate wells with crystal violet stain after exposure for 72 hours. The
OD values are mean ± standard deviation where n=15.
Concentration
of BM2 in P407
(µg/mL)
Time (h) CV stain
after 72 h 0 24 48 72
Ca(OH)2 2.656 ± 0.151 2.956 ± 0.102 4.152 ± 0.150 5.260 ± 0.154
PBS 2.504 ± 0.217 2.684 ± 0.142 2.866 ± 0.118 3.304 ± 0.099
Growth
Media 2.584 ± 0.182 6.492 ± 0.094 7.774 ± 0.122 9.776 ± 0.157
Figure 4.6.1 C. albicans biofilm biomass following exposure to experimental agents and
controls for 72 hours. The OD values plotted are mean ± standard deviation where n=15.
0
2
4
6
8
10
12
Initial
biomass
PBS Growth
Media
P407 128
µg/mL
256
µg/mL
512
µg/mL
Ca(OH)2
Ab
sorb
ance
(O
D6
00
nm
)
BM2 in P407

73
4.6.2 Streptococcus gordonii
The mean OD of S. gordonii DL1 biofilms was 1.898 ± 0.147 after 24 h. The mean OD values
after exposure to all experimental agents and controls over 72 h is shown in Tables 4.6.2a and
4.6.2b. Control biofilms exposed to PBS for 72 h had a mean OD of 4.470 ± 0.319, however,
significant growth was observed over this period (p < 0.001). Biofilm biomass disruption was
observed at BM2 concentrations ≥ 128 µg/mL over 72 h while growth was observed for
concentrations < 128 µg/mL. BM2 at a concentration of 64 µg/mL resulted in initial growth,
however, demonstrated disruption of the biofilm after 24 h.
Exposure to saturated calcium hydroxide for 72 h resulted in growth which was significantly
higher than growth after exposure to all BM2-loaded gels (p < 0.001). Figure 4.6.2 shows the
effect of BM2 concentrations of 64 µg/mL and higher on the biomass after 72 h compared to
PBS and saturated calcium hydroxide.
Table 4.6.2a S. gordonii biofilm biomass following exposure to varying concentrations of BM2
in P407 over 72 hours and representative microtitre plate wells with crystal violet stain after
exposure for 72 hours. The OD values are mean ± standard deviation where n=15.
Concentration
of BM2 in P407
(µg/mL)
Time (h) CV stain
after 72 h 0 24 48 72
0 1.926 ± 0.141 3.476 ± 0.151 4.874 ± 0.225 5.080 ± 0.120
2 1.924 ± 0.133 3.534 ± 0.138 4.494 ± 0.165 4.914 ± 0.193
4 1.884 ± 0.209 3.546 ± 0.147 4.112 ± 0.213 4.704 ± 0.116
8 1.962 ± 0.206 3.454 ± 0.164 3.980 ± 0.139 4.584 ± 0.190
16 1.888 ± 0.129 3.314 ± 0.216 3.888 ± 0.117 4.406 ± 0.139

74
32 1.872 ± 0.101 3.234 ± 0.155 3.794 ± 0.124 4.264 ± 0.131
64 1.956 ± 0.173 3.336 ± 0.089 3.060 ± 0.059 2.356 ± 0.088
128 1.956 ± 0.123 1.842 ± 0.108 1.780 ± 0.143 1.684 ± 0.118
256 1.914 ± 0.094 1.810 ± 0.091 1.680 ± 0.099 1.504 ± 0.106
512 1.836 ± 0.112 1.728 ± 0.045 1.476 ± 0.091 1.236 ± 0.066
Table 4.6.2b S. gordonii biofilm biomass following exposure to controls over 72 hours and
representative microtitre plate wells with crystal violet stain after exposure for 72 hours. The
OD values are mean ± standard deviation where n=15.
Concentration
of BM2 in P407
(µg/mL)
Time (h) CV stain
after 72 h 0 24 48 72
Ca(OH)2 1.818 ± 0.079 3.336 ± 0.105 4.756 ± 0.173 5.654 ± 0.136
PBS 1.846 ± 0.193 3.352 ± 0.142 3.896 ± 0.190 4.470 ± 0.319
Growth
Media 1.896 ± 0.106 6.210 ± 0.191 7.812 ± 0.402 9.076 ± 0.204

75
Figure 4.6.2 S. gordonii biofilm biomass following exposure to experimental agents and
controls for 72 hours. The OD values plotted are mean ± standard deviation where n=15.
4.6.3 Streptococcus mutans
The mean OD of S. mutans NG8 biofilms after 24 h was 1.862 ± 0.117. The mean OD values
after exposure to all experimental agents and controls over 72 h are shown in Tables 4.6.3a and
4.6.3b. After 72 h, the mean OD of S. mutans biofilms exposed to PBS was 4.052 ± 0.151.
Significant biofilm detachment was observed when exposed to BM2-loaded P407 at
concentrations ≥ 32 µg/mL for 72 h.
Saturated calcium hydroxide also demonstrated biofilm disruption which was statistically
significant as compared to control biofilms exposed to PBS (p < 0.001) (Figure 4.6.3).
0
1
2
3
4
5
6
7
8
9
10
Initial
biomass
PBS Growth
Media
P407 64
µg/mL
128
µg/mL
256
µg/mL
512
µg/mL
Ca(OH)2
Ab
sorb
ance
(O
D6
00
nm
)
BM2 in P407

76
Table 4.6.3a S. mutans biofilm biomass following exposure to varying concentrations of BM2
in P407 over 72 hours and representative microtitre plate wells with crystal violet stain after
exposure for 72 hours. The OD values are mean ± standard deviation where n=15.
Concentration
of BM2 in P407
(µg/mL)
Time (h) CV stain
after 72 h 0 24 48 72
0 1.890 ± 0.114 4.190 ± 0.306 5.670 ± 0.243 6.402 ± 0.278
2 1.850 ± 0.094 3.632 ± 0.190 4.938 ± 0.229 6.102 ± 0.089
4 1.834 ± 0.119 3.494 ± 0.090 4.646 ± 0.241 5.938 ± 0.251
8 1.848 ± 0.165 3.490 ± 0.210 4.724 ± 0.310 5.978 ± 0.269
16 1.814 ± 0.074 3.210 ± 0.270 3.560 ± 0.131 3.710 ± 0.112
32 1.850 ± 0.107 1.816 ± 0.090 1.758 ± 0.095 1.672 ± 0.051
64 1.878 ± 0.103 1.834 ± 0.080 1.738 ± 0.053 1.676 ± 0.054
128 1.870 ± 0.122 1.790 ± 0.068 1.690 ± 0.040 1.520 ± 0.061
256 1.888 ± 0.083 1.784 ± 0.076 1.684 ± 0.041 1.468 ± 0.054
512 1.892 ± 0.148 1.782 ± 0.101 1.606 ± 0.089 1.342 ± 0.047
77
Table 4.6.3b S. mutans biofilm biomass following exposure to controls over 72 hours and
representative microtitre plate wells with crystal violet stain after exposure for 72 hours. The
OD values are mean ± standard deviation where n=15.
Concentration
of BM2 in P407
(µg/mL)
Time (h) CV stain
after 72 h 0 24 48 72
Ca(OH)2 1.908 ± 0.142 4.534 ± 0.219 3.178 ± 0.084 2.222 ± 0.148
PBS 1.856 ± 0.136 3.412 ± 0.146 3.634 ± 0.282 4.052 ± 0.151
Growth
Media 1.828 ± 0.089 6.216 ± 0.135 7.730 ± 0.207 8.856 ± 0.209
Figure 4.6.3 S. mutans biofilm biomass following exposure to experimental agents and controls
for 72 hours. The OD values plotted are mean ± standard deviation where n=15.
0
1
2
3
4
5
6
7
8
9
10
Initial
biomass
PBS Growth
Media
P407 16 µg/mL 32 µg/mL 64 µg/mL Ca(OH)2
Ab
sorb
ance
(O
D6
0n
m)
BM2 in P407

78
4.6.4 Enterococcus faecalis
The mean OD of E. faecalis JH2-2 biofilms was 0.422 ± 0.020 after 24 h, which was found to
be significantly lower than the other bacterial biofilms (p < 0.001). The mean OD values after
exposure to all experimental agents and controls over 72 h are shown in Tables 4.6.4a and
4.6.4b. The mean OD of control biofilms exposed to PBS for 72 h was 0.475 ± 0.008. A BM2
concentration of 512 µg/mL in gel medium was required in order to disrupt the biofilm with a
mean OD of 0.253 ± 0.015 after exposure for 72 h (Figure 4.6.4). BM2 concentrations < 512
µg/mL resulted in growth at all time periods with OD values significantly higher than PBS (p
< 0.001).
Saturated calcium hydroxide did not appear to cause any biofilm detachment, with an increase
in the mean OD over 72 h which was significantly higher than all gel formulations (p < 0.001).
Table 4.6.4a E. faecalis biofilm biomass following exposure to varying concentrations of BM2
in P407 over 72 hours and representative microtitre plate wells with crystal violet stain after
exposure for 72 hours. The OD values are mean ± standard deviation where n=15.
Concentration
of BM2 in P407
(µg/mL)
Time (h) CV stain
after 72 h 0 24 48 72
0 0.411 ± 0.017 0.608 ± 0.019 0.716 ± 0.015 0.832 ± 0.010
2 0.416 ± 0.020 0.594 ± 0.012 0.694 ± 0.016 0.816 ± 0.014
4 0.428 ± 0.020 0.593 ± 0.017 0.699 ± 0.009 0.815 ± 0.008
8 0.434 ± 0.010 0.588 ± 0.013 0.695 ± 0.008 0.799 ± 0.018
16 0.421 ± 0.012 0.572 ± 0.017 0.673 ± 0.012 0.795 ± 0.012

79
32 0.424 ± 0.023 0.570 ± 0.016 0.671 ± 0.015 0.787 ± 0.021
64 0.427 ± 0.022 0.577 ± 0.012 0.666 ± 0.018 0.776 ± 0.020
128 0.433 ± 0.021 0.571 ± 0.007 0.646 ± 0.017 0.742 ± 0.019
256 0.421 ± 0.025 0.539 ± 0.019 0.550 ± 0.020 0.562 ± 0.013
512 0.410 ± 0.012 0.468 ± 0.016 0.363 ± 0.022 0.253 ± 0.015
Table 4.6.4b E. faecalis biofilm biomass following exposure to controls over 72 hours and
representative microtitre plate wells with crystal violet stain after exposure for 72 hours. The
OD values plotted are ± standard deviation where n=15.
Concentration
of BM2 in P407
(µg/mL)
Time (h) CV stain
after 72 h 0 24 48 72
Ca(OH)2 0.432 ±
0.021
0.561 ±
0.013
0.703 ±
0.013
0.902 ±
0.020
PBS 0.420 ±
0.017
0.449 ±
0.010
0.459 ±
0.006
0.475 ±
0.008
Growth
Media 0.411 ±
0.013
0.672 ±
0.012
0.826 ±
0.018
0.987 ±
0.021

80
Figure 4.6.4 E. faecalis biofilm biomass following exposure to experimental agents and
controls for 72 hours. The OD values plotted are mean ± standard deviation where n=15.
4.6.5 Summary
Determination of biofilm biomass of 24 h biofilms treated for up to 72 h with BM2 incorporated
into P407 gels gave dose-dependent growth impairment for all 4 strains in the test panel and, in
most cases, significantly disrupted biofilm detachment. A concentration of 512 µg/mL BM2
was able to disrupt all biofilms.
As found with planktonic cells, the biofilm formed by S. mutans NG8 appeared to be the most
susceptible to BM2 while that of E. faecalis JH2-2 appeared to be the most resistant. Saturated
calcium hydroxide was most effective in inhibiting growth of the S. mutans 24 h biofilm, slowed
growth of S. gordonii and C. albicans biofilms, but was ineffective against the E. faecalis
biofilm.
0
0.2
0.4
0.6
0.8
1
1.2
Initial
biomass
PBS Growth
Media
P407 256 µg/mL 512 µg/mL Ca(OH)2
Ab
sorb
ance
(O
D6
00
nm
)
BM2 in P407

81
Chapter 5: Discussion
The aim of the present study was to produce a sustained release gel suitable for the intracanal
administration of the cationic AMP, BM2, and to assess the in vitro effect of this gel on common
endodontic pathogens. Comparison was also made between the antimicrobial efficacy of BM2
in a gel formulation and in aqueous solution.
5.1 Poloxamer gel formulation
The basic goal of therapy is to achieve a steady-state tissue level of drug that is therapeutically
effective and nontoxic for an extended period of time. Attempts have been made to sustain local
drug levels and increase their therapeutic efficacy. The use of Poloxamer 407 polymer gels for
the controlled delivery of drugs is well documented. These gels have been utilised for the
delivery of antibiotics (Esposito et al. 1996, Veyries et al. 1999, Zhang et al. 2002), anti-
inflammatory drugs (Miyazaki et al. 1995, Newa et al. 2008), anticancer drugs (Miyazaki et al.
1984, Amiji et al. 2002, Saxena & Hussain 2012), anaesthetics such as lidocaine (Chen-Chow
& Frank 1981, Ricci et al. 2005), and biologically active proteins/peptides such as interleukin-
2 (Johnston et al. 1992), melanotan-I (Bhardwaj & Blanchard 1996), and urease (Fults &
Johnston 1990, Pec et al. 1992). Due to the pharmacological properties of P407, it was chosen
as a polymer for delivery of BM2.
For the present study, the concentration of P407 had to meet the criteria of being free-flowing
at room temperature but a viscous gel at 37°C. This was chosen on the basis of ease of
administration by syringe at room temperature and transition to a gel when placed into the root
canal system at body temperature. Various concentrations of P407 ranging from 15-50% (w/v)
were evaluated. At concentrations below 20% (w/v), P407 formulations were solutions at
ambient temperatures. A concentration of 20% (w/v) was found to have suitable viscosity but
previous studies have shown increased dissolution rates with low concentrations and increased
stability with higher concentrations (Chi & Jun 1991, El Gendy et al. 2002). As such, at 25%
(w/v) P407 formulation was found to be easy to manipulate and inject, facilitating convenient
administration of BM2 into the root canal system.
In vitro stability and release profiles provide important information about the efficiency of a
drug delivery system. The model of choice should resemble the in vivo behaviour as closely as

82
possible so the results can be extrapolated. In vitro stability and release studies were performed
using a membrane dissolution model. The advantage of this model is that gel formulation is in
direct contact with the release medium, and consequently, formulation factors affecting drug
release can be readily discerned (Bhardwaj & Blanchard 1996).
Poloxamers are swelling-controlled systems that function by a process of continuous swelling
of the polymer carrier that is associated with simultaneous or subsequent dissolution (Zhang et
al. 2002). Drug release is controlled by the surface hydration rate. The P407 gels are viewed as
consisting of large populations of micelles and aqueous channels in which the incorporated
solute may be released by its passage through these aqueous channels and from gel dissolution
(Gilbert et al. 1986, Bhardwaj & Blanchard 1996). The size of the aqueous channels, the
arrangement of the drug between the micelles and the aqueous phase, and the microviscosity of
the extramicellar fluid can affect release of the drug (Chen-Chow & Frank 1981, Rassing &
Attwood 1983). At low temperatures, P407 forms micellar subunits in solution. As the
temperature increases, micellar desolvation and swelling gives rise to large micelles and the
creation of a cross-linked network (Chen-Chow & Frank. 1981, Alexandridis & Hatton 1995).
The result of this phenomenon is an increase in viscosity on heating (Veyries et al. 1999).
Gel properties can change with the addition of a drug. These include alterations to the sol-gel
transition temperature (Vadnere et al. 1984, Gilbert et al. 1987) and consequently, interference
with the gelation process (Ricci et al. 2002). In this study, sustained release Poloxamer gel
formulations containing BM2 were developed and evaluated in vitro. Incorporation of BM2
into the P407 gels did not appear to affect the overall gel stability with no alteration to the rate
of dissolution, supporting the first hypothesis of this study. The second hypothesis was that
BM2 would be released over a period of time from the P407 gel. The BM2 release profile, as
shown in Figure 4.1.3a correlated well with the dissolution rate of the P407 gels (Figure 4.1.3b),
however, it was evident from the in vitro release studies that the entire weight of peptide
incorporated into the P407 gel was not released, despite complete dissolution of the gel. This
may be attributed to possible alteration to the state of the peptide or the inability to detect the
peptide through spectrophotometric analysis at 280nm. It is postulated that some of the BM2
may have been deactivated or degraded. When compared to the availability of BM2 in solution,
the amount of BM2 released from P407 gel formulations was 8-fold with complete gel
dissolution occurring over 4-5 days. Although the literature on drug release indicates that
release occurs through passage through aqueous channels, there are currently no studies on how
BM2 is incorporated into the gel matrix and the exact mechanism of release. Based on previous

83
reports with other compounds, we assume that BM2 is released via gel dissolution and
subsequent release into the aqueous channels (Bhardwaj & Blanchard 1996, Moore et al. 2000).
BM2 retained its antimicrobial activity as shown in the susceptibility testing on planktonic cells
(Figures 4.5.1-4.5.4) and using the crystal violet assay model (Tables 4.6.1-4.6.4 and Figures
4.6.1-4.6.4). This is in accordance with other studies showing that drugs released from P407
retain their therapeutic activity (Mengi & Deshpande 1992, Esposito et al. 1996).
Poloxamers have been used as surfactants for several years which has led to the discovery of
their biological activity. They can interact with cell membranes and modify membrane
permeability for certain compounds such as drugs (Takáts et al. 2001). The results of the current
study found that all gel formulations, including P407 alone, resulted in microbial growth that
was significantly lower than sterile water. The potential of P407 for inhibiting bacterial
attachment and growth and increasing their susceptibility to antibiotics has been demonstrated
(Veyries et al. 2000). BM2 exhibited antimicrobial activity in both aqueous and gel form,
however, the effects were observed at lower concentrations and occurred faster in aqueous form
compared to gel form due to the drug availability. The gel medium demonstrated more sustained
effects.
Poloxamer 407 gels are novel drug delivery systems which this study has highlighted to be a
promising carrier for BM2. This study has shown the potential of BM2 incorporated into P407
gels to be antimicrobial against the endodontic strains tested in vitro. If this combination can
be shown to be effective against other common members of the endodontic microflora, this gel
may be considered as a suitable intracanal medicament for disinfection of the root canal system
during root canal treatment. The tissue-dissolving capacity is, however, not yet known and
before BM2 incorporated into a P407 gel can be considered as a potential intracanal
medicament, further studies need to be carried out to assess this.
5.2 Planktonic cell cultures
Streptococcus species have been implicated in the initiation and progression of endodontic
infections (Love et al. 2000, Love & Jenkinson 2002). S. gordonii and S. mutans are well known
as predominant bacterial species present in the oral cavity that have been implicated as early
colonisers in dental plaque (Nyvad & Kilian 1987, Jenkinson & Lamont 1997). There is
evidence of invasion of dentinal tubules showing that they may be responsible for the initiation
of pulpal infection (Love et al. 1997, Love & Jenkinson 2002). In addition to this, they provide

84
additional binding sites for the subsequent attachment of microorganisms (Svensäter &
Bergenholtz 2004). As a result, both S. mutans and S. gordonii were selected for this research.
E. faecalis has been found to be a commensal microorganism of the root-filled tooth which can
survive initial treatment but may not necessarily be causative of treatment failure (Fabricius et
al. 1982a, Kaufman et al. 2005). It has the potential to become pathogenic and has been
cultivated from obturated root canals of teeth with persistent periapical pathology (Molander et
al. 1998, Sundqvist et al. 1998, Hancock III et al. 2001). E. faecalis has been found to be
difficult to eradicate using current intracanal medicaments (Haapasalo & Ørstavik 1987, Saleh
et al. 2004). C. albicans has also been recognised as a commensal microorganism that can
become pathogenic under certain conditions (Sen et al. 1995). Similar to E. faecalis, it has been
reported to show resistance to calcium hydroxide (Waltimo et al. 1999). Due to the difficulty
in eradicating these organisms, they were chosen for this study.
The results of the minimum inhibitory and bactericidal/fungicidal tests as well as the
susceptibility tests on planktonic cells over an extended period validated the third hypothesis
of this study which was that the species tested will be susceptible to BM2-loaded P407 gels at
varying concentrations. All strains were found to be susceptible to BM2 in aqueous and gel
medium with S. mutans being the most susceptible and E. faecalis being the most resistant.
BM2 was found to exert both fungistatic and fungicidal effects on C. albicans when
administered in P407 gel. Inhibitory effects were observed at a concentration of 256 µg/mL
with apparent fungicidal effects at 512 µg/mL. Growth occurred initially at 128 µg/mL BM2 in
P407 gel but BM2 appeared to block growth after 24 hours. This effect is most likely due to the
initial release of a concentration of peptide that was inadequate at inhibiting growth of C.
albicans.
The bacteriostatic and bactericidal properties of BM2-loaded P407 gels were also highlighted
in this study. BM2 in P407 exhibited bacteriostatic effects on S. gordonii at a concentration of
128 µg/mL and exhibited bactericidal effects at concentrations greater than 256 µg/mL. For S.
mutans, 32 µg/mL BM2 in P407 was effective at inhibiting growth while concentrations greater
than 32 µg/mL were effective at killing S. mutans planktonic cells. BM2 was ineffective at
inhibiting or killing E. faecalis in planktonic culture when exposed for 24 hours, however,
bactericidal effects were observed when exposed for longer periods to 512 µg/mL.
Based on these results, the antimicrobial effects of BM2 were dose-dependent with a
concentration of 512 µg/mL incorporated into P407 being the most effective at inhibiting and

85
perhaps even killing all 4 strains. Cationic peptides preferentially bind to acidic phospholipids,
acidic polysaccharides, and lipopolysaccharides on the surface of lipid bilayer of microbes.
Such peptides appear to exert antimicrobial effects by forming structures which can affect the
integrity of the lipid bilayer and disrupt the membrane (Dathe & Wieprecht 1999, Matsuzaki
1999, Shai 1999). The antimicrobial properties of BM2 may be related to its configuration,
being composed of D-amino acids. D-peptides have been shown to be resistant to enzymatic
degradation and have been reported to be more stable than their L-isomeric forms (Wade et al.
1990). Moreover, peptides containing D-amino acids can be more biologically potent. It has
been proposed that D-peptides first associate with the membrane by electrostatic forces and
then the helical molecules span the lipid bilayer (Wade et al. 1990). There are no studies on the
mechanism in which BM2 exerts in antibacterial properties and hence, it can only be postulated
that ion-channel pores are formed. Additionally, BM2 is comprised of a triarginine motif with
amidation of the C-terminus. The cationic charge of arginine provides an effective means of
attracting BM2 to the target membranes and the opportunities for ionic bonding should facilitate
its interaction with the negatively charged surfaces of the lipid bilayer (Chan et al. 2006).
In line with the third hypothesis, these results support the use of BM2 in a thermoresponsive
P407 gel medium which allowed the peptide to retain its antimicrobial properties.
5.3 Antimicrobial activity against monospecies biofilms
The development of biofilms presents significant treatment problems because pathogens in the
biofilm can be highly resistant to treatment, especially with antibiotics. Once the microbial
communities form, they are difficult to eradicate with conventional therapies. Bacterial biofilms
have become important targets for drug discovery (Kwasny & Opperman 2010).
The current in vitro study showed that BM2-loaded P407 gels had fungicidal and bactericidal
effects against biofilms of the selected strains, corroborating the fourth hypothesis.
Further growth of C. albicans was inhibited when exposed to BM2 concentrations of 128
µg/mL but concentrations greater than 128 µg/mL resulted in a significant reduction of the
biomass with the crystal violet assay. When exposed to 256 µg/mL and 512 µg/mL BM2, there
was a 75% and 82% reduction in the biomass, respectively. These results demonstrate the
fungicidal potential of BM2, which most likely occurs as a result of inhibition of the essential
enzyme, Pma1p, an ATPase required for fungal energy transduction (Monk et al. 2005).

86
BM2 was inhibitory against S. gordonii and S. mutans biofilms at concentrations as low as 16
µg/mL with absorbance values comparable to PBS. BM2 was bactericidal against S. gordonii
biofilms or caused biofilm detachment at concentrations of 128 µg/mL and higher with a 33%
reduction in the bacterial biomass when exposed to BM2 at a concentration of 512 µg/mL. For
S. mutans, BM2 was bactericidal or caused biofilm detachment at concentrations of 32 µg/mL
and higher with a maximum reduction in the bacterial biomass of 29% after exposure to BM2
at a concentration of 512 µg/mL. E. faecalis biofilms were the most difficult to target requiring
BM2 concentrations of 512 µg/mL to elicit bactericidal effects. The results indicated a 38%
reduction in the biomass using the crystal violet assay.
BM2-loaded P407 gels gave greater reduction in fungal biofilms compared to bacterial biofilms
with BM2-loaded P407 gels. As previously noted, BM2 targets fungal cells via the membrane
protein, Pma1p, which is only present in fungi (Serrano et al. 1986). Based on the results, it is
likely that BM2 has a different mechanism of action on bacterial cells, a point which remains
to be investigated.
Calcium hydroxide significantly reduced the biomass of S. mutans biofilms, but was ineffective
for C. albicans, S. gordonii and E. faecalis biofilms. For all biofilms, including S. mutans,
calcium hydroxide was a less effective antimicrobial than BM2-loaded P407 gels which gave
significantly greater reduction in biomass at 512 µg/mL incorporated peptide. Based on these
results, BM2 incorporated into a P407 medium is more effective than calcium hydroxide against
monospecies biofilms, thereby refuting the final hypothesis.
5.4 Experimental design and limitations
For this study, a membraneless dissolution model was used to assess the stability of P407 and
release of BM2. This model posed potential sources of error due to difficulties in removing the
receptor medium for spectrophotometric analysis. Difficulties were encountered in accurately
sampling the PBS solution. Its efficient removal required considerable care in avoiding
disruption of the P407 surface. Errors were minimised by using replicate of experiments. The
other limitations of using a membraneless dissolution model is that this procedure is greatly
influenced by stirring speed and experimental set-up, including temperature of the receptor
medium. Preheating of the receptor medium does not mimic in vivo conditions (Dumortier et
al. 2006). Finally, release at the interface has been postulated to occur via diffusion while the
remainder of the drug is released during gel dissolution (Anderson et al. 2001).

87
Peptides have the tendency to precipitate and bind avidly to the surface of target cells or plastic
materials such as polystyrene, complicating evaluation of the in vitro antimicrobial activities
(Hancock 1997, Wu & Hancock 1999, Giacometti et al. 2000). Giacometti et al. 2000 showed
that cationic AMPs possessed higher antimicrobial activities when polypropylene materials
were used. Another study by the same group recommended shaking microtitre plates during
incubation to reduce precipitation (Giacometti et al. 1999). In the present study, BM2 appeared
to precipitate at higher concentrations when combined with the bacterial inoculums. This was
detected by visual inspection of the microtitre wells as well as the higher absorbance values
attained after the microtitre plate was read at 600nm. No precipitate was observed when BM2
was combined with the fungal inoculum. It is possible that the precipitation occurred as a result
of interaction with the culture media or interaction with the bacterial cells itself, as the same
was not observed for C. albicans. Higher concentrations of peptides have been shown to
precipitate in culture medium (Steinberg et al. 1997, Wu & Hancock 1999). The precipitation
could also be related to the pH of the culture media, as the pH of the SD medium for C. albicans
was adjusted to 7.0 ± 0.1. It may be that the pH of tryptic soy broth needed to be pH-adjusted
prior to use. Studies have recommended preparation of peptide stocks by the addition of 0.01%
acetic acid and 0.2% bovine serum albumin to avoid precipitation of the peptides (Steinberg et
al. 1997, Wu & Hancock 1999). The problem, however, is that acetic acid lowers the pH of the
medium, inhibiting bacterial growth and consequently, the antimicrobial activity of the drug
cannot be accurately ascertained and may be overstated.
The use of a viscous vehicle for the administration of an antimicrobial in a root canal system
minimises dispersion of the drug into the periapical tissues and maintains it in the desired area
for extended periods. This can be advantageous in the case of cytotoxicity. P407 exhibits a high
degree of solubility when in contact with solutions and subsequent erosion (Garala et al. 2013).
As shown in the in vitro stability tests, complete dissolution of P407 occurred after 4-5 days
when in continuous contact with PBS. The gel formulation would, however, remain intact if
not in contact with any solution but would then not release sufficient amounts of BM2. A further
limitation with this is tubular penetration associated with limited degradation of the gel. In the
biofilm model, it was noted that the BM2-loaded gels had not completely degraded even after
incubation for 72 hours. The wells were washed with PBS prior to exposing the biofilms to the
antimicrobials and hence, it can be concluded that the gel was in contact with limited solution
leading to minimal breakdown. In a root canal model, exposure to fluids is generally minimal
unless the antimicrobial agent is in direct contact with the periapical tissue fluids in which case
it would be rapidly solubilised. It is possible that the P407 gels with BM2 may be stable for an

88
extended period of time in a root canal system compared to that observed in the present study
due to the limited contact with fluids. This justifies the use and suitability of a gel medium for
the intracanal administration of BM2 but also highlights the need for further ex vivo and in vivo
research.
Calcium hydroxide was chosen as a control for this study as it is the most widely used root
canal medicament and its antimicrobial properties are based on the high pH environment it
creates through release of hydroxyl ions (Wang & Hume 1988, Nerwich et al. 1993). In a
clinical setting, calcium hydroxide is used in the form of a paste. The use of a paste is, however,
precluded in this type of experimental design due to the drying out effect that would be
problematic when conducting experiments over several days. Consequently, a saturated
solution of calcium hydroxide was used. The biological action of calcium hydroxide will always
occur through ionic dissociation into calcium and hydroxyl ions, however, the vehicle plays an
important role in the overall process because it affects the concentration and the velocity of
ionic liberation (Fava & Saunders 1999). Consequently, the results of these in vitro experiments
cannot be extrapolated to a root canal model.
A crystal violet assay was used for the indirect quantification of microbial adhesion and biofilm
formation and works by binding to negatively charged surface molecules and polysaccharides
in the extracellular matrix (Stepanovic et al. 2000, Li et al. 2003, Peeters et al. 2008). Both live
and dead cells as well as matrix are stained making them difficult to differentiate and
consequently, it is difficult to obtain a true representation of the cidal effects of BM2 and its
formulations with P407 (Pitts et al. 2003). Further research using cell viability assays is needed
and will be discussed in the following section.
5.5 Future research
This study aimed to develop a sustained release gel which possessed antimicrobial activity
against common endodontic pathogens in planktonic cultures and biofilms.
5.5.1 Antimicrobial efficacy
The present study could be supported by further analysis including the application of confocal
laser scanning microscopy (CLSM) where high resolution optical images are taken at various
depths of the sample point-by-point with a laser beam and reconstructed with a computer

89
(Paddock 1999). The use of CLSM over conventional optical microscopy provides the
advantages of controlling depth of field and elimination of background light by the use of a
spatial filter (Paddock 1999). CLSM has successfully been used for differentiation of live cells
from dead cells within different layers of cultured biofilms using fluorescence-based live/dead
cell assays (Lawrence et al. 1991, Caldwell et al. 1992, Norton et al. 1998), which is limited
with a crystal violet assay (Pitts et al. 2003). This would be useful for assessment of the biomass
content after the development of an established biofilm, providing details on static/cidal activity
of BM2 in P407 gel and consequently the antimicrobial activity of the formulation.
Furthermore, the depth of penetration of BM2 within the complex biofilm structure can be
analysed (Jefferson et al. 2005). Previous studies on BM2 used CLSM to assess the effects on
biofilm detachment (Yoganathan 2012, Othman 2014). Yoganathan (2012) reported almost
complete loss of cell viability of E. faecalis with BM2 at a concentration of 160 µg/mL after
CLSM assessment, however, crystal violet biofilm assays revealed only a slight reduction in
biofilm height with limited cell detachment.
This study would have more clinical relevance if the antimicrobials were tested on multispecies
and more established biofilms. Most studies examine monospecies cultures whereas nearly all
biofilm communities comprise a variety of microorganisms with different virulence factors.
The species that constitute a mixed biofilm and the interactions between these microorganisms
critically influence the development and shape of the community (Elias & Banin 2012).
Interspecies dynamics within mixed biofilms, such as communication and/or competition for
nutrients and physical resources, represent those of a community rather than a single species
population and hence, studies testing antimicrobials on monospecies biofilms do not
demonstrate the true antimicrobial potential of the drug. Multispecies biofilms are thought to
be more resistant to antimicrobial treatment (Leriche et al. 2003, Burmølle et al. 2006, Kara et
al. 2006) and this may be related to their more complex extracellular polysaccharide matrix
(Adam et al. 2002). This is the first study to assess the antimicrobial efficacy of BM2
incorporated into a P407 gel. It is imperative to evaluate the efficacy of any new antimicrobial
on monospecies biofilms to provide experimental justification before undertaking studies on
multispecies models or ex vivo models.
It would be beneficial to assess an ex vivo model to determine whether BM2 in a gel medium
has the ability to penetrate dentinal tubules and reduce the bacterial load within the tubules.
This is especially important given the complexity of the root canal system and the issues
surrounding the presence of pulpal remanents. It is possible that a higher concentration would
be required for BM2 to exert the same bactericidal and fungicidal effects as shown in this study

90
in infected dentinal tubules. Teanpaisan et al. (2013) used a modification of the model described
by Haapasalo & Ørstavik (1987) and showed that the number of colonies of E. faecalis
decreased in the deeper layers of radicular dentine. They also found no significant difference
between the chosen antimicrobial in a P407 gel and calcium hydroxide paste.
5.5.2 Poloxamer 407
Poloxamer 407 has been shown to be a promising delivery system for BM2. Further studies
could evaluate the rheological behaviour of BM2-loaded P407 with emphasis on the mechanism
of BM2 release. Additionally, additives might be used to enhance the physicochemical
properties of P407 and the release of BM2 (Choi et al. 1999, Kojarunchitt et al. 2011).
5.5.3 BM2
A mechanism of action of BM2 was demonstrated by Monk et al. 2005 in which they showed
broad-spectrum fungicidal activity against a range of fungi by inhibition of the integral plasma
protein Pma1p. The present study showed antimicrobial activity against the bacterial strains
and fungal strain tested in aqueous and gel form, however, the mechanism of action against
bacterial species is yet to be elucidated. Future research could assess the structural configuration
of BM2 which may provide information on the mode of action on bacterial cell walls and cell
permeabilisation. The interactions of an AMP cannot be completely explained by a particular
sequential amino acid pattern (Fjell et al. 2012) but rather by the physicochemical and structural
features including size, residue composition, charge, secondary structure, hydrophobicity and
amphiphilic character (Boman 2003, Hall et al. 2003, Fjell et al. 2012).
5.5.4 Toxicity
5.5.4.1 Poloxamer 407
Studies have reported on the nontoxic properties and stability of P407 (Johnston & Miller 1985,
Henry & Schmolka, 1989, Garcia Sagrado et al. 1994), however, further research is needed to
assess the biocompatibility of P407 within the periapical tissues including toxicity to host cells.

91
5.5.4.2 BM2
Several cationic AMPs have been shown to possess a broad-spectrum of antimicrobial activity
against gram-negative and gram-positive bacteria, viruses, mycoplasma, and fungi (Hancock
1997) whilst being minimally toxic to host cells (Giacometti et al. 1999). They preferentially
interact with bacterial cells rather than mammalian cells as a result of their surface charge,
preventing them from binding to the cholesterol-rich and neutral plasma membrane surfaces
(Monk et al. 2005). This enables AMPs to exert their antimicrobial effects without being
significantly toxic to mammalian cells (Monk et al. 2005). Although Monk et al. showed that
BM2 did not cause significant haemolysis of red blood cells or death of cultured human
epithelial type 2 cells, further investigations are warranted to assess the cytotoxicity of BM2 to
surrounding tissues by using cell lines derived from fibroblasts, cementoblasts, and osteocytes.
5.6 Conclusions
BM2, a broad-spectrum antimicrobial, was successfully prepared as a thermoresponsive gel
using Poloxamer 407. This study has demonstrated that BM2-loaded P407 gels not only have
in vitro antimicrobial activity against planktonic cultures but also anti-biofilm effects. The
antimicrobial effects of BM2 were dose-dependent and while BM2 incorporated into a P407
gel medium required higher concentrations compared to an aqueous solution, it demonstrated
more sustained effects on cell cultures.
Taken together, this data indicates that BM2 in a gel medium has potential for use as an
antimicrobial agent in the treatment of root canal infections. Further research is warranted
assessing the ex vivo efficacy before it can be applied in an in vivo model taking into
consideration the issues surrounding the complexity of the root canal system and the presence
of pulpal remnants.

92
References
Abbott PV (1990) Medicaments: Aids to success in endodontics. Part 1. A review of the
literature. Australian Dental Journal 35, 438-48.
Abbott PV, Heithersay GS, Hume WR (1988) Release and diffusion through human tooth
roots in vitro of corticosteroid and tetracycline trace molecules from Ledermix® paste. Dental
Traumatology 4, 55-62.
Adam B, Baillie GS, Douglas LJ (2002) Mixed species biofilms of Candida albicans and
Staphylococcus epidermis. Journal of Medical Microbiology 51, 344-9.
Adamidou V (2010) In vitro investigation of teeth discolouration with different endodontic
medicament. MDentSci Thesis. University of Leeds, Leeds, United Kingdom.
Aerts AM, François IEJA, Cammue BPA, Thevissen K (2008) The mode of antifungal action
of plant, insect and human defensins. Cellular and Molecular Life Sciences 65, 2069-79.
Akpata ES, Blechman H (1982) Bacterial invasion of pulpal dentin wall in vitro. Journal of
Dental Research 61, 435-8.
Alexandridis P, Hatton TA (1995) Poly(ethylene oxide)-poly(propylene oxide)-poly(ethylene
oxide) block copolymer surfactants in aqueous solutions and at interfaces: thermodynamics,
structure, dynamics, and modeling. Colloids and Surfaces A: Physicochemical and
Engineering Aspects 96, 1-46.
Altschul SF, Madden TL, Schäffer AA, Zhang J, Zhang Z, Miller W, Lipman DJ (1997)
Gapped BLAST and PSI-BLAST: a new generation of protein database search programs.
Nucleic Acids Research 25, 3389-402.
Amiji MM, Lai PK, Shenoy DB, Rao M (2002) Intratumoral administration of Paclitaxel in
an in situ gelling Poloxamer 407 formulation. Pharmaceutical Development and Technology
7, 195-202.

93
Andersen M, Lund A, Andreasen JO, Andreasen FM (1992) In vitro solubility of human pulp
tissue in calcium hydroxide and sodium hypochlorite. Endodontics & Dental Traumatology 8,
104-8.
Anderson BC, Pandit NK, Mallapragada SK (2001) Understanding drug release from
poly(ethylene oxide)-b-poly(propylene oxide)-b-poly(ethylene oxide) gels. Journal of
Controlled Release 70, 157-67.
Andrews JM (2001) Determination of minimum inhibitory concentrations. Journal of
Antimicrobial Chemotherapy 48, 5-16.
Baumann G, Mueller P (1974) A molecular model of membrane excitability. Journal of
Supramolecular Structure 2, 538-57.
Baumgartner JC, Falkler WA (1991) Bacteria in the apical 5 mm of infected root canals.
Journal of Endodontics 17, 380-3.
Baumgartner JC, Watts CM, Xia T (2000) Occurrence of Candida albicans in infections of
endodontic origin. Journal of Endodontics 26, 695-8.
Bhardwaj R, Blanchard J (1996) Controlled-release delivery system for the α-MSH analog
Melanotan-I using poloxamer 407. Journal of Pharmaceutical Sciences 85, 915-9.
Bobbala SKR, Tamboli V, McDowell A, Mitra AK, Hook S (2016) Novel injectable
pentablock copolymer based thermoresponsive hydrogels for sustained release vaccines. The
American Association of Pharmaceutical Sciences Journal 18, 261-9.
Boman HG (2003) Antibacterial peptides: basic facts and emerging concepts. Journal of
Internal Medicine 254, 197-215.
Brogden KA (2005) Antimicrobial peptides: pore formers or metabolic inhibitors in bacteria?
Nature Reviews Microbiology 3, 238-50.
94
Brogden KA, Ackermann M, McCray Jr PB, Tack BF (2003) Antimicrobial peptides in
animals and their role in host defences. International Journal of Antimicrobial Agents 22,
465-78.
Brown KL, Hancock REW (2006) Cationic host defense (antimicrobial) peptides. Current
Opinion in Immunology 18, 24-30.
Burmølle M, Webb JS, Rao D, Hansen LH, Sørensen SJ, Kjelleberg S (2006) Enhanced
biofilm formation and increased resistance to antimicrobial agents and bacterial invasion are
caused by synergistic interactions in multispecies biofilms. Applied and Environmental
Microbiology 72, 3916-23.
Byström A, Claesson R, Sundqvist G (1985) The antibacterial effect of camphorated
paramonochlorophenol, camphorated phenol and calcium hydroxide in the treatment of
infected root canals. Dental Traumatology 1, 170-5.
Byström A, Sundqvist G (1981) Bacteriologic evaluation of the efficacy of mechanical root
canal instrumentation in endodontic therapy. European Journal of Oral Sciences 89, 321-8.
Byström A, Sundqvist G (1983) Bacteriologic evaluation of the effect of 0.5 percent sodium
hypochlorite in endodontic therapy. Oral Surgery, Oral Medicine, Oral Pathology 55, 307-12.
Byström A, Sundqvist G (1985) The antibacterial action of sodium hypochlorite and EDTA in
60 cases of endodontic therapy. International Endodontic Journal 18, 35-40.
Cabana A, Ait-Kadi A, Juhasz J (1997) Study of the gelation process of polyethylene oxide-
polypropylene oxide-polyethylene oxide copolymer (Poloxamer 407) aqueous solution.
Journal of Colloid and Interface Science 190, 307-12.
Caldwell DE, Korber DR, Lawrence JR (1992) Imaging of bacterial cells by fluorescence
exclusion using scanning confocal laser microscopy. Journal of Microbiological Methods 15,
249-61.

95
Ceri H, Olson ME, Stremick C, Read RR, Morck D, Buret A (1999) The Calgary biofilm
device: new technology for rapid determination of antibiotic susceptibilities of bacterial
biofilms. Journal of Clinical Microbiology 37, 1771-6.
Chan DI, Prenner EJ, Vogel HJ (2006) Tryptophan- and arginine-rich antimicrobial peptides:
Structures and mechanisms of action. Biochimica et Biophysica Acta 1758, 1184-202.
Charrueau C, Tuleu C, Astre V, Grossiord JL, Chaumeil JC (2001) Poloxamer 407 as a
thermogelling and adhesive polymer for rectal administration of short-chain fatty acids. Drug
Development and Industrial Pharmacy 27, 351-7.
Chen BKJ, George R, Walsh LJ (2012) Root discolouration following short-term application
of steroid medicaments containing clindamycin, doxycycline, or demeclocycline. Australian
Endodontic Journal 38, 124-8.
Chen J, Zhou R, Li L, Li B, Zhang X, Su J (2013) Mechanical, rheological and release
behaviors of a Poloxamer 407/Poloxamer 188/Carbopol 940 thermosensitive composite
hydrogel. Molecules 18, 12415-25.
Chen-Chow PC, Frank SG (1981) In vitro release of lidocaine from Pluronic F-127 gels.
International Journal of Pharmaceutics 8, 89-99.
Cheung GS, Ho MW (2001) Microbial flora of root-canal treated teeth associated with
asymptomatic periapical radiolucent lesions. Oral Microbiology and Immunology 16, 332-7.
Chi SC, Jun HW (1991) Release rates of ketoprofen from poloxamer gels in a membraneless
diffusion cell. Journal of Pharmaceutical Sciences 80, 280-3.
Choi HG, Lee MK, Kim MH, Kim CK (1999) Effect of additives on the physicochemical
properties of liquid suppository bases. International Journal of Pharmaceutics 190, 13-9.
Chong BS, Pitt Ford TR (1992) The role of intracanal medication in root canal treatment.
International Endodontic Journal 25, 97-106.
96
Chun KW, Lee JB, Kim SH, Park TG (2005) Controlled release of plasmid DNA from photo-
cross-linked pluronic hydrogels. Biomaterials 26, 3319-26.
Clarridge JE (2004) Impact of 16S rRNA gene sequence analysis for identification of bacteria
on clinical microbiology and infectious diseases. Clinical Microbiology Reviews 17, 840-62.
Clinical and Laboratory Standards Institute (2008) Development of in vitro susceptibility
testing criteria and quality control parameters: approved guideline. 3rd edn. Wayne, PA.
Clinical and Laboratory Standards Institute. CLSI document M23-A3.
Costerton JW, Stewart PS, Greenberg EP (1999) Bacterial biofilms: a common cause of
persistent infections. Microbes, Immunity and Disease 284, 1318-22.
Cwikla SJ, Bélanger M, Giguère S, Progulske-Fox A, Vertucci FJ (2005) Dentinal tubule
disinfection using three calcium hydroxide formulations. Journal of Endodontics 31, 50-2.
Dahlén G, Bergenholtz G (1980) Endotoxic activity in teeth with necrotic pulps. Journal of
Dental Research 59, 1033-40.
Dahlén G, Hofstad T (1977) Endotoxic activities of lipopolysaccharides of microorganisms
isolated from an infected root canal in Macaca cynomolgus. European Journal of Oral
Sciences 85, 272-8.
Dai XF, Cate ART, Limeback H (1991) The extent and distribution of intratubular collagen
fibrils in human dentine. Archives of Oral Biology 36, 775-8.
Dathe M, Wieprecht T (1999) Structural features of helical antimicrobial peptides: their
potential to modulate activity on model membranes and biological cells. Biochimica et
Biophysica Acta 1462, 71-87.
De Lucca AJ, Walsh TJ (1999) Antifungal peptides: novel therapeutic compounds against
emerging pathogens. Antimicrobial Agents and Chemotherapy 43, 1-11.

97
Desai M, Bühler T, Weller PH, Brown MRW (1998) Increasing resistance of planktonic and
biofilm cultures of Burkholderia cepacia to ciprofloxacin and ceftazidime during exponential
growth. Journal of Antimicrobial Chemotherapy 42, 153-60.
Docampo R, Moreno SNJ (1990) The metabolism and mode of action of gentian violet. Drug
Metabolism Reviews 22, 161-78.
Dommisch H, Winter J, Açil Y, Dunsche A, Tiemann M, Jepsen S (2005) Human β-defensin
(hBD-1, -2) expression in dental pulp. Oral Microbiology and Immunology 20, 163-6.
Dosler S, Mataraci E (2013) In vitro pharmacokinetics of antimicrobial cationic peptides
alone and in combination with antibiotics against methicillin resistant Staphylococcus aureus
biofilms. Peptides 49, 53-8.
Drake DR, Wiemann AH, Rivera EM, Walton RE (1994) Bacterial retention in canal walls in
vitro: effect of smear layer. Journal of Endodontics 20, 78-82.
Dufour D, Leung V, Lévesque CM (2010) Bacterial biofilm: structure, function, and
antimicrobial resistance. Endodontic Topics 22, 2-16.
Dumortier G, Grossiord JL, Agnely F, Chaumeil JC (2006) A review of Poloxamer 407
pharmaceutical and pharmacological characteristics. Pharmaceutical Research 23, 2709-28.
Dwyer TG, Torabinejad M (1981) Radiographic and histologic evaluation of the effect of
endotoxin on the periapical tissues of the cat. Journal of Endodontics 7, 31-5.
Eggink CO (1982) The value of the bacteriological culture in endodontics. I. The influence of
infection during and after treatment. International Endodontic Journal 15, 79-86.
Ehrmann EH (1965) The effect of triamcinolone with tetracycline on the dental pulp and
apical periodontium. The Journal of Prosthetic Dentistry 15, 144-52.
Ehrmann EH, Messer HH, Adams GG (2003) The relationship of intracanal medicaments to
postoperative pain in endodontics. International Endodontic Journal 36, 868-75.

98
El Gendy AM, Jun HW, Kassem AA (2002) In vitro release studies of flurbiprofen from
different topical formulations. Drug Development and Industrial Pharmacy 28, 823-31.
Elias S, Banin E (2012) Multi-species biofilms: living with friendly neighbors. Microbiology
Reviews 36, 990-1004.
Ellner PD, Stoessel CJ, Drakeford E, Vasi FA (1966) New culture medium for medical
bacteriology. American Journal of Clinical Pathology 45, 502-4.
Emilson CG, Bratthall D (1976) Growth of Streptococcus mutans on various selective media.
Journal of Clinical Microbiology 4, 95-8.
Esposito E, Carotta V, Scabbia A, Trombelli L, D’Antona P, Menegatti E, Nastruzzi C (1996)
Comparative analsis of tetracycline-containing dental gels: Poloxamer- and monoglyceride-
based formulations. International Journal of Pharmaceutics 142, 9-23.
Evans M, Davies JK, Sundqvist G, Figdor D (2002) Mechanisms involved in the resistance of
Enterococcus faecalis to calcium hydroxide. International Endodontic Journal 35, 221-8.
Fabricius L, Dahlén G, Holm SE, Möller ǺJR (1982a) Influence of combinations of oral
bacteria on periapical tissues of monkeys. European Journal of Oral Sciences 90, 200-6.
Fabricius L, Dahlén G, Öhman AE, Möller ǺJR (1982b) Predominant indigenous oral
bacteria isolated from infected root canals after varied times of closure. European Journal of
Oral Sciences 90, 134-44.
Falla TJ, Hancock REW (1997) Improved activity of a synthetic indolicidin analog.
Antimicrobial Agents and Chemotherapy 41, 771-5.
Fava LRG, Saunders WP (1999) Calcium hydroxide pastes: classification and clinical
indications. International Endodontic Journal 32, 257-82.
Fjell CD, Hiss JA, Hancock REW, Schneider G (2012) Designing antimicrobial peptides:
form follows function. Nature Reviews Drug Discovery 11, 37-51.

99
Fults KA, Johnston TP (1990) Sustained-release of urease from a Poloxamer gel matrix. PDA
Journal of Pharmaceutical Science and Technology 44, 58-65.
Garala K, Joshi P, Shah M, Ramkishan A, Patel J (2013) Formulation and evaluation of
periodontal in situ gel. International Journal of Pharmaceutical Investigation 3, 29-41.
Garberoglio R, Brännström M (1976) Scanning electron microscopic investigation of human
dentinal tubules. Archives of Oral Biology 21, 355-62.
Garcia Sagrado F, Guzman M, Molpeceres J, Aberturas MR (1994) Pluronic copolymers-
characteristics, properties, and pharmaceutical applications: part I. Pharmaceutical
Technology Europe 6, 38-44.
Giacometti A, Cirioni O, Barchiesi F, Del Prete MS, Fortuna M, Caselli F, Scalise G (2000)
In vitro susceptibility tests for cationic peptides: comparison of broth microdilution methods
for bacteria that grow aerobically. Antimicrobial Agents and Chemotherapy 44, 1694-6.
Giacometti A, Cirioni O, Barchiesi F, Del Prete MS, Scalise G (1999) Antimicrobial activity
of polycationic peptides. Peptides 20, 1265-73.
Giacometti A, Cirioni O, Barchiesi F, Fortuna M, Scalise G (1999) In-vitro activity of
cationic peptides alone and in combination with clinically used antimicrobial agents against
Pseudomonas aeruginosa. Journal of Antimicrobial Chemotherapy 44, 641-5.
Giacometti A, Cirioni O, Greganti G, Quarta M, Scalise G (1998) In vitro activities of
membrane-active peptides against gram-positive and gram-negative aerobic bacteria.
Antimicrobial Agents and Chemotherapy 42, 3320-4.
Gilbert JC, Hadgraft J, Bye A, Brookes LG (1986) Drug release from Pluronic F-127 gels.
International Journal of Pharmaceutics 32, 223-8.
Gilbert JC, Richardson JL, Davies MC, Palin KJ (1987) The effect of solutes and polymers on
the gelation properties of pluronic F-127 solutions for controlled drug delivery. Journal of
Controlled Release 5, 113-8.

100
Gilbert P, Das J, Foley I (1997) Biofilm susceptibility to antimicrobials. Advances in Dental
Research 11, 160-7.
Gillies RJ, Didier N, Denton M (1986) Determination of cell number in monolayer cultures.
Analytical Biochemistry 159, 109-13.
Gold OG, Jordan HV, van Houte J (1973) A selective medium for Streptococcus mutans.
Archives of Oral Biology 18, 1357-64.
Gombotz WR, Pettit DK (1995) Biodegradable polymers for protein and peptide drug
delivery. Bioconjugate Chemistry 6, 332-51.
Gomes BPFA, Lilley JD, Drucker DB (1996a) Clinical significance of dental root canal
microflora. Journal of Dentistry 24, 47-55.
Gomes BPFA, Lilley JD, Drucker DB (1996b) Variations in the susceptibilities of
components of the endodontic microflora to biomechanical procedures. International
Endodontic Journal 29, 235-41.
Gomes BPFA, Souza SFC, Ferraz CCR, Teixeira FB, Zaia AA, Valdrighi L, Souza-Filho FJ
(2003) Effectiveness of 2% chlorhexidine gel and calcium hydroxide against Enterococcus
faecalis in bovine root dentine in vitro 36, 267-75.
Green MR, Sambrook J (2012) Agarose gel electrophoresis. In: Molecular Cloning: A
Laboratory Manual 4th edn; pp 82-99. Cold Spring Harbor, New York: Cold Spring Harbor
Laboratory Press.
Griffin SG, Markham JL, Leach DN (2000) An agar dilution method for the determination of
the minimum inhibitory concentration of essential oils. Journal of Essential Oil Research 12,
249-55.
Haapasalo M, Ørstavik D (1987) In vitro infection and of dentinal tubules. Journal of Dental
Research 66, 1375-9.

101
Hahn CL, Overton B (1997) The effects of immunoglobulins on the convective permeability
of human dentine in vitro. Archives of Oral Biology 42, 835-43.
Hall K, Mozsolits H, Aguilar MI (2003) Surface plasmon resonance analysis of antimicrobial
peptide-membrane interactions: affinity & mechanism of action. Letters in Peptide Science
10, 475-85.
Hancock III HH, Sigurdsson A, Trope M, Moiseiwitsch J (2001) Bacteria isolated after
unsuccessful endodontic treatment in a North American population. Oral Surgery, Oral
Medicine, Oral Pathology, Oral Radiology, and Endodontology 91, 579-86.
Hancock REW (1997) Peptide antibiotics. The Lancet 349, 418-22.
Hancock REW (2001) Cationic peptides: effecors in innate immunity and novel
antimicrobials. The Lancet Infectious Diseases 1, 156-64.
He K, Ludtke SJ, Worcester DL, Huang HW (1996) Neutron scattering in the plane of
membranes: structure of alamethicin pores. Biophysical Journal 70, 2659-66.
Heithersay GS (1975) Calcium hydroxide in the treatment of pulpless teeth with associated
pathology. International Endodontic Journal 8, 74-93.
Henry RL, Schmolka IR (1989) Burn wound coverings and the use of poloxamer
preparations. Critical Reviews in Biocompatibility 5, 207-20.
Hoffman AS (2012) Hydrogels for biomedical application. Advanced Drug Delivery Reviews
64, 18-23.
Jefferson KK, Goldmann DA, Pier GB (2005) Use of confocal microscopy to analyze the rate
of vancomycin penetration through Staphylococcus aureus biofilms. Antimicrobial Agents
and Chemotherapy 49, 2467-73.
Jenkinson HF, Lamont RJ (1997) Streptococcal adhesion and colonization. Critical Reviews
in Oral Biology & Medicine 8, 175-200.

102
Jenssen H, Hamill P, Hancock REW (2006) Peptide antimicrobial agents. Clinical
Microbiology Reviews 19, 491-511.
Johnson G, Olgart L, Brännström M (1973) Outward fluid flow in dentin under a physiologic
pressure gradient: experiments in vitro. Oral Surgery, Oral Medicine, Oral Pathology 35,
238-48.
Johnston TP, Miller S (1985) Toxicological evaluation of Poloxamer vehicles for
intramuscular use. Parenteral Drug Association 39, 83-8.
Johnston TP, Punjabi MA, Froelich CJ (1992) Sustained delivery of interleukin-2 from a
Poloxamer 407 gel matrix following intraperitoneal injection in mice. Pharmaceutical
Research 9, 425-34.
Juhasz J, Lenaerts V, Raymond P, Ong H (1989) Diffusion of rat atrial natriuretic factor in
thermoreversible poloxamer gels. Biomaterials 10, 265-8.
Kabanov AV, Batrakova EV, Alakhov VY (2002) Pluronic block copolymers as novel
polymer therapeutics for drug and gene delivery. Journal of Controlled Release 82, 189-212.
Kakehashi S, Stanley HR, Fitzgerald RJ (1965) The effects of surgical exposures of dental
pulps in germ-free and conventional laboratory rats. Oral Surgery, Oral Medicine, Oral
Pathology 20, 340-9.
Kantz WE, Henry CA (1974) Isolation and classification of anaerobic bacteria from intact
pulp chambers of non-vital teeth in man. Archives of Oral Biology 19, 91-6.
Kara D, Luppens SBI, Ten Cate JM (2006) Difference between single- and dual-species
biofilms of Streptococcus mutans and Veilonella parvula in growth, acidogenicity and
susceptibility to chlorhexidine. European Journal of Oral Sciences 114, 58-63.
Kaufman B, Spångberg L, Barry J, Fouad AF (2005) Enterococcus Spp. in endodontically
treated teeth with and without periradicular lesions 31, 851-6.

103
Kawashima N, Wadachi R, Suda H (2009) Root canal medicaments. International Dental
Journal 59, 5-11.
Kim ST, Abbott PV, McGinley P (2000) The effects of Ledermix paste on discolouration of
mature teeth. International Endodontic Journal 33, 227-32.
Klotman ME, Chang TL (2006) Defensins in innate antiviral immunity. Nature Reviews
Immunology 6, 447-56.
Kojarunchitt T, Hook S, Rizwan S, Rades T, Baldursdottir S (2011) Development and
characterisation of modified poloxamer 407 thermoresponsive depot systems containing
cubosomes. International Journal of Pharmaceutics 408, 20-6.
Kolbert CP, Persing DH (1999) Ribosomal DNA sequencing as a tool for identification of
bacterial pathogens. Current Opinion in Microbiology 2, 299-305.
Kwasny SM, Opperman TJ (2010) Static biofilm cultures of gram-positive pathogens grown
in a microtiter format used for anti-biofilm drug discovery. Current Protocols in
Pharmacology 50, 1-27.
Lambert RJW, Pearson J (2000) Susceptibility testing: accurate and reproducible minimum
inhibitory concentration (MIC) and non-inhibitory concentration (NIC) values. Journal of
Applied Microbiology 88, 784-90.
Lawrence JR, Korber DR, Hoyle BD, Costerton JW, Caldwell DE (1991) Optical sectioning
of microbial biofilms. Journal of Bacteriology 173, 6558-67.
Le Goff A, Bunetel L, Mouton C, Bonnaure-Mallet M (1997) Evaluation of root canal
bacteria and their antimicrobial susceptibility in teeth with necrotic pulp. Oral Microbiology
and Immunology 12, 318-22.
Leavitt JM, Naidorf IJ, Shugaevsky P (1958) The bacterial flora of root canals as disclosed by
a culture medium for endodontics. Oral Surgery, Oral Medicine, Oral Pathology 11, 302-8.
Leid JG (2009) Bacterial biofilms resist key host defenses. Microbe 4, 66-70.

104
Leontiadou H, Mark AE, Marrink SJ (2006) Antimicrobial peptides in action. Journal of the
American Chemical Society 128, 12156-61.
Leriche V, Briandet R, Carpentier B (2003) Ecology of mixed biofilms subjected daily to a
chlorinated alkaline solution: spatial distribution of bacterial species suggests a protective
effect of one species to another. Environmental Microbiology 5, 64-71.
Li X, Yan Z, Xu J (2003) Quantitative variation of biofilms among strains in natural
populations of Candida albicans. Microbiology 149, 353-62.
Liu T, Chu B (2000) Formation of homogenous gel-like phases by mixed triblock copolymer
micelles in aqueous solution: FCC to BCC phase transition. Journal of Applied
Crystallography 33, 727-30.
Love RM (1996) Bacterial penetration of the root canal of intact incisor teeth after a simulated
traumatic injury. Endodontics & Dental Traumatology 12, 289-93.
Love RM (2001) Enterococcus faecalis – a mechanism for its role in endodontic failure.
International Endodontic Journal 34, 399-405.
Love RM (2004) Invasion of dentinal tubules by root canal bacteria. Endodontic Topics 9, 52-
65.
Love RM (2010) Biofilm-substrate interaction: from initial adhesion to complex interactions
and biofilm maturity. Endodontic Topics 22, 50-7.
Love RM, Jenkinson HF (2002) Invasion of dentinal tubules by oral bacteria. Critical
Reviews in Oral Biology & Medicine 13, 171-83.
Love RM, McMillan MD, Jenkinson HF (1997) Invasion of dentinal tubules by oral
streptococci is associated with collagen recognition mediated by the antigen I/II family of
polypeptides. Infection and Immunity 65, 5157-64.

105
Love RM, McMillan MD, Park Y, Jenkinson HF (2000) Coinvasion of dentinal tubules by
Porphyromonas gingivalis and Streptococcus gordonii depends upon binding specificity of
Streptococcal antigen I/II adhesin. Infection and Immunity 68, 1359-65.
Macdonald JB, Hare GC, Wood AWS (1957) The bacteriologic status of the pulp chambers in
intact teeth found to be nonvital following trauma. Oral Surgery, Oral Medicine, Oral
Pathology 10, 318-22.
Mah TF (2014) Establishing the minimal bactericidal concentration of an antimicrobial agent
for planktonic cells (MBC-P) and biofilm cells (MBC-B). Journal of Visualized Experiments
83, 1-6.
Marsh PD (2005) Dental plaque: biological significance of a biofilm and community life-
style. Journal of Clinical Periodontology 32, 7-15.
Martin DM (1979) Irrigation and medication of the root canal. International Endodontic
Journal 12, 55-62.
Matsuzaki K (1999) Why and how are peptide-lipid interactions utilized for self-defense?
Magainins and tachyplesins as archetypes. Biochimica et Biophysica Acta 1462, 1-10.
Matsuzaki K, Murase O, Fujii N, Miyajima K (1996) An antimicrobial peptide, magainin 2,
induced rapid flip-flop of phospholipids coupled with pore formation and peptide
translocation. Biochemistry 35, 11361-8.
Matsuzaki K, Sugishita KI, Ishibe N, Ueha M, Nakata S, Miyajima K, Epand RM (1998)
Relationship of membrane curvature to the formation of pores by magainin 2. Biochemistry
37, 11856-63.
McFarland J (1907) The nephelometer: an intrument for estimating the number of bacteria in
suspensions used for calculating the opsonic index and for vaccines. Journal of the American
Medical Assocation 49, 1176-8.

106
Medlicott NJ, Rathbone MJ, Tucker IG, Holborow DW (1994) Delivery systems for the
administration of drugs to the periodontal pocket. Advanced Drug Delivery Reviews 13, 181-
203.
Mengi S, Deshpande SG (1992) Development and evaluation of flurbiprofen hydrogels on the
breakdown of the blood/aqueous humor barrier. Sciences Techniques et Pratiques
Pharmaceutiques Sciences 2, 118-24.
Meryon SD, Jakeman KJ, Browne RM (1986) Penetration in vitro of human and ferret dentine
by three bacterial species in relation to their potential role in pulpal inflammation.
International Endodontic Journal 19, 213-20.
Meyer RJ, Hussain AS (2005) Awareness Topic: Mitigating the risks of ethanol induced dose
dumping from oral sustained/controlled release dosage forms. In: FDA’s ACPS Meeting; pp
1-4. Washington, DC, USA: Center for Drug Evaluation and Research.
Michelich VJ, Schuster GS, Pashley DH (1980) Bacterial penetration of human dentin in
vitro. Journal of Dental Research 59, 1398-403.
Miller SC, Donovan MD (1982) Effect of poloxamer 407 gel on the miotic activity of
pilocarpine nitrate in rabbits. International Journal of Pharmaceutics 12, 147-52.
Miyazaki S, Takeuchi S, Yokouchi C, Takada M (1984) Pluronic F-127 gels as a vehicle for
topical administration of anticancer agents. Chemical & Pharmaceutical Bulletin 32, 4205-8.
Miyazaki S, Tobiyama T, Takada M, Attwood D (1995) Percutaneous absorption of
indomethacin from pluronic F-127 gels in rats. Journal of Pharmacy and Pharmacology 47,
455-7.
Molander A, Reit C, Dahlén G (1990) Microbiological evaluation of clindamycin as a root
canal dressing in teeth with apical periodontitis. International Endodontic Journal 23, 113-8.
Molander A, Reit C, Dahlén G, Kvist T (1998) Microbiological status of root-filled teeth with
apical periodontitis. International Endodontic Journal 31, 1-7.

107
Möller ÅJR, Fabricius L, Dahlén G, Öhman AE, Heyden G (1981) Influence on periapical
tissues of indigenous oral bacteria and necrotic pulp tissue in monkeys. European Journal of
Oral Sciences 89, 475-84.
Möller ÅJR, Fabricius L, Dahlén G, Sundqvist G, Happonen RP (2004) Apical periodontitis
development and bacterial response to endodontic treatment. Experimental root canal
infections in monkeys with selected bacterial strains. European Journal of Oral Sciences 112,
207-15.
Molven O, Olsen I, Kerekes K (1991) Scanning electron microscopy of bacteria in the apical
part of root canals in permanent teeth with periapical lesions. Endodontics & Dental
Traumatology 7, 226-9.
Monk BC, Niimi K, Lin S, Knight A, Kardos TB, Cannon RD, Parshot R, King A, Lun D,
Harding DRK (2005) Surface-active fungicidal d-peptide inhibitors of the plasma membrane
proton pump that block azole resistance. Antimicrobial Agents and Chemotherapy 49, 57-70.
Moore T, Croy S, Mallapragada S, Pandit N (2000) Experimental investigation and
mathematical modelling of Pluronic F-127 gel dissolution: drug release in stirred system.
Journal of Controlled Release 67, 191-202.
Morikawa K, Okada F, Hosokawa M, Kobayashi H (1987) Enhancement of therapeutic
effects of recombinant interleukin 2 on a transplantable rat fibrosarcoma by the use of a
sustained release vehicle, Pluronic gel. Cancer Research 47, 37-41.
Nagaoka S, Miyazaki Y, Liu HJ, Iwamoto Y, Kitano M, Kawagoe M (1995) Bacterial
invasion into dentinal tubules of human vital and nonvital teeth. Journal of Endodontics 21,
70-3.
Nair PNR (1987) Light and electron microscopic studies of root canal flora and periapical
lesions. Journal of Endodontics 13, 29-39.
Nair PNR (2004) Pathogenesis of apical periodontitis and the causes of endodontic failures.
Critical Reviews in Oral Biology & Medicine 15, 348-81.

108
Nair PNR, Sjögren U, Krey G, Kahnberg KE, Sundqvist G (1990) Intraradicular bacteria and
fungi in root-filled, asymptomatic human teeth with therapy-resistant periapical lesions: a
long-term light and electron microscopic follow-up study. Journal of Endodontics 16, 580-8.
Nerwich A, Figdor D, Messer HH (1993) pH changes in root dentin over a 4-week period
following root canal dressing with calcium hydroxide. Journal of Endodontics 19, 302-6.
Newa M, Bhandari KH, Oh DH, Kim YR, Sung JH, Kim JO, Woo JS, Choi HG, Yong CS
(2008) Enhanced dissolution of ibuprofen using solid dispersion with poloxamer 407.
Archives of Pharmacal Research 31, 1497-507.
Nguyen LT, Haney, EF, Vogel HJ (2011) The expanding scope of antimicrobial peptide
structures and their modes of action. Trends in Biotechnology 29, 464-72.
Nishimura E, Eto A, Kato M, Hashizume S, Imai S, Nisizawa T, Hanada N (2004) Oral
streptococci exhibit diverse susceptibility to human β-defensin-2: antimicrobial effects of
hBD-2 on oral streptococci. Current Microbiology 48, 85-7.
Noiri Y, Ehara A, Kawahara T, Takemura N, Ebisu S (2002) Participation of bacterial
biofilms in refractory and chronic periapical periodontitis. Journal of Endodontics 28, 679-83.
Norton TA, Thompson RC, Pope J, Veltkamp CJ, Banks B, Howard CV, Hawkins SJ (1998)
Using confocal laser scanning microscopy, scanning electron microscopy and phase contrast
light microscopy to examine marine biofilms. Aquatic Microbial Ecology 16, 199-204.
Nyvad B, Kilian M (1987) Microbiology of the early colonization of human enamel and root
surfaces in vivo. European Journal of Oral Sciences 95, 369-80.
O’Toole GA (2011) Microtiter dish biofilm formation assay. Journal of Visualized
Experiments 47, 1-2.
Ong S, Strahan JD (1989) Effect of a desensitizing dentifrice on dentinal hypersensitivity.
Endodontics & Dental Traumatology 5, 213-8.

109
Okamura K, Maeda M, Nishikawa T, Tsutsui M (1980) Clinical science: dentinal response
against carious invasion: localization of antibodies in odontoblastic body and process. Journal
of Dental Research 59, 1368-73.
Olgart L, Brännström M, Johnson G (1974) Invasion of bacteria into dentinal tubules:
Experiments in vivo and in vitro. Acta Odontologica Scandinavica 32, 61-70.
Omidian H, Park K (2012) Hydrogels. In: Siepmann J, Siegel R, Rathbone M, eds.
Fundamentals and Applications of Controlled Release Drug Delivery; pp. 75-106. New York,
NY: Springer.
Ørstavik D, Haapasalo M (1990) Disinfection by endodontic irrigants and dressings of
experimentally infected dentinal tubules. Dental Traumatology 6, 142-9.
Othman NI (2014) In vitro effect of an antimicrobial peptide against mono-species endodontic
biofilms. DClinDent Thesis. University of Otago, Dunedin, New Zealand.
Ouhara K, Komatsuzawa H, Yamada S, Shiba H, Fujiwara T, Ohara M, Sayama K,
Hashimoto K, Kurihara H, Sugai M (2005) Susceptibilities of periodontopathogenic and
cariogenic bacteria to antibacterial peptides, β-defensins and LL37, produced by human
epithelial cells. Journal of Antimicrobial Chemotherapy 55, 888-96.
Paavola A, Yliruusi J, Rosenberg P (1998) Controlled release and dura mater permeability of
lidocaine and ibuprofen from injectable poloxamer-based gels. Journal of Controlled Release
52, 169-78.
Paddock SW (1999) Confocal laser scanning microscopy. BioTechniques 22, 992-1004.
Pashley DH, Nelson R, Kepler EE (1982) The effects of plasma and salivary constituents on
dentin permeability. Journal of Dental Research 61, 978-81.
Pec EA, Wout ZG, Johnston TP (1992) Biological activity of urease formulated in Poloxamer
407 after intraperitoneal injection in the rat. Journal of Pharmaceutical Sciences 81, 626-30.

110
Peciuliene V, Reynaud AH, Balciuniene I, Haapasalo M (2001) Isolation of yeasts and enteric
bacteria in root-filled teeth with chronic apical periodontitis. International Endodontic
Journal 34, 429-34.
Peeters E, Nelis HJ, Coenye T (2008) Comparison of multiple methods for quantification of
microbial biofilms grown in microtiter plates. Journal of Microbiological Methods 72, 157-
65.
Perez F, Rochd T, Lodter JP, Calas P, Michel G (1993) In vitro study of the penetration of
three bacterial strains into root dentine. Oral Surgery, Oral Medicine, Oral Pathology 76, 97-
103.
Pierce A, Lindskog S (1987) The effect of an antibiotic/corticosteroid paste on inflammatory
root resorption in vivo. Oral Surgery, Oral Medicine, Oral Pathology 64, 216-20.
Pinheiro ET, Gomes BPFA, Ferraz CCR, Sousa ELR, Teixeira FB, Souza-Filho FJ (2003)
Microorganisms from canals of root-filled teeth with periapical lesions. International
Endodontic Journal 36, 1-11.
Pitts B, Hamilton MA, Zelver N, Stewart PS (2003) A microtiter-plate screening method for
biofilm disinfection and removal. Journal of Microbiological Methods 54, 269-76.
Pitts DL, Williams BL, Morton Jr TH (1982) Investigation of the role of endotoxin in
periapical inflammation. Journal of Endodontics 8, 10-8.
Pouny Y, Rapaport D, Mor A, Nicolas P, Shai Y (1992) Interaction of antimicrobial
dermaseptin and its fluorescently labeled analogs with phospholipid membranes.
Biochemistry 31, 12416-23.
Rassing J, Attwood D (1983) Ultrasonic velocity and light-scattering studies on the
polyoxyethylene-polyoxypropylene copolymer Pluronic F127 in aqueous solution.
International Journal of Pharmaceutics 13, 47-55.

111
Ricci EJ, Bentley MVLB, Farah M, Bretas RES, Marchetti JM (2002) Rheological
characterization of Poloxamer 407 lidocaine hydrochloride gels. European Journal of
Pharmaceutical Sciences 17, 161-7.
Ricci EJ, Lunardi LO, Nanclares DMA, Marchetti JM (2005) Sustained release of lidocaine
from Poloxamer 407 gels. International Journal of Pharmaceutics 288, 235-44.
Ricucci D, Siqueira Jr JF (2010) Biofilms and apical periodontitis: study of prevalence
and association with clinical and histopathologic findings. Journal of Endodontics 36, 1277-
88.
Safavi KE, Spångberg LSW, Langeland K (1990) Root canal dentinal tubule disinfection.
Journal of Endodontics 16, 207-10.
Saleh IM, Ruyter IE, Haapasalo M, Ørstavik D (2004) Survival of Enterococcus faecalis in
infected dentinal tubules after root canal filling with different root canal sealers in vitro 37,
193-8.
Sanger F, Nicklen S, Coulson AR (1977) DNA sequencing with chain-terminating inhibitors.
Proceedings of the National Academy of Sciences of the United States of America 74, 5463-7.
Saotome K, Morita H, Umeda M (1989) Cytotoxicity test with simplified crystal violet
staining method using microtitre plates and its application to injection drugs. Toxicology In
Vitro 3, 317-21.
Saxena V, Hussain MD (2012) Poloxamer 407/TPGS mixed micelles for delivery of
gambogic acid to breast and multidrug-resistant cancer. International Journal of
Nanomedicine 7, 713-21.
Schein B, Schilder H (2006) Endotoxin content in endodontically involved teeth. Journal of
Endodontics 32, 293-5.
Schmolka IR (1972) Artificial skin I. Preparation and properties of pluronic F-127 gels for
treatment of burns. Journal of Biomedical Materials Research 6, 571-82.

112
Schmolka IR (1977) A review of block polymer surfactants. Journal of the American Oil
Chemists’ Society 54, 110-6.
Sen BH, Piskin B, Demirci T (1995) Observation of bacteria and fungi in infected root canals
and dentinal tubules by SEM. Dental Traumatology 11, 6-9.
Sengupta D, Leontiadou H, Mark AE, Marrink SJ (2008) Toroidal pores formed by
antimicrobial peptides show significant disorder. Biochimica et Biophysica Acta 1778, 2308-
17.
Serrano R, Kielland-Brandt MC, Fink GR (1986) Yeast plasma membrane ATPase is
essential for growth and has homology with (Na+ + K+), K+ - and Ca2+-ATPases. Nature 319,
689-93.
Shai Y (1999) Mechanism of the binding, insertion and destabilization of phospholipid
bilayer membranes by α-helical antimicrobial and cell non-selective membrane-lytic peptides.
Biochimica et Biophysica Acta 1462, 55-70.
Shuping GB, Ørstavik D, Sigurdsson A, Trope M (2000) Reduction of intracanal bacteria
using nickel-titanium rotary instrumentation and various medications. Journal of Endodontics
26, 751-5.
Silver G (1997) Calcium hydroxide or Ledermix® as the root canal medicament? New
Zealand Endodontic Journal 23, 35-45.
Siqueira Jr JF (2001) Aetiology of root canal treatment failure: why well-treated teeth can fail.
International Endodontic Journal 34, 1-10.
Siqueira Jr JF, De Uzeda M, Fonseca MEF (1996) A scanning electron microscopic
evaluation of in vitro dentinal tubules penetration by selected anaerobic bacteria. Journal of
Endodontics 22, 308-10.
Siqueira Jr JF, Rôças IN (2009) Diversity of endodontic microbiota revisited. Journal of
Dental Research 88, 969-81.

113
Siqueira Jr JF, Rôças IN, Lopes HP (2002) Patterns of microbial colonization in primary root
canal infections. Oral Surgery, Oral Medicine, Oral Pathology, Oral Radiology, and
Endodontology 93, 174-8.
Sjögren U, Figdor D, Spångberg L, Sundqvist G (1991) The antimicrobial effect of calcium
hydroxide as a short-term intracanal dressing. International Endodontic Journal 24, 119-25.
Soldani P, Amaral CM, Rodrigues JA (2010) Microhardness evaluation of in situ vital
bleaching and thickening agents on human dental enamel. International Journal of
Periodontics & Restorative Dentistry 30, 202-11.
Steinberg DA, Hurst MA, Fujii CA, Kung AHC, Ho JF, Cheng FC, Loury DJ, Fiddes JC
(1997) Protegrin-1: a broad-spectrum, rapidly microbicidal peptide with in vivo activity.
Antimicrobial Agents and Chemotherapy 41, 1738-42.
Stepanovic S, Vukovic D, Dakic I, Savic B, Svabic-Vlahovic M (2000) A modified
microtiter-plate test for quanitification of staphylococcal biofilm formation. Journal of
Microbiological Methods 40, 175-9.
Stevens RH, Grossman LI (1983) Evaluation of the antimicrobial potential of calcium
hydroxide as an intracanal medicament. Journal of Endodontics 9, 372-4.
Sundqvist G (1976) Bacteriological studies of necrotic dental pulps. Odontological
Dissertation No. 7. University of Umeå, Umeå, Sweden.
Sundqvist G (1992) Associations between microbial species in dental root canal infections.
Oral Microbiology and Immunology 7, 257-62.
Sundqvist G, Figdor D (2003) Life as an endodontic pathogen. Endodontic Topics 6, 3-28.
Sundqvist G, Figdor D, Persson S, Sjögren U (1998) Microbiologic analysis of teeth with
failed endodontic treatment and the outcome of conservative re-treatment. Oral Surgery, Oral
Medicine, Oral Pathology, Oral Radiology, and Endodontology 85, 86-93.

114
Svensäter G, Bergenholtz G (2004) Biofilms in endodontic infections. Endodontic Topics 9,
27-36.
Takáts Z, Vékey K, Hegedüs L (2001) Qualitative and quantitative determination of
poloxamer surfactants by mass spectrometry. Rapid Communications in Mass Spectrometry
15, 805-10.
Taylor MA, Hume WR, Heithersay GS (1989) Some effects of Ledermix® paste and
Pulpdent® paste on mouse fibroblasts and on bacteria in vitro. Dental Traumatology 5, 266-
73.
Teanpaisan R, Ruangkiatkul P, Thammasitboon K, Puripattanavong J, Faroongsarng D (2013)
Effectiveness of Artocarpus lakoocha extract, poloxamer 407, on Enterococcus faecalis in
vitro. Journal of Investigative and Clinical Dentistry 4, 219-24.
Tong Z, Dong L, Zhou L, Tao R, Ni L (2010) Nisin inhibits dental caries-associated
microorganism in vitro. Peptides 31, 2003-8.
Turner SR, Love RM, Lyons KM (2004). An in-vitro investigation of the antibacterial effect
of nisin in root canals and canal wall radicular dentine. International Endodontic Journal 37,
664-71.
Turnidge JD (2015) Susceptibility Test Methods: General Considerations. In: Jorgensen J,
Pfaller M, Carroll K, Funke G, Landry M, Richter S, Warnock D, eds. Manual of Clinical
Microbiology 11th edn; pp. 1246-52. Washington, DC: American Society for Microbiology
Press.
Vadnere M, Amidon G, Lindenbaum S, Haslam JL (1984) Thermodynamic studies on the gel-
sol transition of some pluronic polyols. International Journal of Pharmaceutics 22, 207-18.
Vagner J, Qu H, Hruby VJ (2008) Peptidomimetics, a synthetic tool of drug discovery.
Current Opinion in Chemical Biology 12, 292-6.
Vertucci FJ (1984) Root canal anatomy of the human permanent teeth. Oral Surgery, Oral
Medicine, Oral Pathology 58, 589-99.

115
Veyries ML, Couarraze G, Geiger S, Agnely F, Massias L, Kunzli B, Faurisson F, Rouveix B
(1999) Controlled release of vancomycin from Poloxamer 407 gels. International Journal of
Pharmaceutics 192, 183-93.
Veyries ML, Faurisson F, Joly-Guillou ML, Rouveix B (2000) Control of Staphylococcal
adhesion to polymethylmethacrylate and enhancement of susceptibility to antibiotics by
Poloxamer 407. Antimicrobial Agents and Chemotherapy 44, 1093-6.
Vogel HJ, Schibli DJ, Jing W, Lohmeier-Vogel EM, Epand RF, Epand RM (2002) Towards a
structure-function analysis of bovine lactoferrin and related tryptophan- and arginine-
containing peptides. Biochemistry and Cell Biology 80, 49-63.
Wade D, Boman A, Wåhlin B, Drain CM, Andreu D, Boman HG, Merrifield RB (1990) All-
D amino acid-containing channel-forming antibiotic peptides. Proceedings of the National
Academy of Sciences of the United States of America 87, 4761-5.
Waltimo TMT, Sirén EK, Ørstavik D, Haapasalo MPP (1999) Susceptibility of oral Candida
species to calcium hydroxide in vitro. International Endodontic Journal 32, 94-8.
Waltimo TMT, Sirén EK, Torkko HLK, Olsen I, Haapasalo MPP (1997) Fungi in therapy‐
resistant apical periodontitis. International Endodontic Journal 30, 96-101.
Walton RE (1984) Intracanal medicaments. Dental Clinics of North America 28, 783-96.
Wang JD, Hume WR (1988) Diffusion of hydrogen ion and hydroxyl ion from various
sources through dentine. International Endodontic Journal 21, 17-26.
Wang Z, Wang G (2004) APD: the antimicrobial peptide database. Nucleic Acids Research
32, 590-2.
Weigand I, Hilpert K, Hancock REW (2008) Agar and broth dilution methods to determine
the minimal inhibitory concentration (MIC) of antimicrobial substances. Nature Protocols 3,
163-75.

116
Weiger R, Manncke B, Werner H, Löst C (1995) Microbial flora of sinus tracts and root
canals of non-vital teeth. Dental Traumatology 11, 15-9.
Wittgow Jr WC, Sabiston Jr CB (1975) Microorganisms from pulpal chambers of intact teeth
with necrotic pulps. Journal of Endodontics 1, 168-71.
Woese CR, Fox GE (1977) Phylogenetic structure of the prokaryotic domain: the primary
kingdoms. Proceedings of the National Academy of Sciences 74, 5088-90.
Woo PCY, Lau SKP, Teng JLL, Tse H, Yuen KY (2008) Then and now: use of 16S rDNA
gene sequencing for bacterial identification and discovery of novel bacteria in clinical
microbiology laboratories. Clinical Microbiology and Infection 14, 908-34.
Wu M, Hancock REW (1999) Interaction of the cyclic antimicrobial cationic peptide
bactenecin with the outer and cytoplasmic membrane. The Journal of Biological Chemistry
274, 29-35.
Yamaguchi S, Hong T, Waring A, Lehrer RI, Hong M (2002) Solid-state NMR investigations
of peptide-lipid interaction and orientation of a β-Sheet antimicrobial peptide, protegrin.
Biochemistry 41, 9852-62.
Yang L, Harroun TA, Weiss TM, Ding L, Huang HW (2001) Barrel-stave model or toroidal
model? A case study on melittin pores. Biophysical Journal 81, 1475-85.
Yang L, Weiss TM, Lehrer RI, Huang HW (2000) Crystallization of antimicrobial pores in
membranes: magainin and protegrin. Biophysical Journal 79, 2002-9.
Yau WM, Wimley WC, Gawrisch K, White SH (1998) The preference of tryptophan for
membrane interfaces. Biochemistry 37, 14713-8.
Yoganathan V (2012) Evaluation of the effects of antimicrobial peptides on endodontic
pathogens in vitro. DClinDent Thesis. University of Otago, Dunedin, New Zealand.

117
Zasloff M (1987) Magainins, a class of antimicrobial peptides from Xenopus skin: isolation,
characterization of two active forms, and partial cDNA sequence of a precursor. Proceedings
of the National Academy of Sciences of the United States of America 84, 5449-53.
Zasloff M (2002) Antimicrobial peptides of multicellular organisms. Nature 415, 389-95.
Zavistoski J, Dzink J, Onderdonk A, Bartlett J (1980) Quantitative bacteriology of endodontic
infections. Oral Surgery, Oral Medicine, Oral Pathology 49, 171-4.
Zhang L, Parsons DL, Navarre C, Kompella UB (2002) Development and in-vitro evaluation
of sustained release Poloxamer 407 (P407) gel formulations of ceftiofur. Journal of
Controlled Release 85, 73-81.
Zhao L, Lu W (2011) D-peptide-based drug discovery aided by chemical protein synthesis.
Israel Journal of Chemistry 51, 868-75.
Zinner DD, Duany LF, Lutz HJ (1977) A new desensitizing dentifrice: preliminary report.
The Journal of the American Dental Association 95, 982-5.

118
Appendices
Appendix A: Spectrophotometric analysis of BM2
Spectrophotometric analysis of the BM2 product was carried out to establish the net peptide
content. Table A1 shows the series of concentrations of BM2 produced and the theoretical and
experimental absorbance values established. Absorbance values were read at 280 nm and
revealed an actual concentration of approximately 50%. Figure A1 shows the standard curve
for BM2 demonstrating the linear relationship between concentration and absorbance as well
as the differences between the theoretical and experimental absorbance values.
Table A1 Concentrations of BM2 after serial dilutions with theoretical and experimental
absorbance values attained at 280 nm.
Concentration
(µM)
Theoretical absorbance value
(A280nm)
Experimental absorbance value
(A280nm)
200 2.3 0.962
100 1.15 0.601
50 0.575 0.311
25 0.2875 0.144
12.5 0.14375 0.069
6.25 0.071875 0.032
3.125 0.0359375 0.011

119
Figure A1 Standard curve of BM2. The values plotted are the theoretical and experimental absorbance values attained at 280 nm.
y = 0.005x + 0.0199
R² = 0.9845
0
0.2
0.4
0.6
0.8
1
1.2
1.4
1.6
1.8
2
2.2
2.4
2.6
0 20 40 60 80 100 120 140 160 180 200
Ab
sorb
an
ce (
OD
280n
m)
Concentration (µM)
Standard curve BM2
Absorbance (Theoretical) Absorbance (Experimental)

120
Appendix B: Minimum inhibitory concentration microtitre plate set up (aqueous BM2)
Figure B1 Microtitre plate set up to assess minimum inhibitory concentrations of aqueous BM2.
SB = Sterile broth
1 2 3 4 5 6 7 8 9 10 11 12
A SB Empty well 128 µg/mL BM2 solution Sterile water Empty well SB
B SB Empty well 64 µg/mL BM2 solution Sterile water Empty well SB
C SB Empty well 32 µg/mL BM2 solution Sterile water Empty well SB
D SB Empty well 16 µg/mL BM2 solution Sterile water Empty well SB
E SB Empty well 8 µg/mL BM2 solution Sterile water Empty well SB
F SB Empty well 4 µg/mL BM2 solution Sterile water Empty well SB
G SB Empty well 2 µg/mL BM2 solution Sterile water Empty well SB
H SB SB SB SB SB SB SB SB SB SB SB SB

121
Appendix C: Minimum inhibitory concentration microtitre plate set up (BM2 in P407 gel)
Figure C1 Microtitre plate set up to assess minimum inhibitory concentrations of BM2-loaded P407 gels.
SB = Sterile broth
1 2 3 4 5 6 7 8 9 10 11 12
A SB SB SB SB SB SB SB SB SB SB SB SB
B SB
512 µg/mL
BM2-P407
gel
256 µg/mL
BM2-P407
gel
128 µg/mL
BM2-P407
gel
64 µg/mL
BM2-P407
gel
32 µg/mL
BM2-P407
gel
16 µg/mL
BM2-P407
gel
8 µg/mL
BM2-P407
gel
4 µg/mL
BM2-P407
gel
2 µg/mL
BM2-P407
gel
0 µg/mL
BM2-P407
gel
SB
C SB SB
D SB SB
E SB SB
F SB SB
G SB
512 µg/mL
BM2-P407
gel with
SB
256 µg/mL
BM2-P407
gel with
SB
128 µg/mL
BM2-P407
gel with
SB
64 µg/mL
BM2-P407
gel with
SB
32 µg/mL
BM2-P407
gel with
SB
16 µg/mL
BM2-P407
gel with
SB
8 µg/mL
BM2-P407
gel with
SB
4 µg/mL
BM2-P407
gel with
SB
2 µg/mL
BM2-P407
gel with
SB
0 µg/mL
BM2-P407
gel with
SB
SB
H SB SB SB SB SB SB SB SB SB SB SB SB
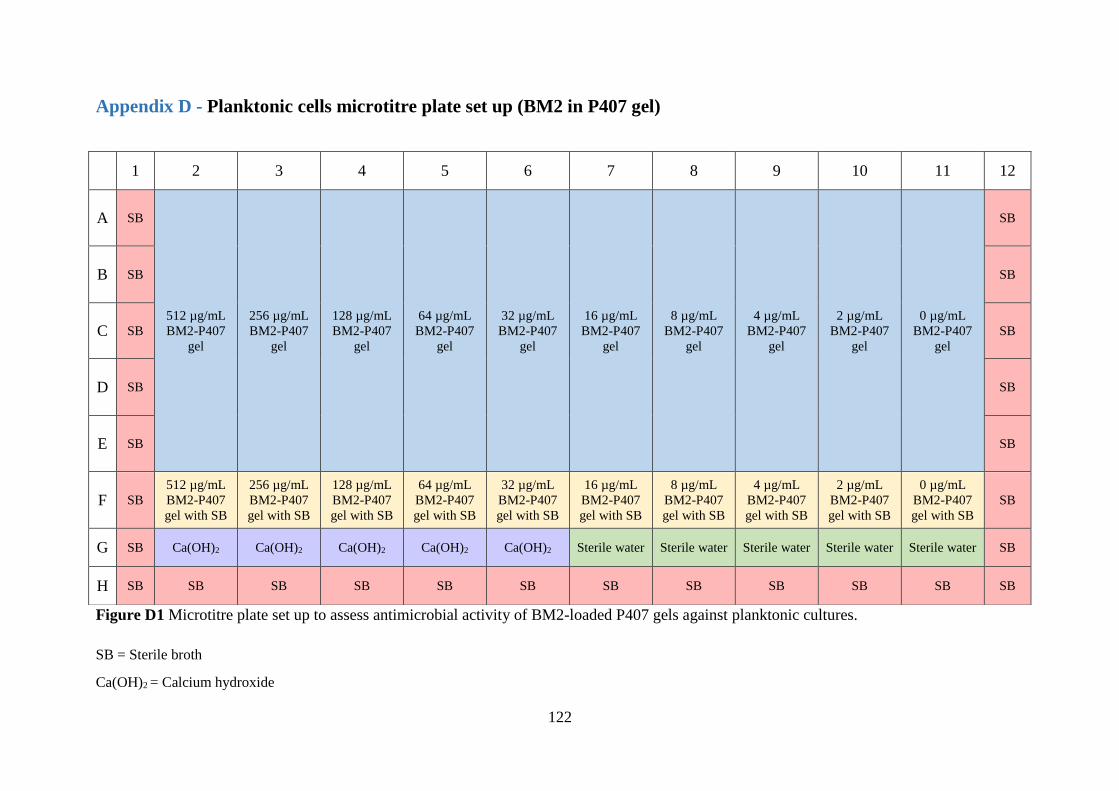
122
Appendix D - Planktonic cells microtitre plate set up (BM2 in P407 gel)
Figure D1 Microtitre plate set up to assess antimicrobial activity of BM2-loaded P407 gels against planktonic cultures.
SB = Sterile broth
Ca(OH)2 = Calcium hydroxide
1 2 3 4 5 6 7 8 9 10 11 12
A SB
512 µg/mL
BM2-P407
gel
256 µg/mL
BM2-P407
gel
128 µg/mL
BM2-P407
gel
64 µg/mL
BM2-P407
gel
32 µg/mL
BM2-P407
gel
16 µg/mL
BM2-P407
gel
8 µg/mL
BM2-P407
gel
4 µg/mL
BM2-P407
gel
2 µg/mL
BM2-P407
gel
0 µg/mL
BM2-P407
gel
SB
B SB SB
C SB SB
D SB SB
E SB SB
F SB
512 µg/mL
BM2-P407
gel with SB
256 µg/mL
BM2-P407
gel with SB
128 µg/mL
BM2-P407
gel with SB
64 µg/mL
BM2-P407
gel with SB
32 µg/mL
BM2-P407
gel with SB
16 µg/mL
BM2-P407
gel with SB
8 µg/mL
BM2-P407
gel with SB
4 µg/mL
BM2-P407
gel with SB
2 µg/mL
BM2-P407
gel with SB
0 µg/mL
BM2-P407
gel with SB
SB
G SB Ca(OH)2 Ca(OH)2 Ca(OH)2 Ca(OH)2 Ca(OH)2 Sterile water Sterile water Sterile water Sterile water Sterile water SB
H SB SB SB SB SB SB SB SB SB SB SB SB

123
Appendix E - Planktonic cells (aqueous BM2)
Figure E1 Microtitre plate set up to assess antimicrobial activity of aqueous BM2 against planktonic cultures.
SB = Sterile broth
1 2 3 4 5 6 7 8 9 10 11 12
A SB
512 µg/mL
BM2
solution
256 µg/mL
BM2
solution
128 µg/mL
BM2
solution
64 µg/mL
BM2
solution
32 µg/mL
BM2
solution
16 µg/mL
BM2
solution
8 µg/mL
BM2
solution
4 µg/mL
BM2
solution
2 µg/mL
BM2
solution
Empty well SB
B SB Empty well SB
C SB Empty well SB
D SB Empty well SB
E SB Empty well SB
F SB Empty well Empty well Empty well Empty well Empty well Empty well Empty well Empty well Empty well Empty well SB
G SB Empty well Empty well Empty well Empty well Empty well Empty well Empty well Empty well Empty well Empty well SB
H SB SB SB SB SB SB SB SB SB SB SB SB

124
Appendix F - Biofilms microtitre plate set up (BM2 in P407 gel)
Figure F1 Microtitre plate set up to assess antimicrobial activity of BM2-loaded P407 gels against monospecies biofilms. Separate plates were
set up for each exposure period.
SB = Sterile broth
PBS = Phosphate buffer saline
Ca(OH)2 = Calcium hydroxide
1 2 3 4 5 6 7 8 9 10 11 12
A SB SB SB SB SB SB SB SB SB SB SB SB
B SB
512 µg/mL
BM2-P407
gel
256 µg/mL
BM2-P407
gel
128 µg/mL
BM2-P407
gel
64 µg/mL
BM2-P407
gel
32 µg/mL
BM2-P407
gel
16 µg/mL
BM2-P407
gel
8 µg/mL
BM2-P407
gel
4 µg/mL
BM2-P407
gel
2 µg/mL
BM2-P407
gel
0 µg/mL
BM2-P407
gel
SB
C SB SB
D SB SB
E SB SB
F SB SB
G SB Ca(OH)2 Ca(OH)2 Ca(OH)2 Ca(OH)2 Ca(OH)2 PBS PBS PBS PBS PBS SB
H SB SB SB SB SB SB SB SB SB SB SB SB

125
Appendix G - Biofilms microtitre plate set up (aqueous BM2)
Figure G1 Microtitre plate set up to assess antimicrobial activity of aqueous BM2 against monospecies biofilms. Separate plates were set up for
each exposure period.
SB = Sterile broth
1 2 3 4 5 6 7 8 9 10 11 12
A SB SB SB SB SB SB SB SB SB SB SB SB
B SB
512 µg/mL
BM2
solution
256 µg/mL
BM2
solution
128 µg/mL
BM2
solution
64 µg/mL
BM2
solution
32 µg/mL
BM2
solution
16 µg/mL
BM2
solution
8 µg/mL
BM2
solution
4 µg/mL
BM2
solution
2 µg/mL
BM2
solution
Empty well SB
C SB Empty well SB
D SB Empty well SB
E SB Empty well SB
F SB Empty well SB
G SB Empty well Empty well Empty well Empty well Empty well Empty well Empty well Empty well Empty well Empty well SB
H SB SB SB SB SB SB SB SB SB SB SB SB

126
Appendix H – Minimum inhibitory concentration
Aqueous BM2
Table H1 Difference in absorbance after exposure to varying concentrations for aqueous BM2 for 24 hours. The OD values plotted are mean ±
standard deviation.
= lowest concentration whereby no visible growth evident after 24 hours incubation
BM2 in P407 gel
Table H2 Difference in absorbance after exposure to varying concentrations of BM2-loaded P407 gels for 24 hours. The OD values plotted are
mean ± standard deviation.
= lowest concentration of BM2 in P407 whereby no visible growth evident after 24 hours incubation
Concentration of BM2 (µg/mL)
Mean ± SD 0 2 4 8 16 32 64 128 p value
C. albicans 1.611 ± 0.026 1.510 ± 0.057 1.419 ± 0.068 1.224 ± 0.160 0.541 ± 0.064 0.007 ± 0.013 -0.001 ± 0.006 -0.002 ± 0.002 < 0.001
S. gordonii 0.519 ± 0.042 0.522 ± 0.039 0.438 ± 0.022 0.059 ± 0.027 0.009 ± 0.006 0.008 ± 0.006 0.001 ± 0.004 -0.039 ± 0.018 < 0.001
S. mutans 0.448 ± 0.021 0.410 ± 0.039 0.002 ± 0.002 0.003 ± 0.003 0.003 ± 0.001 0.005 ± 0.004 0.011 ± 0.007 -0.056 ± 0.029 < 0.001
E. faecalis 0.404 ± 0.021 0.378 ± 0.018 0.353 ± 0.068 0.402 ± 0.016 0.350 ± 0.023 0.021 ± 0.003 0.003 ± 0.004 -0.030 ± 0.022 < 0.001
Concentration of BM2 in 25% P407 (µg/mL)
Mean ± SD 0 2 4 8 16 32 64 128 256 512 p value
C. albicans 1.151 ± 0.063 1.018 ± 0.100 1.110 ± 0.143 1.197 ± 0.094 1.057 ± 0.060 1.037 ± 0.078 0.874 ± 0.066 0.319 ± 0.081 0.000 ± 0.002 -0.001 ± 0.002 < 0.001
S. gordonii 0.289 ± 0.010 0.267 ± 0.018 0.259 ± 0.018 0.207 ± 0.010 0.197 ± 0.008 0.187 ± 0.006 0.068 ± 0.012 0.005 ± 0.003 -0.006 ± 0.007 -0.014 ± 0.011 < 0.001
S. mutans 0.123 ± 0.010 0.114 ± 0.007 0.117 ± 0.006 0.110 ± 0.007 0.088 ± 0.006 0.002 ± 0.002 -0.001 ± 0.001 0.000 ± 0.002 0.002 ± 0.002 -0.014 ± 0.007 < 0.001
E. faecalis 0.164 ± 0.006 0.161 ± 0.005 0.171 ± 0.005 0.165 ± 0.006 0.165 ± 0.010 0.161 ± 0.006 0.162 ± 0.008 0.147 ± 0.006 0.099 ± 0.007 0.010 ± 0.006 < 0.001

127
Appendix I – Minimum inhibitory concentration C. albicans
Aqueous BM2
Table I1 Absorbance values attained at 600 nm for C. albicans ATCC 10261 after exposure to
aqueous BM2. The OD values plotted are mean ± standard deviation.
BM2 in P407 gel
Table I2 Absorbance values attained at 600 nm for C. albicans ATCC 10261 after exposure to
BM2-loaded P407 gels. The OD values plotted are mean ± standard deviation.
Concentration
(µg/mL)
Time 0 h
(mean ± standard deviation)
Time 24 h
(mean ± standard deviation) p value
0 0.044 ± 0.006 1.655 ± 0.023 < 0.001
2 0.043 ± 0.007 1.553 ± 0.063 < 0.001
4 0.043 ± 0.006 1.462 ± 0.073 < 0.001
8 0.042 ± 0.005 1.266 ± 0.165 < 0.001
16 0.047 ± 0.008 0.587 ± 0.071 0.001
32 0.041 ± 0.005 0.048 ± 0.016 0.163
64 0.042 ± 0.005 0.042 ± 0.005 0.699
128 0.042 ± 0.005 0.040 ± 0.004 0.361
Test agent Time 0 h
(mean ± standard deviation)
Time 24 h
(mean ± standard deviation) p value
BM2 gel – 0 0.036 ± 0.001 1.187 ± 0.064 < 0.001
BM2 gel – 2 0.037 ± 0.002 1.055 ± 0.100 < 0.001
BM2 gel – 4 0.036 ± 0.002 1.146 ± 0.143 < 0.001
BM2 gel – 8 0.037 ± 0.002 1.234 ± 0.094 < 0.001
BM2 gel – 16 0.038 ± 0.001 1.095 ± 0.059 < 0.001
BM2 gel – 32 0.036 ± 0.001 1.073 ± 0.078 < 0.001
BM2 gel – 64 0.036 ± 0.002 0.910 ± 0.066 < 0.001
BM2 gel – 128 0.036 ± 0.001 0.356 ± 0.081 < 0.001
BM2 gel – 256 0.036 ± 0.002 0.036 ± 0.001 0.490
BM2 gel – 512 0.036 ± 0.002 0.035 ± 0.001 0.032
Calcium hydroxide 0.079 ± 0.007 0.240 ± 0.027 < 0.001
Sterile water 0.037 ± 0.002 1.656 ± 0.032 < 0.001

128
Appendix J – Minimum inhibitory concentration S. gordonii
Aqueous BM2
Table J1 Absorbance values attained at 600 nm for S. gordonii DL1 after exposure to aqueous
BM2. The OD values plotted are mean ± standard deviation.
BM2 in P407 gel
Table J2 Absorbance values attained at 600 nm for S. gordonii DL1 after exposure to BM2-
loaded P407 gels. The OD values plotted are mean ± standard deviation.
Concentration
(µg/mL)
Time 0 h
(mean ± standard deviation)
Time 24 h
(mean ± standard deviation) p value
0 0.051 ± 0.001 0.570 ± 0.042 < 0.001
2 0.050 ± 0.002 0.571 ± 0.039 < 0.001
4 0.049 ± 0.002 0.488 ± 0.022 < 0.001
8 0.048 ± 0.002 0.107 ± 0.026 < 0.001
16 0.049 ± 0.001 0.058 ± 0.006 < 0.001
32 0.051 ± 0.001 0.059 ± 0.005 < 0.001
64 0.079 ± 0.004 0.080 ± 0.005 0.754
128 0.232 ± 0.017 0.193 ± 0.016 0.502
Test agent Time 0 h
(mean ± standard deviation)
Time 24 h
(mean ± standard deviation) p value
BM2 gel – 0 0.036 ± 0.002 0.325 ± 0.009 < 0.001
BM2 gel – 2 0.037 ± 0.001 0.304 ± 0.018 < 0.001
BM2 gel – 4 0.036 ± 0.002 0.295 ± 0.018 < 0.001
BM2 gel – 8 0.037 ± 0.002 0.244 ± 0.011 < 0.001
BM2 gel – 16 0.038 ± 0.002 0.234 ± 0.006 < 0.001
BM2 gel – 32 0.037 ± 0.002 0.224 ± 0.007 < 0.001
BM2 gel – 64 0.035 ± 0.001 0.102 ± 0.012 < 0.001
BM2 gel – 128 0.037 ± 0.001 0.042 ± 0.003 < 0.001
BM2 gel – 256 0.041 ± 0.002 0.036 ± 0.006 0.001
BM2 gel – 512 0.072 ± 0.009 0.059 ± 0.007 < 0.001
Calcium hydroxide 0.167 ± 0.015 0.407 ± 0.016 < 0.001
Sterile water 0.040 ± 0.002 0.316 ± 0.011 < 0.001

129
Appendix K – Minimum inhibitory concentration S. mutans
Aqueous BM2
Table K1 Absorbance values attained at 600 nm for S. mutans NG8 after exposure to aqueous
BM2. The OD values plotted are mean ± standard deviation.
BM2 in P407 gel
Table K2 Absorbance values attained at 600 nm for S. mutans NG8 after exposure to BM2-
loaded P407 gels. The OD values plotted are mean ± standard deviation.
Concentration
(µg/mL)
Time 0 h
(mean ± standard deviation)
Time 24 h
(mean ± standard deviation) p value
0 0.049 ± 0.001 0.498 ± 0.022 < 0.001
2 0.048 ± 0.001 0.458 ± 0.040 < 0.001
4 0.049 ± 0.002 0.050 ± 0.002 0.019
8 0.048 ± 0.002 0.050 ± 0.003 0.007
16 0.049 ± 0.002 0.052 ± 0.002 < 0.001
32 0.052 ± 0.002 0.057 ± 0.005 0.003
64 0.079 ± 0.008 0.089 ± 0.013 0.016
128 0.246 ± 0.012 0.190 ± 0.027 < 0.001
Test agent Time 0 h
(mean ± standard deviation)
Time 24 h
(mean ± standard deviation) p value
BM2 gel – 0 0.038 ± 0.002 0.161 ± 0.009 < 0.001
BM2 gel – 2 0.038 ± 0.002 0.152 ± 0.006 < 0.001
BM2 gel – 4 0.037 ± 0.002 0.154 ± 0.006 < 0.001
BM2 gel – 8 0.039 ± 0.002 0.149 ± 0.007 < 0.001
BM2 gel – 16 0.038 ± 0.002 0.126 ± 0.007 < 0.001
BM2 gel – 32 0.036 ± 0.001 0.038 ± 0.001 0.003
BM2 gel – 64 0.038 ± 0.002 0.037 ± 0.001 0.168
BM2 gel – 128 0.038 ± 0.001 0.038 ± 0.002 0.812
BM2 gel – 256 0.043 ± 0.001 0.044 ± 0.002 0.016
BM2 gel – 512 0.071 ± 0.007 0.058 ± 0.004 < 0.001
Calcium hydroxide 0.145 ± 0.007 0.345 ± 0.018 < 0.001
Sterile water 0.039 ± 0.001 0.169 ± 0.014 < 0.001

130
Appendix L – Minimum inhibitory concentration E. faecalis
Aqueous BM2
Table L1 Absorbance values attained at 600 nm for E. faecalis JH2-2 after exposure to aqueous
BM2. The OD values plotted are mean ± standard deviation.
BM2 in P407 gel
Table L2 Absorbance values attained at 600 nm for E. faecalis JH2-2 after exposure to BM2-
loaded P407 gels. The OD values plotted are mean ± standard deviation.
Concentration
(µg/mL)
Time 0 h
(mean ± standard deviation)
Time 24 h
(mean ± standard deviation) p value
0 0.050 ± 0.002 0.454 ± 0.021 < 0.001
2 0.048 ± 0.002 0.426 ± 0.019 < 0.001
4 0.049 ± 0.002 0.402 ± 0.066 < 0.001
8 0.048 ± 0.003 0.449 ± 0.017 < 0.001
16 0.049 ± 0.003 0.399 ± 0.024 < 0.001
32 0.052 ± 0.002 0.073 ± 0.004 < 0.001
64 0.086 ± 0.005 0.089 ± 0.004 0.084
128 0.238 ± 0.018 0.208 ± 0.009 < 0.001
Test agent Time 0 h
(mean ± standard deviation)
Time 24 h
(mean ± standard deviation) p value
BM2 gel – 0 0.036 ± 0.001 0.200 ± 0.006 < 0.001
BM2 gel – 2 0.036 ± 0.001 0.197 ± 0.005 < 0.001
BM2 gel – 4 0.035 ± 0.001 0.206 ± 0.005 < 0.001
BM2 gel – 8 0.037 ± 0.001 0.202 ± 0.006 < 0.001
BM2 gel – 16 0.038 ± 0.003 0.203 ± 0.008 < 0.001
BM2 gel – 32 0.036 ± 0.002 0.197 ± 0.006 < 0.001
BM2 gel – 64 0.035 ± 0.001 0.197 ± 0.008 < 0.001
BM2 gel – 128 0.036 ± 0.001 0.184 ± 0.006 < 0.001
BM2 gel – 256 0.042 ± 0.002 0.141 ± 0.007 < 0.001
BM2 gel – 512 0.068 ± 0.004 0.078 ± 0.006 < 0.001
Calcium hydroxide 0.153 ± 0.010 0.352 ± 0.022 < 0.001
Sterile water 0.037 ± 0.001 0.300 ± 0.007 < 0.001