Embed Size (px)
Citation preview
The effects on consumer welfare of a corporate tax cut
Chris Murphy*
Visiting Fellow
Arndt-Corden Department of Economics
Crawford School of Public Policy
Australian National University
Abstract
This paper analyses in two ways the effects of an Australian Government proposal to reduce
the corporate tax rate from 30 to 25 per cent. Murphy (2016a) modelled the proposal for the
Australian Treasury using CGETAX (Murphy, 2016b), a large-scale, long-run CGE model
designed for tax policy analysis. The gain in the real wage is estimated at 1.0 per cent.
Depending on how the company tax cut is funded, the net gain in annual consumer welfare is
between $4.1 billion and $5.2 billion in 2015/16 terms and the associated gain in real GDP is
from 0.7 to 0.9 per cent. This paper also uses a highly stylised version of CGETAX to provide
a theoretical analysis of the proposed tax cut, applicable to advanced, open economies in
general. Echoing CGETAX including by allowing for imperfect competition, the Stylised
model shows an increase in the capital-labour ratio from the reduction in the cost of capital, an
increase in the labour supply induced by a higher real wage when the tax cut is passed on from
internationally mobile capital to labour, and a reduction in the incentive to shift profits to lower-
taxed jurisdictions (de Mooij and Devereux (2009)). This paper also discusses the likely timing
on the introduction of the tax cut and the economic responses to it.
JEL classification: C68, D43, H25
Key words: Computable General Equilibrium models, Oligopoly, Corporate tax, Australia
21 May 2016
* I would like to thank participants at a seminar at the Arndt-Corden Department of Economics,
ANU, for helpful comments.
1
The effects on consumer welfare of a corporate tax cut
1 Introduction
This paper analyses the effects of an Australian Government proposal to reduce the Australian
corporate tax rate from 30 to 25 per cent. Detailed Computable General Equilibrium (CGE)
modelling of the proposal has already been conducted for the Australian Treasury1 (Murphy,
2016a). That report to the Treasury used CGETAX (Murphy, 2016b), a large-scale CGE model
designed for tax policy analysis. This extension to that work uses a highly stylised version of
CGETAX to provide a theoretical analysis of the proposed tax cut. It focusses mainly on the
effects of the company tax cut on consumer welfare. One aim of this theoretical analysis is to
provide a general analysis of a corporate tax cut, applicable to advanced, open economies in
general. The other aim is to complement the CGETAX modelling of the company tax cut by
making transparent its economics and to identify the key parameters that drive the main results.
The standard analysis of a company tax cut in an open economy includes an increase in the
capital-labour ratio from the reduction in the cost of capital, and an increase in the labour supply
induced by a higher real wage when the tax cut is passed on from internationally mobile capital
to labour. The analysis here extends this by allowing for the reduction in the incentive to shift
profits to lower-taxed jurisdictions (using the approach of de Mooij and Devereux (2009)), and
by allowing for oligopoly rents in the tax base. The Stylised model is set out in section 2, and
its results for a company tax cut are interpreted in section 3.
The paper then turns to the CGETAX modelling. While CGETAX incorporates all of the
features of the Stylised model, it also has many other features, which are summarised in section
4. This is followed by a summary in section 5 of the CGETAX company tax cut simulation
results.
Section 6 explains the similarities and differences between the CGETAX results and the
company tax modelling of other Australian researchers. CGETAX is a model of long run
equilibrium and so section 7 addresses the issue of timing, includes the phasing of the proposed
company tax cut and the likely timing of the modelled responses.
1 This working paper includes results from modelling of company taxation that were produced for the
Australian Treasury. The views expressed in this paper are solely those of the author and do not
necessarily represent the views of the Australian Treasury or the Australian Government.
2
2 Stylised Model
This section outlines the Stylised model of an open economy, designed for analysing the effects
of a corporate tax cut.
In a textbook analysis, a company tax cut reduces the cost of capital, leading to a higher capital-
to-labour ratio. In an open economy with perfect capital mobility, no fixed factors of
production and perfect competition, the full incidence of the company tax cut falls on labour,
and the resulting increase in the real wage stimulates the labour supply and employment. The
Stylised model generalises that analysis in two ways.
As a tax based on a firm’s surplus, company tax applies to both the normal return on capital
and any oligopoly rents. As the economic effects of taxing these two components differ, and
oligopoly rents may be substantial in some sectors, the Stylised model allows for oligopoly,
with perfect competition as a special case.
There is a large body of research demonstrating that MNCs engage in profit shifting to low-
taxed jurisdictions to avoid tax. In that context, a company tax cut may have the benefit of
reducing profit shifting to other jurisdictions, resulting in a reduction in wasteful tax avoidance
activity. This paper therefore also allows for profit shifting, following the approach of de Mooij
and Devereux (2009).
Thus, the Stylised model refers to a long run equilibrium in an open economy. It captures the
effects of a company tax cut on the capital-labour ratio, labour supply and tax avoidance, while
allowing for oligopoly power and taxation of oligopoly rents. Besides company tax, for
comparative purposes the Stylised model also includes taxes on payrolls, labour income and
consumption.
Production, households and consumer welfare in the Stylised model are now discussed in turn.
Production
A representative firm produces output y using capital k and labour n under constant returns to
scale.
𝑦 = 𝑓(𝑘, 𝑛) [1]
The oligopolist determines price by applying a mark-up factor m to marginal cost. This
assumption for the form of oligopoly has the advantages that perfect competition can be
allowed for as a special case (m=1), and the assumption of constant returns to scale can be
maintained. It is the most common approach to oligopoly in CGE models (Roson, 2006).
Further, mark-up pricing is consistent with a number of theories of oligopoly. These include
the well-known Cournot-Nash model, the conjectural variations model (Katz and Rosen, 1983
and Dung, 1993), which has the Cournot-Nash model as a special case, and the mark-up
3
strategy models of Grant and Quiggin (1994). These mark-up pricing models all have the
common feature that they generate imperfect competition by assuming that the number of firms
in an industry is fixed.
The mark-up factor can be constructed from the parameters of the underlying oligopoly theory
that is selected. Alternatively, the mark-up factor may be estimated empirically from industry
data on costs and profits and an assumed normal rate of return on capital, which is the approach
taken here.
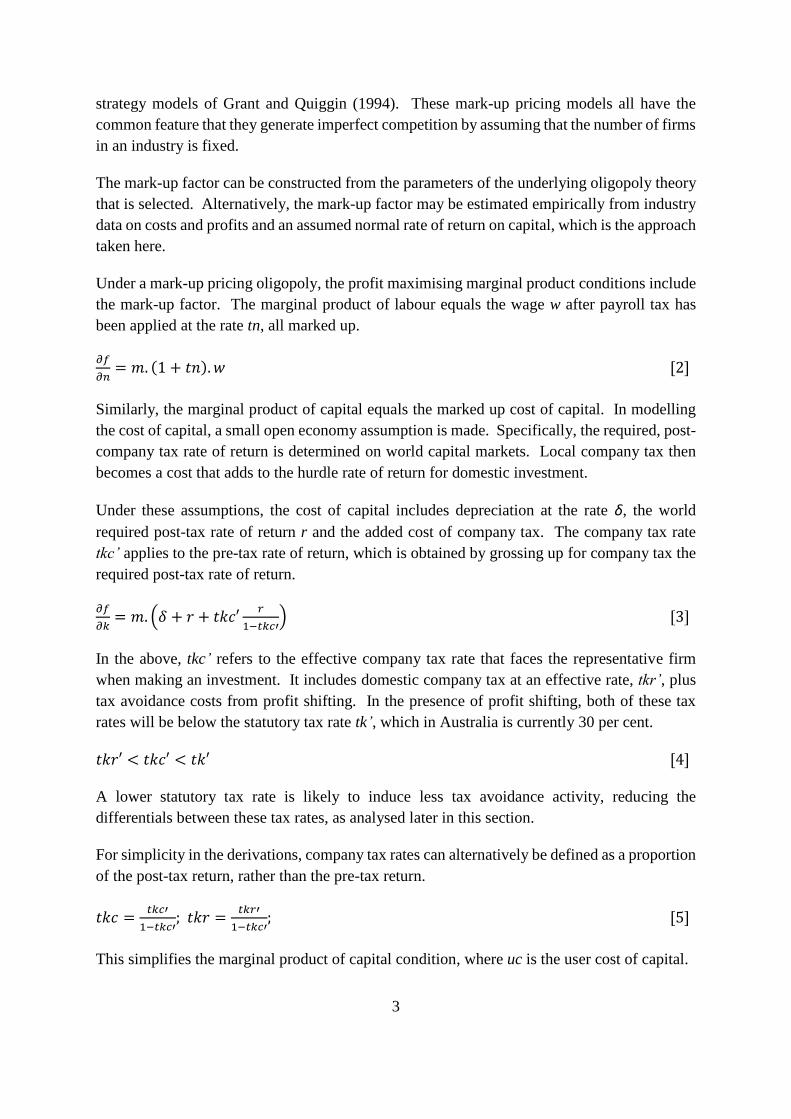
Under a mark-up pricing oligopoly, the profit maximising marginal product conditions include
the mark-up factor. The marginal product of labour equals the wage w after payroll tax has
been applied at the rate tn, all marked up.
𝜕𝑓
𝜕𝑛= 𝑚. (1 + 𝑡𝑛). 𝑤 [2]
Similarly, the marginal product of capital equals the marked up cost of capital. In modelling
the cost of capital, a small open economy assumption is made. Specifically, the required, post-
company tax rate of return is determined on world capital markets. Local company tax then
becomes a cost that adds to the hurdle rate of return for domestic investment.
Under these assumptions, the cost of capital includes depreciation at the rate δ, the world
required post-tax rate of return r and the added cost of company tax. The company tax rate
tkc’ applies to the pre-tax rate of return, which is obtained by grossing up for company tax the
required post-tax rate of return.
𝜕𝑓
𝜕𝑘= 𝑚. (𝛿 + 𝑟 + 𝑡𝑘𝑐′
𝑟
1−𝑡𝑘𝑐′) [3]
In the above, tkc’ refers to the effective company tax rate that faces the representative firm
when making an investment. It includes domestic company tax at an effective rate, tkr’, plus
tax avoidance costs from profit shifting. In the presence of profit shifting, both of these tax
rates will be below the statutory tax rate tk’, which in Australia is currently 30 per cent.
𝑡𝑘𝑟′ < 𝑡𝑘𝑐′ < 𝑡𝑘′ [4]
A lower statutory tax rate is likely to induce less tax avoidance activity, reducing the
differentials between these tax rates, as analysed later in this section.
For simplicity in the derivations, company tax rates can alternatively be defined as a proportion
of the post-tax return, rather than the pre-tax return.
𝑡𝑘𝑐 =𝑡𝑘𝑐′
1−𝑡𝑘𝑐′; 𝑡𝑘𝑟 =
𝑡𝑘𝑟′
1−𝑡𝑘𝑐′; [5]
This simplifies the marginal product of capital condition, where uc is the user cost of capital.
4
𝜕𝑓
𝜕𝑘= 𝑚. (𝛿 + 𝑟 + 𝑡𝑘𝑐. 𝑟) = 𝑚. 𝑢𝑐 [6]
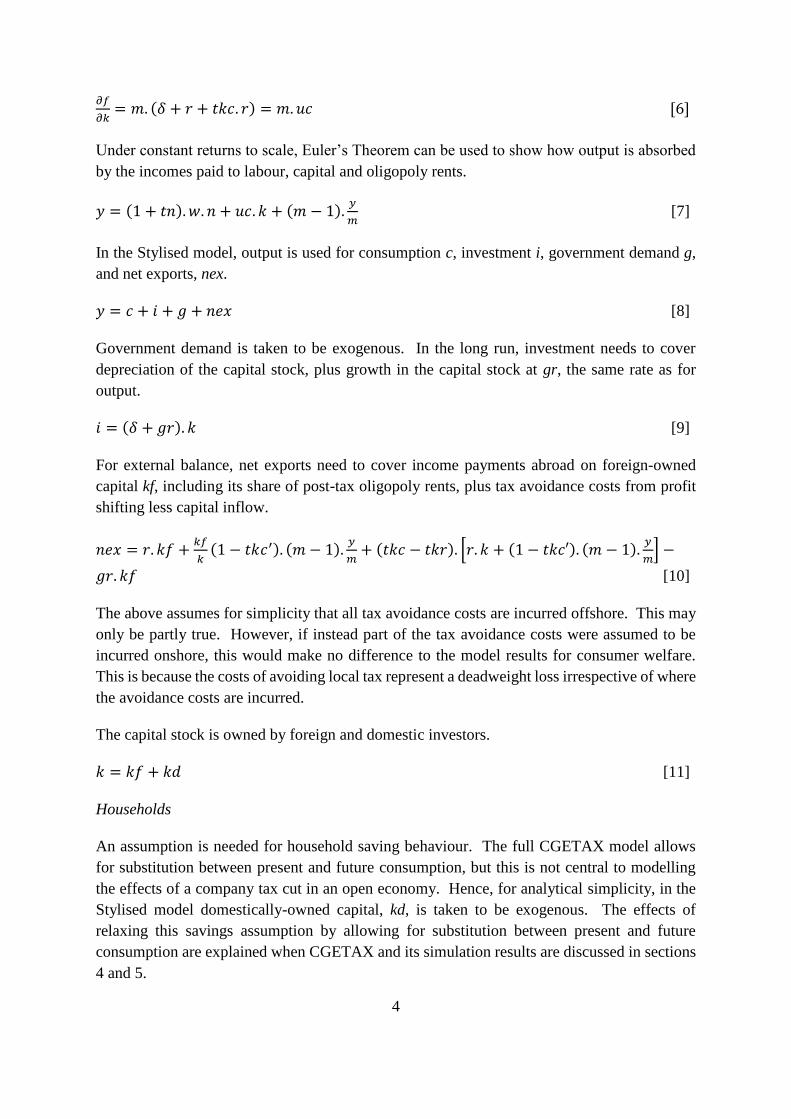
Under constant returns to scale, Euler’s Theorem can be used to show how output is absorbed
by the incomes paid to labour, capital and oligopoly rents.
𝑦 = (1 + 𝑡𝑛). 𝑤. 𝑛 + 𝑢𝑐. 𝑘 + (𝑚 − 1).𝑦
𝑚 [7]
In the Stylised model, output is used for consumption c, investment i, government demand g,
and net exports, nex.
𝑦 = 𝑐 + 𝑖 + 𝑔 + 𝑛𝑒𝑥 [8]
Government demand is taken to be exogenous. In the long run, investment needs to cover
depreciation of the capital stock, plus growth in the capital stock at gr, the same rate as for
output.
𝑖 = (𝛿 + 𝑔𝑟). 𝑘 [9]
For external balance, net exports need to cover income payments abroad on foreign-owned
capital kf, including its share of post-tax oligopoly rents, plus tax avoidance costs from profit
shifting less capital inflow.
𝑛𝑒𝑥 = 𝑟. 𝑘𝑓 +𝑘𝑓
𝑘(1 − 𝑡𝑘𝑐′). (𝑚 − 1).
𝑦
𝑚+ (𝑡𝑘𝑐 − 𝑡𝑘𝑟). [𝑟. 𝑘 + (1 − 𝑡𝑘𝑐′). (𝑚 − 1).
𝑦
𝑚] −
𝑔𝑟. 𝑘𝑓 [10]
The above assumes for simplicity that all tax avoidance costs are incurred offshore. This may
only be partly true. However, if instead part of the tax avoidance costs were assumed to be
incurred onshore, this would make no difference to the model results for consumer welfare.
This is because the costs of avoiding local tax represent a deadweight loss irrespective of where
the avoidance costs are incurred.
The capital stock is owned by foreign and domestic investors.
𝑘 = 𝑘𝑓 + 𝑘𝑑 [11]
Households
An assumption is needed for household saving behaviour. The full CGETAX model allows
for substitution between present and future consumption, but this is not central to modelling
the effects of a company tax cut in an open economy. Hence, for analytical simplicity, in the
Stylised model domestically-owned capital, kd, is taken to be exogenous. The effects of
relaxing this savings assumption by allowing for substitution between present and future
consumption are explained when CGETAX and its simulation results are discussed in sections
4 and 5.
5
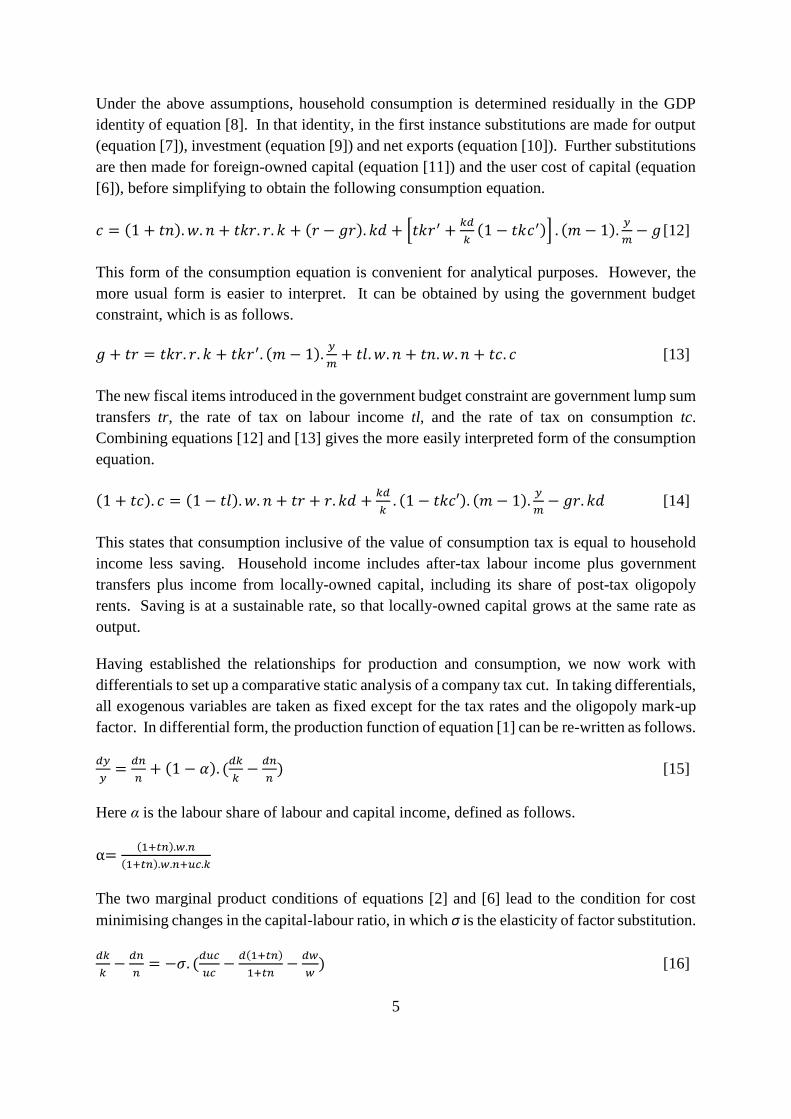
Under the above assumptions, household consumption is determined residually in the GDP
identity of equation [8]. In that identity, in the first instance substitutions are made for output
(equation [7]), investment (equation [9]) and net exports (equation [10]). Further substitutions
are then made for foreign-owned capital (equation [11]) and the user cost of capital (equation
[6]), before simplifying to obtain the following consumption equation.
𝑐 = (1 + 𝑡𝑛). 𝑤. 𝑛 + 𝑡𝑘𝑟. 𝑟. 𝑘 + (𝑟 − 𝑔𝑟). 𝑘𝑑 + [𝑡𝑘𝑟′ +𝑘𝑑
𝑘(1 − 𝑡𝑘𝑐′)] . (𝑚 − 1).
𝑦
𝑚− 𝑔 [12]
This form of the consumption equation is convenient for analytical purposes. However, the
more usual form is easier to interpret. It can be obtained by using the government budget
constraint, which is as follows.
𝑔 + 𝑡𝑟 = 𝑡𝑘𝑟. 𝑟. 𝑘 + 𝑡𝑘𝑟′. (𝑚 − 1).𝑦
𝑚+ 𝑡𝑙. 𝑤. 𝑛 + 𝑡𝑛. 𝑤. 𝑛 + 𝑡𝑐. 𝑐 [13]
The new fiscal items introduced in the government budget constraint are government lump sum
transfers tr, the rate of tax on labour income tl, and the rate of tax on consumption tc.
Combining equations [12] and [13] gives the more easily interpreted form of the consumption
equation.
(1 + 𝑡𝑐). 𝑐 = (1 − 𝑡𝑙). 𝑤. 𝑛 + 𝑡𝑟 + 𝑟. 𝑘𝑑 +𝑘𝑑
𝑘. (1 − 𝑡𝑘𝑐′). (𝑚 − 1).
𝑦
𝑚− 𝑔𝑟. 𝑘𝑑 [14]
This states that consumption inclusive of the value of consumption tax is equal to household
income less saving. Household income includes after-tax labour income plus government
transfers plus income from locally-owned capital, including its share of post-tax oligopoly
rents. Saving is at a sustainable rate, so that locally-owned capital grows at the same rate as
output.
Having established the relationships for production and consumption, we now work with
differentials to set up a comparative static analysis of a company tax cut. In taking differentials,
all exogenous variables are taken as fixed except for the tax rates and the oligopoly mark-up
factor. In differential form, the production function of equation [1] can be re-written as follows.
𝑑𝑦
𝑦=
𝑑𝑛
𝑛+ (1 − 𝛼). (
𝑑𝑘
𝑘−
𝑑𝑛
𝑛) [15]
Here α is the labour share of labour and capital income, defined as follows.
α=(1+𝑡𝑛).𝑤.𝑛
(1+𝑡𝑛).𝑤.𝑛+𝑢𝑐.𝑘
The two marginal product conditions of equations [2] and [6] lead to the condition for cost
minimising changes in the capital-labour ratio, in which σ is the elasticity of factor substitution.
𝑑𝑘
𝑘−
𝑑𝑛
𝑛= −𝜎. (
𝑑𝑢𝑐
𝑢𝑐−
𝑑(1+𝑡𝑛)
1+𝑡𝑛−
𝑑𝑤
𝑤) [16]
6
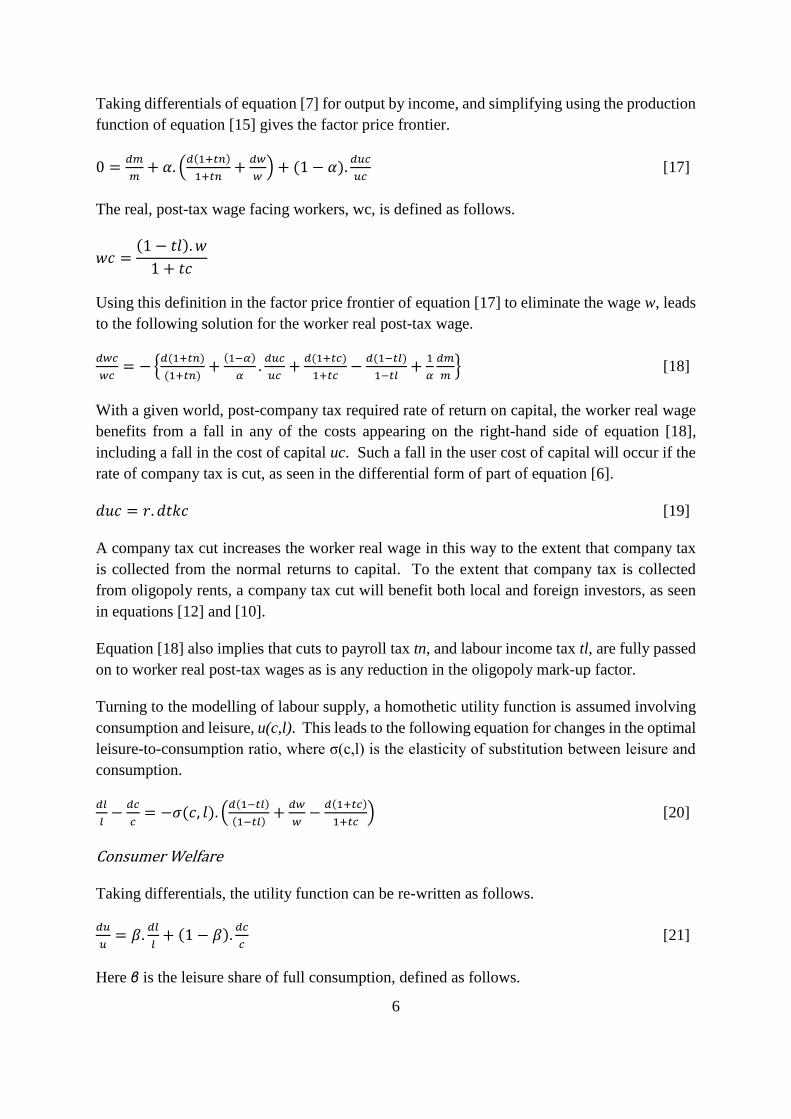
Taking differentials of equation [7] for output by income, and simplifying using the production
function of equation [15] gives the factor price frontier.
0 =𝑑𝑚
𝑚+ 𝛼. (
𝑑(1+𝑡𝑛)
1+𝑡𝑛+
𝑑𝑤
𝑤) + (1 − 𝛼).
𝑑𝑢𝑐
𝑢𝑐 [17]
The real, post-tax wage facing workers, wc, is defined as follows.
𝑤𝑐 =(1 − 𝑡𝑙). 𝑤
1 + 𝑡𝑐
Using this definition in the factor price frontier of equation [17] to eliminate the wage w, leads
to the following solution for the worker real post-tax wage.
𝑑𝑤𝑐
𝑤𝑐= − {
𝑑(1+𝑡𝑛)
(1+𝑡𝑛)+
(1−𝛼)
𝛼.
𝑑𝑢𝑐
𝑢𝑐+
𝑑(1+𝑡𝑐)
1+𝑡𝑐−
𝑑(1−𝑡𝑙)
1−𝑡𝑙+
1
𝛼
𝑑𝑚
𝑚} [18]
With a given world, post-company tax required rate of return on capital, the worker real wage
benefits from a fall in any of the costs appearing on the right-hand side of equation [18],
including a fall in the cost of capital uc. Such a fall in the user cost of capital will occur if the
rate of company tax is cut, as seen in the differential form of part of equation [6].
𝑑𝑢𝑐 = 𝑟. 𝑑𝑡𝑘𝑐 [19]
A company tax cut increases the worker real wage in this way to the extent that company tax
is collected from the normal returns to capital. To the extent that company tax is collected
from oligopoly rents, a company tax cut will benefit both local and foreign investors, as seen
in equations [12] and [10].
Equation [18] also implies that cuts to payroll tax tn, and labour income tax tl, are fully passed
on to worker real post-tax wages as is any reduction in the oligopoly mark-up factor.
Turning to the modelling of labour supply, a homothetic utility function is assumed involving
consumption and leisure, u(c,l). This leads to the following equation for changes in the optimal
leisure-to-consumption ratio, where σ(c,l) is the elasticity of substitution between leisure and
consumption.
𝑑𝑙
𝑙−
𝑑𝑐
𝑐= −𝜎(𝑐, 𝑙). (
𝑑(1−𝑡𝑙)
(1−𝑡𝑙)+
𝑑𝑤
𝑤−
𝑑(1+𝑡𝑐)
1+𝑡𝑐) [20]
Consumer Welfare
Taking differentials, the utility function can be re-written as follows.
𝑑𝑢
𝑢= 𝛽.
𝑑𝑙
𝑙+ (1 − 𝛽).
𝑑𝑐
𝑐 [21]
Here β is the leisure share of full consumption, defined as follows.

7
𝛽 =(1 − 𝑡𝑙). 𝑤. 𝑙
(1 − 𝑡𝑙). 𝑤. 𝑙 + (1 + 𝑡𝑐). 𝑐
With a fixed endowment of time, changes in leisure time are exactly offset by changes in
employment.
𝑑𝑛 = −𝑑𝑙 [22]
The Stylised model is now complete. It can be condensed down to a pair of equations involving
changes in employment and consumption.
The first equation in this pair is obtained by differentiating the consumption equation [12],
eliminating the changes in output, capital and wages using production-related equations [15]-
[17], and simplifying.
𝑑𝑐 = −𝑑𝑔 + [(1 + 𝑡𝑛). 𝑤. 𝑛 + 𝐶𝐼𝑇].𝑑𝑛
𝑛− [
𝜎
𝛼. 𝐶𝐼𝑇 − 𝜎. 𝜃. (𝑚 − 1).
𝑦
𝑚] . (
𝑑𝑢𝑐
𝑢𝑐+
𝑑𝑚
𝑚)
−(1 − 𝜃).𝑦
𝑚.𝑑𝑚
𝑚− 𝑟. 𝑘. (𝑑𝑡𝑘𝑐 − 𝑑𝑡𝑘𝑟) −
𝑘𝑑
𝑘. (𝑚 − 1).
𝑦
𝑚. (𝑑𝑡𝑘𝑐′ − 𝑑𝑡𝑘𝑟′) +
𝑘𝑓
𝑘. (𝑚 − 1).
𝑦
𝑚. 𝑑𝑡𝑘𝑟′ [23]
Here CIT is company tax revenue and θ is the proportion of oligopoly rent that is retained
nationally rather than leaked abroad.
𝐶𝐼𝑇 = 𝑡𝑘𝑟. 𝑟. 𝑘 + 𝑡𝑘𝑟′. (𝑚 − 1).𝑦
𝑚
𝜃 = 𝑡𝑘𝑟′ +𝑘𝑑
𝑘. (1 − 𝑡𝑘𝑐′)
The second equation in the pair is obtained by starting with equation [20] for the change in the
leisure to consumption ratio, eliminating wages using equation [17], eliminating leisure using
equation [22] and using the relationship for the worker real post-tax wage given by equation
[18].
𝑑𝑛
𝑛= −
𝑙
𝑛.
𝑑𝑐
𝑐+ 𝜎(𝑐, 𝑙).
𝑙
𝑛.
𝑑𝑤𝑐
𝑤𝑐 [24]
Equations [23] and [24] can be solved for consumption and employment. Equation [22] can
then be used to solve for leisure. Finally, the solutions for consumption and leisure can be used
in equation [21] to solve for consumer welfare.
𝑑𝑤𝑒𝑙𝑓𝑎𝑟𝑒 = 𝑀.𝑑𝑢
𝑢= −𝑑𝑔
+𝜂. [𝐶𝐼𝑇 + (𝑡𝑙 + 𝑡𝑛). 𝑤. 𝑛 +𝑡𝑐
1 + 𝑡𝑐. (1 − 𝑡𝑙). 𝑤. 𝑛] .
𝑑𝑤𝑐
𝑤𝑐
8
− [𝜎
𝛼. 𝐶𝐼𝑇 − 𝜎. 𝜃. (𝑚 − 1).
𝑦
𝑚] . (
𝑑𝑢𝑐
𝑢𝑐+
𝑑𝑚
𝑚)
−(1 − 𝜃).𝑦
𝑚.𝑑𝑚
𝑚
− [𝑟. 𝑘. (𝑑𝑡𝑘𝑐 − 𝑑𝑡𝑘𝑟) +𝑘𝑑
𝑘. (𝑚 − 1).
𝑦
𝑚. (𝑑𝑡𝑘𝑐′ − 𝑑𝑡𝑘𝑟′)]
+𝑘𝑓
𝑘. (𝑚 − 1).
𝑦
𝑚. 𝑑𝑡𝑘𝑟′ [25]
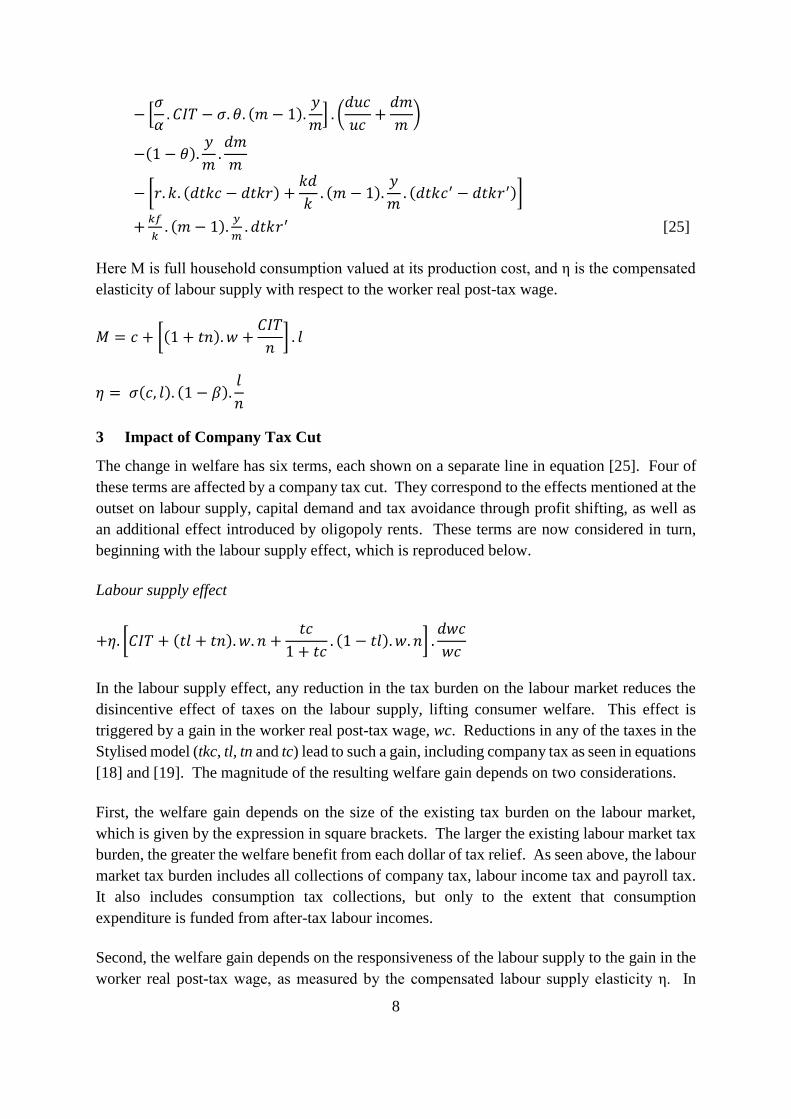
Here M is full household consumption valued at its production cost, and η is the compensated
elasticity of labour supply with respect to the worker real post-tax wage.
𝑀 = 𝑐 + [(1 + 𝑡𝑛). 𝑤 +𝐶𝐼𝑇
𝑛] . 𝑙
𝜂 = 𝜎(𝑐, 𝑙). (1 − 𝛽).𝑙
𝑛
3 Impact of Company Tax Cut
The change in welfare has six terms, each shown on a separate line in equation [25]. Four of
these terms are affected by a company tax cut. They correspond to the effects mentioned at the
outset on labour supply, capital demand and tax avoidance through profit shifting, as well as
an additional effect introduced by oligopoly rents. These terms are now considered in turn,
beginning with the labour supply effect, which is reproduced below.
Labour supply effect
+𝜂. [𝐶𝐼𝑇 + (𝑡𝑙 + 𝑡𝑛). 𝑤. 𝑛 +𝑡𝑐
1 + 𝑡𝑐. (1 − 𝑡𝑙). 𝑤. 𝑛] .
𝑑𝑤𝑐
𝑤𝑐
In the labour supply effect, any reduction in the tax burden on the labour market reduces the
disincentive effect of taxes on the labour supply, lifting consumer welfare. This effect is
triggered by a gain in the worker real post-tax wage, wc. Reductions in any of the taxes in the
Stylised model (tkc, tl, tn and tc) lead to such a gain, including company tax as seen in equations
[18] and [19]. The magnitude of the resulting welfare gain depends on two considerations.
First, the welfare gain depends on the size of the existing tax burden on the labour market,
which is given by the expression in square brackets. The larger the existing labour market tax
burden, the greater the welfare benefit from each dollar of tax relief. As seen above, the labour
market tax burden includes all collections of company tax, labour income tax and payroll tax.
It also includes consumption tax collections, but only to the extent that consumption
expenditure is funded from after-tax labour incomes.
Second, the welfare gain depends on the responsiveness of the labour supply to the gain in the
worker real post-tax wage, as measured by the compensated labour supply elasticity η. In
9
CGETAX, the compensated elasticity is based on the widely-cited study of Gruber and Sayers
(2002) who find an “elasticity of taxable income” of 0.4. This refers to the elasticity of declared
labour income with respect to the marginal retention rate (defined as one minus the marginal
tax rate). This is a broader concept than the labour supply elasticity, but is more appropriate
for tax efficiency analysis. In captures the effects of labour income tax not only on labour
supply, but also on avoidance and evasion. It also focusses specifically on the effects of
changes in tax rates.
The empirical literature is focussed more on the uncompensated, rather than the compensated,
labour supply elasticity. The uncompensated elasticity in CGETAX is 0.14, which is in line
with this literature. For example, Evers, de Mooij and van Vuuren (2008) find a lower value
for men but a higher value for women.
While a reduction in any of the four taxes in the Stylised model delivers a gain in consumer
welfare via the labour supply effect, there are two important distinctions in how each tax affects
welfare.
First, while the incidences of payroll tax and labour income tax fall entirely on labour, the
incidence is spread more widely for consumption tax and company tax, diluting the labour
market-based welfare gain for each dollar of tax relief. Consumption tax falls on labour to the
extent that consumption is funded from post-tax labour incomes rather than the other sources
shown in equation [14]. Company tax falls on labour to the extent that it is collected from
normal profits rather than oligopoly profits; the two components are shown in the government
budget constraint of equation [13]. Thus, there is a larger welfare benefit through the labour
supply effect from providing a dollar of tax relief through payroll tax or labour income tax than
through consumption tax or company income tax (except under perfect competition).
Second, company tax cuts have three other effects on consumer welfare. These capital-labour
ratio, reduced tax avoidance and reduced tax from foreign oligopoly rent effects are now
considered in turn.
10
Capital-labour ratio effect
− [𝜎
𝛼. 𝐶𝐼𝑇 − 𝜎. 𝜃. (𝑚 − 1).
𝑦
𝑚] . (
𝑑𝑢𝑐
𝑢𝑐+
𝑑𝑚
𝑚)
By reducing the user cost of capital uc, a company tax cut induces a higher capital-to-labour
ratio, as implied by equation [16]. In the case of perfect competition (m=1), this affects
consumer welfare through only one of the two channels represented above.
−𝜎
𝛼. 𝐶𝐼𝑇. (
𝑑𝑢𝑐
𝑢𝑐+
𝑑𝑚
𝑚)
The lower burden of tax on capital reduces the tax disincentive effect on the capital-to-labour
ratio. The magnitude of the resulting welfare gain depends on two considerations.
First, the welfare gain depends on the size of company tax collections, CIT. The larger this
existing capital tax burden, the greater the welfare benefit from each dollar of company tax
relief.
Second, the welfare gain depends on the elasticity of the capital-labour ratio with respect to the
cost of capital. This in turn equals the (negative of the) elasticity of substitution between labour
and capital σ, divided by labour’s share of income α. Thus, the elasticity of factor substitution
drives the strength of the response of the capital-to-labour ratio to a company tax cut.
For this elasticity, the Gunning et al. (2008) literature survey reports values in CGE models
ranging from 0.4 to the Cobb-Douglas case of 1.0. Similarly, de Mooij and Devereux (2011)
assume an elasticity of substitution of 0.7 in the CORTAX model of the EU countries.
Consistent with these studies, CGETAX uses values ranging from 0.7 to 0.9, depending on the
type of capital. Specifically, the elasticity of substitution between labour and equipment is set
to 0.9. For structures capital, the substitution with labour is indirect. The elasticity of
substitution between structure services, which include structures, and the labour-equipment
composite is 0.7.
Allowing for imperfect competition (m>1) introduces a second channel through which a higher
capital-to-labour ratio affects consumer welfare.
+𝜎. 𝜃. (𝑚 − 1).𝑦
𝑚. (
𝑑𝑢𝑐
𝑢𝑐+
𝑑𝑚
𝑚)
In the Stylised model, the additional capital demanded in response to the company tax cut is
funded from abroad. This increase in the share of the capital stock that is foreign owned leads
to a commensurate increase in the foreign share of oligopoly rents, including rents received by
marking up labour costs. However, while this income leakage from the second component
11
reduces consumer welfare, for Australian data it is easily dominated by the consumer welfare
gain from the first component.
This brings us to the next source of welfare gain from a company tax cut, reduced tax avoidance
activity from profit shifting.
Reduced tax avoidance from profit shifting
In the reduced tax avoidance effect, any reduction in the tax rate differential between the local
economy and lower-taxed jurisdictions reduces the incentive to shift profits abroad. Hence a
company tax cut lowers tax avoidance and its associated economic cost.
Profit shifting is modelled using the approach of de Mooij and Devereux (2009). This assumes
that MNCs avoid local company tax by shifting profits offshore until the point is reached where
the marginal cost of avoidance reaches the marginal saving in local tax compared to tax haven
tax. Avoidance costs are assumed to depend on the squared proportion of the profits that are
shifted. In practice avoidance costs take a variety of forms including costs from establishing
and maintaining subsidiaries in tax havens, legal and accounting costs and the risks of legal
action and reputational damage.
In allowing for tax avoidance, three different company tax rates need to be distinguished. Re-
capping on the notation introduced earlier, tk’ is the statutory company tax rate (currently 30
per cent), tkr’ is the effective tax rate paid locally and tkc’ is the effective tax rate that drives
investment decisions and captures both local tax and the tax avoidance costs. Under the
approach of de Mooij and Devereux (2009), the two effective tax rates are linked to the
statutory tax rate as follows. In these equations, tkh’ is the tax rate in the tax haven to which
profits are shifted.
𝑡𝑘𝑟′ = 𝑡𝑘′ − 𝐴. (𝑡𝑘′ − 𝑡𝑘ℎ′). 𝑡𝑘′ [26]
𝑡𝑘𝑐′ = 𝑡𝑘′ − 𝐴. (𝑡𝑘′ − 𝑡𝑘ℎ′)2/2 [27]
The value of the parameter A depends on the assumed semi-elasticity of the local tax base with
respect to the statutory tax rate of -k, as follows.
𝐴 = 𝑘 [1 + 𝑘. (𝑡𝑘′ − 𝑡𝑘ℎ′)]⁄ [28]
The value chosen for k is discussed later in this section.
A company tax cut reduces the statutory tax rate tk’. This reduces the incentive to engage in
tax avoidance activity to shift profits, so the gap between the tkc’ and tkr’ shrinks. This is
implied by equation [29], which is derived from equations [26] and [27].
𝑑𝑡𝑘𝑐′ − 𝑑𝑡𝑘𝑟′ = 𝐴. 𝑡𝑘′. 𝑑𝑡𝑘′ [29]
12
This reduction in wasteful tax avoidance activity from reducing the company tax rate provides
the third contribution to the gain in consumer welfare, which is reproduced below.
− [𝑟. 𝑘. (𝑑𝑡𝑘𝑐 − 𝑑𝑡𝑘𝑟) +𝑘𝑑
𝑘. (𝑚 − 1).
𝑦
𝑚. (𝑑𝑡𝑘𝑐′ − 𝑑𝑡𝑘𝑟′)]
The two components capture the reduction in wasteful tax avoidance expenditure with respect
to company tax payable on capital income and oligopoly rent respectively. For oligopoly rent,
only the locally-received share appears, because the incidence of tax avoidance costs with
respect to taxation of foreign-owned oligopoly rents falls on foreigners.
As noted above, the strength of this reduced tax avoidance effect depends on the assumed semi-
elasticity of the company tax base with respect to the company tax rate -k. The value used here
of -0.73 is adopted from de Mooij and Devereux (2011). An elasticity of around this magnitude
is also confirmed by other recent studies. Both Heckemeyer and Overesch (2013) and
Dharmapala (2014) estimate a semi-elasticity of -0.8 from the available evidence.
These elasticities are based on pooled evidence for a range of countries. Hence the implicit
assumption is that the severity of the profit shifting problem locally is similar to the
international norm.
In the case of Australia, its franking system may discourage profit shifting for Australian-based
MNCs as it would weaken their ability to distribute franking credits to their shareholders
(AFTSR, 2009). On the other hand, Dharmapala (2014) finds that profit shifting is more
pronounced for inbound investment than outbound investment, and Australia has more inbound
investment. Australia, like other countries, aims to limit profit shifting, including through
transfer pricing and thin capitalisation rules. Overall, it seems reasonable to assume that the
profit shifting problem in Australia is similar to the international norm.
This brings us to the final effect on consumer welfare from a company tax cut, reduced tax
revenue from taxation of foreign-owned oligopoly rents.
Reduced tax from foreign-owned oligopoly rents
+𝑘𝑓
𝑘. (𝑚 − 1).
𝑦
𝑚. 𝑑𝑡𝑘𝑟′
In the final effect, the company tax cut reduces tax collected from foreign-owned oligopoly
rents. This reduces national income, leading to a reduction in consumer welfare. This offsets
part of the gain in consumer welfare from the first three effects. Of course, this effect is absent
under perfect competition.
13
4 Other Features of CGETAX
The CGETAX model of Australia incorporates all of the structure of the Stylised model. In
addition, CGETAX also allows for other aspects of the business tax system, as discussed below.
Further, it is designed to analyse the economic impacts of all 19 major taxes, not just company
income tax. To that end, its dimensions include 278 industries, nine types of produced capital,
eight types of labour, as well as land and minerals as fixed factors. Perfect competition is
assumed in many industries, but a mark-up pricing oligopoly is assumed in certain sectors with
unexplained, persistently high returns on capital.
On its empirical side, CGETAX is calibrated to the latest Australian Bureau of Statistics (ABS)
input-output tables, which refer to 2012-13. A baseline scenario is then generated for a
normalised version of the Australian economy in 2015-16, taking into account broad economic
developments in the intervening years and recent government budget data. There is a single
general government sector that consolidates federal, state and local levels of government.
This section provides a brief summary of the main features of CGETAX and the history of their
development. It emphasises aspects that influence the model results for the proposed company
tax cut. See Murphy (2016b) for a fuller explanation of the model.
Seminal paper
CGE models have been used to analyse the economic efficiency of tax systems since the
seminal work for the USA by Ballard, Shoven and Whalley (1985). When an economic activity
is taxed heavily, economic returns are reduced, which can lead to a tax-driven, economically
inefficient shift away from that activity and towards other less-heavily taxed activities. The
extent of such shifts and associated economic losses depends on the substitutability between
activities, as measured by various elasticities. CGE models provide a means of quantifying
these shifts and losses.
Ballard et al. (1985) estimated marginal excess burdens (MEBs) for the major US taxes. The
MEB shows the consumer loss per dollar of improvement in the government budget from a
small tax rise. This loss is measured over and above the amount of the revenue that is raised2.
Thus, the MEB provides a pure measure of the costs to consumers of disincentive effects from
a tax. These disincentive effects may include disincentives to work, save or invest, or to the
patterns in the same areas. More narrowly-based taxes may also distort more specific economic
choices e.g. between different alcoholic beverages.
2 The income effect on consumers from raising revenue from them is neutralised by assuming the revenue is
returned as a lump-sum transfer, leaving only the disincentive effects.

14
Ballard et al. (1985) reached two major conclusions.
“There is growing evidence that MEBs may be in the range of 15 to 50 cents for an economy
like that of the United States.” Such a wide range means that there is a large potential for
consumers benefiting by the US Government relying more on taxes with low MEBs and less
on taxes with high MEBs. In principle, tax efficiency would be optimised by shifting the tax
burden in this way until MEBs are equalised across all taxes.
“We hope that the large estimates we report will contribute to … a discussion of possibly
modifying the cost-benefit criterion for public goods evaluation.” For example, if a
government spending program is to be funded with a tax with a typical MEB of say 25 cents
per dollar, each four dollars of program spending would need to provide consumers with
benefits of at least five dollars for the program to be worthwhile. This is so the program covers
the direct cost to taxpayers of $4, plus the additional cost from disincentive effects of one dollar
(or 25 cents per dollar of additional revenue).
Development of CGETAX
The features of CGETAX have developed as the model has evolved over the period from 2012
to 2016. Independent Economics (IE) constructed its original IE CGE model in 2012. The
modelling of company tax was developed in collaboration with the Australian Treasury.
The original IE CGE model incorporated the broad thrust of the Stylised model. The four broad
effects on a company tax cut on labour supply, the capital-labour ratio, profit shifting and the
taxation of foreign-owned economic rents were all represented. However, the original
modelling of profit shifting and economic rents was refined later, as discussed later in this
section.
The original IE CGE model also incorporated additional features of the Australian company
tax not taken into account in the Stylised model. These features include: franking credits;
interest deductibility; investments allowances; depreciation at historic cost; and the limited
availability of foreign investor tax credits for Australian company tax. See the “Original IE
CGE model” column of Table 4.1 for further information on the Original IE CGE model. It
was used to model a company tax cut for the Business Tax Working Group (Australian
Government, 2012).
Of these additional features, one has a notable impact on the gain in Australian consumer
welfare when a company income tax is simulated in the CGE model. In a narrow range of
circumstances, a foreign investor may be able to claim a tax credit in their home country for
company tax paid in Australia. The main example of this is when US-based MNCs remit
profits from their Australian-based operations back to the US. In these narrow circumstances,
which receive a weight of 5 to 10 per cent in various editions of the CGE model, a reduced tax
credit nullifies the effects of the Australian company tax cut for the foreign investor.
15
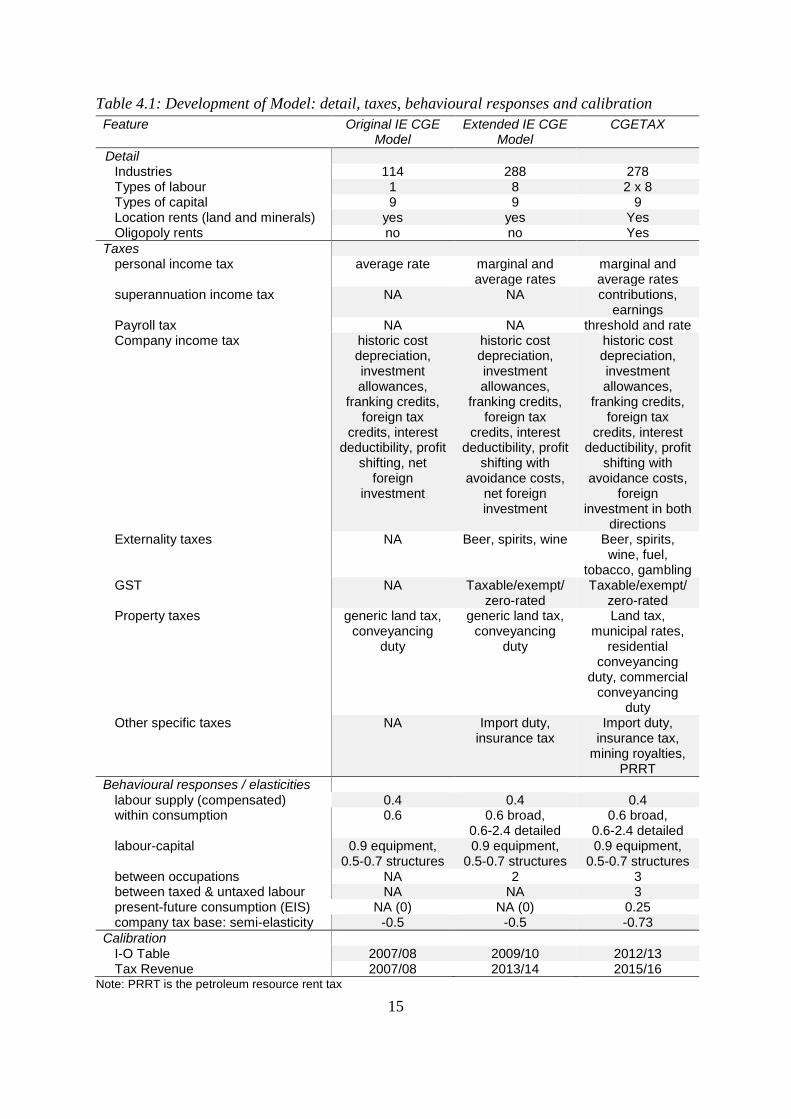
Table 4.1: Development of Model: detail, taxes, behavioural responses and calibration
Feature Original IE CGE Model
Extended IE CGE Model
CGETAX
Detail Industries 114 288 278 Types of labour 1 8 2 x 8 Types of capital 9 9 9 Location rents (land and minerals) yes yes Yes Oligopoly rents no no Yes
Taxes personal income tax average rate marginal and
average rates marginal and average rates
superannuation income tax NA NA contributions, earnings
Payroll tax NA NA threshold and rate Company income tax historic cost
depreciation, investment allowances,
franking credits, foreign tax
credits, interest deductibility, profit
shifting, net foreign
investment
historic cost depreciation, investment allowances,
franking credits, foreign tax
credits, interest deductibility, profit
shifting with avoidance costs,
net foreign investment
historic cost depreciation, investment allowances,
franking credits, foreign tax
credits, interest deductibility, profit
shifting with avoidance costs,
foreign investment in both
directions Externality taxes NA Beer, spirits, wine Beer, spirits,
wine, fuel, tobacco, gambling
GST NA Taxable/exempt/ zero-rated
Taxable/exempt/ zero-rated
Property taxes generic land tax, conveyancing
duty
generic land tax, conveyancing
duty
Land tax, municipal rates,
residential conveyancing
duty, commercial conveyancing
duty Other specific taxes NA Import duty,
insurance tax Import duty,
insurance tax, mining royalties,
PRRT
Behavioural responses / elasticities labour supply (compensated) 0.4 0.4 0.4 within consumption 0.6 0.6 broad,
0.6-2.4 detailed 0.6 broad,
0.6-2.4 detailed labour-capital 0.9 equipment,
0.5-0.7 structures 0.9 equipment,
0.5-0.7 structures 0.9 equipment,
0.5-0.7 structures between occupations NA 2 3 between taxed & untaxed labour NA NA 3 present-future consumption (EIS) NA (0) NA (0) 0.25 company tax base: semi-elasticity -0.5 -0.5 -0.73
Calibration I-O Table 2007/08 2009/10 2012/13 Tax Revenue 2007/08 2013/14 2015/16
Note: PRRT is the petroleum resource rent tax
16
The Australian Treasury has continued to develop and use the original IE CGE model under
licence, resulting in several publications. These include papers on company tax (Rimmer et
al., 2014), the efficiency of selected taxes (Cao et al., 2015) and the Budget proposal to cut the
company tax rate from 30 to 25 per cent (Kouparitsas et al., 2016).
In 2014 and 2015 IE extended its CGE model. The main developments can be seen in Table
4.1 by comparing the “extended IE CGE model” column with the “original IE CGE model”
column. This involved developing the detail and behavioural responses in the model so that it
could capture the economic impacts of a wider range of taxes. The original model captured
the economic impacts of company tax, stamp duty on conveyances and, to a limited degree,
personal income tax as it applies to labour income. The extended model widened this scope to
cover the behavioural impacts of many major taxes. An important element of this was
increasing the industry detail from 114 industries to around 280 industries (using ABS product
details tables) so that narrowly-based taxes could be adequately modelled.
For company income tax, the main development in moving from the original to the extended
model was in refining the modelling of profit shifting. The original model allowed for the
impacts of profit shifting on government revenue (equations [13] and [26]) and the cost of
capital (equations [3] and [27]). The extended model added the impact of profit shifting on tax
avoidance costs (equation [10]). Hence the extended model takes into account the saving in
tax avoidance costs when the company tax rate is cut, adding to its estimate of the gain in
consumer welfare. This brings the CGE model into line with the treatment of profit shifting in
the Stylised model.
In November 2015 the Australian Treasury commissioned IE to undertake modelling to support
the tax review process. This triggered a further round of model development work to obtain
the latest version of the model. Given the focus of this model on tax, and the increased use of
it in academic research as distinct from consulting work, the latest model is now known simply
as CGETAX.
The CGETAX development work of most significance for modelling the proposed company
tax cut are improvements in the modelling of household saving, the introduction of oligopoly
power, and a re-assessment of the strength of the profit shifting effect. These three modelling
refinements are now discussed in turn.
Previously, the real stock of domestic savings was assumed to be fixed, the same assumption
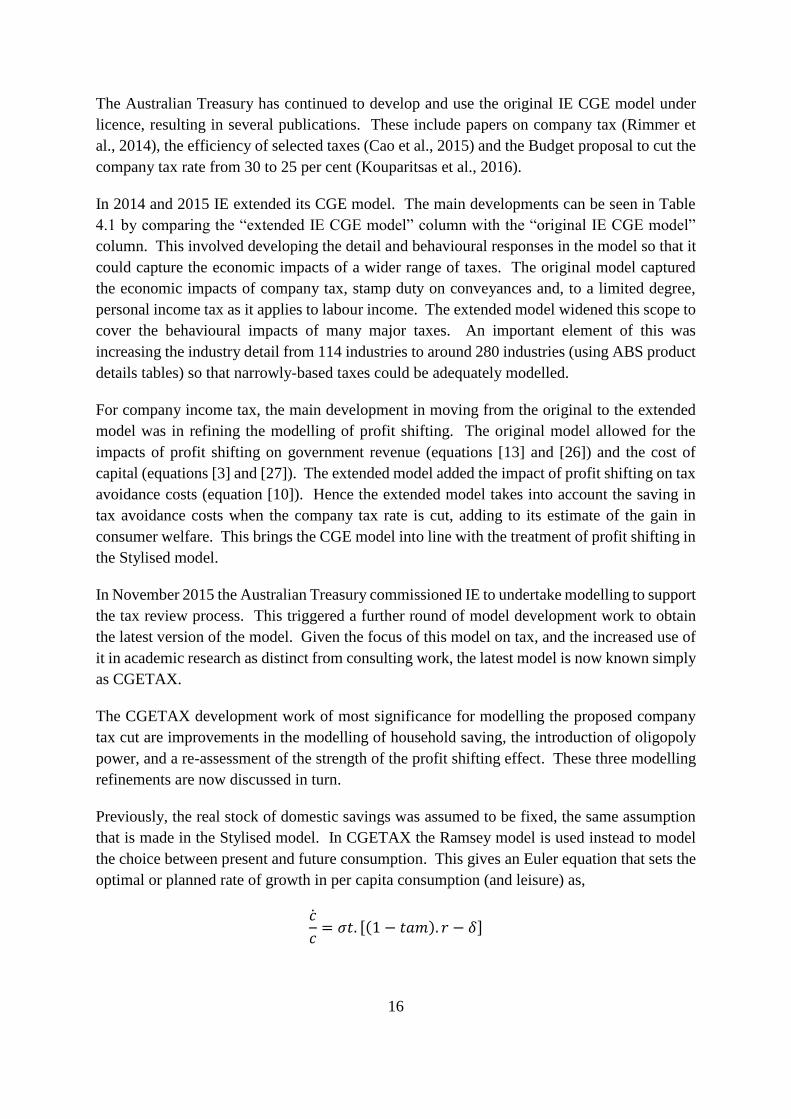
that is made in the Stylised model. In CGETAX the Ramsey model is used instead to model
the choice between present and future consumption. This gives an Euler equation that sets the
optimal or planned rate of growth in per capita consumption (and leisure) as,
𝑐
𝑐
= 𝜎𝑡. [(1 − 𝑡𝑎𝑚). 𝑟 − 𝛿]
17
where σt is the elasticity of intertemporal substitution (EIS), r is the real rate of return on assets
and tam is the marginal tax rate for asset income. Households forego current consumption in
return for future consumption if the post-tax rate of return to assets, (1-tam).r, exceeds their
rate of discount of the future, δ. For the purpose of welfare analysis in a static model like
CGETAX, lifetime utility is calculated from the intertemporal utility function and the
associated present value of taxes on asset incomes is derived analytically. That makes it
unnecessary to make the model dynamic to undertake welfare analysis under this saving
assumption.
To apply this approach, an estimate is needed for the EIS. Gunning, Diamond and Zodrow
(2008) point out that the EIS values used in CGE models typically range from 0.25 to 0.50.
Australia’s system of compulsory superannuation is likely to make voluntary saving less
important, and so CGETAX uses the value for the EIS at the bottom of this range i.e. the EIS
is set to 0.25. The earlier models that instead took the stock of real domestic savings to be
fixed implicitly assumed an EIS of zero.
This modelling of saving behaviour has a direct rather than an indirect effect on consumer
welfare in simulations of a company tax cut. Under the assumption of perfect capital mobility,
a company tax cut lowers the cost of capital, with foreign investors accepting an unchanged
post-company tax rate of return. This lowering of the cost of capital stimulates the labour
supply and capital-labour ratio responses and the associated gain in consumer welfare. Thus,
local saving behaviour does not have a direct impact.
Australia’s system of franking credits introduces an indirect impact. The company tax cut
reduces the franking credits distributed to Australian shareholders, which increases the
effective rate of tax on saving tam. This higher tax disincentive to save has a negative impact
on consumer welfare.
Turning to the second company tax-related refinement in CGETAX, the model was enhanced
to recognise oligopoly power. Economic rents (or above normal returns) not explained by
mineral resources or land were previously assumed to be derived from unidentified, location-
specific fixed factors of production. In CGETAX they are more realistically assumed to be
derived from oligopoly power. In particular, mark-up pricing oligopoly is assumed in finance,
telecommunications and beverages.
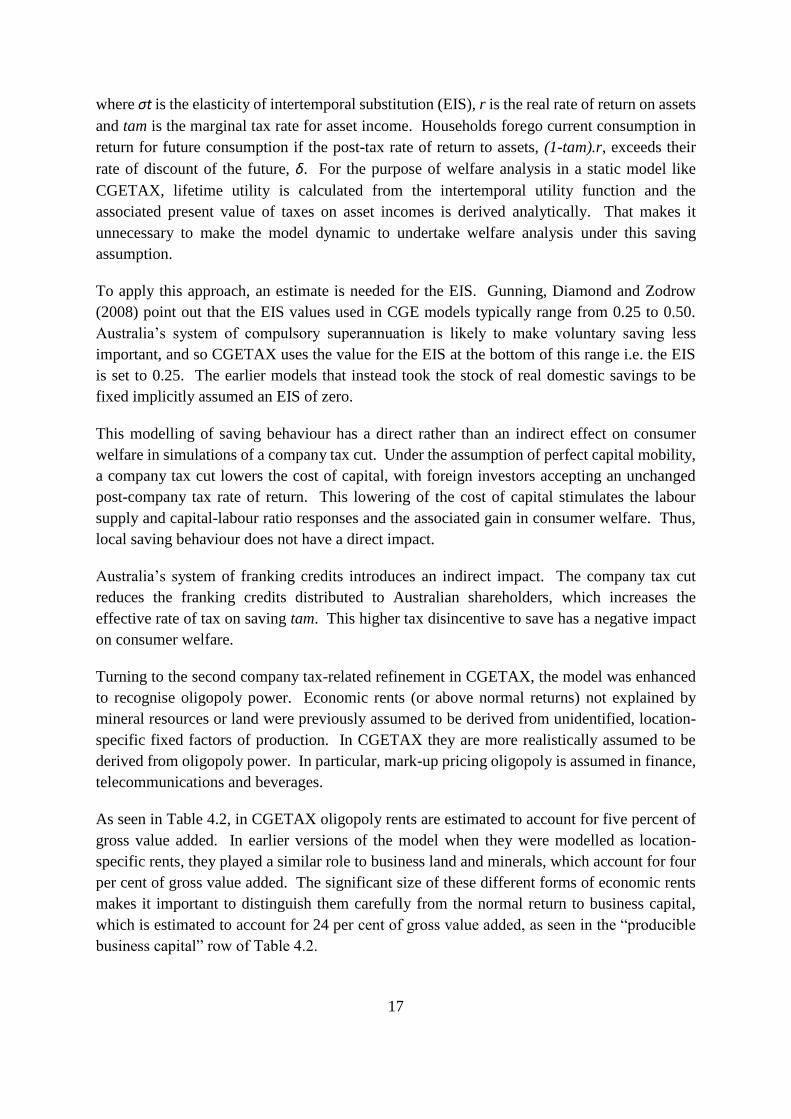
As seen in Table 4.2, in CGETAX oligopoly rents are estimated to account for five percent of
gross value added. In earlier versions of the model when they were modelled as location-
specific rents, they played a similar role to business land and minerals, which account for four
per cent of gross value added. The significant size of these different forms of economic rents
makes it important to distinguish them carefully from the normal return to business capital,
which is estimated to account for 24 per cent of gross value added, as seen in the “producible
business capital” row of Table 4.2.
18
This recognition of oligopoly rents, alongside the earlier model refinement to capture tax
avoidance costs, means that CGETAX incorporates all of the features of the Stylised model.
The implications of recognising oligopoly rents for modelling the effects of a company tax are
shown in section 6.
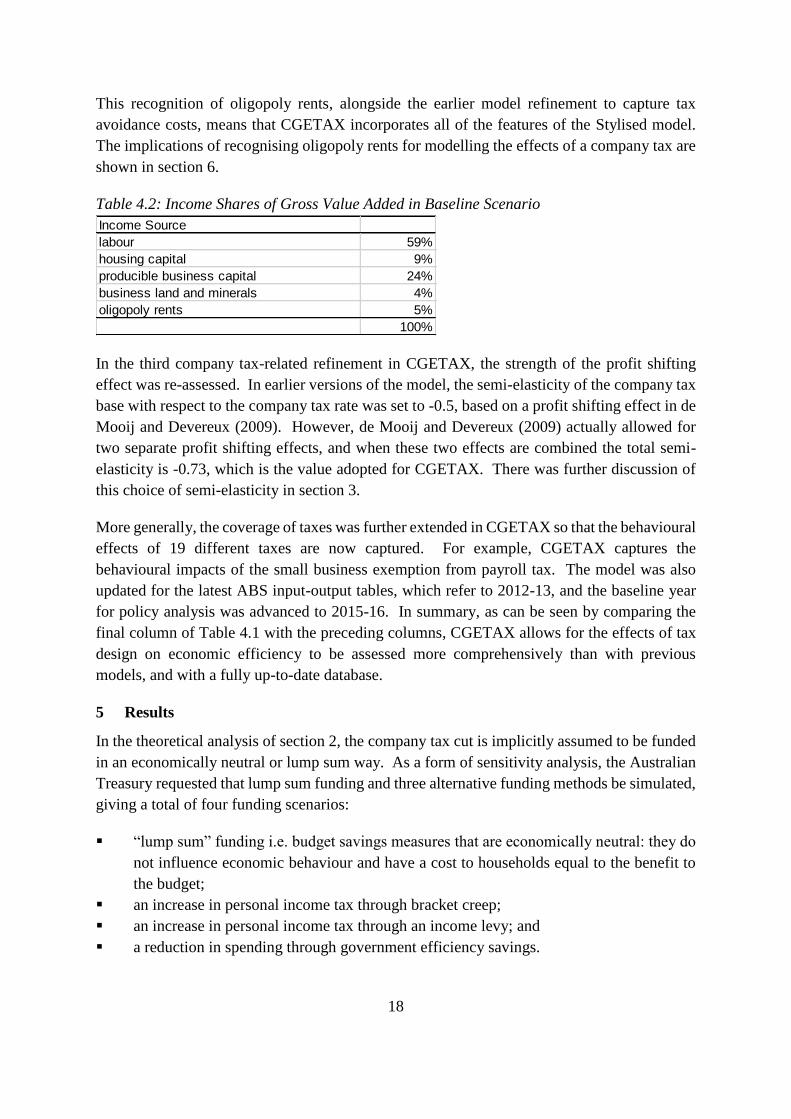
Table 4.2: Income Shares of Gross Value Added in Baseline Scenario
Income Source
labour 59%
housing capital 9%
producible business capital 24%
business land and minerals 4%
oligopoly rents 5%
100%
In the third company tax-related refinement in CGETAX, the strength of the profit shifting
effect was re-assessed. In earlier versions of the model, the semi-elasticity of the company tax
base with respect to the company tax rate was set to -0.5, based on a profit shifting effect in de
Mooij and Devereux (2009). However, de Mooij and Devereux (2009) actually allowed for
two separate profit shifting effects, and when these two effects are combined the total semi-
elasticity is -0.73, which is the value adopted for CGETAX. There was further discussion of
this choice of semi-elasticity in section 3.
More generally, the coverage of taxes was further extended in CGETAX so that the behavioural
effects of 19 different taxes are now captured. For example, CGETAX captures the
behavioural impacts of the small business exemption from payroll tax. The model was also
updated for the latest ABS input-output tables, which refer to 2012-13, and the baseline year
for policy analysis was advanced to 2015-16. In summary, as can be seen by comparing the
final column of Table 4.1 with the preceding columns, CGETAX allows for the effects of tax
design on economic efficiency to be assessed more comprehensively than with previous
models, and with a fully up-to-date database.
5 Results
In the theoretical analysis of section 2, the company tax cut is implicitly assumed to be funded
in an economically neutral or lump sum way. As a form of sensitivity analysis, the Australian
Treasury requested that lump sum funding and three alternative funding methods be simulated,
giving a total of four funding scenarios:
“lump sum” funding i.e. budget savings measures that are economically neutral: they do
not influence economic behaviour and have a cost to households equal to the benefit to
the budget;
an increase in personal income tax through bracket creep;
an increase in personal income tax through an income levy; and
a reduction in spending through government efficiency savings.
19
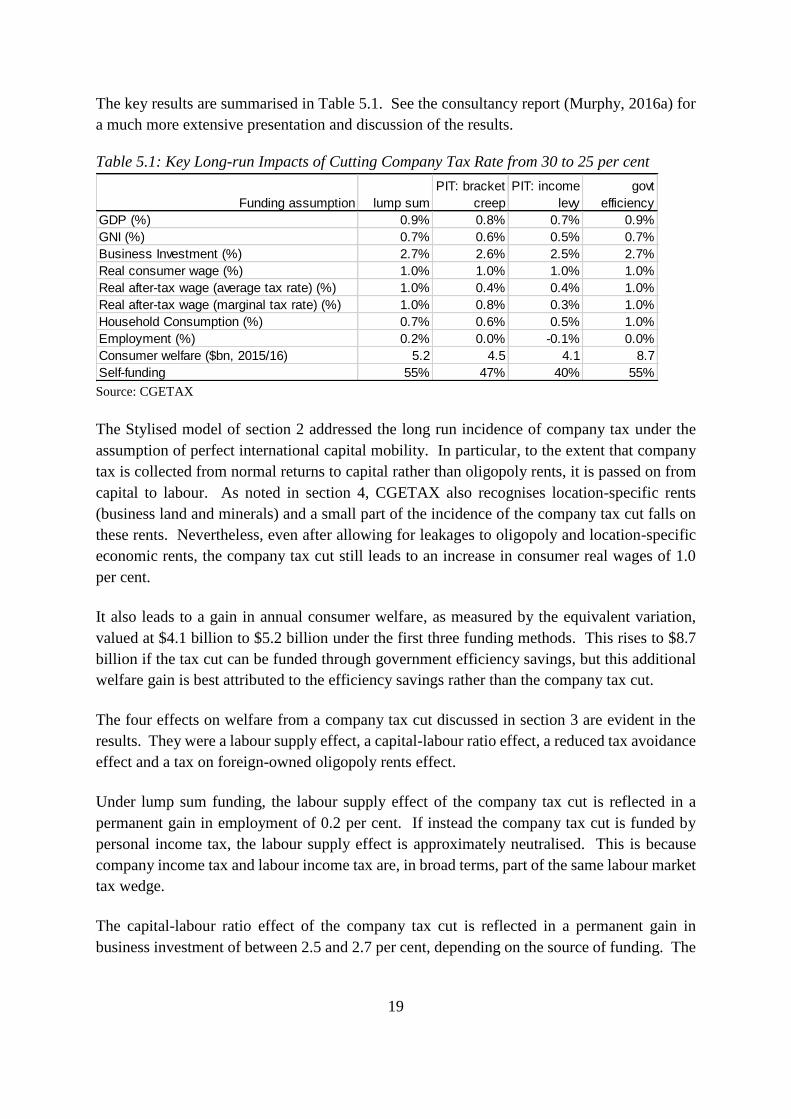
The key results are summarised in Table 5.1. See the consultancy report (Murphy, 2016a) for
a much more extensive presentation and discussion of the results.
Table 5.1: Key Long-run Impacts of Cutting Company Tax Rate from 30 to 25 per cent
Funding assumption lump sum
PIT: bracket
creep
PIT: income
levy
govt
efficiency
GDP (%) 0.9% 0.8% 0.7% 0.9%
GNI (%) 0.7% 0.6% 0.5% 0.7%
Business Investment (%) 2.7% 2.6% 2.5% 2.7%
Real consumer wage (%) 1.0% 1.0% 1.0% 1.0%
Real after-tax wage (average tax rate) (%) 1.0% 0.4% 0.4% 1.0%
Real after-tax wage (marginal tax rate) (%) 1.0% 0.8% 0.3% 1.0%
Household Consumption (%) 0.7% 0.6% 0.5% 1.0%
Employment (%) 0.2% 0.0% -0.1% 0.0%
Consumer welfare ($bn, 2015/16) 5.2 4.5 4.1 8.7
Self-funding 55% 47% 40% 55% Source: CGETAX
The Stylised model of section 2 addressed the long run incidence of company tax under the
assumption of perfect international capital mobility. In particular, to the extent that company
tax is collected from normal returns to capital rather than oligopoly rents, it is passed on from
capital to labour. As noted in section 4, CGETAX also recognises location-specific rents
(business land and minerals) and a small part of the incidence of the company tax cut falls on
these rents. Nevertheless, even after allowing for leakages to oligopoly and location-specific
economic rents, the company tax cut still leads to an increase in consumer real wages of 1.0
per cent.
It also leads to a gain in annual consumer welfare, as measured by the equivalent variation,
valued at $4.1 billion to $5.2 billion under the first three funding methods. This rises to $8.7
billion if the tax cut can be funded through government efficiency savings, but this additional
welfare gain is best attributed to the efficiency savings rather than the company tax cut.
The four effects on welfare from a company tax cut discussed in section 3 are evident in the
results. They were a labour supply effect, a capital-labour ratio effect, a reduced tax avoidance
effect and a tax on foreign-owned oligopoly rents effect.
Under lump sum funding, the labour supply effect of the company tax cut is reflected in a
permanent gain in employment of 0.2 per cent. If instead the company tax cut is funded by
personal income tax, the labour supply effect is approximately neutralised. This is because
company income tax and labour income tax are, in broad terms, part of the same labour market
tax wedge.
The capital-labour ratio effect of the company tax cut is reflected in a permanent gain in
business investment of between 2.5 and 2.7 per cent, depending on the source of funding. The
20
associated gain in the capital stock and productivity is the main factor driving a gain in real
GDP of 0.7 to 0.9 per cent.
The gain in real GNI is 0.5 to 0.7 per cent, placing it 0.2 percentage points below the gain in
GDP across all funding scenarios. This indicates that the company tax cut adds to net income
paid abroad. This reflects three partly offsetting effects.
First, the company tax cut stimulates foreign investment in Australia, leading to a higher stock
of foreign liabilities and associated additional servicing costs. This adds to net income paid
abroad.
Second, the lower company tax rate reduces tax collections from foreign-owned oligopoly
rents. This also adds to net income paid abroad.
Third, the lower local company tax cut rate leads to less profit shifting offshore, resulting in
lower offshore tax avoidance costs. This reduces net income paid abroad.
The first two effects dominate the third effect, resulting in the net increase in net income paid
abroad equivalent to 0.2 percentage points of GDP.
The consumer welfare gain is closely associated with the company tax cut being partly self-
funding. Table 5.1 shows that it is 40 to 55 per cent self-funding, depending on the funding
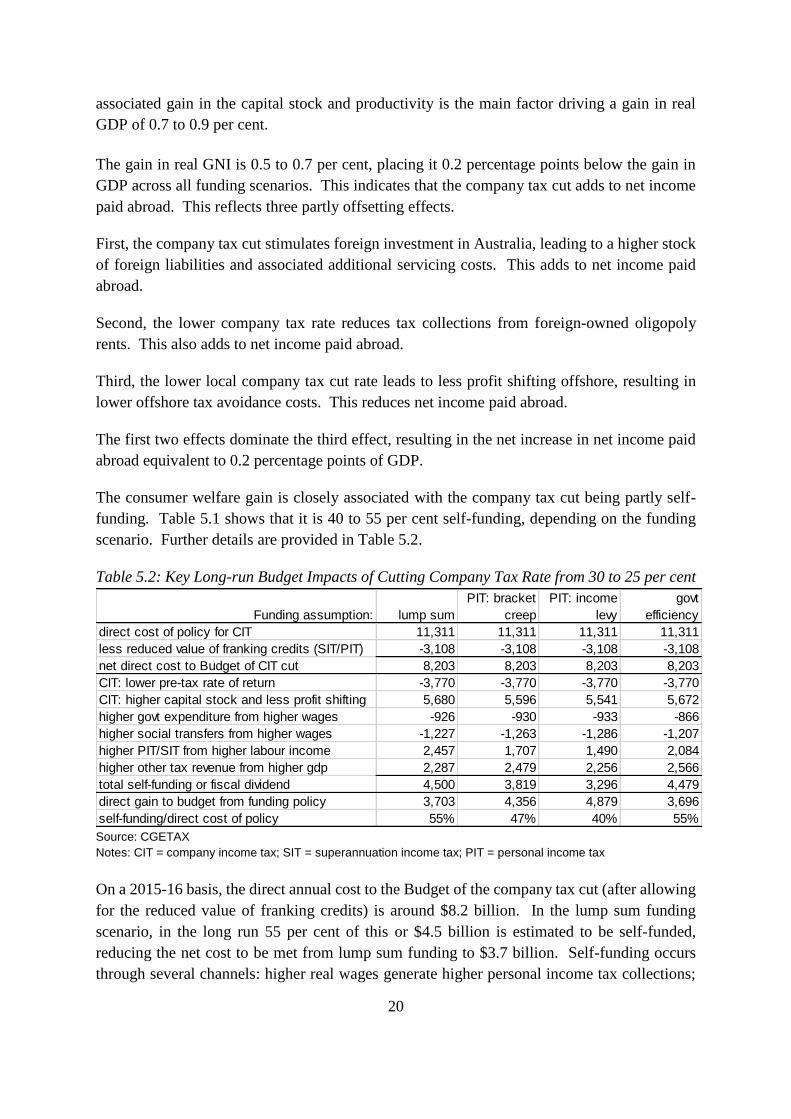
scenario. Further details are provided in Table 5.2.
Table 5.2: Key Long-run Budget Impacts of Cutting Company Tax Rate from 30 to 25 per cent
Funding assumption: lump sum
PIT: bracket
creep
PIT: income
levy
govt
efficiency
direct cost of policy for CIT 11,311 11,311 11,311 11,311
less reduced value of franking credits (SIT/PIT) -3,108 -3,108 -3,108 -3,108
net direct cost to Budget of CIT cut 8,203 8,203 8,203 8,203
CIT: lower pre-tax rate of return -3,770 -3,770 -3,770 -3,770
CIT: higher capital stock and less profit shifting 5,680 5,596 5,541 5,672
higher govt expenditure from higher wages -926 -930 -933 -866
higher social transfers from higher wages -1,227 -1,263 -1,286 -1,207
higher PIT/SIT from higher labour income 2,457 1,707 1,490 2,084
higher other tax revenue from higher gdp 2,287 2,479 2,256 2,566
total self-funding or fiscal dividend 4,500 3,819 3,296 4,479
direct gain to budget from funding policy 3,703 4,356 4,879 3,696
self-funding/direct cost of policy 55% 47% 40% 55%
Source: CGETAX
Notes: CIT = company income tax; SIT = superannuation income tax; PIT = personal income tax
On a 2015-16 basis, the direct annual cost to the Budget of the company tax cut (after allowing
for the reduced value of franking credits) is around $8.2 billion. In the lump sum funding
scenario, in the long run 55 per cent of this or $4.5 billion is estimated to be self-funded,
reducing the net cost to be met from lump sum funding to $3.7 billion. Self-funding occurs
through several channels: higher real wages generate higher personal income tax collections;
21
an enlarged capital stock and less profit shifting lifts company tax collections; and higher
economic activity leads to widespread gains in other tax collections, including of GST and
payroll tax. This self-funding percentage of 55 per cent is in line with other studies. See a
recent study by the UK Treasury (2013) of that country’s company tax cuts and the references
cited therein.
As noted above, the annual gain in consumer welfare from the company tax cut in the lump
sum funding scenario of $5.2 billion is measured using the equivalent variation. This is the
amount that consumers would need to be compensated for not proceeding with the company
tax cut, while still leaving them as well off.
The loss in consumer welfare can also be estimated to a first approximation in a simpler way,
as the self-funding amount or fiscal dividend of $4.5 billion shown in Table 5.2. The company
tax cut involves a direct cost to government budgets of $8.2 billion. This is also an approximate
measure of the ultimate benefit to consumers. However, favourable economic responses result
in indirect gains to the budget of $4.5 billion. This partial self-funding of the company tax cut
means that governments only need a policy to fund the remaining cost of $3.7 billion. If this
is funded in an economically-neutral way, this funding policy will cost consumers the same
amount. This leaves consumers with a net benefit of $4.5 billion, corresponding to the indirect
gain to the budget or fiscal dividend from the company tax cut.
The approximate estimate of the welfare gain provided by the self-funding amount of $4.5
billion is a little below the true welfare gain, as measured by the equivalent variation, of $5.2
billion. In CGETAX, the equivalent variation can differ from the budget-based approximate
estimate of the welfare gain for a range of reasons including externalities, oligopoly power,
taxation of foreign-owned rents and terms-of-trade effects.
In any case, this budget-based interpretation highlights the importance of self-funding effects
in improving the efficiency of the tax system. It allows the benefit to consumers of tax
reductions to outweigh the cost to consumers of the tax increases or spending cuts that fund
those reductions. This requires improving the tax mix by increasing the reliance on taxes with
lower MEBs and reducing the reliance on taxes with higher MEBs.
6 Other Studies
The Australian Treasury (Kouparitsas et al., 2016) undertook parallel modelling of the
company tax cut using Treasury’s version of the original IE CGE model. See Table 4.1 for a
comparison of the original IE CGE model with CGETAX, and Kouparitsas et al. (2016) for an
explanation of Treasury’s model development work.
22
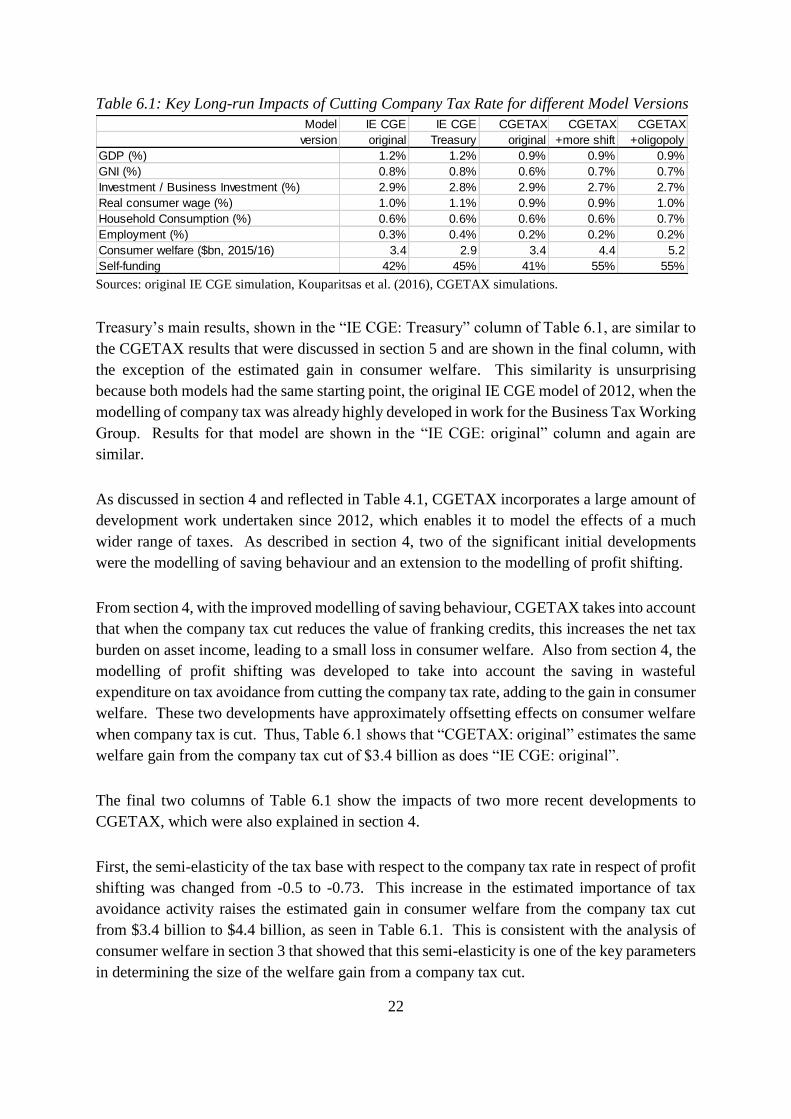
Table 6.1: Key Long-run Impacts of Cutting Company Tax Rate for different Model Versions
Model IE CGE IE CGE CGETAX CGETAX CGETAX
version original Treasury original +more shift +oligopoly
GDP (%) 1.2% 1.2% 0.9% 0.9% 0.9%
GNI (%) 0.8% 0.8% 0.6% 0.7% 0.7%
Investment / Business Investment (%) 2.9% 2.8% 2.9% 2.7% 2.7%
Real consumer wage (%) 1.0% 1.1% 0.9% 0.9% 1.0%
Household Consumption (%) 0.6% 0.6% 0.6% 0.6% 0.7%
Employment (%) 0.3% 0.4% 0.2% 0.2% 0.2%
Consumer welfare ($bn, 2015/16) 3.4 2.9 3.4 4.4 5.2
Self-funding 42% 45% 41% 55% 55% Sources: original IE CGE simulation, Kouparitsas et al. (2016), CGETAX simulations.
Treasury’s main results, shown in the “IE CGE: Treasury” column of Table 6.1, are similar to
the CGETAX results that were discussed in section 5 and are shown in the final column, with
the exception of the estimated gain in consumer welfare. This similarity is unsurprising
because both models had the same starting point, the original IE CGE model of 2012, when the
modelling of company tax was already highly developed in work for the Business Tax Working
Group. Results for that model are shown in the “IE CGE: original” column and again are
similar.
As discussed in section 4 and reflected in Table 4.1, CGETAX incorporates a large amount of
development work undertaken since 2012, which enables it to model the effects of a much
wider range of taxes. As described in section 4, two of the significant initial developments
were the modelling of saving behaviour and an extension to the modelling of profit shifting.
From section 4, with the improved modelling of saving behaviour, CGETAX takes into account
that when the company tax cut reduces the value of franking credits, this increases the net tax
burden on asset income, leading to a small loss in consumer welfare. Also from section 4, the
modelling of profit shifting was developed to take into account the saving in wasteful
expenditure on tax avoidance from cutting the company tax rate, adding to the gain in consumer
welfare. These two developments have approximately offsetting effects on consumer welfare
when company tax is cut. Thus, Table 6.1 shows that “CGETAX: original” estimates the same
welfare gain from the company tax cut of $3.4 billion as does “IE CGE: original”.
The final two columns of Table 6.1 show the impacts of two more recent developments to
CGETAX, which were also explained in section 4.
First, the semi-elasticity of the tax base with respect to the company tax rate in respect of profit
shifting was changed from -0.5 to -0.73. This increase in the estimated importance of tax
avoidance activity raises the estimated gain in consumer welfare from the company tax cut
from $3.4 billion to $4.4 billion, as seen in Table 6.1. This is consistent with the analysis of
consumer welfare in section 3 that showed that this semi-elasticity is one of the key parameters
in determining the size of the welfare gain from a company tax cut.
23
Second, the final column of Table 6.1 shows the impact of the introduction of oligopoly to
certain sectors of the model. Economic rents (or above normal returns) not explained by
mineral resources or land were previously assumed to be derived from unidentified, location-
specific fixed factors of production, but in CGETAX are more realistically assumed to be
derived from oligopoly power. With oligopoly introduced, the estimated gain in annual
consumer welfare from the company tax cut rises from $4.4 billion to the final estimate of $5.2
billion. The previous over-use of location-specific fixed factors artificially reduced economic
flexibility, leading to under-statement of the economic gains from tax reform.
Sensitivity Analysis
The theoretical analysis in sections 2 and 3 identified the key parameters for determining the
size of the gain in consumer welfare of the company tax cut. A simulation confirming the role
of the tax avoidance parameter has been discussed above. Kouparitsas et al. (2016) present
sensitivity analysis that confirms the roles of the labour supply elasticity and capital-labour
substitution parameters (see Tables 3 and 8 of their paper) in influencing the economic gains
from the company tax cut.
Like the CORTAX model used by de Mooij and Devereux (2011), CGETAX assumes
Australia is fully integrated into the world capital market. This means that post-company tax
rates of return on capital in Australia are determined globally through the free movement of
funds. While Australia may not be perfectly integrated into the world capital market, there is
no doubt that it is highly integrated. Kouparitsas et al. (2016, Table 6) find that assuming
capital is highly mobile rather than perfectly mobile leads to only a small reduction in the
favourable impacts of the proposed company tax cut.
Dixon and Nassios
Notwithstanding the extensive international literature pointing in the opposite direction, Dixon
and Nassios (2016) report that the impact of a company tax cut on living standards would be
negative. It may well be the case that they have assumed that international capital mobility is
implausibly low. Their numerical assumption about the degree of mobility is not made explicit
and there is no sensitivity analysis showing how the results would differ if perfect mobility
were assumed.
It also seems likely that their estimated fall in domestic saving is exaggerated. This saving fall
is triggered by the reduction in the value of franking credits to shareholders resulting from the
company tax cut. However, Dixon and Nassios (2016) assume the level of franking credits
utilised by Australian shareholders matches the company tax attributable to them, whereas
Australian Taxation Office (2016) data shows the utilisation is less than half that amount, after
retained earnings and other leakages are taken into account. Further, their numerical
assumption about the sensitivity of domestic saving to this fall in return is also not made
explicit. It appears that a simple saving supply curve has been used rather than the more usual
24
treatment based on an elasticity of intertemporal substitution. It also appears that their
treatment of external balance does not take into account that an increase in the stock of foreign
liabilities increases the sustainable level of net capital inflow. In effect, the final term in the
external balance equation [10] seems to be missing under one of their alternative model closure
assumptions.
Further, Dixon and Nassios (2016) allow for just one out of the three channels through which
a company tax cut would raise economic welfare. That channel, the capital response, is
assumed to be weak: the assumed elasticity of substitution between capital and labour is 0.4.
As noted in section 3, a literature survey of CGE models by Gunning, Diamond and Zodrow
(2008) reports values ranging from 0.4 to 1.0. Regarding the other two channels, the labour
supply is assumed to be rigid; profit shifting is not taken into account, notwithstanding its
extensive treatment in the international corporate tax literature during the last decade.
Finally, Dixon and Nassios (2016) do not appear to allow for most of the important features of
the Australian company tax system that are listed in Table 4.1. The exception is franking
credits, but as noted above these are estimated at more than double their actual size.
The Centre of Policy Studies do highly useful work in many areas, especially industry policy.
But in CGE modelling of tax reform, CGETAX offers a more comprehensive and detailed
analysis.
7 Timing
CGETAX is a model of long run equilibrium. Thus, its results refer to the ongoing effects on
the economy after it has fully adjusted to economic shocks. This is appropriate for policy
analysis, because government policy options should be assessed primarily on the basis of their
lasting impacts. However, it is appropriate to take adjustment costs into consideration and
policymakers are always interested in timing, so the issue of timing is now considered. This
includes the phasing of the company tax cut announced in the Budget and the likely timing of
the economic responses to those tax cuts.
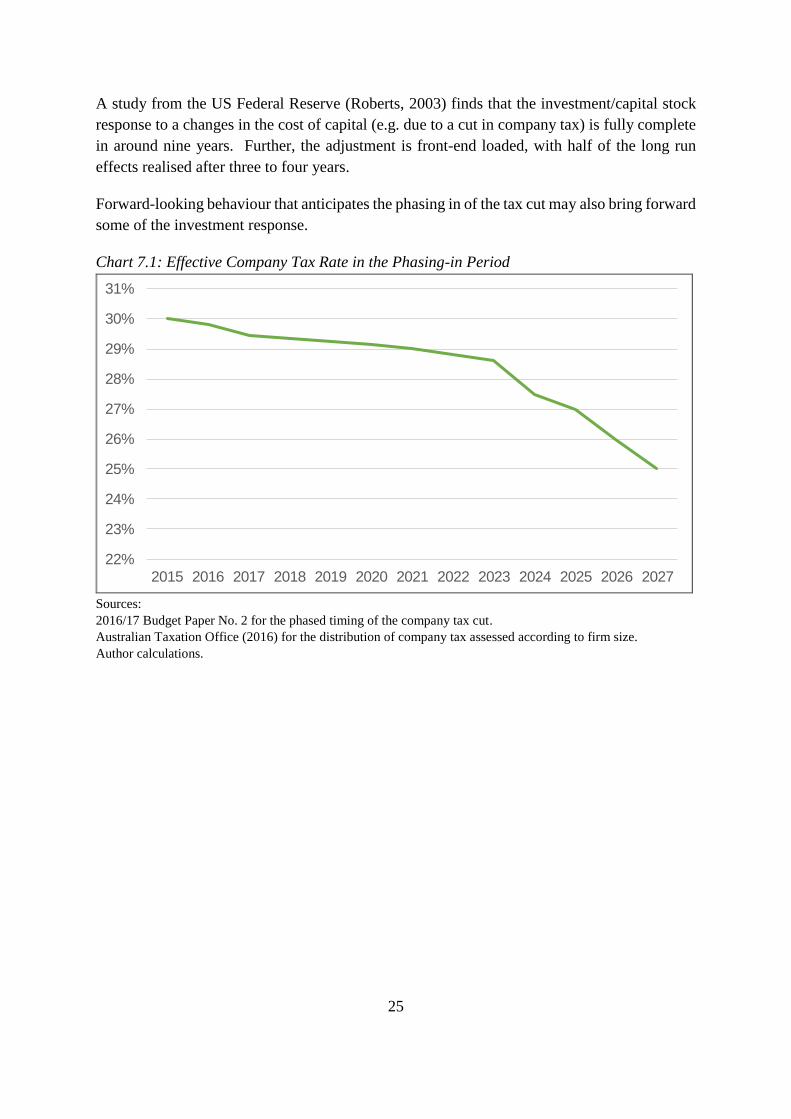
The company tax cut from 30 to 25 per cent is to be gradually phased in. An initial cut to 27.5
per cent is gradually extended from smaller to larger businesses, before the cut is gradually
deepened to 25 per cent. Chart 7.1 shows the estimated path of the effective rate of company
tax. The relatively small nature of the cut in the early years is because in those years the cut is
to only 27.5 per cent and it is limited to smaller businesses that have a relatively low weight in
company tax collections.
Other studies provide a guide to the likely timing of the economic responses to this company
tax cut. The UK Treasury (UK Treasury & Revenue and Customs, 2013) modelling of a phased
cut in the UK corporate tax rate from 28 to 20 per cent was undertaken using a dynamic CGE
model. It found that the gains accrued reasonably quickly. In particular, more than one-half
of the long-run gains had already accrued by the time the corporate tax cut was fully phased in.
25
A study from the US Federal Reserve (Roberts, 2003) finds that the investment/capital stock
response to a changes in the cost of capital (e.g. due to a cut in company tax) is fully complete
in around nine years. Further, the adjustment is front-end loaded, with half of the long run
effects realised after three to four years.
Forward-looking behaviour that anticipates the phasing in of the tax cut may also bring forward
some of the investment response.
Chart 7.1: Effective Company Tax Rate in the Phasing-in Period
22%
23%
24%
25%
26%
27%
28%
29%
30%
31%
2015 2016 2017 2018 2019 2020 2021 2022 2023 2024 2025 2026 2027
Sources:
2016/17 Budget Paper No. 2 for the phased timing of the company tax cut.
Australian Taxation Office (2016) for the distribution of company tax assessed according to firm size.
Author calculations.
26
References
Australian Bureau of Statistics (2015), Taxation Revenue, Australia 2013-14, cat no 5506.0.
Australia’s Future Tax System Review (2009), Report to the Treasurer, Commonwealth of
Australia.
Australian Government (2015), “Mid-Year Economic and Fiscal Outlook 2015-16”.
Australian Government (2012), “Business Tax Working Group: Final Report”, Appendix B.
Australian Taxation Office (2016), Taxation Statistics 2013-14.
Ballard, Charles L., Shoven, John B. and Whalley, John (1985), “General Equilibrium
Computations of the Marginal Welfare Costs of Taxes in the United States”, The American
Economic Review.
Ballard, Charles L. (2000), “How many hours are in a simulated day? The effects of time
endowment on the results of tax policy simulation models”.
Cao Liangyue, Hosking Amanda, Kouparitsas Michael, Mullaly Damian, Rimmer Xavier, Shi
Qun, Stark Wallace, and Wende Sebastian (2015), Treasury WP 2015-01, “Understanding the
Efficiency and Incidence of Major Australian Taxes”.
Dharmapala, Dhammika (2014), “What Do We Know about Base Erosion and Profit Shifting?
A Review of the Empirical Literature”, Working Paper N. 702, University of Chicago Law
School.
Dung, Tran Huu (1993), “Optimal Taxation and Heterogeneous Oligopoly”, The Canadian
Journal of Economics, 26:4.
Evers, Michiel, de Mooij, Rudd and van Vuuren, Daniel (2008), “The Wage Elasticity of
Labour Supply: a Synthesis of Empirical Estimates”, de Economist, 156:1.
Gruber and Saez (2002), “The elasticity of taxable income: evidence and implications”,
Journal of Public Economics.
Gunning, Timothy S., Diamond, J.W. and Zodrow, George R. (2008), “Selecting Parameter
Values for General Equilibrium Model Simulations”, Proceedings of the One Hundredth
Annual Conference on Taxation, 43–49, National Tax Association, Washington, DC.
Heckemeyer, Jost H.; and Overesch, Michael (2013), “Multinationals’ Profit Response to Tax
Differentials: Effect Size and Shifting Channels”, Centre for European Economic Research,
Discussion Paper No. 13-045.
27
Katz, Michael L. and Rosen, Harvey S. (1983), “Tax Analysis in an Oligopoly Model”, NBER
Working Paper No. 1088.
Kouparitsas, Michael; Prihardini, Dinar; and Beames, Alexander (2016), Treasury WP 2016-
02, “Analysis of the Long Term Effects of a Company Tax Cut”.
de Mooij, Rudd A. and Devereux, Michael P. (2009), “Alternative systems of business tax in
Europe: an applied analysis of ACE and CBIT reforms”, Working Paper No. 17 2009,
Directorate General Taxation and Customs Union, European Commission.
de Mooij, Rudd A. and Devereux, Michael P. (2011), “An applied analysis of ACE and CBIT
reforms in the EU”, Journal of International Tax and Public Finance, 8: 93–120.
Murphy, Chris (2016a), “Company Tax Scenario”, report to the Department of the Treasury,
28 April 2008.
Murphy, Chris (2016b), “The CGETAX model”, May 2016.
Roberts, John M. (2003), “Modelling Aggregate Investment: A Fundamentalist Approach”.
Roson, Roberto (2006), “Introducing Imperfect Competition in CGE Models: Technical
Aspects and Implications”, Fondazione Eni Enrico Mattei.
Xavier Rimmer, Jazmine Smith and Sebastian Wende (2014), “The Incidence of Company Tax
in Australia”, Economic Roundup Issue 1, 2014, The Treasury.
UK Treasury & Revenue and Customs (2013), “Analysis of the dynamic effects of corporation
tax reductions”.