Embed Size (px)
Citation preview
Contact
Prof. Dr. Friedrich Heinemann
Prof. Dr. Christoph Spengel
Post:
L 7, 1 68161 Mannheim
P.O.Box 10 34 43 68034 Mannheim
Germany
Mail:
Phone:
+49 621-1235-149
+49 621-181-1704
Analysis of US Corporate Tax Reform Proposals and their Effects for Europe and Germany
Final Report
Mannheim, 11 December 2017


List of Authors
Prof. Dr. Christoph Spengel
University of Mannheim and ZEW
Prof. Dr. Friedrich Heinemann
ZEW and University of Heidelberg
Marcel Olbert
University of Mannheim
Olena Pfeiffer
University of Mannheim and ZEW
Thomas Schwab
University of Mannheim and ZEW
Kathrin Stutzenberger
University of Mannheim
This project was funded by
www.matax.eu

Table of contents Executive Summary ................................................................................................................................. 1
Introduction ............................................................................................................................................. 5
1. Status quo: Corporate taxation in the US and Europe .................................................................... 7
1.1. Comparative analysis of the US and European tax systems ................................................... 7
1.2. Effective tax burdens ............................................................................................................... 9
2. Reform perspectives and their economic effects ......................................................................... 17
2.1. Reform discussion in the US .................................................................................................. 17
2.2. Impact of currently discussed reform proposals on effective tax rates ................................ 21
2.3. Expected effects on foreign direct investment ..................................................................... 28
3. Potential countermeasures and parallel developments in European tax systems ....................... 35
3.1. European initiatives against aggressive tax planning ............................................................ 35
3.2. Outlook: Tax competition in the EU ...................................................................................... 41
Literature ............................................................................................................................................... 45
Appendix ................................................................................................................................................ 51
Appendix A: Country abbreviations .................................................................................................. 51
Appendix B: CFC legislation ............................................................................................................... 52
Figures ................................................................................................................................................... 53
Tables .................................................................................................................................................... 53
1
Executive Summary
Status quo
1. The US currently has a complex tax system and, in international comparison, imposes a high tax rate on business profits between 35% and 40%, depending on the level of local state taxes.
2. The current US tax system is based on worldwide taxation, under which income is taxed at an equal rate regardless of where profits are earned. US corporations therefore face a competi-tive disadvantage compared to foreign companies. Since repatriation of foreign profits triggers high US taxation, US multinationals have an incentive to refrain from bringing home their for-eign earnings. In the light of substantial amounts of “trapped earnings” abroad, tax holidays became a strategic tax planning tool of US multinationals.
3. Today, domestic US investments face an effective average tax rate (EATR) of 36.5% (in the State of California). This is far above the EATR in Germany (28.2%), the average of the EU28 Member States (20.9%) and in low-tax countries, for example, Ireland (14.1%).
Reform perspectives and their economic effects
Reform discussion in the US
1. After a heated debate on US tax reform that gained particular momentum during the presi-dential campaign of Donald Trump, a fundamental reform is now close to being enacted with the US Congress’ House of Representatives and Senate having passed preliminary versions of the “Tax Cuts and Jobs Act” in the beginning of December 2017.
2. Apart from efforts to simplify the tax code and to lower individual income taxes to a modest extent, the tax reform primarily aims to stimulate the US economy by significantly reducing the tax burden on corporate investments in the US. The key elements to achieve this goal are a substantial cut of the federal corporate income tax from 35% to 20%, a provision for imme-diate expensing of certain capital investments, and a move from worldwide taxation towards territoriality (i.e. exemption of foreign profits).
3. Along with the transition to a territorial international tax system, the reform further provides for a one-time deemed repatriation tax of deferred foreign corporate profits at a rate of around 14% (cash assets) and 7% (illiquid assets).
4. Since a territorial tax system facilitates tax planning strategies to generate profits in foreign low-tax jurisdictions, the reform proposal extends the controlled foreign company (CFC) legis-lation aiming to establish a minimum tax of at least 10% on foreign earnings generated from intangible property located abroad.
5. At the same time, anti-base erosion rules will most probably be part of the US tax reform. Depending on the outcome of final negotiations, US affiliates of non-US multinational groups will be subject to an excise tax on payments to foreign affiliates (i.e. imports) or to a minimum tax based on a deemed tax base before payments for transactions with foreign affiliates. Such anti-base erosion rules are likely to hamper cross-border business and trade into the US se-verely. This could run counter to the overarching goal of the US tax reform to increase invest-ment in the US.

2
6. The key elements of the reform including the tax rate cut, immediate expensing of certain capital investments, exemption of foreign profits and a one-time repatriation tax can be con-sidered final. By contrast, CFC and anti-base erosion rules are still subject to negotiations in the Conference Committee of the US Congress that finally has to produce a uniform bill to be signed into law by President Donald Trump.
Impact on Effective Tax Burdens
1. The US tax reform proposal reduces the effective average tax rate (EATR) on domestic US cor-porate investment from 36.5% to 22.7%. This drop of roughly 14 percentage points substan-tially improves the global US position in international tax competition. US investments would face a lower EATR compared to Germany (28.2%) and would be closer to the EU28-average (20.9%). Also, the cost of capital, an important measure for decision makers regarding the scale of investment, decreases substantially after the US tax reform. This is not only due to the tax rate cut but also driven by the introduction of immediate expensing of certain capital invest-ments (e.g. machinery).
2. Regarding cross-border investments, US-based multinationals have an incentive to locate their activities in low-tax foreign jurisdictions. By contrast, non-US multinationals face incentives to relocate their investments into the US and, thus, pay lower US taxes. Our average finding for investment relationships between the US and the EU28 Member States reveal that after the US reform the EATR on US outbound investments into the EU decreases from 27.1% to 21.7% and the EATR on US inbound investments from the EU from 36.0% to 23.5%.
3. Considering tax planning activities, it is likely to assume that the reform increases incentives to shift taxable profits into the US. Our analysis of tax planning incentives indicates that US inbound investments from high-tax jurisdictions (i.e. Germany) should be financed with equity such that profits are taxed in the US whereas profits stemming from US outbound investments into high-tax foreign jurisdictions (i.e. Germany) should again be taxed in the US via intra-company debt financing.
4. With regard to US investments into and from low-tax jurisdictions such as Ireland, however, there will be a clear opposite tax incentive to avoid paying higher US taxes after the reform by shifting profits outside the US via debt financing of US inbound investments and equity financ-ing of US outbound investments.
5. Regarding US inbound investments, the proposed anti-base erosion rules which have not yet been fixed so far have to be examined carefully.
Effect on FDI
1. For the EU28, the US is the most important partner for mutual foreign direct investment (FDI). Between 2008 and 2012, the annual stock for US FDI in the EU28 was 1.28 trillion EUR on average, investors from the EU28 held FDI valued 1.35 trillion EUR in the US.
2. While early macroeconomic analyses make only cautious predictions on the reform’s impact on investment and growth, studies on past tax reforms in the empirical literature suggest that the US corporate tax reform can be expected to foster both, FDI conducted in the US and FDI conducted abroad by US investors.
3. The effect for FDI increases is heterogeneous across EU28 Member States. For high-tax juris-dictions (i.e. Germany) the cross-border tax burden for inbound investment from the US is reduced less than for outbound investment to the US. This will lead to an expected increase in
3
German FDI activities in the US which is not fully balanced by expected additional US FDI ac-tivities in Germany resulting in a net outflow of investment capital. By contrast, for low-tax jurisdictions (i.e. Ireland) the reduction in cross-border tax burdens for inbound and outbound investment is symmetric leading to expected increases in bilateral FDI activity of similar size.
4. The magnitude of the effects is significant. Based on a simulation using average FDI stock data over the period 2008-2012 and tax rate semi-elasticities found in prior empirical literature, the US tax reform is expected to have a significant impact on bilateral FDI flows between the US and its partner countries in the EU: German FDI stocks in the US could increase by roughly 38.6 billion EUR (25%) whereas US FDI in Germany might only increase by a magnitude of 6.33 bil-lion EUR (9%).
Countermeasures and parallel developments in European tax systems
European initiatives against aggressive tax planning
1. The proposed US tax reform would significantly affect corporate financing and location deci-sions of both US and European multinational groups. In consequence, the enhanced competi-tive pressure could result in an erosion of European tax bases and an associated loss in tax revenue.
2. Regarding aggressive tax planning, both the OECD (i.e. BEPS Action Plan) and the EU (i.e. Anti-Tax Avoidance Directive (ATAD)) introduced anti-avoidance measures such as interest deduc-tion limitation rules and controlled foreign company (CFC) legislation. In addition, Country-by-Country Reporting (CbCR) should enhance transparency. At the same time, a draft EU-directive for a staged introduction of a Common (Consolidated) Corporate Tax Base (CC(C)TB) shall con-tribute to the reduction of opportunities for aggressive tax planning within the EU.
3. Neither measure is suitable to prevent the potential revenue loss associated with a reduction of the US corporate income tax rate without putting the attractiveness of the EU as an invest-ment location at a risk: Whereas CFC legislation will not even be applicable under the threshold for low taxation set out in the ATAD in relation to the US in the post-reform scenario, the introduction of an interest deduction limitation rule might increase the risk of double taxation. Moreover, the enhanced disclosure obligations under a public CbCR would require certain MNEs with EU operations to publicly disclose sensitive commercial information which would put them at a disadvantage when compared to corporations without any establishment in the EU.
4. With a CCCTB, aggressive tax planning can only be avoided within the EU. With regard to third countries as the US, even new tax planning opportunities could arise since a shift of less prof-itable assets to the EU might lead to a lower worldwide corporate tax burden through consol-idation.
5. Therefore, it can be concluded that EU28 Member States will face an even increased compar-ative disadvantage towards the US from a tax point of view given the ongoing implementation of BEPS, ATAD and CbCR measures.
Tax competition in the EU
1. Within the EU, corporate tax competition has been characterized by declining corporate tax rates and broader corporate tax bases (“tax rate cut cum tax base broadening”). Apart from

4
the possible reduction of the US statutory corporate income tax rate to 20%, competitive pres-sure among EU28 Member States is further driven by (announced) tax rate reductions in sev-eral Member States.
2. To ensure future competitiveness, EU28 Member States should focus on establishing and maintaining an attractive environment for MNE investments, for instance through the intro-duction or advancement of tax incentives for R&D rather than merely reducing the corporate income tax rate.
3. In total, from an EU perspective and in particular from the perspective of Germany as a high tax jurisdiction, BEPS, ATAD and CbCR are not the proper answers to the US tax reform pro-posals. Rather, the EU and in particular Germany should seek to increase the international competitiveness of their tax systems.
5
Introduction Reforming the corporate tax system has been a recurring issue in the US. The current US corporate tax system is unique in terms of the worldwide income principle applied and is characterized by its numer-ous regulations firms can exploit for avoiding taxes. Moreover, US administrations have refrained from any major corporate tax reform since that implemented by Reagan in 1986. This passivity has been remarkable in the sense that most industrial countries have put forward considerable corporate tax cuts in the last decades. This long period of inaction has now come to an end. Reforming the US cor-porate tax system was prominently addressed in the presidential campaigns in 2016 and is currently the most important item on the political agenda of the Trump administration and the US Congress.
Since the beginning of the presidency of Donald Trump, multiple tax reform proposals have been dis-cussed. The first proposal has put forward a tax reform based on cash flow taxation combined with border adjustment, the destination based cash flow taxation (DBCFT) (see Spengel and Heinemann 2017). Due to the resulting increase in costs for imports and its potential to breach WTO free trade rules but also because of large domestic political resistance from, inter alia, the retail sector, this far-reaching proposal has been given up.
In November 2017, two detailed proposals to reform the US tax system were released by Committees of the House of Representatives and the Senate of the US Congress. Common key features of these proposals are a reduction of the federal corporate income tax rate from 35% to 20%, immediate tax deductions for machinery and intangible assets and the move from worldwide income taxation to ter-ritorial taxation combined with the implementation of a corporate reduced deemed repatriation tax on deferred foreign earnings.
The key elements of the current proposals have realistic chances to get implemented, as they already had been approved by the House of Representatives in November and the Senate passed a tax reform bill in December 2017 with numerous differences in details but similar fundamental changes to corpo-rate and international taxation. Therefore, it can be expected that the emerging key features of re-forming the US corporate tax systems will be implemented.
Without doubt, this far reaching corporate tax reform of the largest economy will change the setting of international tax competition. The proposed US tax reform will have important implications for cor-porate investment decisions both into the US as well as from the US into the EU. Against this back-ground, this study
- quantifies the effects of the tax reform on the effective corporate tax burden in the US in the context of an international comparison;
- identifies the reform impacts on investment and financing strategies of companies considering outbound investments from and inbound investments to the US, differentiating between Euro-pean low-tax locations (e.g. Ireland) and high-tax locations (e.g. Germany);
- assesses the magnitudes of FDI effects which could result from the changes in relative tax burdens in the US and Europe (Germany);
- discusses possible tax policy options on how EU Member States and Germany in particular could react to the US tax reform.
If the tax rate cuts and depreciation changes are implemented in line with the current draft bills, the US effective average tax rate (EATR) for corporate income decreases from 36.5% to 22.7%. This sub-stantially improves the US global tax position. US EATR falls considerably below the German EATR (28.2%) and approaches a level close to the EU28-average (20.9%).
6
Furthermore, this study analyzes the optimal options for cross-border investments of the US with Ger-many, Ireland and the EU28 on average. According to our results, the US becomes a more attractive location for investments from the perspective of high-tax jurisdictions like Germany. At the same time, due to the end to US taxation of worldwide income, investments into low-tax jurisdictions such as Ireland will become even more attractive from the point of view of US investors. The simulations for the expected FDI effects point to significant magnitudes: For example, German FDI into the US could increase by 25% while US FDI into Germany could increase by 9% only. For Ireland an increase of 30% for both Irish FDI in the US and US FDI in Ireland is computed. The difference in the increase of US FDI into Germany and German FDI into the US implies a net outflow of investment capital for Germany.
Thus, a crucial finding is that the US tax reform will not only intensify US-European tax competition but also intra-European competition. From the point of view of US investors, European tax differentials will gain in importance in the choice of an optimum European location. Hence, with the US tax reform, European high-tax jurisdictions like Germany or France will become less attractive relative to European low-tax jurisdictions like Ireland or Eastern Europe from the perspective of US investors.
The US move will challenge the current course of European and German tax policy. Without an appro-priate response, Germany could become one of the European losers in the new round of tax competi-tion. The adoption of anti-tax avoidance measures such as BEPS, ATAD and CbCR do not shield Europe from negative effects of the US reform. On the contrary, these anti-avoidance measures increase the risks for double taxation which might even increase the damage for investment incentives in European high-tax jurisdictions. Overall, this points to the necessity that the EU and Germany in particular should develop a strategy to increase the international competitiveness of their tax systems.
This study proceeds as follows: In Section 1, the history and the main features of the current US cor-porate income tax system are introduced and compared to European taxation systems. Subsequently, the economic effects of the US corporate tax reform are analyzed in Section 2 with a summary of the current state of the US reform process (2.1), the quantitative analysis of effective tax rate effects and resulting tax optimizing incentives (2.2) and an approximation of the magnitude of FDI effects (2.3). In Section 3, current tax policy objectives and initiatives at EU level such as the Anti-Tax Avoidance Di-rective are introduced and related to the anticipated effects of the US corporate tax reform (3.1). Fur-thermore, general trends in intra-EU tax competition are reviewed with the aim to give a recommen-dation for an overall competitive positioning in the future (3.2).

7
1. Status quo: Corporate taxation in the US and Europe
1.1. Comparative analysis of the US and European tax systems
In 1909, the US enacted its first uniform Corporate Tax Act that introduced an excise tax on the privi-lege of doing business in corporate form (Mehrotra 2010). This tax on the profits of corporations is considered a predecessor of the modern corporate income tax, which is nowadays levied in all juris-dictions around the world with the exception of a few tax havens. Germany was among the first Euro-pean countries to enact a uniform corporate income tax in 1920. In the 1930s, a number of reforms were introduced in the US in response to the global economic crisis. This series of programs, also re-ferred to as the New Deal, included several tax measures imposing a more progressive taxation with large tax increases, especially on wealthy individuals. It also introduced the tax on undistributed profits in 1936, i.e. the taxation of retained corporate earnings. After a reduction of the applicable tax rate on undistributed profits, the tax was finally abolished in 1939.
While the American corporate income tax (CIT) rate amounted to only 1% at the time of its introduc-tion, it steadily increased to over 10% in the 1920s and to over 40% in the 1940s. The corporate tax rate reached its peak of 52.8% in 1968, after which it slightly declined in the 1970s (Tax Policy Center 2017). In 1986, the US enacted the Tax Reform Act, which reduced the tax rate on business profits from 46% to 34% and therefore made the US tax system one of the most attractive regimes in the world (Bärsch/Olbert/Spengel 2017). In the following years, the US has experienced a slight rise in business taxes, while other high-income jurisdictions have substantially reduced their business tax rates. As a result, the US currently has a complex tax system and imposes a relatively high tax rate on business profits of approximately 35% to 40%, depending on the level of local taxes.
The US corporate tax system differs from European systems and the German system in several ways (see Table 1). Local taxes on profits are set independently by local authorities in the US. Consequently, combined corporate income tax rates vary within the country. Hence, the US combined corporate income tax rate consists of the 35% federal tax and a state tax rate, which is, however, deductible from the federal tax base. State taxes are either based on corporate income or gross receipts.1 Not only the states but also some US municipalities, including New York City and Washington DC, impose local taxes on profits. Therefore, the combined corporate income tax rates can vary by more than 10 percentage points within the US, depending on the state and municipality in which a company resides. In compar-ison, in Germany, the federal government levies a corporate income tax of 15% and a solidarity sur-charge of 5.5%.2 In addition, German municipalities levy local business taxes on profits. The local busi-ness tax (Gewerbesteuer) is a non-deductible expense and contributes at an average rate of 15% to a variation in German combined corporate income tax rates similar to the case of the US.3
1 Forty-four states levy a local corporate income tax. Rates range from 3% in North Carolina to 12% in Iowa. Nevada, Ohio, Texas and Washington impose gross receipts taxes instead of corporate income taxes. South Da-kota and Wyoming are the only states that levy neither a local corporate income nor gross receipts tax. For more information, see IBFD (2016). 2 The assessment base for the solidarity surcharge is the total corporate income tax due by the taxpayer after deducting tax credits. See IBFD (2016) for details. 3 The local business tax rate on profits is determined based on a federal basic rate (Messzahl) of 3.5% and a municipal coefficient (Hebesatz). In municipalities with over 20 000 inhabitants, the coefficient varies from 260% in Monheim (Nordrhein-Westfalen) to 550% in Oberhausen (Nordrhein-Westfalen) (DIHK (2017)). As a result, the local tax rate on profits varies between 7% and 19% across municipalities.

8
Furthermore, the US tax system is based on worldwide taxation, under which income regardless where it is earned is taxed at an equal rate. US corporations therefore face a competitive disadvantage com-pared to foreign companies which are, due to a relatively high tax rate on business profits in the US, often subject to lower tax rates in their respective home jurisdictions. The income of a foreign branch, which is not legally separated from the parent, is included in the taxable income of the US parent and therefore subject to the US corporate income tax rate. However, in the case of a subsidiary, which constitutes a separate legal entity, the foreign income is not directly included in the US tax base. Amer-ican tax has to be paid if the money returns to the US, for example due to repatriation, dividend pay-ments or a sale of shares of the foreign subsidiary. This is referred to as a tax deferral, as the US parent is able to defer the domestic tax liability (Shaviro 2014).
Since repatriation triggers taxation, US multinationals face an incentive to refrain from bringing home their foreign earnings, which are often effectively taxed at a relatively low level abroad (Hines 1994). Existing CFC rules (Subpart F) contain many exceptions such that, in combination with the so-called “Check the Box Regulation”, they regularly do not apply to low taxed earnings held abroad. In the light of substantial amounts of “trapped earnings” abroad, tax holidays became a strategic tax planning tool of US multinationals. While sales tax holidays have been repeatedly granted in the US starting from 1996, the Bush administration was the first one that enacted a repatriation tax holiday in order to boost domestic investment financed by foreign income. In 2004, the Homeland Investment Act was enacted as part of the American Jobs Creation Act. It enabled US corporations to repatriate their for-eign earnings with substantially lower taxation, subject to certain limitations. The act allowed a one-time dividend deduction of 85%, resulting in an effective tax rate of 5.25% on qualifying dividends instead of 35%. This tax holiday resulted in the repatriation of foreign income worth roughly 362 billion USD (Redmiles 2008). However, the tax holiday failed to achieve its goal of boosting domestic invest-ment in the US. Empirical studies find that the US multinationals that repatriated under the Homeland Investment Act have increased their free cash flows and repurchased shares instead of real investment (Blouin and Krull 2009). Another important feature of the current American and European tax systems concerns the taxation of investment financing. From a tax point of view, firms might see debt as a preferable financing option compared to issuing new equity or using retained earnings, because inter-est payments are tax deductible in most jurisdictions and therefore they minimize a company’s tax liability. This can be used by multinational enterprises to shift profits from high-tax affiliates that take on debt to low-tax affiliates that issue debt. Some countries such as Belgium, Italy and Liechtenstein offer a notional interest deduction (NID) for equity capital in order to even out the tax treatment of different sources of investment financing. This tax instrument allows companies to deduct a certain percentage of the qualifying equity capital from their taxable profits and therefore gives the same kind of advantage to both debt and equity financing.
9
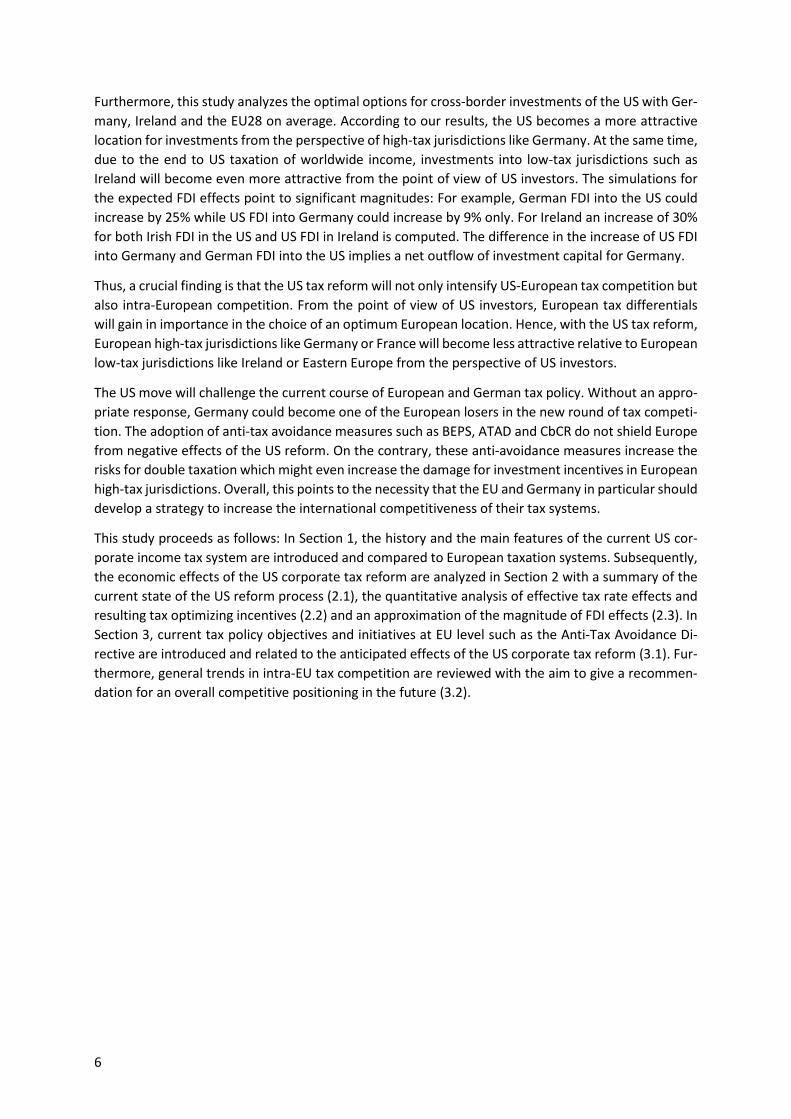
Table 1: Comparison of current US and European corporate tax systems
Feature of tax system US Europe
Tax rate 35% On average 20.5% (in Germany 15%)
Local profit taxes State taxes, 3-12% deductible from CIT
Varying (in DE ca. 15% non-deductible from CIT)
International taxation Worldwide taxation of foreign prof-its (Credit system)
Territorial tax system (Exemption of for-eign profits, except for Ireland)
Treatment of financing Debt/Equity discrimination (interest tax deductible)
Debt/Equity discrimination except for NID in Italy, Belgium, Liechtenstein
Tax bases According to GAAP adjusted by tax law, certain credits available (e.g. R&D)
According to GAAP adjusted by tax law (limitation on interest deductions: 30% of EBITDA)
1.2. Effective tax burdens
Model framework
For the computation of effective tax burdens we build on neoclassical investment theory and incorpo-rate the most important features of the tax system to calculate the cost of capital for a marginal in-vestment project and effective average tax rates (EATR) for profitable investment projects. We apply the well-known model of Devereux and Griffith (1999, 2003) that incorporates various aspects of a tax system and therefore reflects a jurisdiction’s effective corporate tax burden. The key assumptions of this model comprise perfect capital mobility under certainty and a successful outcome of real invest-ment. The investment composition and financial structure considered in the model are illustrated in Figure 1.
Figure 1: Structure of a hypothetical investment
Industrial Buildings
Intangibles
Machinery Financial Assets
Inventories
Corporation
Shareholder
5 Types of Assets
3 Sources of Finance
Dividend
External Lender
Interest
Additional
Dividend Debt Equity
Retained Earnings
Dividends in Future Periods
3 Types of Shareholders
10
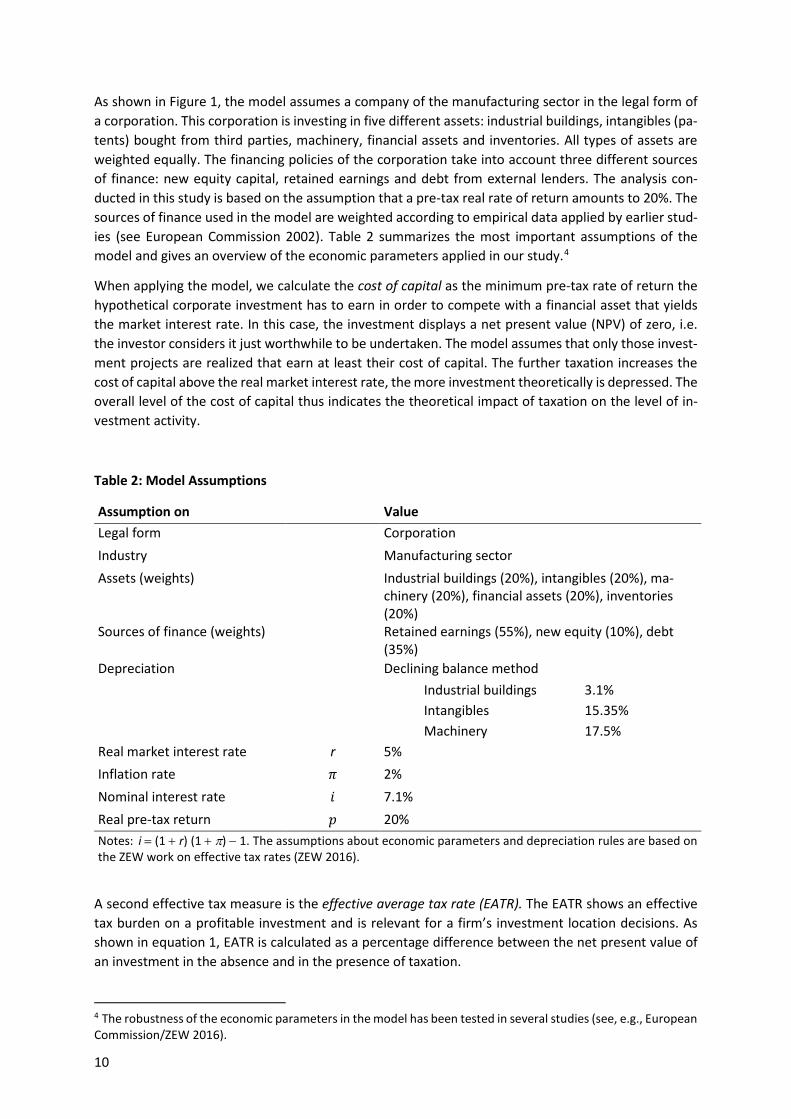
As shown in Figure 1, the model assumes a company of the manufacturing sector in the legal form of a corporation. This corporation is investing in five different assets: industrial buildings, intangibles (pa-tents) bought from third parties, machinery, financial assets and inventories. All types of assets are weighted equally. The financing policies of the corporation take into account three different sources of finance: new equity capital, retained earnings and debt from external lenders. The analysis con-ducted in this study is based on the assumption that a pre-tax real rate of return amounts to 20%. The sources of finance used in the model are weighted according to empirical data applied by earlier stud-ies (see European Commission 2002). Table 2 summarizes the most important assumptions of the model and gives an overview of the economic parameters applied in our study.4
When applying the model, we calculate the cost of capital as the minimum pre-tax rate of return the hypothetical corporate investment has to earn in order to compete with a financial asset that yields the market interest rate. In this case, the investment displays a net present value (NPV) of zero, i.e. the investor considers it just worthwhile to be undertaken. The model assumes that only those invest-ment projects are realized that earn at least their cost of capital. The further taxation increases the cost of capital above the real market interest rate, the more investment theoretically is depressed. The overall level of the cost of capital thus indicates the theoretical impact of taxation on the level of in-vestment activity.
Table 2: Model Assumptions
Assumption on Value Legal form Corporation Industry Manufacturing sector Assets (weights) Industrial buildings (20%), intangibles (20%), ma-
chinery (20%), financial assets (20%), inventories (20%)
Sources of finance (weights) Retained earnings (55%), new equity (10%), debt (35%)
Depreciation Declining balance method Industrial buildings 3.1% Intangibles 15.35% Machinery 17.5%
Real market interest rate r 5% Inflation rate 𝜋𝜋 2% Nominal interest rate 𝑖𝑖 7.1% Real pre-tax return 𝑝𝑝 20% Notes: i = (1 + r) (1 + π) − 1. The assumptions about economic parameters and depreciation rules are based on the ZEW work on effective tax rates (ZEW 2016).
A second effective tax measure is the effective average tax rate (EATR). The EATR shows an effective tax burden on a profitable investment and is relevant for a firm’s investment location decisions. As shown in equation 1, EATR is calculated as a percentage difference between the net present value of an investment in the absence and in the presence of taxation.
4.The robustness of the economic parameters in the model has been tested in several studies (see, e.g., European Commission/ZEW 2016).

11
𝐸𝐸𝐸𝐸𝐸𝐸𝐸𝐸 = (𝐸𝐸∗ − 𝐸𝐸)/ �𝑝𝑝
(1 + 𝑟𝑟)� (1)
In equation 1, 𝐸𝐸∗ represents the net present value of an investment in the absence of taxes and 𝐸𝐸 shows its net present value after taxation. The denominator represents the NPV of a total pre-tax in-come stream net of the rate of return. 𝐸𝐸 covers the most relevant tax provisions of the national tax systems. With respect to the taxation of corporate profits, it considers headline statutory corporate profit tax rates as well as surcharges and other special rates for particular types of income and expend-itures. It takes into account the most important taxes on capital, such as real estate taxes. Generally, the model assumes a level of corporate profits and capital at which the top-bracket statutory tax rates apply. Regarding the definition of the taxable income, the relevant rules concerning depreciation and amortization allowances, the valuation of inventories and the interest deductibility in the case of debt financing are considered. In addition, it includes some important generally available investment incen-tives. Since the measures of effective tax burden take into account the most important rules concern-ing the tax rate and the tax base of all relevant taxes, they are more relevant for analyzing investment and financing decisions than statutory tax rates. Moreover, cost of capital and EATR are directly com-parable between locations and therefore enable both a cross-country comparison and a comprehen-sive analysis over time.
Comparing the two measures of effective tax burdens, one should note that the cost of capital reflects the lowest sufficient rate of return to be worthwhile for the investor. The receipts only exceed the expenses by little; therefore, the treatment of these expenses for purposes of taxation – especially the path of tax depreciation allowances – is relatively important. Hence, changes in depreciation rules, property and net wealth taxes have a greater impact on the cost of capital than on the EATR. On the contrary, the EATR calculation assumes a profitable investment. As a result, a higher level of receipts now accompanies the same level of expenses. The additional receipts are taxed regularly at the statu-tory tax rate without triggering additional allowances. The relative weight of these allowances in the determination of the effective tax burden thus declines with an increasing level of profitability. More-over, property and net wealth taxes are usually based on the historic cost. Thus, their absolute amount does not differ between marginal and profitable investments, which display the same initial cost but different levels of return. Consequently, property and net wealth taxes take away a lower fraction of the return of a more profitable investment.
In total, the model includes all relevant tax provisions for both domestic and cross-border investments. In case of cross-border investments withholding taxes in the source jurisdictions and the methods to avoid double taxation in the residence jurisdiction (e.g. tax credits, exemption) are taken into account.
Effective tax burden: Domestic investment
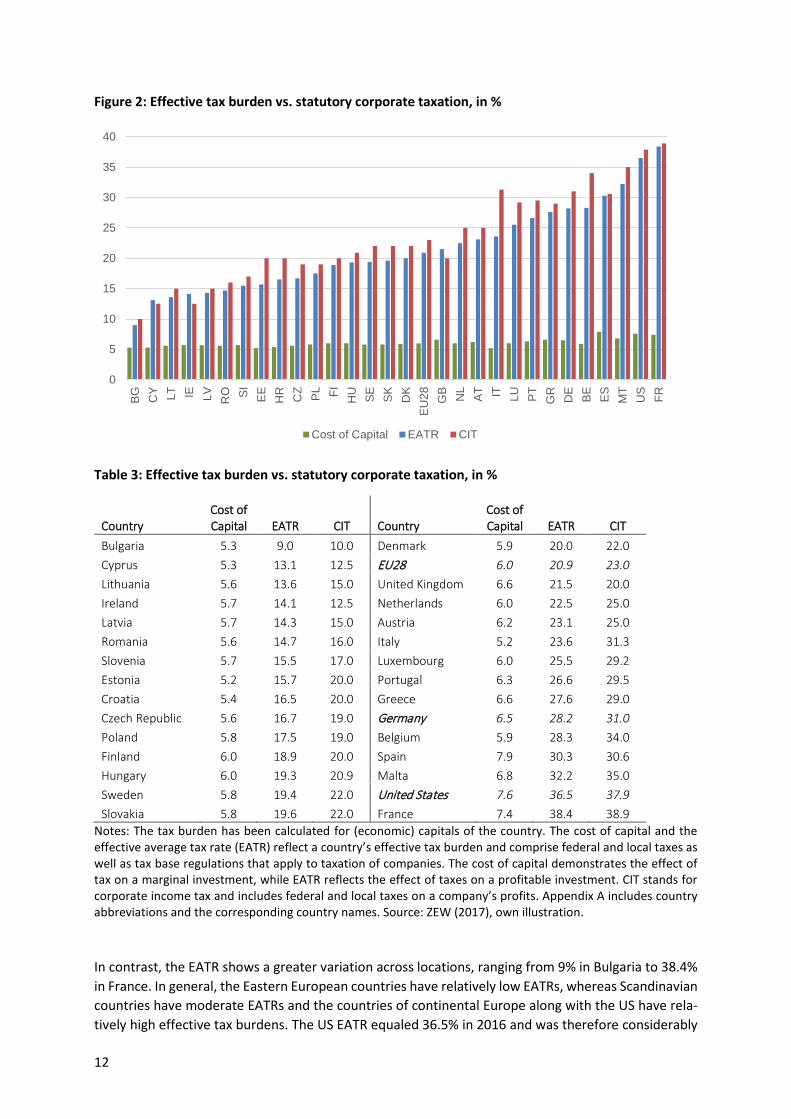
Figure 2 and Table 3 display the cost of capital and the EATR in the economic capitals5 of Member States of the EU and the US in 2016. In addition, it compares the effective tax burdens with the statu-tory corporate income tax rates. The cost of capital shows less variation among locations than EATR or CIT. In 2016, the cost of capital in the EU28 ranged from 5.2% in Estonia to 7.9% in Spain with an average of 6%. In Ireland, the cost of capital was 5.7%, in Germany 6.5% and in the US 7.6%.
5 For example, the US tax burden was calculated using data on corporate taxation in Los Angeles (California). All calculations in this study are based on legislation effective on 31 December 2016.
12
Figure 2: Effective tax burden vs. statutory corporate taxation, in %
Table 3: Effective tax burden vs. statutory corporate taxation, in %
Country Cost of Capital EATR CIT Country
Cost of Capital EATR CIT
Bulgaria 5.3 9.0 10.0 Denmark 5.9 20.0 22.0 Cyprus 5.3 13.1 12.5 EU28 6.0 20.9 23.0 Lithuania 5.6 13.6 15.0 United Kingdom 6.6 21.5 20.0 Ireland 5.7 14.1 12.5 Netherlands 6.0 22.5 25.0 Latvia 5.7 14.3 15.0 Austria 6.2 23.1 25.0 Romania 5.6 14.7 16.0 Italy 5.2 23.6 31.3 Slovenia 5.7 15.5 17.0 Luxembourg 6.0 25.5 29.2 Estonia 5.2 15.7 20.0 Portugal 6.3 26.6 29.5 Croatia 5.4 16.5 20.0 Greece 6.6 27.6 29.0 Czech Republic 5.6 16.7 19.0 Germany 6.5 28.2 31.0 Poland 5.8 17.5 19.0 Belgium 5.9 28.3 34.0 Finland 6.0 18.9 20.0 Spain 7.9 30.3 30.6 Hungary 6.0 19.3 20.9 Malta 6.8 32.2 35.0 Sweden 5.8 19.4 22.0 United States 7.6 36.5 37.9 Slovakia 5.8 19.6 22.0 France 7.4 38.4 38.9
Notes: The tax burden has been calculated for (economic) capitals of the country. The cost of capital and the effective average tax rate (EATR) reflect a country’s effective tax burden and comprise federal and local taxes as well as tax base regulations that apply to taxation of companies. The cost of capital demonstrates the effect of tax on a marginal investment, while EATR reflects the effect of taxes on a profitable investment. CIT stands for corporate income tax and includes federal and local taxes on a company’s profits. Appendix A includes country abbreviations and the corresponding country names. Source: ZEW (2017), own illustration.
In contrast, the EATR shows a greater variation across locations, ranging from 9% in Bulgaria to 38.4% in France. In general, the Eastern European countries have relatively low EATRs, whereas Scandinavian countries have moderate EATRs and the countries of continental Europe along with the US have rela-tively high effective tax burdens. The US EATR equaled 36.5% in 2016 and was therefore considerably
0
5
10
15
20
25
30
35
40B
G CY LT IE LV RO SI
EE
HR CZ PL FI HU SE
SK
DK
EU
28 GB NL
AT IT LU PT
GR DE BE
ES
MT
US FR
Cost of Capital EATR CIT
13
higher than the German EATR of 28.2%, the EU28-average EATR of 20.9% and the Irish EATR of 14.1%. The EATRs usually differ from statutory CIT rates and, in most cases, they are lower than the CIT rates. For example, the Italian CIT rate exceeds the country’s EATR by 7.7 percentage points. However, in some countries, such as Ireland and the United Kingdom, the CIT values is below the EATR. As discussed in the previous section, EATRs represent a more meaningful measure of taxation than simple statutory corporate income tax rates because they take into account all relevant types of taxes and in particular, the respective tax base regulations.
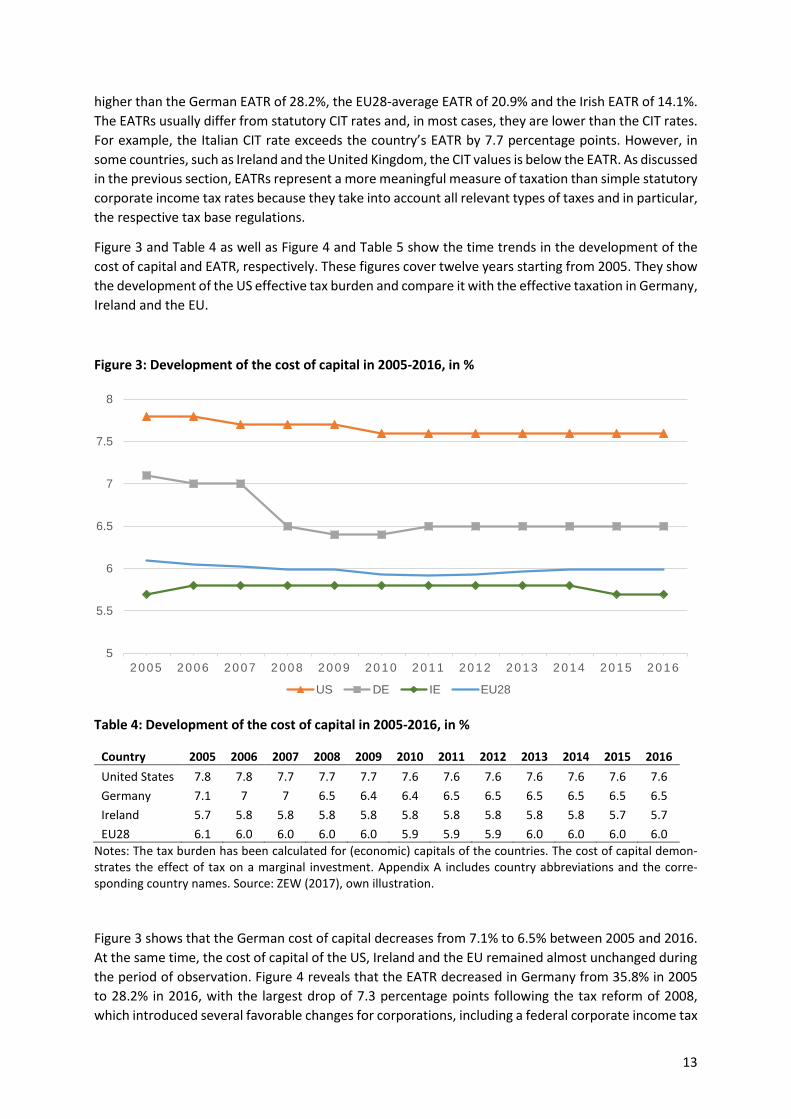
Figure 3 and Table 4 as well as Figure 4 and Table 5 show the time trends in the development of the cost of capital and EATR, respectively. These figures cover twelve years starting from 2005. They show the development of the US effective tax burden and compare it with the effective taxation in Germany, Ireland and the EU.
Figure 3: Development of the cost of capital in 2005-2016, in %
Table 4: Development of the cost of capital in 2005-2016, in %
Country 2005 2006 2007 2008 2009 2010 2011 2012 2013 2014 2015 2016 United States 7.8 7.8 7.7 7.7 7.7 7.6 7.6 7.6 7.6 7.6 7.6 7.6 Germany 7.1 7 7 6.5 6.4 6.4 6.5 6.5 6.5 6.5 6.5 6.5 Ireland 5.7 5.8 5.8 5.8 5.8 5.8 5.8 5.8 5.8 5.8 5.7 5.7 EU28 6.1 6.0 6.0 6.0 6.0 5.9 5.9 5.9 6.0 6.0 6.0 6.0
Notes: The tax burden has been calculated for (economic) capitals of the countries. The cost of capital demon-strates the effect of tax on a marginal investment. Appendix A includes country abbreviations and the corre-sponding country names. Source: ZEW (2017), own illustration.
Figure 3 shows that the German cost of capital decreases from 7.1% to 6.5% between 2005 and 2016. At the same time, the cost of capital of the US, Ireland and the EU remained almost unchanged during the period of observation. Figure 4 reveals that the EATR decreased in Germany from 35.8% in 2005 to 28.2% in 2016, with the largest drop of 7.3 percentage points following the tax reform of 2008, which introduced several favorable changes for corporations, including a federal corporate income tax
5
5.5
6
6.5
7
7.5
8
2005 2006 2007 2008 2009 2010 2011 2012 2013 2014 2015 2016
US DE IE EU28

14
rate cut from 25% to 15%. As mentioned in the previous section, tax rate cuts have a greater effect on the EATR than on the cost of capital, which explains the greater drop of the German EATR as compared to the cost of capital after this reform. The average EATR of the EU Member States decreased steadily from 23% in 2005 to 20.9% in 2016 and therefore fell by 2.1 percentage points during this period. In contrast, the Irish EATR remained almost unchanged during the period of observation, slightly decreas-ing from 14.3% in 2005 to 14.1% in 2016. The US effective tax burden also remained almost unchanged between 2005 and 2015, decreasing by only 1.8 percentage points, mainly due to the phasing-in of the manufacturers’ deduction, which is a favorable treatment of profits of manufacturing companies that reduces their taxable profits by a pre-determined percentage. In 2007, for example, the reduction was doubled from 3% to 6% of the taxable income which led to a lower effective tax burden in the US. However, with 36.5% the EATR of the US remained one of the highest in the world in 2016. The same held true for the country’s cost of capital of 7.6%.
Figure 4: Development of EATR in 2005-2016, in %
Table 5: Development of EATR in 2005-2016, in %
Country 2005 2006 2007 2008 2009 2010 2011 2012 2013 2014 2015 2016 United States 38.3 38.3 37.4 37.4 37.4 36.5 36.5 36.5 36.5 36.5 36.5 36.5 Germany 35.8 35.5 35.5 28.2 28 28 28.2 28.2 28.2 28.2 28.2 28.2 Ireland 14.3 14.4 14.4 14.4 14.4 14.4 14.4 14.4 14.4 14.1 14.1 14.1 EU28 23.0 22.7 22.1 21.3 21.6 20.9 20.8 20.8 21.2 21.1 21.1 20.9
Notes: The tax burden has been calculated for (economic) capitals of the countries. EATR stands for effective average tax rate and comprises federal and local taxes as well as tax base regulations that apply to taxation of companies. Appendix A includes country abbreviations and the corresponding country names. Source: ZEW (2017), own illustration.
10
15
20
25
30
35
40
2005 2006 2007 2008 2009 2010 2011 2012 2013 2014 2015 2016
US DE IE EU28

15
Effective tax burden: Cross-border investment
The previous section has illustrated the calculation of cost of capital and EATR in the case of a domestic investment. In other words, we have assumed that the shareholder and the investment target are located in the same jurisdiction. However, this does not always have to be the case. Residences of an investor and an investee may differ, resulting in a cross-border investment. In this section, we calculate and compare the cost of capital and EATR in the case of a cross-border investment. Furthermore, we analyze investment financing options that are optimal for companies from a tax point of view. Within the model framework, these options include retained earnings, new equity capital and debt, as ex-plained in section 1.2.
We focus on the inbound and outbound investments of the US with respect to Germany, Ireland and the unweighted average of EU28 Member States. We compare how the best financing options from a tax point of view change when US cross-border investment with high-tax and low-tax countries are analyzed. In addition, parallel to the domestic investment scenario, we calculate both the cost of cap-ital and the EATR in the case of inbound and outbound investments of the US with these countries and show the results in Table 6.
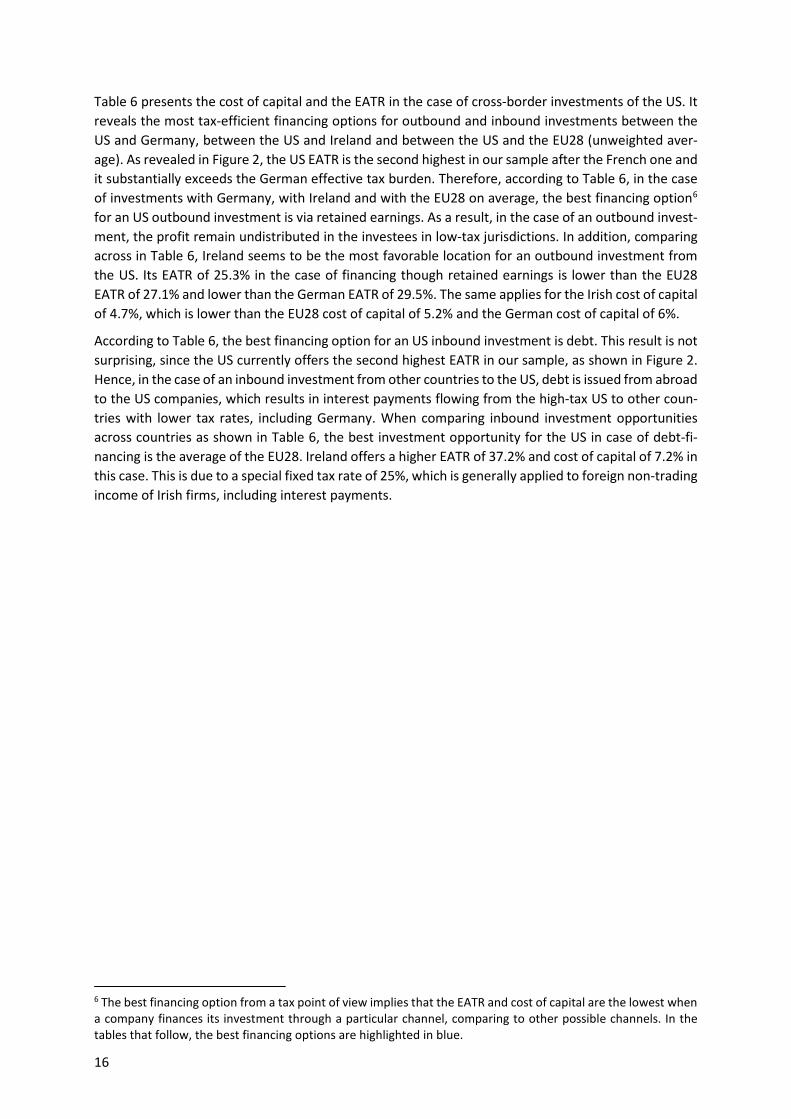
Table 6: Cross-Border investment: US, 2016, in %
Country Investment Type Investment Financing Cost of Capital EATR Germany Outbound Retained earnings 6.0 29.5 New equity 6.6 31.5 Debt 7.0 32.7 Inbound Retained earnings 8.0 38.3 New equity 8.2 38.9 Debt 7.3 36.1 Ireland Outbound Retained earnings 4.7 25.3 New equity 7.2 33.4 Debt 7.2 33.4 Inbound Retained earnings 8.5 41.0 New equity 9.1 42.7 Debt 7.2 37.2 EU28 Outbound Retained earnings 5.2 27.1 New equity 6.9 32.7 Debt 7.0 33.1 Inbound Retained earnings 8.2 40.7 New equity 9.0 42.8 Debt 6.7 36.0
Notes: Highlighted numbers indicate the most favorable investment financing option for a company after ac-counting for taxation. The tax burden has been calculated for (economic) capitals of the countries. The cost of capital and the effective average tax rate (EATR) reflect a country’s effective tax burden and comprise federal and local taxes as well as tax base regulations that apply to taxation of companies. The cost of capital demon-strates the effect of tax on a marginal investment, while EATR reflects the effect of taxes on a profitable invest-ment. EU28 stands for the unweighted average of the EU Member States.
16
Table 6 presents the cost of capital and the EATR in the case of cross-border investments of the US. It reveals the most tax-efficient financing options for outbound and inbound investments between the US and Germany, between the US and Ireland and between the US and the EU28 (unweighted aver-age). As revealed in Figure 2, the US EATR is the second highest in our sample after the French one and it substantially exceeds the German effective tax burden. Therefore, according to Table 6, in the case of investments with Germany, with Ireland and with the EU28 on average, the best financing option6 for an US outbound investment is via retained earnings. As a result, in the case of an outbound invest-ment, the profit remain undistributed in the investees in low-tax jurisdictions. In addition, comparing across in Table 6, Ireland seems to be the most favorable location for an outbound investment from the US. Its EATR of 25.3% in the case of financing though retained earnings is lower than the EU28 EATR of 27.1% and lower than the German EATR of 29.5%. The same applies for the Irish cost of capital of 4.7%, which is lower than the EU28 cost of capital of 5.2% and the German cost of capital of 6%.
According to Table 6, the best financing option for an US inbound investment is debt. This result is not surprising, since the US currently offers the second highest EATR in our sample, as shown in Figure 2. Hence, in the case of an inbound investment from other countries to the US, debt is issued from abroad to the US companies, which results in interest payments flowing from the high-tax US to other coun-tries with lower tax rates, including Germany. When comparing inbound investment opportunities across countries as shown in Table 6, the best investment opportunity for the US in case of debt-fi-nancing is the average of the EU28. Ireland offers a higher EATR of 37.2% and cost of capital of 7.2% in this case. This is due to a special fixed tax rate of 25%, which is generally applied to foreign non-trading income of Irish firms, including interest payments.
6 The best financing option from a tax point of view implies that the EATR and cost of capital are the lowest when a company finances its investment through a particular channel, comparing to other possible channels. In the tables that follow, the best financing options are highlighted in blue.

17
2. Reform perspectives and their economic effects
2.1. Reform discussion in the US
Recent history of US tax reform plans The elements of the currently evolving US tax reform date back to two separate proposals: the “House Blueprint” that was put forward by House Republicans in June 20167 and the “Trump Plan” that was presented by President Donald Trump’s Administration on 26 April 2017. The latter is a mix of tax policy proposals made during the campaign while some campaign elements have been modified or aban-doned. Since then, leading scholars have considered a tax reform that focuses on the common grounds of both, the Trump Plan and the House Blueprint, most likely since the administration needs a majority in both chambers of the Congress, the House of Representatives and the Senate, to pass a tax reform (Avi-Yonah and Mazzoni 2017, De Simone 2017). President Trump’s cursory statements during his of-ficial interview on the working status of tax reform on 30 August 2017 as well as earlier announcements by officials hinted at a tax reform that will substantially lower the corporate income tax rate, exempt foreign corporate profits (territorial system) and introduce a one-time repatriation tax. In particular, Paul Ryan, the former main supporter of the Destination-Based Cash Flow Tax (DBCFT)8, and other Republican officials announced on 27 June 2017 that a US tax reform would not depart from estab-lished principles in international taxation by introducing a DBCFT or some other form of border adjust-ment.
Currently, the tax reform is going through the legislative process of the bicameral US congress. On November 16, the House of Representatives voted 227 to 205 to pass the “Tax Cuts and Jobs Act” (HR 1). On 2 December, a slight 51-49 majority passed the Senate’s version of the reform bill after the Senate Finance Committee had approved a Senate version of tax reform legislation shortly after the House Bill (HR 1) was passed. Both current proposals, the House Bill (HR 1) and the Senate Bill differ in several aspects while the most important changes to corporate and international taxation are very similar. Until the end of the year, the Conference Committee of the two chambers is expected to rec-oncile differences between the two bills in order to vote to pass a final bill that can be signed into law by President Trump. The further qualitative and quantitative analyses of this study are based on the core elements of both proposals as publicly available on 4 December 2017.
A significant cut of the corporate income tax rate from 35% to 20% to be expected A tax rate cut for business profits will be the most likely and also the most prominent element if a tax reform will be passed before the midterm elections in 2018. Scholars and politicians from both US parties agree that the high statutory corporate income tax rate of up to 39% (35% federal rate) is a devastating factor in international tax competition and should therefore be decreased (see, e.g. Avi-Yonah and Mazzoni 2017, see Devereux et al. 2008 for an analysis of competition over tax rates).
Thus, the corporate income tax rate cut as part of the reform is mainly a question of dimension and timing. While the House Blueprint provides a reduction of the federal rate from 35% to 20%, Trump’s Administration proposed the “biggest tax cut we’ve ever had” with a tax rate of only 15%. In the end, the definite tax rate is a result of a political bargaining process, which in turn is constrained by revenue neutrality to meet Senate Budget Reconciliation rules (Avi-Yonah and Mazzoni 2017). Analysts of the
7 https://abetterway.speaker.gov/_assets/pdf/ABetterWay-Tax-PolicyPaper.pdf 8 See Auerbach et al. (2017) for a detailed overview of DBCFT.
18
matter have therefore been expecting a more moderate tax rate cut own to 28% or 30% if the expected loss of revenue is not counterbalanced by measures broadening the tax base or by the one-time tax on repatriated profits.9
However, the will to pass a substantial tax rate cut that visibly serves as an economic stimulus was strong enough for both chambers of the congress to propose a federal tax rate on corporate profits of 20%. The only difference between the bills is that the Senate Bill provides for the reduced tax rate to apply for tax years after 2018 to reduce the fiscal cost of the reform while the tax rate cut would come into force immediately after 2017 under the House Bill.
All tax reform proposal discussed yet suggested a corporate income tax rate reduction by significantly more than 10 percentage points, which would be sizeable enough and significant for business decisions and international tax competition (Bärsch/Olbert/Spengel 2017). In particular, the profit tax rate is highly important for investors in assessing the locations for new investment (see section 2.3 and Feld and Heckemeyer 2011). Further, a significant tax rate cut would change the position of the US in the global landscape of tax attractiveness from a high tax to a low tax jurisdiction. The result would be a fundamental change in investors’ incentives for financing new investment and subsidiaries. Under such a tax rate cut, a bias towards debt financing of US FDI in Germany or other European countries can be expected while German and other incoming FDI in the US would be primarily equity financed (Bärsch/Olbert/Spengel 2017). Given the concurrent new tax rate on corporate profits in the House and Senate Bill of 20%, we argue that it is reasonable to assume that a tax rate cut of 15 percentage points is coming into force. Thus, we base our further analysis on this assumption.
During the reform negotiations, it was less clear at which rate business income earned by pass-through entities (e.g. partnerships) would be taxed. The House Blueprint had proposed a maximum tax rate of 25% and the Trump administration had only mentioned not to distinguish between business income earned by companies with different legal forms. The recently passed Senate Bill provides for a deduc-tion of 23% of income earned through pass through businesses with the remainder being taxed at the individual income tax rate. As proposed in the Blueprint, the House Bill contains a reduced tax rate of 25% on all income generated of pass through entities and places more restrictions on the eligibility of legal entities and activities that would benefit from the reduced rate.10 Overall, reconciling the differ-ent proposals will be a major element of negations of the Conference Committee. In the remainder of this study, all analysis focus on business activity of incorporated entities.
Move from worldwide taxation to exempting foreign corporate profits Both, the House Blueprint and the Administration’s plan aimed to adopt a territorial system of taxing corporate profits. As in most OECD countries including Germany, repatriated profits from foreign affil-iated companies would not be liable to taxation in the US in case CFC legislation (Subpart F rules) is not triggered. The tax burden would then only depend on the tax level in the foreign source jurisdictions, which is referred to as capital import neutrality (CIN) (Endres and Spengel 2015). A territorial system would remove any incentive for US investors to defer the repatriation of foreign profits through tax planning. US policy makers consider this feature a curative effect given the large pile of permanently reinvested offshore profits and its alleged distortions to domestic investment. Given its broad, bipar-
9 Financial Times of 28 July 2017. 10 Pass-through legislation remain among the mostly contested parts of the bill and are subject to change dur-ing negotiations, see http://www.bbc.com/news/business-42227965.
19
tisan support in the US and the predominant existence of territorial systems in other developed coun-tries it has always been seen as very likely that territoriality will be a major international component of the US tax reform.
Both chambers of the Congress include the exemption of foreign corporate profits in their bills that only differ in the technicalities of translating the territorial system into practice.11 As a result, future profits of foreign subsidiaries of US multinational corporations will not be taxed in the US upon repat-riation if the US corporate shareholder holds at least 10% of the stock of the foreign corporation. The ultimate tax burden of foreign profits will thus depend on the level of taxation in foreign jurisdictions. As such a change establishes an effective financial advantage for US multinational corporations gener-ating profits in relatively low-tax foreign jurisdictions compared to the status quo, current reactions of business leaders and stock market investors are widely positive (The Wall Street Journal 2017).
The tax advantages for multinational enterprises (MNE) residing in territorial tax systems would also make mergers and acquisitions more profitable, i.e. US MNEs would have relatively stronger incentives to acquire foreign target companies. With regard to the US, it is estimated that such a move towards territoriality would increase the likelihood of cross-border mergers and acquisitions by 11%, thereby implying an annual efficiency gain of more than 500 million USD (Feld et al. 2016). At the same time, a territorial tax system would create new incentives for US MNEs to shift profits abroad since the post-reform US tax rate is unlikely to be lower than those of common tax havens such as Ireland (Avi-Yonah and Mazzoni 2017, for empirical evidence, see Atwood et al. 2012, Markle 2016 and Clausing 2016). Immanent in a territorial system, a deferral of foreign profits becomes unnecessary and low-taxed earnings can be repatriated without any additional tax burden if current CFC rules are not systemati-cally revised and tightened.
Given a territorial system provides incentives to generate income through foreign corporations in low-tax jurisdictions, the current versions of the bill include CFC legislation that will be added to the existing Subpart F rules (Section 951A). In particular, income earned in connection with intangible assets lo-cated in low-tax CFCs will be included in the gross income of the US shareholder and taxed at the reduced US corporate tax rate of 20%. Yet, a general deduction of 50% of US CFCs’ foreign income is provided but only a limited credit for foreign taxes paid is granted resulting in an effective tax rate of at least 10% for foreign CFCs’ income.12
In addition, anti-base erosion rules will be implemented to broaden the tax base for US multinational groups with payments to related foreign parties. Apart from special interest deduction limitations for US corporations with excessive leverage, new valuation rules to limit base erosion through payments related to foreign owned intellectual property and payments in relation to hybrid entities, the current Senate Version provides for a “base erosion minimum tax”. This tax is an absolute amount calculated as the excess of 10% of taxable income before deemed base eroding payments (modified income) over reported taxable income.13 The House Bill would impose an even stricter regulation in the form of a 20% excise tax on all payments by a domestic corporation to foreign corporate members of the finan-cial reporting group (Deloitte 2017). Both types of anti-base erosion provisions comprise detailed
11 In particular, anti-abuse rules to limit base erosion are still being discussed. 12 The addition to the CFC legislation is complicated in nature and still differs in the House and Senate versions of the bill. In particular, the Senate Bill provides for a special calculation of the eligible deduction of foreign in-come depending on investment in qualifying assets in the US for foreign use (EY 2017). 13 For instance, if a US affiliate of a foreign MNE has gross receipts of 100 and pays an amount of 95 to other foreign affiliates for intracompany services or goods, its reported tax liability in the US is 5 and would be multi-plied with a tax rate of 20% resulting in a tax liability of 1. The base erosion minimum tax amount then is 5 (10%*100 – 5 = 5) which increases the tax liability in this example of a US affiliate with a high share of internal trade with foreign affiliates by the factor 5.
20
mechanisms to calculate base eroding payments and a list of exceptions. It is foreseeable that the regulations will be subject to further negotiations of the Conference Committee. Overall, such regula-tions will be of particular relevance for foreign multinationals with US affiliated corporations and a substantial amount of internal trade. US inbound transactions, i.e. imports of US corporations from foreign affiliated companies might be burdened with taxes that cannot be credited in the jurisdiction of the recipient entity. Therefore, such an effective border adjustment tax can be substantially bur-densome depending on the relevance of multinational firms’ internal trade. Moreover, such a regula-tion could result in an obvious disadvantage for non-US MNEs with high shares of internal trade be-tween US affiliates and foreign affiliates.
One-time taxation of foreign profits to end with deferral and generate revenue As a complement to the move to territoriality, both the House Republicans and the Trump Administra-tion aimed to impose a one-off tax on offshore profits14 that have been accumulated under the deferral system. During the development of reform proposals, there were no official statements on the respec-tive tax rate. The House Blueprint mentioned a tax rate of 8.75% on cash and 3.5% on other assets stemming from profits held abroad. During the campaign of Donald Trump, a repatriation tax rate of 10% was discussed. The repatriation tax could be introduced as a mandatory tax on deemed dividends, i.e. applicable to all foreign profits whether repatriated or not as proposed in the House Blueprint. Also, the tax could only apply upon repatriation as in the 2004 tax holiday with a reduced rate of 5.25% under the Bush administration. Both alternatives, however, entail substantial complications with re-gard to their implementation alongside the other reform proposals (see Herzfeld 2017 and Bärsch/Ol-bert/Spengel 2017 for respective implementation issues).
Ultimately, the one-time repatriation tax will be an instrument to ensure at least short-term revenue neutrality of the tax reform. Thus, the respective tax rate and its applicability will depend on the esti-mated costs of the tax reliefs of the reform as well as the respective political agreement. Given that the offshore profits are highly concentrated among a small group of large US MNEs (Avi-Yonah and Mazzoni 2017), such a rate might also result from political decisions influenced by lobbyist groups.
The House and Senate Bills have substantially converged and both propose a deemed repatriation tax of currently deferred foreign profits, i.e. those profits will be taxed independently of effective repatri-ation. Both bills distinguish between foreign profits held as liquid assets (i.e. cash) and illiquid assets. The House version intends to apply a 14% tax rate on liquid assets and a 7% rate on illiquid assets. Senate Bill differs only slightly with tax rates of 14.49% and 7.49%, respectively. These tax rates will substantially affect both, the ultimate tax burden of US MNEs currently holding substantial amounts of untaxed cash abroad and the federal budget of the current administration. Those revenue effects are the major reasons why the tax rates in the current bills are higher than those discussed during the early stage of the reform developments (Tax Foundation 2017).
Changes to the tax base for profit taxation Since revenue neutrality is a pre-condition for a successful tax reform, broadening the tax base is a natural candidate as an instrument to counterbalance the revenue loss due to tax rate cuts. In addition to the foreseeable anti-base erosion provisions set out above, limits to tax deductions have been dis-cussed as part of a tax reform. While the House Blueprint comprises certain limitations on interest
14 The US Congressional Joint Committee on Taxation (31 Aug. 2016) estimated that that the total of “undistrib-uted post-1986 not previously taxed [foreign] earnings [of US parent companies] for 2015 were approximately $2.6 trillion”, see also Avi-Yonah and Mazzoni (2017).

21
deductions in relation to immediately expensed capital expenditures, the Trump Administration has been silent on changes to the determination of corporate tax bases. Limits to interest deductibility were long considered unlikely (Avi-Yonah and Mazzoni 2017) and companies have been expecting to be confronted with less advantageous depreciation rules and general tax deductions if the Trump Ad-ministration moves in a similar direction as in the area of personal income taxation. One major com-ponent of the so-called itemized deductions are state and local taxes paid, including property taxes, that were discussed to be no longer deductible from federal taxes.
However, both Congress bills comprise some unanticipated regulations affecting the tax base deter-mination for corporate income taxation including a limit to interest deductibility, more restrictive tax use of net operating losses and immediate expensing of certain short-lived capital investment. State and local property tax deductions remain in place under both bills, capped at 10,000 USD, which is in line with the interest of Senators from high tax states such as New York of California. Also, the much debated credit for research and development remains in place. Regarding the tax treatment of interest the House Bill includes a cap of net interest deduction at 30% of EBITDA which is similar to the rule in German tax law. The Senate Bill provides for a stricter rule limiting the deduction to 30% of EBIT. Both versions of the bill eliminate net operating loss carrybacks that is currently available for two years while providing for an indefinite loss carryforward limited to 90% (House Bill) or 80% (Senate Bill) of taxable income.
Although President Trump pronounced that the Tax Reform will offer tax cuts and repeal the majority of complex deductions for businesses, the latest House and Senate versions of the bill contain an ad-ditional rule for business expenses that are currently not available under US law. Framed as a stimulus for business investment and economic growth, immediate expensing of capital investment in short-lived assets will be granted to businesses for a period of five years after enacting the bill. As a result, investment outlays for, e.g., machinery and equipment will be immediately deductible for tax purposes in the year of acquisition as opposed to the general rule of capitalizing investment costs and deducting expenses over the useful life of the asset.
2.2. Impact of currently discussed reform proposals on effective tax rates
Effective tax burden under the US tax reform: Domestic investment
As discussed in the previous section, the main changes to the US corporate income tax system within the scope of the current reform discussions include the following: First, it is planned to lower the stat-utory corporate income tax rate from 35% to 20%. Second, an immediate depreciation of corporate investments in machinery and intangible assets is expected to be implemented. Third, there will be a systematic shift in taxing foreign-source profits with the US abolishing the worldwide taxation and introducing the exemption of foreign corporate profits (territorial system). The influence of these re-form suggestions on the taxation of domestic and cross-border investments is analyzed in this part of the study.
In order to isolate the effects of the key reform elements in our quantitative analyses, we conduct a two-step approach:
1. Departing from status quo, we first model the effects of a CIT rate cut from 35% to 20% to-gether with immediately expensing capital investments in machinery and acquired intangible assets;

22
2. Then, in addition to that, we analyze the effects of moving to exempting foreign profits in the cross-border setting.
In our analyses, we consider a domestic investment conducted by a corporation in a given jurisdiction in five assets (see section 1.2) and a cross-border investment conducted by a corporation in a given jurisdiction which is owned and financed by a parent corporation in a different jurisdiction. We focus on US inbound and outbound investments as depicted in Figure 5.
Figure 5: US inbound and outbound investment for calculating effective tax burdens
Figure 6 and Table 7 display the new ranking of the cost of capital and EATR after integrating the US corporate tax reform proposal into the model. The bars labelled “US” represent the effective tax bur-dens of the US under the status quo. The bars labelled “US_20%” represent taxation in the US after the US tax rate cut to 20%. “US_Dep” shows taxation after the tax rate cut to 20% and the introduction of immediate depreciation allowance (expensing capital investments) of machinery and acquired in-tangible assets.15
Reducing the US CIT rate from 35% to 20% decreases the US domestic EATR to 25.2%, which is lower than the German EATR of 28.2% under current provisions. At the same time, the US cost of capital decreases from 7.6% to 6.6%. This result is close to the German cost of capital of 6.4% and the EU28-average of 6%. The introduction of an immediate depreciation of machinery and intangible assets in addition to the CIT rate of 20% reduces the cost of capital and the EATR even further. In this case, the cost of capital is 5.9% and the EATR amounts to 22.7%. As a result, the US EATR is very close to the EU28-average of 20.9% and the US cost of capital lies below the EU28-average of 6%. As discussed in section 1.2, changes in depreciation rules have a greater impact on the cost of capital than on the EATR. This effect is illustrated in Figure 6. In relative terms, the cost of capital decreases by 10.6% once the depreciation rules are introduced, while EATR decreases by 9.9%.
15 Please note that the exemption of foreign corporate profits does not influence the results in Figure 6. The reason is that the effective tax burden shown in this figure reflects taxation in the case of a domestic investment, where dividends are transferred to the shareholders that reside in the same country as the investment target. As a result, only tax rate cuts have an impact on the decreasing cost of capital and EATR of the US in Figure 6.

23
Figure 6: Effective tax burden after the US tax reform, in %
Table 7: Effective tax burden after the US tax reform, in %
Country Cost of Capital EATR CIT Country
Cost of Capital EATR CIT
Bulgaria 5.3 9.0 10.0 6.0 20.9 23.0 Cyprus 5.3 13.1 12.5 6.6 21.5 20.0 Lithuania 5.6 13.6 15.0 6.0 22.5 25.0 Ireland 5.7 14.1 12.5 5.9 22.7 27.1 Latvia 5.7 14.3 15.0 6.2 23.1 25.0 Romania 5.6 14.7 16.0 5.2 23.6 31.3 Slovenia 5.7 15.5 17.0 6.6 25.2 27.1 Estonia 5.2 15.7 20.0 6.0 25.5 29.2 Croatia 5.4 16.5 20.0 6.3 26.6 29.5 Czech Republic 5.6 16.7 19.0 6.6 27.6 29.0 Poland 5.8 17.5 19.0 6.4 28.2 31.0 Finland 6.0 18.9 20.0 5.9 28.3 34.0 Hungary 6.0 19.3 20.9 7.1 30.3 30.6 Sweden 5.8 19.4 22.0 6.8 32.2 35.0 Slovakia 5.8 19.6 22.0 7.6 36.5 37.9 Denmark 5.9 20.0 22.0
EU28 United Kingdom Netherlands US_20%_Dep Austria Italy US_20% Luxembourg Portugal Greece Germany Belgium Spain Malta US France 7.4 38.4 38.9
Notes: The tax burden has been calculated for (economic) capitals of the countries. The cost of capital and the effective average tax rate (EATR) reflect a country’s effective tax burden and comprise federal and local taxes as well as tax base regulations that apply to taxation of companies. The cost of capital demonstrates the effect of tax on a marginal investment, while EATR reflects the effect of taxes on a profitable investment. CIT stands for corporate income tax and includes federal and local taxes on a company’s profits. US implies taxation in the United States under the status quo; US_20% represents taxation in the United States after lowering the US CIT rate to 20%; US_Dep shows taxation after lowering the US CIT rate to 20% and additionally introducing an im-mediate depreciation of machinery and intangible assets. In Appendix A country abbreviations and the corre-sponding country names are listed.
0
5
10
15
20
25
30
35
40B
G CY LT IE LV RO SI
EE
HR CZ PL FI HU SE
SK
DK
EU
28 GB NL
US
_Dep AT IT
US
_20% LU P
TG
R DE BE
ES
MT
US FR
CoC EATR CIT

24
Effective tax burden under the US tax reform: Cross-border investment
This section examines the changes in the taxation of cross-border investments after the US tax reform in two steps. First, we analyze the outcomes of the US lowering its statutory corporate income tax rate and introducing an immediate depreciation of machinery and intangible assets. Second, we addition-ally model the switch from the worldwide taxation to the exemption of foreign corporate profits.
Step 1: Reduction of tax rate to 20% and introduction of immediate depreciation
Table 8 resembles the analysis presented in Table 6 but accounts for the US tax reform, which would reduce the US CIT rate from the current 35% to 20% and would introduce an immediate depreciation of machinery and intangible assets. Parallel to Table 6, Table 8 shows the cost of capital and EATR in the case of a cross-border investment into and out of the US. In addition, the three investment financ-ing options, such as retained earnings, new equity and debt are analyzed here.
The results in Table 8 suggest that for US outbound investments on average in the EU28 and in Ireland, the best financing option is retained earnings. These results resemble the outcomes shown in Table 6, even though the advantages of using particular financing options are smaller in Table 8 compared to Table 6. These findings are not surprising, since even though the US statutory CIT rate decreases from 35% to 20%, it still remains higher than the tax burden of Ireland.
However, results for the outbound investment from the US to Germany differ. In this case, intra-company debt becomes the best financing option from a tax point of view. This is due to the US after-reform CIT rate becoming lower than the German CIT rate and therefore making the US a low-tax ju-risdiction relative to Germany. The major driver of this result is that interest payments are deductible at the subsidiary level in Germany as a relatively high-tax jurisdiction and increase the US tax liability at the reduced rate of 20%.
Table 8 further shows that the best financing option for the US inbound investment from Ireland and, on average from EU28 countries is debt. However, the best financing option for an inbound investment changes once a US inbound investment conducted from Germany or another relatively high-tax juris-diction is considered. For German companies it is tax optimal to finance their inbound investments in the US through retained earnings. Similarly to the outbound investment case, this scenario is triggered by the US CIT rate becoming lower than the German CIT rate under the US reform proposal.
Differences in the results shown in Table 6 and Table 8 are mostly due to the decrease of the US CIT rate. An immediate depreciation of machinery and intangibles does not influence the outbound invest-ment from the US to other jurisdictions, since an outbound investment is undertaken overseas and the US domestic depreciation rules do not apply. In the case of inbound investments from Germany, Ire-land and the EU28 to the US, the best financing options are not influenced by an immediate deprecia-tion. However, the inbound investments in the US become more attractive for foreign firms, because the US effective tax burden – represented by the cost of capital and EATR – decreases when companies are allowed to immediately expense their machinery and intangible assets.
25
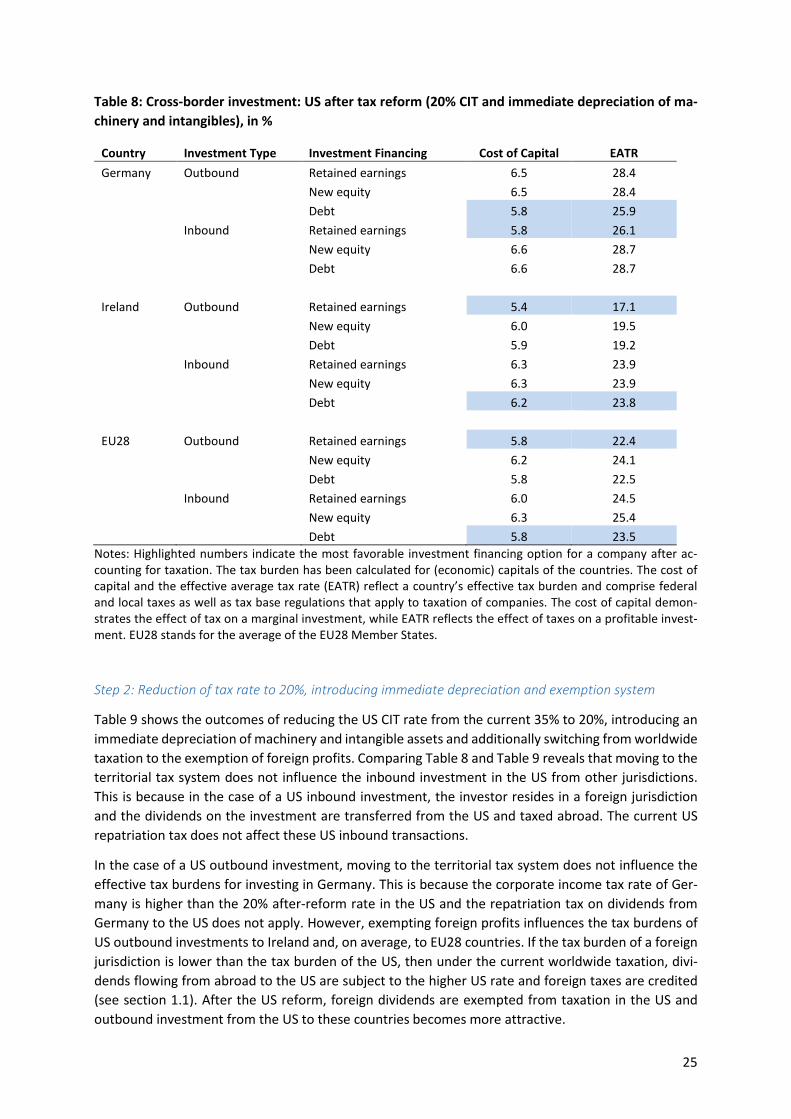
Table 8: Cross-border investment: US after tax reform (20% CIT and immediate depreciation of ma-chinery and intangibles), in %
Country Investment Type Investment Financing Cost of Capital EATR Germany Outbound Retained earnings 6.5 28.4 New equity 6.5 28.4 Debt 5.8 25.9 Inbound Retained earnings 5.8 26.1 New equity 6.6 28.7 Debt 6.6 28.7 Ireland Outbound Retained earnings 5.4 17.1 New equity 6.0 19.5 Debt 5.9 19.2 Inbound Retained earnings 6.3 23.9 New equity 6.3 23.9 Debt 6.2 23.8 EU28 Outbound Retained earnings 5.8 22.4 New equity 6.2 24.1 Debt 5.8 22.5 Inbound Retained earnings 6.0 24.5 New equity 6.3 25.4 Debt 5.8 23.5
Notes: Highlighted numbers indicate the most favorable investment financing option for a company after ac-counting for taxation. The tax burden has been calculated for (economic) capitals of the countries. The cost of capital and the effective average tax rate (EATR) reflect a country’s effective tax burden and comprise federal and local taxes as well as tax base regulations that apply to taxation of companies. The cost of capital demon-strates the effect of tax on a marginal investment, while EATR reflects the effect of taxes on a profitable invest-ment. EU28 stands for the average of the EU28 Member States.
Step 2: Reduction of tax rate to 20%, introducing immediate depreciation and exemption system
Table 9 shows the outcomes of reducing the US CIT rate from the current 35% to 20%, introducing an immediate depreciation of machinery and intangible assets and additionally switching from worldwide taxation to the exemption of foreign profits. Comparing Table 8 and Table 9 reveals that moving to the territorial tax system does not influence the inbound investment in the US from other jurisdictions. This is because in the case of a US inbound investment, the investor resides in a foreign jurisdiction and the dividends on the investment are transferred from the US and taxed abroad. The current US repatriation tax does not affect these US inbound transactions.
In the case of a US outbound investment, moving to the territorial tax system does not influence the effective tax burdens for investing in Germany. This is because the corporate income tax rate of Ger-many is higher than the 20% after-reform rate in the US and the repatriation tax on dividends from Germany to the US does not apply. However, exempting foreign profits influences the tax burdens of US outbound investments to Ireland and, on average, to EU28 countries. If the tax burden of a foreign jurisdiction is lower than the tax burden of the US, then under the current worldwide taxation, divi-dends flowing from abroad to the US are subject to the higher US rate and foreign taxes are credited (see section 1.1). After the US reform, foreign dividends are exempted from taxation in the US and outbound investment from the US to these countries becomes more attractive.

26
Table 9: Cross-border investment: US after tax reform (20% CIT, immediate depreciation of machin-ery and intangibles and the exemption of foreign profits), in %
Country Investment Type Investment Financing Cost of Capital EATR Germany Outbound Retained earnings 6.5 28.4 New equity 6.5 28.4 Debt 5.8 25.9 Inbound Retained earnings 5.8 26.1 New equity 6.6 28.7 Debt 6.6 28.7 Ireland Outbound Retained earnings 5.4 12.9 New equity 5.4 12.9 Debt 5.8 14.6 Inbound Retained earnings 6.3 23.9 New equity 6.3 23.9 Debt 6.2 23.8 EU28 Outbound Retained earnings 5.8 21.7 New equity 6.1 23.0 Debt 5.7 21.7 Inbound Retained earnings 6.0 24.5 New equity 6.3 25.4 Debt 5.8 23.5
Notes: Highlighted numbers indicate the most favorable investment financing option for a company after ac-counting for taxation. The tax burden has been calculated for (economic) capitals of the countries. The cost of capital and the effective average tax rate (EATR) reflect a country’s effective tax burden and comprise federal and local taxes as well as tax base regulations that apply to taxation of companies. The cost of capital demon-strates the effect of tax on a marginal investment, while EATR reflects the effect of taxes on a profitable invest-ment. EU28 stands for the average of the EU28 Member States.
This effect is especially notable for the outbound investment financed through new equity. The EATR of an average US outbound investment to the EU28 decreases from 24.1% to 23.0% and the cost of capital decreases from 6.2% to 6.1% once the exemption of foreign profits is introduced. The effect on the outbound investment from the US to Ireland (and other low tax jurisdictions, respectively) is more substantial. For an US outbound investment in Ireland, the EATR decreases by 6.6 percentage points from 19.5% to 12.9% and the cost of capital decreases by 0.6 percentage points from 6% to 5.4%. A larger drop of the EATR as compared to the cost of capital can be explained by a greater importance of tax rate changes in the determination of EATR than in the calculation of the cost of capital (see section 1.2).
Interim conclusion
Table 10 summarizes the effects of the US tax reform for outbound investments from and inbound investments to the US. It compares the optimal investment financing options under the status quo with the optimal financing options after the US tax reform. Our analyses model the US reform including a reduction of the US corporate income tax rate from 35% to 20%, immediate depreciation of machin-ery and intangible assets and switching to exempting foreign profits.
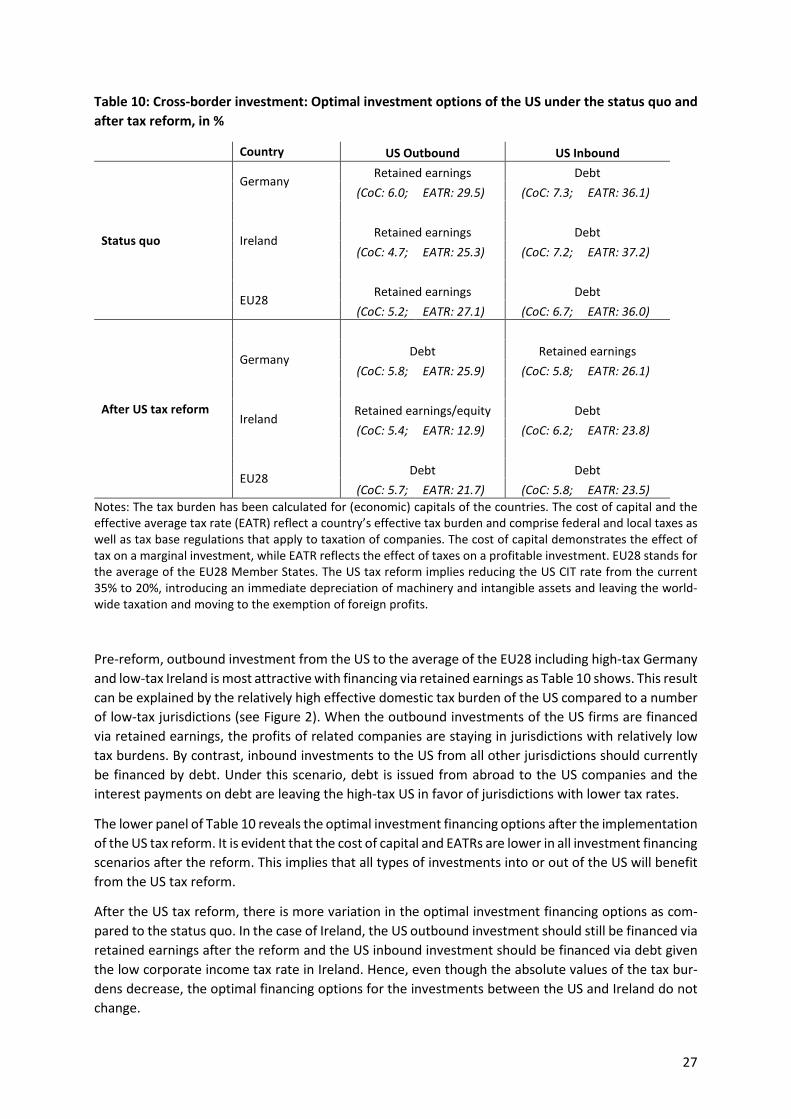
27
Table 10: Cross-border investment: Optimal investment options of the US under the status quo and after tax reform, in %
Country US Outbound US Inbound
Status quo
Germany Retained earnings Debt
(CoC: 6.0; EATR: 29.5) (CoC: 7.3; EATR: 36.1)
Ireland Retained earnings Debt (CoC: 4.7; EATR: 25.3) (CoC: 7.2; EATR: 37.2)
EU28 Retained earnings Debt
(CoC: 5.2; EATR: 27.1) (CoC: 6.7; EATR: 36.0)
After US tax reform
Germany Debt Retained earnings (CoC: 5.8; EATR: 25.9) (CoC: 5.8; EATR: 26.1)
Ireland Retained earnings/equity Debt (CoC: 5.4; EATR: 12.9) (CoC: 6.2; EATR: 23.8)
EU28 Debt Debt (CoC: 5.7; EATR: 21.7) (CoC: 5.8; EATR: 23.5)
Notes: The tax burden has been calculated for (economic) capitals of the countries. The cost of capital and the effective average tax rate (EATR) reflect a country’s effective tax burden and comprise federal and local taxes as well as tax base regulations that apply to taxation of companies. The cost of capital demonstrates the effect of tax on a marginal investment, while EATR reflects the effect of taxes on a profitable investment. EU28 stands for the average of the EU28 Member States. The US tax reform implies reducing the US CIT rate from the current 35% to 20%, introducing an immediate depreciation of machinery and intangible assets and leaving the world-wide taxation and moving to the exemption of foreign profits.
Pre-reform, outbound investment from the US to the average of the EU28 including high-tax Germany and low-tax Ireland is most attractive with financing via retained earnings as Table 10 shows. This result can be explained by the relatively high effective domestic tax burden of the US compared to a number of low-tax jurisdictions (see Figure 2). When the outbound investments of the US firms are financed via retained earnings, the profits of related companies are staying in jurisdictions with relatively low tax burdens. By contrast, inbound investments to the US from all other jurisdictions should currently be financed by debt. Under this scenario, debt is issued from abroad to the US companies and the interest payments on debt are leaving the high-tax US in favor of jurisdictions with lower tax rates.
The lower panel of Table 10 reveals the optimal investment financing options after the implementation of the US tax reform. It is evident that the cost of capital and EATRs are lower in all investment financing scenarios after the reform. This implies that all types of investments into or out of the US will benefit from the US tax reform.
After the US tax reform, there is more variation in the optimal investment financing options as com-pared to the status quo. In the case of Ireland, the US outbound investment should still be financed via retained earnings after the reform and the US inbound investment should be financed via debt given the low corporate income tax rate in Ireland. Hence, even though the absolute values of the tax bur-dens decrease, the optimal financing options for the investments between the US and Ireland do not change.

28
By contrast, once bilateral investments between the US and the high-tax jurisdiction Germany are con-sidered, the optimal financing options switch. It becomes optimal to finance outbound investments from the US to Germany via debt and the inbound investments from Germany to the US via retained earnings. This is due to the US effective tax burden becoming lower than the German tax burden after the introduction of a CIT rate of 20%, an immediate depreciation of machinery and intangibles and the exemption system. Furthermore, after the reform, debt becomes the optimal financing option for the outbound and inbound investments of the US with respect to the average of EU28. This result can be explained through a relatively similar level of the effective tax burden of the US and the average of the EU28 after the reform.
2.3. Expected effects on foreign direct investment In the following, the impact of the US corporate tax reform proposals on foreign direct investment (FDI) between the US and Europe is assessed. Based on the calculations in the previous subsection on the changes of corporate tax burdens, the potential after-reform change in bilateral FDI stocks be-tween the US and the EU28 and vice-versa is simulated.
Foreign direct investment and taxation Foreign direct investments are investments firms or individuals conduct outside their country of resi-dence. FDI are characterized by their long-term intention and the influence of the direct investor on the investment and go beyond pure capital flows as they also entail transfer of knowledge and tech-nology (OECD 2008). Hence, FDI are in general considered as desirable for the host economy (Feldstein 2000, Markusen and Venables 1999). The two forms of FDI are greenfield investments where new business facilities are established and mergers and acquisitions (M&A) of already existing business en-tities.
Decision-making of investors for FDI is affected by various determinants. One key determinant is tax-ation (see, e.g., Fuest et al. 2005). In particular, the effective tax rate on corporate income is important as it affects net-of-tax profitability. A high net-of-tax profitability increases the probability of hosting FDI which would have been realized anyway but in a different country. In addition, a high net-of-tax profitability enables investors to also realize FDI with lower economic returns. Domestic investments also benefit from high net-of-tax profitability the same way as FDI.
The US tax reform will affect the net-of-tax profitability of both inbound and outbound FDI as well as domestic investments. The increased net-of-tax profitability influences the decision margin of foreign investors leading to more investments conducted in the US. In addition, for US investors more domes-tic and foreign investment projects become profitable leading to an increase in outbound foreign in-vestments. Hence, both inbound and outbound FDI in the US are expected to increase once the US tax reform is implemented.
Methodology and data to simulate changes in foreign direct investment In the following, the effects of the discussed US corporate tax reform proposal on bilateral FDI between the US and the EU28 together with Germany and Ireland are analyzed. Germany and Ireland serve as illustrative examples in a separate analysis due to their status as high-tax jurisdiction (Germany) and low-tax jurisdiction (Ireland). The focus of the analysis is on both inbound and outbound FDI for the US and its European trading partners. To simulate the impact of changes in corporate taxation in the US

29
on FDI, we use the change in the effective tax rate between the US and its trading partners as calcu-lated in the previous section. Table 11 lists the change in the EATR in outbound and inbound invest-ments for the US. Thereby, the most favorable financing option in the status quo and after the tax reform is considered. The greatest change with a reduction of 13.4% occurs for inbound US invest-ments from Ireland. Investments in Germany conducted by US investors are affected to a lower extent with a reduction in the EATR of 3.6%. This implies that while for Irish investors it becomes substantially more attractive to invest in the US, the decision margin for US investors to invest in Germany will be altered on a minor scale. However, in the case of Germany the reduction in the tax burden for German FDI in the US outweighs the reduction of the tax burden for US outbound FDI in Germany by almost factor 3.
Table 11: Changes in effective average tax burdens of investment options of the US after tax reform, in %
Country US Outbound US Inbound Germany -3.6 -10.0
Ireland -12.4 -13.4
EU28 -5.4 -12.5
Note: Changes in the tax rate are based on the results listed in Table 10. The table provides the changes in cross-border tax burdens for US FDI in Europe (column ‘US outbound’) and for European FDI in the US (column ‘US inbound’). The difference in effective average tax burden for the EU28 is based on the unweighted effective average tax rates of the EU28 Member States. The difference between the most beneficial financing option in the status quo and the most beneficial financing option after the implementation of the US tax reform is taken.
The information of Table 11 is used to compute the changes in inbound and outbound FDI using esti-mated elasticities from the empirical literature. For the computation of aggregated FDI, a semi-elastic-ity of 2.49 is employed. This semi-elasticity is the key result of Feld and Heckemeyer (2011) who ana-lyze the results of 704 primary estimates of 45 empirical studies on the impact of taxation on FDI using a meta-regression design. Their key result implies that FDI stocks in a country increases by 2.49% if the tax rate is reduced by one percentage point.16 For computing the effects on FDI flows by industries, the semi-elasticity results of Overesch and Wamser (2009) are used. Overesch and Wamser (2009) analyze German FDI flows using administrative data.17 They find a semi-elasticity for manufacturing FDI flows of -2.55 and for business services of -1.31.
For this analysis, Eurostat data is used. FDI stock data for the US and Europe is collected for the years 2008 to 2012. A potential limitation of FDI data is that it may be prone to fluctuations (Noorbakhsh and Paloni 2001) which can be explained by the fact that sizeable foreign investments are conducted irregularly. To overcome this limitation, this analysis is based on the average of FDI stocks between 2008 and 2012.
16 The semi-elasticity of 2.49 is the average effect based on analyses of numerous countries. The usual caveats for employing an average effect estimate for predicting effects for single countries apply. 17 Overesch and Wamser (2009) analyzed how the number of FDI flows is influenced by taxation which capture the extensive decision margin, i.e. whether a firm decides to conduct a foreign investment or not. For this anal-ysis, it is assumed that their derived elasticities also represent the intensive decision margin meaning the vol-ume of foreign direct investments.
30
The simulation is based on the underlying assumption that investors are not adjusting their principal investment strategy of conducting FDI directly without using intermediate jurisdictions. This may be a concern for the results of European high-tax jurisdictions as US investors could channel investments in Germany through other jurisdictions (e.g. Ireland) to circumvent taxation. This incentive increases es-pecially after the implementation of the US corporate tax reform.
Effects on total foreign direct investments In Figure 7, the effects of the US tax reform on FDI between the US and the EU28 are illustrated. With 37.14% of all EU28 FDI invested there, the US is the most important destination country for EU28 out-bound FDI. Currently, the value of investments conducted in the US by investors residing in the EU28 amounts to 1353 billion EUR (see blue bar, left panel). Assuming the average effects found in prior literature, the implementation of the US corporate tax reform is expected to increase US inbound in-vestments originating from the EU28 by 31.3% resulting in an FDI stock of 1774 billion EUR (see orange bar, left panel).
FDI in the EU28 conducted by US investors will also be fostered. While the stock of FDI held by US investors is 1278 billion EUR currently (see blue bar, right panel), an increase of 172 billion EUR to 1450 billion EUR can be expected after the US tax reform (see orange bar, right panel), reflecting an increase of 13.4%.
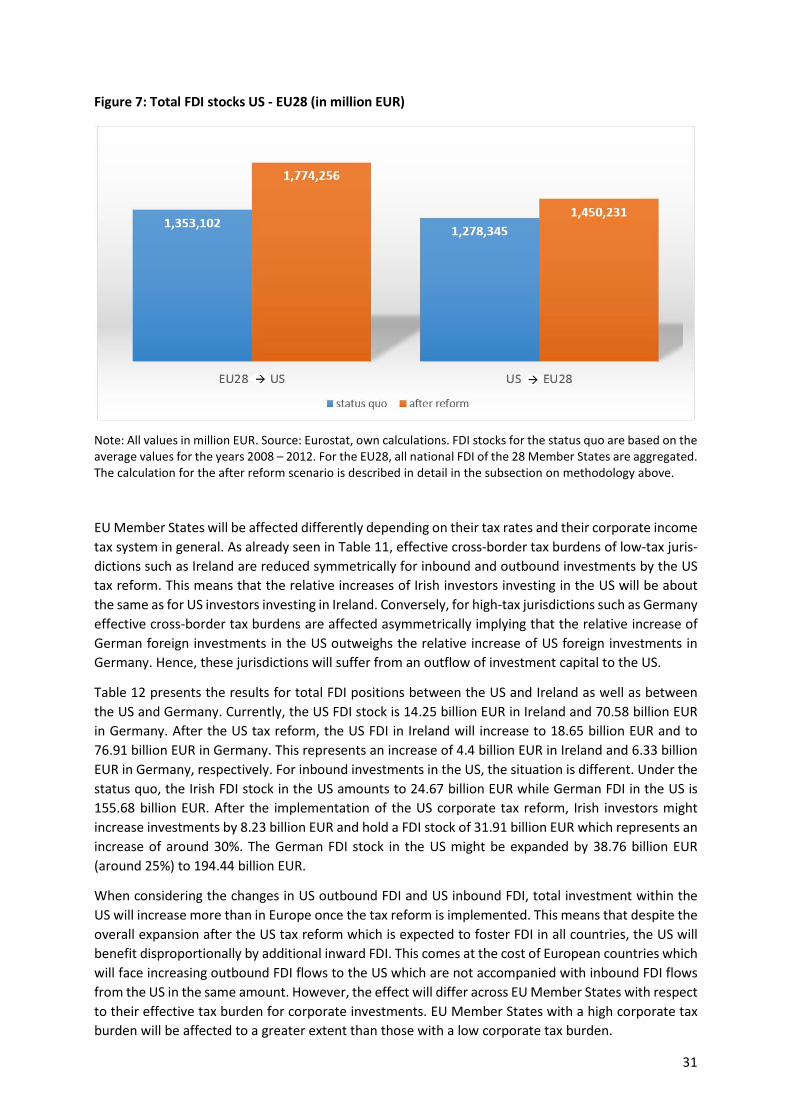
31
Figure 7: Total FDI stocks US - EU28 (in million EUR)
Note: All values in million EUR. Source: Eurostat, own calculations. FDI stocks for the status quo are based on the average values for the years 2008 – 2012. For the EU28, all national FDI of the 28 Member States are aggregated. The calculation for the after reform scenario is described in detail in the subsection on methodology above.
EU Member States will be affected differently depending on their tax rates and their corporate income tax system in general. As already seen in Table 11, effective cross-border tax burdens of low-tax juris-dictions such as Ireland are reduced symmetrically for inbound and outbound investments by the US tax reform. This means that the relative increases of Irish investors investing in the US will be about the same as for US investors investing in Ireland. Conversely, for high-tax jurisdictions such as Germany effective cross-border tax burdens are affected asymmetrically implying that the relative increase of German foreign investments in the US outweighs the relative increase of US foreign investments in Germany. Hence, these jurisdictions will suffer from an outflow of investment capital to the US.
Table 12 presents the results for total FDI positions between the US and Ireland as well as between the US and Germany. Currently, the US FDI stock is 14.25 billion EUR in Ireland and 70.58 billion EUR in Germany. After the US tax reform, the US FDI in Ireland will increase to 18.65 billion EUR and to 76.91 billion EUR in Germany. This represents an increase of 4.4 billion EUR in Ireland and 6.33 billion EUR in Germany, respectively. For inbound investments in the US, the situation is different. Under the status quo, the Irish FDI stock in the US amounts to 24.67 billion EUR while German FDI in the US is 155.68 billion EUR. After the implementation of the US corporate tax reform, Irish investors might increase investments by 8.23 billion EUR and hold a FDI stock of 31.91 billion EUR which represents an increase of around 30%. The German FDI stock in the US might be expanded by 38.76 billion EUR (around 25%) to 194.44 billion EUR.
When considering the changes in US outbound FDI and US inbound FDI, total investment within the US will increase more than in Europe once the tax reform is implemented. This means that despite the overall expansion after the US tax reform which is expected to foster FDI in all countries, the US will benefit disproportionally by additional inward FDI. This comes at the cost of European countries which will face increasing outbound FDI flows to the US which are not accompanied with inbound FDI flows from the US in the same amount. However, the effect will differ across EU Member States with respect to their effective tax burden for corporate investments. EU Member States with a high corporate tax burden will be affected to a greater extent than those with a low corporate tax burden.

32
Figure 8: Total bilateral FDI stocks for US - Germany and US - Ireland
Note: All values in million EUR. Source: Eurostat, own calculations. FDI stocks for the status quo are based on the average values for the years 2008 – 2012. The calculation for the after reform scenario is described in detail in the subsection on methodology above.
Effects on foreign direct investments by sectors Previous studies have shown that there exists substantial heterogeneity in the tax sensitivity of FDI across industries (see, e.g., Overesch and Wamser 2009). Investments in the manufacturing sector ex-hibit a semi-elasticity of -2.55 and react therefore stronger to changes in cross-border tax burdens than investments in the service sector with a semi-elasticity of -1.31. Hence, the US tax reform can be ex-pected to affect FDI in countries with a relatively large manufacturing sector to a greater extent.
Table 12 gives an overview of the expected effects of the US corporate tax reform on the service and manufacturing sectors. Inbound service FDI from Germany to the US amounts to more than twice the amount of outbound FDI from the US to Germany. In total, investors from European countries hold FDI in service-related industries worth 920.88 billion EUR and in the manufacturing sector worth 355.78 billion EUR. Conversely, US FDI in the in European manufacturing sector is worth 252.10 billion EUR and in the service sector approximately 994 billion EUR.
After the implementation of the US corporate tax reform, manufacturing FDI be particularly expanded. The US will attract additional inbound FDI of 113.5 billion EUR from investors located in the EU28. In particular, German FDI is expected to increase by more than 4 billion EUR and Irish FDI by almost 3 billion EUR. US manufacturing FDI can be expected to expand in the EU28 by only 34.76 billion EUR, of which Ireland receives 1.13 billion EUR and Germany only 713 million EUR. US FDI in the service sector in Europe will increase by 70.20 billion EUR. Relatively to the size of the economy, the increase in Ire-land (1.73 billion EUR) is substantially larger than that of Germany (2.95 billion EUR). For the US, an increase of 150.56 billion EUR in FDI stocks held by European investors is expected. A substantial share of this increase is contributed by German investors with over 18 billion EUR additional investments. The contribution of Irish investors is calculated at 2.45 billion EUR.
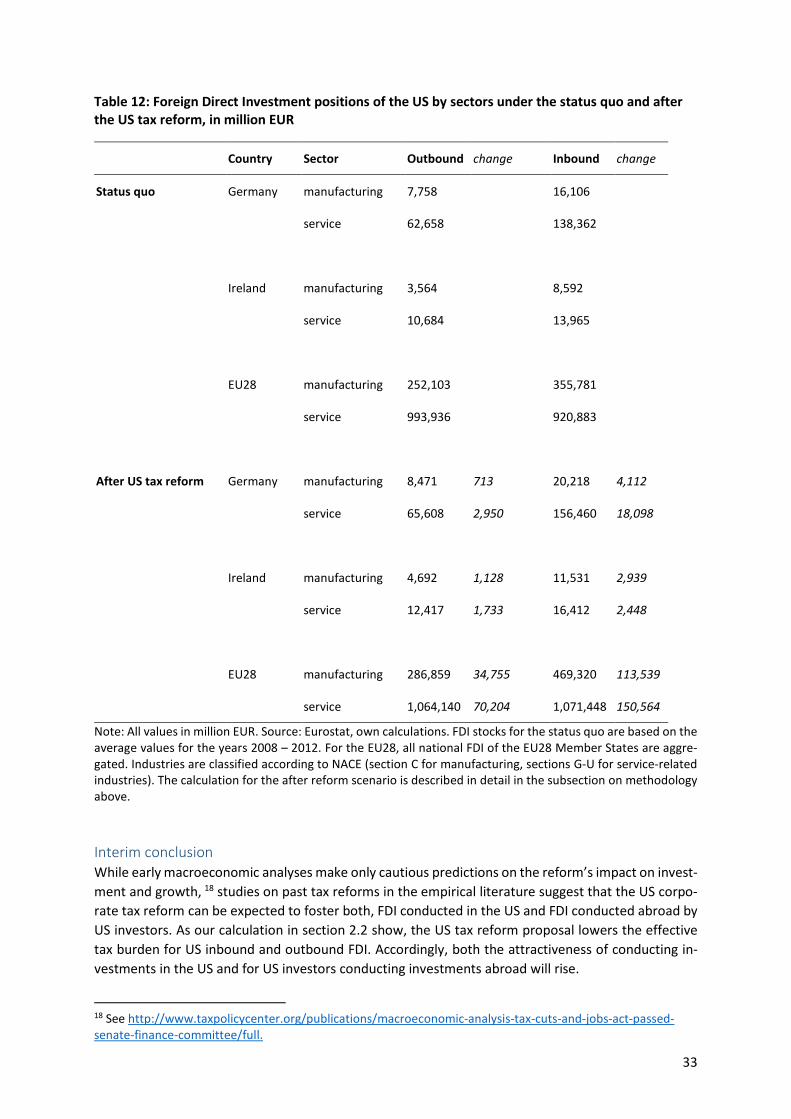
33
Table 12: Foreign Direct Investment positions of the US by sectors under the status quo and after the US tax reform, in million EUR
Country Sector Outbound change Inbound change
Status quo Germany manufacturing 7,758 16,106
service 62,658 138,362
Ireland manufacturing 3,564 8,592
service 10,684 13,965
EU28 manufacturing 252,103 355,781
service 993,936 920,883
After US tax reform Germany manufacturing 8,471 713 20,218 4,112
service 65,608 2,950 156,460 18,098
Ireland manufacturing 4,692 1,128 11,531 2,939
service 12,417 1,733 16,412 2,448
EU28 manufacturing 286,859 34,755 469,320 113,539
service 1,064,140 70,204 1,071,448 150,564
Note: All values in million EUR. Source: Eurostat, own calculations. FDI stocks for the status quo are based on the average values for the years 2008 – 2012. For the EU28, all national FDI of the EU28 Member States are aggre-gated. Industries are classified according to NACE (section C for manufacturing, sections G-U for service-related industries). The calculation for the after reform scenario is described in detail in the subsection on methodology above.
Interim conclusion While early macroeconomic analyses make only cautious predictions on the reform’s impact on invest-ment and growth, 18 studies on past tax reforms in the empirical literature suggest that the US corpo-rate tax reform can be expected to foster both, FDI conducted in the US and FDI conducted abroad by US investors. As our calculation in section 2.2 show, the US tax reform proposal lowers the effective tax burden for US inbound and outbound FDI. Accordingly, both the attractiveness of conducting in-vestments in the US and for US investors conducting investments abroad will rise.
18 See http://www.taxpolicycenter.org/publications/macroeconomic-analysis-tax-cuts-and-jobs-act-passed-senate-finance-committee/full.

34
Drawing on findings from existing literature, results of our simulation show for the US increases in both inbound and outbound FDI. Accordingly, EU Member States will also benefit from additional invest-ments in Europe conducted by US investors and additional investment opportunities in the US for Eu-ropean investors.
However, the US become significantly more attractive as investment location. The simulation of the expected changes in FDI show that the US can expect additional inbound FDI from the EU28 of 421.15 billion EUR while the additional outbound investment to Europe is predicted to be 171.89 billion EUR. This leads to a greater share of global investments located within the US accompanied with positive effects of additional capital for the US economy.
The relative increase in attractiveness of the US as investment location comes at the cost of European countries. Overall, the US might benefit from a substantial net inflow of European investment capital following the tax reform while substantial variation in the net inflow of investments across industries and European countries exists. In particular, European high-tax jurisdictions such as Germany will most likely be confronted with a higher net outflow of investments than European low-tax jurisdictions such as Ireland. Ultimately, the European high-tax jurisdictions will lose ground in the competition for FDI.

35
3. Potential countermeasures and parallel developments in European tax systems
The expected significant reduction in the statutory federal corporate income tax rate from currently 35% to 20% will presumably have a substantial impact on the location attractiveness of the US in global tax competition. As evident from Figure 6, the proposed corporate tax reform would improve the US competitive position relative to the EU Member States from being among the jurisdictions with the highest effective corporate tax burden to a jurisdiction with a comparatively moderate effective tax rate. Apart from competition aspects, the expected corporate tax reform will have further important implications for cross-border financing strategies of both US and European MNEs: Under the current rules, it is favorable for most European MNEs to finance new investment or subsidiaries in the US with debt (internal loans). In turn, an incentive towards equity financing may be induced for EU Member States where the effective tax burden is higher than in the US after the announced reform. Similarly, an incentive towards debt financing of US MNEs’ subsidiaries in Germany or other EU Member States with high effective tax levels will result (see, e.g., Bärsch/Olbert/Spengel 2017).
The resulting competitive pressure and changes in incentives for cross-border financing strategies could potentially lead to an erosion of European tax bases and an associated loss in tax revenue. There-fore, the aim of this chapter is to analyze potential defense mechanisms in European tax systems and to contrast the effects of the US tax reform with potential similar developments among EU Member States. In the following, first, current European initiatives against aggressive tax planning are intro-duced and evaluated with regard to their effectiveness to protect European tax bases. Second, the overall competitiveness of European tax systems is assessed.
3.1. European initiatives against aggressive tax planning Especially since 2012, the European Commission has actively participated in the development of a framework to prevent aggressive tax planning.19 In this context, five key areas for action were identi-fied and published in an action plan in 2015 (European Commission 2015). Thereby, the European Commission intends to find a coordinated, EU-wide approach for the implementation of the recom-mendations of the Base Erosion and Profit Shifting (BEPS) project of the OECD into the national tax systems of EU Member States and to contribute to the establishment of a fairer and more efficient tax system. To implement the results of the BEPS project in the national tax codes of the EU Member States, the Anti-Tax Avoidance Directive (2016/1164, ATAD)20 was adopted in record time in July 2016 after only five months of negotiation (recitals 1 and 2 of the ATAD). Furthermore, the European Commission resubmitted a directive proposal concerning the staged introduction of a Common Consolidated Cor-porate Tax Base (CCCTB) in October 2016. Besides, significant progress has been made towards achiev-ing more tax transparency through the introduction of a Country-by-Country-Reporting (CbCR). These initiatives and their interaction with the consequences of the proposed US tax reform are discussed in more detail in the following.
19 In December 2012, for instance, an action plan as well as two recommendations were published, see European Commission (2012a); European Commission (2012b); European Commission (2012c). 20 Council Directive (EU) 2016/1164 of 12 July 2016 laying down rules against tax avoidance practices that directly affect the functioning of the internal market, OJ 2016 L 193.

36
Anti-Tax Avoidance Directive (ATAD) The ATAD streamlines actions against aggressive tax planning in five key areas by establishing rules for a minimum standard including the introduction of an interest deduction limitation rule (Art. 4), a com-mon approach for exit taxation (Art. 5), a controlled foreign company (CFC) rule (Art. 7/8) as well as rules against hybrid mismatch arrangements (Art. 9).21 Furthermore, a general anti-abuse rule (Art. 6) is supposed to step in if none of the more specific rules applies. By 31 December 2018, EU Member States will have to newly introduce or amend their existing anti-avoidance provisions in line with the specifications of the ATAD and apply them as of 1 January 2019 (Art. 11 (1)).22 Since the proposed US tax reform will presumably have a strong impact on cross-border financing strategies, the following further examination of the ATAD is limited to the proposed minimum stand-ards for interest deduction limitation rules as well as CFC legislation. Interest deduction limitation rule (Art. 4 ATAD) MNEs often use cross-border debt financing to exploit international tax rate differentials (e.g. Huizinga and Laeven 2008). Therefore, interest deduction limitation rules have become an important instru-ment to limit the loss of taxable income by means of cross-border debt shifting. Currently, 20 out of 28 EU Member States dispose of a general rule to limit the tax deductibility of interest.23 According to Art. 4 (1) of the ATAD, EU Member States have to introduce an earnings stripping rule which limits the amount of deductible interest to 30% of a corporation’s earnings before interest, tax, depreciation and amortization (EBITDA). In addition, EU Member States may include a safe haven rule which allows full interest deductibility if payments do not exceed a threshold of 3 million EUR or in case the taxpayer does not belong to a group of companies (Art. 4 (3)). Furthermore, EU Member States have different possibilities for the inclusion and design of a rule for the carry forward or carry back of non-deductible interest (Art. 4 (6)). In general, the compulsory introduction of an interest deduction limitation rule prevents the excessive deductibility of interest expenses and associated shift of taxable income to jurisdictions with a lower effective tax level. Thus, although especially EU Member States with high effective tax levels might prefer to invest into the US via debt, the benefit of debt financing and associated erosion of the do-mestic tax bases through excessive interest deductibility can be limited by means of interest deduction limitation rules. However, the implementation of interest deduction limitation rules could equally lead to an increased risk of double taxation in case interest expenses are not fully deductible while the corresponding interest income is fully taxed at the level of the recipient (Navarro/Parada/Schwarz 2016). Furthermore, the rules laid out in Art. 4 ATAD correspond to the German interest deduction limitation rule in section 4h of the German income tax code (EStG). The German Federal Fiscal Court however held that the German interest deduction limitation rules would violate the constitutional principle of
21 A second directive amended the provisions by rules for hybrid mismatches in relation to third countries in May 2017 (Council Directive (EU) 2017/952 of 29 May 2017 amending Directive (EU) 2016/1164 as regards hybrid mismatches with third countries, OJ 2017 L 144 (“ATAD 2”)). 22 This time limit, however, does not apply for the rules on exit taxation that have to be implemented by the end of 2019 and applied as of 2020 (Art. 11 (5)). In case a EU Member State already disposes of a different, but equally effective interest deduction limitation rule, the minimum standard set out in the ATAD has to be applied only as of 2024 (Art. 11 (6)). 23 For an overview on the development of interest deduction limitation rules in the EU between 1998 and 2015, see Bräutigam/Spengel/Stutzenberger (2017).
37
equal treatment and subsequently referred the question of constitutionality to the German Federal Constitutional Court in October 2015 (Bundesfinanzhof, decision of 14 October 2015, I R 20/15). The compulsory introduction of an equally controversial rule at EU level seems highly questionable. Espe-cially for German taxpayers, high legal uncertainty might result. CFC legislation (Art. 7/8 ATAD) In general, CFC rules are anti-avoidance measures that target the extensive use of affiliates in low-tax jurisdictions which earn only “passive” income (Dahlberg and Wiman 2013, Endres and Spengel 2015, Bräutigam/Spengel/Streif 2017). To date, 13 EU Member States have adopted such provisions that – based on specific national requirements regarding for instance the level of control, qualifying income or effective tax rate of the CFC – prescribe the attribution of the income of a low-taxed foreign subsid-iary to the taxable income of a controlling domestic parent company. By the end of 2018, EU Member States are obliged to introduce a CFC rule that is in line with the minimum standard CFC rule estab-lished in Art. 7/8 of the ATAD. The attribution of undistributed income of a foreign subsidiary to the parent company is based on three requirements: First, the foreign subsidiary should be “controlled” by a resident investor with a direct or indirect shareholding of more than 50% of the voting rights, capital or profits (Art. 7 (1) a)). Second, the tax paid by the foreign entity is considered unacceptably low in case it is lower than the difference between the corporate tax that would have been charged on the entity according to the tax rules of the residence state of the controlling shareholder and the actual tax paid (Art. 7 (1) b)). This condition is essentially satisfied in case foreign taxation is lower than 50% of the respective domestic tax burden. In this respect, only the statutory corporate income tax rate is relevant, whereas the rules do not apply with regard to other taxes such as for instance the German trade tax or solidarity sur-charge (Schönfeld 2017). Third, if the above conditions are met, Art. 7 (2) of the ATAD specifies the income that has to be attributed to the parent company: On the one hand, the income could be defined as derived from one of the categories of passive income listed in subparagraph a) if the CFC does not carry out any “substantive economic activity”. If the CFC is not resident in a country that belongs to the European Economic Area (EEA), however, EU Member States do not have to apply the substance requirement. On the other hand, the attributable income may be determined based on a principle purpose test (b)). In general, thus, CFC legislation shall only apply with regard to passive income derived by the controlled foreign entity. In case European MNEs decide to relocate their productive assets or real business ac-tivities to the US upon the announced tax reform, the resulting active income should usually avoid the application of CFC legislation (Bärsch/Olbert/Spengel 2017). On the contrary, for passive income that a CFC derives from sales, service or financial activities (Art. 7 (2) a) iv) – vi)), for instance, CFC rules could be applicable if the entity does not carry on “a substantive economic activity supported by staff, equipment, assets and premises, as evidenced by relevant facts and circumstances” (Art. 7 (2) a)). However, EU Member States may refrain from applying the substance requirement in case the CFC is not resident or situated in a country that belongs to the EEA, such as the US. Besides, for MNEs with fragmented and integrated business models where functions are spread across various affiliates, it could prove difficult to satisfy the substance requirement (Bärsch/Olbert/Spengel 2017). To evaluate whether US subsidiaries of high-taxed European MNEs are exposed to CFC legislation un-der the minimum standard rule of the ATAD, a US corporate income tax rate of 20% as proposed in the draft bill is compared to the 50% domestic tax rate threshold specified by the ATAD. The statutory corporate income tax rates of the EU Member States as of 2017 as well as the respective threshold for the applicability of CFC legislation are illustrated in Table 13 in the Appendix. It is apparent that even

38
in EU Member States where effective tax levels are considerably higher than in the US, US subsidiaries do not qualify as a low-taxed CFC according to the rules of the ATAD. On the one hand, this could be the result of a mere consideration of the statutory corporate income tax rate for the determination of an unacceptably low taxation. On the other hand, although a reduction of the US corporate income tax rate to 20% would be remarkable, such a rate would not be extraordinarily low, but almost equal to the current average European statutory corporate income tax rate of 20.5%. Therefore, the mini-mum standard CFC rule established by the ATAD does not constitute an effective instrument to avoid a shift of income from high-taxed European MNEs to lower-taxed US subsidiaries. In general, the ATAD only stipulates the specifications for a minimum standard level of protection. Hence, EU Member States are free to introduce or maintain even stricter rules if the circumstances of their national tax framework require them to do so (recitals 2 and 3 of the ATAD). In EU Member States with a high statutory corporate income tax rate such as France or Belgium, for instance, a threshold of 60% would be sufficient for CFC rules to apply. Other EU Member States such as Austria or Sweden where tax rates are only slightly higher than the assumed US corporate income tax rate of 20% would require delusive thresholds of more than 80% or even 90% to trigger the application of CFC legislation in relation to US entities. In 16 out of 28 EU Member States including Germany, the statutory corporate income tax rate is equal to or even lower than the post-reform US corporate income tax rate such that CFC legislation cannot be triggered in these EU Member States at all under the rules of the ATAD. As a whole, the ATAD is no effective instrument to ensure a sufficient level of protection against the risk of tax base erosion in the EU upon the proposed US corporate tax reform. Whereas CFC legislation is not even applicable under the threshold for “low” taxation as defined in Art. 7 of the ATAD, the interest deduction limitation rule is likely to enhance the risk of double taxation and creates legal un-certainty.
Country-by-Country Reporting (CbCR) To achieve more transparency in financial reporting, initiatives for the introduction of a CbCR have been launched at both OECD24 and EU level. In general, CbCR is based on the disclosure of key financial or tax data to the fiscal authorities involved. The data to be disclosed includes - among others - infor-mation on profits, taxes paid in each country a MNE operates in, assets as well as the number of em-ployees (OECD 2015a). Based on this disclosure, national tax authorities should be able to detect abu-sive tax planning arrangements. Besides, proponents of CbCR argue that CbCR exerts pressure on com-panies to pay taxes at the actual place of value creation and contributes to the efficiency of tax admin-istration (Evers/Meier/Spengel 2014).
Based on the OECD’s recommendations in the BEPS project, a directive (2016/881)25 was enacted by the EU legislative bodies that stipulates the introduction of a comprehensive CbCR for large European MNEs. Furthermore, despite the explicit recommendation of the OECD, the European Commission has issued a draft directive that would mandate all MNEs to publicly disclose their CbCR data in a public register and on their webpage (European Commission 2016a). In a first reading, the European Parlia-ment has approved this draft and has thus further advanced the legislative process (European Parlia-ment 2017).
24 See Actions 11-13 of the OECD BEPS Project. 25 Council Directive (EU) 2016/881 of 25 May 2016 amending Directive 2011/16/EU as regards mandatory auto-matic exchange of information in the field of taxation, OJ 2016 L 146/8.
39
Especially the imminent introduction of a public CbCR could significantly harm the attractiveness of the EU Member States as potential investment locations for US FDI. According to the draft directive, worldwide disclosure obligations would not only affect EU groups, but also EU subsidiaries of a non-EU parent corporation with consolidated group income of more than EUR 750 Million. In consequence, MNEs with EU subsidiaries could be at a clear competitive disadvantage if compared to peer companies without operations in the EU: In the report, corporations would have to publicly disclose confidential internal information. This could enable competitors outside the scope of the disclosure obligations – either because they fall short of the size threshold or because they do not have any EU establishment – to derive conclusions on geographical positioning, cost structures and production processes as well as the value of goods used (among others Evers/Meier/Spengel 2016). In consequence, US MNEs might consider to relocate existing EU subsidiaries to third countries and further also refrain from setting up a presence in the EU (Dutt/Spengel/Vay 2017).
Although CbCR could lead to more transparency regarding abusive tax planning structures, it places another compliance burden on corporate taxpayers and cannot contribute to maintaining or improving tax revenues in the EU Member States. On the contrary, in particular a public CbCR in the EU might rather entail significant competitive disadvantages for MNEs with subsidiaries in the EU as compared to MNEs operating only in third countries. In consequence, (public) CbCR could harm the attractiveness of the EU as a location for (new) investment.
Common (Consolidated) Corporate Tax Base (CC(C)TB) In October 2016, the European Commission relaunched two draft directives for the introduction of a CCCTB (European Commission 2016b (“CCTB draft directive”); European Commission 2016c (“CCCTB draft directive”)). Apart from new elements such as the introduction of a notional interest deduction (“Allowance for Growth and Investment” (AGI), Art. 11 CCTB draft directive), a super-deduction for expenses on research and development (R&D, Art. 9 (3) CCTB draft directive) as well as the possibility of a cross-border loss offset (Art. 42 CCTB draft directive), the proposals mainly build upon a draft directive that was issued in 2011 (European Commission 2011). The new draft directives, however, envision a staged introduction of the CCCTB: First, EU Member States shall adopt a set of harmonized rules for the introduction of a common corporate tax base (CCTB) that is mandatory for all European Corporations with consolidated group revenues of more than EUR 750 million by the end of 2018. In a second step, corporate group members’ corporate tax bases shall be consolidated and allocated to the group members according to a three-part formula based on labor, assets and sales of the group in each EU Member State by the end of 2020.
With the CCCTB, the European Commission intends to remove fiscal barriers as well as competitive disadvantages within the EU by means of a simplification and harmonization of the corporate tax codes. Besides, the CCCTB should ensure the taxation of corporate profits at the place of value creation and thus contribute to the fairness of the international tax system (European Commission 2016c). In this context, the CCTB draft directive further includes a harmonized approach against aggressive tax planning and stipulates a common standard for the anti-avoidance rules laid down in the ATAD (Art. 13 as well as Art. 58-61a).
Subject to the degree of harmonization, fiscal barriers to cross-border trade within the EU can be mit-igated to a different extent: The mere harmonization of the rules for the determination of the corpo-rate income tax base (CCTB) would lead to a decrease in tax compliance costs. Consolidation and for-mulary apportionment (CCCTB), however, would fully eliminate incentives to shift book profits among subsidiaries through financing structures or transfer prices within the EU (Spengel 2008).
40
Since the CCCTB is only applicable to corporations that are established in the EU, incentives for tax planning cannot be avoided with regard to third countries such as the US, though. In addition, even new tax planning strategies could emerge from a decrease in the US corporate income tax rate: Cross-border loss offset is granted under the CCTB and is further achieved through group consolidation under a CCCTB. Hence, US MNEs with a high effective tax burden in Europe might be incentivized to shift loss-making assets to the EU with the aim of lowering their worldwide tax burden through consolidation.
In sum, the introduction of a CCCTB is only a suitable instrument to avoid aggressive tax planning within the EU and lacks such ability with regard to third countries. Furthermore, new tax planning opportuni-ties could arise for US MNEs by means of factor shifting. Unanimous consensus among EU Member States regarding the adoption of the CC(C)TB draft directives in the near future nevertheless seems unlikely due to the broad scope of the newly introduced elements: The AGI, R&D super-deduction and cross-border loss offset regime could lead to narrower tax bases. To finance the associated fiscal rev-enue losses, corporate income tax rates would have to be increased (Spengel et al. 2016; Spengel and Nicolay 2017). Against the background of the announced tax rate reduction in the US, an increase in corporate tax rates in the EU could negatively affect its attractiveness as a location for profitable in-vestment.
Further unilateral defense mechanisms To limit the effects of harmful tax competition by means of preferential regimes such as intellectual property (IP) box regimes, no specific measures have been introduced at EU level. Instead, preferential IP box regimes that are deemed to be harmful should be abolished or adapted according to the speci-fications laid out in the OECD BEPS project by July 2021 (OECD 2015b): According to the “modified nexus approach” that was established by the OECD, a taxpayer may only benefit from an IP regime to the extent that R&D expenditures that gave rise to the IP income were incurred (OECD 2015b).
Despite the availability of a grandfathering rule, a rule that limits the deductibility of royalty payments was introduced to anticipate the application of the nexus approach in Germany in June 2017. Austria enacted a similar rule already in 2014 (Peyerl 2014). According to the new section 4j of the German income tax code, the deductibility of royalty payments is partially denied in case the corresponding royalty income is subject to low taxation in a preferential regime that is not in line with the nexus approach. This rule, however, would not prevent a tax base erosion via license payments from high-tax Germany to the low-tax US after the proposed tax reform. Although the proposed US tax rate cut might induce an incentive to re-locate IP to the US and reduce the German tax base through the asso-ciated license payments, the applicability of section 4j EStG is limited to situations where IP income is taxed under a specific preferential IP regime. Unless such a regime is introduced in the US, section 4j EStG is not relevant in the context of the proposed US corporate tax reform.
Evaluation and deficiencies of the current approaches In sum, the above initiatives do not provide for a desirable degree of protection against the erosion of tax bases in the EU upon the announced tax reform in the US and could further have unintended neg-ative effects for the European common market. Already today, the parallel application and administra-tion of 28 different tax systems in the EU is associated with significant fiscal barriers to cross-border trade such as high compliance costs as well as double taxation due to conflicting taxing rights, qualifi-cation conflicts or transfer pricing issues (European Commission 2001a and 2001b). Further fragmen-
41
tation by different national approaches regarding the implementation of the minimum standard es-tablished by the ATAD as well as the introduction of unilateral defense mechanisms could even aggra-vate existing problems and would thereby jeopardize the competitiveness of the EU in worldwide tax competition (Dourado 2016, Ginevra 2017).
Based on the inapplicability of the CFC rules, for instance, it could be argued that the rules laid out in the ATAD are not strict enough to prevent the erosion of European tax bases upon the announced reduction of the US corporate income tax rate. Regarding the threshold for the definition of an unac-ceptably low taxation, for example, the definition in Art. 7 (1) b) of the ATAD falls short of the definition in the current German CFC rule. With a corporate income tax rate of 20% which is below the threshold of 25% in section 8 (3) of the German foreign tax act (AStG), current German CFC rules would apply for passive income of US subsidiaries controlled by a German parent corporation. In contrast, under the standard of the ATAD, the US corporate income tax rate would have to be lower than 7.5% for CFC legislation to apply in Germany (see Table 13 in the Appendix). However, the introduction of even stricter anti-avoidance rules is likely to be associated with negative investment effects: The median semi-elasticity of FDI has been shown to correspond to a value of 2.49 in absolute terms (Feld and Heckemeyer 2011). This means that FDI in a country is assumed to decrease by 2.49% in case the tax rate increases by one percentage point. By means of anti-avoidance measures such as ATAD and CbCR, the effective tax burden in a country becomes a much more decisive criterion in international location decisions. In EU Member States with high effective tax levels, stricter anti-avoidance provisions could thus lead to a significant reduction of real investments whereas at the same time, the US become a more attractive investment location. This is especially relevant when considering the tax semi-elasticity of pre-tax profit that amounts to about 0.8 in absolute terms (Heckemeyer and Overesch 2017). The reported profit thus presumably decreases by 0.8% if the tax rate differential that can be exploited for tax arbitrage increases by one percentage point.
Against the background of the above findings, it is indispensable for the EU Member States to adopt an active and coordinated approach to enhance the attractiveness of the EU as investment location rather than relying on mere defensive measures. At present, single EU Member States have already implemented or announced some reforms with the aim to enhance the attractiveness of their national tax systems as further discussed in the following.
3.2. Outlook: Tax competition in the EU In general, corporate tax competition in the EU has predominantly been characterized by declining corporate income tax rates and broader corporate income tax bases (so-called “tax rate cut cum tax base broadening”). Especially during recent years, interest deduction limitation rules as well as loss compensation rules have become important fiscal instruments to achieve broader tax bases that should compensate for decreases in the corporate income tax rates (Bräutigam/Spengel/Stutzen-berger 2017). As opposed to the development in many other EU Member States, however, the German corporate tax framework has predominantly remained unchanged since the latest corporate income tax reform in 2008.
Since then, tax policy has primarily focused on the mere elimination of unconstitutional provisions. Due to higher trade tax rates, the overall effective tax level in Germany has increased which runs con-trary to the common declining trend in the EU (Spengel and Bräutigam 2015). In consequence, the tax attractiveness of Germany as an investment location has rather declined during the last ten years which further enhances competitive pressure and the need for tax reform.

42
In the near future, tax competition in the EU is likely to persist. On the one hand, tax competition will be driven by EU Member States themselves: In France, for instance, the 2018 finance bill envisages a gradual reduction of the corporate income tax rate from currently 33.33% to 25% by 2022 (Deloitte 2017). Furthermore, corporate income tax rates were in part remarkably reduced in Croatia, Hungary, Italy, Luxembourg and in the Slovak Republic in 2017.26 Besides, after the intended withdrawal from the EU, the United Kingdom plans to have the lowest corporate tax rate among the world’s 20 biggest economies which should be achieved by decreasing the statutory rate from currently 20% to 17% by 2020 (Dominiczak and Hughes 2016). On the other hand, the proposed US reform will presumably influence the competitive situation in Europe as well: The tax rate reduction initiated by the Tax Re-form Act of 1986 led to a decline in corporate income tax rates in many other countries as well (Altshuler and Goodspeed 2015). Likewise, any future reduction of the US corporate income tax rate could further encourage tax competition in the EU.
Figure 9 illustrates the outcomes of implementing the tax reforms of 2017-2020 in the Devereux and Griffith model in the case of a domestic investment. The columns show a new ranking of the countries in our sample according to their effective taxation and statutory CIT rates. The numbers specify by how much the tax measures change after the reforms are implemented as compared to the status quo shown in Figure 2. It is evident that the cost of capital, EATRs and CIT rates substantially decrease after the implementation of the reforms. The only exemption is Slovenia, where the statutory CIT rate in-creases from 17% to 19% after its tax reform. The biggest drop in the tax burden occurs in France, where the cost of capital decreases by 0.8 percentage points, EATR falls by 11.6 percentage points and the combined statutory CIT rate drops by 9.4 percentage points. This leads to France moving ahead of Germany in the international ranking shown in Figure 9. The other major decreases can be observed in Hungary, Italy and the United Kingdom. In these jurisdictions, the EATR falls by respectively 9, 3.1 and 2.9 percentage points. As a result, Germany becomes a jurisdiction with the fourth highest taxation in our sample.
In principle, anti-avoidance measures such as the interest deduction limitation rule that has to be in-troduced according to the ATAD could allow several EU Member States to reduce their corporate in-come tax rates due to the associated tax base broadening effect. However, it is arguable whether tax competition by ever lower corporate tax rates is sustainable. EU Member States might have only few possibilities left to further broaden their tax bases in order to balance revenue losses associated with lower tax rates. Furthermore, the partial non-deductibility of operating costs through interest deduc-tion limitation rules or loss compensation rules as a means to achieve broader tax bases could lead to an enhanced substance taxation which is especially problematic during economic downturns (Bräutigam/Spengel/Stutzenberger 2017). Hence, instead of focusing on the reduction of corporate income tax rates, EU Member States should rather establish an attractive environment for investments of MNEs, for instance by the introduction or advancement of tax incentives for R&D. In turn, this could allow EU Member States to maintain comparatively high statutory tax rates (Devereux and Loretz 2013).
26 The statutory corporate income tax rate was reduced from 20% in 2016 to 18% in 2017 in Croatia, from 27.5% to 24% in Italy, from 21% to 19% in Luxembourg and from 22% to 21% in the Slovak Republic. In Hun-gary, the progressive rates of 10% and 19% were reduced to a flat rate of 9%. In contrast, the statutory rate was increased from 17% to 19% in Slovenia.
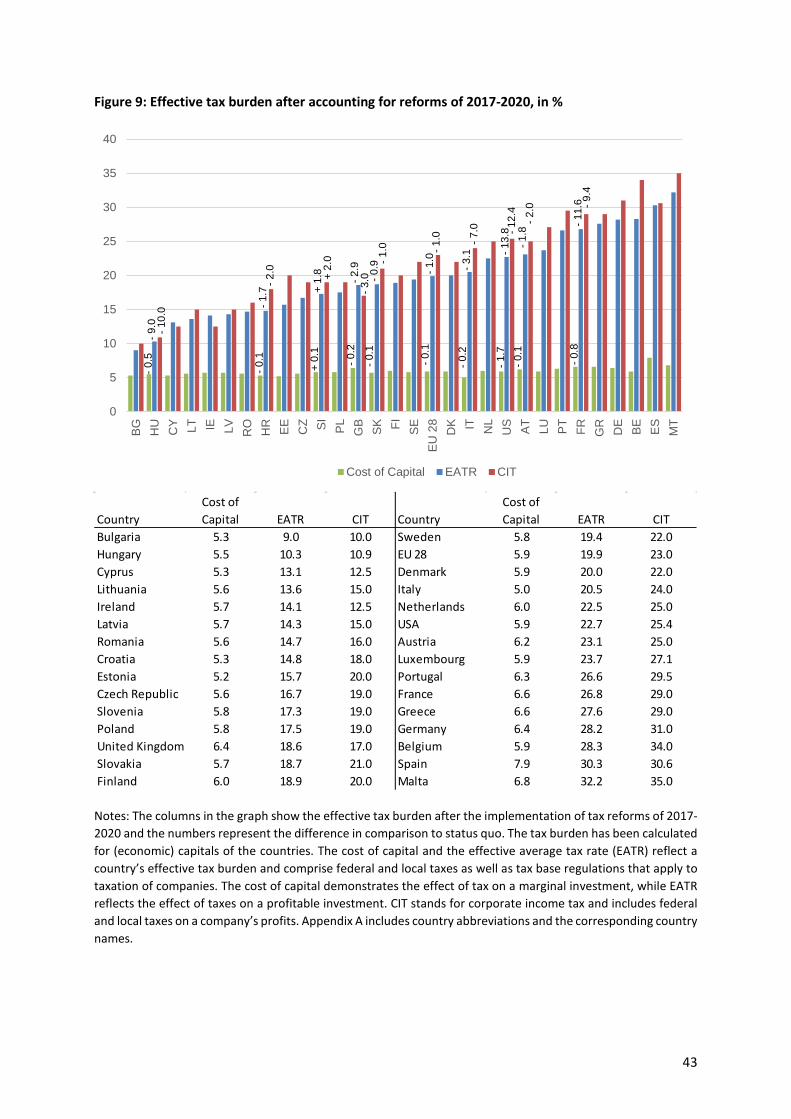
43
Figure 9: Effective tax burden after accounting for reforms of 2017-2020, in %
Notes: The columns in the graph show the effective tax burden after the implementation of tax reforms of 2017-2020 and the numbers represent the difference in comparison to status quo. The tax burden has been calculated for (economic) capitals of the countries. The cost of capital and the effective average tax rate (EATR) reflect a country’s effective tax burden and comprise federal and local taxes as well as tax base regulations that apply to taxation of companies. The cost of capital demonstrates the effect of tax on a marginal investment, while EATR reflects the effect of taxes on a profitable investment. CIT stands for corporate income tax and includes federal and local taxes on a company’s profits. Appendix A includes country abbreviations and the corresponding country names.
0
5
10
15
20
25
30
35
40B
G HU CY LT IE LV RO HR EE CZ SI
PL
GB SK FI SE
EU
28
DK IT NL
US AT
LU PT
FR GR DE BE
ES
MT
Cost of Capital EATR CIT
-0.5
-9.0
-0.1
-1.7
+ 0.
1+
1.8
-0.2
-2.9
-0.1
-0.9
-0.1
-1.0
-0.2
-3.1
-0.1
-1.8
-1.7
-13.
8
-0.8
-11.
6
-10.
0
-2.0 + 2.
0
-3.0
-1.0 -1
.0 -7.0
-2.0
-12.
4 -9.4
CountryCost of Capital EATR CIT Country
Cost of Capital EATR CIT
Bulgaria 5.3 9.0 10.0 Sweden 5.8 19.4 22.0Hungary 5.5 10.3 10.9 EU 28 5.9 19.9 23.0Cyprus 5.3 13.1 12.5 Denmark 5.9 20.0 22.0Lithuania 5.6 13.6 15.0 Italy 5.0 20.5 24.0Ireland 5.7 14.1 12.5 Netherlands 6.0 22.5 25.0Latvia 5.7 14.3 15.0 USA 5.9 22.7 25.4Romania 5.6 14.7 16.0 Austria 6.2 23.1 25.0Croatia 5.3 14.8 18.0 Luxembourg 5.9 23.7 27.1Estonia 5.2 15.7 20.0 Portugal 6.3 26.6 29.5Czech Republic 5.6 16.7 19.0 France 6.6 26.8 29.0Slovenia 5.8 17.3 19.0 Greece 6.6 27.6 29.0Poland 5.8 17.5 19.0 Germany 6.4 28.2 31.0United Kingdom 6.4 18.6 17.0 Belgium 5.9 28.3 34.0Slovakia 5.7 18.7 21.0 Spain 7.9 30.3 30.6Finland 6.0 18.9 20.0 Malta 6.8 32.2 35.0


45
Literature Altshuler, R./Goodspeed, T.J. (2015): Follow the Leader? Evidence on European and US Tax Competi-tion, Public Finance Review, Vol. 43, No. 4, 485-504.
Atwood, T.J./Drake, M. S./Myers, J. N./Myers, L. A. (2012): Home Country Tax System Characteristics and Corporate Tax Avoidance: International Evidence, The Accounting Review, Vol. 87, No. 6, 1831-1860.
Auerbach, A./Devereux, M./Keen, M./Vella, J. (2017): Destination-Based Cash Flow Taxation, OUCBT Working Paper 17/01.
Avi-Yonah, R./Mazzoni, G. (2017): The Trump Tax Reform Plan: Implications for Europe, Bulletin for International Taxation, Vol. 71, No. 61, 8-14.
Bärsch, S.-E./Olbert, M./Spengel, C. (2017): US Tax Reform: The Implications in a Germany-US Context, Bulletin For International Taxation, Vol. 71, No. 6a, 22-29.
Blouin, J./Krull, L. (2009): Bringing it home: A study of the incentives surrounding the repatriation of foreign earnings under the American Jobs Creation Act of 2004, Journal of Accounting Research, Vol. 47, 1027-1059.
Bräutigam, R./Spengel, C./Streif, F. (2017): Decline of Controlled Foreign Company Rules and Rise of Intellectual Property Boxes: How the European Court of Justice Affects Tax Competition and Economic Distortions in Europe, Fiscal Studies, forthcoming.
Bräutigam, R./Spengel, C./Stutzenberger, K. (2017): The Development of Corporate Tax Structures from 1998 to 2015 – Qualitative and Quantitative Analysis, ZEW Discussion Paper No. 17-034, Mann-heim.
Clausing, K. A. (2016): Competitiveness, Tax Base Erosion, and the Essential Dilemma of Corporate Tax Reform, BYU Law Review, Vol. 6, 1649-1679.
Dahlberg, M./Wiman, B. (2013): General Report, in: International Fiscal Association, The taxation of foreign passive income for groups of companies, Rotterdam, 17-56.
Deloitte (2017): France alert – Finance bill for 2018 published, https://www2.deloitte.com/con-tent/dam/Deloitte/global/Documents/Tax/dttl-tax-alert-france-28-september-2017.pdf, accessed on 02 November 2017.
De Simone, L. (2017): Can the GOP Fix the Corporate Income Tax?, https://www.gsb.stanford.edu/in-sights/can-gop-fix-corporate-income-tax, accessed on 01 September 2017.
Devereux, M./Griffith, R. (1999): The Taxation of Discrete Investment Choices, The Institute for Fiscal Studies Working Paper Series, No. W98/16 (Revision 2).
Devereux, M./Griffith, R. (2003): Evaluating Tax Policy for Location Decisions, International Tax and Public Finance, Vol. 10, No. 2, 107-126.
Devereux, M./Habu, K./Lepoev, S./Maffini, G. (2016): G20 Corporation Tax Ranking, Policy Paper Se-ries, Oxford Centre for Business Taxation, March 2016.
Devereux, M./Lockwood, B./Redoano, M. (2008): Do Countries Compete over Corporate Tax Rates?, Journal of Public Economics, Vol. 92, 1210-1235.

46
Devereux, M./Loretz, S. (2013): What do we know about corporate tax competition?, National Tax Journal, Vol. 66, No. 3, 745-774.
DIHK (2017): Ergebnisse der DIHK-Hebesatzumfrage 2017 unter allen Gemeinden in Deutschland ab 20.000 Einwohnern, https://www.ihk-niederrhein.de/downloads/ihk/dihk-hebesatzumfrage-2017-im-ueberblick.pdf
Dominiczak, P./Hughes, L. (2016): Theresa May to give Britain lowest corporation tax of world’s top 20 economies, http://www.telegraph.co.uk/news/2016/11/21/theresa-may-to-offer-business-an-olive-branch-with-hint-of-futur/, accessed on 02 November 2017.
Dourado, A.P. (2016): The EU Anti Tax Avoidance Package: Moving Ahead of BEPS?, Intertax, Vol. 44, No. 6/7, 440-446.
Dutt, V./Spengel, C./Vay, H. (2017): Der EU-Vorschlag zum Country-by-Country Reporting im Internet: Kosten, Nutzen, Konsequenzen, Stiftung Familienunternehmen, Munich.
Endres, D./Spengel, C. (2015): International Company Taxation and Tax Planning, Kluwer Law Interna-tional, Alphen aan Den Rijn.
European Commission (2001a): Towards an Internal Market without tax obstacles: A strategy for providing companies with a consolidated corporate tax base for their EU-wide activities, COM(2001) 582 final, Brussels.
European Commission (2001b): Company Taxation in the Internal Market, Commission Staff Working Paper SEC(2001) 1681, Brussels.
European Commission (2002): Company Taxation in the Internal Market, Commission Staff Working Paper COM(2001) 582 final, Brussels.
European Commission (2011): Proposal for a Council Directive on a Common Consolidated Corporate Tax Base (CCCTB), COM(2011) 121/4, Brussels.
European Commission (2012a): An Action Plan to strengthen the fight against tax fraud and tax eva-sion, COM(2012) 722 final, Brussels.
European Commission (2012b): Commission Recommendation of 6.12.2012 regarding measures in-tended to encourage third countries to apply minimum standards of good governance in tax matters, C(2012) 8805 final, Brussels.
European Commission (2012c): Commission Recommendation of 6.12.2012 on aggressive tax plan-ning, C(2012) 8806 final, Brussels.
European Commission (2015): A Fair and Efficient Corporate Tax System in the European Union: 5 Key Areas for Action, COM(2015) 302 final, Brussels.
European Commission (2016a): Proposal for a Directive of the European Parliament and of the Council amending Directive 2013/34/EU as regards disclosure of income tax information by certain undertak-ings and branches, COM(2016) 198 final, Strasbourg.
European Commission (2016b): Proposal for a Council Directive on a Common Corporate Tax Base, COM(2016) 685 final, Strasbourg.
European Commission (2016c): Proposal for a Council Directive on a Common Consolidated Corporate Tax Base (CCCTB), COM(2016) 683 final, Strasbourg.

47
European Commission/ZEW (2016): The Effect of Inflation and Interest Rates on Forward-Looking Ef-fective Tax Rates, EU Commission Taxation Papers Working Paper, No. 63.
European Parliament (2017): Amendments adopted by the European Parliament on 4 July 2017 on the proposal for a directive of the European Parliament and of the Council amending Directive 2013/34/EU as regards disclosure of income tax information by certain undertakings and branches (COM(2016)0198 – C8-0146/2016 – 2016/0107(COD)), P8_TA-PROV(2017)0284.
Evers, M.T./Meier, I./Spengel, C. (2014): Transparency in Financial Reporting: Is Country-by-Country Reporting Suitable to Combat International Profit Shifting?, Bulletin for International Taxation, Vol. 68, No. 6/7, 295-303.
Evers, M.T./Meier, I./Spengel, C. (2016): Country-by-Country Reporting: Tension between Transpar-ency and Tax Planning, ZEW Discussion Paper No. 17-008, Mannheim.
EY (2017): Tax News Update 14 November 2017, https://taxnews.ey.com/news/2017-1917-jct-re-leases-explanation-of-international-provisions-of-senate-tax-reform-proposal, accessed on05 Decem-ber 2017.
Feld, L./Heckemeyer, J. (2011): FDI and Taxation: A Meta-Study, Journal of Economic Surveys, Vol. 25, No.2, 233-272.
Feld, L./Ruf, M./Scheuering, U./Voget, J. (2016): Repatriation Taxes and Outbound M&As, Journal of Public Economics, Vol. 139, 13-27.
Feldstein, M. (2000): Aspects of Global Economic Integration: Outlook for the Future, No 7899, NBER Working Papers.
Fuest, C./Huber, B./Mintz, J. (2005): Foundations and Trends in Microeconomics, 2005, Vol. 1, No. 1, 1-62.
Ginevra, G. (2017): The EU Anti-Tax Avoidance Directive and the Base Erosion and Profit Shifting (BEPS) Action Plan: Necessity and Adequacy of the Measures at EU level, Intertax, Vol. 45, No. 2, 120-137.
Hall, R./Jorgenson, D. (1967): Tax Policy and Investment Behaviour, The American Economic Review, Vol. 57, No. 3, 391-414.
Heckemeyer, J.H./Overesch, M. (2017): Multinationals’ Profit Response to Tax Differentials: Effect Size and Shifting Channels, Canadian Journal of Economics, Volume 50, Issue 4, 965-994.
Herzfeld, M. (2017): Revisiting Camp’s Repatriation, Tax Notes International, Vol. 12, 1042-1045.
Hines, J. (1994): Credit and deferral as international investment incentives, Journal of Public Econom-ics, Vol. 55, No.2, 323-347.
Huizinga, H./Laeven, L. (2008): International profit shifting within multinationals: A multi-country per-spective, Journal of Public Economics, Vol. 92, No. 5-6, 1164-1182.
International Bureau of Fiscal Documentation (IBFD) (2016), Global Corporate Tax Handbook, Amster-dam.
Jorgenson, D. (1963): Capital Theory and Investment Behaviour, The American Economic Review, Vol. 53, No. 2, 247-259.

48
King, M./Fullerton, D. (1984): The Taxation of Income from Capital: A comparative study of the United States, the United Kingdom, Sweden and West Germany, University of Chicago Press, Chicago.
Markle, K. (2016): A Comparison of the Tax-Motivated Income Shifting of Multinationals in Territorial and Worldwide Countries, Contemporary Accounting Research, Vol. 33, No. 1, 7-43.
Markusen, J./Venables, A. (1999): Foreign Direct Investment as a Catalyst for Industrial Development, European Economic Review, Vol. 43, Issue 2, pp. 335-356.
Mehrotra, K. (2010): The Public Control of Corporate Power: Revisiting the 1909 U.S. Corporate Tax from a Comparative Perspective, Maurer School of Law: Indiana University, Article No.47.
Navarro, A./Parada, L./Schwarz, P. (2016): The Proposal for an EU Anti-avoidance Directive: Some Pre-liminary Thoughts, EC Tax Review, Vol. 25, No. 3, 117-131.
Noorbakhsh, F./Paloni, A. (2001): Human Capital and FDI Inflows to Developing Countries: New Em-pirical Evidence, World Development, Vol. 29, No. 3, 1593-1610.
OECD (2008): OECD Benchmark Definition of Foreign Direct Investment - 4th Edition.
OECD (2015a): Transfer Pricing Documentation and Country-by-Country Reporting – Action 13: 2015 Final Report, OECD/G20 Base Erosion and Profit Shifting Project, Paris.
OECD (2015b): Countering Harmful Tax Practices More Effectively, Taking into Account Transparency and Substance – Action 5: 2015 Final Report, OECD/G20 Base Erosion and Profit Shifting Project, Paris.
Overesch, M./Wamser, G. (2009): Who Cares About Corporate Taxation? Asymmetric Tax Effects on Outbound FDI, The World Economy, Vol. 32, No. 12, 1657-1684.
Peyerl, H. (2014): Deductibility of Interest and Royalties Restricted: Is Austria a BEPS Role Model?, Eu-ropean Taxation, Vol. 54, No. 12, 572-577.
Redmiles, M. (2008): The one-time received dividend deduction, Statistics of Income Bulletin, Vol. 27, 103-117.
Schönfeld, J. (2017): CFC Rules and Anti-Tax Avoidance Directive, EC TAX Review, Vol. 27, No. 3, 145-152.
Shaviro, D. (2014): Fixing US international taxation, Oxford University Press, Oxford.
Spengel, C. (2008): Concept and Necessity of a Common Tax Base, in: Schön, W./Schreiber, U./Spengel, C. (eds.), A Common Consolidated Corporate Tax Base for Europe, Berlin/Heidelberg, 1-47.
Spengel, C./Bräutigam, R. (2015): Steuerpolitik in Deutschland – eine Halbzeitbilanz der aktuellen Le-gislaturperiode im Kontext europäischer Entwicklungen, Die Unternehmensbesteuerung (Ubg), Vol. 8, No. 10, 569-581.
Spengel, C./Heckemeyer, J.H./Nicolay, K./Bräutigam, R./Klar, O./Stutzenberger, K. (2016): The Effects of Tax Reforms to Address the Debt-Equity Bias on the Cost of Capital and on Effective Tax Rates, Eu-ropean Commission Taxation Paper N. 65-2016, Luxembourg.
Spengel, C./Heinemann, F. (2017): US-Steuerpläne bedrohen den globalen Handels- und Steuerfrieden, Der Betrieb, 70(17), M5.
Spengel, C./Nicolay, K. (2017): The European Commission’s CC(C)TB Re-Launch, ZEW policy brief No. 1 2017, Mannheim.

49
Tax Foundation (2017): Important Differences Between the House and Senate Tax Reform Bills Head-ing into Conference, https://taxfoundation.org/important-differences-house-senate-tax-reform-bills-heading-conference/, accessed 05 December 2017.
Tax Policy Center (2017): Statistics on Corporate Top Tax Rate and Bracket, http://www.taxpoli-cycenter.org/statistics/corporate-top-tax-rate-and-bracket, accessed on 15 November 2016.
The Wall Street Journal (2017): Live Coverage Tax-Bill-2017, https://www.wsj.com/livecoverage/tax-bill-2017, accessed 05 December 2017.
ZEW (2017): Final Report 2016: Effective Tax Levels Using the Devereux/Griffith Methodology, Pro-ject for the EU Commission TAXUD/2013/CC/120, Mannheim.


51
Appendix
Appendix A: Country abbreviations
Abbreviation Country Abbreviation Country
AT Austria HU Hungary
BE Belgium IE Ireland
BG Bulgaria IT Italy
CY Cyprus LT Lithuania
CZ Czech Republic LU Luxembourg
DE Germany LV Latvia
DK Denmark MT Malta
EE Estonia NL Netherlands
ES Spain PL Poland
EU28 EU 28 PT Portugal
FI Finland RO Romania
FR France SE Sweden
GB United Kingdom SI Slovenia
GR Greece SK Slovakia
HR Croatia US United States

52
Appendix B: CFC legislation
Table 13: Applicability of CFC legislation under Art. 7 ATAD with regard to the proposed US corpo-rate income tax rate of 20%
Statutory corporate income tax rate
50% threshold (Art. 7 (1) b) ATAD)
Applicability of CFC legislation
Austria 25.0% 12.5% No
Belgium 33.0% 16.5% No
Bulgaria 10.0% 5.0% No
Croatia 18.0% 9.0% No
Cyprus 12.5% 6.3% No
Czech Republic 19.0% 9.5% No
Denmark 22.0% 11.0% No
Estonia 20.0% 10.0% No
Finland 20.0% 10.0% No
France 33.33% 16.7% No
Germany 15.0% 7.5% No
Greece 29.0% 14.5% No
Hungary 9.0% 4.5% No
Ireland 12.5% 6.3% No
Italy 24.0% 12.0% No
Latvia 15.0% 7.5% No
Lithuania 15.0% 7.5% No
Luxembourg 19.0% 9.5% No
Malta 35.0% 17.5% No
Netherlands 25.0% 12.5% No
Poland 19.0% 9.5% No
Portugal 21.0% 10.5% No
Romania 16.0% 8.0% No
Slovak Republic 21.0% 10.5% No
Slovenia 19.0% 9.5% No
Spain 25.0% 12.5% No
Sweden 22.0% 11.0% No
United Kingdom 20.0% 10.0% No
Legal status as of 2017. Information on the statutory corporate income tax rates was retrieved from the Tax Research Platform of the International Bureau of Fiscal Documentation (IBFD), available at www.ibfd.org.

53
Figures
Figure 1: Structure of a hypothetical investment ................................................................................... 9 Figure 2: Effective tax burden vs. statutory corporate taxation, in % .................................................. 12 Figure 3: Development of the cost of capital in 2005-2016, in % ......................................................... 13 Figure 4: Development of EATR in 2005-2016, in % .............................................................................. 14 Figure 5: US inbound and outbound investment for calculating effective tax burdens ....................... 22 Figure 6: Effective tax burden after the US tax reform, in % ................................................................ 23 Figure 7: Total FDI stocks US - EU28 (in million EUR) ............................................................................ 31 Figure 8: Total bilateral FDI stocks for US - Germany and US - Ireland ................................................. 32 Figure 9: Effective tax burden after accounting for reforms of 2017-2020, in % ................................. 43
Tables
Table 1: Comparison of current US and European corporate tax systems ............................................. 9 Table 2: Model Assumptions ................................................................................................................. 10 Table 3: Effective tax burden vs. statutory corporate taxation, in % .................................................... 12 Table 4: Development of the cost of capital in 2005-2016, in % .......................................................... 13 Table 5: Development of EATR in 2005-2016, in % ............................................................................... 14 Table 6: Cross-Border investment: US, 2016, in % ................................................................................ 15 Table 7: Effective tax burden after the US tax reform, in %.................................................................. 23 Table 8: Cross-border investment: US after tax reform (20% CIT and immediate depreciation of machinery and intangibles), in % .......................................................................................................... 25 Table 9: Cross-border investment: US after tax reform (20% CIT, immediate depreciation of machinery and intangibles and the exemption of foreign profits), in %............................................... 26 Table 10: Cross-border investment: Optimal investment options of the US under the status quo and after tax reform, in % ............................................................................................................................ 27 Table 11: Changes in effective average tax burdens of investment options of the US after tax reform, in % ........................................................................................................................................................ 29 Table 12: Foreign Direct Investment positions of the US by sectors under the status quo and after the US tax reform, in million EUR ................................................................................................................ 33 Table 13: Applicability of CFC legislation under Art. 7 ATAD with regard to the proposed US corporate income tax rate of 20%.......................................................................................................................... 52