Embed Size (px)
Citation preview

U.S. Army Research Institute for the Behavioral and Social Sciences
Research Note 2003-07
Toward an Understanding of Team Performance and Team Cohesion Over Time Through the Lens
of Time Series Analysis
Robert M. McIntyre Kari Strobel Hope Hanner
Amy Cunningham Lara Tedrow
Old Dominion University
December 2002

Understanding Team Performance and Team Cohesion i
Table of Contents Table of Contents................................................................................................................. i LIST OF TABLES............................................................................................................. iv Executive Summary ........................................................................................................... ix PREFACE........................................................................................................................... 1 PHASE 1: STUDY 1 .......................................................................................................... 3
Method ............................................................................................................................ 6 Participants................................................................................................................. 6 Procedure.................................................................................................................... 6 Measures ..................................................................................................................... 7 Training Program Development and Description ...................................................... 8
Hypotheses...................................................................................................................... 9 Results............................................................................................................................. 9
Experimental Manipulation ........................................................................................ 9 Efficacy of Training on Team Cohesion ..................................................................... 9 Efficacy of Training on Team Performance.............................................................. 10
Discussion..................................................................................................................... 10 PHASE 2: STUDY 1 ........................................................................................................ 12
Method .......................................................................................................................... 12 Participants............................................................................................................... 12 Procedure.................................................................................................................. 13 Measures ................................................................................................................... 13 Statistical Analysis .................................................................................................... 14 ARIMA Model of Time Series Analysis ..................................................................... 14 Seasonal ARIMA Models .......................................................................................... 16 Model Identification.................................................................................................. 16
Hypotheses.................................................................................................................... 20 Results........................................................................................................................... 20
Experimental Manipulation ...................................................................................... 21 Training Evaluation .................................................................................................. 21 ARIMA Models.......................................................................................................... 21 ARIMA Time Series Analyses.................................................................................... 22
Discussion..................................................................................................................... 38 CONCLUSIONS FOR STUDIES FOCUSING ON COHESION ................................... 39 PHASE 2: STUDY 2 ........................................................................................................ 41
Social Loafing............................................................................................................... 41 Identifiability............................................................................................................. 42 Dispensability ........................................................................................................... 43 Equity Theory............................................................................................................ 43 Limitations of Previous Social Loafing Research..................................................... 44
Affect ............................................................................................................................ 45 Time Series Analysis and the Interrupted Time Series Experiment ............................. 46
AUTOBOX ................................................................................................................ 46 Transfer Function Model .......................................................................................... 47
The Present Study ......................................................................................................... 47

Understanding Team Performance and Team Cohesion ii
Method .......................................................................................................................... 48 Participants and Procedure ...................................................................................... 48 Measures ................................................................................................................... 48 Statistical Analyses ................................................................................................... 49 Training Program ..................................................................................................... 50
Results........................................................................................................................... 50 Summary of Affective State Results........................................................................... 50 Affective State and Social Loafing ............................................................................ 51 Affective State and Performance............................................................................... 57 Summary of Training Effect Results ......................................................................... 61 The Effect of Training ............................................................................................... 61
Discussion..................................................................................................................... 68 PHASE 2: STUDY 3 ........................................................................................................ 71
Workload and Team Performance ............................................................................ 71 Unanswered Questions ............................................................................................. 72 Statistical Analyses ................................................................................................... 73
Hypotheses.................................................................................................................... 74 Method .......................................................................................................................... 74
Difficulty of Exercises vs. Team Performance Methods ........................................... 75 Workload vs. Performance........................................................................................ 76 Multivariate Transfer Function Analysis.................................................................. 77
Results........................................................................................................................... 77 Demographics ........................................................................................................... 77 Effect of Difficulty Level on Team Performance....................................................... 78 Effect of Training on Relationship between Team Performance and Workload ...... 82 Multiple-predictor Transfer Function Analyses ....................................................... 87 Task and Social Cohesion ......................................................................................... 97
Discussion................................................................................................................... 103 Difficulty of Exercises vs. Team Performance ........................................................ 103 Workload vs. Performance...................................................................................... 103 Multiple-predictor Transfer Function Analysis ...................................................... 103 Prediction of Task Cohesion ................................................................................... 104 Prediction of Social Cohesion ................................................................................ 104 Prediction of Dominant-Submissive Social Cohesion ............................................ 104 Unpredicted and Unusual Results .......................................................................... 104 An Overall Issue—The Inconsistency Across Teams .............................................. 107 Strengths of the Study.............................................................................................. 108 Future Team Research with Student Teams............................................................ 109
CONCLUDING REMARKS AND SOME LESSONS LEARNED.............................. 111 REFERENCES ............................................................................................................... 113 APPENDIX A................................................................................................................. 120
Teamwork Skills Knowledge Test.............................................................................. 120 Subjective Evaluation of Training Program ............................................................... 122 Team Log .................................................................................................................... 123 The PANAS (Watson, Clark, & Tellegen, 1988) ....................................................... 125 Workload Sharing (Campion, Medsker, & Higgs, 1993) ........................................... 126
Understanding Team Performance and Team Cohesion iii
Social Loafing............................................................................................................. 127 Technical Details of Bivariate and Multivariate Transfer Function Analysis ............ 128 Graphs of Performance of Teams for Phase 2: Study 2.............................................. 130 Team Assignment ....................................................................................................... 135 Difficulty Questionnaire ............................................................................................. 136 NASA-TLX................................................................................................................. 138

Understanding Team Performance and Team Cohesion iv
LIST OF TABLES
Table 1.1. ARIMA (0,0,1) Model Predicting Team 1 F-B Cohesion Dimension .............. 23
Table 1.2. ARIMA (1,1,0) Model Predicting Team 2 F-B Cohesion Dimension .............. 23
Table 1.3. ARIMA (0,1,0) Model Predicting Team 3 F-B Cohesion Dimension .............. 23
Table 1.4. ARIMA (0,1,1) Model Predicting Team 4 F-B Cohesion Dimension .............. 24
Table 1.5. ARIMA (0,0,0) Model Predicting Team 5 F-B Cohesion Dimension .............. 24
Table 1.6. ARIMA (1,0,0) Model Predicting Team 6 F-B Cohesion Dimension .............. 24
Table 1.7. ARIMA (1,0,0) Model Predicting Team 8 F-B Cohesion Dimension .............. 25
Table 1.8. ARIMA (0,1,1) Model Predicting Team 10 F-B Cohesion Dimension ............ 25
Table 1.9. ARIMA (0,0,1) Model Predicting Team 1 P-N Cohesion Dimension .............. 27
Table 1.10. ARIMA (1,0,0) Model Predicting Team 2 P-N Cohesion Dimension ............ 27
Table 1.11. ARIMA (1,0,0) Model Predicting Team 3 P-N Cohesion Dimension ............ 27
Table 1.12. ARIMA (1,0,0) Model Predicting Team 4 P-N Cohesion Dimension ............ 28
Table 1.13. ARIMA (0,0,0) Model Predicting Team 5 P-N Cohesion Dimension ............ 28
Table 1.14. ARIMA (0,0,1) Model Predicting Team 6 P-N Cohesion Dimension ............ 28
Table 1.15. ARIMA (1,0,0) Model Predicting Team 8 P-N Cohesion Dimension ............ 29
Table 1.16. ARIMA (0,0,0) Model Predicting Team 10 P-N Cohesion Dimension .......... 29
Table 1.17. ARIMA (0,1,1) Model Predicting Team 1 U-D Cohesion Dimension ........... 31
Table 1.18. ARIMA (1,1,0) Model Predicting Team 2 U-D Cohesion Dimension ........... 31
Table 1.19. ARIMA (0,0,0) Model Predicting Team 3 U-D Cohesion Dimension ........... 31
Table 1.20. ARIMA (0,1,1) Model Predicting Team 4 U-D Cohesion Dimension ........... 32
Table 1.21. ARIMA (0,0,0) Model Predicting Team 5 U-D Cohesion Dimension ........... 32
Table 1.22. ARIMA (0,1,1) Model Predicting Team 6 U-D Cohesion Dimension ........... 32
Understanding Team Performance and Team Cohesion v
Table 1.23. ARIMA (0,0,1) Model Predicting Team 8 U-D Cohesion Dimension ........... 33
Table 1.24. ARIMA (0,1,1) Model Predicting Team 10 U-D Cohesion Dimension ......... 33
Table 1.25. ARIMA (0,0,1) Model Predicting Performance for Team 1 .......................... 35
Table 1.26. ARIMA (0,0,0) Model Predicting Performance for Team 2 .......................... 35
Table 1.27. ARIMA (0,0,1) Model Predicting Performance for Team 3 .......................... 35
Table 1.28. ARIMA (0,0,0) Model Predicting Performance for Team 4 .......................... 36
Table 1.29. ARIMA (0,0,1) Models Predicting Performance for Team 5......................... 36
Table 1.30. ARIMA (1,0,0) Model Predicting Performance for Team 6 .......................... 36
Table 1.31. ARIMA (0,0,0) Model Predicting Performance for Team 8 .......................... 37
Table 1.32. ARIMA (0,1,1) Model Predicting Performance for Team 10 ........................ 37
Table 2. 1. Summary of Significant Results for the Effects of Affect State ....................... 50
Table 2. 2. Team 4: Positive Affect and Social Loafing.................................................... 52
Table 2. 3. Team 6: Positive Affect and Social Loafing.................................................... 52
Table 2. 4. Team 10: Positive Affect and Social Loafing.................................................. 52
Table 2. 5. Team 1: Negative Affect and Social Loafing .................................................. 53
Table 2. 6. Team 3: Negative Affect and Social Loafing .................................................. 53
Table 2. 7. Team 4: Negative Affect and Social Loafing .................................................. 54
Table 2. 8. Team 6: Negative Affect and Social Loafing .................................................. 54
Table 2. 9. Team 8: Negative Affect and Social Loafing .................................................. 54
Table 2. 10. Team 4: Positive Affect and Workload Sharing............................................ 55
Table 2. 11. Team 6: Positive Affect and Workload Sharing............................................ 55
Table 2. 12. Team 1: Negative Affect and Workload Sharing .......................................... 55
Table 2. 13. Team 3: Negative Affect and Workload Sharing .......................................... 56

Understanding Team Performance and Team Cohesion vi
Table 2. 14. Team 1: Positive Affect and Performance .................................................... 58
Table 2. 15. Team 2: Positive Affect and Performance .................................................... 58
Table 2. 16. Team 3: Positive Affect and Performance .................................................... 58
Table 2. 17. Team 6: Positive Affect and Performance .................................................... 59
Table 2. 18. Team 10: Positive Affect and Performance .................................................. 59
Table 2. 19. Team 2: Negative Affect and Performance................................................... 60
Table 2. 20. Team 4: Negative Affect and Performance................................................... 60
Table 2. 21. Team 6: Negative Affect and Performance................................................... 60
Table 2. 22. Summary of Significant Results for the Effects of Training.......................... 61
Table 2. 23. Team 1: Effects of Training on Negative Affect............................................ 63
Table 2. 24. Team 1: Effects of Training on (NA) Mood Linkage .................................... 63
Table 2. 25. Team 1: Effects of Training on Social Loafing............................................. 63
Table 2. 26. Team 5: Effects of Training on Social Loafing............................................. 64
Table 2. 27. Team 6: Effects of Training on Positive Affect ............................................. 64
Table 2. 28. Team 6: Effects of Training on Workload Sharing....................................... 64
Table 2. 29. Level Shifts in Positive Affect........................................................................ 65
Table 2. 30. Level Shifts in Negative Affect ...................................................................... 65
Table 2. 31. Level Shifts in Positive Affect Mood Linkage ............................................... 65
Table 2. 32. Level Shifts in Negative Affect Mood Linkage .............................................. 66
Table 2. 33. Level Shifts in Social Loafing ....................................................................... 66
Table 2. 34. Level Shifts in Workload Sharing ................................................................. 66
Table 2. 35. Level Shifts in Performance .......................................................................... 67
Table 3. 1. Demographics: Teams 1-11............................................................................ 78

Understanding Team Performance and Team Cohesion vii
Table 3. 2. Team 4: Difficulty Level and Team Performance........................................... 80
Table 3. 3. Team 9: Difficulty Level and Team Performance........................................... 80
Table 3. 4. Teams 1-3, 5-8, 10-11 Difficulty Level and Team Performance .................... 81
Table 3. 5. Team 1: Workload and Team Performance.................................................... 83
Table 3. 6. Team 2: Workload and Team Performance.................................................... 83
Table 3. 7. Team 3: Workload and Team Performance.................................................... 83
Table 3. 8. Team 4: Workload and Team Performance.................................................... 83
Table 3. 9. Team 5: Workload and Team Performance.................................................... 84
Table 3. 10. Team 6: Workload and Team Performance.................................................. 84
Table 3. 11. Team 7: Workload and Team Performance.................................................. 84
Table 3. 12. Team 8: Workload and Team Performance.................................................. 85
Table 3. 13. Team 9: Workload and Team Performance.................................................. 85
Table 3. 14. Team 10: Workload and Team Performance................................................ 85
Table 3. 15. Team 11: Workload and Team Performance................................................ 86
Table 3. 16. Team 1: Multi-transfer Function Analysis.................................................... 88
Table 3. 17. Team 2: Multi-transfer Function Analysis.................................................... 89
Table 3. 18. Team 3: Multi-transfer Function Analysis.................................................... 90
Table 3. 19. Team 4: Multi-transfer Function Analysis................................................... 91
Table 3. 20. Team 5: Multi-transfer Function Analysis................................................... 92
Table 3. 21. Team 6: Multi-transfer Function Analysis................................................... 93
Table 3. 22. Team 7: Multi-transfer Function Analysis................................................... 93
Table 3. 23. Team 8: Multi-transfer Function Analysis................................................... 94
Table 3. 24. Team 9: Multi-transfer Function Analysis................................................... 95
Understanding Team Performance and Team Cohesion viii
Table 3. 25. Team 10: Multi-transfer Function Analysis................................................. 96
Table 3. 26. Team 11: Multi-transfer Function Analysis................................................. 96
Table 3. 27. Teams 1-11: Task Cohesion.......................................................................... 99
Table 3. 28. Teams 1-11: Social Cohesion (P-N) ........................................................... 100
Table 3. 29. Teams 1-11: Social Cohesion (U-D) .......................................................... 101
Table 3. 30. Teams 1-11: “In-the-Wrong-Direction” Effects......................................... 102

Understanding Team Performance and Team Cohesion ix
Executive Summary
This final report summarizes the results of two phases of research involving the effects of theory-based teamwork training on team cohesion and team performance. In the first phase, the research used a relatively straightforward pre-training, post-training, and post-post-training design to determine the effects of theory-based teamwork process training on team cohesion. In this study, teams of college students carrying out team projects served as research participants. Results indicated significant and reasonably long-lasting effects on team cohesion as measured by the System for the Multiple Level Observation of Group (SYMLOG) measurement system. The second phase of the research was extremely labor intensive. It involved the use of 11 student teams who participated in an advanced undergraduate psychology course. This course was designed to be completely team-based. That is, students met three times per week for 14 1/3 weeks and worked on exercises as teams. The grades for the exercises were the basis for the grades in the course. The assigned team grade was the grade for each team member for every exercise and for the whole course. Three sets of data were collected and separated into three different studies. In the first of the studies, team cohesion as measured over time was measured over the course of the semester. At the mid-point in the course, teams were trained in theory-drive teamwork processes in a similar but more intense way as that used in Phase 1. Interrupted autoregressive integrated moving average (ARIMA) analyses showed that training seemed to be responsible for increase in team cohesion. Note that interrupted ARIMA was used separately for each of the 11 teams. In the second of the phase 2 studies, a number of socio-emotional variables were examined in addition to team performance as measured by the teams’ grades. Once again ARIMA was used to examine bivariate relationships between team performance and cohesion, mood state, and other socio-emotional variables. The set of statistical analyses, technically referred to as bivariate transfer function analyses, yielded an array of results across the teams, implying that different levels of relationship held for different teams. A somewhat surprising finding was that team performance and team cohesion were not related as expected. The third phase-two study was a complex refinement of the second study in that it included additional variables that had not been examined in the previous two—namely, workload measures, and it employed multiple-variable ARIMA transfer functions. The hypothesis was that perceptions of workload over time might moderate the relationship between team performance and the set of predictors that had been examined in the second study, phase 2. Once again, the findings indicated a range of effects across the 11 teams. All in all, the four studies in two phases provided more questions than answers. We discuss the implications of the studies for future research at the end of the report for each of the studies.

Understanding Team Performance and Team Cohesion 1
PREFACE The statement of work for this funded study indicated two tasks. The first referred to an empirical study that investigates the degree to which the behavior constructs that comprise the Teamwork Process model affect team cohesiveness. Although it was anticipated at the time of the beginning of the study that this task and its components were answerable in a single study, in fact we discovered that it required more. Therefore, we addressed the task in two phases. In phase 1, we carried out a relatively simple repeated measures design demonstrating that cohesion increased as a function of theory-driven training. We became concerned, however, with the duration of the training effect. Further, we came to recognize that unless one understands the psychological processes involved in the development of cohesion, and the dynamic relationship between team cohesion and team performance, then our research was not very telling. We proceeded to follow up this Phase 1 research with a Phase 2 effort. In this phase, our goal was to study teams behavior (including team performance and cohesion) dynamically over time. To this end, in the fall of 2000, three of my students and I ran a pilot study (not mentioned in the text of our report to contain the length of the document) for one whole semester (15 weeks—three times per week). Student teams in an undergraduate Personnel Psychology course met three times per week and completed assignments on their own after a weekly lecture by the instructor. The purpose of the pilot test was formative: we wanted to gauge the reaction of students to a course like this, the usability of the measurements over time, and administrative logistics to carry out such a study. We learned much from our experience. In particular, we learned that there was resistance to working as teams by undergraduates if they had to meet outside the assigned class time. We learned that the measures of cohesion were clear and usable. We learned that students tended to like working on the exercises in teams. All in all, we gleaned a number of important lessons for running the following 15-week data collection effort in another undergraduate psychology course. In the spring semester of 2001, we ran the actual study. With a class of approximately 45 students, who had been contacted prior to the beginning of class and told of the unique nature of the course, we implemented a completely team-based course. Students were randomly assigned to 11 teams, read assignments each week, were given tri-weekly team assignments during class time, and completed paper-and-pencil measures. Their graded assignments served as their team and individual grades. Teams were also given two optional extra-credit assignments each week to ensure that the teams had every chance to get good grades. Each assignment consisted of 10 true or false questions with correcting of the false questions, three short answer questions, and one long answer question. They also had an extra-credit at the end of the assignment. The two weekly extra credit assignments took the same format. Grading was done by my students and thoroughly double-checked by me. Over all teams, we graded 8,250 true-false-correct-the-false items, 2,475 short-answer questions (approximate 75 words per answer), and 825 long-answer questions (approximately 250 words per answer). We attempted to provide regular feedback to students on their grades.

Understanding Team Performance and Team Cohesion 2
In addition to the assignments, we trained all students in the teamwork model.
Training, newly developed by us for this study, lasted approximately 3 ½ hours. Students also received, via email and written reminders, “weekly team-o-grams” which were pithy, humorous (at times) reminders of key teamwork processes. The goal of the latter was to encourage students to recall teamwork principles.
Following the spring 2001 semester, the data were analyzed in three different
stages. Because of the nature of the analyses, it took approximately one year to complete the three documents that are summarized within this present report.
The statement of work also contained a second task. This task indicated that we
would attempt to replicate the findings with ROTC cadets. I had made contacts with TRADOC during the previous year to gain the commitment for a nationwide sample of ROTC cadets at some point. However, given the limited resources in the ARI contract, it appeared as though such a wide-scale study might better be held off to some later date. Therefore, in the spring of 2002, we contacted the ROTC management at Old Dominion University to request the participation of the ROTC cadets to participate in a small-scale team-training-for-cohesion study. The ROTC management was very enthusiastic about participating but given the late date in the research cycle, could only provide very basic opportunities to observe ROTC cadets. The nature of the Phase 2 studies in effect had encroached on the time remaining on the contract. Cadets were not available during the summer of 2002, so that the best we could do is to plan for continuation of the program of research in the fall of 2002. Unfortunately, we learned that the proposal for such research was not funded by ARI.
This preface provides a detailed background of the research that my students and I
have done since the contract’s inception two years ago. We believe that we have carried out some innovative research and have set the stage for important future research. We hope that ARI sees our efforts as intensive and in line with the mission to which the institute is committed.

Understanding Team Performance and Team Cohesion 3
PHASE 1: STUDY 1 The team concept has become an increasingly important and widely studied organizational phenomenon as the 1990s witnessed a dramatic increase in the use of workplace teams and substantial productivity gains resulted (Morgan, Salas, & Glickman, 1993). Increased emphasis on teams has been one of the responses to greater domestic and international competition, and to rapid changes in technology and management practice (Oser, Gualtieri, Cannon-Bowers & Salas, 1999). The subsequent study of team dynamics is dedicated to advancing knowledge about the nature of teams, the laws of their development, as well as their interrelations with individuals, other teams, and larger institutions (Widmeyer, Brawley & Carron, 1986). The concept of team cohesion has attained a central position in team dynamics theory, due to its consistent relationship with organizational effectiveness (Greene, 1989), and its facilitative effect on group productivity (Keyton & Sprinston, 1990). For example, in a meta-analysis of 372 groups taken from 16 published studies, Evans and Dion (1991) calculated a significant mean correlation of .42 between team cohesion and team performance. The moderate effect size supports the contention that cohesive teams, on average, are more productive than their counterparts.
Although cohesion appears to be a critical element of successful teams, the concept defies precise definition (Mudrack, 1989; see Siebold, 1999 for a review). One prominent framework for these multiple components involves the distinction between "social cohesion" and "task cohesion" (Carron, 1988). Social cohesion has been primarily defined as an interpersonal attraction to the team or group. Task cohesion, on the other hand, de-emphasizes social aspects and focuses on group affiliation for the purpose of achieving task-related outcomes (Craig & Kelly, 1999). In brief, social cohesion can be viewed as a description of pleasurable interpersonal interactions, which produce a desire to maintain affiliation with the team, whereas task cohesion involves collective efforts with other team members for the purpose of achieving specific goals beyond that which could be accomplished alone by an individual.
While there is no consensus as to the exact nature of cohesion or its definition,
there is general agreement that the success of teams is frequently dependent on team members’ abilities to develop as a cohesive unit. A wide variety of professional leaders recognize cohesion as a desirable group property and are very interested in accessing or creating interventions to develop this characteristic for their competitive advantage (Prapavessis & Albert, 1997). The recognition of the practical importance and theoretical significance of the cohesion construct has led to considerable research into numerous theorized antecedents. Some member characteristics thought to contribute to team cohesion include individual personality and attitudes (House, 1971), and feelings of satisfaction with team members' abilities to achieve team goals (Kerr & Jermier, 1978). Characteristics of the group suspected of playing a role in the development of a cohesive team include the size of the team (Isenberg & Ennis, 1981), clarity of members’ roles (Evans & Dion, 1991), clarity of team goals (Mudrak, 1989), and mutual commitment to the task of the group (Zacarro & Lowe, 1986). In addition, some believe that certain

Understanding Team Performance and Team Cohesion 4
situations experienced by the group contribute to team cohesion. These include external threats (Tziner, 1992), inter-group competition (Taylor, Doria & Tyler, 1983), and shared failures and successes (Zaccaro & Lowe, 1986).
Beneficial outcomes of cohesive teams include team loyalty (Polley, 1987), the
ability of the team to perform under pressure (Mudrack, 1989), and a team's proclivity to expend effort to achieve group goals (Greene, 1989). Cohesion is also thought to have positive influences on team processes, such as member participation in team tasks (Widmeyer & Martens, 1978) and team members placing the groups' needs before their individual needs and wants (Littlepage, Cowart & Kerr, 1989). Perhaps of most importance, cohesion positively affects group end products. Specifically, research repeatedly has shown a positive relationship between team cohesion and team performance (Widmeyer, Brawley & Carron, 1986).
Although the beneficial consequences of team cohesion are generally accepted,
the antecedents or precursors are not as well understood. Investigations of these hypothesized predictors almost invariably invoked the use of cross-sectional designs with associated correlational techniques. Unfortunately, such research strategies are rather limited in their ability to draw causal inferences (Zaccaro, Gualtieri & Minionis, 1995). In other words, scientific investigators cannot say whether these presumed antecedent factors lead to, or develop from, cohesion (Slater & Sewell, 1994). In order to answer this critical question, we must incorporate more sophisticated theoretical models of teamwork components. Researchers must also utilize more rigorous longitudinal research designs and appropriate statistical analyses to better understand the prospective nature of the cohesion-performance relationship.
As you can see, the definition, conceptualization, and empirical investigation of
the cohesion construct have been somewhat difficult. This challenge has encouraged researchers to search for additional information regarding other aspects within the larger field of team dynamics in order to obtain greater information about team cohesion. For example, associated models of teamwork processes and team performance models may provide insight, as productive teams tend to be more cohesive than their unproductive counterparts (Evans & Dion, 1991).
One prominent model of teamwork processes describes the dimensions and
principles of teamwork derived from Dickinson, McIntyre, Ruggeberg, Yanushefski, Hamill and Vick (1992), McIntyre and Salas (1995) and Dickinson and McIntyre (1997). This "Dickinson-McIntyre model" provides a firm foundation for comprehensive team training (See Tedrow, 2001). Based on empirical data, contributors to the model identified and described the core components of teamwork necessary for maximal team performance. The seven elements of this model are:
1. Communication - Communication is defined as the active exchange of
information among team members using proper terminology, to clarify or acknowledge the receipt of information.

Understanding Team Performance and Team Cohesion 5
2. Team orientation – Team orientation refers to the attitudes of team members toward one another and the team task. It reflects the acceptance of team norms, level of group cohesiveness, importance of team membership, and self-awareness of each member as a team member.
3. Team leadership – Leaders provide direction, structure, and support for other
team members. Team leadership does not necessarily refer to a single individual with formal authority but can be shown by several team members.
4. Monitoring – Team performance occurs through the observation and
awareness of the activities and performance of its members. Monitoring implies that team members are individually competent (have the necessary skills) and can provide feedback and backup behavior.
5. Feedback - Feedback is defined as the giving, seeking, and receiving of
information among group members. The term refers to providing information regarding other's performance.
6. Backup behavior - Backup behavior is defined as assisting other team
members with the performance of their tasks. It implies that members have an understanding of other members’ tasks and are willing and able to provide and seek assistance when needed.
7. Coordination – Coordination occurs when team activities are executed in
response to the behavior of other members. Successful coordination indicates that other components of teamwork are functioning effectively. Coordination may be regarded as dependent on the remaining components of teamwork.
Careful reading of this model points to the fact that it concentrates on the critical
processes and specific behaviors that lead to team coordination, one element of which is team cohesion. Essentially, the Dickinson-McIntyre model of teamwork processes provides a comprehensive framework for team cohesion development based on a review of the literature and data. It also has another advantage in that it is one of the few models that clearly emphasizes teachable teamwork skills.
The development of a training program that can be demonstrated to produce
cohesion was the ultimate aim of this research project. It was expected that team members trained on these fundamental team concepts would develop into more cohesive teams and produce superior outcomes. Specifically, the experimental manipulation of interest to these investigators was the direct training of the Dickinson-McIntyre teamwork process behaviors in an attempt to enhance cohesion.

Understanding Team Performance and Team Cohesion 6
Method
Participants
University student participants were recruited through the support of local
university professors who use team projects as an integral part of class requirements. Professors were recruited via e-mail, letters, and personal visits. The Education, Business, Engineering and Psychology departments were targeted because their classes tend to emphasize group projects. Graduate and undergraduate students in these courses were given the option to participate but were not penalized for choosing not to participate. Procedure
Pursuant to their enrollment into the study, students in each class were randomly
assigned to teams. Then, teams from all classes were randomly assigned to either an experimental or control condition. The experimental teams received the formal personnel training on teamwork concepts. Control teams received no training but met and received the same measures at the same measurement intervals. To mediate any potential Hawthorne effects, the control group was treated as a placebo group, as simple exposure to other team members may improve team performance (Hollingshead, 1998).
Once team and condition assignments were established, all members met with
their team and received a demographics questionnaire, a baseline cohesion measure, and a baseline measure of the knowledge of teamwork principles. Seven days later, the experimental group was provided the formal training. The controls received no formal training, but were required to meet at the same time as the training groups in an alternate location. The meeting rooms used were similar in location, size, and setting. The experimental teams were exposed to a four-hour training session and all team members attended the training together. The cohesion and teamwork principles measures were then administered a second time four weeks later. Cohesion was measured again at the end of the semester, as was the performance criterion of class grades.
The use of a college student participant pool has been well established in the
organizational behavior literature. Druskat and Wolff (1999) argued that this methodology has an acceptable degree of external validity because such student groups require member interdependence and are held responsible for a tangible and desired outcome (academic grades). It should also be pointed out that much of our knowledge about the correlates of cohesion has been generated from studies of college student working groups (Mulvey & Klein, 1998; Zaccaro, Gualtieri & Minionis, 1995). Because of the prior research and good validity, the use of college students at this stage of research appears to be warranted.
Understanding Team Performance and Team Cohesion 7
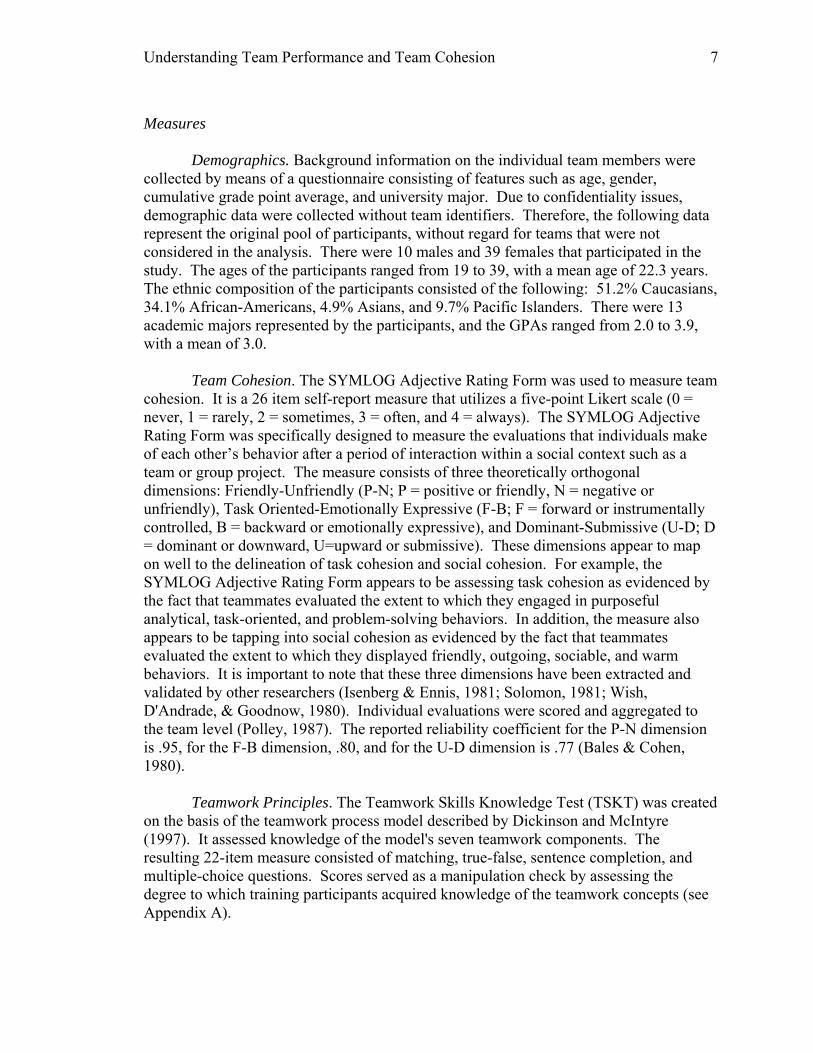
Measures
Demographics. Background information on the individual team members were
collected by means of a questionnaire consisting of features such as age, gender, cumulative grade point average, and university major. Due to confidentiality issues, demographic data were collected without team identifiers. Therefore, the following data represent the original pool of participants, without regard for teams that were not considered in the analysis. There were 10 males and 39 females that participated in the study. The ages of the participants ranged from 19 to 39, with a mean age of 22.3 years. The ethnic composition of the participants consisted of the following: 51.2% Caucasians, 34.1% African-Americans, 4.9% Asians, and 9.7% Pacific Islanders. There were 13 academic majors represented by the participants, and the GPAs ranged from 2.0 to 3.9, with a mean of 3.0.
Team Cohesion. The SYMLOG Adjective Rating Form was used to measure team
cohesion. It is a 26 item self-report measure that utilizes a five-point Likert scale (0 = never, 1 = rarely, 2 = sometimes, 3 = often, and 4 = always). The SYMLOG Adjective Rating Form was specifically designed to measure the evaluations that individuals make of each other’s behavior after a period of interaction within a social context such as a team or group project. The measure consists of three theoretically orthogonal dimensions: Friendly-Unfriendly (P-N; P = positive or friendly, N = negative or unfriendly), Task Oriented-Emotionally Expressive (F-B; F = forward or instrumentally controlled, B = backward or emotionally expressive), and Dominant-Submissive (U-D; D = dominant or downward, U=upward or submissive). These dimensions appear to map on well to the delineation of task cohesion and social cohesion. For example, the SYMLOG Adjective Rating Form appears to be assessing task cohesion as evidenced by the fact that teammates evaluated the extent to which they engaged in purposeful analytical, task-oriented, and problem-solving behaviors. In addition, the measure also appears to be tapping into social cohesion as evidenced by the fact that teammates evaluated the extent to which they displayed friendly, outgoing, sociable, and warm behaviors. It is important to note that these three dimensions have been extracted and validated by other researchers (Isenberg & Ennis, 1981; Solomon, 1981; Wish, D'Andrade, & Goodnow, 1980). Individual evaluations were scored and aggregated to the team level (Polley, 1987). The reported reliability coefficient for the P-N dimension is .95, for the F-B dimension, .80, and for the U-D dimension is .77 (Bales & Cohen, 1980).
Teamwork Principles. The Teamwork Skills Knowledge Test (TSKT) was created
on the basis of the teamwork process model described by Dickinson and McIntyre (1997). It assessed knowledge of the model's seven teamwork components. The resulting 22-item measure consisted of matching, true-false, sentence completion, and multiple-choice questions. Scores served as a manipulation check by assessing the degree to which training participants acquired knowledge of the teamwork concepts (see Appendix A).
Understanding Team Performance and Team Cohesion 8
Team Performance. As the final outcome measure, team project grades were collected.
Training Program Development and Description
Muchinsky (2000) suggested seven steps be included in designing an effective training program: needs analysis, develop training objectives, review training methods, design training, design evaluation training, implement program, and measure effectiveness. A needs analysis should first be conducted to determine the necessary content of the training. However, this initial step was not included in this training program because the context, vis-à-vis teamwork, was already established. Additionally, this step was eliminated because of the impracticality of both measuring all the teams prior to implementation and then tailoring the training program to each individual team. These activities were simply beyond the scope of this project. The second step in Muchinsky’s (2000) process is to develop training objectives. The objective of this training program was to have team members identify, define, and demonstrate the seven core components of teamwork as defined by Dickinson et al. (1992). The next two steps are to review available training methods and then to design and select training. A variety of sources, including previous experiments’ methods, team training literature, and books on training, were consulted to select the most appropriate methods for training. A combination of lecture, discussions, games, and behavioral modeling were chosen for the methods. A synopsis of the training program’s content is reviewed in the next paragraph. The fifth step is to design the training evaluation approach. The training program itself was evaluated at the end of the training session by asking participants to complete a post-training evaluation questionnaire requesting participants' reactions to the teamwork skills training.
A variety of activities were included in the training. Blanchard and Thacker
(1998) suggested the use of relevant examples, behavioral reproduction (practice), and feedback to maximize trainee learning. These and other learning theories helped guide the development of the training program. Introductory activities were used to introduce participants to the training topic objectives. Team members were instructed to create a list, consisting of positive and negative teamwork examples. These examples were then reviewed and discussed as a class. Definitions and examples of the seven principles of teamwork derived from Dickinson et al. (1992), McIntyre and Salas (1995) and Dickinson and McIntyre (1997) were then given via lecture format. Participants were provided a handout that contained all information contained in the lecture. Computer-generated slides were used as aids in the presentation. Following the lecture, team members viewed videotapes of hypothetical student work teams engaging in the seven principles of teamwork behavior. In the video, the teams worked together to complete a team assignment similar to those assignments given to the teams in the course. Following the video, team members viewed brief portions of popular movies highlighting characters engaging in the seven teamwork behaviors. Participants were then instructed to identify positive and negative teamwork examples in the movie and the video. A team building activity was then used to allow team members to practice the skills in a non-stressful setting while other members observed for the teamwork components. At this

Understanding Team Performance and Team Cohesion 9
time, teams were asked to complete a tower building exercise (Moore, 1992). Finally, participants were asked to evaluate the training session and to assess the perceived effectiveness of the training program (see Appendix B). Teams were then given an opportunity to apply what they practiced to their own team projects. After the intervention, teams were encouraged to track the frequency with which the seven behaviors occurred using a "team log" given to team members upon completion of the training program (see Appendix C). In order to better ensure the transfer of the teamwork skills training, members also received weekly "team-o-grams", which were reminder electronic mail messages sent to serve as boosters to the points provided in the training. The entire training program lasted approximately four hours.
Hypotheses
As previously stated, the ultimate aim of Study 1 was to develop a training
program that can be demonstrated to produce cohesion. It was expected that teams receiving teamwork skills training would report and maintain increased levels of cohesion and performance. It was hypothesized that teamwork skills training would increase task cohesion levels as demonstrated by greater scores on the F-B dimension of the SYMLOG. In addition, the training would increase levels of social cohesion as demonstrated by increased scores on the P-N and U-D SYMLOG dimensions. Finally, team performance levels would be positively impacted by the teamwork skills training.
Results
An alpha level of .05 was used for all statistical tests. There were no statistically significant differences between groups on demographics such as age, sex, and cumulative grade point average. Experimental Manipulation
A manipulation check was performed to gauge knowledge acquisition of the training program's components. Results showed a significant difference between the experimental groups from baseline (mean = 4.20, sd = 2.50) to first follow-up (mean = 15.20, sd = 1.70) on the TSKT (t (33) = 18.37, p = .00), suggesting the participants learned the teamwork concepts provided in the training program. Efficacy of Training on Team Cohesion
A multivariate analysis of variance (MANOVA) was conducted comparing the two groups on outcomes. The overall multivariate effect was significant, (F (1,) = 21.49, p = .00). A series of univariate ANOVAs was then conducted comparing the two groups on outcomes. Results for the P-N social cohesion dimension showed no significant differences between controls and the trainees at baseline (F(1,60) = .43, p = .15). However, significant between-group differences emerged at first follow-up (F(1,60) = 48.02, p = .00) and at one-month follow-up (F(1,60) = 31.92, p = .00). Moreover, results for the U-D social cohesion dimension showed no significant differences between

Understanding Team Performance and Team Cohesion 10
controls and trainees at baseline (F(1,60) = .83, p = .56). Significant differences emerged between controls and trainees at first follow-up (F(1,60) = 9.24, p = .02) and at one-month follow-up (F(1,60) = 7.65, p = .04). Finally, results for the task cohesion dimension showed no significant differences between controls and trainees at baseline (F(1,60) = .08 p = .77). Significant differences emerged between controls and trainees at first follow-up (F(1,60) = 6.02, p = .02) and at one-month follow-up (F(1,60) = 4.48, p = .04).
Efficacy of Training on Team Performance
Finally, there was a significant difference between controls (mean = 2.95, sd = .54) and trainees (mean = 3.36, sd = .53) on team project grades (F(1,60) = 9.00, p = .00) supporting the hypothesis that teams receiving the teamwork skills training protocol would outperform their control group counterparts.
Discussion
We found support for the hypothesis that a brief but focused training program
based on empirically derived teamwork principles can enhance social cohesion and task cohesion for newly established teams, and ultimately improve performance as demonstrated by higher project grades. A manipulation check revealed that the training program's principles were incorporated. These data are important because the prospective nature of the study, along with the experimental manipulation, allows us to draw stronger inferences about cohesion and team performance. Until now, research has focused almost exclusively on correlates of cohesion using cross-sectional designs. This is the first systematic program we are aware of that attempted to manipulate cohesion under controlled conditions.
We were also intrigued and encouraged by an incidental finding. The data
suggested a natural nonlinear development of cohesion since controls' cohesion levels decreased at the second observation and recovered at the third. Cohesion's natural course over a college semester demonstrated a U-shaped curve in this instance. While we did not predict this finding a priori, those data are consistent with the stage model of team development described by Wagner and Hollenbeck (1998). During their initial stage ("forming"), new team members may focus on establishing interpersonal relationships, or they may become more likely to discuss neutral topics that have no bearing on the team’s purpose. As the team becomes more familiar with each other, members may begin discussing general work issues and each person’s probable role to the formally prescribed task of the team. When, and if, a team enters the second stage ("storming"), conflicts may erupt as members try to reach an agreement on the purpose, goals, and objectives of the team. In this second stage, differences of opinion may also emerge as members try to achieve consensus on exactly how they will accomplish the team’s formally prescribed task. Sorting out individual responsibilities and how they will be accomplished, along with what reward members will receive for their performance, may prove to be extremely difficult. Our study may have measured the effects of this tumultuous period when control participants' cohesion ratings actually decreased from baseline to observation two,
Understanding Team Performance and Team Cohesion 11
only to recover back to baseline levels by the third observation at end of the semester. Conversely, it appeared the trained groups avoided the detrimental effects of a storming period. Instead, these participants' social and task cohesion increased in a linear fashion from baseline to observation two and remained steady over the course of several weeks.
The process model of teamwork and the stage model of team development may
provide frameworks for understanding the development of cohesive teams. However, the results could not fully tap into the temporal aspects of team cohesion given that only three longitudinal observations were gathered. Such a small number of data points cannot adequately assess the likely subtle and gradual changes in the development of team cohesion. For these reasons, we needed to use more detailed longitudinal methods with a greater number of data points.

Understanding Team Performance and Team Cohesion 12
PHASE 2: STUDY 1
There are research designs and statistical analyses that improve upon the standard methods used by team investigators. To clarify this point, consider the definition of team that was presented at the beginning of this work. A team is defined as a "group working dynamically and interdependently." The phenomenon that the term "dynamic and interdependently" refers to is not well investigated by traditional static research designs which were originally conceived of as a way of solving static agricultural questions. The term "dynamic" implies change in time. In the context of team research, the term "interdependently" refers to a growing dependence over time of team members on each other. Neither idea can be understood through cross-sectional, static designs. Instead, investigation of how teams behave and how their performance can be improved by external interventions are best accomplished through the use of longitudinal research designs requiring numerous measurements of teamwork processes. Longitudinal research techniques allow investigators to more accurately assess changes in, and the development of, team characteristics over time (Druskatt & Wolff, 1999). They also provide a powerful means of assessing the effects of team training such as team process training recommended by Dickinson et al. (1992) and McIntyre and Salas (1995).
In accord with this line of thinking, the primary purpose of the second study was
to examine longitudinally the effects of teamwork skills training on team cohesion with the use of multiple data points and time series statistical procedures that are seldom employed by industrial/organizational psychologists. In effect, we looked to replicate Study 1 and demonstrate with idiographic analyses that our training program would enhance social cohesion and task cohesion. We also took advantage of a second study to investigate the participants' evaluations of the training program and their degree of satisfaction with the format provided. Muchinsky (2000) suggested such evaluations are an important and necessary aspect in the design of effective training.
Method
Participants
Eleven three-to-five member undergraduate student teams participating in a team-based course in Industrial/Organizational (I/O) psychology were recruited through the support of a local university professor who uses team projects as an integral part of class requirements.
Participants consisted of 36 women (75%) and 9 men (19%). The average age of
the participants was 22.27 (SD = 3.83) years. The sample was composed of 51% Caucasian, 34% African American, 7% Pacific Islander, and 8% Asian participants. Their mean cumulative grade point average was 2.99 (SD = .50). The majority of students were advanced undergraduates (35% juniors and 44% seniors). Sixty-seven percent of the participants reported having previous experience working within the context of teams. These students came from varied academic backgrounds including the college of sciences, liberal arts, education, and engineering. Three participants declined
Understanding Team Performance and Team Cohesion 13
to provide demographic information.
Procedure
Participants were randomly assigned to teams pursuant to their enrollment into the team-based undergraduate I/O psychology class. Three times per week, a standardized measure of cohesion was collected following completion of various class subject-based team assignments. Data were gathered every Monday, Wednesday, and Friday over the course of 14 weeks, providing 41 observation points. Following the 22nd observation, teams received the four-hour training program described in Study 1 of Phase 1.
Measures
Demographics. Background information on the individual team members were collected by means of a questionnaire consisting of features such as age, gender, cumulative grade point average, year in school, university major, and previous team work experience.
Team Cohesion. The SYMLOG Adjective Rating Form (Bales & Cohen, 1980)
was utilized in the same fashion as described in Study 1. Secondary analysis of the first study revealed test-retest correlations from baseline to second observation (five weeks) was .51 for the P-N social cohesion dimension is .35, for the F-B task cohesion dimension, and .58, and for the U-D social cohesion dimension (Strobel & McIntyre, 2001). These moderate numbers indicate that the SYMLOG has clear state components and therefore lends itself well to time series analysis.
Teamwork Principles. The TSKT was again employed for purposes of a
manipulation check as in Study 1of Phase 1. Team Performance. Team performance was defined in terms of the teams'
responses to team assignments. For each meeting, teams were directed to complete group assignments, which consisted of five true-false questions, three short essay questions, and one long essay question on introductory topics within I/O psychology. The course instructors (CI) created the items for the assignments with the assistance of the course textbook, instructor's manual (Muchinsky, 2000), and the graduate research assistants. Team members worked together for 45 minutes, to produce a single document for each assignment. All teams were given the option of completing two extra credit assignments per week of the same format. Extra credit assignments were not used as data in the study. The CI made all final decisions regarding weekly and final team assignment grades. In order to improve the likelihood that team grades were reliably assessed, the CI and graduate research assistants created a set of "scoring rules" prior to each graded assignment. Research assistants used these scoring rules to grade the assignments, after which the CI reviewed all scoring to ensure consistency and reliable application of the rules.

Understanding Team Performance and Team Cohesion 14
Statistical Analysis Autoregressive integrated moving average (ARIMA) time series procedures were used to analyze the temporal aspects of team cohesion and performance. A time series is defined as a set of N time-ordered observations of a process. A process is understood to be a mathematically defined function that generates realizations of the process. A realization is one sample generated from a process. The concept of process is roughly analogous to a population distribution while realization is roughly analogous to a sample from the population in traditional cross-sectional research designs (McCleary & Hay, 1980).
Many think of time series designs as substitutes for traditional randomized experimental designs when such designs are not feasible. Glass, Wilson, and Gottman (1975) correct this erroneous position. They explain that the time series designs offer a unique perspective on the evaluation of intervention (or "treatment") effects. They go on to say that the traditional "Fisherian" designs fail to address the fact that interventions (such as training) affect social systems (such as teams) in time over time. The effects of interventions may occur immediately after the intervention is implemented or they may affect the team after some period of time has passed. Further, the effect may take a variety of forms. It may be abrupt and temporary, abrupt and permanent, gradual and temporary, or gradual and permanent. It may show decay in time that cannot in general be captured in the traditional research design (Glass, Willson, and Gottman (1975) discuss ten different types of effects that may follow an intervention). The Interrupted Time Series Experiment (ITSE) is therefore not just a weak fallback position for investigators of teams. It may well be the preferred approach to addressing the dynamic and interdependent nature of team performance.
An ITSE requires the collection of time series data over time. At some point in
time, the time series data are "interrupted" by the intervention. Prior to the intervention, data are treated as baseline data. After the intervention, data are treated as the experimental data of interest. To test the hypothesis that an intervention has an impact on the data, an interrupted time series analysis (ITSA) was conducted (Gottman, 1981; Glass, Willson, & Gottman, 1975; McDowall, McCleary, Meidinger, & Hay, 1980). This analysis allows for the evaluation of an intervention within an ITSE by controlling for the autocorrelation in the data. Autocorrelation implies that there is time dependency within the data—that there is some predictability from past series of data to the current values. The existence of autocorrelation makes it difficult to determine whether an intervention has an impact on the data. That is, when a change in trend appears, autocorrelation is an obstacle to determining whether change following an intervention is the result of the intervention or simply the normal behavior of the (interdependent) series of data (Gottman, 1981).
ARIMA Model of Time Series Analysis
The following is a lengthy, but pertinent discussion of the mechanics of time series analyses used in the current study. This discussion is provided because this

Understanding Team Performance and Team Cohesion 15
statistical approach is relatively novel in the realm of team research. Readers who are already familiar with the use of the ARIMA model of time series analysis may wish to continue on to the hypotheses section.
In the current study, the Auto-Regressive Integrated Moving Average (ARIMA)
model of TSA was followed (Glass, Willson, & Gottman, 1975; Gottman, 1981; McCleary & Hay, 1980; McDowall, McCleary, Meidenger, & Hay, 1980; Wei, 1990). The ARIMA model follows the theory that any time series observation Xt consists of a random error component et plus some deterministic component. In this case, et is referred to as white noise and is ordinarily assumed to be normally distributed with a mean of zero and variance, σe
2. The deterministic component refers to two phenomena in training and intervention evaluation research. The first is the effect or impact of the intervention. The second is the mathematical process that generates the data.
Note that there are several processes considered in the ARIMA model. The first
is trend or drift. In point of fact, it is should be noted that trend is technically a deterministic type of behavior while drift is considered random. Unfortunately, it is difficult in social sciences to distinguish between trend or drift. Therefore, here, the phenomenon is treated as deterministic. In addition to trend-drift, two mathematical processes generate a particular time series: auto-regressive and moving average. In an auto-regressive process, prior observations in a time series affect the current observation. In a moving-average process, prior random shocks (that is, random error components) are assumed to affect the current value.
The final deterministic element of a time series observation is attributable to the
intervention. It was previously stated that interventions can take on a variety of dynamic forms (e.g., abrupt permanent change, gradual permanent change, etc.) in time, which simpler pre-test—post-test designs may not pick up. Therefore, the exact value of the intervention part of the deterministic component depends on the nature of the intervention effect. ARIMA procedures provide a means of isolating autoregressive (AR), trend-drift, and moving average (MA) aspects of an observation in an ITSE so that the phenomenon of primary interest, the intervention effect, can be examined. That is, ARIMA accounts for the existence of AR, trend-drift, and MA processes, allowing the investigator to analyze the size of the effect attributable to the intervention.
In general, ARIMA models can take on a variety of forms described by three
parameters. For this reason, one regularly finds the expression ARIMA (p,d,q), where p is the order of the autoregressive component of the model, d is the order of the trend-drift component of the model, and q is the order of the moving average component. The "orders" can take on values equal to or greater than zero. An ARIMA (1,0,0) means that the model is a pure first order autoregressive model. The ARIMA (0,1,0) means that the model accounts for a first order trend-drift with no autoregressive or moving average tendencies.

Understanding Team Performance and Team Cohesion 16
Seasonal ARIMA Models McCleary and Hay (1980) defined seasonality "as any cyclical or periodic fluctuation in a time series that recurs or repeats itself at the same phase of the cycle or period" (p. 80). Seasonality is commonly observed in social science data. For example, in the area of consumer behavior, one sees a peak in shopping behavior in December corresponding to the holiday season. Just as there are deterministic functions that account for the variance in nonseasonal time series data corresponding to trend-drift, and autoregressive and moving-average influences, there are also these three parallel functions at the seasonal level. The full ARIMA model, therefore, is signified as ARIMA (p,d,q)(P,D,Q) where the capitalized variables indicate seasonal components. Model Identification
Stationary models and trend and drift. It is important to understand trend and drift a bit more precisely. As was pointed out above, unless there is a firm foundation in the literature to guide a researcher's thinking, trend and drift are not easily distinguishable from one another. Another way of expressing the existence of trend-drift is through the concept of a stationary model. A time series is considered stationary in its mean if it neither trends nor drifts. A stationary model in the mean is one for which the parameter d = 0. However, if a series of data appear to trend or drift in the mean, then the data are usually transformed by a process called differencing. Differencing refers to subtracting from a current observation Xt a previous observation Xt-1. In other words,
Zt = Xt - Xt-1If the differencing transformation is carried out one time, then d = 1. If there
remains trend or drift in the data, then the differenced series may itself have to be differenced. In this case,
Zt2 = (Xt - Xt-1) - (Xt-1 - Xt-2) It should be noted that if a researcher is dealing with seasonal trend or drift, then similar equations could be presented in which the season itself would replace t. Therefore, for yearly seasonality, year one would correspond to season one, year two would correspond to season two, and so on. The very same procedures used to deal with trend or drift in the nonseasonal type of time series would apply to seasonal time series data.
Trend or drift can sometimes be discovered by examining the plot of time series data. However, a much better way of carrying out the process is by examining the autocorrelations that underlie the time series data. An autocorrelation is defined as the correlation between pairs of data in the time series separated by k time points (or k seasonal points). This means the correlation can be computed for pairs of observations (X1, X2), (X2,X3), (X3,X4), etc. (For seasonal data, the data may be represented as (Xs1, Xs2), (Xs2,Xs3), (Xs3,Xs4), etc.) It also means that the separation of k, sometimes called lag, can increase. For example, after computing the correlation for k =1, a correlation would then be computed for k=2 involving the ordered pairs (X1,X3), (X2,X4), …,(Xn-
2,Xn). The autocorrelation indicates the degree to which there is dependency within a time series data set. The autocorrelation function (ACF) refers to the series of autocorrelations up to, say, 20 lags for a given time series. The ACF can be plotted and

Understanding Team Performance and Team Cohesion 17
examined to determine whether trend or drift are operative in a given time series. The plot is referred to as a correlogram. When the values in the correlogram "neither damp out or truncate for a given level of d, but instead remain large, then nonstationarity [in the mean] at the level of differencing is indicated" (Glass et al., 1975, page 97). (Once again, for seasonal data, the very same logic applies.)
Identifying p and q. (Note that the following section applies to seasonal and
nonseasonal time series data. The reader must remember that the lag with seasonal data represents the difference from one corresponding season to the next corresponding season.) Identifying the level of differencing required in modeling a given time series is the first step in identifying the model. Thereafter, efforts are invested in identifying the degree to which the model is an autoregressive, a moving average, or a mixed model. In addition to using the ACF, another function is examined called the PACF, the partial autocorrelation function. McCleary and Hay (1980) explain the PACF in the following way: "The PACF has an interpretation not unlike that of any other measure of partial correlation. The lag-k PACF, PACF (k), is a measure of correlation between time series observations k units apart after the correlation at intermediate lags has been controlled or 'partialed out'" (p. 75). The computation of the PACF (k) is not as straightforward as that of the ACF (k). It is a complex function of ACF. Fortunately, time series computer programs compute the function values as a matter of course.
All theoretical time series processes have a known pattern of ACF and PACF. Therefore, theoretically, if one examines the ACF and PACF, one should be able to identify the proper values of p and q in an ARIMA (p,d,q)(P,D,Q). (Note that d and D have already been addressed above.) McCleary and Hay (1980) as well as other authors provide detailed guidelines for identifying the values of p and q (and P and Q) on the basis of examining the ACF and PACF. (The different patterns of ACF and PACF for identification of the models will not be described here. The interested reader would do well to review McCleary and Hay (1980).) However, the practical difficulty in applying the guidelines can be quite challenging. This is because actual realizations of time series processes often generate ACFs and PACFs that appear to be quite different from those existing at the process level. The multiple stage procedure that ARIMA requires provides a means of correcting model identification errors.
Parameter Estimation. An ARIMA model is nonlinear in its parameters which means that ordinary least squares (OLS) procedures, so commonly used in traditional experimental designs, are usually not recommended (McCleary & Hay, 1980; Wei, 1990). Instead, two procedures are recommended. One is referred to as the Exact Likelihood Function. The other more commonly recommended is the nonlinear least squares estimate procedure. This procedure "involves an iterative search technique" (Wei, 1990, p. 144). Wei (1990) describes this procedure in the following way.
The nonlinear least squares routine starts with initial guess values of the parameters. It monitors these values in the direction of the smaller sum of squares and updates the initial guess values. The iterations continue until some

Understanding Team Performance and Team Cohesion 18
specified convergence criteria area reached (p. 145).
McCleary and Hay (1980) point out that after the parameters are estimated, two concerns arise. First, the estimated autoregressive and moving average parameters should be statistically significant. If a parameter estimate is not statistically significantly different from zero, it is dropped from the model and the model is estimated again. Second, the estimates of the autoregressive and moving-average parameters must lie within the bounds of stationarity (for autoregressive parameters) and invertibility (for moving-average parameters). Stationarity of autoregressive parameters is a mathematical requirement that must be met to retain the autoregressive nature of the model. It states that given a p of some level, the values of p must take on values so that the nature of the autoregressive model is retained. The phrase "nature of the autoregressive model" implies that any observation of an autoregressive process must be a function of past observations in the process and the influence of these past observations decreases as the time lag between the present and the past observations increases
Invertibility for the moving-average model is similarly defined. It refers to values of q that keep intact the nature of the moving-average model. Recall that the moving-average model dictates that an observation at time t is influenced by previous random error values (random shocks) of previous observations in the time series. Further, the influence of the random shocks decreases as the time lag between the present value of t and the previous value of t increases. Fortunately, statisticians have worked out exact values for the range of parameters to satisfy the stationarity and invertibility requirements. McCleary and Hay (1980) point out that for social science data, the order of autoregressive and moving-average models rarely exceeds two. Therefore, the "rules" for stationarity in autoregressive parameters and invertibility in moving-average parameters are readily available in most texts on time series analysis. After estimation has taken place and after the requirements of statistical significance and stationarity-invertibility are met, a tentative model has been computed. At this point, the third stage of the time series analysis begins—the diagnosis.
Model diagnosis. McCleary and Hay (1980) describe the three-stage process of diagnosing an appropriate ARIMA model. First, model residuals are computed by computing for each observation the difference between the values of the model implied observation and the actual value. Second, the residuals of the tentative model must be statistically independent at a first and second lag. That is, the following must hold:
ACF(1) = ACF(2) = 0 Third, the residuals must be distributed as white noise. McCleary and Hay (1980) point out that for 20 or 30 lags of an ACF, given a significance level of .05, it would be expected that some of the ACF (k) values would be significant by chance. This third criterion requires that, overall, the ACF (k) values are nonsignificant. To test this, the Q statistic can be used:
[ ]Q = N ACF(i)i
k
=∑
1
2,
where df = k-p-q-P-Q. The Q statistic is distributed approximately as a chi-square with

Understanding Team Performance and Team Cohesion 19
degrees of freedom as indicated. The null hypothesis that the model residuals are white noise is:
Ho: ACF(1) = ACF(2) =…= ACF(k) = 0 If the Q statistic takes on a value greater than chance, then the model residuals are presumed to be different from white noise and the model is to be rejected. McCleary and Hay (1980) recommend a value of the number of lags (k) would be 25 due to the influence of k on the power of the Q statistic.
Impact of the Intervention. After the three stages have been completed, usually within the pre-intervention data, the intervention must be examined for its impact. In the case of most social science interventions, researchers have chosen to examine the abrupt-permanent type of impact. This may in part be due to the computer software available to the researchers. It may also be due to the number of data points that have been collected. In the absence of any theoretical reasons, perhaps the abrupt and permanent type of impact is the most reasonable to assess. However, it seems fruitful to recognize that there are alternative approaches to investigating impacts. McCleary and Hay (1980) discuss the process of examining these alternatives as "rival hypotheses." These would include the abrupt-permanent, the gradual-permanent, and the abrupt-temporary impact hypotheses.
In all cases, the researcher must identify a transfer function associated with each
of these types of impacts. This transfer function in the simplest case—that is, the abrupt permanent impact—requires that parameters in the following function be solved for:
ƒ (It) = ωoIt, where It = 0 prior to the intervention and 1 after the intervention and ω0 is the level change attributed to the intervention. Here It is a dichotomous variable indicating whether the intervention is impacting or not. For the gradual constant pattern, the parameters in the following function must be solved for:
ƒ (It) = ω0 / 1-δ1 (It), where δ1 is a parameter that is constrained to the interval,
-1 < δ1 < +1, and It is again a dichotomously valued coding variable indicating whether the intervention has an effect. Here, δ1 algebraically operates on ω0 to effectively increase or reduce the magnitude of ω0 over time depending on the sign of δ1. The other parameters have already been defined. For an abrupt temporary impact, the parameters of the following function must be solved for:
ƒ (It) = ω0 / 1-δ1 {It (1-B) It}, where all values have been defined except for B. B is the backward shift operator and is interpreted as "B operates on I by shifting I back one point in time." McCleary and Hay (1980) refer to the following as a pulse function:
(1-B)It, such that, for example,

Understanding Team Performance and Team Cohesion 20
(1-B) It = 0 prior to intervention (1-B) It = 1 at the onset of the intervention (1-B) It = 0 thereafter
McCleary and Hay (1980) refer to the abrupt temporary impact as a differenced step function. This implies that the difference transformation is applied to the It values in time which are in effect the dichotomous code indicating whether the intervention is operating. Consider the values of It
…0, 0, 0, 0, 1, 1, 1, 1,… By applying a first-order differencing transformation to these codes, one gets a pulse function, in effect:
…(0-0), (0-0), (0-0),(1-0),(1-1),(1-1),… …0 , 0 , 0, 1 , 0 , 0…
Once again, these codes represent a dummy variable indicating whether the intervention is impacting the time series data or not. In this case, the impact is a single "pulse" which abruptly diminished after one impact. There are other types of interventions that may be examined. The three presented above are perhaps the most commonly observed. The most important thing to understand is that the current statistical software allow for an investigation of the impact of interventions such as team training that provide a much richer understanding of its effects.
Software Used. In this study, the TRENDS module in Statistical Package for the Social Sciences (SPSS) was used. This software requires that the analyst examine the pattern of autocorrelation functions and partial autocorrelation functions to identify the prospective model. Thereafter, the model is diagnosed according to the information presented above.
Hypotheses
As previously stated, the goal of Phase 2: Study 1 was to examine the effect of a theory-based training program on the cohesion and performance of intact student work teams through the use of a longitudinal design and interrupted time series analysis. It was expected that teams receiving teamwork skills training would report and maintain increased levels of cohesion and performance. It was hypothesized that teamwork skills training would increase task cohesion levels as demonstrated by greater scores on the F-B dimension of the SYMLOG. In addition, the training would increase levels of social cohesion as demonstrated by increased scores on the P-N and U-D SYMLOG dimensions. Finally, team performance levels would be positively impacted by the teamwork skills training.
Results
In the process of collecting data, three teams were excluded from the analyses. Team Seven was eliminated due to the teams' consistent noncompliance with questionnaire procedures despite repeated clarifying instructions. Teams Nine and

Understanding Team Performance and Team Cohesion 21
Eleven were excluded from the analyses due to attrition. Several of these two teams' members withdrew from the undergraduate psychology course, thus changing the dynamics of the teams mid-semester.
Experimental Manipulation
A manipulation check was performed to gauge the success of the training program (Kazdin, 1998). A paired samples t-test was conducted comparing pre (mean = 11.94 , sd = 1.88) and post-intervention (mean = 15.64 , sd = 2.63) scores on the TSKT, revealing significant differences (t(44) = 7.15 p =.00). Thus, evidence suggested that the participants successfully learned the teamwork concepts provided in the training program.
Training Evaluation
The qualitative evaluation data were impressive. Overall, 100% of the Study 2 student teams reported the teamwork skills training was valuable. In addition, 98% of the participants felt that their team would not only benefit from the training, but would implement the teamwork skills learned. Moreover, 91% of the respondents found the contents of the training program to be either “useful” or “very useful”, and believed they felt they knew enough about these teamwork skills to successfully implement them into a team meeting.
ARIMA Models
ARIMA time series procedures were the main statistical techniques employed to analyze the effects of teamwork skills training on team cohesion and team performance. As previously stated, these procedures overcome the statistical confounds commonly associated with small n studies that utilize repeated measures data collection. The most significant of these confounds being serial correlation of adjacent error terms (West & Hepworth, 1991). Multiple regression procedures require these error terms to be uncorrelated. Violations of this standard serve to increase alpha levels. Thus, incorrect rejection of the null hypothesis results. ARIMA procedures account for auto-regressive (AR), integrative (I), and moving average (MA) portions of time series, and simultaneously include them in calculations of the sought after effect. Serial correlation of error terms is therefore eliminated and the remaining variance is kept in regression equations to calculate the effect (Box & Jenkins, 1976; McCleary & Hay, 1980).
ARIMA (p,d,q) models were created for each of the four criteria; F-B cohesion
dimension, P-N cohesion dimension, U-D cohesion dimension, and team performance. These models were derived from all 41 data points. The identification, diagnosis, and estimation steps were followed as described by McCleary and Hay (1980). The training program was modeled as an abrupt, permanent impact. Pre-intervention observations were scored as equal to 0 for data points 1 through 22 and post-intervention data points 23 through 41 were set equal to 1.

Understanding Team Performance and Team Cohesion 22
ARIMA Time Series Analyses
An interrupted time series analysis was employed to analyze the effects of teamwork skills training on team cohesion. Based on a priori one-tailed tests, the teamwork skills training appeared to alter task cohesion levels. Seven teams out of eight (Teams One through Four, Six, Eight, and Ten) showed significant increases in F-B cohesion levels following the teamwork skills training. Team Five did not show significant post-intervention increases in this task cohesion dimension. Results can be found in Tables 1.1 through 1.8.

Understanding Team Performance and Team Cohesion 23
Table 1.1. ARIMA (0,0,1) Model Predicting Team 1 F-B Cohesion Dimension
________________________________________________________________________
Predictor B SE t ________________________________________________________________________ MA[1] .347 .155 2.244** Teamwork Skills Training 2.119 .974 2.177** ________________________________________________________________________ ** p < .05
Table 1.2. ARIMA (1,1,0) Model Predicting Team 2 F-B Cohesion Dimension
________________________________________________________________________ Predictor B SE t ________________________________________________________________________ AR[1] -.539 .135 -3.963**** Teamwork Skills Training 4.874 1.988 2.452** ________________________________________________________________________ ** p < .05 **** p < .001
Table 1.3. ARIMA (0,1,0) Model Predicting Team 3 F-B Cohesion Dimension
________________________________________________________________________ Predictor B SE t ________________________________________________________________________ Teamwork Skills Training 4.718 1.789 2.637** ________________________________________________________________________ ** p < .05
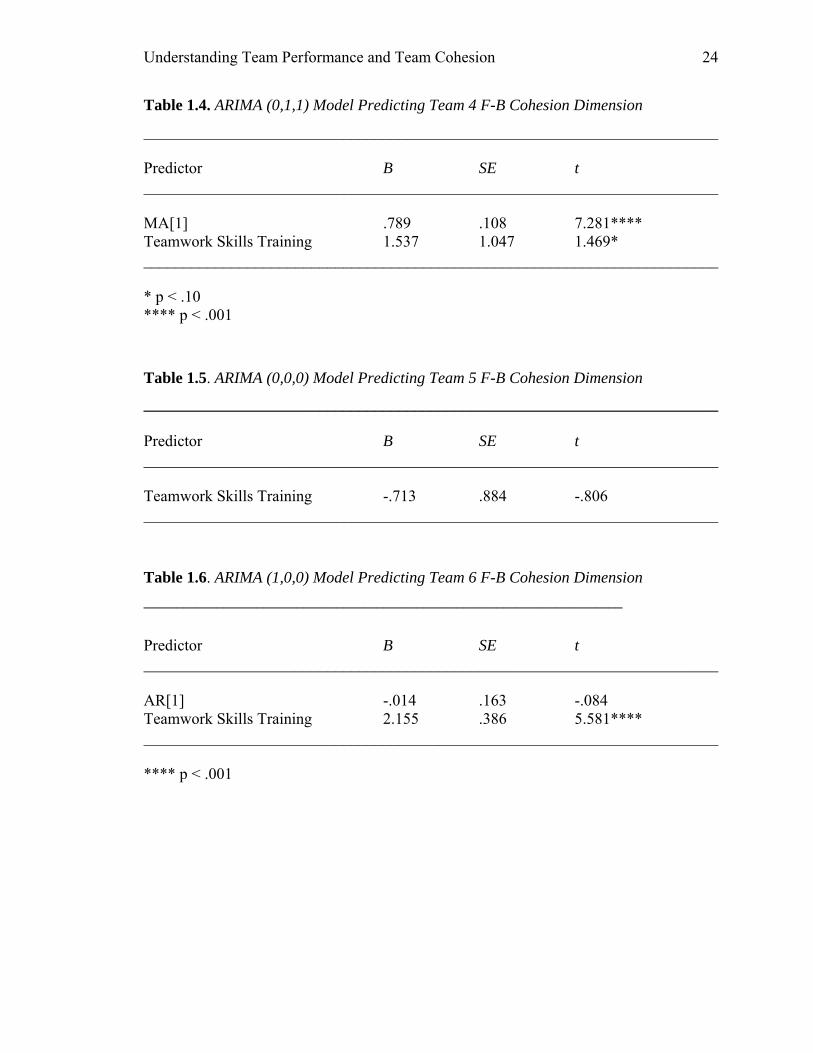
Understanding Team Performance and Team Cohesion 24
Table 1.4. ARIMA (0,1,1) Model Predicting Team 4 F-B Cohesion Dimension
________________________________________________________________________ Predictor B SE t ________________________________________________________________________ MA[1] .789 .108 7.281**** Teamwork Skills Training 1.537 1.047 1.469* ________________________________________________________________________ * p < .10 **** p < .001
Table 1.5. ARIMA (0,0,0) Model Predicting Team 5 F-B Cohesion Dimension
________________________________________________________________________ Predictor B SE t ________________________________________________________________________ Teamwork Skills Training -.713 .884 -.806 ________________________________________________________________________
Table 1.6. ARIMA (1,0,0) Model Predicting Team 6 F-B Cohesion Dimension ________________________________________________________________________
Predictor B SE t ________________________________________________________________________ AR[1] -.014 .163 -.084 Teamwork Skills Training 2.155 .386 5.581**** ________________________________________________________________________ **** p < .001

Understanding Team Performance and Team Cohesion 25
Table 1.7. ARIMA (1,0,0) Model Predicting Team 8 F-B Cohesion Dimension
________________________________________________________________________ Predictor B SE t ________________________________________________________________________ AR[1] -.284 .158 -1.793* Teamwork Skills Training 1.00 .974 2.998*** ________________________________________________________________________ * p < .10 *** p < .01
Table 1.8. ARIMA (0,1,1) Model Predicting Team 10 F-B Cohesion Dimension
________________________________________________________________________ Predictor B SE t ________________________________________________________________________ MA[1] .999 41.902 .024 Teamwork Skills Training 3.301 1.409 2.342** ________________________________________________________________________ ** p < .05

Understanding Team Performance and Team Cohesion 26
The same format was followed when assessing the impact of training on social cohesion as reflected by both the P-N and U-D levels. Six teams out of eight (Teams One, Two, Four, Six, Eight and Ten) showed significant increases in the P-N dimension directly following the teamwork skills training. Teams Three and Five did not demonstrate significant effects. Results can be found in Tables 1.9 through 1.16.

Understanding Team Performance and Team Cohesion 27
Table 1.9. ARIMA (0,0,1) Model Predicting Team 1 P-N Cohesion Dimension
________________________________________________________________________ Predictor B SE t ________________________________________________________________________ MA[1] .895 .091 9.817**** Teamwork Skills Training 5.673 1.644 3.452*** ________________________________________________________________________ *** p < .01 **** p < .001
Table 1.10. ARIMA (1,0,0) Model Predicting Team 2 P-N Cohesion Dimension
________________________________________________________________________ Predictor B SE t ________________________________________________________________________ AR[1] .440 .139 3.170*** Teamwork Skills Training 3.268 1.336 2.446*** ________________________________________________________________________ *** p < .01
Table 1.11. ARIMA (1,0,0) Model Predicting Team 3 P-N Cohesion Dimension
________________________________________________________________________ Predictor B SE t ________________________________________________________________________ AR[1] .743 .112 6.607**** Teamwork Skills Training -1.159 2.127 -.545 ________________________________________________________________________ **** p < .001
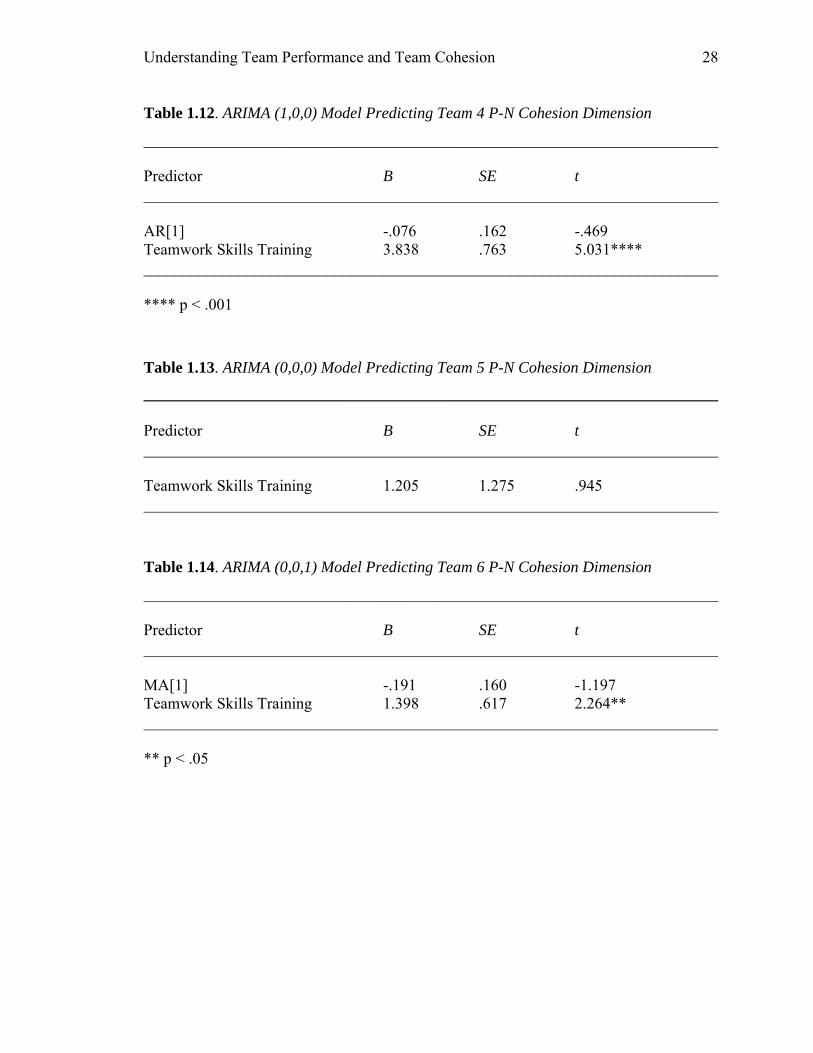
Understanding Team Performance and Team Cohesion 28
Table 1.12. ARIMA (1,0,0) Model Predicting Team 4 P-N Cohesion Dimension
________________________________________________________________________ Predictor B SE t ________________________________________________________________________ AR[1] -.076 .162 -.469 Teamwork Skills Training 3.838 .763 5.031**** ________________________________________________________________________ **** p < .001
Table 1.13. ARIMA (0,0,0) Model Predicting Team 5 P-N Cohesion Dimension
________________________________________________________________________ Predictor B SE t ________________________________________________________________________ Teamwork Skills Training 1.205 1.275 .945 ________________________________________________________________________
Table 1.14. ARIMA (0,0,1) Model Predicting Team 6 P-N Cohesion Dimension
________________________________________________________________________ Predictor B SE t ________________________________________________________________________ MA[1] -.191 .160 -1.197 Teamwork Skills Training 1.398 .617 2.264** ________________________________________________________________________ ** p < .05

Understanding Team Performance and Team Cohesion 29
Table 1.15. ARIMA (1,0,0) Model Predicting Team 8 P-N Cohesion Dimension
________________________________________________________________________ Predictor B SE t ________________________________________________________________________ AR[1] .567 .138 4.100**** Teamwork Skills Training 3.383 1.966 1.721** ________________________________________________________________________ ** p < .05 **** p < .001
Table 1.16. ARIMA (0,0,0) Model Predicting Team 10 P-N Cohesion Dimension
________________________________________________________________________ Predictor B SE t ________________________________________________________________________ Teamwork Skills Training 1.256 .927 1.355* ________________________________________________________________________ * p < .10

Understanding Team Performance and Team Cohesion 30
Finally, five teams out of eight (Teams Two through Four, Six, and Eight) showed increased social cohesion levels (U-D dimension) following the team training intervention. Teams One, Five, and Ten did not show significant increases in the U-D measure of cohesion. Results for these analyses can be found in Tables 1.17 through 1.24.
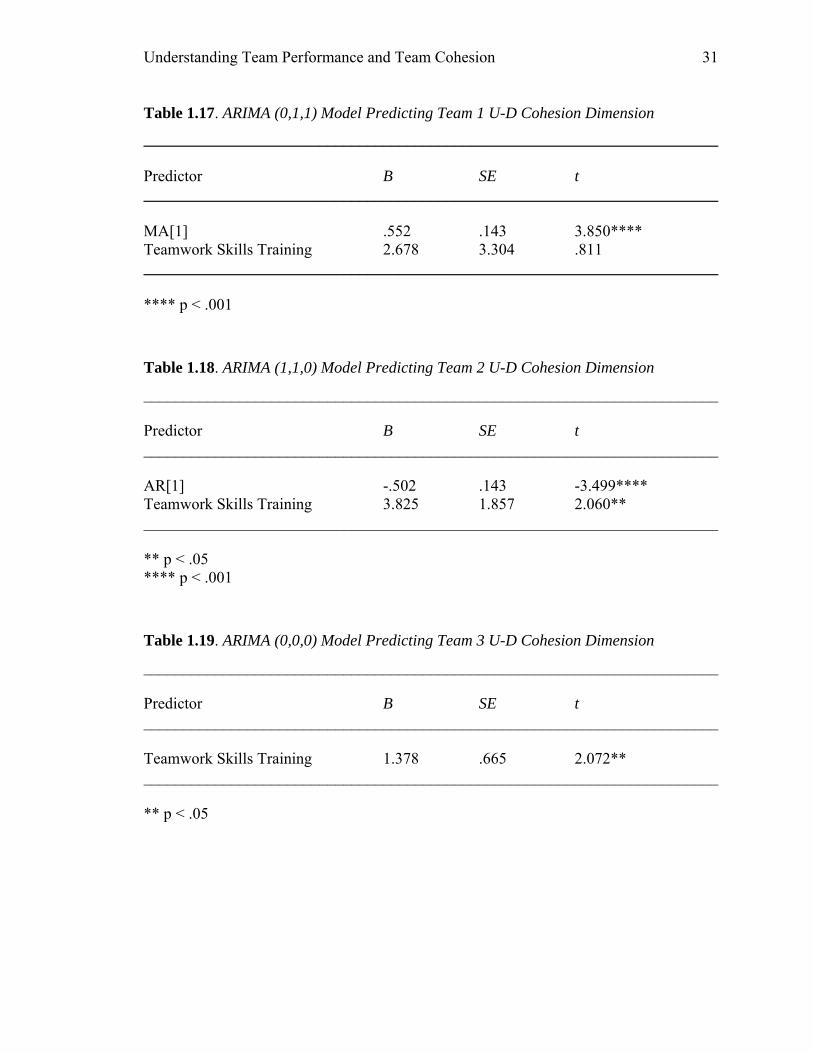
Understanding Team Performance and Team Cohesion 31
Table 1.17. ARIMA (0,1,1) Model Predicting Team 1 U-D Cohesion Dimension
________________________________________________________________________ Predictor B SE t ________________________________________________________________________ MA[1] .552 .143 3.850**** Teamwork Skills Training 2.678 3.304 .811 ________________________________________________________________________ **** p < .001
Table 1.18. ARIMA (1,1,0) Model Predicting Team 2 U-D Cohesion Dimension
________________________________________________________________________ Predictor B SE t ________________________________________________________________________ AR[1] -.502 .143 -3.499**** Teamwork Skills Training 3.825 1.857 2.060** ________________________________________________________________________ ** p < .05 **** p < .001
Table 1.19. ARIMA (0,0,0) Model Predicting Team 3 U-D Cohesion Dimension
________________________________________________________________________ Predictor B SE t ________________________________________________________________________ Teamwork Skills Training 1.378 .665 2.072** ________________________________________________________________________ ** p < .05

Understanding Team Performance and Team Cohesion 32
Table 1.20. ARIMA (0,1,1) Model Predicting Team 4 U-D Cohesion Dimension
________________________________________________________________________ Predictor B SE t ________________________________________________________________________ MA[1] .999 19.217 .052 Teamwork Skills Training 2.525 .976 2.586*** ________________________________________________________________________ *** p < .01
Table 1.21. ARIMA (0,0,0) Model Predicting Team 5 U-D Cohesion Dimension
________________________________________________________________________ Predictor B SE t ________________________________________________________________________ Teamwork Skills Training .005 .964 .061 ________________________________________________________________________
Table 1.22. ARIMA (0,1,1) Model Predicting Team 6 U-D Cohesion Dimension
________________________________________________________________________ Predictor B SE t ________________________________________________________________________ MA[1] .999 9.023 .111 Teamwork Skills Training 2.285 1.097 2.084** ________________________________________________________________________ ** p < .05

Understanding Team Performance and Team Cohesion 33
Table 1.23. ARIMA (0,0,1) Model Predicting Team 8 U-D Cohesion Dimension
________________________________________________________________________ Predictor B SE t ________________________________________________________________________ MA[1] -.256 .157 -1.624 Teamwork Skills Training 2.129 1.255 1.696** ________________________________________________________________________ ** p < .05
Table 1.24. ARIMA (0,1,1) Model Predicting Team 10 U-D Cohesion Dimension
________________________________________________________________________ Predictor B SE t ________________________________________________________________________ MA[1] .571 .139 4.109**** Teamwork Skills Training .838 2.089 .401 ________________________________________________________________________ **** p < .001

Understanding Team Performance and Team Cohesion 34
An interrupted time series analysis was also employed to analyze the temporal effects of teamwork skills training on team performance. However, there were no significant differences in team performance levels following the team training intervention. Results can be found in Tables 1.25 through 1.32.

Understanding Team Performance and Team Cohesion 35
Table 1.25. ARIMA (0,0,1) Model Predicting Performance for Team 1
________________________________________________________________________ Predictor B SE t ________________________________________________________________________ MA[1] -.113 .161 -.700 Teamwork Skills Training -6.012 4.079 -1.488 ________________________________________________________________________
Table 1.26. ARIMA (0,0,0) Model Predicting Performance for Team 2
________________________________________________________________________ Predictor B SE t ________________________________________________________________________ Teamwork Skills Training -4.872 3.655 -1.333 ________________________________________________________________________
Table 1.27. ARIMA (0,0,1) Model Predicting Performance for Team 3
________________________________________________________________________ Predictor B SE t ________________________________________________________________________ MA[1] -.408 .153 -2.668** Teamwork Skills Training 5.152 4.998 1.031 ________________________________________________________________________ ** p < .05
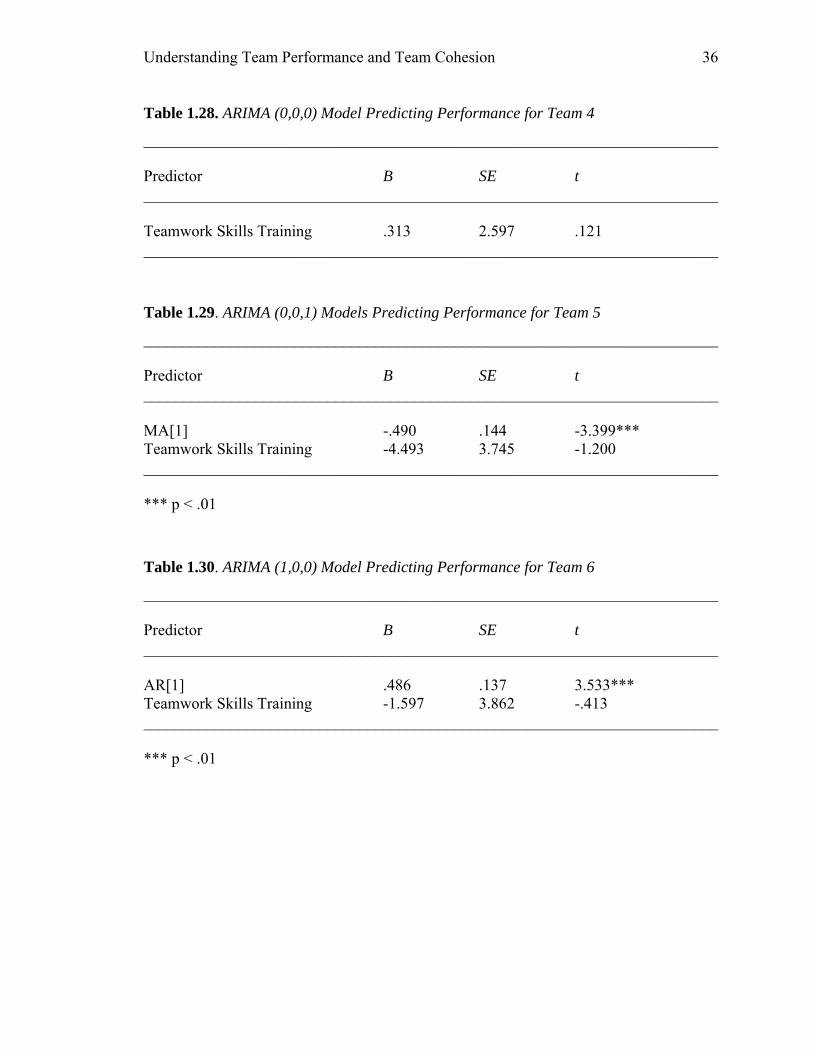
Understanding Team Performance and Team Cohesion 36
Table 1.28. ARIMA (0,0,0) Model Predicting Performance for Team 4
________________________________________________________________________ Predictor B SE t ________________________________________________________________________ Teamwork Skills Training .313 2.597 .121 ________________________________________________________________________
Table 1.29. ARIMA (0,0,1) Models Predicting Performance for Team 5
________________________________________________________________________ Predictor B SE t ________________________________________________________________________ MA[1] -.490 .144 -3.399*** Teamwork Skills Training -4.493 3.745 -1.200 ________________________________________________________________________ *** p < .01
Table 1.30. ARIMA (1,0,0) Model Predicting Performance for Team 6
________________________________________________________________________ Predictor B SE t ________________________________________________________________________ AR[1] .486 .137 3.533*** Teamwork Skills Training -1.597 3.862 -.413 ________________________________________________________________________ *** p < .01

Understanding Team Performance and Team Cohesion 37
Table 1.31. ARIMA (0,0,0) Model Predicting Performance for Team 8
________________________________________________________________________ Predictor B SE t ________________________________________________________________________ Teamwork Skills Training -.439 3.137 -.140 ________________________________________________________________________
Table 1.32. ARIMA (0,1,1) Model Predicting Performance for Team 10
________________________________________________________________________ Predictor B SE t ________________________________________________________________________ MA[1] .777 .111 7.000**** Teamwork Skills Training -4.560 8.323 -.548 ________________________________________________________________________ **** p < .001

Understanding Team Performance and Team Cohesion 38
Discussion
Results were consistent with the principle hypothesis that a targeted team-training program can enhance cohesion. In this sense, Study 1 was replicated. Study 2 data demonstrated that, for the majority of the teams, training based on the teamwork components model raised task cohesion and social cohesion above baseline levels. For the F-B dimension reflecting task cohesion, seven teams out of eight (88%) showed increased post-intervention effects. For the P-N and U-D markers of social cohesion, six teams (75%) and five teams (63%) respectively exhibited significant effects following the intervention. However, the hypothesis that the teamwork training would increase performance was not supported. None of the teams demonstrated significant training effects on this dependent variable.
Methodologically, the use of a longitudinal design, ARIMA statistics, and
manipulation of the independent variable lend strong support for the conclusion that this training program produced rapid enhancements in cohesion. This combination defends the data against many alternative explanations for the findings. For example, the results cannot be due to differences between participants or teams because each team served as their own control (Affleck, Zautra, Tennen, & Armeli, 1999). The longitudinal design and statistical procedures were able to control for spurious factors as explanations for the significant results (West & Hepworth, 1991).
Despite the favorable results, Study 2 had limitations. For example, time
staggered interventions could have served as another level of control and helped to establish the changes in cohesion were due to the training as opposed to maturation, although the immediacy of the effect would argue against that alternative interpretation (Kazdin, 1998; Meltzoff, 1998). Several threats to external validity are also apparent. For example, the participant pool predominantly consisted of American female students. We did not investigate the effects of sex, age, or cultural differences within teams, which may have significantly altered or impacted the performance and the development and maintenance of team cohesion (Early & Erez, 1997). In addition, self-selection may have been another threat. Study 2 participants enrolled in a team-based I/O class and because of their academic interests they may have been particularly primed for such an intervention, given that they enrolled in a course to study such phenomena.

Understanding Team Performance and Team Cohesion 39
CONCLUSIONS FOR STUDIES FOCUSING ON COHESION
Taken as a whole, the implications of these two studies on team cohesion are potentially far reaching. The training program employed would not be difficult to implement in other contexts, given that it required little time, few resources, and was quite favorably evaluated. Most importantly, it was empirically derived and demonstrated impressive effects utilizing an experimental design and advanced statistical methods of inference. In other words, the training might be used as a model by organizations whose goal is to improve team cohesion and as a result, performance.
Furthermore, several human resource procedures may benefit from the results
provided in the two studies. For example, in personnel selection, the jobs for which individuals are chosen are examined to determine what tasks and responsibilities will be required (Cascio, 1998). The specification of the domain of job tasks is followed by the generation of hypotheses concerning the knowledge, skills, abilities, and other characteristics (KSAOs) required of these individuals who must perform these tasks (Schmitt & Chan, 1998). Since so many organizations are now employing teams, logic would suggest that the ability to work within a team would have to become part of those KSAOs. This training program, and the cohesion literature that it was built upon, could provide practicing I/O psychologists with specific, empirically supported behaviors on which to assess potential applicants. Moreover, performance appraisals for incumbent team members potentially could be improved by incorporating the teamwork components framework used. These objective criteria might include, for instance, how effectively and how often a team member communicates, provides feedback, or monitors the behaviors of other team members.
These data also have potential implications for understanding and overcoming the
natural course of team development. The team skills training may act as a buffer or antidote against the "storming" stage of team maturation. As you may recall, when a team enters the storming stage, conflicts theoretically erupt as members try to reach an agreement on the purpose, goals, and objectives of the team (Tuckman, 1965; Bell, 1982). Study 1 demonstrated that team members who were trained in this teamwork model within the first weeks of team creation showed the ability to quickly work together as a cohesive unit and appeared to develop as a team without a storming period. In effect, it appeared that training allowed teams to bypass or quickly move through this chaotic stage. Participants in both studies demonstrated immediate improvements in cohesion that could be seen as further evidence that such training accelerates teams into more advanced "norming" or "performing" stages.
The primary purpose of this research was to train team members on fundamental
teamwork concepts so as to develop measurable improvements in team cohesion, with an additional criterion in Study 1 of performance on an academic task. Subsequent research should be conducted to determine the applicability of these findings to other settings of interest, including non-intellectual or physical tasks. It would also be interesting to analyze the efficacy of the intervention on global teams due to the increasing number of multicultural teamwork within organizations. Other areas of interest would be the extent
Understanding Team Performance and Team Cohesion 40
to which the program could be adapted to multiple formats. For instance, with the increasing reliance on virtual teams and internet training (Avolio, Kahai, Dumdum & Sivasubramaniam, 2001), it would be worthwhile to know if this training program could be entirely modified to manual, computer, or video format with no loss in effectiveness. Furthermore, the study was only concerned with the effects of team training on newly formed interdependent teams. Therefore, the utility of the intervention on established teams or on other brands of teams cannot be determined within these studies' limited framework but would be an ideal subject of future investigation.
Methodological considerations should also be taken into account for future
research. For example, the number and the type of team assignments given to student learning teams are important factors (Feichtner & Davis, 1984). Negative teamwork attitudes resulting from too many performance measurements may ultimately erode cohesion. Another improvement on the current studies would involve the use of staggered interventions, which could provide the basis for stronger conclusions regarding the effect of the training program effectiveness. Finally, the SYMLOG Adjective Rating Form should be considered an appropriate assessment tool for any within-person or within-team study of cohesion given that its psychometric properties lend itself to longitudinal analysis.
It is hoped that this research project will serve as another catalyst for longitudinal
and repeated measures research. Improved statistical methods and research designs are now available for better understanding of prospective relationships between team cohesion and team performance. Researchers should capitalize on these techniques whenever possible to recognize the complex workings of the development and maintenance of cohesive work teams.

Understanding Team Performance and Team Cohesion 41
PHASE 2: STUDY 2
One area of team research of interest to the present study is that of the evolution and maturation of team behaviors and teamwork over time. A traditional view of team development maintains that it is linear; progressing through specific phases, wherein one phase must be completed prior to progressing to the next phase (Morgan, Salas & Glickman, 1993). However, a more recent view of team development proposes that developmental stages are more informal and indistinct than previously thought. The team's progress through these stages is not necessarily linear, and there may be a number of alternate paths through these stages. This second view of team development is referred to as the Team Evolution And Maturation (TEAM) Model, and was proposed by Morgan, Salas, and Glickman (1993). The maturation of team behaviors over time is one concept examined in the present study.
Another team issue of interest to this study is the occurrence of counterproductive behavior in teams. Counterproductive behavior is defined as "voluntary behavior that violates significant organizational norms and in doing so threatens the well-being of the organization, its members, or both" (Boye & Jones, 1997, p. 173). This type of behavior can be potentially disastrous for organizations, with possible outcomes such as incurring debt and having to deal with litigation issues. It includes such behaviors as absenteeism, vandalism, theft, sabotage, substance abuse, insubordination, passive aggression, and violence, just to name a few (Hogan & Hogan, 1989). Of interest to the present study is one particular form of counterproductive behavior: social loafing.
Social Loafing
The concept of social loafing is defined as "a decrease in individual effort due to the social presence of other persons" (Latané, Williams & Harkins, 1979, p. 823). This concept is also occasionally defined in terms of group size in that larger groups have a greater likelihood of increased social loafing than smaller groups (Kerr & Bruun, 1983). The first historical mention of loafing, although it was not labeled as such until much later, came from an unpublished report by a German psychologist named Ringelmann in the 1920s (Latané, Williams & Harkins, 1979). In this study, Ringelmann had workers pull on a rope as hard as they could, either alone, or in groups of 2, 3, or 8. Ringelmann measured the force exerted by each worker individually as well as the total effort by the groups. He found that as more people were added to the groups, less individual effort was exerted. Specifically, using the measurements from the individuals pulling the rope alone, he found that the sum of this effort was considerably less than what was actually exerted when more than one worker was pulling the rope. This difference between individual force and group force increased as the size of the group increased. Since that time, a great deal of research on social loafing has been accumulated. Three major moderators of loafing have been identified: identifiability, dispensability, and equity theory.
Understanding Team Performance and Team Cohesion 42
Identifiability Social facilitation theory states that people are aroused by the mere presence of other individuals, so that they are likely to work harder when with a group of people than when alone (Latané, Williams & Harkins, 1979). This fits nicely with the rationale behind utilizing teams, in that a group of individuals will achieve more through collective action than they would alone. However, social facilitation theory appears to be directly opposed to the idea of social loafing. This is not to say that the two concepts are completely incompatible, only that clarification is needed. Studies of social loafing have shown that in fact people do not necessarily work harder or more efficiently in groups, and this loafing effect increases when group size is increased. However, one factor that has been found to decrease loafing is identifiability. When individuals working in a team are aware that their own specific efforts will be examined separately from the collective effort of the group, loafing tends to decrease or even disappear. This may be due to a type of performance anxiety called "evaluation apprehension" (Latané, Williams & Harkins, 1979). That is, if people know they are being monitored, and the subsequent evaluation of their performance has some importance to them, then efforts to work will typically increase. With regard to social facilitation theory, although arousal may very well be increased, which may lead to increased output, it is unlikely that the arousal is due solely to the mere presences of others.
Identifiability is such a strong phenomenon that even in situations where individuals performed some task alone, but were informed their specific output would not be connected to them, levels of effort exerted still decreased (Williams, Harkins & Latané, 1981). The concept of identifiability is critical for two main reasons. First, if individual performance is evaluated, team members will be motivated to work harder, due to feelings such as evaluation apprehension. Second, the contingency between effort and outcome is established (Latané, Williams & Harkins, 1979; Williams, Harkins & Latané, 1981). Information from Seligman's theory of learned helplessness can aid in understanding contingencies. If no connection is made between the efforts one makes and the outcome, the contingency is not established, and several detrimental effects can result from this, including loss of motivation, severe depression, and even death (Williams, Harkins & Latané, 1981). Of course, for the purposes of the present study, lacking a contingency would not be likely to result in anything so severe. However, the loss of motivation from the lack of an effort-outcome contingency may very well result from an individual's efforts being unidentifiable within a team setting. One proposition concerning the idea of unidentifiability is that these individuals "seem to feel less motivated to perform well, either because they are unable to reap their proper rewards, or because they can 'get away' with taking it easy without incurring criticism or blame" (Williams, Harkins & Latané, 1981, p. 303).
Understanding Team Performance and Team Cohesion 43
Dispensability Perceptions of dispensability by team members have been shown to increase the likelihood of social loafing. That is, if a team member feels that others in the group are more capable or working harder than that member, this may result in a perception that his or her own efforts have less value to the group, hence, they will seem superfluous and dispensable (Kerr & Bruun, 1983). This feeling that one's efforts are less noticeable to other team members is increased as the team becomes larger. In situations like these, it is easy to feel "lost in the crowd" and decrease one's input to the group. This phenomenon is also called the "free rider effect" (Kerr & Bruun, 1983). Another factor related to dispensability is the degree of competence of each team member. Novices have been found to be more prone to loaf in the presence of more competent or capable teammates (Hardy & Crace, 1991). Equity Theory The third main moderating factor of social loafing comes from equity theory. This concept has been described as a "theory of motivation that suggests that behavior is motivated by the desire to reduce guilt or anger associated with social exchanges that are perceived to be unfair" (Wagner & Hollenbeck, 1998). This implies that if an individual feels that the division of labor is unequal among the members of the team, he or she will recognize the unfairness of the situation and take action to rectify it (Latané, Williams & Harkins, 1979). In some situations, this action will take the form of the "sucker effect" (Kerr, 1983). The "sucker effect" is defined as reduced efforts of group members who have capable partners free-riding on their efforts (Matsui, Kakuyama & Onglatco, 1987). These reduced efforts are a method of restoring an equal diffusion of responsibility to the group. Some individuals feel so strongly about this injustice that they would rather fail at a task instead of playing the role of the "sucker" (Kerr, 1983). It should be noted that these moderating effects on social loafing seem to apply primarily to individualistic cultures, such as the United States. Several studies have been conducted that dealt with the influence of individualism and collectivism on the occurrence of social loafing. The majority of these studies have found the incidence of social loafing in collectivistic societies to be very low or non-existent. Collectivism is typically defined in group interactions as the subordination of personal interests, with the emphasis placed instead on group welfare and harmony and on goal attainment (Earley, 1989). Individualism is the opposite end of this dimension, representing the celebration of personal gain and self-sufficiency (Earley, 1989). According to the definition of the concept, collectivists would not be expected to exhibit social loafing due to its potential harmful effect on the team. Indeed, studies comparing Chinese and American individuals (Earley, 1989), and Israeli kibbutz individuals and their urban counterparts (Erez & Somech, 1996) have found that those individuals from collectivist cultures loaf considerably less, if at all, than comparable individuals from individualist cultures. Therefore, the applicability of the body of social loafing research to collectivist cultures is questionable, and in fact may be highly inappropriate. This is

Understanding Team Performance and Team Cohesion 44
not to say that social loafing does not occur within collectivist groups. As Earley (1989) has pointed out, it may just occur under circumstances that differ from those of individualist groups. Limitations of Previous Social Loafing Research
Although the quantity of research available on social loafing is quite large, there are still some limitations to this area of research. First, the majority of the studies have used physical tasks to measure performance and loafing. These studies have utilized noise production, such as shouting, cheering or clapping; and motor production tasks, like rowing, squeezing a rubber bulb, or pulling a rope (Hardy & Latané, 1988). Since the majority of teams used in the workplace typically never deal with physical situations such as the ones described above, the application of these studies' results is questionable. There have been some social loafing experiments dealing with more cognitive tasks, such as evaluating essays, brainstorming, and vigilance tasks (Hardy & Latané, 1988). Although this is heartening, the more cognitive tasks are severely underrepresented in the literature. One of the aims of the present study is to observe social loafing in conditions that are more applicable to workplace situations.
A second limitation of the loafing research is the use of "pseudo groups" (Erez & Somech, 1996). Most of the research investigating social loafing utilizes experimental settings in which one individual is led to believe he or she is part of a team. Often there are no other team members, or partitions and such may separate them. Erez and Somech (1996) argue that this use of artificial groups violates the very definition of a team because it dies not account for "people's mutual awareness and potential mutual interaction " (p. 1515). In fact, the definition of "team" selected for the present study emphasizes the component of interdependent and adaptive interaction. Erez and Somech (1996) go on to assert that, theoretically, loafing should not occur if the full conditions of the definition of a group are met. In fact, in their study, loafing occurred in only one of 16 conditions, and that one instance was eliminated when all the groups were encouraged to communicate. The present study observed teams that interacted a great deal, thus satisfying the definition of a team.
A third limitation of the research on loafing is that it has primarily focused on situational factors, such as the composition of the team, identifiability, and contingencies. Of course, the information gathered on moderating factors can be incredibly beneficial to organizations in order to prevent loafing or make less favorable conditions available for loafing to occur. The following list represents steps that may be taken to reduce the likelihood of the occurrence of social loafing:
1. Create specific group and individual goals to reduce dispensability (Matsui, Kakuyama & Onglatco, 1987)
2. Allow individuals the opportunity to make unique contributions (Hardy & Latané, 1988)

Understanding Team Performance and Team Cohesion 45
3. Increase identifiability through mandated personal accountability or feedback from other team members (Matsui, Kakuyama & Onglatco, 1987)
4. Make credit or blame contingent on individual performance (versus overall group performance) (Latané, Williams & Harkins, 1979)
However, these factors will only help make loafing less severe, and are not guarantees of eliminating the phenomenon. In fact, Hardy and Latané (1988) have called social loafing " a rather robust phenomenon, threatening effective collective endeavor" (p. 109). This seems to imply that loafing is an endemic aspect of work teams that we can moderate, but not totally obliterate. While this may or may not be accurate at the current time, at least in individualistic cultures, more research is needed before this can truly be determined. In fact, one area of research that has been neglected by social loafing experts is a line of investigation examining more personal, individual factors. One study did attempt to discover whether some individuals are more prone to loafing by measuring various personality traits (Cohen, 1988). The author did not find any support for her idea, and concluded that the results may indicate that "loafing is such a strong phenomenon that individuals loaf regardless of their personality" (Cohen, 1988 p. 1431B). This is an intriguing statement, considering that researchers have not identified all the influencing factors that lead people to loaf, but if personality does not create tendencies to loaf, which personal factors do? Perhaps the answer is simpler than complex multitrait personality variables. Perhaps the tendency for certain individuals to loaf is simply a result of their current mood. One purpose of the present study is to investigate the influence affective state has on team processes, including the occurrence of social loafing.
Affect
Affect is typically described in terms of two broad dimensions: positive affect and negative affect (Watson, Clark & Tellegen, 1988). These are two separate dimensions, largely independent of each other, with each reflecting a different continuum of mood. Positive affect (PA) is described as the extent to which one feels enthusiastic, alert, and active. An individual at the high end of PA would experience high levels of energy, be able to concentrate or focus easily, and have a general feeling of pleasurable engagement. Low positive affect, on the other hand, is characterized by lethargy and sadness. Negative affect (NA) is generally defined as subjective distress or unpleasant engagement. The high end of the spectrum is characterized by moods of anger, contempt, disgust, guilt, fear and nervousness. Low NA represents calmness and serenity. These two factors of affect are representative of state dimensions. However, there is some evidence that PA and NA are related to the affective trait dimensions of positive and negative emotionality (Watson, Clark & Tellegen, 1988). For the purposes of the present study, the focus will be on affective state, rather than trait.
One study of affect investigated it in connection to social interaction whereby the
researchers manipulated a social setting to be either naturalistic or induced (McIntyre, Watson, Clark & Cross, 1991). The authors found that only positive affect had a relationship to social interaction, and that regardless of the setting, levels of PA would experience a temporary increase immediately after the interaction. This reiterates the
Understanding Team Performance and Team Cohesion 46
idea that positive affect was believed to be related to social activity and general satisfaction (Watson, Clark & Tellegen, 1988). Negative affect has been shown to be associated with self-reported stress, poor coping strategies, and health complaints.
There is some evidence to suggest that an individual's moods can influence the
collective mood of a team. This idea of "group affect" has been studied in relation to both organizational climate and team cohesiveness. The literature on this topic proposes two primary methods of inducing moods in others, both of which are believed to be viable options (Totterdell, Kellett, Teuchmann & Briner, 1998). The first method involves the comparison of oneself with another, wherein conscious processing of the other's mood takes place, and is subsequently experienced by the observer. The second method is called "emotional contagion," and is described as a phenomenon where one individual mimics another's emotional expression, and receives feedback from experiencing that expression, which leads the individual to experience the mood he or she was mimicking.
One study investigated "mood linkage" with work teams (Totterdell, Kellett,
Teuchmann & Briner, 1998). Mood linkage is described as a temporal association between people's moods. The link created between two or more people due to mood occurs when "one rhythmic process causes or is caused to oscillate with the same frequency as another" (Totterdell, Kellett, Teuchmann & Briner, 1998, p. 1505). Essentially, by associating with other individuals, one's own rhythm of mood states affects and is affected by the rhythms of others' mood states, so that there is some degree of synchronicity. The results of the study indicate that mood linkage does occur within groups, and this effect is stronger when the team members are older, more committed to the team, perceive a more positive team climate, or experienced fewer hassles with their teammates.
Time Series Analysis and the Interrupted Time Series Experiment
One area of interest to the present study is the evolution and maturation of teams. "Maturation" implies a time dimension, in that the performance of teams will be evaluated over time. Therefore, once again, time series analysis and interrupted time series analysis were used to investigate team maturation, the effects of team training, and the covariation between performance, social loafing, and affective state. We do not repeat the background information on time series analysis here. We do bring in new information that had not been covered in the previous study that used time series analysis. AUTOBOX
In this study, we chose to use a statistical program referred to as AUTOBOX to carry out the analyses. AUTOBOX (referring roughly to automatic software for carrying out Box-Jenkins analyses) has the ability to serve as an expert system in identifying unforeseen memory structure and functions within the data set. It also has the capability to detect automatically the existence of temporary and permanent shifts in the data series.

Understanding Team Performance and Team Cohesion 47
Transfer Function Model
For a detailed description of the technical details of the analyses used in this study, see Appendix D. In this section we present a conceptual overview of single-predictor and multiple-predictor transfer function analysis. For each team, the relationship between two variables apropos of the hypothesis was assessed through transfer function analysis. A transfer function is the time-series-analysis equivalent of a regression model. One can have single-predictor and multiple-predictor transfer functions. In this study, hypotheses were expressed in terms of single-predictor transfer functions (equivalent to bivariate correlations). However, because the software (described below) is fundamentally an expert system, it can be and was used to detect certain “predictors” such as the various lags of one of a predictor, pulses in the dependent measure, and level shifts in the dependent measure. In effect, the latter three can be considered predictors themselves, although in this study not hypothesized in many instances. If the software detected predictors over and above the hypothesized predictor, the effective function was multiple-predictor in nature.
Let us recover from that deviation to a straightforward description of multiple-
predictor transfer function. Simply put, it is a linear-regression equation in which the autodependence in the dependent and predictor variables is controlled for. In linear regression, the regression coefficients are examined to determine whether a predictor significantly predicts a dependent variable. In transfer function analysis, there are two types of prediction coefficients, similar to regression coefficients. An omega coefficient applies to different lagged values of the predictors. As such, an omega can be interpreted as the partialed change in the dependent variable per unit change in the predictor variable at different time lags. A delta coefficient applies to different lagged values of the dependent variable. There is no straightforward linear-regression analogue to the delta coefficient. In point of fact, a delta coefficient also expresses the relationship between the predictor(s) and the dependent variable—but indirectly through different lagged values of the dependent variable. By examining the standard errors of the omega and delta coefficients, and computing a Z statistic (sometimes referred to as T), one can test hypotheses concerning the relationship between the focal dependent variable and the predictor(s). Mathematically, the delta coefficients serve as a more elegant and parsimonious way of describing relationships (Wei, 1990).
The Present Study
Based on the evidence of a relationship between group members' affective states
and group performance, and the hypothesis that team members' affect may be an influencing variable in the incidence of social loafing, the goal of the present study was to investigate the relationships between affective state, social loafing, and team performance over time. The following comprise the specific hypotheses:
1. The affective state of the individual team members is correlated with the
degree of social loafing within the teams. Specifically,
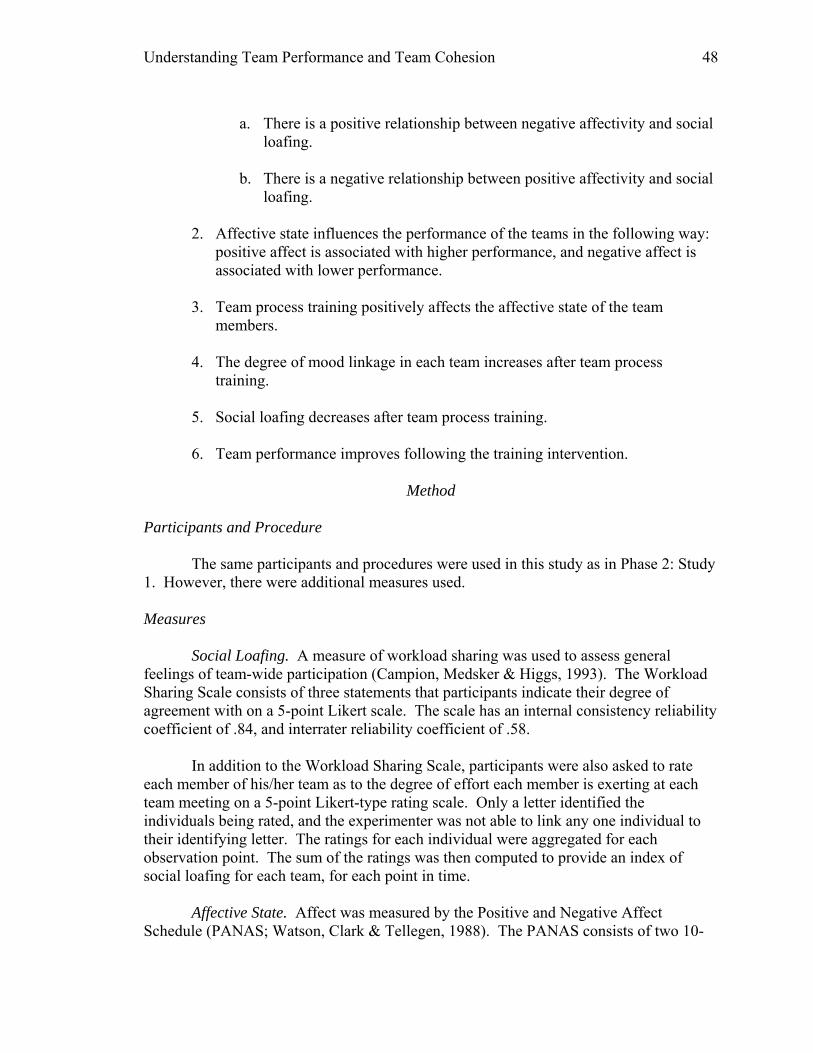
Understanding Team Performance and Team Cohesion 48
a. There is a positive relationship between negative affectivity and social
loafing. b. There is a negative relationship between positive affectivity and social
loafing.
2. Affective state influences the performance of the teams in the following way: positive affect is associated with higher performance, and negative affect is associated with lower performance.
3. Team process training positively affects the affective state of the team
members. 4. The degree of mood linkage in each team increases after team process
training. 5. Social loafing decreases after team process training.
6. Team performance improves following the training intervention.
Method
Participants and Procedure The same participants and procedures were used in this study as in Phase 2: Study 1. However, there were additional measures used. Measures
Social Loafing. A measure of workload sharing was used to assess general feelings of team-wide participation (Campion, Medsker & Higgs, 1993). The Workload Sharing Scale consists of three statements that participants indicate their degree of agreement with on a 5-point Likert scale. The scale has an internal consistency reliability coefficient of .84, and interrater reliability coefficient of .58.
In addition to the Workload Sharing Scale, participants were also asked to rate each member of his/her team as to the degree of effort each member is exerting at each team meeting on a 5-point Likert-type rating scale. Only a letter identified the individuals being rated, and the experimenter was not able to link any one individual to their identifying letter. The ratings for each individual were aggregated for each observation point. The sum of the ratings was then computed to provide an index of social loafing for each team, for each point in time.
Affective State. Affect was measured by the Positive and Negative Affect Schedule (PANAS; Watson, Clark & Tellegen, 1988). The PANAS consists of two 10-

Understanding Team Performance and Team Cohesion 49
item scales, rated on a 5-point Likert scale. Positive Affect (PA) is described as reflecting a mood state in which one feels energetic and alert. Negative Affect (NA) assesses subjective distress and other aversive mood states. The PA and NA scales are independent dimensions of mood states. Participants must rate each of the 20 mood adjectives to the degree with which they experienced that mood on the current day. Internal consistency reliability coefficients for the PA scale range from .86 to .90, and for the NA scale, from .84 to .87. In order to demonstrate that each scale "adequately capture[s] the underlying mood factors" (Watson, Clark & Tellegen, 1988, p. 1066), factorial scale validities were computed by correlating each scale (PA and NA) with two sets of factor scores. This resulted in convergent correlations between .86 and .96, and discriminant correlations from -.02 to -.18.
For each point in time, team members' affect (positive and negative) was summarized in two different ways to assess the relationship between it and social loafing, according to procedures and recommendations made by Neuman, Wagner, and Christiansen (1999). First, the mean level of each state was computed, which reflects team affect elevation. This was the primary measure used to analyze affective state. Second, the range for each state was computed. That is, the difference between the highest score and the lowest score for each team was computed to indicate team affect diversity. This range value was used to assess the degree of mood linkage in each team. A smaller range represented a higher degree of mood linkage. Due to the fact that affective state was measured over time, the measure must be able to reflect changes over each observation. The developers of the measure note that the test-retest reliability of the PANAS is .47 for PA and .39 for NA over an eight-week period (Watson, Clark, & Tellegen, 1988). Thus, it is possible to detect changes in affective state. However, the test developers point out that affective state has a "strong dispositional component" (Watson, Clark, & Tellegen, 1988, p. 1065). Therefore, regular and wide fluctuations in affective state would not be expected.
Team Performance. Team grades on the tri-weekly assignments were used to assess team performance. The professor of the class assigned these grades.
Statistical Analyses The present study used the ARIMA model of time series analyses, as described in the introduction. By way of summary, the following analyses were carried out within the time series paradigm.
1. The correlation between team members' affect and social loafing was examined as a part of the time series design. Correlations were computed through the analysis of transfer functions between hypothesized covariates.
2. The correlation between team performance and team member affect was assessed.

Understanding Team Performance and Team Cohesion 50
3. The effect of team training on social loafing, affective state, and team performance was assessed.
Training Program
The training program used in this study is the same one discussed in Phase 2: Study 1.
Results The results of the statistical analyses pertaining to the hypothesized relationships between variables as well as the effects of training are summarized in Tables 2.1 through 2.28. Tables 2.1 and 2.22 , specifically, provide a summary of the findings for the entire study. Only significant results were reported for purposes of brevity. Tables 2.2 through2.21 and 2.2 through 2.28 contain information pertaining to the parameters isolated by the statistical software that contribute to the forecasting model. A forecasting equation precedes each table, and contains only those parameters reaching significance. The remaining parameters in the tables are included for descriptive purposes only. Only the delta and omega parameters are of interest to the current study, and the results below are interpreted in terms of these two factors. The tables describing specific sets of variables will be mentioned in the appropriate sections below. Summary of Affective State Results
Table 2.1 shows a summary of significant results for the effects of affect state. As can be seen by the mixed results, the hypothesized relationships of social loafing, workload sharing, and performance with affect were not definitive.
Table 2. 1. Summary of Significant Results for the Effects of Affect State
____________________________________________________________ Social Loafing Workload Sharing Performance____ Team PA NA PA NA PA NA______ 1 x x x 2 x x 3 x x x 4 x x x x 5 6 x x x x x 8 x 10 x x________________ Note: an "x" designation indicates significance at p ≤.05

Understanding Team Performance and Team Cohesion 51
Affective State and Social Loafing
Positive Affect. Eight teams were examined concerning the effect of positive affective state on the incidence of social loafing. One team (Team 10, Table 2.4) exhibited a significant negative relationship between the two variables, consistent with the hypothesis. Team 6 (Table 2.3) also exhibited a negative relationship, albeit a more complex one. On a given observation, lower PA values led to high loafing values. In addition, a significant positive delta parameter was found for the loafing variable, with a lag of 1. This implies that the preceding value of loafing led to a higher value of loafing the following observation, indicating that loafing increased for this team over time. One team (Team 4, Table 2.2) demonstrated a positive relationship between positive affect and social loafing. Workload sharing was another variable used in the study to tap into loafing behavior. Both Team 4 (Table 2.10) and Team 6 (Table 2.11) revealed similar relationships as those found with the loafing variable, meaning the PA levels of Team 4 were negatively related to workload sharing, and Team 6 demonstrated a positive relationship between PA and workload sharing. Thus, mixed results were found with only two of the eight teams displaying the hypothesized relationship between the positive affect and social loafing.
Negative Affect. Two teams (6 and 8) showed a significant positive relationship
between negative affect and loafing. The results for Team 6 can be found in Table 2.8, and for Team 8, in Table 2.9. Team 4, as with the positive affect results, showed the reverse relationship (Table 2.7). Team 3 proved to have a more complex relationship between negative affect and loafing. The results of this analysis can be found in Table 2.6. On a given observation, the variables of negative affect and loafing had a positive relationship; meaning higher NA was associated with higher levels of loafing. However, there was a negative relationship between the variables at a lag of 1. This means that the value of negative affect on the previous observation negatively impacted the value of loafing on the current observation. This can be theoretically illustrated with an example. Let us assume that over the course of observation, both negative affect and loafing decrease. This reflects this first aspect of the relationship mentioned above. Regarding the second aspect, we can see that if the trend of the two values were downward, this would imply a higher value of negative affect on the previous observation relating to a lower value of social loafing on the current observation.
Workload sharing was shown to have a direct significant negative relationship
with only one team (Team 3, Table 2.13) out of the eight. Although negative affect had no significant impact on workload sharing for Team 1 (Table 2.5), a lagged relationship for workload sharing was found (Table 2.12). In essence, levels of workload sharing on a given observation were related to higher levels of workload sharing on the following observation, indicating an increase in workload sharing over time for this team.

Understanding Team Performance and Team Cohesion 52
Table 2. 2. Team 4: Positive Affect and Social Loafing
Yt = (.1574B3)X1 - 4.9956X2 - 5.0019X3 + at
Estimated Model Parameters Model Component Lag Time Coefficient St. Error p-value
Constant -0.6645 1.7805 0.7109AR factor 1 0.2806 0.1597 0.0863AR factor 3 -0.2150 0.1578 0.1804omega factor 3 0.1574 0.0708 0.0317Pulse 36 -4.9956 0.0347Pulse 41 -5.0019 0.0138Pulse 29 -3.3464 0.0636Pulse 37 2.9119 0.0758Significance level is p ≤.05
Table 2. 3. Team 6: Positive Affect and Social Loafing
Yt = 8.3396 + [(1 - .5419B)-1 (-.3306)]X1 + at Estimated Model Parameters
Model Component Lag Coefficient St. Error p-value Constant 8.3396 3.3526 0.0176delta factor 1 0.5419 0.2354 0.0265omega factor 0 -0.3306 0.0949 0.0012omega factor 2 -0.1006 0.0698 0.1569Significance level is p ≤.05
Table 2. 4. Team 10: Positive Affect and Social Loafing
Yt = 14.4844 - (.2479B2)X1 + at
Estimated Model Parameters Model Component Lag Time Coefficient St. Error p-value
constant 14.4844 3.6523 0.0003AR factor 1 -0.0957 0.1523 0.5333omega factor 2 -0.2479 0.0989 0.0161pulse 14 -7.1579 0.0830pulse 38 -6.9095 0.0738
Significance level is p ≤.05

Understanding Team Performance and Team Cohesion 53
Table 2. 5. Team 1: Negative Affect and Social Loafing
Yt = (4916B2)X1– 4.0784X2 + at Estimated Model Parameters
Model Component Lag Time Coefficient St. Error p-value Constant -3.0012 2.3441 0.2078AR factor 1 0.2626 0.1566 0.1013AR factor 3 0.2360 0.1584 0.1551Omega 1 0.2512 0.1954 0.2059Omega 2 -0.4916 0.1923 0.0145Pulse 29 -4.2382 0.0511Pulse 13 -4.0784 0.0347Pulse 37 -3.0582 0.0818Pulse 39 -2.8423 0.0780Pulse 31 -2.6317 0.0735Significance level is p ≤.05
Table 2. 6. Team 3: Negative Affect and Social Loafing
Yt = (.8118 + .8099B)X1 + (1 - .5093B)-1 + at
Estimated Model Parameters Model Component Lag Coefficient St. Error p-value
Constant -4.9658 3.5080 0.1645AR factor 1 0.5093 0.1344 0.0005Omega 0 0.8118 0.3141 0.0340Omega 1 -0.8099 0.3170 0.0144Significance level is p ≤.05

Understanding Team Performance and Team Cohesion 54
Table 2. 7. Team 4: Negative Affect and Social Loafing
Yt = 4.5806 - .2061X1 – 5.8033X2 – 5.1222X3 + [(1 - .4640B)] + at Estimated Model Parameters
Model Component Lag Time Coefficient St. Error p-value Constant 4.5806 1.4620 0.0032AR factor 1 0.4340 0.1405 0.0020AR factor 3 -0.2768 0.1561 0.0836Omega 0 -0.2061 0.0864 0.0218Pulse 41 -5.8033 0.0068Pulse 36 -5.1222 0.0036Significance level is p ≤.05
Table 2. 8. Team 6: Negative Affect and Social Loafing
Yt = .7630X1 + at Estimated Model Parameters
Model Component Lag Coefficient St. Error p-value constant -3.1257 3.6121 0.3917omega 0 0.7360 0.3344 0.0331Significance level is p ≤.05
Table 2. 9. Team 8: Negative Affect and Social Loafing
Yt = (.4950B8)X1 + at Estimated Model Parameters
Model Component Lag Coefficient St. Error p-value constant -2.9422 2.1945 0.1897omega 8 0.4950 0.1640 0.0043Significance level is p ≤.05

Understanding Team Performance and Team Cohesion 55
Table 2. 10. Team 4: Positive Affect and Workload Sharing
Yt = 17.6484 – (.0866B) + at Estimated Model Parameters
Model Component Lag Coefficient St. Error p-value Constant 17.6484 1.0177 0.0000Omega 1 -0.0866 0.0291 0.0048Omega 2 0.0300 0.0211 0.1616Significance level is p ≤.05
Table 2. 11. Team 6: Positive Affect and Workload Sharing
Yt = 7.6976 + .1045X1 + (1 - .2659B)-1 + at Estimated Model Parameters
Model Component Lag Coefficient St. Error p-value constant 7.6976 1.4741 0.0000AR factor 1 0.2659 0.1207 0.0331omega 0 0.1045 0.0293 0.0009Significance level is p ≤.05 Table 2. 12. Team 1: Negative Affect and Workload Sharing
Yt = 7.7652 + [(1 - .4709B)-1 ]X1 – 3.2012X2 + at Estimated Model Parameters
Model Component Lag Time Coefficient St. Error p-value Constant 7.7652 0.0000 0.0000Delta 1 0.4709 0.1000 0.0000Omega 0 -0.0998 0.1000 0.3244Omega 1 -0.0786 0.1000 0.4368Omega 2 -0.0263 1.0000Omega 3 0.0529 0.1000 0.6001Pulse 37 -3.2012 0.0114Significance level is p ≤.05

Understanding Team Performance and Team Cohesion 56
Table 2. 13. Team 3: Negative Affect and Workload Sharing
Yt = (-.1054B2 )]X1 – 1.1509X2 + .9407X3 + (1 - .3999B3)-1 + at
Estimated Model Parameters Model Component Lag Time Coefficient St. Error p-value
Constant 3.8673 2.6571 0.1541AR factor 1 0.1965 0.1532 0.2077AR factor 2 0.1534 0.1445 0.2952AR factor 3 0.3999 0.1635 0.0193Delta 1 -0.2084 0.3443 0.5487Omega 2 -0.1054 0.0408 0.0139Omega 3 -0.0352 0.0516 0.4994Omega 4 0.0383 0.0480 0.4297Pulse 43 -1.1509 0.0315Pulse 28 0.9407 0.0304Pulse 35 0.7347 0.0604Significance level is p ≤.05

Understanding Team Performance and Team Cohesion 57
Affective State and Performance Analyses were carried out to determine the impact of positive and negative affect on the performance of the teams. The results of these analyses can be found in Tables 2.14 through 2.21.
Positive Affect. Four teams (1, 2, 3, and 10) actually showed a decrease in performance as positive affect increased (Tables 2.14, 2.15, 2.16, and 2.18, respectively). The negative relationship found with Team 2 had an additional component. Positive affect negatively impacted performance with a lag of 1, meaning, PA on a given observation led to decreased performance on the following observation. However, the delta component of this relationship was shown to be significant as well, in a negative direction, with a lag of 1. This means that performance on the current observation negatively impacted the performance of the following observation, describing a decrease in performance over time. Team 6 (Table 2.17) was shown to have a positive relationship between PA and performance.
Negative Affect. The analysis of the impact of negative affect revealed that three
of the eight teams (Teams 2, 4, and 6) had a significant negative relationship with performance. (The results from these analyses can be found in Tables 2.19, 2.20, and 2.21, respectively.) That is, higher levels of negative affect resulted in lower levels of performance.
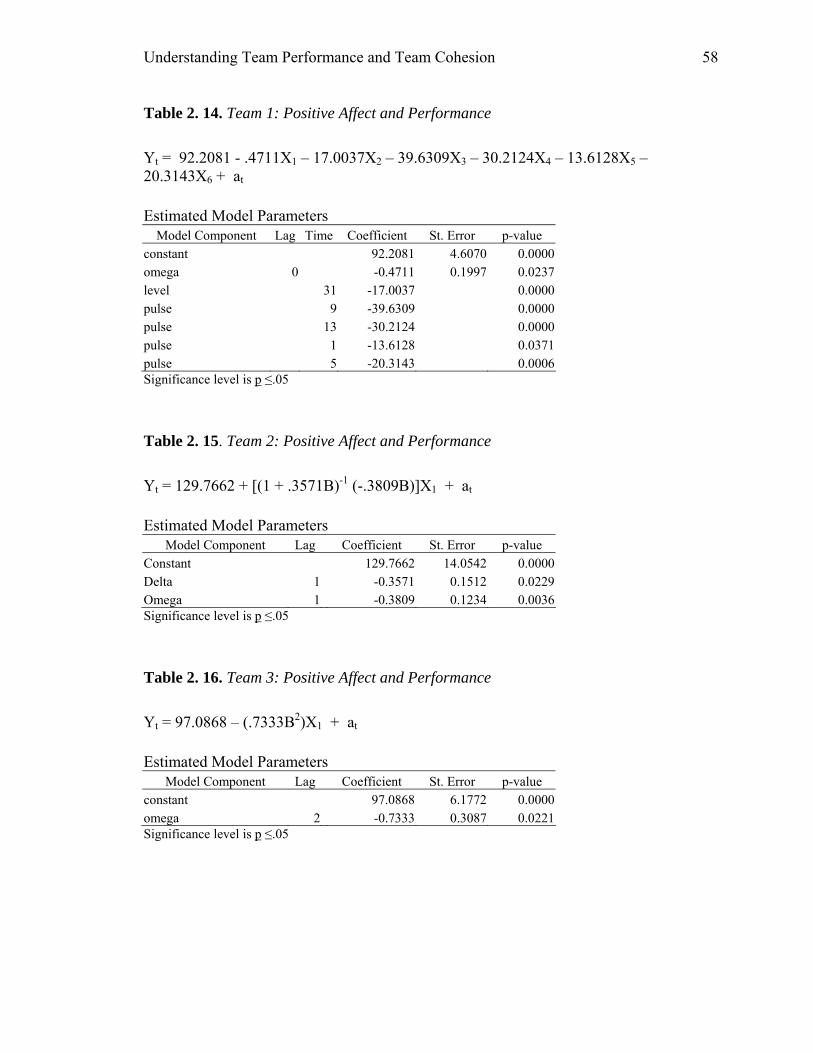
Understanding Team Performance and Team Cohesion 58
Table 2. 14. Team 1: Positive Affect and Performance
Yt = 92.2081 - .4711X1 – 17.0037X2 – 39.6309X3 – 30.2124X4 – 13.6128X5 – 20.3143X6 + at Estimated Model Parameters
Model Component Lag Time Coefficient St. Error p-value constant 92.2081 4.6070 0.0000omega 0 -0.4711 0.1997 0.0237level 31 -17.0037 0.0000pulse 9 -39.6309 0.0000pulse 13 -30.2124 0.0000pulse 1 -13.6128 0.0371pulse 5 -20.3143 0.0006Significance level is p ≤.05
Table 2. 15. Team 2: Positive Affect and Performance
Yt = 129.7662 + [(1 + .3571B)-1 (-.3809B)]X1 + at Estimated Model Parameters
Model Component Lag Coefficient St. Error p-value Constant 129.7662 14.0542 0.0000Delta 1 -0.3571 0.1512 0.0229Omega 1 -0.3809 0.1234 0.0036Significance level is p ≤.05
Table 2. 16. Team 3: Positive Affect and Performance
Yt = 97.0868 – (.7333B2)X1 + at Estimated Model Parameters
Model Component Lag Coefficient St. Error p-value constant 97.0868 6.1772 0.0000omega 2 -0.7333 0.3087 0.0221Significance level is p ≤.05

Understanding Team Performance and Team Cohesion 59
Table 2. 17. Team 6: Positive Affect and Performance
Yt = 31.5276 +(.9459B2)X1 – 18.3323X2 + 12.5956X3 – 11.2523X4 – 9.2087X5 + [(1 - .6863B)]-1 + at Estimated Model Parameters
Model Component Lag Time Coefficient St. Error p-value Constant 31.5276 14.9723 0.0417AR factor 1 0.6863 0.9723 0.0000AR factor 3 0.0419 0.1259 0.8212Omega 0 0.4093 0.1841 0.2295Omega 1 -0.0196 0.3353 0.9572Omega 2 0.9459 0.3629 0.0074Pulse 19 -18.3323 0.3349 0.0067Pulse 39 12.5956 0.0309Pulse 33 -11.2523 0.0279Pulse 44 -9.2087 0.0433Pulse 32 -7.1763 0.0837Significance level is p ≤.05
Table 2. 18. Team 10: Positive Affect and Performance Yt = 109.7870 – (.8440B4)X1 + at Estimated Model Parameters
Model Component Lag Coefficient St. Error p-value Constant 109.7870 9.5461 0.0000omega 4 -0.8440 0.3119 0.0097Significance level is p ≤.05

Understanding Team Performance and Team Cohesion 60
Table 2. 19. Team 2: Negative Affect and Performance
Yt = 129.7799 – 3.7001X1 – 13.7549X2 + 13.9014X3 + at Estimated Model Parameters
Model Component Lag Time Coefficient St. Error p-value constant 129.7799 7.2512 0.0000omega 0 -3.7001 0.6489 0.0000level 32 -13.7549 0.0000seasonal pulse 35 13.9014 0.0030pulse 37 15.3764 0.0533Significance level is p ≤.05
Table 2. 20. Team 4: Negative Affect and Performance
Yt = 99.9855 - .8786X1 + at Estimated Model Parameters
Model Component Lag Coefficient St. Error p-value Constant 99.9855 6.3787 0.0000Omega 0 -0.8786 0.4244 0.0444Significance level is p ≤.05
Table 2. 21. Team 6: Negative Affect and Performance
Yt = 2.5215X1 + 13.6610X2 –11.9381X3 + (1 - .7041B)-1 + at Estimated Model Parameters
Model Component Lag Time Coefficient St. Error p-value Constant 25.6533 21.5565 0.2410AR factor 1 0.7041 0.1499 0.0000AR factor 2 -0.1829 0.1820 0.3210AR factor 3 0.2607 0.1619 0.1153omega 0 -2.5215 0.7283 0.0013pulse 20 13.6610 0.0465pulse 33 -12.1629 0.0511pulse 12 -11.9381 0.0330Significance level is p ≤.05

Understanding Team Performance and Team Cohesion 61
Summary of Training Effect Results
Table 2.22 shows a summary of significant results for the effects of training. As can be seen by the mixed results, the hypothesized relationships of social loafing, workload sharing, and performance with training in teamwork skills were not definitive.
Table 2. 22. Summary of Significant Results for the Effects of Training
____________________________________________________________ Team PA NA Linkage Linkage Loafing Workload Performance (PA) (NA) Sharing______________ 1 x x x 2 3 4 5 x 6 x x 8 10 Note: an "x" designation indicates significance at p ≤.05 The Effect of Training
Training was evaluated by two methods. The first method compared pre-test and post-test results concerning the knowledge of the seven components taught to the participants. A paired samples t-test demonstrated that there was a significance difference (t = 7.12, p = .000), indicating that the participants did in fact learn from the training. The second method was a subjective evaluation of the training, which was completed by each participant. The results suggest that the training was received very favorably. The evaluations were measured on a Likert-type scale ranging from "not at all valuable" to "very valuable." Every participant gave the training an overall evaluation of "very valuable." In addition, 97.7% of the participants reported that they felt their team would benefit from the training, and 93.2% said they felt they had learned sufficiently to practice the skills successfully within their teams.
The present study examined the effects of training by two methods. The first
method forced the statistical program used to analyze the data to look for level shifts in the variables at the time of the training intervention. This was achieved by analyzing each variable in conjunction with a dichotomously coded variable to indicate pre- and post-training. The results of this type of analysis can be found in Tables 2.23 through 2.28. The second method allowed the statistical program to locate intervention effects without being limited to abrupt permanent changes in the variable at the time of the intervention; instead, "intervention effects" were loosely defined as level shifts in the variable. These exploratory results are presented in Tables 2.29 through 2.35. These tables contain the following information: the specific team, the observation at which the

Understanding Team Performance and Team Cohesion 62
level shift occurred, the mean difference, and significance values. In addition, graphical representations of the performance data over time for each team are presented in Graphs 1 through 8 found in Appendix E. Each variable will be discussed separately.
Positive Affect. Only one team (Team 6, Table 2.27) demonstrated a significant
effect of training using the "forced" method. The results indicate that positive affect for the team decreased significantly after training. The "exploratory" method located a negative level shift for Team 4 (Table 2.29) approximately three observations after the intervention. This indicates a decrease in positive affect.
Negative Affect. Using the forced method, Team 1 (Table 2.23) was identified as the only team significantly impacted by the training. In this situation, negative affect decreased following the training. The exploratory method identified two significantly effected teams (Team 1 and Team 6, Table 2.30). Team 1 showed a decrease in negative affect following training, while Team 6 exhibited an increase.
Mood Linkage. There were no significant training effects on positive mood linkage from the forced method. The exploratory method revealed two teams with post-training level shifts. Team 4 showed a significant increase in positive mood linkage, and Team 5 demonstrated a significant decrease in positive mood linkage (Table 2.31). For negative mood linkage, Team 1 (Table 2.24) was found to have increased linkage following the training by the forced method. Using the exploratory method, Teams 4 and 6 were shown to have a decrease in linkage during the post-training phase, while Team 1 demonstrated an increase in linkage (Table 2.32).
Social Loafing. A significant decrease in social loafing was found for Team 1
(Table 2.25), while a significant increase in loafing was present in Team 5 (Table 2.26) following training, according to forced method results. Both these results were supported by the exploratory method analysis (Table 2.33).
Workload Sharing. The forced method identified Team 6 (Table 2.28) as having
significantly decreased workload sharing due to training. No other teams were found significant through the forced method. However, the exploratory method uncovered significant post-intervention level shifts for three teams. Teams 5 and 10 experienced a decrease in workload sharing, and Team 1 showed an increase in that variable (Table 2.34).
Performance. The forced method revealed no significant training effects.
However, by using the exploratory method, significant level shifts in the post-training period were found for all eight teams. In every team, performance decreased significantly. Table 2.35 contains the results of these analyses.

Understanding Team Performance and Team Cohesion 63
Table 2. 23. Team 1: Effects of Training on Negative Affect
Yt = 12.4040 - .8246X1 + at Estimated Model Parameters
Model Component Lag Coefficient St. Error p-value Constant 12.4040 0.2574 0.0000Omega 0 -0.8246 0.3976 0.0441Significance level is p ≤.05
Table 2. 24. Team 1: Effects of Training on (NA) Mood Linkage
Yt = 5.1538 – 1.8907X1 + at Estimated Model Parameters
Model Component Lag Coefficient St. Error p-value constant 5.1538 0.4681 0.0000omega 0 -1.8907 0.7204 0.0120Significance level is p ≤.05
Table 2. 25. Team 1: Effects of Training on Social Loafing
Yt = 4.6860 – 2.1333X1 + at Estimated Model Parameters
Model Component Lag Coefficient St. Error p-value constant 4.6860 0.3506 0.0000omega 0 -2.1333 0.5396 0.0003Significance level is p ≤.05

Understanding Team Performance and Team Cohesion 64
Table 2. 26. Team 5: Effects of Training on Social Loafing
Yt = 3.7824 + 1.6107X1 – 5.7481X2 – 5.7465X3 + 4.1428X4 + at Estimated Model Parameters
Model Component Lag Time Coefficient St. Error p-value Constant 3.7824 0.6264 0.0000AR factor 3 -0.2288 0.1373 0.1030Omega 0 1.6107 0.4989 0.0024Pulse 28 -5.7481 0.0298Pulse 29 -5.7465 0.0126Pulse 39 4.1428 0.0429Pulse 22 -3.4658 0.0597Significance level is p ≤.05
Table 2. 27. Team 6: Effects of Training on Positive Affect
Yt = 28.2789 – 1.8004X1 + at Estimated Model Parameters
Model Component Lag Coefficient St. Error p-value constant 28.7289 0.5682 0.0000omega 0 -1.8004 0.8744 0.0456Significance level is p ≤.05
Table 2. 28. Team 6: Effects of Training on Workload Sharing
Yt = 13.5240 - .5546X1 + at Estimated Model Parameters
Model Component Lag Coefficient St. Error p-value constant 13.5240 0.1052 0.0000omega 0 -0.5546 0.1620 0.0014Significance level is p ≤.05
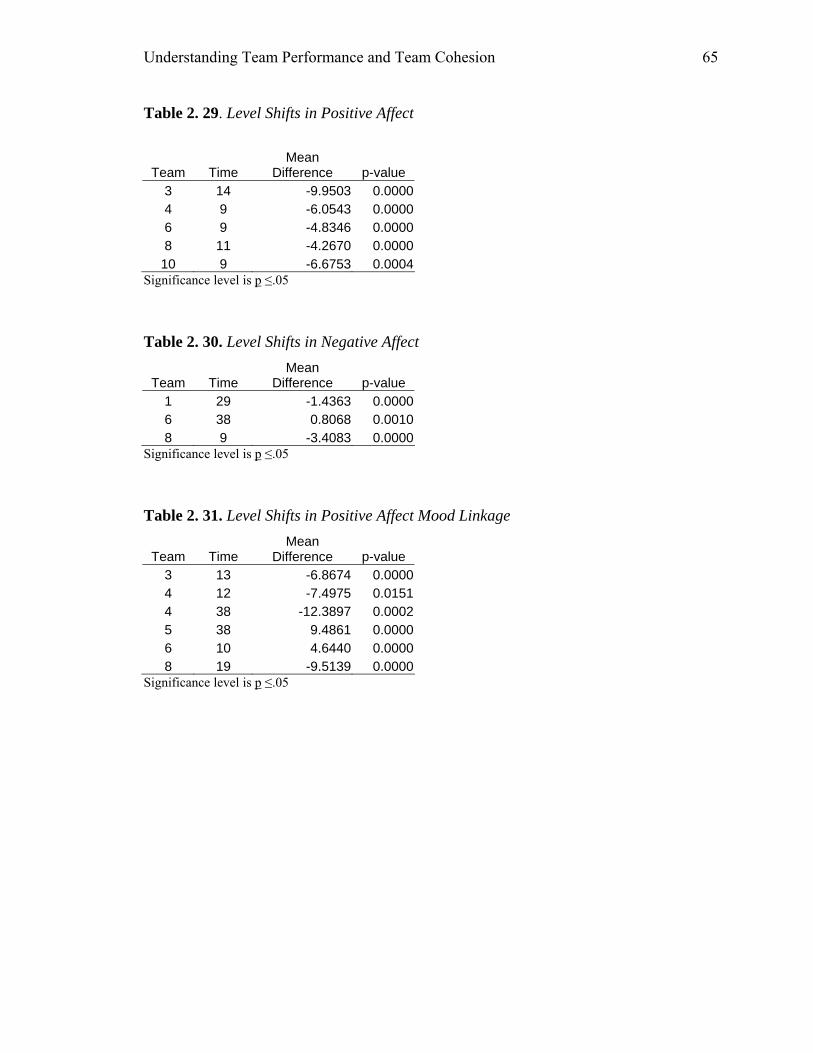
Understanding Team Performance and Team Cohesion 65
Table 2. 29. Level Shifts in Positive Affect
Team Time Mean
Difference p-value 3 14 -9.9503 0.00004 9 -6.0543 0.00006 9 -4.8346 0.00008 11 -4.2670 0.0000
10 9 -6.6753 0.0004Significance level is p ≤.05
Table 2. 30. Level Shifts in Negative Affect
Team Time Mean
Difference p-value 1 29 -1.4363 0.00006 38 0.8068 0.00108 9 -3.4083 0.0000
Significance level is p ≤.05
Table 2. 31. Level Shifts in Positive Affect Mood Linkage
Team Time Mean
Difference p-value 3 13 -6.8674 0.00004 12 -7.4975 0.01514 38 -12.3897 0.00025 38 9.4861 0.00006 10 4.6440 0.00008 19 -9.5139 0.0000
Significance level is p ≤.05

Understanding Team Performance and Team Cohesion 66
Table 2. 32. Level Shifts in Negative Affect Mood Linkage
Team Time Mean
Difference p-value 1 29 -2.6854 0.00004 10 -4.4091 0.00004 33 5.0649 0.00066 38 2.1061 0.00238 9 -7.1583 0.0001
Significance level is p ≤.05
Table 2. 33. Level Shifts in Social Loafing
Team Time Mean
Difference p-value 1 29 -2.6599 0.00002 20 -2.8484 0.00073 11 7.4101 0.00004 11 -1.8425 0.01805 30 1.9863 0.0000
Significance level is p ≤.05
Table 2. 34. Level Shifts in Workload Sharing
Team Time Mean
Difference p-value 1 28 0.8787 0.00013 13 -0.9450 0.00004 13 0.7569 0.00015 9 1.6039 0.00005 37 -2.1222 0.00006 24 -0.5825 0.0001
10 33 -0.9507 0.0020Significance level is p ≤.05

Understanding Team Performance and Team Cohesion 67
Table 2. 35. Level Shifts in Performance
Team Time Mean
Difference p-value 1 31 -16.4449 0.00002 20 6.0884 0.00012 32 -9.2479 0.00003 11 17.1319 0.00003 37 -11.9295 0.00014 36 -4.8602 0.01505 16 7.5006 0.00005 32 -11.0528 0.00006 38 -11.9407 0.00008 35 -9.1584 0.0001
10 11 15.2403 0.000010 33 -9.0122 0.0002
Significance level is p ≤.05

Understanding Team Performance and Team Cohesion 68
Discussion The results of the analysis of affective state and social loafing lend some support to the hypotheses that positive affect is associated with decreased loafing behavior, while negative affect is associated with increased loafing behavior. There was one team that displayed the opposite of the proposed effect. Workload sharing, which was used to supplement the loafing analysis, was also supportive of the hypothesis. The one exception, in which the degree of workload sharing decreased with an associated increase in positive affect, was found in the same team as mentioned above regarding loafing behavior. The data from the exploration of the relationship between performance and affective state provide some support for the hypothesis that high negative affect would be related to low performance levels. However, it was also found that high levels of positive affect were related to low performance. This would indicate that the characterization of a person experiencing high positive affect as being energetic and enthusiastic would also exhibit poor performance. It is possible that the existence of high positive affect was not channeled to performance concerns, but instead to more interpersonal or social concerns. The examination of the effects of the training intervention on the teams was made somewhat less meaningful by the inconsistency of the results from the two methods of inquiry. The forced method of analyzing training effects yielded very little information, and those few significant results were fairly evenly split between those which supported the hypotheses and those which displayed the opposite effect of that which was expected. Added to this is the fact that there was very little corroboration between the results of the forced and exploratory methods. There were no contradictory findings between the two methods, but for the most part, they did not overlap in any meaningful way. Generally speaking, it was expected that the training intervention would have a globally positive effect on the teams, in terms of increased positive affect, decreased loafing, and higher performance levels. However, the findings presented by the exploratory method show that this anticipated result was not only not found, but rather it shows the opposite of what was expected. Since it cannot be stated explicitly that the findings from the exploratory method are due directly to the training, it may not actually be the case that the training was in any way detrimental to the teams. However, with the exploratory method, we can look at the progress of the variables over time to see whether or not they change, and if so, in what direction. With that in mind, we can state with confidence that in the latter half of the study (post-training) the very variables that were proposed to increase, in fact decreased significantly. The most startling of these results is that performance was considerably deteriorated for all of the eight teams by the end of the study. The reasons for this effect are not clear, but there are several possibilities. An example might be that performance suffered due to the other academic obligations of the students, especially considering the drop in performance occurred during the time of final exams. Another possibility that takes into account the study itself is that the students may have become discouraged or even resentful towards the class/study as the end
Understanding Team Performance and Team Cohesion 69
approached. However, there is no way to say for certain what caused the decrease in performance. Considering that the hypotheses in the present study were based soundly on previous research and theory, the inconsistency and relative dearth of information provided by the results, as well as the fact that many were in opposition to expectations, suggests that perhaps there were certain limitations to the study. The use of a nontraditional classroom setting in the present study may have introduced unanticipated confounds. For the participants, there may have been some sort of cognitive dissonance effect from their simultaneous involvement in both an academic class and a scientific study. This factor is important not only to the data analysis of the present study, but also to the question of applicability of the results to the use of teams in workplace settings. The set of expectations of the participants in the present study were more than likely of a different nature than those one would expect to find in teams in the workplace. Another possible limitation is the use of the performance measures employed in the present study. One difficulty in determining the performance measure to be used was trying to balance the needs of the student teams with the needs of the study. A measure had to be designed that would be appropriately challenging for the teams, and at the same time, accurately and consistently measure performance. Due to these factors, a measure of performance had to be created specifically for the purposes of the study, and therefore, there is no validity or reliability data to ascertain the appropriateness of the measure. Another issue concerning the performance data is the frequency with which it was collected, especially in the context of an academic setting. Assignments were collected three times a week, and perhaps this was a bit more than the participants were used to in their previous experience. The format of the assignments never varied, which was important to the study, but it may have become rather tedious for the participants. One area that might have been confounded was that of affective state. The factors mentioned previously, as well as the very existence of the study, may have influenced the affect variables in ways that were unexpected and that cannot be quantified at this point. When dealing with a variable such as affect, it is somewhat expected that there will be outside influences, and that these will be difficult if not impossible to control. It may very well be that the measures of affective state cannot be solely attributable to team interaction. Attempts to control for these outside influences might have led to some important differences in the affect results. The results of the analysis of the effects of training may also be considered a limitation of the study. Considering the sheer magnitude of analyses conducted, a very small percentage was actually significant using the forced method. Although there were many more significant results from the exploratory method, the meaningfulness of these results is questionable. The level shifts that occurred in the post-training phase of the study cannot necessarily be attributed to the training intervention. Similarly, there were several significant level shifts that occurred prior to the intervention. It would be inappropriate to attempt to explain the antecedents of these shifts.

Understanding Team Performance and Team Cohesion 70
Despite the few limitations of the study, it still has many strengths. For one, the use of the ARIMA model of time series analysis allowed the data to be analyzed by a very powerful statistical technique. In addition, this technique is not typically used with team research, and thus gives the study an added advantage. Also, the use of "true" teams in the present study was a strength of this research. Many studies that examine team interactions do so with groups of individuals interacting for only a short time. In this study, teams were followed over a lengthy period of time that is more appropriate to the nature of teams. The use of psychometrically sound measurements also added to the value of the present study. In terms of future directions for this area of research, one might attempt a redesign of the study in terms of the participants. If academic teams were to be used again, perhaps the limitations mentioned above could be rectified, such as dual expectations, the frequency and method of measuring performance, and providing a more traditional classroom environment. Ideally, one would want to replicate the study in a true workplace setting. Another area of future interest might be the possibility of bi-directional relationships between the affect variables, social loafing, and performance.

Understanding Team Performance and Team Cohesion 71
PHASE 2: STUDY 3
The overall goal of the present proposed study was to arrive at a causal model of team performance. We accomplished this through several different methods. First, we carried out secondary analyses of the data analyzed Studies 1 and 2 of Phase 2. Second, and related to the first, we used multiple-predictor transfer function models of team performance in place of the single-predictor models used in Studies 1 and 2 of Phase 2. Third, we examined the effects of team members’ perceived task workload, intellectual composition, socio-demographic diversity, and diversity of college majors of team members. These predictors were combined with the previous to determine whether a more fruitful model of team cohesion and performance might be identified.
The results of Study 2 of Phase 2 had several inconclusive results. Although we hypothesized that positive affect would be associated with higher team performance and negative affect would be associated with lower performance, four teams demonstrated an opposite relationship between affect and performance. Thus, this hypothesis was not supported. Study 2 hypothesized that social loafing would decline following the training intervention. The findings were not supportive of this hypothesis, either. It was further hypothesized that the training intervention would positively affect the affective state of team members. However, the results provided only partial support for this hypothesis. In other words, half of the teams experienced a positive relationship between the training and team affect while the other half experienced a negative relationship. Finally, we hypothesized in Study 2 that team performance would improve after the training intervention. However, team performance decreased significantly across all teams.
The present study (Phase 2: Study 3) can be considered “novel” in that it examined predictors in combination. These predictors included, but were not limited to, task workload, affect, and team cohesion. In addition to these variables, the previously un-researched effects of perceived task workload data were examined. Although we had collected these data, we had not analyzed them until this stage in the research.
Workload and Team Performance
Task workload, which is defined as the perceived complexity of a task, has been found to be a compelling influence on team performance. Previous research has shown task workload to be more consistently influential than any other variable, including task organization and team training (Naylor & Briggs, 1965). In the case of the present study, task workload is operationalized as the joint completion of multiple college-level psychology in-class assignments. Many researchers have found a link between high task workload and declining team performance (Bowers, Thornton, Braun, & Salas, 1998; Bray, Kerr, Norbert, & Atkin, 1978; Gallwey, & Drury, 1986; Xiao, Hunter, Mackenzie & Jefferies, 1996). In addition, increasing task complexity is often associated with a greater risk of coordination breakdown.
The National Aeronautics and Space Administration Task Load Index (TLX) was
used to assess the level of perceived difficulty of the team tasks. The TLX is a subjective

Understanding Team Performance and Team Cohesion 72
workload measure developed by Hart and Staveland (1988), consisting of the following six dimensions to assess workload: mental demand, physical demand, temporal demand, performance, effort, and frustration. This measure will be described in greater detail in the methods section.
Team members completed the measures mentioned above during the last five
minutes of the team sessions. The majority of the time in each session was spent on the team exercises. The exercises were based on readings in the course textbook that included a comprehensive array of topics of Industrial/Organizational Psychology (e.g. job analysis, selection, performance appraisal, workplace diversity, training and development, and so on). Exercises were integrally related to the learning objectives of the course, as indicated by the course syllabus. In other words, all team assignments were intended to be challenging enough so as to require team member participation. Each assignment consisted of a true-false section (in which teams were to correct the false), a three-question short answer section, a long-answer essay section, and an optional extra credit section. A panel of subject matter experts (SMEs) trained on the material assessed the level of difficulty of the team assignments, the “teamness” of the assignments, and the degree to which the assignments were relevant to the course content.
As mentioned earlier, team performance decreased in the period following the
training intervention. One of the objectives of the present study is to account for this decline. Although much time and effort were devoted to the development of the assignments, the level of difficulty of the topical areas may have contaminated team performance. By controlling for the difficulty of the assignments and thus, partialing out its effects, the decline in performance may become better understood. It is also possible that team performance may take on an altogether different pattern.
Unanswered Questions While the previously mentioned studies offer insight into the growth and maturation of teams over time, some important questions remain unanswered. For instance, it is presumed that the members of a team will vary in their levels of intelligence. However, it is unclear whether this intellectual diversity helps or hampers team performance. Also, it is uncertain whether a difference exists between low versus high intelligence teams. In other words, do teams that have members that are all highly intelligent outperform teams that have members with lower intelligence? The present study aims to investigate this question through the use of GPA scores
While ethnic and gender diversity are extremely popular in the team literature, the issue of intellectual diversity in teams has not yet been addressed. Nonetheless, the investigation of this type of diversity research may have very interesting implications for both student learning teams and teams in the workplace. Due to the great number of research studies pertaining to ethnic and gender diversity in work teams, supervisors have been advised about the effects of diversity and thus, have become better equipped to deal with heterogeneous teams. It is presumed that knowledge about varying levels of

Understanding Team Performance and Team Cohesion 73
intelligence within a single team will also enable supervisors to better manage team members.
According to Shaw (1976), socio-demographic variables including ethnicity, age,
and gender have an important impact of the performance of teams. Therefore, another question that has yet to be answered is: Did demographic diversity help or hinder team performance? Although appropriate demographic data were collected, the previous studies (Studies 1 and 2 of Phase 2) did not determine whether degree of ethnic diversity within teams affected the performance of the teams. Likewise, they did not examine whether gender diversity within teams affected performance.
Research on diversity in teams has yielded mixed results. Some studies have
indicated that diversity among teams can have beneficial effects including, enhanced creativity (Northcraft et al., 1995) and the ability to produce solutions of higher quality (Watson, Kumar, & Michaelsen, 1993). However, the majority of research indicated that teams with demographically diverse members have detrimental results including, higher turnover (O'Reilly, Caldwell, & Barnett, 1989), lower effectiveness (Fenelon & Megargee, 1971; Tsui & O'Reilly, 1989), lower psychological attraction (Tsui, Egan, O’Reilly, 1992), and lower satisfaction (Jehn, Northcraft, & Neale, 1999). Since there is no definitive prediction for the effect of heterogeneity of team performance, it is more appropriate to treat the final two issues not as hypotheses but as questions to be explored. Therefore, the present study seeks to determine if a difference exists between the performance of heterogeneous (i.e., gender, race, college majors) teams versus the performance of homogeneous teams. Among the variables under investigation in this study (affect, team cohesion and workload), this study examined which predictors, if any, distinguish heterogeneous teams from homogeneous ones.
A final topic that requires attention is task workload. As previously mentioned,
the effect of perceived workload on the teams in the previous studies had not yet been addressed. This research examined the data that have been gathered within the same teams to determine which workload indices would be significantly related to team performance.
Statistical Analyses As with the prior two studies, ARIMA was used. The following analyses were performed.
1. The transfer function of perceived task workload on team performance. 2. A multivariate transfer function analysis of team performance with the following
predictors: (a) training, (b) intellectual composition of team members, (c) affect of team members, (d) work load of members, (e) demographic diversity of team members, (f) college majors, and (g) team cohesion.
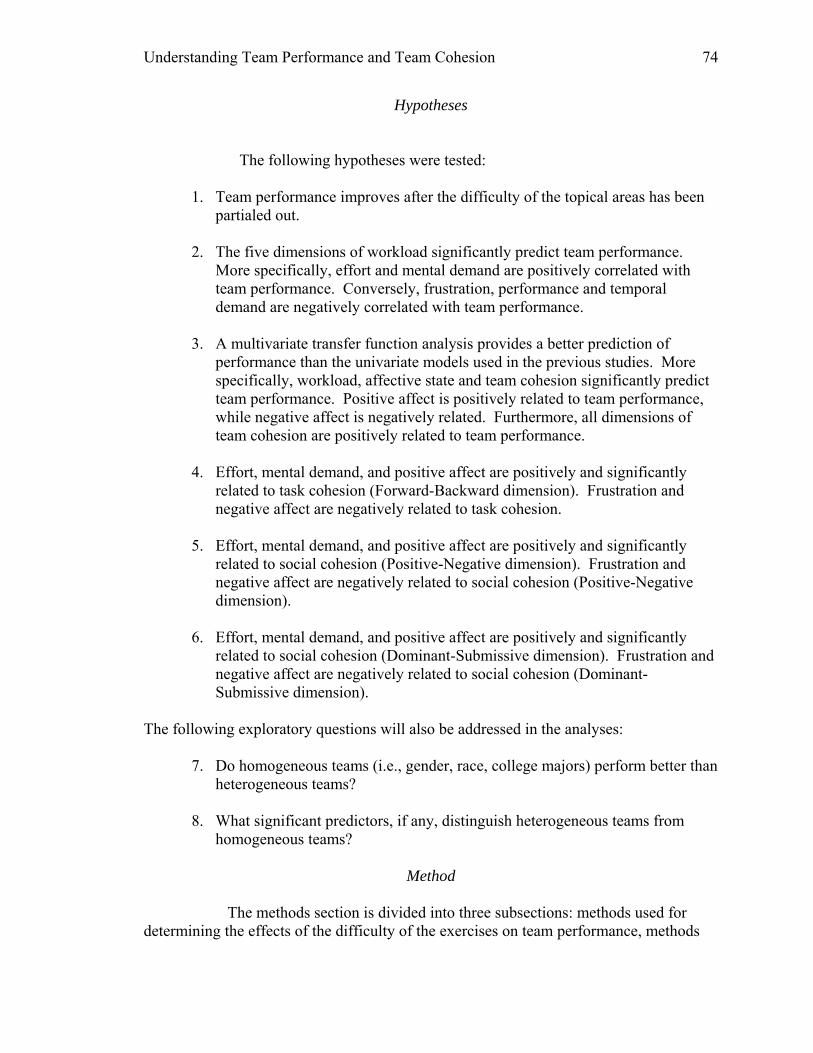
Understanding Team Performance and Team Cohesion 74
Hypotheses
The following hypotheses were tested:
1. Team performance improves after the difficulty of the topical areas has been partialed out.
2. The five dimensions of workload significantly predict team performance.
More specifically, effort and mental demand are positively correlated with team performance. Conversely, frustration, performance and temporal demand are negatively correlated with team performance.
3. A multivariate transfer function analysis provides a better prediction of
performance than the univariate models used in the previous studies. More specifically, workload, affective state and team cohesion significantly predict team performance. Positive affect is positively related to team performance, while negative affect is negatively related. Furthermore, all dimensions of team cohesion are positively related to team performance.
4. Effort, mental demand, and positive affect are positively and significantly
related to task cohesion (Forward-Backward dimension). Frustration and negative affect are negatively related to task cohesion.
5. Effort, mental demand, and positive affect are positively and significantly
related to social cohesion (Positive-Negative dimension). Frustration and negative affect are negatively related to social cohesion (Positive-Negative dimension).
6. Effort, mental demand, and positive affect are positively and significantly
related to social cohesion (Dominant-Submissive dimension). Frustration and negative affect are negatively related to social cohesion (Dominant-Submissive dimension).
The following exploratory questions will also be addressed in the analyses:
7. Do homogeneous teams (i.e., gender, race, college majors) perform better than heterogeneous teams?
8. What significant predictors, if any, distinguish heterogeneous teams from
homogeneous teams?
Method The methods section is divided into three subsections: methods used for determining the effects of the difficulty of the exercises on team performance, methods

Understanding Team Performance and Team Cohesion 75
used for determining the impact of workload on performance, and methods for conducting the multivariate transfer function analyses. Difficulty of Exercises vs. Team Performance Methods
Procedure. Recall that the first goal of this study was to determine if the varying level of difficulty of the team assignments in the previous research led to the erroneous predictability of performance. Therefore, 44 undergraduate students who had just completed a course in an Industrial/Organizational Psychology course were asked to evaluate the level of difficulty of the content of each of the team assignments used in previous research. The evaluations of these students were presumed to be representative of the perceptions of the students who participated in the previous studies. The following information and directions were given to the participating students. First, they were informed that the set of assignments represented assignments in a previous course and that students in that previous course worked in teams to complete the assignments. Second, they were informed that prior students (in the previous studies) were allowed to use a textbook in order to complete each assignment in approximately 45 minutes. Third, students were asked to evaluate the difficulty of the assignments by reading each and referring to the textbook (Psychology Applied to Work; Muchinsky, 2000) that participants had used in the prior studies. The goal here was to provide students with sufficient material to make an educated estimate of the level of difficulty. Because there were too many assignments for all students to evaluate, a sampling plan was developed whereby each student evaluated the difficulty of nine assignments in three sessions. In this plan, five rows of eight students were formed. This seating position was maintained across all three days of evaluation. Packets were distributed in numerical order, beginning with chapter one. On the second day, the student in the first seat of the first row was given chapter two. Distribution of team assignment packets continued with the next person receiving chapter three, and so on. With this plan, it was ensured that students would rate different chapter on all three days. To register their reactions to each assignment, students completed a nine-item questionnaire that accompanied each assignment.
Measures. Students completed questionnaires that consisted of nine Likert-type (1 = strongly agree, 3 = moderately agree, and 5 = strongly agree) items that were designed to determine the level of difficulty of the assignments (e.g., “It would be fair of the instructor to expect completion of the questions on this assignment by a team in 45 minutes,” “The questions on this assignment are appropriate to the material presented in this chapter,” “The questions on the assignment are clear for a team to answer”) (see Appendix F). Students were given 50 minutes in which to evaluate a packet of three separate assignments. Each packet contained assignments that assessed understanding of material from a single chapter. As was pointed out above, a total of nine assignments were rated over the course of three days.
Statistical Analyses. It should be recalled here that a primary goal of the study
was to explain the results of the Study 1 and 2 in Phase 2 by testing the hypothesis that
Understanding Team Performance and Team Cohesion 76
the varying level of difficulty of the team tasks may have masked the effect of training and the effect of cohesiveness and social loafing on team performance. In particular, it was of interest to understand the lack of training effect on performance of teams. Therefore, we examined the effect of task difficulty on team performance. By controlling for difficulty, the effect of team training on team performance was re-assessed.
ARIMA was used to analyze the effects of rated level of difficulty on the team
performance scores and to determine whether a multivariate transfer function model representing the combined effect of training and rated difficulty level on team performance was viable. In effect, the latter approach provided the basis for partialing out the effect of level of difficulty on team performance, which in effect can be considered a nuisance variable.
Workload vs. Performance
Procedure. As described in the Introduction, the procedure was that used in Studies 1 and 2 of Phase 2. In short, eleven teams consisting of undergraduate students who voluntarily participated in a team-based course completed team assignments in I/O psychology over the course of an entire semester. After completing each assignment, all team members completed the NASA-TLX (described in detail below) to assess the level of challenge they believed to exist within the current team assignment. We had not analyzed these data in the previous stages of this research.
Measures. The National Aeronautics and Space Administration Task Load Index
(TLX) is a subjective workload measure developed by Hart and Staveland (1988). The TLX consists of the following six dimensions in which to assess workload: mental demand, physical demand, temporal demand, performance, effort, and frustration. Mental demand assesses the mental and perceptual activity required of a task (e.g., “Was the task easy or demanding?”). As the name implies, physical demand measures the amount of physical activity involved in a task (e.g., “Was the task restful or laborious?”). This dimension was the only one to be omitted in the current study since the task at hand was intellectual and thus, did not require any physical activity. The temporal dimension evaluates the time pressure team members may experience as they work on a task (e.g., “Was the pace slow and leisurely or rapid and frantic?”). The performance dimension measures the level of satisfaction that members feel regarding the accomplishment of goals (e.g., “How successful do you think you were in accomplishing the goals of the task set by the experimenter (or yourself)?”). The effort dimension assesses the mental and physical energy exerted to accomplish team goals (e.g., “How hard did you have to work (mentally and physically) to accomplish your level of performance?”). The final dimension, frustration, measures the emotional responses of members as they work through a task (e.g., “How insecure, discouraged, irritated, stressed and annoyed versus secure, gratified, content, relaxed and complacent did you feel during the task?”) (See Appendix G). For each dimension respondents indicate their perceptions on a one hundred-point, bipolar scale. TLX dimensions are labeled from either low to high or good to poor.

Understanding Team Performance and Team Cohesion 77
Although the TLX is a widely used measure, there has been little empirical focus
on its psychometric properties. Subjective workload measures in general, including the TLX, are not commonly evaluated in terms of their reliability and validity (Gopher & Donchin, 1986). In contrast, the development of most workload measures has been guided by pragmatism, operator acceptance ratings, and face validity. When reliability is addressed in research, test-retest reliability is most commonly reported. The test-retest reliability for the TLX is rather high, with correlations ranging between .83 -.88 (Hart & Staveland, 1988; Scerbo, 2001).
Statistical Analyses. The present study used ARIMA, which is described in
some detail in the following section. For each team, the correlation (expressed as a transfer function) between team members' perceived task workload and team performance was examined. Transfer functions represent the time series analysis (TSA)-equivalent of regression models in which the autodependence in the data is controlled. In effect, these correlations are computed by the application of transfer function analysis. They represent the relationships between the workload dimensions and the social loafing, cohesion, and team performance investigated by Studies 1 and 2 of Phase 2. In addition, once again through the application of transfer function analysis, the effect of team training on perceived task workload was assessed.
Multivariate Transfer Function Analysis
Procedure. Within a time series paradigm, a multivariate transfer function analysis was performed with the following predictors: (a) training, (b) intellectual composition of team members, (c) affect of team members, (d) workload of members, (e) college majors, and (f) team cohesion. AUTOBOX 5.0 was used in these secondary analyses.
Analyses. Recall that the goal is to identify a reasonable causal model that
represents the causal effects of all exogenous variables on the endogenous variables. To this end, multiple-predictor transfer function analysis was performed. A review of these analytic strategies can be found in the body of the text for Study 2, Phase 2 and Appendix D. The following exogenous variables were examined with regard to their effect on performance and cohesion: (a) team training, (b) intellectual composition of team members, (c) affect of team members, and (d) workload of members. Finally, we examined the effect of diversity of demographic characteristics, intellectual achievement, and college major within teams on the predictability of the endogenous variable.
Results
Demographics Table 3.1 contains the demographic information from the eleven teams. For gender, a dummy variable was created (males=1 and females =0) and variance was computed. Similarly for race, a dummy variable was created (white=1, non-white=0) and
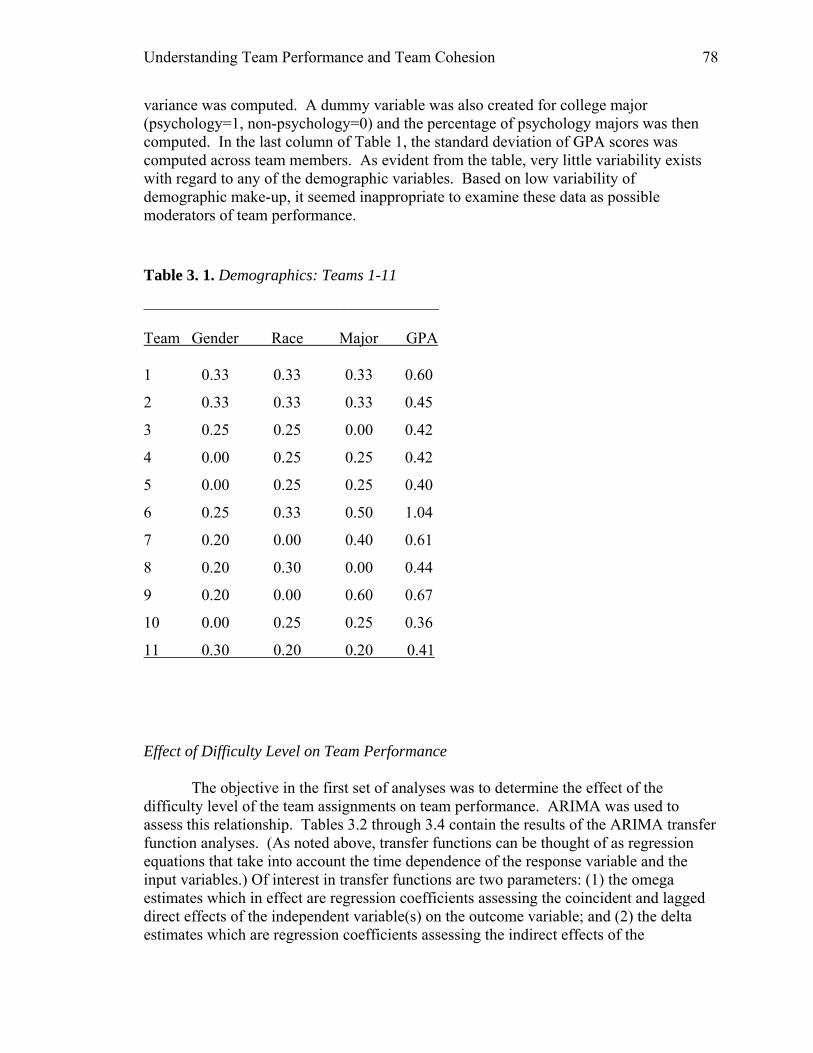
Understanding Team Performance and Team Cohesion 78
variance was computed. A dummy variable was also created for college major (psychology=1, non-psychology=0) and the percentage of psychology majors was then computed. In the last column of Table 1, the standard deviation of GPA scores was computed across team members. As evident from the table, very little variability exists with regard to any of the demographic variables. Based on low variability of demographic make-up, it seemed inappropriate to examine these data as possible moderators of team performance.
Table 3. 1. Demographics: Teams 1-11
_____________________________________ Team Gender Race Major GPA 1 0.33 0.33 0.33 0.60
2 0.33 0.33 0.33 0.45
3 0.25 0.25 0.00 0.42
4 0.00 0.25 0.25 0.42
5 0.00 0.25 0.25 0.40
6 0.25 0.33 0.50 1.04
7 0.20 0.00 0.40 0.61
8 0.20 0.30 0.00 0.44
9 0.20 0.00 0.60 0.67
10 0.00 0.25 0.25 0.36
11 0.30 0.20 0.20 0.41
Effect of Difficulty Level on Team Performance
The objective in the first set of analyses was to determine the effect of the difficulty level of the team assignments on team performance. ARIMA was used to assess this relationship. Tables 3.2 through 3.4 contain the results of the ARIMA transfer function analyses. (As noted above, transfer functions can be thought of as regression equations that take into account the time dependence of the response variable and the input variables.) Of interest in transfer functions are two parameters: (1) the omega estimates which in effect are regression coefficients assessing the coincident and lagged direct effects of the independent variable(s) on the outcome variable; and (2) the delta estimates which are regression coefficients assessing the indirect effects of the

Understanding Team Performance and Team Cohesion 79
independent variable(s) on the outcome variable. Appendix D provides a more detailed description of the transfer function concept.
In two teams, statistically significant relationships existed between difficulty and
team performance: Team 4, (ω (lag 0) = 4.09, p < .05) (Table 3.2) and Team 9, (δ (lag 1) = 0.88, p < .01) (Table 3.3). This means that there was a direct positive relationship between difficulty and performance for Team 4. However, for Team 9, the same relationship was indirect and expressed in terms of effects of current values of Y on later values of Y. Although the remaining nine teams did not demonstrate significant results, their findings can be viewed in Table 3.4. These results were not considered compelling enough to use difficulty as a covariate of team performance. Therefore, the difficulty variable was dropped from further analyses.

Understanding Team Performance and Team Cohesion 80
Table 3. 2. Team 4: Difficulty Level and Team Performance Yt= 65.0230 +[X1t][(+ 4.0861B* 2)]+ at Estimated Model Parameters Model Component Lag Coefficient Std. Error P Value Constant 65.0231 8.9266 0.0000 INPUT SERIES X1 Difficulty Omega Factor # 1 2 4.0861 1.6216 0.0156 Significance level is p < .05
Table 3. 3. Team 9: Difficulty Level and Team Performance
Yt= -.0147+[X1t][(1- .8820B1)]-1[(+ 2.2686- .2310B)]+[(1- .3930B+.3340B*2- .1050B3)]-1at Estimated Model Parameters Model Component Lag Coefficient Std. Error P Value Constant -0.0123 9.8566 0.9990 AR factor #1 1 0.3926 0.1624 0.0207 2 -0.3335 0.1362 0.0192 3 0.1049 0.1551 0.5031 INPUT SERIES X1 Difficulty Delta Factor #2 1 0.8818 0.0817 0.0000 Omega Factor # 1 0 2.2686 1.4015 0.1143 1 0.2314 1.4691 0.8757 Significance level is p < .05

Understanding Team Performance and Team Cohesion 81
Table 3. 4. Teams 1-3, 5-8, 10-11 Difficulty Level and Team Performance
Estimated Model Parameters Model Component Lag Coefficient Std. Error P Value Team 1: Constant -0.0123 9.8560 0.9990 AR factor #1 10.3926 0.1624 0.0207 INPUT SERIES X1 Difficulty Omega Factor # 1 02.2686 1.4015 0.1143 Team 2: Constant -0.0123 9.8566 0.9990 INPUT SERIES X1 Difficulty Omega Factor # 1 02.2686 1.4015 0.1143 Team 3: Constant -0.0123 9.8566 0.9990 AR factor #1 1 0.3926 0.1624 0.0207 INPUT SERIES X1 Difficulty Omega Factor # 1 0 2.2686 1.4015 0.1143 Team 5: Constant -0.0123 9.8566 0.9990 INPUT SERIES X1 Difficulty Omega Factor # 1 0 2.2686 1.4015 0.1143 Team 6: Constant -0.0123 19.8566 0.9990 AR factor #1 1 0.3926 0.1624 0.0207 INPUT SERIES X1 Difficulty Omega Factor # 1 0 2.2686 1.4015 0.1143 Team 7: Constant -0.0123 9.85660 0.9990 INPUT SERIES X1 Difficulty Omega Factor # 1 0 2.2686 1.4015 0.1143 Team 8: Constant -0.0123 9.8566 0.9990 INPUT SERIES X1 Difficulty Omega Factor # 1 0 2.2686 1.4015 0.1143 Team 10: Constant -0.0123 9.8566 0.9990 INPUT SERIES X1 Difficulty Omega Factor # 1 0 2.26861 0.4015 0.1143 Team 11: Constant -0.0123 9.8566 0.9990 INPUT SERIES X1 Difficulty Omega Factor # 1 0 2.2686 1.4015 0.1143 Significance level is p < .05
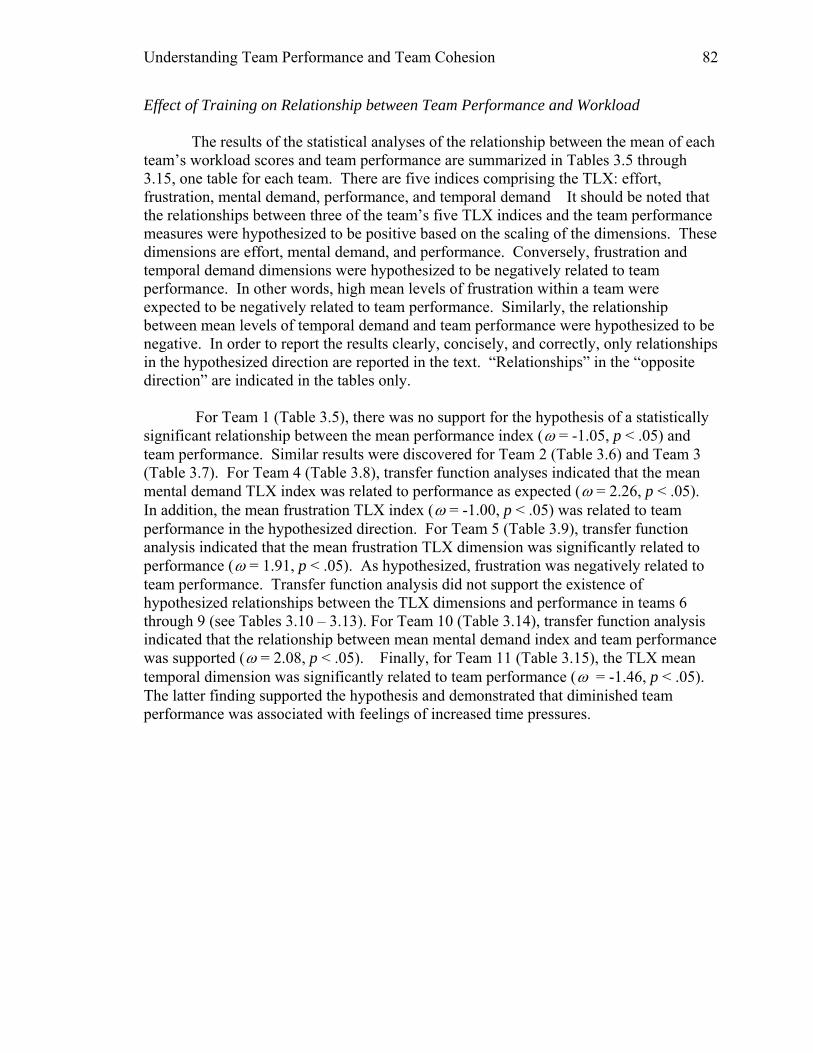
Understanding Team Performance and Team Cohesion 82
Effect of Training on Relationship between Team Performance and Workload
The results of the statistical analyses of the relationship between the mean of each team’s workload scores and team performance are summarized in Tables 3.5 through 3.15, one table for each team. There are five indices comprising the TLX: effort, frustration, mental demand, performance, and temporal demand It should be noted that the relationships between three of the team’s five TLX indices and the team performance measures were hypothesized to be positive based on the scaling of the dimensions. These dimensions are effort, mental demand, and performance. Conversely, frustration and temporal demand dimensions were hypothesized to be negatively related to team performance. In other words, high mean levels of frustration within a team were expected to be negatively related to team performance. Similarly, the relationship between mean levels of temporal demand and team performance were hypothesized to be negative. In order to report the results clearly, concisely, and correctly, only relationships in the hypothesized direction are reported in the text. “Relationships” in the “opposite direction” are indicated in the tables only.
For Team 1 (Table 3.5), there was no support for the hypothesis of a statistically
significant relationship between the mean performance index (ω = -1.05, p < .05) and team performance. Similar results were discovered for Team 2 (Table 3.6) and Team 3 (Table 3.7). For Team 4 (Table 3.8), transfer function analyses indicated that the mean mental demand TLX index was related to performance as expected (ω = 2.26, p < .05). In addition, the mean frustration TLX index (ω = -1.00, p < .05) was related to team performance in the hypothesized direction. For Team 5 (Table 3.9), transfer function analysis indicated that the mean frustration TLX dimension was significantly related to performance (ω = 1.91, p < .05). As hypothesized, frustration was negatively related to team performance. Transfer function analysis did not support the existence of hypothesized relationships between the TLX dimensions and performance in teams 6 through 9 (see Tables 3.10 – 3.13). For Team 10 (Table 3.14), transfer function analysis indicated that the relationship between mean mental demand index and team performance was supported (ω = 2.08, p < .05). Finally, for Team 11 (Table 3.15), the TLX mean temporal dimension was significantly related to team performance (ω = -1.46, p < .05). The latter finding supported the hypothesis and demonstrated that diminished team performance was associated with feelings of increased time pressures.

Understanding Team Performance and Team Cohesion 83
Table 3. 5. Team 1: Workload and Team Performance Yt = 80.6854 + at Estimated Model Parameters Model Component Lag Coefficient Std. Error P ValueConstant 80.6854 3.3715 0.0000 X1: Team1 Performance Omega -1.0464 0.5633 0.0701 Significance level is p ≤ .05
Table 3. 6. Team 2: Workload and Team Performance Yt = 105.4300 +[X1t][(- 5.9161)] + at Estimated Model Parameters Model Component Lag Coefficient Std. Error P ValueConstant 105.4283 3.7837 0.0000 X1: Team2 Performance Omega 0 -5.9161 1.0743 0.0000 Significance level is p ≤ .05
Table 3. 7. Team 3: Workload and Team Performance Yt = 55.1450 +[X1t][(- .7120)] +[(1- .3860B)]-1 (at) Estimated Model Parameters Model Component Lag Coefficient Std. Error P Value Constant 55.1446 13.2694 0.0002 X1: Team3 Effort Omega 0 -0.7117 0.8617 0.4135 Significance level is p ≤ .05
Table 3. 8. Team 4: Workload and Team Performance Yt = 60.4550 +[X1t][(- 1.0000)] +[X2t][(+ 2.2581)]+ at Estimated Model Parameters Model Component Lag Coefficient Std. Error P ValueConstant 60.4555 13.6335 0.0001 X1: Team4 Frustration Omega 0 -0.9995 0.4322 0.0257 X2: Team4 Mental Demand Omega 0 2.2581 1.005 0.0300 Significance level is p ≤ .05

Understanding Team Performance and Team Cohesion 84
Table 3. 9. Team 5: Workload and Team Performance Yt = 24.9290 + [X1t][(- 1.6316)]+[X2t][(+ 1.9108 + 1.4593 B)] + [(1- .3530B)]- at
Estimated Model Parameters Model Component Lag Coefficient Std. Error P ValueConstant 24.9290 13.1798 0.0658 X1: Team5 Frustration Omega 0 -1.6316 0.6332 0.0138 X2: Team5 Temporal Demand Omega 0 1.9108 0.7436 0.0140
cance level is p .05 ≤ Signifi
Table 3. 10. Team 6: Workload and Team Performance
Yt = 36.9090 +[X1t][(- .9070)]+ [(1- .6130B)]-1 at
Estimated Model Parameters Model Component Lag Coefficient Std. Error P ValueConstant 36.9094 12.1677 0.0041 X1: Team6 Performance Omega 0 -0.9072 0.6238 0.1533 Significance level is p ≤ .05
Table 3. 11. Team 7: Workload and Team Performance Yt = 99.4840 +[X1t][(- 2.2603)] + at Estimated Model Parameters Model Component Lag Coefficient Std. Error P ValueConstant 99.4841 9.1854 0.0000 X1: Team7 Performance Omega 0 -2.2603 1.3301 0.0972 Significance level is p ≤ .05
Understanding Team Performance and Team Cohesion 85
Table 3. 12. Team 8: Workload and Team Performance Yt = 90.6580+[X1t][(- .8010)] + at Estimated Model Parameters Model Component Lag Coefficient Std. Error P ValueConstant 90.6582 6.0934 0.0000 X1: Team8 Frustration Omega 0 -0.8012 0.6778 0.2437 Significance level is p .05 ≤
Table 3. 13. Team 9: Workload and Team Performance
Yt = 86.9570 +[X1t][(+ .5240)] + at Estimated Model Parameters Model Component Lag Coefficient Std. Error P ValueConstant 86.9571 4.0262 0.0000 X1: Team9 Frustration Omega 0 0.5237 0.4402 0.2413 Significance level is p .05 ≤
Table 3. 14. Team 10: Workload and Team Performance Yt = 124.9800 +[X1t][(- 3.3331)]+[X2t][(+1.4073)] +[X3t][(+ 2.0845- 1.8079B)]+[X4t] [(- 2.2738)] +at Estimated Model Parameters Model Component Lag Coefficient Std. Error P ValueConstant 124.9754 9.5119 0.0000 X1: Team10 Effort Omega 0 -3.3331 1.0935 0.0044 X2: Team10 Frustration Omega 0 1.4073 0.5022 0.0082 X3: Team10 Mental Demand Omega 0 2.0845 1.0314 0.0510 X4: Team10 Performance Omega 0 -2.2738 0.6904 0.0023 Significance level is p ≤ .05

Understanding Team Performance and Team Cohesion 86
Table 3. 15. Team 11: Workload and Team Performance
Yt = 103.2800 +[X1t][(- 1.4573)] + at Estimated Model Parameters Model Component Lag Coefficient Std. Error P ValueConstant 103.2761 6.6521 0.0000 X1: Team11 Temporal Demand Omega 0 -1.4573 0.5419 0.0106 Significance level is p ≤ .05

Understanding Team Performance and Team Cohesion 87
Multiple-predictor Transfer Function Analyses
Eleven teams were examined with regard to the effect of team cohesion, task workload, mean level of positive and negative affective state, and range of positive and negative affect within teams on performance. As described earlier, team cohesion scores were derived from the SYMLOG Adjective Rating Form, which is a 26 item self-report measure. The SYMLOG Adjective Rating Form was used to measure the evaluations that team members make of each other’s behaviors following their 50-minute interaction period. Individual evaluation scores were aggregated to the team level. Due to either improper completion of measures or more than two changes made to team composition, Teams 7, 9, and 11 were dropped from the analysis in Study 2 of Phase 2. Consequently, the affective measures for these three teams were unavailable in the current research. The results of the following analyses can be found in Tables 3.16 through 3.26.
For Team 1 (Table 3.16), transfer function analysis provided no support for the
hypothesized relationships. For Team 2 (Table 3.17), the analyses identified three significant predictors of team performance: the two workload measures of effort (ω (lag 0) = 3.26, p < .01) and frustration (ω (lag 0) = -0.86, p < .01), and the mean negative affect level (ω (lag 0) = -4.67, p < .05). Therefore, as hypothesized, a positive relationship existed between the amount of effort exerted and team performance, while a negative relationship existed between the level of experienced frustration and team performance. In addition, as hypothesized, mean level of negative affect was negatively related to team performance. For Team 3 (Table 3.18), only one variable was predictive of performance as hypothesized-- the range of positive affect significantly affected team performance as hypothesized (ω (lag 0) = 0.84, p < .01).
For Team 4 (Table 3.19) and 5 (Table 3.20), no hypothesized relationships were
supported. For Team 6 (Table 3.21), mean negative affect (ω (lag 0) = -8.49, p < .05) was predictive of team performance. The hypothesized predictive effects of one affective measure — mean positive affect — were supported for Team 8 (Table 3.23) with no other hypothesized relationships supported. Mean positive affect (ω (lag 0) = 1.04, p < .05) was significantly predictive of team performance. For the final team, Team 10 (Table 3.25), the workload measure of mental demand (ω (lag 0) = 2.72, p < .05) was significantly related to team performance as hypothesized. In addition, the Dominant-Submissive cohesion dimension was a significant correlate of team performance (ω (lag 0) = 1.38, p < .05). As predicted, there was a positive relationship between cohesion and team performance.
Recall that Phase 2: Study 2 excluded Teams 7, 9, and 11 from the original analyses. Therefore, the multiple-predictor transfer function analyses for these teams did not include affective measures. For Teams 7, 9 and 11 (Tables 3.22, 3.24 and 3.26), there were no statistically significant correlates of team performance.

Understanding Team Performance and Team Cohesion 88
Table 3. 16. Team 1: Multi-transfer Function Analysis
Yt = 23.4180 +[X1t][(+.5300)]+[X2t][(- 1.5939)]+[X3t][(+.9460)]+[X4t][(-.2000)]+ [X5t] [(+.1990)]+[X6t][(+.02500)]+[X7t][(+.5760)]+[X8t]+[(.5300)]+[X9t][(-.4750)] + [(X10t)[(+4.2896)]+at Estimated Model Parameters Model Component Lag Coefficient Std. Error P Value Constant 23.4184 34.6122 0.5034 1 Effort Omega Factor 1 0 -1.5939 1.1139 0.1619 2 Frustration Omega Factor 2 0 0.9456 0.8324 0.2641 3 Mental Omega Factor 3 0 -0.1999 1.5807 0.9002 4 Forward-Backward Omega Factor 4 0 0.19871 0.0271 0.8478 5 Friendly-Unfriendly Omega Factor 5 0 0.0248 0.6451 0.9696 6 Dominant-Submissive Omega Factor 6 0 0.5761 0.6296 0.3668 7 Positive Affect Omega Factor 7 0 -0.5300 1.2707 0.6793 8 Positive Range Omega Factor 80 0 0.5298 0.2930 0.0797 9 Negative Range Omega Factor 9 0 -0.4748 0.9192 0.6089 10 Negative Affect Omega Factor 10 0 4.2896 1.3370 0.0030 Significance level is p < .05

Understanding Team Performance and Team Cohesion 89
Table 3. 17. Team 2: Multi-transfer Function Analysis
Yt = 25.3780 +[X1t][(+ 3.2610)]+[X2t][(.8650)]+[X3t] 190)]+[X4t] (.2570)] [X5t] (2.8561)+ [X6t][(.2490)]+[X7t][(-.2470)]+[X8t][(+.0040)]+[X9t][(+.7230)]+[X10t[(- 4.6651)] 1- .203B-.5930B*2)]at Estimated Model Parameters Model Component Lag Coefficient Std. Error P ValueConstant 1 24.8210 30.9530 0.0003 Moving Avg-Factor 1 0.2033 0.1981 0.3127 1 Effort Omega Factor 1 0 3.2610 0.7532 0.0001 2 Frustration Omega Factor 2 0 -0.8649 0.3721 0.0268 3 Mental Omega Factor 3 0 -0.1900 0.7372 0.7983 4 Forward-Backward Omega Factor 4 0 -0.2570 0.6530 0.6966 5 Friendly-Unfriendly Omega Factor 5 0 -2.8561 0.8101 0.0013 6 Dominant-Submissive Omega Factor 6 0 -0.2493 0.3279 0.4528 7 Positive Affect Omega Factor 7 0 -0.2474 0.0800 0.0042 8 Positive Range Omega Factor 8 0 0.0038 0.2101 0.9856 9 Negative Range Omega Factor 9 0 0.7231 1.135 0.5288 10 Negative Affect Omega Factor 10 0 -4.6651 2.1913 0.0413 Significance level is p < .05
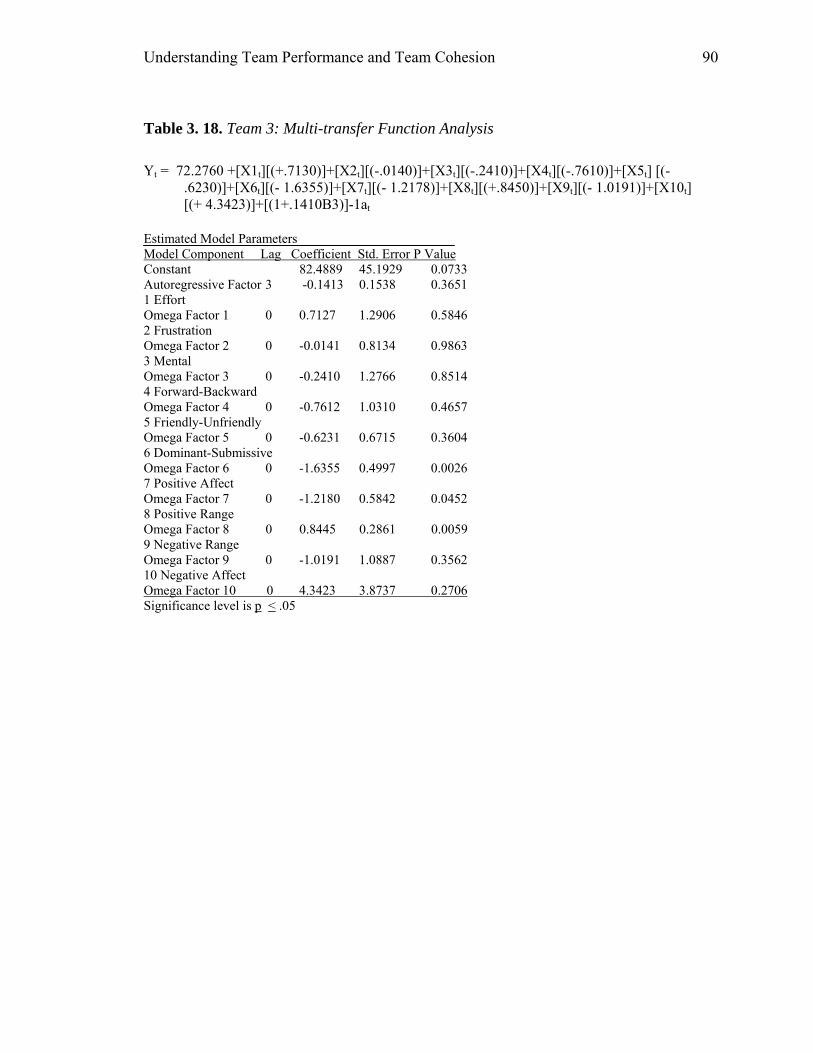
Understanding Team Performance and Team Cohesion 90
Table 3. 18. Team 3: Multi-transfer Function Analysis Yt = 72.2760 +[X1t][(+.7130)]+[X2t][(-.0140)]+[X3t][(-.2410)]+[X4t][(-.7610)]+[X5t] [(- .6230)]+[X6t][(- 1.6355)]+[X7t][(- 1.2178)]+[X8t][(+.8450)]+[X9t][(- 1.0191)]+[X10t] [(+ 4.3423)]+[(1+.1410B3)]-1at Estimated Model Parameters Model Component Lag Coefficient Std. Error P Value Constant 82.4889 45.1929 0.0733 Autoregressive Factor 3 -0.1413 0.1538 0.3651 1 Effort Omega Factor 1 0 0.7127 1.2906 0.5846 2 Frustration Omega Factor 2 0 -0.0141 0.8134 0.9863 3 Mental Omega Factor 3 0 -0.2410 1.2766 0.8514 4 Forward-Backward Omega Factor 4 0 -0.7612 1.0310 0.4657 5 Friendly-Unfriendly Omega Factor 5 0 -0.6231 0.6715 0.3604 6 Dominant-Submissive Omega Factor 6 0 -1.6355 0.4997 0.0026 7 Positive Affect Omega Factor 7 0 -1.2180 0.5842 0.0452 8 Positive Range Omega Factor 8 0 0.8445 0.2861 0.0059 9 Negative Range Omega Factor 9 0 -1.0191 1.0887 0.3562 10 Negative Affect Omega Factor 10 0 4.3423 3.8737 0.2706 Significance level is p < .05

Understanding Team Performance and Team Cohesion 91
Table 3. 19. Team 4: Multi-transfer Function Analysis Yt = 109.5200 +[X1t][(-.2800)]+[X2t][(-.4640)]+[X3t][(+2.1705)]+[X4t][(-1.3082)]+[X5t] [(-.5150)]+[X6t][(-.3840)]+[X7t][(-.4650)]+[X8t][(+.0340)]+[X9t][(+.01300)]+[X10t[(- 1.2737)]+ at Estimated Model Parameters Model Component Lag Coefficient Std. Error P Value Constant 109.5198 21.1681 0.0000 1 Effort Omega Factor 1 0 -0.2797 0.9651 0.7738 2 Frustration Omega Factor 2 0 -0.4639 0.4542 0.3145 3 Mental Omega Factor 3 0 2.1705 1.4349 0.1399 4 Forward-Backward Omega Factor 4 0 -1.3082 0.7153 0.0765 5 Friendly-Unfriendly Omega Factor 5 0 -0.5153 0.7993 0.5235 6 Dominant-Submissive Omega Factor 6 0 -0.3836 0.4218 0.3697 7 Positive Affect Omega Factor 7 0 -0.4646 0.2172 0.0399 8 Positive Range Omega Factor 8 0 0.0345 0.1836 0.8521 9 Negative Range Omega Factor 9 0 0.0129 0.3077 0.9667 10 Negative Affect Omega Factor 10 0 -1.2737 0.7342 0.0921 Significance level is p < .05

Understanding Team Performance and Team Cohesion 92
Table 3. 20. Team 5: Multi-transfer Function Analysis Yt = 12.9420 +[X1t][(+ 2.2270)]+[X2t][(-1.0025)]+[X3t][(+.5890)]+[X4t][(+ 1.7301)]+[X5t][(- .2990)]+[X6t][(+.3690)]+[X7t][(+.1760)]+[X8t][(-.4160)]+[X9t)][(-.1200) ]+[(X10t) [(+1.1772)] + at
Estimated Model Parameters Model Component Lag Coefficient Std. Error P Value Constant 12.9424 52.2996 0.8861 1 Effort Omega Factor 1 0 2.2270 1.3772 0.1154 2 Frustration Omega Factor 2 0 -1.0025 0.7621 0.1974 3 Mental Omega Factor 3 0 0.5888 1.2347 0.6366 4 Forward-Backward Omega Factor 4 0 1.7301 1.066 0.1142 5 Friendly-Unfriendly Omega Factor 5 0 -0.2994 0.7790 0.7031 6 Dominant-Submissive Omega Factor 6 0 0.3687 0.4237 0.3905 7 Positive Affect Omega Factor 7 0 0.1760 0.5003 0.7272 8 Positive Range Omega Factor 8 0 -0.4158 0.2233 0.0715 9 Negative Range Omega Factor 9 0 -0.1197 1.0819 0.9126 10 Negative Affect Omega Factor 10 0 1.1772 3.8368 0.7609 Significance level is p < .05

Understanding Team Performance and Team Cohesion 93
Table 3. 21. Team 6: Multi-transfer Function Analysis Yt = 250.1700 +[X1t][(-.3240)]+[X2t][(+.1240)]+[X3t][(- 1.2247)]+[X4t][(-.3180)] +[ X5t] [(.216)]+[X6t][(- 1.6659)]+[X7t][(-.1420)]+[X8t][(-.1320)]+[X9t][(+ 1.3270)]+[X10t[(- 8.4943)]+ at Estimated Model Parameters Model Component Lag Coefficient Std. Error P Value Constant 250.1729 36.3371 0.0000 1 Effort Omega Factor 1 0 -0.3242 0.6855 0.6393 2 Frustration Omega Factor 2 0 0.1244 0.3338 0.7117 3 Mental Omega Factor 3 0 -1.2247 1.4441 0.4025 4 Forward-Backward Omega Factor 4 0 -0.3181 0.7677 0.6813 5 Friendly-Unfriendly Omega Factor 5 0 -0.2163 0.5531 0.6982 6 Dominant-Submissive Omega Factor 6 0 -1.6660 0.5627 0.0057 7 Positive Affect Omega Factor 7 0 -0.1416 0.4731 0.7666 8 Positive Range Omega Factor 8 0 -0.1315 0.2450 0.5950 9 Negative Range Omega Factor 9 0 1.3270 1.2760 0.3058 10 Negative Affect Omega Factor 10 0 -8.4943 3.5517 0.0226 Significance level is p < .05
Table 3. 22. Team 7: Multi-transfer Function Analysis Yt = 98.5910 +[X1t][(-.4510)]+[X2t)][(+.4130)]+[X3t][(-.8040)]+[X4t][(-.2010)]+[X5t)][(- .2260)]+[X6t][(+.1390)]+ at Estimated Model Parameters Model Component Lag Coefficient Std. Error P Value Constant 98.59104 18.3708 0.0000 1 Effort Omega Factor 1 0 -0.4513 1.2122 0.7118 2 Frustration Omega Factor 2 0 0.4131 0.7848 0.6017 3 Mental Omega Factor 3 0 -0.8040 0.9598 0.4076 4 Forward-Backward Omega Factor 4 0 -0.2011 0.9079 0.8259 5 Friendly-Unfriendly Omega Factor 5 0 -0.2264 0.7389 0.7610 6 Dominant-Submissive Omega Factor 6 0 0.1388 0.7340 0.8510 Significance level is p < .05
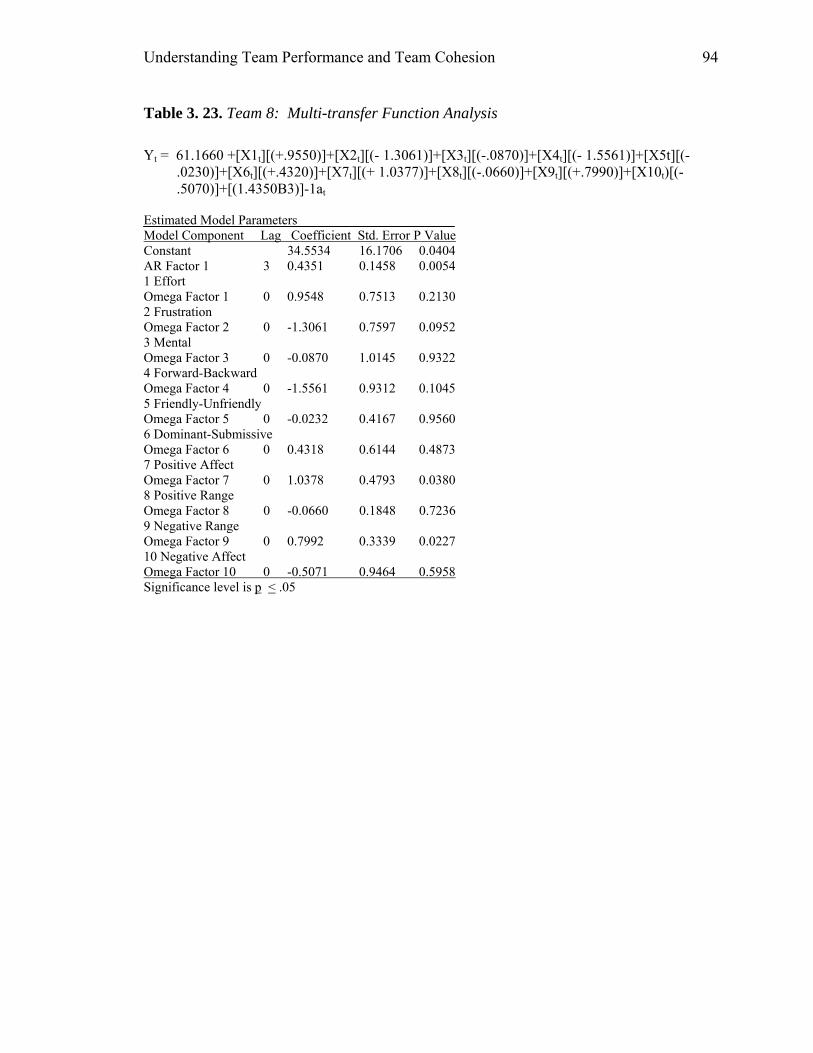
Understanding Team Performance and Team Cohesion 94
Table 3. 23. Team 8: Multi-transfer Function Analysis Yt = 61.1660 +[X1t][(+.9550)]+[X2t][(- 1.3061)]+[X3t][(-.0870)]+[X4t][(- 1.5561)]+[X5t][(- .0230)]+[X6t][(+.4320)]+[X7t][(+ 1.0377)]+[X8t][(-.0660)]+[X9t][(+.7990)]+[X10t)[(- .5070)]+[(1.4350B3)]-1at Estimated Model Parameters Model Component Lag Coefficient Std. Error P Value Constant 34.5534 16.1706 0.0404 AR Factor 1 3 0.4351 0.1458 0.0054 1 Effort Omega Factor 1 0 0.9548 0.7513 0.2130 2 Frustration Omega Factor 2 0 -1.3061 0.7597 0.0952 3 Mental Omega Factor 3 0 -0.0870 1.0145 0.9322 4 Forward-Backward Omega Factor 4 0 -1.5561 0.9312 0.1045 5 Friendly-Unfriendly Omega Factor 5 0 -0.0232 0.4167 0.9560 6 Dominant-Submissive Omega Factor 6 0 0.4318 0.6144 0.4873 7 Positive Affect Omega Factor 7 0 1.0378 0.4793 0.0380 8 Positive Range Omega Factor 8 0 -0.0660 0.1848 0.7236 9 Negative Range Omega Factor 9 0 0.7992 0.3339 0.0227 10 Negative Affect Omega Factor 10 0 -0.5071 0.9464 0.5958 Significance level is p < .05

Understanding Team Performance and Team Cohesion 95
Table 3. 24. Team 9: Multi-transfer Function Analysis Yt = 94.7530 +[X1t][(-.2880)]+[X2t][(-.1060)]+[X3t][(-.2970)]+ [X4t][(+.1900)] +[X5t] [(+.2240)]+[(1-.5080B1+.1550B2-.2620B3)]-1at Estimated Model Parameters Model Component Lag Coefficient Std. Error P Value Constant 36.5567 17.9075 0.0488 AR Factor 1 1 0.5078 0.1537 0.0022
2 –0.1555 0.1586 0.3336 3 0.2618 0.1346 0.0599
1 Effort Omega Factor 2 0 -0.2877 0.9742 0.7695 2 Frustration Omega Factor 3 0 -0.1058 0.4561 0.8179 3 Forward-Backward Omega Factor 4 0 -0.2969 0.5731 0.6076 5 Friendly-Unfriendly Omega Factor 5 0 0.1904 0.5413 0.7272 6 Dominant-Submissive Omega Factor 6 0 0.2238 0.4497 0.6218 Significance level is p < .05

Understanding Team Performance and Team Cohesion 96
Table 3. 25. Team 10: Multi-transfer Function Analysis Yt = 25.4270 +[X1t][(-2.9849)]+[X2t][(+.3050)]+[X3t][(+2.7201)]+[X4t][(-.8660)]+[X5(T)] [(+.3050)]+[X6t][(+1.3766)]+[X7t][(+.0320)]+[X8t][(+.3340)]+[X9(T)][(- 1.7887)] +[X10t[(+2.4485)]+ at Estimated Model Parameters Model Component Lag Coefficient Std. Error P Value Constant 25.4272 36.0075 0.4859 1 Effort Omega Factor 1 0 -2.9849 1.2887 0.0269 2 Frustration Omega Factor 2 0 0.3045 0.5690 0.5962 3 Mental Omega Factor 3 0 2.720 1.1432 0.0233 4 Forward-Backward Omega Factor 4 0 -0.8657 0.9917 0.3890 5 Friendly-Unfriendly Omega Factor 5 0 0.3050 0.4536 0.5060 6 Dominant-Submissive Omega Factor 6 0 1.3766 0.4157 0.0022 7 Positive Affect Omega Factor 7 0 0.0319 0.4445 0.9433 8 Positive Range Omega Factor 8 0 0.3343 0.1711 0.0592 9 Negative Range Omega Factor 9 0 -1.7887 1.0936 0.1114 10 Negative Affect Omega Factor 10 0 2.4485 2.1805 0.2696 Significance level is p < .05
Table 3. 26. Team 11: Multi-transfer Function Analysis Yt = 97.2350 +[X1t][(+.9580)]+[X2t][(-.5670)]+[X3t][(- 1.7830)]+[X4t][(+.6740)]+[X5t][(- 1.4716)]+[X6t][(+.1940)] + at Estimated Model Parameters Model Component Lag Coefficient Std. Error P Value Constant 97.2352 13.4368 0.0000 1 Effort Omega Factor 1 0 0.9578 1.3918 0.4956 2 Frustration Omega Factor 2 0 -0.5671 0.7954 0.4803 3 Mental Omega Factor 3 0 -1.7830 1.3571 0.1970 4 Forward-Backward Omega Factor 4 0 0.6742 0.7995 0.4045 5 Friendly-Unfriendly Omega Factor 5 0 -1.4716 0.9799 0.1416 6 Dominant-Submissive Omega Factor 6 0 0.1942 0.4803 0.6884 Significance level is p < .05

Understanding Team Performance and Team Cohesion 97
Task and Social Cohesion
The following thirty-three analyses were conducted to determine the significant correlates of both task and social cohesion. The predictors that were used in the multipredictor transfer functions were the workload measures of effort, frustration, and mental demand and four affective measures: mean positive affect, range of positive affect in a team, mean negative affect, and range of negative affect in a team. Only three TLX dimensions were selected because they were the most frequently occurring predictors in the study of the relationship between workload and team performance. Therefore, they had the greatest impact on performance across all teams.
Task Cohesion (F-B). The results of the task cohesion portion of the current study are summarized in Table 3.27. For Team 1, the range of positive affect (ω (lag 0) = 0.15, p < .05) was the single predictor of task cohesion. As hypothesized, higher levels of positive affect in a team were positively related to task cohesion. For Team 2, no significant relationships were observed. For Team 3, positive affective state (ω (lag 0) = 0.20, p < .01) was related to task cohesion in the hypothesized direction. In addition, the TLX frustration measure was related to task cohesion in the hypothesized direction (ω (lag 0) = -0.42, p < .01). Analysis of Team 4 data revealed no significant correlates of task cohesion. For Team 5, the TLX frustration index was significantly related to task cohesion in the expected positive direction (ω (lag 0) = -0.29, p < .01). For Teams 6 through 8, no significant correlates were discovered. For Team 9, frustration (ω (lag 0) = -0.24, p < .05) was negatively related to team cohesion, thus supporting the hypothesis. Analyses of Teams 10 and 11 data yielded no evidence of significant predictors of task cohesion.
Social Cohesion (P-N). The P-N or Positive-Negative dimension is one of the
two markers of social cohesion within the SYMLOG measurement system. Results of this dimension are summarized in Table 3.28. For Team 1, effort was significantly related to social cohesion in the hypothesized direction (ω (lag 0) = 0.53, p < .05). For Team 2, effort was the sole predictor of social cohesion (ω (lag 0) = 0.42, p < .05). The positive relationship between effort and social cohesion lends support to the hypothesis. For Team 3, there were no significant correlates of social cohesion. For Team 4, negative affective state (ω (lag 0) = -0.32, p < .05) was significantly related to social cohesion in the hypothesized direction. For Team 5, the TLX mental demand measure was significantly and positively related to social cohesion (ω (lag 0) = 0.66, p < .05). In addition, mean negative affect was significantly related to social cohesion (ω (lag 0) = -1.55, p < .05). For Team 6, mean positive affect (ω (lag 0) = 0.27, p < .05) was significantly related to social cohesion, thus supporting the hypothesis. For Team 7, analyses did not yield evidence of significant predictors of social cohesion. For Team 8, mean positive affect was significantly related to social cohesion (ω (lag 0) = 0.51, p < .01) in the hypothesized direction. For the final three teams, Team 9-11, there were no significant correlates of social cohesion.
Understanding Team Performance and Team Cohesion 98
Social Cohesion U-D. The U-D or Dominant-Submissive SYMLOG dimension is
the other marker of social cohesion. Results of this dimension are summarized in Table 3.29. In Team 1, range of negative affect within a team significantly predicted social cohesion (ω (lag 0) = -0.58, p < .05). Range of affect was negatively related to social cohesion, thus confirming the hypothesized relationship. For Team 2, mental demand was positively and significantly related to social cohesion (ω (lag 0) = 0.92, p < .01). Thus, the hypothesis was supported. For Team 3, results failed to support the existence of correlates of the dependent variable. For Team 4, range of positive affect in a team predicted social cohesion (ω (lag 0) = 0.12, p < .05). For Team 5, mental demand positively predicted social cohesion (ω (lag 0) = 0.88, p < .05). Thus, the hypothesis was confirmed. There were no significant correlates for Team 6. For Team 7, effort positively and significantly predicted social cohesion (ω (lag 0) = 0.75, p < .05). For Team 8, results did not support the existence of any hypothesized predictor. For Teams 9, 10, and 11, no significant predictors were found.
There were many anomalous findings among the analyses that were considered. A recurring anomaly is the existence of apparently significant relationships “in the wrong direction.” Technically, these cannot be used as evidence of some unexpected phenomenon. Yet, it seems useful to incorporate all of the “in-the-wrong-direction effects” into one table to help identify any hidden patterns within the results. For this reason, Table 3.30 is presented to indicate for each team, which predictors were found to have apparently significant relationships in the direction other than hypothesized.

Understanding Team Performance and Team Cohesion 99
Table 3. 27. Teams 1-11: Task Cohesion Estimated Model Parameters Model Component Lag Coefficient Std. Error P Value Team 1: X4: Positive Range Omega Factor # 4 0 0.1453 0.0552 0.0125 Team 2: X5: Positive Affect Omega Factor # 5 0 -0.0406 0.0191 0.0412 Team 3: X2: Frustration Omega Factor # 2 0 -0.4207 0.1168 0.0009 X5: Positive Affect Omega Factor # 5 0 0.2029 0.0717 0.0076 Team 4: No significant predictors Team 5: X1: Effort Omega Factor # 1 0 -0.5841 0.1737 0.0018 X2: Frustration Omega Factor # 2 0 -0.2873 0.0978 0.0057 X3: Mental Demand Omega Factor # 3 0 -0.4703 0.1470 0.0029 Team 6: No significant predictors Team 7: No significant predictors Team 8: No significant predictors Team 9: X2: Frustration Omega Factor # 2 0 -0.2360 .0875 0.0102 Team 10: No significant predictors Team 11: No significant predictors ________________________________________________ Significance level is p < .05

Understanding Team Performance and Team Cohesion 100
Table 3. 28. Teams 1-11: Social Cohesion (P-N) Estimated Model Parameters Model Component Lag Coefficient Std. Error P Value Team 1: X1: Effort Omega Factor # 1 0 0.5269 0.2475 0.0404 X2: Frustration Omega Factor # 2 0 0.4408 0.1679 0.0126 Team 2: X1: Effort Omega Factor # 1 0 0.4190 0.1861 0.0305 Team 3: No significant predictors Team 4: X6: Negative Range Omega Factor # 6 0 0.1205 0.0566 0.0401 X7: Negative Affect Omega Factor # 7 0 -0.3232 0.1332 0.0204 Team 5: X3: Mental Demand Omega Factor # 3 0 0.6596 0.3118 0.0416 X6: Negative Range Omega Factor # 6 0 0.4613 0.2177 0.0412 X7: Negative Affect Omega Factor # 7 0 -1.5543 0.7530 0.0465 Team 6: X5: Positive Affect Omega Factor # 5 0 0.2658 0.1030 0.0141 Team 7: No significant predictors Team 8: X5: Positive Affect Omega Factor # 5 0 0.5058 0.1400 0.0009 Team 9: No significant predictors Team 10: No significant predictors Team 11: No significant predictors _______________________________________________ Significance level is p < .05

Understanding Team Performance and Team Cohesion 101
Table 3. 29. Teams 1-11: Social Cohesion (U-D) Estimated Model Parameters Model Component Lag Coefficient Std. Error P Value Team 1: X6: Negative Range Omega Factor # 6 0 -0.5762 0.2308 0.0172 X7: Negative Affect Omega Factor # 7 0 0.8765 0.4137 0.0411 Team 2: X1: Effort Omega Factor # 1 0 -0.6342 0.2295 0.0094 X3: Mental Demand Omega Factor # 3 0 0.9196 0.2368 0.0005 X5: Positive Affect Omega Factor # 5 0 -0.0597 0.0239 0.0178 Team 3: No significant predictors Team 4: X4: Positive Range Omega Factor # 4 0 0.1244 0.0539 0.0274 X5: Positive Affect Omega Factor # 5 0 -0.2403 0.0535 0.0001 Team 5: X3: Mental Demand Omega Factor # 3 0 0.8772 0.3691 0.0229 Team 6: No significant predictors Team 7: X1: Effort Omega Factor # 1 0 0.7489 0.3681 0.0493 Team 8: X5: Positive Affect Omega Factor # 5 0 -0.7118 0.1398 0.0000 Team 9: No significant predictors Team 10: No significant predictors Team 11: No significant predictors _________________________________________________ Significance level is p < .05

Understanding Team Performance and Team Cohesion 102
Table 3. 30. Teams 1-11: “In-the-Wrong-Direction” Effects Study Dependent Variable Predictor Team Task Workload Team Performance TLX Performance 1 TLX Performance 2
TLX Frustration 4 TLX Temporal 5 TLX Frustration 10 TLX Effort 10 TLX Performance 10 Multivariate Team Performance Negative Affect 1
P-N Cohesion 2 Positive Affect 2 U-D Cohesion 3 Positive Affect 3 Positive Affect 4 U-D Cohesion 6 Range of Negative Affect 8
TLX Mental Demand 10 Task Task Cohesion Positive Affect 2 Cohesion (F-B) TLX Effort 5 TLX Mental Demand 5 Social Social Cohesion TLX Frustration 1 Cohesion (P-N) Range of Negative Affect 5 Social Social Cohesion Negative Affect 1 Cohesion (U-D) TLX Effort 2 Positive Affect 2
Positive Affect 4 Positive Affect 8
________________________________________________________________________

Understanding Team Performance and Team Cohesion 103
Discussion
The Discussion is organized according to the major sets of hypotheses. Difficulty of Exercises vs. Team Performance
One of the focal questions in this study pertained to why the performance of all eleven teams declined after training. The first hypothesis was formed in an effort to determine whether the varying level of difficulty of the team exercises may have masked the effect of training. The results of the analysis of the relationship between difficulty and team performance provide no support for the hypothesis that performance will improve after the difficulty of the topical areas has been partialed out. Results indicated that for two teams, there was a significant relationship between difficulty and performance. Even with these two teams, there appeared to be no effect training-driven improvement in the partialed performance scores.
It was somewhat surprising that a relationship between performance and difficulty was found for only two of the teams. There are several possible reasons for this. The evaluations of the difficulty of the exercises made by a second sample of students may not have been consistent with the participants’ perceptions. Recall that the sample of evaluators of difficulty were asked to carry out their task to inform the instructor with regard to the value of the team assignments as exercises for future classes. This instruction was intended to increase the evaluators’ involvement and commitment in their evaluation. However, their motivation may not have been equivalent to the motivation of those students who had completed the exercises for a grade. In addition, it may have been difficult for these judges to estimate the difficulty level of the assignments without having actually worked through them.
Workload vs. Performance
The results of the analysis of workload and performance lend weak support for the hypothesis that effort and mental demand indices are positively correlated with team performance while frustration, performance, and temporal demand indices are negatively correlated with the same variable. Data on four of the eleven teams demonstrated support for these hypothesized relationships. It should be pointed out that there does not seem to be a reason why the relationship is supported for only certain teams. Because there is a pattern of inconsistency across the teams in several hypotheses, this inconsistency of results is treated separately at the end of the Discussion.
Multiple-predictor Transfer Function Analysis
For the multiple-predictor transfer function analysis, nearly half of the teams displayed significant predictors of team performance. Specifically, five teams demonstrated significant predictors, while six teams did not. Again, there seems to be no apparent reason for the nonsupport.

Understanding Team Performance and Team Cohesion 104
Prediction of Task Cohesion
The results lend support to the hypothesis that effort, mental demand, and positive affect are positively related to task cohesion, while frustration and negative affect are negatively related to it. There does not appear to be a reason that approximately half of the teams supported this relationship while the remaining half did not.
Prediction of Social Cohesion
In the study of the positive-negative social cohesion dimension, significant predictors were identified for six teams. This is considered support for the hypothesized relationship between P-N social cohesion and effort, mental demand, and positive affect. Once again, there is no evident reason for this partial support.
Prediction of Dominant-Submissive Social Cohesion
Data analysis in five of the eleven teams lends some support for the hypothesis regarding the dominant-submissive (U-D) social cohesion dimension. Recall that this hypothesis stated that effort, mental demand, and positive affect are positively related to U-D social cohesion, while frustration and negative affect are negatively related to it. Five teams displayed significant predictors of U-D social cohesion while the remaining six teams yielded no significant predictors. It cannot be explained why only half of the teams supported this relationship.
Unpredicted and Unusual Results
The most perplexing finding in the present study is that the coefficients for many of the predictors of team performance and cohesion had algebraic signs opposite from those that had been predicted. In fact, a total of twenty-seven predictors were found to be “statistically significant” (had a two-tailed test been used) but whose signs were reversed. There are several reasons for this. First, the signs themselves may be spurious with little interpretive value. This reason coincides with the rigorous procedures that research should follow after positing a directional hypothesis. Specifically, in standard null hypothesis testing, the rejection region falls only on one side of the test statistic distribution. To suggest that an opposite effect might be significant is to abuse the power-increasing one-tailed test. Following this orthodox line of thinking, all apparently significant effects in “the opposite direction” would not even be acknowledged.
A second reason for the apparent opposite effects that were found pertains to the
possibility that the hypothesized arose from the fact that the hypothesized were erroneously conceived. Consider the analysis of the relationship between workload and team performance. According to the Yerkes and Dodson Law (Wickens & Hollands, 2000), an intermediate degree of stimulation is more favorable than extreme stimulation in either direction. In other words, stimulation that is either too high or too low may hinder, rather than enhance performance. Moderate levels of arousal will improve

Understanding Team Performance and Team Cohesion 105
performance by allowing the individual to focus on relevant cues, whereas higher levels may be detrimental because relevant cues may also be excluded. Therefore, it might have been a flaw in logic to hypothesize that the TLX indices of effort and mental demand are positively related to performance. The relationship may be more akin to an inverted-U. Optimum levels of mental demand and effort may not be at extreme points. Rather, optimum levels may be intermediate.
The multiple-predictor transfer function analyses also yielded several “in-the-
wrong-direction” effects. This was particularly true for negative and positive affective states. Once again, an orthodox treatment of this would be to conclude that the null hypothesis is not rejected. Another way of treating it is that once again, the scientific hypotheses may have been erroneously conceived. Teams that scored high in positive affect, for example, may have not been serious enough about their performance. Conversely, it is conceivable that teams that scored very high in negative affect may have performed well if the negative affectivity served to bond members to their teams. The PANAS only evaluates the various feelings and emotions experienced by individual team members. Therefore, it is unclear whether these emotions were directed at the instructor, the course, the workload, or the other team members.
Several “in-the-wrong-direction” effects were also found with the two social
cohesion predictors. Similar to the aforementioned analyses, the hypotheses regarding social cohesion may have been unrealistically stated. To reiterate, it was hypothesized that effort, mental demand, and positive affect would be positively and significantly related to both markers of social cohesion, while frustration and negative affect would be negatively related to social cohesion. It is possible that those teams that scored particularly high in social cohesion may have exerted more effort into the friendships among team members than they did to the team tasks. Therefore, it is not implausible that the performance of highly cohesive teams may be poorer than the performance of teams that receive moderate scores of social cohesion. Moreover, it was suggested above that teams might require moderate levels of workload, positive and negative affect, and team cohesion in order to become high-performing units. It was presumed initially that teams high in cohesion and positive affect would outperform teams with lower scores on these measures. However, these findings now suggest that extreme cohesion and affect scores, in either direction, may actually hinder team performance.
Another perspective on the “in-the-wrong-direction” findings concerns the
complex problem of suppressor variables. Cohen and Cohen (1983) provide an explanation of suppressor variables as predictors whose presence in the regression model accounts for variance in the dependent variable because of their relationships with the other predictors. Although no source on the topic has been found, it is logical to assert that since transfer function analysis is analogous to multiple regression analysis, the same phenomena may occur. The point is that the algebraic sign of the predictors may be purely related to the nature of the other predictors in the model and not have much importance in and of themselves. Statisticians who accept this point of view place little credence in the interpretation of individual transfer function or regression coefficients. In

Understanding Team Performance and Team Cohesion 106
a sense, these statisticians are “nihilistic” with regard to the “meaning” of prediction systems (David Reilly, personal communication, 2002).
The perspective that we take in this study is that none of the three approaches is
completely correct. Specifically, prediction coefficients whose algebraic sign is opposite to that predicted must be treated with care. They should not be over- or underinterpreted. For example, let us assume that the time-based paradigm makes it at least somewhat unique. Under this assumption, it seems foolish to adopt a statistically orthodox view and completely discount as nonsignificant prediction coefficients whose algebraic signs oppose the prediction. On the other hand, it also seems equally foolish to begin to interpret as meaningful prediction coefficients as though a two-tailed null hypothesis had been in effect. Finally, it seems as though ignoring the possible interpretability of statistically significant prediction coefficients, in spite of the risk of suppressor variable effects may be a missed opportunity in this exploratory study. Therefore, I have taken the approach to cautiously examine possible future research that might be carried out in the event that the opposite-signed findings are NOT spurious.
In line with this thinking, the following can be asserted. The frequency of the “in-
the-wrong-direction” findings may suggest limitations in the study. Because the course instructor did not hold a traditional role in the class, some of the participants may have felt that their role as a student was somewhat ambiguous. Instead of holding the conventional role of a college student, they had become members of a self-managing learning team. Although they had been warned several times about the new roles they were expected to espouse, it may not have made a difference.
In addition, students may have harbored some resentment regarding their
simultaneous participation in a college course and psychology experiment. On several occasions, the teaching assistants witnessed both verbal and nonverbal expressions of boredom and even hostility. Several students were frustrated with particular team members that consistently arrived to their session late and/or left prematurely. It is not surprising, therefore, that many students said that they were unhappy with the nature of the team-based course in the instructor’s teaching evaluations.
Another possible limitation of the study is that the frequency of the team exercises
may have overwhelmed the student-learning teams. Unlike most college courses, the teams in this study in effect received a “test” every time they attended class (i.e., three times per week). This much testing may have overwhelmed the students, resulting in general resentment toward the course in addition to student apathy and carelessness. This point is particularly poignant given the previously unknown fact that the majority of students taking the course were taking it not as an elective within their major course of study but as a means of meeting certain course cluster requirements. Many students throughout the course were not well prepared for the course material and felt little enthusiasm for it.
The fact that the original performance measures themselves may have had several
measurement-related problems presents another possible limitation. Due to the large
Understanding Team Performance and Team Cohesion 107
number of team exercises to be graded, grading inconsistency may have occurred. Recall that each exercise was scored first by one of the teaching assistants and second by the course instructor. Both followed a pre-specified key for grading. In spite of these attempts to control for grading inconsistency, it may not have been eliminated completely. In addition to the reliability-related issues, there may have been concerns with the validity of the measures. Although the measures appeared to have face validity, no formal test validation was performed. In spite of a lack of formal validation, it seems reasonable to accept that the exercises were reasonably content valid. That is, the material came from a careful reading of the text, the instructor’s guide, and was examined by a second subject matter expert. The real psychometric concern seems to revolve around the fact that the content domain changed from week to week and even class to class. In other words, the subject matter’s difficulty and complexity varied. This was something that had not been anticipated at the outset of the project. It was thought that assessing the relative difficulty of each exercise by a different group of students who took the same course might serve as a way of partialing out differential difficulty. This approach not only did not seem to work but also was never anticipated to deal with the variability of the constructs being measured.
A further drawback of the present study pertains to the way in which many of the
teams appeared to carry out their team tasks. Several teams seemed to form a pattern of breaking down their exercises into smaller, disjunctive units. Since the exercises were designed to be completed as a team, an aggregation of individual efforts would be unlikely to result in high performance. If members became complacent in their “disjunctive teamwork,” it is possible that the training intervention may not have been potent enough to change this behavior.
A final limitation is that problems may have existed with the team training
intervention itself. For instance, a three-hour team training may have been insufficient to create a significant effect on team performance. Rather, the participants may have benefited from a longer or more spaced-out intervention. In addition, the participants were not able to receive the training with their own team members due to numerous scheduling conflicts. Therefore, participants often did not receive the training with their fellow team members. Training was conducted in settings that were different from those in which they met during their team sessions. Therefore, there may have been a lack of transfer climate for training.
An Overall Issue—The Inconsistency Across Teams
In addition to these limitations, there were many instances of inconsistency among the positive findings across teams. More specifically, the same predictors did not always come into play with all teams. Because traditional science depends on consistency and replication, critics may claim that the present inconsistencies invalidate the results, pointing to a lack of credibility. These critics may be correct. However, on the other hand, it may be that certain entities such as teams may behave differently from others over time. In other words, there may be some individual team characteristics that may account for the differences. This perspective indicates that the findings may not be

Understanding Team Performance and Team Cohesion 108
generalizable; but there may be moderators that account for the differences. It is not clear what the moderators are. Our attempts at identifying possible demographic characteristics of team members that serve as moderators seemed to be unsuccessful. Strengths of the Study
Despite these potential limitations, the study does possess several strengths. This is the first study of its kind to look at team outcome as a performance measure over time within the context of a university setting. Although the use of team projects within university courses has gained immense popularity over the past twenty years (Feichtner & Davis, 1985), the dynamics of teams have yet to be followed over an extended period of time, such as a four-month semester. Team research at the college level is typically cross-sectional in nature. The present study, on the other hand, is unique in that it tracked changes in behavior and perceptions that occur in student teams over several months. Further, it provided insight into the complexities that university students experience when working in teams over time. This study points to a paradigm that might be used, perhaps with modification, to study teams over time. If the psychometric problems can be addressed, the time series paradigm might be a powerful one for examining team performance. The findings therefore can be used to inform college instructors who use teams in teaching that there may be variability in reactions over time. There may also be a need to carefully and regularly monitor the conditions that exists within teams. For instance, it is important to address levels of workload and team cohesion. Is the workload either too high or too low? Are teams becoming too cohesive or are members not bonding enough?
A further strength of the current research is that it addressed some of the
questions that Studies 1 and 2 of Phase 2 analyses left unanswered. For instance, it was not clear whether the difficulty level of certain topical areas of I/O psychology played a role in the declining team performance. Because difficulty was not related to performance for most of the teams, it was determined that the varying level of difficulty was not a factor in explaining the declining performance scores after the training intervention. In other words, the effect of difficulty on performance was ruled out. Ruling out difficulty might lead to a conclusion that negative motivation levels and lack of personal control on the part of the students (both of which were suggested by student comments) contributed greatly to the nonsuccess of the training.
The use of the ARIMA model of time series analysis may be viewed as another
strength of the study. ARIMA is a powerful statistical technique that has not been frequently used in team research. However, the need for flexibility and adaptability in teams requires a developmental approach to team research. ARIMA is considered a very useful tool in that it is able to capture this dynamic nature of teams. According to Kozlowski, Gully, Nason, and Smith (1999), there exists a noticeable absence of theories that incorporate team development and performance. These authors feel strongly that team theory should be developed “with a more dynamic conceptualization of team performance and its compilation” (p. 241). A true understanding of team performance

Understanding Team Performance and Team Cohesion 109
must be capable of viewing performance at various points in time. The ARIMA model allowed this study to examine these dynamics first hand.
An additional strength of the study is the use of multiple-predictor models for the
dependent measures. The previous studies examined only univariate models. In contrast, the present research examined predictors in combination so that more comprehensive prediction models could be developed.
Furthermore, the use of psychometrically sound instruments including, the
SYMLOG, PANAS, and TLX contributed to the strengths of this study. The reasonable level of reliabilities coefficients of the SYMLOG dimensions make the measure an appropriate tool for tracking changes in levels of task and social cohesion (Bales & Cohen, 1979). The high internal consistency reliability coefficients for the positive and negative affect scales of the PANAS indicate that the scales sufficiently capture both mood factors. TLX also has moderate test-retest reliabilities and high ratings of operator acceptance, making it useful in the study of task workload.
Future Team Research with Student Teams
There were three purposes of this study: 1) to conduct a secondary analysis on the Study 1 and Study 2 of Phase 2 data, 2) to examine the previously unresearched effects of workload, and 3) to arrive at a multiple-predictor transfer functions models of team performance. Future research may benefit from revising the methodology when using student-learning teams. As mentioned previously, taking performance measures as often as three times per week may be overwhelming for team members. Therefore, team members may function more successfully when they are expected to perform either weekly or biweekly. The format of team exercises may need to be altered as well. For example, team members may be more satisfied with their team experience if their assignments are varied. Some assignments may consist of essays and multiple-choice questions, while others could require members to create group presentations. Clearly, the development of assignments would require a great deal of effort and imagination on the part of the instructor. Finally, additional contact with the course instructor may also prove to be beneficial to team performance and team satisfaction. Some of the participants in the present study were discontented with the limited presence of the instructor. In the future, he or she should be readily available to address concerns relating to either the assignments or team functioning
During the course of the study, it appeared that many of the teams created a
pattern of dividing the team assignments into individualized, smaller tasks. As a result, assignments became an exercise in disjunctive group work. In future studies, the course instructor may choose to encourage students to work as a team. In addition, the team process training intervention may require revamping. A three-hour session may have been inadequate to impart sufficient knowledge on how to successfully function as a team. Rather than lecture about the seven core processes through an hour-long PowerPoint presentation, the instructor may need to focus on each component for an entire session. In other words, the team training most likely should be modularized. The

Understanding Team Performance and Team Cohesion 110
trainer should be prepared with several role-play exercises for each of the seven core processes. Mere memorization of definitions will prove insufficient for a true understanding of the team components. The goal, rather, should be for an experiential understanding of teamwork in a controlled setting. Future team training can be made more successful through the use of analogies, error-based training, and learner control (Kozlowski, Gully, Nason, & Smith, 1999). It is also likely that the training needs to be longer in duration (e.g., several days long). While the present training occurred for one day during a three-hour session, it is highly recommended that future training take place over several days. Three hours appeared to be an insufficient amount of time to acquire the necessary team knowledge. It would seem that team process training could easily be two to three times as long in duration.
In conclusion, this study is of value to the team research literature due its novel
approach to tracking team performance. In a sense, it is a proof of concept that such a study can be performed in a university setting. It provides the basis of a paradigm for team research. The merits and weaknesses of the research were identified and recommendations for future research were suggested. Future researchers also may choose to adopt the ARIMA model, or other methods of time-based research, to investigate team dynamics. The continuation of the approach should elucidate the results of the present study, as well as other questions that remained unanswered in the field of team research.
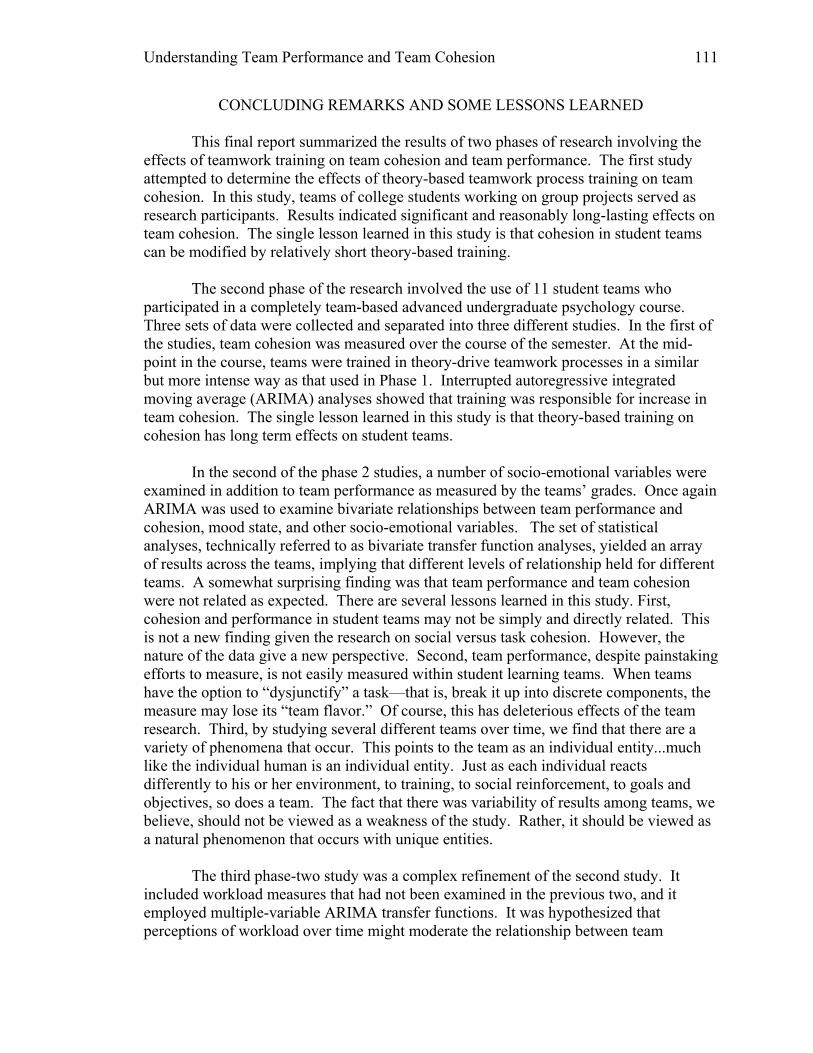
Understanding Team Performance and Team Cohesion 111
CONCLUDING REMARKS AND SOME LESSONS LEARNED
This final report summarized the results of two phases of research involving the effects of teamwork training on team cohesion and team performance. The first study attempted to determine the effects of theory-based teamwork process training on team cohesion. In this study, teams of college students working on group projects served as research participants. Results indicated significant and reasonably long-lasting effects on team cohesion. The single lesson learned in this study is that cohesion in student teams can be modified by relatively short theory-based training. The second phase of the research involved the use of 11 student teams who participated in a completely team-based advanced undergraduate psychology course. Three sets of data were collected and separated into three different studies. In the first of the studies, team cohesion was measured over the course of the semester. At the mid-point in the course, teams were trained in theory-drive teamwork processes in a similar but more intense way as that used in Phase 1. Interrupted autoregressive integrated moving average (ARIMA) analyses showed that training was responsible for increase in team cohesion. The single lesson learned in this study is that theory-based training on cohesion has long term effects on student teams. In the second of the phase 2 studies, a number of socio-emotional variables were examined in addition to team performance as measured by the teams’ grades. Once again ARIMA was used to examine bivariate relationships between team performance and cohesion, mood state, and other socio-emotional variables. The set of statistical analyses, technically referred to as bivariate transfer function analyses, yielded an array of results across the teams, implying that different levels of relationship held for different teams. A somewhat surprising finding was that team performance and team cohesion were not related as expected. There are several lessons learned in this study. First, cohesion and performance in student teams may not be simply and directly related. This is not a new finding given the research on social versus task cohesion. However, the nature of the data give a new perspective. Second, team performance, despite painstaking efforts to measure, is not easily measured within student learning teams. When teams have the option to “dysjunctify” a task—that is, break it up into discrete components, the measure may lose its “team flavor.” Of course, this has deleterious effects of the team research. Third, by studying several different teams over time, we find that there are a variety of phenomena that occur. This points to the team as an individual entity...much like the individual human is an individual entity. Just as each individual reacts differently to his or her environment, to training, to social reinforcement, to goals and objectives, so does a team. The fact that there was variability of results among teams, we believe, should not be viewed as a weakness of the study. Rather, it should be viewed as a natural phenomenon that occurs with unique entities. The third phase-two study was a complex refinement of the second study. It included workload measures that had not been examined in the previous two, and it employed multiple-variable ARIMA transfer functions. It was hypothesized that perceptions of workload over time might moderate the relationship between team

Understanding Team Performance and Team Cohesion 112
performance and the set of predictors that had been examined in the second study, phase 2. Once again, the findings indicated a range of effects across the 11 teams. This study attempted to help explain the variability of results and the unexpected results of the prior study. Two approaches were used. First, certain variables were examined as moderators. Second, predictor variables in a transfer function model were examined in concert with one another. Variability among teams over time remained unexplained to our satisfaction. They seemed not to be well accounted for by these two methods. Therefore, there are several lessons learned in this study. First, variability in “behavior” of teams over time exists and is resistant to simple explanation. Second, researchers should consider teams as individual entities and expect that the treatment of teams will have variable effects. This may sound obvious if the reader comes from an “individual differences” perspective. However, viewing teams as individual entities that vary with regard to cohesion, performance, reaction to workload, and team training implies that researchers adopt or create new paradigms to study teams. Third, in spite of these “lessons” the old problems of aggregation and measurement of team behavior remain stubborn ones. We believe that the four studies in two phases yielded some answers but perhaps more questions than answers. These results suggest that teamwork is a complex process that involves numerous variables interacting in different ways depending upon the task and the team. It is important to continue research that employs novel techniques such as time-series analysis to reveal important patterns of team behavior over time.

Understanding Team Performance and Team Cohesion 113
REFERENCES
Affleck, G., Zautra, A., Tennen, H., & Armeli, S. (1999). Multilevel daily process designs for consulting and clinical psychology: A preface for the perplexed. Journal of Consulting and Clinical Psychology, 67, 746-754.
Avolio, B. J., Kahai, S., Dumdum, R., & Sivasubramaniam, N. (2001). Virtual teams:
Implications for e-leadership and team development. In M. London (Ed). How people evaluate others in organizations (pp. 337-358). Mahwah, NJ: Lawrence Erlbaum Associates, Inc.
Bales, R. F. & Cohen, S. P. (1979). Symlog: A System for the Multiple Level Observation
of Groups. New York: Free Press. Bell, M. A. (1982). Phases in group problem solving. Small Group Behavior, 13, 475-
495. Blanchard, P. N. & Thacker, J. W. (1998). Effective training: Systems, strategies, and
practices. Englewood Cliffs, NJ: Prentice Hall. Bowers, C., Thornton, C., Braun, C., Morgan, Jr., B. B., & Salas, E. (1998). Automation,
task difficulty, and aircrew performance. Military Psychology, 10, 259-274. Box, G. E. P. & Jenkins, G. M. (1976). Time series analysis: Forecasting and control.
San Francisco, CA: Holden-Day. Boye, M.W. & Jones, J.J. (1997). Organization culture and employee
counterproductivity. In R.A. Giacalone & J. Greenberg (Eds.) Antisocial Behavior in Organizations. (172-184) Thousand Oaks, CA: Sage.
Bray, R. M., Kerr, N. L., & Atkin, R. S. (1978). Effects of group size, problem difficulty,
and sex on group performance and member reactions. Journal of Personality and Social Psychology, 36, 1224-1240.
Campion, M.A., Medsker, G.J. & Higgs, A.C. (1993). Relations between work group
characteristics and effectiveness: Implications for designing effective work groups. Personnel Psychology, 46, 823-850.
Carron, A. V. (1988). Group dynamics in sport. London, Canada: Spodym. Cascio, W. F. (1998). Applied psychology in human resource management. Upper
Saddle River, NJ: Prentice-Hall, Inc. Cohen, C.J. (1988, October). Social loafing and personality: The effects of individual
differences on collective performance. (Doctoral Dissertation, Fordham University). Dissertation Abstracts International, 49, 1430B-1431B.

Understanding Team Performance and Team Cohesion 114
Cohen, J., & Cohen P. (1983). Applied multiple regression/correlation analysis for the
behavioral sciences. Hillsdale, NJ: Lawrence Erlbaum. Craig, T. Y., & Kelly, J. R. (1999). Group cohesiveness and creative performance. Group
Dynamics, 3(4), 243-256. Dickinson, T. L. & McIntyre, R. M. (1997). A conceptual framework for teamwork
measurement. In Brannick, M.T. Salas, E., (Eds.) Team Performance Assessment and Measurement: Theory, Methods, and Applications. Hillsdale, NJ: Lawrence Erlbaum.
Dickinson, T. L., McIntyre, R. M., Ruggeberg, B. J., Yanushefski, A., Hamill, L. S., &
Vick, A. L. (1992). A conceptual framework for developing team process measures of decision-making performance (Final Report). Orlando, FL: Naval Training Systems Center, Human Factors Division.
Druskat, V. U. & Wolff, S. B. (1999). Effects and timing of developmental peer
appraisals in self-managing work groups. Journal of Applied Psychology, 84(1), 58-74.
Earley, P. C. (1989). Social loafing and collectivism: A comparison of the United States
and the People's Republic of China. Administrative Science Quarterly, 34, 565-582.
Earley, P. C. & Erez, M. (1997). New perspectives on international
industrial/organizational psychology. San Francisco, CA: The New Lighter Press. Erez, M. & Somech, A. (1996). Is group productivity loss the rule or the exception?
Effects of culture and group-based motivation. Academy of Management Journal, 39, 1513-1537.
Evans, C. R. & Dion, K. L. (1991). Group cohesion and performance: A meta-analysis.
Small Group Research, 22, 175-186. Feichtner, S. B. & Davis, E. A. (1984). Why some groups fail: A survey of students'
experiences with learning groups. Organizational Behavior Teaching Review, 9, 58-71.
Fenelon, J. R., & Megargee, E. I. (1971). Influence of race on the manifestation of
leadership, Journal of Applied Psychology, 55, 353-358. Gallwey, T.J., & Drury, C. G. (1986). Task complexity in visual inspection. Human
Factors, 28, 595-606. Glass, G.V., Willson, V.L., & Gottman, J.M. (1975). Design and analysis of time-series

Understanding Team Performance and Team Cohesion 115
experiments. Boulder, Colorado: Colorado Associated University Press. Gopher, D., Donchin, E. (1986). Workload – An examination of the concept. In K. Boff,
L. Kauffman, and J.P. Thomas (Eds.), Handbook of perception and human performance (pp. 41.1-41.9. New York: Wiley
Gottman, J.M. (1981). Time-series analysis: A comprehensive introduction for social
scientists. Cambridge: Cambridge University Press. Greene, C. N. (1989). Cohesion and productivity in work groups. Small Group
Behavior, 20, 70-86. Hardy, C.J. & Crace, R.K. (1991). The effects of task structure and teammate
competence on social loafing. Journal of Sport & Exercise Psychology, 13, 372-381.
Hardy, C.J. & Latané, B. (1988). Social loafing in cheerleaders: Effects of team
membership and competition. Journal of Exercise & Sport Psychology, 10, 109-114.
Hart, S. G., & Staveland, L. (1988). Development of the NASA task load index (TLX):
Results of empirical and theoretical research. In P.A. Hancock and N. Meshkati (Eds.) Human Mental Workload (pp. 139-183). Amsterdam: North-Holland.
Hogan J. & Hogan, R. (1989). How to measure employee reliability. Journal of Applied
Psychology, 74, 273-279. Hollingshead, A. B. (1998). Group and individual training: The impact of practice on
performance. Small Groups Research, 29(2), 254-280. House, R. J. (1971). A path-goal theory of leader effectiveness. Administrative Science
Quarterly, 16, 321-338. Isenberg, D. J. & Ennis, J. G. (1981). Perceiving group members: A comparison of
derived and imposed dimensions. Journal of Personality and Social Psychology, 41, 293-305.
Jehn, K. A., Northcraft, G. B., & Neale, M. A. (1999). Why differences make us
different: A field study of diversity, conflict, and performance. Administrative Science Quarterly, 44, 741-763.
Kazdin, A. E. (1998). Methodological Issues and Strategies in Clinical Research.
Washington, DC: American Psychological Association.

Understanding Team Performance and Team Cohesion 116
Kerr, N.L. & Bruun, S.E. (1983). Dispensability of member effort and group motivation losses: Free-rider effects. Journal of Personality and Social Psychology, 44, 78-94.
Kerr, S. & Jermier, J. M. (1978). Substitutes for leadership: Their meaning and
measurement. Organizational Behavior and Human Performance, 22, 375-403. Keyton, J. & Springston, J. (1990). Redefining cohesiveness in groups. Small Group
Research, 21, 234-254. Kozlowski, S. W. J., Gully, S. M., Nason, E. R., & Smith, E. M. (1999). Developing
adaptive teams: A theory of compilation and performance across levels and time. In D. R. Ilgen & E. D. Pulakos (Eds.), The Changing Nature of Performance: Implications For Staffing, Motivation, and Development (pp. 240-292). San Francisco, CA: Jossey-Bass.
Latané, B., Williams, K. & Harkins, S. (1979). Many hands make light the work: The
causes and consequences of social loafing. Journal of Personality and Social Psychology, 37, 822-832.
Littlepage, G. E., Cowart, L., & Kerr, B. (1989). Relationships between group
environment scales and group performance and cohesion. Small Group Behavior, 20, 50-61.
Matsui, T., Kakuyama, T. & Onglatco, M.L.U. (1987). Effects of goals and feedback on
performance in groups. Journal of Applied Psychology, 72, 407-415. McCleary, R. & Hay, R. A. (1980). Applied Time Series Analysis For the Social
Sciences. Beverly Hills, CA: Sage Publications. McDowall, D., McCleary, R., Meidinger, R.E., & Hay, R.A. (1980). Interrupted Time
Series Analysis. Beverly Hills, CA: Sage Publications. McIntyre, R. M., & Salas, E. (1995). Measuring and managing for team performance:
Emerging principles from complex environments. In R. A. Guzzo & E. Salas (Eds.). Team Effectiveness and Decision-Making in Organizations (pp. 9-45). San Francisco: Josey-Bass Publishers.
McIntyre, C.W., Watson, D., Clark, L.A. & Cross, S.A. (1991). The effect of induced
social interaction on positive and negative affect. Bulletin of the Psychonomic Society, 29, 67-70.
Meltzoff, J. (1998). Critical Thinking About Research: Psychology and Related Fields.
Washington, DC: American Psychological Association. Moore, A. C. (1992). The Game Finder: A Leader's Guide to Great Activities. State

Understanding Team Performance and Team Cohesion 117
College, PA: Venture. Morgan, B. B., Jr., Salas, E., & Glickman, A. S. (1993). An analysis of team evolution
and maturation. The Journal of General Psychology, 120(3), 277-291. Muchinsky, P. M. (2000). Psychology Applied to Work. (6th ed). Stamford, CT:
Wadsworth Thompson Lauwry. Mudrack, P. E. (1989). Defining group cohesiveness a legacy of confusion. Small
Group Behavior, 20, 37-49. Mulvey, P. W. & Klein, H. J. (1998). The impact of perceived loafing and collective
efficacy in group goal processes and group performance. Organizational Behavior & Human Decision Processes, 74(1), 62-87.
Naylor, J. C., & Briggs, G. E. (1965). Team-training effectiveness under various
conditions. Journal of Applied Psychology, 49, 223-229. Northcraft, G. B., Polzer, J. T., Neale, M. A., & Kramer, R. M. (1995). Diversity, social
identity, and performance: Emergent social dynamics in cross-functional teams. In S. E. Jackson & M. N. Ruderman (Eds.) Diversity in Work Teams (pp.1-13). Washington, DC: American Psychological Association.
Neuman, G. A., Wagner, S. H., & Christiansen, N. D. (1999). Relationship between
work-team personality composition and the job performance of teams. Group and Organizational Management, 24(1), 28-45.
O’Reilly, C. A., Caldwell, D. F., & Barnett, W. P. (1989). Work group demography,
social integration, and turnover. Administrative Science Quarterly, 34, 21-37. Oser, R. L., Gualtieri, J. W., Cannon-Bowers, J. A., & Salas, E. (1999). Training team
problem solving skills: An event-based approach. Computers in Human Behavior, 15, 441-462.
Polley, R. B. (1987). The dimensions of social interaction: A method for improving
rating scales. Social Psychology Quarterly, 50, 72-82. Prapavessis, H. & Carron, A. V. (1997). Sacrifice, cohesion, and conformity to norms in
sports teams. Group Dynamics, 1(3), 231-240. Scerbo, M.W. (2001). Stress, workload, and boredom in vigilance: A problem and an
answer. In P.A. Hancock & P.A. Desmond (Eds.), Stress, Workload, and Fatigue (pp. 267-278). Hillsdale, NJ: Lawrence Erlbaum Associates.
Schmitt, N. & Chan, D. (1998). Personnel Selection: A Theoretical Approach.
Thousand Oaks, CA: Sage Publications, Inc.

Understanding Team Performance and Team Cohesion 118
Shaw, M. E. (1976). Group Dynamics: The Psychology of Small Group Behavior. New
York: McGraw-Hill. Siebold, G. L. (1999). The evolution of the measurement of cohesion. Military
Psychology, 11(1), 5-26. Slater, M.R. & Sewell, D.F (1994). An examination of the cohesion-performance
relationship in university hockey teams. Journal of Sports Sciences, 12, 423-431. Solomon, M. J. (1981). Dimensions of interpersonal behavior: A convergent validation
within a cognitive interactionist framework. Journal of Personality, 49(1), 15-26. Strobel, K.R. & McIntyre, R.M (2001). Creating cohesive teams: Analyzing the effects of
teamwork skills training. Poster presented at the 21st Annual Convention of the Society for Industrial and Occupational Psychology. San Diego, CA.
Tabachnick, B.G., & Fidell, L.S. (2001). Using Multivariate Statistics. 4th ed. Boston,
MA: Allyn and Bacon. Taylor, D. M., Doria, J., & Tyler J. K. (1983). Group performance and cohesiveness: An
attribution analysis. Journal of Social Psychology, 119, 187-198. Tedrow, L. B. (2001). The Effects of Training in Teamwork Skills on Intact Student
Teams. Unpublished master’s thesis, Old Dominion University, Norfolk, VA. Totterdell, P., Kellett, S., Teuchmann, K. & Briner, R.B. (1998). Evidence of mood
linkage in work groups. Journal of Personality and Social Psychology, 74, 1504-1515.
Tsui, A. S., & O’Reilly, C. A. (1989). Beyond simple demographic effects: The
importance of relational demography in superior-subordinate dyads. Academy of Management Journal, 32, 402-423.
Tsui, A. S., Eagan, T. D., & O’Reilly, C. A. (1992). Being different: Relational
demography and organizational attachment. Administrative Science Quarterly, 37, 549-579.
Tuckman, B. W. & Jensen, M. (1977). Stages of small group development revisited.
Group and Organizational Studies, 2, 419-427. Tziner, A. (1992). Group cohesiveness: A dynamic perspective. Social Behavior and
Personality, 10, 205-211. Vandaele, W. (1983). Applied Time Series and Box-Jenkins Models. Orlando: Academic
Press.
Understanding Team Performance and Team Cohesion 119
Wagner, J. A. & Hollenbeck, J. R. (1998). Organizational behavior: Securing
competitive advantage. Upper Saddle, New Jersey: Prentice Hall. Watson, D., Clark, L.A. & Tellegen, A. (1988). Development and validation of brief
measures of positive and negative affect: The PANAS scales. Journal of Personality and Social Psychology, 54, 1063-1070.
Watson, W. E. Kumar, K., & Michaelsen, L. K. (1993). Cultural diversity’s impact on
interaction process and performance: Comparing homogeneous and diverse task groups. Academy of Management Journal, 36, 590-602.
Wei, W.S. (1990). Time Series Analysis: Univariate and Multivariate Methods.
Redwood City, CA: Addison-Wesley Publishing Company, Inc. West, S. G. & Hepworth J. T. (1991). Statistical issues in the study of temporal data:
Daily experiences. Journal of Personality, 59:3, 609-662. Wickens, C. D., & Hollands, J. G. (2000). Engineering Psychology and Human
Performance. Upper Saddle River, NJ: Prentice Hall. Widmeyer, W. N. & Martens, R. (1978). When cohesion predicts performance outcome
in sport. Research Quarterly, 49, 372-380. Wildmeyer W. N., Brawley, L. R., & Carron, A. V. (1986). The Measurement of
Cohesion iIn Sport Teams: The Group Environment Questionnaire. London, Ontario: Sports Dynamics.
Williams, K., Harkins, S. & Latané, B. (1981). Identifiability as a deterrent to social
loafing: Two cheering experiments. Journal of Personality and Social Psychology, 40, 303-311.
Wish, M, D'Andrade, R. G., & Goodnow, J. E. (1980). Dimensions of interpersonal
communication: Correspondences between structures for speech acts and bipolar scales. Journal of Personality & Social Psychology, 39(5), 848-860.
Xiao, Y., Hunter, W.A., Mackenzie, C. F., & Jefferies, N.J. (1996). Task complexity in
emergency medical care and its implications for team coordination. Human Factors, 38, 636-645.
Zaccaro, S. J. & Lowe, C. A. (1986). Cohesiveness and performance on an additive task:
Evidence for multidimensionality. Journal of Social Psychology, 128, 547-558. Zaccaro, S. J., Gualtieri, J., & Minionis, D. (1995). Task cohesion as a facilitator of team
decision making under temporal urgency. Military Psychology, 7(2), 77-93.
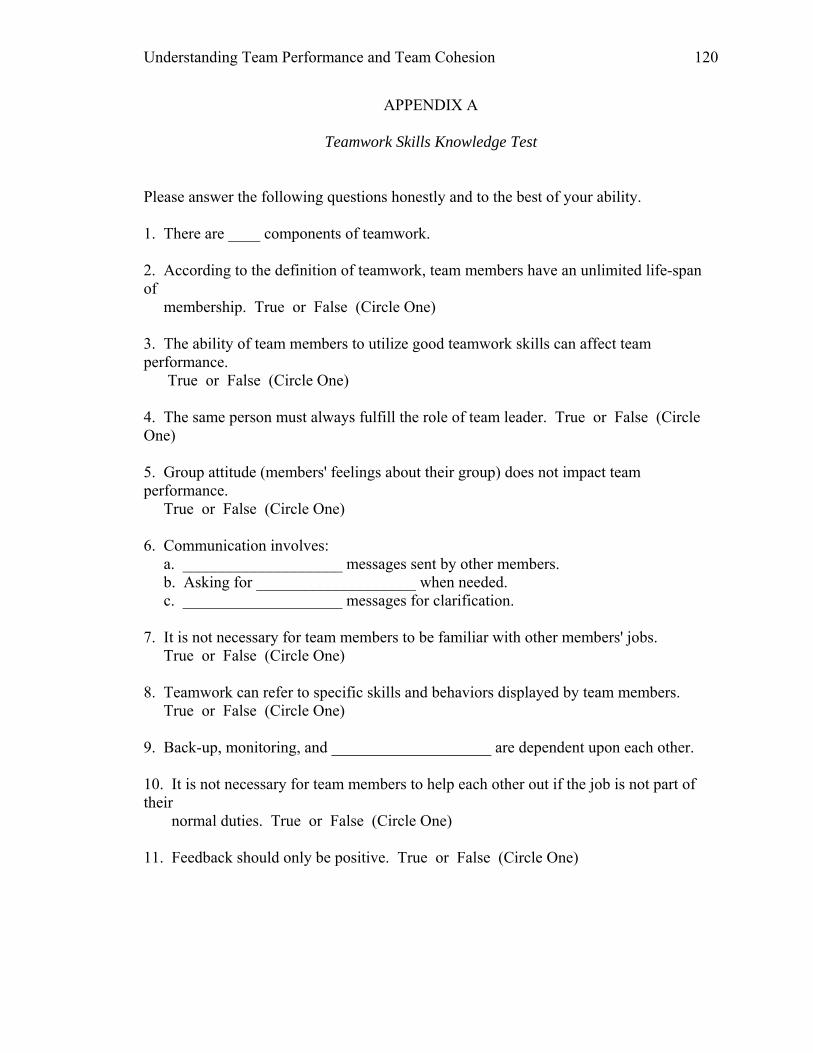
Understanding Team Performance and Team Cohesion 120
APPENDIX A
Teamwork Skills Knowledge Test
Please answer the following questions honestly and to the best of your ability. 1. There are ____ components of teamwork. 2. According to the definition of teamwork, team members have an unlimited life-span of membership. True or False (Circle One) 3. The ability of team members to utilize good teamwork skills can affect team performance. True or False (Circle One) 4. The same person must always fulfill the role of team leader. True or False (Circle One) 5. Group attitude (members' feelings about their group) does not impact team performance. True or False (Circle One) 6. Communication involves: a. ____________________ messages sent by other members. b. Asking for ____________________ when needed. c. ____________________ messages for clarification. 7. It is not necessary for team members to be familiar with other members' jobs. True or False (Circle One) 8. Teamwork can refer to specific skills and behaviors displayed by team members. True or False (Circle One) 9. Back-up, monitoring, and ____________________ are dependent upon each other. 10. It is not necessary for team members to help each other out if the job is not part of their normal duties. True or False (Circle One) 11. Feedback should only be positive. True or False (Circle One)

Understanding Team Performance and Team Cohesion 121
APPENDIX A Continued
12. Match each component with its example: _____ Communication a. Recognizing when a fellow team
member has performed correctly. ______ Team Orientation b. Being supportive of team members when they make a mistake. ______ Team Leadership c. Facilitating the performance of other
members' jobs. ______ Monitoring d. Helping another member when they're having difficulty. ______ Feedback e. Allowing others to complete statements
without interruptions. ______ Back-up f. Consulting others when you're unsure
how to proceed. ______ Coordination g. Listening to the concerns of other
members. 13. Feedback involves the ____________________, ____________________, and ____________________ of information.

Understanding Team Performance and Team Cohesion 122
APPENDIX B
Subjective Evaluation of Training Program
1. Did you find this training session in teamwork skills to be valuable? ________________________________________________________________________________________________________________________________________________________________________________________________________________________________________________________________________________________________________________________ 2. Please rate the following sections of the program in terms of usefulness in helping you learn the teamwork components using the following scale.
1__________2__________3__________4__________5
(Not Very Useful) (Very Useful) ____a. Warm-up Activities. ____b. Defining and Creating Examples of Teamwork. ____c. Viewing and Analyzing Video of Team Meeting. ____d. Tower Building Activity and Observation of Group. 3. Do you feel your team will benefit from the use of these skills? ________________________________________________________________________________________________________________________________________________________________________________________________________________________________________________________________________________________________________________________ 4. Do you feel your team will use these skills in the completion of your assignments? ________________________________________________________________________________________________________________________________________________________________________________________________________________________________________________________________________________________________________________________ 5. Do you feel you now know enough about these teamwork skills to successfully use them in a group meeting? ________________________________________________________________________

Understanding Team Performance and Team Cohesion 123
APPENDIX C
Team Log
Prior to each team meeting, please review the following components. Remind each other of the importance of good teamwork for group success. As you work in your groups, observe the team's behavior. You may use the space provided to record examples of constructive and/or destructive behaviors. At the end of the meeting, review these examples and focus on your team's successes and areas of improvement. Communication - The active exchange of information among team members using proper terminology, to clarify or acknowledge the receipt of information. ________________________________________________________________________________________________________________________________________________________________________________________________________________________________________________________________________________________________________________________________________________________________________ Team Orientation - The attitudes of team members towards one another and the team task - it reflects acceptance of team norms, level of group cohesion, and importance team membership. ________________________________________________________________________________________________________________________________________________________________________________________________________________________________________________________________________________________________________________________________________________________________________ Team Leadership - Providing direction, structure, and support for other team members - does not necessarily refer to a single individual with formal authority. ________________________________________________________________________________________________________________________________________________________________________________________________________________________________________________________________________________________________________________________________________________________________________ Monitoring - Team performance occurs through the observation and awareness of the activities and performance of members - implies that team members are individually competent and can provide the necessary feedback and back-up behavior. ________________________________________________________________________________________________________________________________________________________________________________________________________________________________________________________________________________________________________________________________________________________________________

Understanding Team Performance and Team Cohesion 124
APPENDIX C Continued
Feedback - The giving, seeking, and receiving of information among group members - providing information regarding other's performance. ________________________________________________________________________________________________________________________________________________________________________________________________________________________________________________________________________________________________________________________________________________________________________ Back-up Behavior - Assisting other team members to perform their tasks - members must be willing and able to provide and seek assistance when needed. ________________________________________________________________________________________________________________________________________________________________________________________________________________________________________________________________________________________________________________________________________________________________________ Coordination - When team activities are executed in response to the behavior of other members - successful coordination indicates that other components of teamwork are functioning effectively. ________________________________________________________________________________________________________________________________________________________________________________________________________________________________________________________________________________________________________________________________________________________________________

Understanding Team Performance and Team Cohesion 125
APPENDIX D
The PANAS (Watson, Clark, & Tellegen, 1988)
This scale consists of a number of words that describe different feelings and emotions. Read each item and then mark the appropriate answer in the space next to that word. Indicate to what extent you have felt this way today. Use the following scale to record your answers. 1 2 3 4 5 very slightly a little moderately quite a bit extremely or not at all
________ interested ________ irritable
________ distressed ________ alert
________ excited ________ ashamed
________ upset ________ inspired
________ strong ________ nervous
________ guilty ________ determined
________ scared ________ attentive
________ hostile ________ jittery
________ enthusiastic ________ active
________ proud ________ afraid

Understanding Team Performance and Team Cohesion 126
APPENDIX E
Workload Sharing (Campion, Medsker, & Higgs, 1993)
This questionnaire consists of statements about your team and how your team functions as a group. Please indicate the extent to which each statement describes your team. Use the following scale: 1 2 3 4 5 strongly disagree disagree neither agree nor disagree agree strongly agree
____________ Everyone on my team does their fair share of the work. ____________ No one in my team depends on other team members to do the work for them.
____________ Nearly all the members on my team contribute equally to the work.

Understanding Team Performance and Team Cohesion 127
APPENDIX F
Social Loafing
Please rate each of your team members on how much effort you feel they exerted at this team meeting by placing a mark on the following scale: Team member_________ |_________|_________|_________|_________|_________|
Exerted a large Exerted enough Exerted a small amount of effort to get the amount of effort effort task accomplished
(Note: A sufficient number of scales were provided so that each team member could be rated regardless of team size.)

Understanding Team Performance and Team Cohesion 128
APPENDIX G
Technical Details of Bivariate and Multivariate Transfer Function Analysis
Single-Predictor and Multiple-Predictor Transfer Function Models In univariate time series analysis, one can look at the ARIMA parameters of a single time series and use these parameters to estimate future values. In effect, the memory structure represented by the ARIMA parameters is the memory structure of a univariate time series. One can also examine the effect of interventions (like training) on univariate time series data. In effect, this type of examination is a bivariate relationship which may become clear as transfer functions are discussed. It is often useful to examine bivariate (and multivariate) time series variables through examining their relationship. To understand how relationships are examined between time series data, it is necessary to examine some terminology. Typical cases of transfer function models are the consumption of alcoholic beverages in a given nation, aggregate consumption and advertising, and forecasting sales using advertising expenditures (Vandaele, 1983). Intervention models are special cases of transfer function models that most commonly assess the impact of a discrete intervention or event on a random or stochastic process. It is important to note that a transfer function model and the standard regression model are conceptually related. In fact, both models have a dependent variable and one or more explanatory or predictor variables (Vandaele, 1983). However, there are several reasons why transfer function analysis is considered to be more appropriate for data containing autocorrelation. First, the multiple regression model violates the assumption of independence of errors, thus increasing the Type I error rate. Second, with multiple regression, patterns may obscure or spuriously augment the effect of an intervention unless it is accounted for in the model (Tabachnick & Fidell, 2001). In the econometric literature, there is the general distributed lag model that says that a current level of Yt is a function of a number of past values of Xt:
etttt XXY ++++= −− ...22110 ννν where ν are the impulse response weights (regression coefficients) and the subscripts of Xi indicate the point in time when the data point is collected. A subscript (t-1) indicates a lag of one time period. Another way of representing this distributed lag equation is as follows:
,)( ttt eXY +Β=ν where
...)( 2210 +Β+Β+=Β νννν
and Β is the backward shift operator, defined, e.g., as
1−=Β tt XX .

Understanding Team Performance and Team Cohesion 129
APPENDIX G Continued
In transfer function investigation, it is assumed that )(Βν is approximated by a
ratio of two finite rational polynomials in Β:
)()()(
ΒΒ
=Βδων ,
where l
lΒ−−Β−=Β ωωωω ...)( 10
rrΒ−−Β−=Β δδδδ ...)( 10
Ultimately, therefore, the final equation representing the transfer function of X on Y and the memory structure within X and Y is as follows:
,)()(
)()(
tbtt axyΒΒ
+ΒΒ
= − φθ
δω
with
td
t Yy'
∇= ,t
dt Xx ∇=
where d and d’ represent the order of consecutive differencing that may be necessary to make the series stationary in the mean; and xt-b is the differenced value for the X series at time t with a lag b.
The goal in transfer function analysis is to estimate the impulse response weights expressed as the ratio of the two polynomials at lags b. These estimated coefficients are similar to regression coefficients and represent the relationship between an antecedent and consequent variable. If the set of ω and δ coefficients are statistically significant, then there is some relationship between X and Y at lag b. Therefore, it is sufficient to
examine the values in the ratio,)()(
ΒΒ
φθ , to assess the nature of the relationship between X
and Y time series variables. Conceptually, this relationship can be broken down into two components, delta (δ) and omega (ω). Omega reflects a fairly straightforward relationship between X and Y. That is, the omega coefficient describes the impact of the variable X on the variable Y, at lag b. Delta is also a reflection of this dynamic relationship between X and Y. However, it is more indirect, describing the impact of current values of Y on later values of Y.
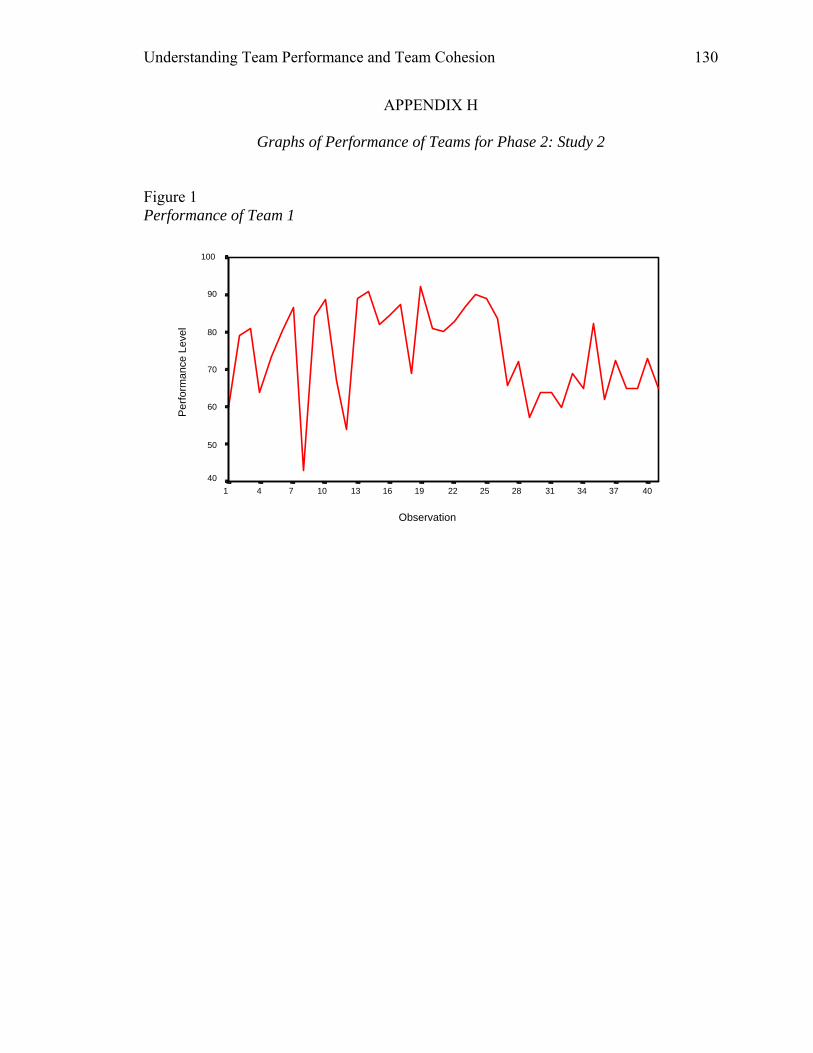
Understanding Team Performance and Team Cohesion 130
APPENDIX H
Graphs of Performance of Teams for Phase 2: Study 2
Figure 1 Performance of Team 1
Observation
4037343128252219161310741
Per
form
ance
Lev
el
100
90
80
70
60
50
40

Understanding Team Performance and Team Cohesion 131
APPENDIX H Continued
Figure 2 Performance of Team 2
Observation
4037343128252219161310741
Per
form
ance
Lev
el
110
100
90
80
70
60
50
40
Figure 3 Performance of Team 3
Observation
4037343128252219161310741
Per
form
ance
Lev
el
110
100
90
80
70
60
50
40
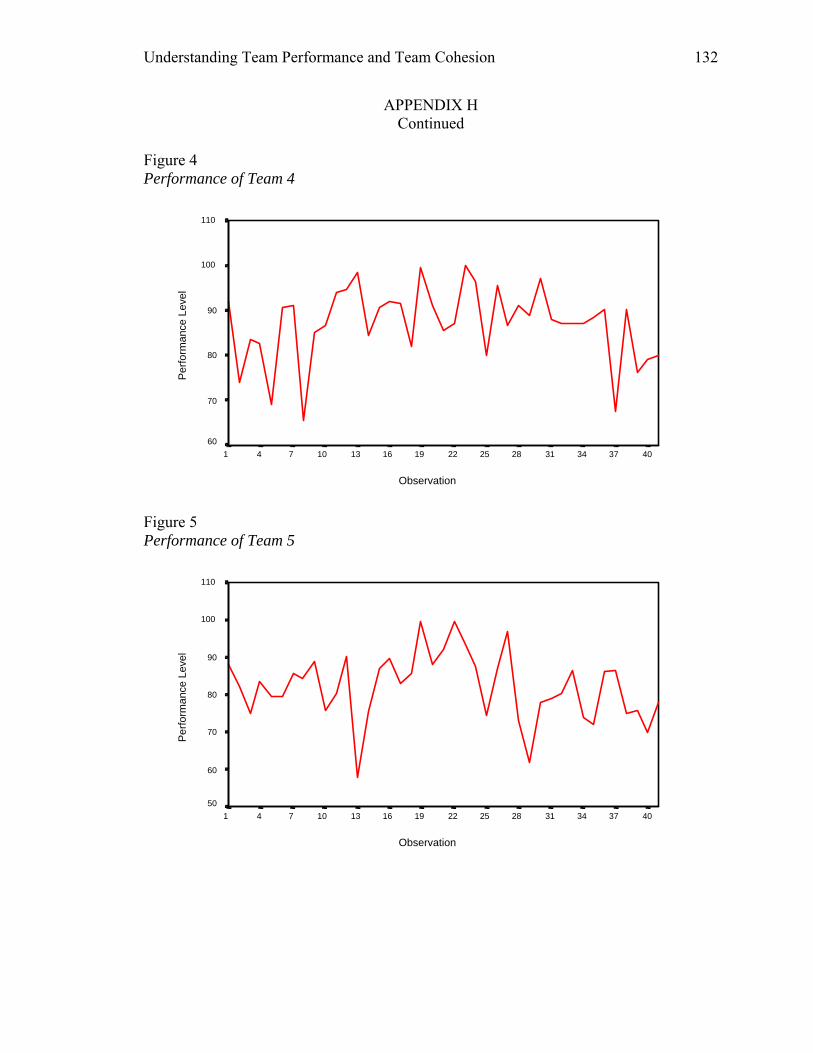
Understanding Team Performance and Team Cohesion 132
APPENDIX H Continued
Figure 4 Performance of Team 4
Observation
4037343128252219161310741
Per
form
ance
Lev
el
110
100
90
80
70
60
Figure 5 Performance of Team 5
Observation
4037343128252219161310741
Per
form
ance
Lev
el
110
100
90
80
70
60
50

Understanding Team Performance and Team Cohesion 133
APPENDIX H Continued
Figure 6 Performance of Team 6
Observation
4037343128252219161310741
Per
form
ance
Lev
el
110
100
90
80
70
60
Figure 7 Performance of Team 8
Observation
4037343128252219161310741
Per
form
ance
Lev
el
110
100
90
80
70
60
50
40

Understanding Team Performance and Team Cohesion 134
APPENDIX H Continued
Figure 8 Performance of Team 10
Observation
4037343128252219161310741
Per
form
ance
Lev
el
110
100
90
80
70
60
50
40

Understanding Team Performance and Team Cohesion 135
APPENDIX I
Team Assignment
True/False Questions (Correct the false) For the following true/false questions: mark your choices to the left of the question in the spaces provided. For those answers that you believe are false, write the correct answer below the question. 1. ___ An industrial psychologist decides he wants to use two predictors to select grocery store
clerks. Ideally, these predictors will have a low intercorrelation.
2. ___ Dr. Banner determines the percentage of the employees in her organization that are currently successful. This percentage is known as the criterion percentage. 3. ___ The research of Schmidt and Hunter demonstrates that validity is situationally specific. 4. ___ The human resources director at the Perpsi Cola Company just hired 10 individuals to be production managers. There had been 100 applicants. Based on this information, you know that the base rate was .10. 5. ___ The value of a valid predictor is greatest when the base rate is .50. (True)
Short Answers - Please use the space provided for your answer. Please be concise.
1. Explain carefully the premise of validity generalization. To what extent has research supported the existence of validity generalization? 2. Clearly explain how the validity of a predictor, the selection ratio, and the base rate relate to how useful a predictor can be to an organization making selection decisions
3. (a) Draw a venn diagram that illustrates two uncorrelated predictors of a criterion. (b) Draw a venn diagram that illustrates two predictors of a criterion that are correlated.
Long Essay – Using the space provided, please answer the following question to the best of your ability. (a) Define true and false positive selection decisions. (b) Define true and false negative selection decisions. (c) Explain how setting a predictor cutoff score higher or lower influences the number of selection errors that are made. Extra Credit: Please attach your own paper in answering the following question: (a) ADA states that employers must provide disabled persons with reasonable accommodations. (b)What is meant by reasonable accommodation? (c) Name 2 forms of reasonable accommodation that are not listed in the textbook.

Understanding Team Performance and Team Cohesion 136
APPENDIX J
Difficulty Questionnaire
Please indicate the degree to which you agree with the statements by circling one of the five points.
1. This assignment would require more than 45 minutes to complete as a graded test.
1-----------------------|-----------------------3-----------------------|-----------------------5 Strongly Agree Moderately Agree Strongly Agree
2. This assignment is appropriate as a regular test of future students knowledge of Industrial-Organizational Psychology. 1-----------------------|-----------------------3-----------------------|-----------------------5 Strongly Agree Moderately Agree Strongly Agree
3. Assume that this assignment would be used as a regular way of assigning grades to teams of students in this course. Indicate the degree to which you agree or disagree that this assignment would be an acceptable graded team assignment to be completed during the first 45 minutes of a regular class.
1-----------------------|-----------------------3-----------------------|-----------------------5 Strongly Agree Moderately Agree Strongly Agree
4. Working on this assignment for 45 minutes in a team of fellow students would be
frustrating to you.
1-----------------------|-----------------------3-----------------------|-----------------------5 Strongly Agree Moderately Agree Strongly Agree
5. The questions on this assignment are appropriate to the material presented in this
chapter.
1-----------------------|-----------------------3-----------------------|-----------------------5 Strongly Agree Moderately Agree Strongly Agree
6. It would be fair of the instructor to expect completion of the questions on this
assignment by a team in 45 minutes.

Understanding Team Performance and Team Cohesion 137
APPENDIX J Continued
1-----------------------|-----------------------3-----------------------|-----------------------5 Strongly Agree Moderately Agree Strongly Agree
7. The questions on the assignment are clear for a team to answer.
1-----------------------|-----------------------3-----------------------|-----------------------5 Strongly Agree Moderately Agree Strongly Agree
8. I would prefer completing this assignment by myself than with other members in class.
1-----------------------|-----------------------3-----------------------|-----------------------5 Strongly Agree Moderately Agree Strongly Agree
9. Overall, on a scale form 1 (very easy) to 10 (extremely difficult), please circle the
difficulty level of this assignment as a team assignment.
1---------2---------3---------4---------5---------6---------7---------8---------9---------10
Very Easy Moderately Difficult Extremely Difficult

Understanding Team Performance and Team Cohesion 138
APPENDIX K
NASA-TLX
Rating Scale Definitions
Title Descriptions
MENTAL DEMAND
How much mental and perceptual activity was required (e.g., thinking, deciding, calculating, remembering, looking, searching, etc.)? Was the task easy or demanding, simple or complex, exacting or forgiving?
PHYSICAL DEMAND
How much physical activity was required (e.g., pushing, pulling, turning, controlling, activating, etc.)? Was the task easy or demanding, slow or brisk, slack or strenuous, restful or laborious?
TEMPORAL DEMAND
How much time pressure did you feel due to the rate or pace at which the tasks or task elements occurred? Was the pace slow and leisurely or rapid and frantic?
PERFORMANCE
How successful do you think you were in accomplishing the goals of the task set by the experimenter (or yourself)? How satisfied were you with your performance in accomplishing these goals?
EFFORT
How hard did you have to work (mentally and physically) to accomplish your level of performance?
FRUSTRATION LEVEL
How insecure, discouraged, irritated, stressed and annoyed versus secure, gratified, content, relaxed and complacent did you feel during the task?

Understanding Team Performance and Team Cohesion 139
APPENDIX K Continued
Place a mark at the desired point on each scale:
MENTAL DEMAND
Low High PHYSICAL DEMAND
Low High TEMPORAL DEMAND
Low High PERFORMANCE
Good Poor EFFORT
Low High FRUSTRATION
Low High