Embed Size (px)
Citation preview

Retrospective Theses and Dissertations Iowa State University Capstones, Theses and Dissertations
1-1-2003
The effects of slope and flexural deflection on the concrete-dowel The effects of slope and flexural deflection on the concrete-dowel
bar system bar system
Andrew Lewis Lundy Iowa State University
Follow this and additional works at: https://lib.dr.iastate.edu/rtd
Recommended Citation Recommended Citation Lundy, Andrew Lewis, "The effects of slope and flexural deflection on the concrete-dowel bar system" (2003). Retrospective Theses and Dissertations. 19490. https://lib.dr.iastate.edu/rtd/19490
This Thesis is brought to you for free and open access by the Iowa State University Capstones, Theses and Dissertations at Iowa State University Digital Repository. It has been accepted for inclusion in Retrospective Theses and Dissertations by an authorized administrator of Iowa State University Digital Repository. For more information, please contact [email protected].

The effects of slope and flexural deflection on the concrete-dowel bar system
by
Andrew Lewis Lundy
A thesis submitted to the graduate faculty
in partial fulfillment of the requirements for the degree of
MASTER OF SCIENCE
Major: Civil Engineering (Structural Engineering)
Program of Study Committee: Max L. Porter, Major Professor
James K. Cable Lester w. Schmerr Jr.
Iowa State University
Ames, Iowa
2003
Copyright ©Andrew Lewis Lundy, 2003. All rights reserved.

11
Graduate College
Iowa State University.
This is to certify that the Master's thesis of
Andrew Lewis Lundy
ha.s met the thesis requirements of Iowa State University
Signatures have been redacted for privac Y

TABLE OF CONTENTS
LIST OF FIGURES vii
LIST OF TABLES viii
ABSTRACT xi
1.0 INTRODUCTION 1
1.1 Background 1
1.2 Objective 3
1.3 Scope 3
2.0 LITERATURE REVIEW 5
2.1 Introduction 5
2.2 Analytical Theory of Dowel Bars 5
2.2.1 Analytical Model 5
2.2.1.1 Timoshenko's Analytical Model 5
2.2.1.2 Friberg's Analytical Model 7
2.3 Pavement Joint Deflection 8
2.3.1 Relative Deflection Across a Pavement Joint 8
2.3.2 Form Factor and Shear Deflection 10
2.4 Theoretical Bearing Stress 11
2.5 Modulus of Foundation versus Modulus of Dowel Support 12
3.0 EXPERIMENTAL INVESTIGATION 14
3.1 Introduction 14
3.2 Test Methods 14

1V
3.2.1 Iospescu Test Method 14
3.2.2 AASHTO Sheaz Test Method 17
3.2.3 Elemental Fatigue Test Method 19
3.2.3.1 Test Procedure 19
3.2.3.2 Loading 21
3.2.4 Elemental Direct Shear Test Method 22
3.3 Aged Specimens 24
3.4 Iowa Department of Transportation Investigation 24
3.5 American Highway Technology Investigation 27
4.0 ANALYSIS OF EXPERIMENTAL RESULTS 29
4.1 Introduction 29
4.2 Iowa Department of Transportation Results 29
4.2.1 Iosipescu Test Method & AASHTO Shear Test Method 29
4.2.2 Elemental Fatigue Test Method 37
4.3 American Highway Technology Results 42
4.3.1 General 42
4.3.2 Elemental Direct Shear Test Method 42
5.0 THEORETICAL INVESTIGATION 45
5.1 Introduction 45
5.2 Dowel Bar Slope Theory 46
5.2.1 Purpose 46
5.2.2 Dowel Bar Slope Derivation 46
5.2.3 Slope Deflection and Ko 49

V
5.3 Flexural Deflection Theory 51
5.3.1 Purpose 51
5.3.2 Flexural Deflection Derivation 52
5.3.3 Flexural Deflection and K~, 54
6.0 ANALYSIS OF THEORETICAL RESULTS 55
6.1 Introduction 55
6.2 Slope Deflection Results 55
6.2.1 Iowa Department of Transportation Results 5 5
6.2.1.1 Iosipescu Test Method & AASHTO Shear Test Method 55
6.2.1.2 Elemental Fatigue Test Method 62
6.2.2 American Highway Technology Results 64
6.3 Flexural Deflection Results 66
6.3.1 Iowa Department of Transportation Results 66
6.3.1.1 Iosipescu Test Method & AASHTO Shear Test Method 67
6.3.1.2 Elemental Fatigue Test Method 68
6.3.2 American Highway Technology Results 69
7.0 SU Y, CONCLUSIONS AND RECOMMENDATIONS 71
7. i Summary 7 i
7.1.1 Slope Deflection Summary 71
7.1.2 Flexural Deflection Summary 72
7.2 Conclusions 73
7.3 Recommendations 74
REFERENCES 76

V1
ACKI~TOWLEDGEMENTS 78

Vll
LIST OF FIGURES
Figure 2.1 Pressure distribution from deflected dowel bar 6
Figure 2.2 Relative deflection between adjacent pavement slabs .9
Figure 3.1 Iosipescu test designed by Adams and Walrath 15
Figure 3.2 ISU Iosipescu shear test specimen 15
Figure 3.3 ISU Iosipescu testing frame .,16
Figure 3.4 Differential deflection at a contraction joint .17
Figure 3.5 Modified AASHTO T253 test specimen ..18
Figure 3.6 Uniform load applied to AASHTO shear specimen .19
Figure 3.7 Testing frame for elemental fatigue test ..20
Figure 3.8 Loading of elemental fatigue specimen 21
Figure 3.9 Location of load on direct shear specimen 23
Figure 3.10 Alternately shaped dowel bars 26
Figure 4.1 k versus yo fora 1.5-in. diameter round epoxy-coated steel dowel bar 32
Figure 4.2 Ko versus yo fora 1.5-in. diameter round epoxy-coated steel dowel bar ..33
Figure 5.1 Semi-infinite beam on an elastic foundation .47
Figure 5.2 Forces acting on a dowel bar .48
Figure 5.3 Twice the deflection at the face of the joint, 2*yo, and slope deflection Versus Ko 50
Figure 5.4 Ko versus ya for the 1.5-in. diameter round epo~ry-coated steel dowel bar 51
Figure 5.5 Idealized beam of dowel bar ....52
Figure 5.6 Shear and moment diagrams for idealized beam of dowel bar .53

viii
LIST OF TABLES
Table 3.1 Dowel material and sizes used in IDOT investigation 25
Table 3.2 Dowel material and sizes used in Elemental Fatigue testing 27
Table 3.3 Test matrix of AHT test specimens 28
Table 4.1 Iosipescu Test —Unaged -Average relative deflection, shear deflection, and deflection at face of joint 30
Table 4.2 Modified AASHTO Test —Unaged -Average relative deflection, shear deflection, and deflection at face of joint 3 0
Table 4.3 Iosipescu Test —Aged -Average relative deflection, shear deflection, and deflection at face of joint 31
Table 4.4 Unaged -Average modulus of foundation and modulus of dowel support values ..34
Table 4.5 Iosipescu Test -Aged -~ Average modulus of foundation and modulus of dowel support values .34
Table 4.6 Unaged -Average bearing stress values 3 S
Table 4.7 Iosipescu Test -Aged -Average bearing stress values ..36
Table 4.8 Fatigue Testing —Unaged, 0 Cycles -Average relative deflection, shear deflection, and deflection at face of joint, 37
Table 4.9 Fatigue Testing —Aged, 0 Cycles -Average relative deflection, shear deflection, and deflection at face of joint 38
Table 4.10 Fatigue Testing —Unaged, 1 Million Cycles -Average relative deflection, shear deflection, and deflection at face of joint ...3 g
Table 4.11 Fatigue Testing —Aged, 1 Million Cycles -Average relative deflection, shear deflection, and deflection at face of joint 3g
Table 4.12 Unaged, 0 Cycles -Average modulus of foundation and modulus of dowel support values .. 3 9
Table 4.13 Aged, 0 Cycles -Average modulus of foundation and modulus of dowel support values ..3 9

1X
Table 4.14 Unaged, l Million Cycles -Average modulus of foundation and modulus of dowel support values 39
Table 4.1 S Aged, l Million Cycles -Average modulus of foundation and modulus of dowel support values ...39
Table 4.16 Unaged, 0 Cycles -Average bearing stress values ..40
Table 4.17 Aged, 0 Cycles -Average bearing stress values ..40
Table 4.18 Unaged, l Million Cycles -Average bearing stress values 40
Table 4.19 Aged, l Million Cycles -Average bearing stress values 41
Table 4.20 Direct Shear Method -Average relative, shear, and face of the joint deflections ..43
Table 4.21 Direct Shear Method -Average modulus of foundation and modulus of dowel support .43
Table 4.22 Direct Shear Method -Average bearing stress values 43
Table 6.1 Unaged -Average modulus of dowel support, slope deflection adjusted modulus of dowel support, and associated error neglecting slope deflection .....56
Table 6.2 Iosipescu Test -Aged -Average modulus of dowel support, slope deflection adjusted modulus of dowel support, and associated -error neglecting slope deflection .....56
Table 6.3 Dowel material, size, stiffness, and Ko slope deflection error 5 7
Table 6.4 Unaged -Average deflection at the face of the joint, slope deflection adjusted deflection at the face of the joint, and associated error neglecting slope deflection 5 g
Table 6.5 Iosipescu Test -Aged -Average deflection at the face of the joint, slope deflection adjusted deflection at the face of the joint, and associated error neglecting slope deflection 59
Table 6.6 Dowel bar material, size, stiffness, and y o slope deflection error ......60
Table 6.7 Unaged -Average Friberg bearing stress, slope deflection adjusted bearing stress, and associated error neglecting slope deflection ....61

X
Table 6.8 Iosipescu Test -Aged Average Friberg bearing stress, slope deflection adjusted bearing stress, and associated error neglecting slope deflection 62
Table 6.9 Aged -Average modulus of dowel support at zero cycles, average modulus of dowel support at one million cycles, percentage difference ..63
Table 6.10 Aged -Average slope adjusted modulus of dowel support at zero cycles, average slope adjusted modulus of dowel support at one million cycles, percentage difference 63
Table 6.11 —Direct Shear Method -Average modulus of dowel support, slope deflection adjusted modulus of dowel support, and associated error neglecting slope deflection 64
Table 6.12 —Direct Shear Method -Average Friberg bearing stress, slope deflection adjusted bearing stress, and associated error neglecting slope deflection .65
Table 6.13 Unaged -Average modulus of dowel support, flexural deflection adjusted modulus of dowel support, and associated error neglecting flexural deflection .....68
Table 6.14 Iosipescu Test -Aged -Average modulus of dowel support, flexural deflection adjusted modulus of dowel support, and associated error neglecting flexural deflection 68
Table 6.15 —Direct Shear Method -Average slope deflection adjusted modulus of dowel support, slope and flexural deflection adjusted modulus of dowel support, and associated error neglecting flexural deflection ..70
Table 7.1 —Total relative deflection, deflection at the face of the joint, shear deflection, slope deflection, .and flexural deflection 74

X1
ABSTRACT
This paper provides a review of recently completed dowel bar research at Iowa State
University. This paper also looks at the assumptions used in this research and checks these
against the theoretical analysis of these assumptions.
The assumptions that are reviewed are the neglecting of slope deflection and flexural
deflection. These terms are theoretically analyzed, evaluated, and then re~riewed to check the
effects. The effect of each type of deflection was compared against the modulus of dowel
support, concrete bearing stress, and influence on conclusions drawn in previous research.
This analysis was done to all types of dowel bars for the two most recently completed
research projects.
Furthermore, the differences between Timo shenko's dowel bar theory and Friberg's
dowel bar theory are analyzed. These theory differences are also outlined for each type of
dowel bar.

1
1.0 INTRODUCTION
1.1 Background
According to the Federal Highway Administration (FHWA) there are approximately
160,000 centerline miles of National Highway System in the United States (1). Of these
160,000 centerline miles, there are 3,180 centerline miles of National Highway System in
Iowa (1). 2,860 centerline miles of the 3,180 centerline miles reported were described as a
High-Type Rigid Pavement (2). According to the FHWA aHigh-Type Rigid pavement is
defined as: "a Portland cement concrete roadway with or without a bituminous wearing
surface of less than 1 in."(2).
In the 2002 Condition and Performance Report to Congress the FHWA reports that
86.6% of the Total System Pavement and 93.5% of the National Highway System Pavement
are acceptable (3). Thus, 13.4% and 6.5% of the respective pavements are in unacceptable
condition. The unacceptable amount of highway in Iowa is approximately equal to 206
centerline miles. Unfortunately, the FHWA does not differentiate the condition of each type
of pavements. Therefore, assuming the same percentage of unacceptable roads for each type
of pavement would mean that approximately 185 centerline miles of rigid concrete pavement
would be in unacceptable condition.
According to the current Iowa Department of Transportation Standards, there is one
doweled contraction joint required every 20 feet for concrete pavements thicker than 8 in.
(4). One doweled joint every 20 feet is equivalent to 264 doweled joints per mile. The
FHWA's 185 centerline miles of unacceptable pavement should contain over 48,000 doweled
joints. V~Thile failure of the dowel bars is not the only cause for the unacceptable roads;
dowel bars certainly play a large role in the overall condition of the roads.

2
Load transfer within a series of concrete slabs takes place across the joints. For a typical
concrete paved road, these joints are approximately 1 /8-in. gaps between two adjacent slabs.
Dowel bars are located at these joints and are used to transfer load from one slab to the
adjacent slab. As long a.s the dowel bar is completely surrounded by concrete no problems
will occur. However, when the hole starts to oblong, a void space is created and difficulties
can arise. This void space is formed due to a stress concentration where the dowel contacts
the concrete.. Over time, the repeated process of traffic traveling over the joint crushes the
concrete surrounding the dowel bar and causes a void in the concrete. This, void inhibits the
dowel bar's ability to effectively transfer load across the joint. Furthermore, this void gives
water and other particles a place to collect that will eventually corrode and potentially bind or
lock the joint so that no thermal expansion is allowed. Once there is no longer load
transferred across the joint, the load is transferred to the subgrade and faulting or pumping
can occur. Faulting is defined as the difference between adjacent slabs, which is caused by
differential settlement. Faulting at the joint creates a roughness, wing vehicle travel
uncomfortable, and requires that the slab be repaired or replaced. Pumping is the expulsion
of subgrade material through joints and along the edges of the pavement. Pumping
accelerates the deterioration of the joint since subgrade support for the slab is diminished.
As was mentioned in the previous paragraph, a void around a dowel bar. is formed by
stress concentrations crushing the concrete directly in contact with the dowel. when a shear
load is applied to the concrete slab, the force is supported only by the top or bottom of the
dowel bar, not the sides. Since the stress concentration region lies on the top or bottom of the
dowel bar, the smaller the dowel bar the higher the stress concentration for the same load.
The sides of the dowel bars do not aid in the distribution of the shear load from the concrete.
3
Therefore, the top and bottom of the dowel bar is where the stress concentration is located
and is directly related to the width, shape and/or material of the dowel bar.
1.2 Objective
Previous work done at Iowa State University (ISU) by Guinn outlined areas where gaps
existed on previous research done around the nation (5). Guinn outlined twenty-two areas
where gaps were present in dowel bar research. Using the information from Guinn the
following objectives were set for this paper:
• to discuss the types of analysis used in previous research at ISU,
• to discuss the assumptions made in previous dowel bar research completed at
ISU,
• to evaluate the appropriateness of the assumptions used in previous research, and
• to recommend any changes that should be implemented with future research
programs.
1.3 Scope
The scope of this paper was a.s follows:
• summarize the recently completed research done at ISU,
• highlight the differences between the Timoshenko and Friberg theories,
• determination of the effects of slope deflection on the modulus of dowel support
and bearing stress,
• determination of the effects of flexural deflection on the modulus of dowel
support and bearing stress,
• determination of the effects of slope deflection and flexural deflection on previous
research, and

4
• determination of when to consider the effects of slope deflection and flexural
deflection.

5
2.0 Literature Review
2.1 Introduction
ISU has been conducting dowel bar research for over ten years. Throughout these years,
two primary theoretical models have been utilized. One common model is based on work
done by Timoshenko and Lessels. Timoshenko's principles were based on a beam resting on
an elastic foundation. Later, Friberg expanded on Timoshenko's work and came up with a
second model that could be used for dowel bar research.
2.2 Analytical Theory of Dowel Bars
2.2.1 Analytical Model
2.2.1.1 Timoshenko 's Analytical Model
Timoshenko and Lessels worked on the first model of a beam on an elastic foundation
that could be applied to a dowel bar system (6). According to Timoshenko, the deflection of
a beam on an elastic foundation is found using Equation 2.1:
d4EI ~4 = -ky (2.1)
where k is a constant, usually called the modulus of foundation (psi), E is the modulus of
elasticity of the beam (psi), I is the moment of inertia of the beam (in.4), and y is the
deflection (in.). The modulus of foundation denotes the reaction per unit length when the
deflection is set equal to one. Bradbury theorized that a dowel bar encased in concrete will
behave as a beam on an elastic foundation (7). Using Bradbury's assumption, a dowel bar
encased in concrete will deflect in the same manner as a beam resting on an elastic
foundation. Figure 2.1 illustrates the deflection of a dowel bar encased in concrete, based on
the deflection of a beam on an elastic foundation.

6
P
Edge of pavement Slab joint
Dowel
~~
L
Figure 2.1 Pressure distribution from deflected dowel bar
The general solution to Timoshenko's differential equation is found in Equations 2.2
and 2.3 (8).
where,
_~
yo = eR"(A cos ~3x + B sin (3x) + e"R"(C cos ~3x + D sin ~3x) (2.2)
k 4EI
—relative stiffness of the beam on the elastic foundation (in."1) (2.3)
k =modulus of foundation (psi)
By applying the appropriate boundary conditions for any given problem the constants A, B,
C, and D can be determined. Once these constants are determined a deflection equation
along the entire. length of a beam can be developed. For asemi-infinite beam with a moment,
Mo, and a point load, P, Equation 2.2 equivalent to Equation 2.4.
e"R"
y = 2~33EI [P cos (3x — (3Iv~(cos (3x -sin fix)]
Integrating Equation 2.4 will yield the slope of the beam, as shown in Equation 2. S .
(2.4)

7
dy e-~X dx 2 32 EI
I~2~3M° — P)cos fix — P sin (3x] (2.5)
2.2.1.2 Friberg's Analytical Model
Friberg applied Timoshenko's elastic foundation theory to a beam ofsemi-infinite
length (9). By assuming that the inflection point exists at the center of the joint, Equations
2.4 and 2.5 can be solved. This solution will be shown in detail in Chapter S; using the
aforementioned assumption, Equation 2.4 becomes Equation 2.6.
where,
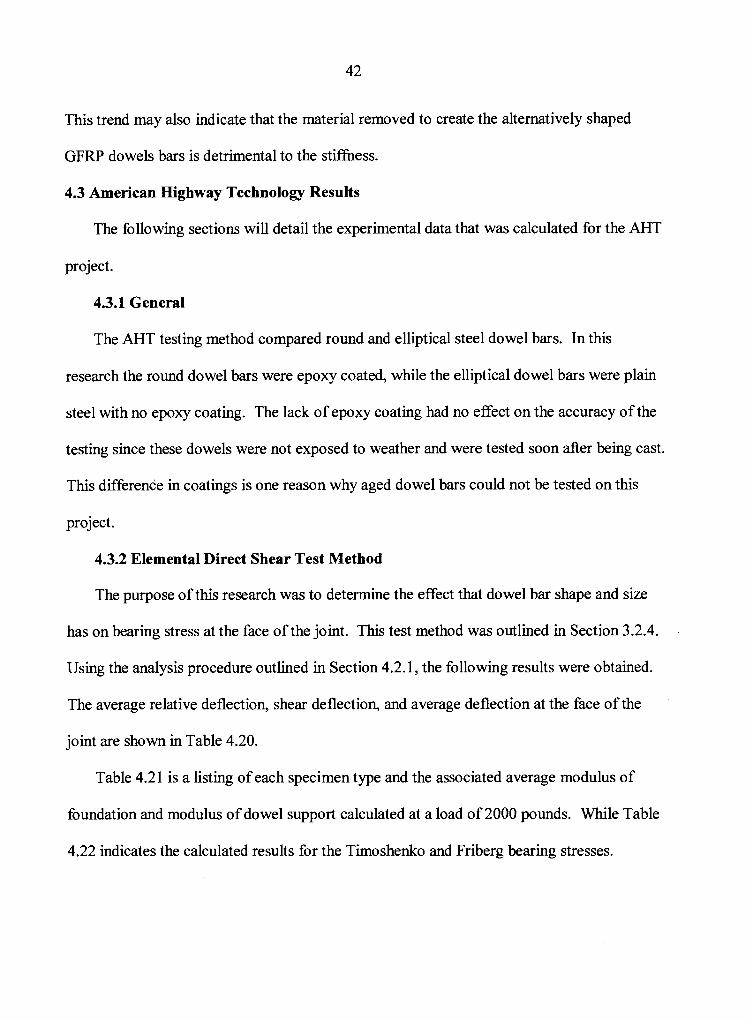
P y° 4R 3EI (2 +biz)
_ ~Kab ~i — 4 4E1 =relative stiffness of the dowel bar encased in concrete
Ko =modulus of dowel support (pci) b =dowel bar width (in.) E =modulus of elasticity of the dowel baz (psi) I =moment of inertia of the dowel baz (in.4) P =load transferred through the dowel baz (pounds) z =joint width (in.)
-1
(2.6)
(2.7)
Friberg used the modulus of dowel support, Ko, in his equation. The modulus of
dowel support is the reaction per unit area causing a deflection equal to one. Friberg used the
expression Kob to replace the modulus of foundation, k, from Timoshenko's model.
Friberg's equation was developed using asemi-infinite dowel length. Dowel bars have a
finite length so this equation would not apply to dowel bars used in practice today. However,
Porter et al. has shown that Friberg's equation can be used with little to no error if the ~iL
value is greater than two (10, 11). where the length, L, is taken to be the length of the -dowel
bar embedded in concrete, or approximately one-half the -dowel bar length.

8
2.3 Pavement Joint Deflection
2.3.1 Relative Deflection Across a Pavement Joint
The relative deflection across a pavement joint, ~, consists of four separate components.
These components, as shown in Figure 2.2, consist of the deflection of the dowel at each
joint face, the deflection .due to the slope of the dowel bar, shear deflection, and flexural
deflection. When considering all possible components for relative deflection the following
expression in Equation 2.8 is found.
where,
3
o=2yo +Z dX° +s+ 12EI
yo =deflection at the face of the joint(in.) ~,Pz
S = AG ,shear deflection (in.)
P =load transferred by dowel bar (pounds) ~, =form factor A =cros-sectional area of the dowel bar (in.2) G =shear modulus (psi)
(2.$)
(2.9)
In this research, a joint width of 1 /8 in. was used for the specimens. Using such a
small joint width allows the deflection due to the slope of the dowel bar to be approximately
equal to zero, which is the case in the author's research since the width and the slope of the
joint are small. This small joint width also means that the flexural deflection is
approximately equal to zero since the joint width term is cubed. After removing both the
slope and flexural deflections from Equation 2.8, Equation 2.10 remains.
0 2yo +S 2 ( .10)

9
Solving Equation 2.10 for yo yields Equation 2.11.
yo — D—~2
e
Centerline of undeformed dowel
yo
z dyo2 dx
P z3 -~- S 12EI
z dyo2 dx
2
Centerline of deformed dowel
z 2
(2.11)
Figure 2.2 Relative deflection between adjacent pavement slabs (12)
As was stated previously, the deflection due to the slope of the dowel bar has been
neglected in previous research at ISU because of the small joint width used with the
specimens. Numerically, the deflection due to the slope of the dowel bar can be calculated to

10
be insignificant to the results. However, consideration needs to be given as to when the
deflection. due to the slope of the dowel bar needs to be addressed. Theoretical investigation
on this topic will be presented in a later chapter.
2.3.2 Form Factor and Shear Deflection
As was shown in Equation 2.9, one variable used in determining shear deflection is the
form factor, ~,. The form factor can be defined as the ratio of the strain energy caused by the
actual shear-stress distribution to the strain energy caused by a constant shear-stress
distribution. This only applies to loads that cause a fiber stress inside the elastic limit.
According to Serra-Conrads (13), the form factor can be determined by using the common
shear stress equation shown in Equation 2.12.
i= PA y' It(y)
where,
i =horizontal sheaz stress in the dowel bar (psi)
A' =cross-sectional area at location of shear stress to edge of member
y' =distance from neutral axis to the centroid of the area A' (in.)
t(y) =width of the dowel bar (in.)
(2.12)
Inserting the shear stress of the section into the equation for the variation in strain
energy returns Equation 2.13.
d(Di~ _ ~J~G dAdL
where,
(2.13)
DU =Variation in strain energy (lb-in./in.3)
Equation 2.13 can be integrated to fmd the strain energy. The general strain energy
equation is shown in Equation 2.14.

11
where, U =Strain energy (lb-in./in.3)
2
U ~L 2AGdL
Equation 2.15 relates Equation 2.14 to Equation 2.9. Equation 2.15 is based on
Castigliano's Theorem (14).
(2.14)
(2.15)
According to Young (14), a solid circular cross-section has a form factor of 10/9 while a
solid rectangular cross-section has a form factor of 6/5. The dowel bars used in this research
consist of round baxs, elliptical bars, and "shaved" bars. All the cross-sections of these bars
will fall between a rectangular section and a circular section. In this research, the amount of
total deflection contributed by shear deflection was very small due to the small joint width of
1 /8". While changing the form factor has some influence on the shear deflection value, the
change has little to no effect on the _deflection at the face of the joint, the modulus of dowel
support or the concrete bearing stress values. Therefore, to simplify the calculations, a form
factor of 10/9 was used for all dowel bars in this research.
2.4 Theoretical Bearing Stress
The bearing stress on the concrete at the face of the joint is critical for proper function
of the dowel bar in the concrete. If the bearing stress on the concrete becomes too large the
concrete will begin to break away, or crush, where in contact with the dowel bar. Repetitive
high stress loadings of the dowel bar-concrete interface will create a void. This void creates
an additional amount of deflection in the system before the dowel bar will begin to take on
the load applied. This additional deflection creates a loss in the efficiency of the dowel bar to

12
transfer load across the joint. This loss in efficiency must now be carried by the subgrade,
which puts additional stress on the subgrade and creates the possibility for differential
settlement of adjacent slabs.
If the dowel behaves as a beam on an elastic foundation, the bearing stress at the face
of the joint, ab, is .proportional to the deflection at the face of the, joint. This relationship for
Timoshenko's model is expressed using Equation 2.15.
6 bT — ~o
The bearing stress for Friberg's model is expressed in Equation 2.16.
abF — Ko}~o
The bearing stress on the concrete needs to be kept low to rriake certain that no crushing of
the concrete or oblonging of the dowel bar encasement occurs. An important note is that the
Timo shenko and Friberg bearing stresses are in different units. The Timo shenko bearing
stress is force per unit length, while the Friberg bearing stress is in terms of force per unit
area. The next section will discuss why this difference exists.
2.5 Modulus of Foundation versus Modulus of Dowel Support
The difference between Timoshenko's and Friberg's models is reflected in the ~ term
in the deflection equation, more specifically, Equations 2.3 and 2.7, which are repeated here
for convenience.
R=~ k 4EI
—relative stiffness of the beam on the elastic foundation (in."~) ~2,3~
_ V Kob~ 4 4EI —relative stiffness of the dowel bar encased in concrete (in.-I) (2.7)

13
As was discussed previously, Friberg's Kob term is the equivalent to Timoshenko's k term.
By definition the modulus of foundation differs from the modulus of dowel support solely by
units.
The first equation discussed to determine the deflection of a beam on an elastic
foundation, Equation 2.1, is based on the modulus of foundation. Later when Friberg
modified Timoshenko's equation, the b-term, bar width, was added for the sole purpose of
converting Timoshenko's modulus of foundation term from pounds per square inches into the
pounds per cubic inches seen in the modulus of dowel support. This conversion was done to
arrive at a convenient unit of stress when comparing the dowel bar bearing stress to concrete
strength.
The bearing stress on the concrete needs to be kept low to make certain that no
crushing of the concrete occurs. According to the American Concrete Institute's (ACI)
Committee 325, the allowable bearing stress on the concrete is equivalent to Equation 2.18
(15)-
where,
4—b , o'a = f 3
a8 =allowable bearing stress (psi) b =dowel bar width (in.) f ~ =compressive strength of concrete (psi)
(2.1 s)
This equation is applicable to dowel bars ranging in size from 0.75 in. to 2 in. and provides a
factor of safety of approximately three.

14
3.0 EXPERIMENTAL INVESTIGATION
3.1 Introduction
The experimental data used in this paper was taken from recently completed research
as well a.s past research conducted at ISU. All data utilized in this paper was part of research
done for the Iowa Department of Transportation (IDOT) TR-408 "Investigation of Glass
Fiber Composite Dowel Baas for Highway Pavement Slabs" project (12) and the American
Highway Technology (AHT) "Dowel Bar Optimization" project (16). Both of the projects
were conducted to analyze bearing stress on dowel bars of different materials and shapes.
3.2 Test Methods
Since the testing was conducted over an extended period of time, different testing
methods were developed and utilized. With the collection of data, problems with the current
test method were determined and new approaches to future testing were developed and
employed. V~►jhile the changing of test methods was done to decrease the error in the testing,
this change can also lead to confusion. This section will discuss the individual test methods
and the dowel bars tested with each method.
3.2.1 Iosipescu Test Method
According to Walrath and Adams (17), the Iosipescu test achieves a state of pure
shear loading at the centerline of the specimen because of the specimen's geometry. Figure
3.1 shows the original Iosipescu test developed by Walrath and Adams. Figure 3.2 shows the
Iosipescu shear test specimen. To use the Iosipescu shear test method, a test frame was used
that had been previously constructed for I SU research (11) and was based on smaller
Iosipescu test frames developed by Adams. The test frame for testing Iosipescu specimens

15
P
Loading fixture
~~~%if%%/%O%%O%j-;
i P
~~~ Test specimen
Figure 3.1 Iosipescu test designed by Adams and Walrath (12)
t
12"
11 - 15/l b" 11-15/16"
8 - 15/16" 8 - 15/16"
a
a
a
.4
a i
a 4 d
Q .
d
d
v 4
a a a
a a a a Q °a
4
a 4
i
12"
Approximate 1 /8" gap
Side View
Dowel centered in concrete
Q
a
Q
a
i a
a a Q.
a
.a a
a
4
Q
Q
Q 4 Q
Q
4
Top View
Figure 3.2 ISU Iosipescu shear test specimen (12)

16
is shown in Figure 3.3. The dowel-concrete system is held tight by the tension rods to
minimize bending and rotation. One end of the specimen is fixed and the other end is
Figure 33 ISU Iosipescu testing frame (12)

17
movable. This set-up allowed the load to be transferred as would be seen in the field
resulting in direct shear of the dowel. The gap shown in Figure 3.2 allows the load to be
transferred from one side of the specimen to the other without having aggregate interlock or
interface friction taking some of the load.
Centerline of Undeformed Shape Centerline of
Deformed Shape
T
Figure 3.4 Differential deflection at a contraction joint (12)
3.2.2 AASHTU Shear Test Method
The American Association of State Highway and Transportation Officials
(AASHTO) shear testing procedure applies loading to the dowel bars in a very similar
manner as the Iosipescu shear test method. The major differences are the specimen and
testing set up. The shear test method used for this research was based on the AASHTO
T253-76 (18) standard test method. There are two dowels encased in concrete, which
simulates two 12-in. high contraction joints. The test specimen is shown in Figure 3.5 . The
AASHTO test applies a uniform load as shown in Figure 3.6 to the middle concrete block.
The deflected shape of the AASHTO specimen is also shown in Figure 3.6. The dowel bar

18
encased within the concrete block deflects similarly to the specimen shown in Figure 3.4.
For tests conducted at ISU (12, 16), the AASHTO setup was modified slightly. In the
modified setup, the joints were shortened to simplify the analysis. The modified joint width
was changed to 1/8-in. contraction joints rather than the 3/8-in. contraction joints used by
AASHTO. The beam width was also changed from 12 in. to 10 in.
L3~i~7 ~t ~n
7 ~ 1 i ! R
i~
~
~ ~ ~
}[
f
!~
~h'~R~ ~C~t~''I~+C~. 2ti t~['tL~ "'~
~ ~e ~ f
Figure 3.5 Modified AASHTO T253 test specimen (12)
As was done in the Iosipescu specimens, the AASHTO specimens also require that
the load-deflection characteristics were known to be able to calculate the modulus of dowel
support or the modulus of foundation. Equation 2.9 is still used to calculate the differential
deflection as was discussed in Section 3.2.1 with the Iosipescu specimen.

19
3.2.3 Elemental Fatigue Test Method
3.2.3.1 Test Procedure
As outlined in Section 3.2.2, a modified AASHTO test was used for a portion of the
direct shear testing. This test was slightly modified and a special test frame was constructed
for use in the elemental fatigue testing. The only modification made to the previously
discussed AAHSTO method was a change in the loading. In the static shear test, a uniform
load was applied to the center block, as shown in Figure 3.6. A change from the uniform load.
Uniform load
-- --- -~.
,r --- -.+
t t t f Reaction
~~~
} ~ , Reaction
Deflected Shape
Figure 3.6 Uniform load applied to AASHTO shear specimen
to point loads was made in the fatigue test so clamps could be attached to the center block
and the actuator could press down on the specimen as well as apply an upward force. The
positioning of the two clamps near the ends of the center block was also done to decrease the
deflection in the center of the block and force the inflection point towards the center of the

20
joint. This reversal of load was used to subject the dowel bars to a stress reversal, as is
experienced when the wheel load passes over the joint. A test setup of this procedure is
shown in Figures 3.7 and 3.8. The elemental fatigue testing was only used in the IDOT
investigation.
~oa~ frame
1~! ~~il a l~ adin~ b e~m
B ray e
Joint
Test ~~ e1
.~ Stu ate r
~ ~ ~~ ~ Ali
~~ncrete test specimen
Supporting beams
J fide e~e~ation ~ie~
Figure 3.7 Testing frame for elemental fatigue test (12)
~i.~utrnent

21
3.2.3.2 Loading
The loading actuators shown in Figure 3.7 applied a load of 3 3 00 pounds to each
specimen. This loading is the equivalent of 1650 pounds on each dowel bar and is closely
related to what the critical dowel would experience on a 12-in. slab with the dowel bars
spaced at 12 in. center to center. A deflection versus load diagram was taken before any
fatiguing of the specimen had occurred. The specimen was then tested for 1 million cycles at
a rate of approximately 4 cycles per second. After the specimen had seen one million cycles,
a second deflection versus load diagram was developed. The two deflection versus load
diagrams were used to calculate the modulus of dowel support and modulus of foundation for
the dowel bar before and after fatiguing.
L~~d lined b ~ I~~rn
I~ ~I~T ~ nve~tred,$ ~
T~en~i~n radf
Darels
Figure 3.8 Loading of elemental fatigue specimen (12)

22
3.2.4 Elemental Direct Shear Test Method
The elemental specimens were constructed as a modified AASHTO T253 specimen (16)
with the same dimensions as the specimen for the AASHTO shear test method, as was shown
in Figure 3.5. A 1 /8-in. gap was used to simulate a field pavement as well as aid in the
reduction of flexure across the joint. As with the AASHTO shear test, the dowel bars were
placed at mid-height of the specimen.
The testing of the direct shear specimens was conducted on a 400-kip capacity
SATEC 400HVL universal-testing machine at the ISU structures laboratory. A modified
AASHTO T253-76 test was used for testing the elemental direct shear specimens. This
procedure requires that the end blocks of the specimens be clamped so that no rotation is
allowed. Before testing began, the specimens were preloaded. The preloading procedure
consisted of loading the direct shear specimens five times at a rate of 2000 pounds/min until
5,000 pounds was reached. This procedure was used to help settle -the specimens so that
more accurate results would be obtained. With the end blocks restrained from rotation, a
load of 2000 pounds/minute was applied to the middle section of the specimen while
deflection on each end was measured. Figure 3.9 shows how the load was applied to the
center section of the specimen. The deflections that were measured were the relative
deflections across the joint, or rather the deflections from the stationary end blocks to the
deflecting center block. The deflections were measured by using Direct Current
Displacement Transducers (DCDT's), see Figure 3.8. Measurements of deflection and
corresponding load were taken every two seconds. The tests were carried out on all
specimens until a load of 10,000 pounds was reached. This data was then used to create a

23
load vs. deflection diagram. This procedure has been tested and validated as an acceptable
approach by Rohner (19).
P P
1 2 1 4"
`\\`\
2 1/ a " 1
/; ////1
1/8" Joint
Figure 3.9 Location of load on direct shear specimen
While testing the first two direct shear specimens, a problem was encountered. While
preparing the initial specimens for testing, the author observed that the specimens were not
sitting level in the testing apparatus. The decision was made to conduct the first test and
attach two DCDT's to the rear of both end blocks. The end block DCDT's were mounted to
measure the movement of the end blocks opposite the dowel bars, or to check the end blocks
for rotation. After performing tests on the first two direct shear specimens, the DCDT's
revealed that there was a significant amount of rotation occurring on the end blocks.
This rotation was due to the unevenness of the bottom of the specimens. The forms
used to cast the specimens were not perfectly flat which created unevenness along the bottom
of the specimen. This unevenness on the bottom of the specimens caused the specimen to
shift when loaded. As more load was applied, more movement of the end blocks would

24
occur. The solution to this problem was to cast the bottom. of the end blocks in dental plaster.
The plaster that was used for this procedure was Labstone, which had a compressive strength
of 8000 psi. Upon retests of the two initial direct shear specimens, the rotation was again
monitored and no measurable amount of rotation was seen. All of the remaining direct shear
specimens were cast in the Labstone to be sure that the bottoms remained level during
testing. As a precaution, rotation readings were taken for all the direct shear specimens to
ensure that no rotation occurred on any of the remaining specimens. The direct shear method
was .only used in the AHT investigation (16).
3.3 Aged Specimens
"Aged" specimens were constructed indentically as the modified AASHTO shear
specimens. After allowing the specimens to cure for 28 days, they were placed in a 131.3°F
solution of sodium hydroxide and satuarated calcium hydroxide with a pH of 12.0-12.5 for
99 days. This aging is equivalent to 18,247 days or approximately 50 years of real time aging
according to work done by Boris (20). The testing for each aged specimen was identical to
the testing for the unaged specimen of each type. Aged specimens were only tested with the
modified AASHTO shear method and the elemental fatigue method.
3.4 Iowa Department of Transportation Investigation
The static tests used in this investigation were the Iosipescu Test method and the
AASHTO Shear Test method, as shown in Figures 3.3 and 3.6. Epoxy-coated steel dowel
bars are the most common dowel bars used in highway pavements today. Therefore, the
dowel bar materials chosen should somehow relate back to the standard dowel bars. This
relation was accomplished by using two different aluminum and copper dowel bars. The
aluminum and copper dowel bars were chosen due to their different modulus of elasticity, E.

25
One aluminum and one copper dowel bar each had a diameter of 1.5 in. and a second bar
diameter was selected that gave both materials the same modulus of rigidity, EI, as that of the
standard epoxy-coated steel dowel bar. Two different sizes of GFRP dowels were also used.
Table 3.1 shows the different sizes and the material properties of the different dowel bars.
The properties for the steel, aluminum, and copper shown in Table 3.1 were obtained from
Ugural's textbook (21).
The concrete strengths were to represent the strength that a pavement would typically
experience. The target concrete mix strength was 6000 psi for each set of dowel bars shown
in Table 3.1. Once the concrete reached the desired strength, the specimens were tested.
Table 3.1 Dowel material and sizes used in IDOT investigation Material Diameter, in. E, (106) psi EI, (106) lb-in.2
Epoxy-Coated Steel 1. S 29 7.206 Stainless Steel 1.5 28 6.958
Plain Steels 1.5 29 7.206
Aluminum b 1.5 10
2.485 1.957 7.200
Copper b 1.5 17
4.225 1.714 7.202
GFRP 1.5 4.934 1.225 GFRPb 1.75 6.20 2.854 GFRP 1.875 6.5 l d 3.950
e Plain Steel indicates an epo~ry-coated dowel bar with the coating removed. b These dowel bars were only tested in unaged specimens. ~ Properties were taken from work done by Porter et al. (22) and (23). d Properties were taken from work done by Porter et a1. (12).
The dowel bars evaluated in the elemental fatigue tests consisted of bars that were
.made out of varying shapes and materials. Three types of dowel bars tested in the fatigue test

26
were also tested in the static test. - There were also two additional, alternatively shaped dowel
bars tested, an elliptical and a shaved dowel bar. The dimensions of these alternatively
shaped dowel bars can be seen in Figure 3.10. Table 3.2 shows the different shapes and
materials that .were used in the elemental fatigue testing.
--~ 1. ~ ~~~ in. 1
alternate chap a ## 1: F.11~p s e ~ ~
Equation of t1~e Enip s e : ~ + ~ = Y ~ .12~~ ~. ~~~~
r
~. ~ 1~0 ~.
~.~~~~ ~.
Alternate Shape #2: Originally a 1.875-in. diameter dowel bar with the top and bottom halves shaved The corners have a fillet with a radius of 0.15 in.
Figure 3.10 Alternatively shaped dowel bars

27
Table 3.2 Dowel material and sizes used in Elemental Fatigue testing Material Diameter, in. E, (106) psi EI, (106)1b-in.2
Epoxy-Coated Steel 1.5 29 7.206 Stainless Steel 1.5 28 6.95 8
Elliptical GFRPa 1.3 l~ 8.66 2.210 Shaved GFRPa b 1.23 6.51 1.619
GFRP 1.5 4.934 1.255 GFRP 1.875 6.S ld 3.950
a These dowel bars were only tested in unaged specimens. b The Shaved GFRP dowel bars were cut from the 1.875-in. diameter dowel bars.
Dimensions listed are the minor axis dimension. See Figure 3.11 for an illustration of these dowel bars.
d Properties were taken from work done by Porter et al. (12).
3.5 American Highway Technology Investigation
In the AHT investigation, the Elemental Direct Shear Test Method, outlined in
Section 3.2.4, was utilized. The purpose of this research was to determine the effect that
dowel bar shape and size had on bearing stress, 6b, at the face of the joint. In this research
there were five different types o f dowel bars tested. Ten dowel bars of each dowel bar type
were used. Two dowel bars were placed in each specimen, which required the construction
of 25 concrete specimens, five specimens for each type of dowel bar. The different types of
dowel bars were:
• 1.25-in. diameter epoxy-coated steel,
o Area = 1.22 7 in.2
• 1.5-in.diameter epoxy-coated steel,
o Area = 1.767 in.2,
• large elliptical steel (major axis = 1.98 in.: minor axis = 1.34 in.),
o Area = 2.084 in.2

28
• medium elliptical steel (major anus = 1.66 in.: minor axis = 1.13 in.),
o Area = 1.473 in.2
• small elliptical steel (major axis = 1.41 in.: minor axis = 0.88 in.).
o Area = 0.975 in.2
See Table 3.3 for a test matrix of the specimens tested.
Table. 3.3 Test matrix of AHT test specimens Description of Dowel Bar Number of Test Specimens Number of Dowel Bars 1.25"~ Epoxy-Coated steel 5 10 1.5"~ Epoxy-Coated steel S 10
Large Elliptical Steel 5 _ 10 Medium Elliptical Steel 5 10
Small Elliptical Steel 5 10

29
4.0 ANALYSTS OF EXPERIMENTAL RESULTS
4.1 Introduction
The tests outlined in Chapter 3 were followed and the appropriate deflection data was
gathered. This deflection data was then utilized to calculate the modulus of dowel support
and the modulus of foundation, as described in Chapter 2. This chapter will outline the
modulus .values that were acquired for each specimen as well the associated bearing stress.
4.2 Iowa Department of Transportation Results
The following section will detail the experimental data that was calculated for the IDOT
project.
4.2.1 Iosipescu Test Method & A.ASHTO Shear Test Method
From the actual deflection versus load diagrams that were created during testing, linear
regression was used to determine aload-deflection equation for each specimen. Using this
relationship, a relative deflection was obtained for a dowel load of 2,000 pounds. A 2,000-
pound load represents the maximum load that the critical dowel in a typical pavement would
be expected to experience due to the distribution of a 9,000-pound wheel load (12). The
deflection at the face of the joint, yo, was determined in Equation 2.11, repeated here for
convenience. The equation for shear deflection, S, is shown in Equation 4.1 and was
obtained from Young (14).
O—~ yo 2
10•P•z b =
9•GXy•A
Table 4.1 .gives the average total relative deflection, average shear deflection, and
average deflection at the face of the joint for each type of dowel bar using an Iosipescu shear

30
test. Table 4.2 is a listing of the average total relative deflection, average shear deflection,
and average deflection at the face of the joint using the modified AASHTO direct shear test.
The values in both tables were calculated fora 2000-pound load and are for unaged
specimens. Note that the 1.75-in. diameter GFRP dowel bar was replaced with a 1.875-in.
diameter GFRP dowel bar in later research.
Table 4.1 Iosipescu Test -Unaged -Average relative deflection, shear deflection, and deflection at face of ioint.
Dowel Bar Average ©, in.* Average S, in.* Average yo, in.*
1.5 "~ Epoxy-Coated 0.003 211 0.000014 0.001 S 99 1.5"~ Stainless Steel
a - 0.003600
s
-0.00001 S 0.001793
1.5"c~ Plain Steel 0.002699 0.000014 0.001343
1.5 "~ GFRP 0.00613 7 0.000679 0.003 03 5 1.75"~ GFRPa 0.007637 0.000242 0.003698
a Properties were tal~en from work done by Porter et al. (11). Note: The deflections cannot be measured this accurately, but are needed to display the
effects of shear deflection.
Table 4.2 Modified AASHTO Test -Unaged -Average relative deflection, shear deflection, and deflection at face of ioint.
*Not
Dowel Bar Average O, in.~ Average b, in.* Average yo, in.~ 1.5"~ Epoxy-Coated 0.005426 0.000014 0.002706
1.5"~ Aluminum 0.009710 0.000041 0.004835 1.957"~ Aluminum 0.007901 0.000024 0.003938
1.5" Co er ~ pp 0.006512 0.000024 0.003244 1..714"~ Copper 0.005415 0.000018 0.002698
1.5"~ GFRP 0.010810 0.000679 0.005065 1.875"~ GFRP 0.007472 0.000319 0.003576
effects of shear deflection.

31
Table 4.3 shows the average total relative deflection, average shear deflection, -and
average deflection at the face of the joint for each type of dowel bar using an Iosipescu shear
test for the aged specimens. The values were calculated fora 2,000-pound load. This
information corresponds to the unaged Iosipescu test results that are given in Table 4.1.
There were no aged specimens tested using the modified AASHTO static test method.
Table 4.3 Iosipescu Test —Aged -Average relative deflection, -shear deflection, and deflection at face of ioint.
*Not
- Dowel Bar Average ~, in.* Average ~, in.* Average yo, in.*1.5"~ Epoxy.-Coated 0.003415 0.000014 0.001701 1.5"~ Stainless Steel 0.002978 0.000015 0.001482
1.5" Plain Steel 0.002729 0.000014 0.0013 5 8
1.5"~ GFRP 0.005863 0.000679 0.002592 1.875"~ GFRP 0.006606 0.000319 0.003144
effects of shear deflection.
With the deflections calculated, the next step is to calculate the modulus of dowel
support and the modulus of foundation. The modulus of dowel support and the modulus of
foundation are calculated using similar procedures. To calculate the modulus of dowel
support and the modulus of foundation, Equation 2.6 is used. However, .the difference, as
was discussed earlier, is found in the ~i term. For the modulus of foundation, Equation 2.3 is
used. when calculating the modulus of foundation, Equation 2.7 is utilized. Equations 2.6,
2.3 and 2.7 are repeated here for convenience.
P yO 4R3EI (2 +biz)
where,
(2.6)

32
k (3 = 4 =relative stiffness of the beam on the elastic foundation (in."1) (2.3)
EI
R y 4EI —relative stiffness of the dowel bar encased in concrete (in.-1) (2.7)
The appropriate values of k, or Ko, are imputed into Equation 2.6. A.f~er multiple values are
imputed, a k versus yo graph, or Ko versus yo graph, can be created. Since Equation 2.6 is
dependent on the bar shape and material properties, a graph must be created for each dowel
bar of a different shape and/or material. Shown in Figure 4.1 is a sample k versus yo graph
fora 1.5-in.diameter round epoxy-coated steel dowel bar calculated at a 2000-pound load.
Similarly, in Figure 4.2 is a sample Ko versus yo graph fora 1.5 -in. diameter round epoxy-
coated steel dowel bar at a 2000-pound load. However, since there was a linear relationship
between the load and the deflection, the results for the modulus of dowel support and
modulus of foundation are not dependent on the load.
k versus Yo graph for 1.5-in. diameter round epoxy-coated steel dowel ba r
0.012 -
0.010
0.008
a 0 0.006
0.004
0.002
0.000 0 200000 400000 600000 800000 1000000 1200000 1400000 1600000
k Value (psi)
Figure 4.1 k versus yo fora 1.5-in. diameter round epoxy-coated steel dowel bar at a 2000-pound load

33
Ko versus ~o graph for 1.5 inch diameter round epoxy-coated dowel bar
0.012
0.010
0.008 .~
~= 0.006 0
0.004
0.002
0.000 ~ ~ 0 200000 400000 600000 800000 1000000 1200000 1400000 1600000
Ko Value (pci}
Figure 4.2 Ko versus yo fora 1.5-in. diameter round epoxy-coated steel dowel bar at a 2000 -pound load
Using the modulus of foundation, or the modulus of dowel support, along with the
deflection at the face of the joint, the concrete bearing stress can be calculated. These
equations are repeated here for convenience.
6bT = ~ o ~2.16~
abF — KoYo 12.17
Table 4.4 is a listing of each unaged specimen type and the associated average
modulus of foundation and average modulus of dowel support. Table 4.5 shows the aged
specimens values for average modulus of foundation and average modulus of dowel support..
Again, the data in the following table has been calculated for a load of 2000 pounds. The
results in Table 4.5 are from the Iosipescu test method since no aged specimens were tested
using the modified AASHTO method.

34
Table 4.4 Unaged -Average modulus of foundation and modulus of dowel support values
Dowel Bar Average k, psi Average Ko, pci
Iosipescu
1.5"~ Epoxy-Coated 1,149,275 772,3 3 0
1.5"~ Stainless Steel 996,630 665,170
1.5" Plain Steel 1,452,689 976,750 1.5"~ GFRP 897,498 598,443
1.75"~ GFRP 516,139 300,000
Modified AASHTO
1.5"~ Epoxy-Coated 567;044 377,774
1.5"~ .Aluminum 374,682 251,133
1.9 5 7"~ Aluminum 3 42, 719 176, 5 00
1.5" Co er ~ pp ~ 533,812 355,786
1.714"~ Copper ~ 569,422 332,032
1.5" GFRP 450,023 299,847
1.875"~ GFRP 478,445 256,233
Table 4.5 Iosipescu Test -Aged -Average modulus of foundation and modulus of dowel support values
L i
Dowel Bar Average k, psi Average Ko, pci
1.5"~ Epoxy-Coated 1,057,697 704,950
1.5"~ Stainless Steel 1,287,147 861,930
1.5"~ Plain Steel 1,431,183 954,071 1.5"~ GFRP 1,110,186 740,432
1.875"~ GFRP 568,835 303,404
As can be seen in Table 4.4, the values given for the modulus of foundation and the
modulus of dowel support vary greatly between test methods. The reason for the lower
modulii values with the modified AASHTO test method is most likely related to the rotation
that the author observed while conducting his own research, a.s explained in Section 3.2.4.

35
The researcher responsible for the test data above did not check for rotation of the specimens
and therefore some may have occurred and reduced the overall stiffness of the system. A
lower stiffness would explain the large variation shown above.
Even with this large variation in the modulii, the bearing stresses determined are
relatively close when comparing both test methods. Since the bearing stress is the primary
concern in this research, the author felt that all of the values where appropriate to be used
collectively in this report.. However, due to the large difference in the modulii, the values of
both test methods should only be used to show trends in the behavior of the dowel bars and
the values from one test method should not be compared directly to the other test method.
Table 4.6 shows the Timoshenko and Friberg bearing stresses for the unaged bars. while
Table 4.7 shows the associated bearing stresses for the aged specimens.
Table 4.6 Unaged - Average bearing stress values Dowel Bar Average abT , pli Average ~bF, psi
Iosipescu
1.5"~ Epoxy-Coated 1,838 1,235 1.5"~ Stainless Steel 1,787 1,193
1.5"~ Plain Steel 1,951 1,312 1.5 "~ GFRP 2, 724 1, 816
1.75"~ GFRP 1,909 1,109 Modified AASHTO
1.5"~ Epoxy-Coated 1,534 1,022
1. S "~ Aluminum 1, 812 1,214
1.957"~ Aluminum 1,350 695 1.5"~ Copper 1,732 1,154
1.714"~ Copper 1,536 896 1.5"~ GFRP 2,279 1,519
1.875"~ GFRP 1,711 916

36
Table 4.7 Iosipescu Test - Aged -Average bearing stress values Dowel Bar Average ~'bT , pli Average crbF, psi
1.5"~ Epoxy-Coated 1,799 1,199
1.5"~ Stainless Steel 1,908 1,277
1.5"~ Plain Steel 1,944 1,296
1.5"~ GFRP 2,878 1,919
1.875" GFRP 1,788 954
When reviewing the bearing stresses, both the Timoshenko and Friberg stresses
follow the same trends. For a given material, bearing stresses tend to be higher on the
smaller bars and the bearing stress decreases as the size of the bar increases. This behavior
can also be stated that the bearing stress is inversely proportional to the size of the dowel bar.
Another trend that can be seen is that the GFRP dowel bars tend to have higher
bearing stresses than that of a similarly sized metal dowel bar. The higher bearing stress in
the GFRP can be explained by looking at the bearing stress equations. The bearing stress is
related to the modulii and the deflection at the face of the joint. The modulii and the
deflection are both related to the stiffness of the material. The material properties of GFRP
dowel bars create a dowel bar with less stiffness than a similarly sized metal dowel bar.
Thus, higher bearing stresses are developed.
The final trend can be seen when comparing the Timoshenko bearing stress to that of
the Friberg bearing stress. The Timoshenko bearing stresses are always higher than the
Friberg bearing stresses. The difference between the Friberg bearing stress and the
Timoshenko bearing stress is equal to the width of the bar. This difference follows the
assumption used by Friberg that the bearing stress was constant across the width of the dowel
bar.

37
4.2.2 Elemental Fatigue- Test Method
The purpose of the elemental fatigue testing was to determine if there is a significant
decline in the modulii for the different dowel bars tested due to fatigue. The trends seen with
these results are to be used to determine if one dowel bar may be more resistant to oblonging
of the concrete adjacent to the dowel bar. Using the test method outlined in Section 3.2.3 and
the analysis procedure outlined in Section 4.2.1, the following results were obtained. The
average relative deflection, shear deflection and the averaged deflection at the face of the
joint can be seen in Tables 4.8 thru 4.1 1. Tables 4.8 and 4.9 show the results before any
cycling of the specimens had occurred for unaged and aged specimens, respectively. V~►Thile
Tables 4.10 and 4.11 contain the results after 1 million cycles had been applied to the
specimens for unaged and aged specimens, respectively. These tables were calculated for a
load of 2000 pounds.
Table 4.8 Fatigue Testing — Unaged, 0 Cycles -Average relative deflection, shear deflection, and deflection at face of ioint.
*Note: The deflections cannot be measured this accurately, but are needed to display the
Dowel Bar Average ~, in.* Average ~, in.* Average yo, in.*1.5 "~ Stainless Steel 0.0013 5 7 0.000015 0.000671
Elliptical GFRP .0.002729 0.000529 0.001100 Shaved GFRP 0.002778 0.000415 0.001181 1.5"~ GFR.P 0.005542 0.000681 0.002431
1.875" GFR.P 0.004424 0.000319 0.002052
effects of shear deflection.
The modulus of foundation and the modulus of dowel support that were calculated
can be seen in Tables 4.12 thru 4.15. Tables 4.12 and 4.13 contain the results far the dowel
bars at 0 cycles and Tables 4.14 and 4.15 show the results for the dowel bars at 1 million

38
cycles. Tables 4.12 and 4.14 list the results for unaged specimen while the other two tables
show the results for aged specimens.
Table 4.9 Fatigue Testing - Aged, o Cycles -Average relative deflection, shear deflection, and deflection at face of ioint.
Dowel Bar v Averag e 0 in.* Avera e b in.*g Avera e o in.~ g y 1.5"~ Epoxy-Coated 0.001889 0.000014 0.000937
1.5"~ Stainless Steel 0.002230 0.000015 0.001108
1.5" GFRP 0.003734 0.000681 0.001527
1.875"~ GFRP 0.004881 0.000319 0.002281
*Note: The deflections cannot be measured this accurately, but are needed to display the effects of shear deflection.
Table 4.10 Fatigue Testing - Unaged, 1 Million Cycles -Average relative deflection, shear deflection, and deflection at face of ioint.
Dowel Bar Avera e O in.*g Avera e S in.*g , Avera a o, in.*g Y 1.5"~ Stainless Steel 0.001218 0.000015 0.000602
Elliptical GFRP 0.002357 0.000529 0.000914
Shaved GFRP 0.002791 0.000415 0.001188
1.5"~ GFRP 0.005277 0.000681 0.002298
1.875" GFRP 0.004515 0.000319 0.002098
*Note: The deflections cannot be measured this accurately, but are needed to display the effects of shear deflection.
Table 4.11 Fatigue Testing -Aged, 1 Million Cycles -Average relative deflection, shear deflection, and deflection at face of ioint.
Dowel Bar Avera e © in.*g Avera e b in.*g Avera a o, in.*g y 1.5"~ Epoxy-Coated 0.003644 0.000014 0.001815
1.5" Stainless Steel 0.002503 0.000015 0.001244
1.5" GFRP 0.004404 0.000681 0.001861
1.875"~ GFRP 0.006761 0.000319 0.003221
*Note: The deflections cannot be measured this accurately, but are needed to display the effects of -shear deflection.

39
Table 4.12 Unaged, 0 Cycles -Average modulus of foundation and modulus of dowel support
Dowel Bar Average k ,psi Average Ko ,pci
1.5 "~ Stainless Steel 3 , 73 0,165 2,492, 740 Elliptical GFRP 2,862,277 1,282,372 Shaved GFRP 2, 904, 5 44 1, 5 S 7, S 94
1.5"~ GFRP 1,210,416 807,378 1.875"~ GFRP 1,009,375 538,623
Table 4.13 Aged, 0 Cycles -Average modulus of foundation and modulus of dowel support values
Dowel Bar Average k ,psi Average Ko ,pci
1.5"~ Epoxy-Coated 2,355,618 1,570,173
1.5" Stainless Steel 1,902,121 1,27.1,193
1.5"~ GFRP 2,265,352 1,512,026
1.875"~ GFRP 875,577 467,336
Table 4.14 Unaged, l Million Cycles -Average modulus of foundation and modulus of dowel suouort values _-
Dowel Bar Average k ,psi Average Ko ,pci
1.5"~ Stainless Steel 4,315,290 2,885,501 Elliptical GFRP 3,672,690 1,647,085 Shaved GFRP 2,881,515 .1,545,786
1.5"~ GFRP 1,305,781 870,874 1.875"~ GFRP 979,741 523,052
Table 4.15 Aged, l Million Cycles -Average modulus of foundation and modulus of dowel support
Dowel Bar Average k ,pci Average Ko ,.pci
1.5"~ Epoxy-Coated 969,462 646,154 1.5"~ Stainless Steel 1,628,247 1,086,978
1.5"~ GFRP 1,735,170 1,157,819 1.-875"~ GFRP 550,633 293,b88

40
Using the data in the tables above and the procedure outlined in Section 4.2.1 the
associated bearing stresses can be found. Tables 4.16 thru 4.19 display the calculated results
for the Timoshenko and Friberg bearing stresses. Tables 4.16 and 4.17 contain the results for
the dowel bars with zero cycles and Tables 4.18 and 4.19 show the results of the dowel bars
with one million cycles. Tables 4.16 and 4.181ist the results for unaged specimen while the
other two tables show the results for aged specimens.
Table 4.16 Unaged, 0 Cycles -Average bearing stress values Dowel Bar , Average 6bT ,pli Average ~bF, psi
1.5"~ Stainless Steel 2,503 1,673 Elliptical GFRP 3,149 1,410 Shaved GFRP 3,430. 1,840 1.5"~ GFRP 2,943 1,963
1.875"~ GFRP 2,071 1,106
Table 4.17 Aged, 0 Cycles -Average bearing stress values Dowel Bar .Average abT ,pli Average crbF ,psi
1.5 "~ Epoxy-Coated 2,207 1,472 1.5"~ Stainless Steel 2,108 1,408
1.5"~ GFRP 3,459 2,309 1.875"~ GFRP 1,997 1,066
Table 4.18 Unaged, l Million Cycles -Average bearing stress values Dowel Bar Average aeT ,pli Average abF ,psi
1.5 "~ Stainless Steel 2, S 98 1, 73 7 Elliptical GFRP 3,357 1,505 .Shaved GFRP 3,423 1, 83 7 1.5"~ GFRP 3,001 2,002
1.875"~ GFRP 2,055 1,097

41
Table 4.19 Aged, l Million Cycles - Average bearing stress values Dowel Bar Average 6bT , pli Average ~bF, psi
1.5 "~ Epoxy-Coated 1, 760 1,173
1.5"~ Stainless Steel 2,026 1,353
1.5"~ GFRP 3,229 2,155
1.875"~ GFRP 1,774 946
When reviewing the bearing stresses from the elemental fatigue results, a few trends
can be seen. One trend is apparent when comparing the zero cycle dowel bars to the million
cycle dowel bars. In general, the million cycle dowel bars tend to have slightly higher
bearing stresses, although, the stresses are very similar in all cases. With the small
deflections that are used in the analysis of this data a safe assumption would be to consider
the bearing stresses between the different cycles approximately equal. Another trend is that
the Timo shenko bearing stresses are larger than the Friberg bearing stresses. A trend that
was also seen with the Iosipescu and AASHTO specimens was that the larger bars of the
same material had lower bearing stresses than the smaller dowel bars. This trend is also true
with the fatigue testing, with the exception of the Timo shenko bearing stresses with the
GFRP alternatively shaped dowel bars. The alternatively shaped dowel bars would have a
larger cross-section, but the Timoshenko bearing stresses are significantly higher than
smaller GFRP bars. The Friberg bearing stresses do not follow the same trend with the
alternatively shaped GFRP dowel bars as the Timoshenko bearing stresses. With the
alternatively shaped GFRF dowel bars, the Friberg bearing stress decreases as the
Timoshenko bearing stress increases when compared with the other bars. This trend may
indicate that the Friberg bearing stresses are underestimated as the dowel bar width increases.
42
This trend may also indicate that the material removed to create the alternatively shaped
GFRP dowels bars is detrimental to the stif~iess.
4.3 American Highway Technology Results
The following sections will detail the experimental data that was calculated for the AHT
project.
4.3.1. General
The AHT testing method compared round and elliptical steel dowel bars. In this
research the round dowel bars were epoxy coated, while the elliptical dowel bars were plain
steel with no epoxy coating. The lack of epoxy coating had no effect on the accuracy of the
testing since these dowels were not exposed to weather and were tested soon after being cast.
This difference in coatings is one reason why aged dowel bars could not be tested on this
project.
4.3.Z Elemental Direct Shear Test Method
The purpose of this research was to determine the effect that dowel bar shape and size
has on bearing stress at the face of the joint. This test method was outlined in Section 3.2.4.
Using the analysis procedure outlined in Section 4.2.1, the following results were obtained.
The average relative deflection, shear deflection, and average deflection at the face of the
joint are shown in Table 4.20.
Table 4.21 is a listing of each specimen type and the associated average modulus of
foundation and modulus of dowel support calculated at a load of 2000 pounds. V~►Th.ile Table
4.22 indicates the calculated results for the Timoshenko and Friberg bearing stresses.

43
Table 4.20 Direct Shear Method -Average relative, shear, and face of the joint deflections Dowel Bar Average ~, in.* Average ~, in.* Average yo, in.*
1.5"~ Epoxy-Coated 0.001642 0.000014 0.000814 1.25"~ Epoxy-Coated 0.002642 0.000020
_ 0.001311
Large Elliptical Steel 0.001968 0.000012 0.000978 Medium Elliptical Steel 0.002432 0.000017 0.001207 Small Elliptical Steel 0.002383 0.000025 0.001179
*Note: The deflections cannot be measured this accurately, but are needed to display the effects of shear deflection.
Table 4.2.1 Direct Shear Method -Average modulus of foundation and modulus of dowel sunnort
Dowel Bar Description ~ Average k , (psi) Average Ko , (pci) 1.5"~ Epoxy-Coated 2,845,586 1,897,832 1.25"~ Epoxy-Coated 1,931,043 1,556,660 Large Elliptical Steel _ 2,272,200 1,148,216
Medium Elliptical Steel 2,171,172 1,311,940 Small Elliptical Steel 3,088,499 2,195,109
Table 4.22 Direct Shear Method - Average bearing stress values Dowel Bar Description Average nbT , (pli) Average nbF , (psi)
1.5"~ Epoxy-Coated 2,316 1,545 1.25"~ Epoxy-Coated 2,532 2,040 Large Elliptical Steel 2,222 1,123
Medium Elliptical Steel 2,621 1,584 Small Elliptical Steel 3,641 2,588
with the Direct Shear Method, the Timo shenko bearing stresses were always larger
than the Friberg bearing stresses. This behavior is just as was indicated in all the other test
methods. . The steel alternatively shaped dowel bars with the Direct Shear Method results
indicate that the Timoshenko and Friberg bearing stresses behave in the same manner as the
round shapes tested. The behavior of the GFRP alternatively shaped dowel bars used in the
Elemental Fatigue test displayed the opposite behavior. The results shown by the steel
alternatively shaped dowel bars suggests that the results seen with the alternatively shaped

44
GFRP bars is caused by the loss in stiffness. However, comparing the bearing stresses of the
steel alternatively shaped dowel bars with the round dowel bars still indicates the possibility
for an underestimation by Friberg's bearing stress theory.

45
5.0 THEORETICAL INVESTIGATION
5.l Introduction
As was discussed in Chapter 2, the relative deflection across a pavement joint is
dependent on .four- separate components. Previous research at ISU neglected two of the
deflection terms due to the assumed small values. The terms neglected in previous .research
was the deflection due to the slope of the dowel bar and flexural deflection.
The equation used to determine the relative deflection across a pavement joint was
shown in Chapter 2 and is repeated here for convenience.
where,
3
o=2yo+Z(aX~ +S+ 12EI
yo =deflection at the face of the joint(in.)
S = AG ,shear deflection (in.)
P =load transferred by dowel bar (pounds) ~, =form factor A =cross-sectional area of the dowel bar (in.2) G =shear modulus (psi)
(2.$)
(2.9)
As stated above, the terms of interest in this chapter are the deflection due to the slope
3 dyo Pz of the dowel bar, z ,and the flexural deflection, As can be seen, both terms dx 12EI
neglected contain the joint width, z. The small joint width, z, used in research at ISU was the
basis for neglecting the two terms listed above. This chapter will investigate the derivations
of each of the terms above, the appropriateness of neglecting these terms, and when including
.the above terms becomes appropriate in the analysis of k and K.o.

46
5.2 Dowel Bar Slope Theory
5.2.1 Purpose
The deflection due to the slope of the dowel bar (slope deflection) consists of two
separate elements. The first element is the joint width, z, the second element is the slope of
the dowel bar at the face of the joint, (aX°) . The joint width is easy to deal with since this
width is a finite value that can easily be measured. On the other hand, the slope of the dowel
bar across the face of the joint is a theoretical value and is more difficult to determine. The
slope of the dowel bar_ across a joint was found by work done by Timoshenko and later
modified upon by Friberg. Their derivation was completed as follows.
5.2.2 Dowel Bar Slope Derivation
The initial portion of the derivation for dowel bar slope was shown in Chapter 2.
This portion will also be repeated here for convenience. Timoshenko found the deflection of
a beam on an elastic. foundation to be equal to Equation 2.1.
d4EI dX4 = -ky (2.1)
where k is a constant (psi), E is the modulus of elasticity of the dowel (psi), I is the moment
of inertia of the dowel (in.4), and y is the deflection. Timoshenko indicates that the general
solution to this equation is Equation 2.2.
yo = eR"(A cos (3x + B sin (3x) + e a"(C cos ~3x + D sin (3x) (2.2)
where, k
~ 4 4EI —relative stiffness of the beam on the elastic foundation (in."') X2.3)
k =modulus of foundation (psi)

47
By applying the appropriate boundary conditions, A, B, C and D can be determined. Assume
a semi-infinite beam on an elastic foundation with moment, Mo, and a point load P, as shown
in Figure 5.1. Solving Equation 2.3 becomes Equation 2.4.
e"a"
y = 2(33EI [P cos J3x — (31V~(cos (3x -sin (3x)]
Figure 5.1 Semi-infinite beam On an elastic foundation
(2.4)
The slope Of the beam can be determined by differentiating Equation 2.4 with respect
to x. This differentiation will determine the slope Of the beam at any point along the axis and
is shown in Equation 2.5.
dy e"RX
dx 2(32EI L(2(3NIo — P)cos fix — P sin fix] ~2.$)
Friberg applied Timoshenko's elastic beam theory of a semi-infinite beam. Friberg
assumed that the inflection point Of the dowel Occurred in the center Of the joint width.
Applying this assumption, the forces On the dowel bar are shown in Figure 5.2. Substituting
Mo = -Pz/2 and setting X equal to zero Equation 2.4 can be written as Equation 2.6. Equation
2.6 is the deflection of the dowel at the face of the joint, yo.
48
where,
P Yo = 4R3EI (2 + (3z) (2.6)
R V 4EI —relative stiffness of the dowel bar encased in concrete (in.-~) (2.7)
Ko =modulus of dowel support (pci) b =dowel bar width (in.) E =modulus of elasticity of the dowel baz (psi) I =moment of inertia of the dowel bar (in.4) P =load transferred through the dowel bar (pounds) z =joint width (in.)
Mo M 2z
P -1 , /
P
Mi Mo
Portion of dowel extending across joint
M1=M2=Pz/2
Mo=-M1=-M2=-Pz/2
Figure 5.2 Forces acting on a dowel bar
The slope of the dowel at the face of the joint can be found in a similar manner to the
deflection, yo. Again, substituting Mo = -Pz/2 and setting x equal to zero into Equation 2.5

49
will yield the slope at the face of the joint. Equation 5.1 shows the slope of the dowel at the
face of the joint.
dyo — P dx 2~32EI
(1 +biz) (5.1)
5.2.3 Slope Deflection and Ko
As was shown in Chapter 3, the relative deflection across a joint, yo, can be
determined without calculating the slope deflection. Previous research at ISU neglected the
slope deflection_ due to the assumed effect over a small joint width, z. When the slope
deflection is used to calculate the solution of K.o, a similar method is utilized as in Chapter 3.
The remainder of this section will show the proper method used to determine Ko, and the
concrete bearing stress, 6b, when including slope deflection in the calculation.
The relative deflection across a pavement joint, ~, was shown in Equation 2.8.
Neglecting flexural deflection Equation 2.8 can be rewritten as Equation 5.2.
°-2y° +Z~ aX~~ +s (s.2)
The deflection at the face of the joint, yo, and the slope deflection are both dependant on Ko.
The relative deflection across the joint, D, is determined from lab experiments. The shear
deflection, S, can easily be computed from the properties of the dowel bar. Reorganizing
Equation 5.2 by placing the terms that are dependent on Ko on the same side of the equation;
Equation S . 3 can be determined.
~-b=2yo +z dyo dx (5.3)

50
Substituting various values of Ko into Equations 2.6 and S.1 a graph can be created showing
the right side of Equation 5.3 versus Ka. Figure 5.3 shows a graphical illustration fora 1.5-
in. diameter epoxy-coated steel dowel bar at a 2000-pound load.
The next step in determining Ko is to evaluate the terms on the left side of Equation
5.3. Using experimental data, a value can be calculated for the left side of Equation 5.3.
Once this value is known, a chart similar to that shown Figure 5.3 is used to determine the Ko
value.
Twice the deflection at the face of the joint and slope deflection versus Ko graph for 1.5-in. diameter round epoxy-coated steel dowel bars
1500000
1000000
0
500000
0
o.000 o.00s o.o ~ o o.o i s o.oao o.oas Twice the deflection at the face of the joint and slope deflection (in.)
Figure 5.3 Twice the deflection at the face of the joint, 2*yo, and slope deflection versus Ko
Once the Ko value is known, the whole previous procedure is used to determine a
value for the deflection at the face of the joint, yo. Substituting various values of Ko into
Equation 2.6, a graph can be created showing Ko versus deflection at the face of a joint, yo.

51
Figure 5.4 shows a Ka versus yo graph fora 1.5-in. diameter epoxy-coated steel dowel bar at
a 2000- and load. Once Ko and yo-have been determined, all pertinent values can easily be
determined using simple mathematics. The results of this section will be shown in the
following chapter.
Ko versus Yo graph for 1.5-in. diameter round epoxy-coated steel dowel bars
0.012
0.010
~„~ 0.008 .~ c 0.006
0.004
0.002
0.000 ---~,
0 200000 400000 600000 800000 1000000 1200000 1400000 1600000
Ko (pci)
Figure 5.4 Ko versus yo for the 1.5-in. diameter round epoxy-coated steel dowel Bar
5.3 Flexural Deflection Theory
5.3.1 Purpose
As was discussed in Section S.l, the flexural deflection term was neglected from
Equation 2.8 when calculating Ko in previous research done at I SU. The flexural deflection,

52
Pz312EI
is simple to evaluate, but was neglected due to the small joint width used in research
at ISU. In the following section a derivation of the flexural deflection term is completed.
5.3.2 Flexural Deflection Derivation
The dowel bar pavement system can easily be analyzed as a beam that is fixed on one
end with a load applied on the opposite end. The opposite end is free to translate vertically
but is restrained from rotating. Figure S.5 shows the idealized beam for a dowel bar spanning
across a pavement joint of width z. Figure 5.6 shows the shear diagram and moment diagram
for the idealized beam.
M P
I~ Z ►i M=Pz/2
Figure 5.5 Idealized beam of dowel bar
From engineering mechanics, the relationship between shear, moment, slope and
deflection are known. These relationships will be used to derive the flexural deflection. The
shear is constant along the entire length of the beam, therefore the shear equation is a
constant. The shear can be determined at any place on the beam using Equation 5.4.

53
v(x) _ -P
The moment is simply the integral of the slope, which is shown in Equation 5.5.
M(x) = f V(x)dx = -Px + Y
(5.4)
~s.$)
Y is a constant that can be solved using the known boundary conditions for the beam.
. — Pz In this case the moment at x = z is equal to . Solving for Y, Equation 5.5 can be
2
rewritten as Equation 5.6.
V
M
Pzl2
Illlllluuuu~~~~~,....__
_p
--••""°~~~~nmllllllll -Pz/2
Figure 5.6 Shear and moment diagrams for idealized beam of dowel bar
2 (5.6)
The method above can be repeated to determine the fle~zral slope and the fle~ral
deflection of the dowel bar. Deviations for the fle~ral slope and fle~ral deflection are
shown in Equations 5.7 and 5.8, respectively.
2
8(x) = 1 f M(x) dx = — Px + Pzx (5.7) EI 2EI

54
0(x) = j8(x)dx = — 2Px3 + 3P~2 — Pz312EI
(s.g)
5.3.3 Flexural Deflection and Ko
Determining Ko including flexural deflection in the equation is a simple process.
Since fle~ral deflection contains no Ka term, the flexural deflection value can simply be
added into the equation and the Ko value determined. Including slope deflection in the
determination of Ko does not change the process used to calculate flexural deflection.
Essentially, fle~ral deflection is simply a value that is added to the equation, but does not
change the method used to determine Ko. The fle~ral deflection results will be shown in
Chapter 6.

55
6.0 ANALYSIS OF THEORETICAL RESULTS
6.1 Introduction
The theoretical explanations of two previously neglected deflection terms were
discussed in Chapter 5. The derivation of these terms was shown and the proper method
used to calculate the new modulus of dowel support, Ko, was also shown. This chapter will
show the effects that these two deflection terms have on Ko and the bearing stress of the
concrete dowel bar interface. The results will also be discussed and the effects analyzed. A
load of 2000 pounds was used to calculate all the values shown throughout this chapter.
6.2 Slope Deflection Results
Using the method outlined in Section 5.2.3, the influence of slope deflection on
experimental results of the modulus of dowel support and the concrete bearing stress can be
deternuned. The remainder of this section will compare the effect that slope deflection has
on the modulus of dowel support, the deflection at the face of the joint, the bearing stress and
other effects.
6.2.1 Iowa Department of Transportation Results
The following section will compare the experimental data from the IDOT project with
the slope deflection modified values.
6.2.1.1 losipescu Test Method & AASHTO Shear Test Method
Table 6.1 is a listing of each unaged specimen type and the associated average
modulus of dowel support, Ko, the average slope deflection adjusted modulus of dowel
support, KoSD, and the amount of error that was introduced when neglecting the slope
deflection term. Table 6.2 shows the aged specimens values for the average modulus of

56
dowel support, Ko, the average slope deflection adjusted modulus of dowel support, KosD,
and the amount of error that was introduced when neglecting the slope deflection term.
Table 6.1 Unaged -Average modulus of dowel support, slope deflection adjusted modulus of dowel support, and associated error neglecting slope deflection ~_ _
Dowel Bar Average Ko, pci _ _
Average KosD, pci Error,
Iosipescu
1.5"~ Epoxy-Coated 772,330 803,524 -4.04
1.5" Stainless Steel 665,170 690,817 -3.86
1.5"~ Plain Steel 976,750 1,018,187 -4.24
1.5"~ GFRP 598,443 634,866 -6.09
1.75" GFRP 300,000 312,513 -4.17
Modified AASHTO
1.5"~ Epoxy-Coated 377,774 390,702 -3.42
1.5"~ Aluminum 251,13 3 261,269 -4.04
1.957"~ Aluminum 176,500 181,755 -2.98
1.5"~ Copper 355,786 369,594 -3.88
1.714"~ Copper 332,032 343,242 -3.38
1.5"~ GFRP 299,847 315,217 -5.13
1.875 ~ GFRP " 256 233 266 427 -3.98
Table 6.2 Iosipescu Test -Aged -Average modulus of dowel support, slope deflection adjusted modulus of dowel support, and associated error neglecting slope deflection
Dowel Bar Average Ko, pci Average KosD, pci Error,
1.5"~ Epoxy-Coated 704,950 732,866 -3.96
1.5"~ Stainless Steel 861,930 897,097 -4.08
1.5"~ Plain Steel 954,071 994,352 -4.22 1.5"~ GFR.P 740,432 787,701 -6.3 8
1.875"~ GFRP 303,404 316,030 -4.16

57
As shown above in Tables 6.1 and 6.2, the average modulus of dowel support, Ko, is
underestimated in every instance when the slope deflection was neglected. . The error ranges
from 2.98% to 6.3 8%. In general, the stiffer the dowel bar, the smaller the error introduced
in neglecting the slope deflection. Table 6.3 shows the error introduced on the modulus of
dowel support when neglecting slope deflection compared to the stiffness, EI, of each type of
dowel bar. Table 6.3 is arranged with the stiffest dowel bars first with more flexible dowel
bars last.
Table 6.3 Dowel material, size, stiffness, and Ko slope deflection error Material Diameter, in. EI, (106) lb-in.? Error,
Epoxy-Coated Steel 1.5 7.206 -3.81
Plain Steel 1.5 7.206 -4.23
Co er pp 1.714 7.202 -3.3 8
Aluminum 1.957 7.200 -2.98
Stainless Steel 1.5 6.95 8 -3.97
Co er pp 1.5 4.225 -3.88
GFRP 1.875 3.950 -4.07
GFRP 1.75 2.854 -4.17
Aluminum 1.5 2.4 8 5 -4.04
GFRP 1.5 1.225 -5.87
Table 6.3 indicates that, in general, the error of K.a increases as the stiffness of the
dowel bar decreases. This behavior would be appropriate since a stiffer bar would have less
overall deflection, which would result in less sloping of the dowel bar. Less sloping of the
dowel bar across the joint would result in less deflection due to slope. Furthermore, consider
that, in general, stiffer bars would have a higher Ko value than dowel bars with a lower
stiffness. When a larger K~, value is combined with a smaller overall slope deflection, a
smaller slope deflection error would be expected.

58
Table 6.4 shows each unaged specimen type and associated average deflection at the
face of the joint, yo, the average slope deflection adjusted deflection at the face of the- joint,
yosD, and the amount of error that was introduced when neglecting .the slope deflection term.
Similarly, Table 6.5 -lists each aged specimen type and associated average deflection at the
face of the 'oint, o, the avera a slope deflection adjusted deflection at the face of the joint, J Y g
yosD, and the amount of error that was introduced when neglecting slope deflection.
Table 6.4 Unaged -Average deflection at the face of the joint, slope deflection adjuste
Dowel Bar _
Average yo, in.* _
Average yosD, in.* Error,
Iosipescu
1.5" E xy-Coated ~ ~ 0.001589 0.001543 2.90
1.5"~ Stainless Steel 0.001793 0.001744 2.78
1.5 "~ Plain Steel 0.0013 34 0.001294 3.04
1.5 "~ GFRP 0.003 03 5 0.002905 4.28
1.75" GFRP 0.003634 0.003526 2.99
Modified AASHTO
1.5"~ Epoxy-Coated 0.002706 0.002639 2.47
1.5"~ Aluminum 0.004815 0.004675 2.90
1.957"~ Aluminum 0.003909 0.003825 2.16
1.5 "~ Copper 0.003 244 0.00315 3 2.79
1.714" Co er ~ pp 0.002698 0.002632 2.44
1.5"~ GFRP 0.005065 0.004881. 3.64
1.875"~ GFR.P 0.003565 0.003463 2.86
Note: The deflections cannot be measured this accurately, but are .needed to show the effects of slope deflection.
Unlike the modulus of dowel support, neglecting the slope deflection overestimates
the deflection at the face of the joint. This trend seems appropriate since a term was ignored

59
Table 6.5 Iosipescu Test -Aged -Average deflection at the face of the joint, slope deflection adjusted deflection at the face of the joint, and associated error neglecting slope deflection
Dowel Bar Average yo, in.* Average yosD, in.~ Error,
1.5"~ Epoxy-Coated 0.001701 0.001653 2.85 1.5 "~ Stainless Steel 0.001479 0.00143 6 2.93
1.5 "~ Plain Stee 1 0.0013 5 8 0.001317 3.03 1.5"~ GFRP 0.002592 0.002476 4.48
1.875"~ GFRP 0.003144 0.003050 2.98 ote: The deflections cannot be measured this accurately, but are needed to show the
effects of shear deflection.
in the equation. The total relative deflection is a known value that is developed through
experimentation. The relative deflection is equal to the deflection at the face of the joint
along with the shear deflection and possibly other terms as shown in Equation 2.8. If one
term is ignored than the portion of the deflection that was associated with the ignored term
gets incorrectly attributed to the remaining terms. This behavior explains why the deflection
at the face of the joint decreases when slope deflection is considered.
Another trend that can be seen in Tables 6.4 and 6.5 is that the error in neglecting the
deflection at the face of the joint is lower for the stiffer dowel bars. This is the same trend
that was seen with the error for the modulus of dowel support. Table 6.6 shows the error
introduced on the deflection at the face of the joint when neglecting slope deflection
compared to the stiffness, EI, of each type of dowel bar. Table 6.6 is arranged with
decreasing stiffness of the dowel bars.
As in Table 6.3, there seems to be a trend that shows the higher the stiffness of the
dowel bar the lower the error introduced into the deflection at the face of the joint. As
discussed above, the deflection at the face of the joint decreased when slope deflection was

60
considered. This trend is due to the fact that the actual slope deflection used in the
calculation was incorrectly attributed to the deflection at the face of the joint when slope
deflection was neglected, as explained previously. Since this error introduced into the
deflection at the face of the joint is directly related to the magnitude of slope deflection the
trend holds that a stiffer dowel bar would develop less slope under load. If the dowel bar will
slope less, than there will obviously be less deflection due to the slope of the dowel bar.
Table 6.6 Dowel bar material, size, stiffness, and yo slope deflection error Material Diameter, in.
_ ~. EI, (106) lb-in 2 Error,
E ox -Coated Steel p Y 1.5 7.206 2.74 Plain Steel 1.5 7.206 3.04
Copper 1.714 7.202 2.44 Aluminum 1.957 7.200 2.16
Stainless Steel 1.5 6.95 8 2.86 Copper 1.5 4.225 2.79 GFRP 1.875 3.950 2.92 GFRP 1.75 2.854 2.99
Aluminum 1.5 2.485 2.90 GFRP 1.5 1.225 4.13
The last area that needs to be reviewed is the bearing stress at the dowel bar concrete
interface. As was stated in Section 4.2.1, the bearing stress is simply the modulus of dowel
support multiplied by the deflection at the face of the joint. In this instance, multiply the
slope deflection adjusted modulus of dowel support, KoSD, times the slope deflection adjusted
deflection at the face of the joint, yosD. This product equals the slope deflection adjusted
bearing stress and is shown in Equation 6.1.
6 bSD — KoSD *yosD (6.1

61
Table 6.7 shows the average Friberg bearing stress, the average slope deflection
adjusted bearing stress and the percent error due to neglecting the slope deflection for the
unaged specimens. Similarly, Table 6.8 shows the average Friberg bearing stress, the
average slope .deflection adjusted bearing stress, and the associated error due to neglecting
the slope deflection for the aged specimens.
Table 6.7 Unaged -Average Friberg bearing stress, slope. deflection adjusted bearing stress, and associated error neglecting slope deflection
Dowel Bar Average ab, psi Average absD, psi Error, Iosipescu
1.5"~ Epoxy-Coated 1227 1240 -1.02
1.5"~ Stainless Steel 1193 1205 -0.97
1.5 "~ Plain Steel 13 03 1317 -1.07 1.5"c~ GFRP 1816 1844 -1.54
1.75"~ GFRP 1090 1102 -1.06
Modified AASHTO
1.5"~ Epoxy-Coated 1022 1031 -0.86
1.5"~ Aluminum 1209 1222 -1.02
1.957"~ Aluminum 690 695 -0.75
1.5"~ Copper 1154 1166 -0.98
1.714"~ Copper 896 903 -0.85
1.5"~ GFRP 1519 1539 -1.30
1.875"~ GFRP 913 923 -1.01
A difference in bearing. stress was expected due to a change seen in both the modulus
of dowel support and the deflection at the face of the joint. However, due to the opposite
effects on each term, the significance of the bearing stress error was unknown until the actual
values had been calculated. As was shown in Tables 6.7 and 6.8, neglecting the slope
deflection underestimates the bearing stress of the dowel bar-concrete interface for ali dowel

62
Table 6.8 Iosipescu Test -Aged Average Friberg bearing stress, slope deflection adjust
Dowel Bar Average mob, psi Average absD, psi Error,
1.5"~ Epoxy-Coated 1199 1211 -1.00 1.5"~ Stainless Steel 1275 1288 -1.03
1.5"~ Plain Steel 1296 1309 -1.06 1.5"~ GFRP 1919 1950 -1.62
1.875"~ GFRP 954 964 -1.05
bar types. The bearing stress is consistently underestimated by approximately 1 %for each
type of dowel bar.
6.2.1.2 Elemental Fatigue Test Method
As .was discussed in Section 4.2.2, this method of testing was intended to determine
the relative amount of oblonging of the hole for different types of dowel bars. The concern
of this thesis is the effect that slope deflection has on the areas previously tested at ISU.
Therefore, the results from this test method will be used to compare the effects of slope
deflections and oblonging.
The effect of slope deflection on oblonging can be explained in simple terms. The
value of significance in regard to oblonging around the dowel bar is the difference between
the zero cycle modulus of dowel support and the million-cycle modulus of dowel support.
The effect of slope deflection on the modulus of dowel support was shown in the previous
tables in this chapter. while the effect of slope deflection will change the value of the
modulus of dowel support, this change will be maintained for each value. Therefore, each
modulus of dowel support value will be altered by a similar value. ~~Thile the difference
between these values will not be identical, the relative amount will be similax and the
relationship between values maintained when slope deflection is included.

63
To illustrate the previous discussion, the aged specimens are shown in Tables 6.9 and
6.10. Table 6.9 shows the average modulus of dowel support, K~,, for zero cycles and one
million cycles, as well as the percentage difference between the two modulii. Table 6.10 will
incorporate the slope deflection and show the average slope deflection adjusted modulus of
dowel support, KoSD, for zero cycles and one. million cycles, as well as the percentage
difference between the two modulii.
Table 6.9 Aged -Average modulus of dowel support at zero cycles, average modulus of dowel support at one million cycles, percentage difference
Dowel Bar Zero Cycles One Million Cycles Difference , Average Ko ,pci
41.69 1.5"~ Epoxy- 1,570,173 646,154 1.5"~ Stainless 1,271,193 1,086,978 7.81
1.5"~ GFRP 1,512,026 1,157,819 13.27
1.875"~ GFRP 467,336 293,688 22.82
Table 6.10 Aged -Average slope adjusted modulus of dowel support at zero cycles, average s 1U~JC dU~ UJLGU tilUUUlUJ V1 UU WG1 JU~J~JVi L dl Vi1G 1ill111Vi1 t:~L1GJ, ~JGi trG11~~1.~G Ul11Gi C111:G
Dowel Bar Zero Cycles One Million Cycles Difference , Average KosD ,pci
42.00 1.5"~ Epoxy- 1,643,260 671,25 S 1.5"~ _ _ ~ _ 1,327,427 1,133,516 7.88
1.5"~ GFRP 1,623,735 _
1,239,000 13.44 1.875"~ GFRP 488,977 305,806 23.05
As illustrated in Tables 6.9 and 6.10, the percentage difference of the modulus of
dowel support over extended cycles when neglecting slope deflection is nearly identical as to
the percentage difference when considering slope deflection. Although the values of the

64
modulus of dowel support and bearing stress vary when including slope deflection, the
effects to the relationships between the values remains the same.
6.2.2 American Highway Technology Results
The following section will compare the experimental values of the AHT project to the
slope deflection modified values. As discussed in Section 4.3, the elemental direct shear
method was used to evaluate five different steel dowel bars. The AHT project was designed
to compare the modulus of dowel support and bearing stress for round dowel bars and
different sizes of steel elliptical dowel bars. In this section the effect of neglecting slope
deflection will be evaluated to determine if elliptical dowel bars are effected the same a.s
round dowel bars.
Table 6.11 shows each specimen type and the associated ,average modulus of dowel
support, Ka, the average slope deflection adjusted modulus of dowel support, KosD, and the
amount of error that was introduced when neglecting slope deflection.
Table 6.11 —Direct Shear Method -Average modulus of dowel support, slope deflection adjusted modulus of dowel support, and associated error neglecting slope deflection
Dowel Bar Average Ko, pci Average Kosn, pci Error, Round
1.5"~ Epoxy-Coated 1,897,832 1,988,508 -4.78 1.25"~ Epoxy-Coated 1,556,660 1,629,522 -4.68
Elliptical Large Elliptical Steel 1,148,216 1,202,719 -4.75
Medium Elliptical Steel 1,311,940 1,382,681 -5.39 Small Elliptical Steel 2,195,109 2,359,479 -7.49

65
As can be seen above, the percentage, of error introduced by neglecting slope
deflection seems to be comparable for round and elliptical steel dowel bars. As the bars get
smaller, the amount of error introduced increases. However, one important item about the
dowel bars is that the .large steel elliptical dowel bar and the 1.5-in. diameter round epoxy-
coated steel dowel bar have approximately the same percentage error in neglecting slope
deflection. The importance of this distinction is that a large steel elliptical dowel bar requires
mare total steel than a 1.5-in. diameter epoxy-coated dowel bar. This trend indicates that the
1.5-in. diameter epoxy-coated steel dowel bar may be more resistant to slope deflection and,
thereby, stiffer than a similarly sized steel elliptical dowel bar. Having indicated that the
round dowel bar is stiffer and less resistant to slope deflection, the overall impact on the
modulus of dowel support will be small.
As was shown in Section 6.2.1, the bearing stress is underestimated when neglecting
slope deflection effects on the dowel bar system. Table 6.12 compares the error introduced
in the bearing stresses when neglecting slope deflection for round and elliptical steel dowel
bars.
Table 6.12 —Direct Shear Method -Average Friberg bearing stress, slope deflection adju
Dowel Bar Average ab, psi Average a~D, psi Error, Round
1.5"~ Epoxy-Coated 1,545 1,564 -1.24 1.25"~ Epoxy-Coated 2,040 2,056 -0.75
Elliptical Large Elliptical Steel 1,123 1,13 7 -1.26
Medium Elliptical Steel 1,584 1,606 -1.40 Small Elliptical Steel 2,588 2,638 -1.93

~~
The slope deflection appears to have different effects on the bearing stress for the
different types of dowel bars. The elliptical dowel bars seem to be underestimated slightly
more as the elliptical dowel bars decrease in size. However, the round dowel bars appear to
have the complete opposite behavior. This difference between the types of dowel bars could
be attributed to the lack of stiffness due to the shape of the elliptical dowel bars, as was
discussed previously. This lower stiffness in the steel elliptical dowel bars could cause a
greater increase in slope deflection relative to the round dowel bars deflections across the
. . ~olnt.
The bearing stresses change a greater amount as dowel bar size increases for the steel
round dowel bars, while the opposite behavior is noticed with the steel elliptical dowel bars.
This difference in behavior suggests that there is a larger increase in all other deflections
compared to slope deflection for the steel round dowel bars. Stated another way, the slope
deflection has a larger impact on the elliptical dowel bars due to the lower stiffness that was
discussed previously.
6.3 Flexural Deflection Results
Using the procedure outlined in Section 5.3.3, the effect of flexural deflection on the
experimental results can be determined. The following section will investigate the effects
that flexural deflection has on the modulus of dowel support, Ko, the deflection at the face of
the joint, yo, the bearing stress, and other items of interest.
6.3.1 Iowa Department of Transportation Results
The following section will compare the IDOT experimental results with the flexural
deflection adjusted results.

67
6.3.1.1 Iosipescu Test Method & AAS'HTO Shear Test Method
Table 6.13 compares the unaged specimens average modulus of dowel support, K.o, with
the average flexural deflection adjusted modulus of dowel support, KoFD, and the associated
error in neglecting the flexural deflection term. Table 6.14 shows the aged specimen average
modulus of dowel support, Ko, with the average flexural deflection adjusted modulus of
dowel support, KoFD, and the associated error in neglecting the flexural deflection term.
As can readily be seen in Tables 6.13 and 6.14, the effect of the flexural. deflection on
the modulus of dowel support is negligible. The 1.5-in. diameter GFRP dowel bar shows
0.01 % of error introduced by neglecting flexural deflection. In fact, of all the dowel bars
tested in this research, the only dowel bars that show 0.01 % of error is the 1. S-in, diameter
GFRP dowel bar. All of the other dowel bars in the IDOT testing had less than 0.01 %error
introduced by neglecting the flexural deflection term.
The deflection at the face of the joint, y o, follows the exact same trend shown in
Tables 6.13 and .6.14. The deflection at the face of the joint only has 0.01 %error in
neglecting flexural deflection in the 1.5-in. diameter GFRP dowel bars. All other dowel bars
have less than 0.01 %error.
when looking at the bearing stress, none of the dowel bars have any measurable
change. Of all the different dowel bars tested in the IDOT research, using the methods
outlined above, none of the dowel bars showed any change in the. actual bearing stress value,
when considering flexural deflection.

68
Table 6.13 Unaged -Average modulus of dowel support, flexural deflection adjusted modulus of dowel. support, and associated error neglecting flexural deflection
Dowel Bar Average Ko, pci Average Kos, pci Error,. Iosipescu
1.5"~ Epoxy-Coated 772,330 772,345 0.00
1.5"~ Stainless Steel 665,170 665,185 0.00
1.5 "~ Plain. Steel 976, 75 0 976, 772 0.00 1.5"~ GFRP 598,443 598,478 -0.01
1.7 5"~ GFRP 3 00, 000 3 00, 006 0.00 Modified AA.SHT(J
1.5"~ Epoxy-Coated 377,774 377,778 0.00
1.5"~ Aluminum 251,133 251,138 0.00
1.957"~ Aluminum 176,500 176,501 0.00
1.5"~ Copper 355,786 355,792 0.00. 1.714"~ Copper 332,032 332,036 0.00
1.5"~ GFRP 299,847 299,858 0.00 1.875"~ GFRP 256,233 256,237 . 0.00
Table 6.14 Iosipescu Test -Aged -Average modulus of dowel support, flexural deflection adjusted modulus of dowel support, and associated error neglecting flexural deflection
Dowel Bar Average Ko, pci Average KoFD, pci Error,
1.5"~ Epoxy-Coated 704,950 704,963 0.00
1.5"~ Stainless Steel a
861,930 861,948 0.00
1.5"~ Plain Steel 954,071 954,042 .0.00 1.5"~ GFRP 740,432 740,483 -0.01
1.875"~ GFRP 303,404 303,409 0.00
b.3.1.2 Elemental Fatigue Test Method
As with the Iosipescu and modified AASHTO testing, the flexural deflection also has
little effect on the Elemental Fatigue testing. The modulus of dowel support, Ko, shows
0.01 % of error on the 1.5-in. diameter GFRP dowel bars, the elliptical GFRP dowel bars, the

69
shaved GFRP dowel bars, and the million cycle 1.5-in. diameter stainless steel dowel bars.
The other bars contain. less than 0.01 %error introduced by neglecting flexural deflection.
With the deflection at the face of the joint, y o , the 1.5-in. diameter stainless steel dowel
bar does not have 0.01 %error when neglecting the flexural deflection. The 1.5-in. diameter
GFRP dowel bar, the elliptical GFRP dowel bar, and the- shaved GFRP dowel bars still
contain 0.01 %error. As with the modulus of dowel support, Ko, the remaining bars also
have less than 0.01 %error with the deflection at the face of the joint.
The bearing stress is the same as in the Iosipescu and modified AASHTO testing.
Considering flexural deflection has no significant effect on bearing stress values. The
elliptical GFRP dowel bar at zero cycles is the only dowel bar with any change in the bearing
stress value. The value of the bearing stress considering flexural deflection goes up one psi
on the elliptical GFRP dowel bar at zero cycles. This small change in bearing stress is not
enough to register even a 0.01 %change. However, this research is based on a 1 /8" joint
width. An increase in joint width will cause the flexural deflection to increase at a cubic.
Therefore, more research on flexural deflection with larger joint widths is recommended.
6.3.2 American Highway Technology Results
The results indicated above are similar to the results returned in the A.HT project. In
Section 6.3.1, the results of the research compared the original values to the flexural
deflection modified values. In this section, a comparison will be made of the slope deflection
modified values to the results obtained when using the slope deflection and flexural
deflection modified values.

70
Table 6.15 shows the slope deflection adjusted modulus of dowel support, KosD,
compared to the slope deflection and flexural deflection adjusted .modulus of dowel support,
KosDFD and the associated error due to neglecting flexural deflection.
Table 6.15 --Direct Shear Method -Average slope deflection adjusted modulus of dowel support, slope and flexural deflection adjusted modulus of dowel support, and associated error ne~lectin~ flexural deflection
Dowel Bar ~, Average Kosn, pci Average KosDFD, pci Error,
Round
1.5"~ Epoxy-Coated ; 1,988,508 1,988,584 0.00
1.25"~ Epoxy-Coated 1
1,629,522 1,629,601 0.00
Elliptical Large Elliptical Steel 1,202,719 1,202,759 0.00
Medium Elliptical Steel 1,382,681 1,382,755 0.00
Small Elliptical Steel 2,359,479 2,359,805 0.00
As in Section 6.3.1, the difference introduced into the values is insignificant. The values
returned in the AHT research indicate that there was no change introduced even when
measured to the one-hundredth of a percent. When comparing the changes made t0 the
associated bearing stresses, there is also no difference. No dowel bar in the AHT research
showed any change in bearing stress when considering flexural deflection. Including the
effects of flexural deflection is even less significant when slope deflection is included. This
trend does follow expectations, because including slope deflection into the equation increases
the values of both the modulus of dowel support and the bearing stress.

71
7.0 SUMMARY, CONCLUSIONS AND RECOMENDATIONS
7.1 Summary
Theoretical calculations were done to compaze the effects of slope deflection and
flexural deflection on a dowel bar-concrete system, Calculations compared the effects on the
modulus of dowel support, the deflection at the face of the joint, and concrete bearing stress.
The following section provides a summary of the effects, and later sections provide
conclusions and recommendations.
7.1.1 Slope Deflection Summary
The modulus of dowel support showed the largest change when slope deflection was
included in the calculation. The addition of slope deflection increased the modulus of dowel
support by approximately 3-6%. The addition of slope deflection decreased the deflection at
the face of the joint by approximately 3-4%. This decrease in the deflection of the joint
seems appropriate considering that another term is added to the equation used to determine
the total relative deflection. The total relative deflection is a fixed value for each dowel bar
determined through experimentation. The more terms that make up the relative deflection,
the less each term would contribute.
The final area measured was the concrete beazing stress. The modulus of dowel
support and the deflection at the face of the joint varied more than the beazing stress. The
effects on the modulus of dowel support and the deflection at the face of the joint were both
in opposite directions; one increased while the other decreased, respectively. Since the
modulus of dowel support and the deflection at the face of the joint are directly applied to
determine the bearing stress, the result was only an increase of approximately 1 %for each
dowel bar.

72
Another trend that was seen in the theoretical analysis is related to the dowel bar
stiffness. In general, a stiffer dowel bar had a smaller change in all categories. This trend
could especially be seen in smaller GFRP dowel bars. The more work that is done with
GFRP dowel bars, the more important considering slope deflection becomes.
One last important consideration that was not tested in this research, is the effect joint
width has when determining slope deflection. . One variable in the slope deflection term is the
joint width, z. The other variable is directly related to slope deflection, which was derived
earlier in this paper. Since slope deflection is dependent on the joint width,. an increase in
joint width will likely cause the slope deflection to increase as well. However, the exact
amount of increase in slope deflection cannot be estimated. The effect of joint width can
only be determined through experimentation due to the slope deflection terms association
with the ~3 variable.
7.1.2 Flexural Deflection Summary
When considering flexural deflection, there was virtually no change in the modulus
of dowel support, the deflection at the face at the joint, or the concrete bearing stress. The
1.5-in. diameter GFRP dowel bar had a change of 0.01 %, but the other dowel bars showed no
change at all. The small change in the GFRP dowel bar, 0.01 %change, is so insignificant
that experimental data cannot be recorded accurately enough to track this change. The
flexural deflection for the experimental results had very little impact.
One final consideration is the effect of joint width on flexural deflection. The
flexural deflection term is calculated by cubing the joint width, z. Therefore, any increase in
joint width will have a substantial effect on flexural deflection. For example, in this research,
a joint width of 1 /8 in. was used to replicate a contraction joint. If a 1 /2-in. joint width was

73
used to replicate an expansion joint, the flexural deflection would be 64 times greater than
the flexural deflection of the 1/8-in. contraction joint. This example shows what a dramatic
effect joint width has on the flexural deflection term.
7.2 Conclusions
The relationships outlined throughout this research, in regards to the effects of slope
deflection and flexural deflection, may best be shown in the following table. Table 7.1
shows the associated deflections fora 1.5-in. diameter epoxy-coated dowel bar, a 1.5-in.
diameter GFIZP dowel bar, and a medium elliptical steel dowel bar. The deflections are
arranged starting with the largest values and going to the smallest values.
In Table 7.1, the significance of each deflection term relative to the others can easily
be seen. The flexural deflection is approximately half of the next closest deflection term.
This small deflection value indicates why almost no effect was seen on the modulus of dowel
support and the concrete bearing stress. Another interesting item that can be seen above is
that in the two round dowel bars, the shear deflection is greater than the slope deflection
value. However, in the elliptical dowel bar, the slope deflection has a slightly larger value
than the shear deflection. This -trend clearly indicates that other deflections need to be
considered as alternative dowel bar shapes are being investigated.
The following conclusions can be made about contraction joints with a 1/8-in. gap
based on the research discussed previously.
• Friberg's addition of the bar width, b, in the Beta term causes the bearing stress value to be assumed constant across the entire bar width.
• Slope deflection value is similar to shear deflection for all the dowel bars used in this research.
• Slope deflection has a slightly larger effect on elliptical and GFRP dowel bars.

74
• Neglecting slope deflection caused the modulus of dowel support and the concrete bearing stress to be underestimated. while the overall effect on the modulus of dowel support and concrete bearing stress were not significant for the dowel bars used in this research, this effect may not be the case for dowel bars of all shapes, materials, and sizes.
• Neglecting slope deflection in previous research had no effect on the trends that were noted. However, the actual values may vaxy slightly from what was reported.
• Flexural deflection was shown to have an insignificant effect on the previously reported research values.
Table 7.1 —Total relative deflection, deflection at the face of the joint, shear deflection, slope deflection, and flexural deflection
3 1.5"~ Epos- Coated 1.5 ~ GFR.P Medium
Elhpt~cal Steel
Total Relative Deflection, ~, m.
'
l 2.64 E-03 3.73 E-03 2.43 E-03
Deflection at the face • of the ~ omt, y~, m.
N
1.26 E-03 1.45 E-03 1.16 E-03
Shear Deflection, ~, . in.* 2.01 E-OS 6.81 E-04 1.68 E-OS
Slope
z
Deflection, dyo , m. ~ 1.01 E-04 1.44 E-04 9.64 E-OS dx
Flexural Deflection, Pz3 i ,~
n. ~_
9.3 7 E-08 2.66 E-07 9.5 S E-08 12EI
* Deflections cannot be measured this accurately but are shown for informational purposes
7.3 Recommendations
The following areas are recommended for further study:
• Investigate the appropriateness of the addition of the bar width in the Friberg deflection equations. The bar width assumes that the bearing stress is equally distributed across the bar width. This effect needs to be checked to _verify if
75
accurate for round dowel bars, as well as alternatively shaped dowel bars. The investigation should also check the effect on other GFR.P and steel dowel bars.
• The effect of joint width on flexural deflection should be studied further. As shown previously, flexural deflection is such a small amount of deflection for contraction joints. However, as the joint width increases the flexural deflection increases by a cubic. Therefore, a small change in joint width could significantly increase the flexural deflection.
• The effect of joint width on form factor should also be investigated further. With the small 1l8" joint width used in this research the form .factor had little effect on the overall values of modulus of dowel. support, deflection at the face of the joint and concrete bearing stress. However, if the joint width changes the form factors could potentially influence the values studied.
• Movement of the dowel bar can occur during the construction process. One possible outcome is that the dowel bar can become "sloped" across the pavement joint prior to the curing of the concrete. The effect of a dowel bar that is installed sloped across the pavement joint should also be studied. The effect that a sloped dowel bar has on the overall deflection and, more specifically, the slope deflection should be implemented..

76
REFERENCES
1. Federal Highway Administration. Highway Statistics 2000. National Highway System Length -- 2000; Miles by Functional System (Table HM-4~), Retrieved May 3, 2003, firom http://vv~~vw.fhwa.dot.gov/ohim/hs00/1un41.htm.
2. Federal Highway Administration. Highway Statistics 2000. Federal Aid Highway Length — 2000; Miles by Type of Surface (Table HM-31). Retrieved May 3, 2003, from http://v~wvw. fhwa. dot. gov/ohim/hs00/hm3 l .htm.
3. Federal Highway Administration. Status of the Nation's Highways, Bridges, and Transit: 2002 Conditions and Performance Report to Congress. Comparison of System Conditions Statistics with Those in the 1999 Report (Exhibit 3-1). Retrieved May 3, 2003, from http://www. fhwa. dot. gov/policy/2002cpr/chi .htm.
4. Iowa Department of Transportation. Standard Road Plans, RH Series Rigid Pavements and Associated Work. Non-Reinforced Four-Lane 53 foot P. C. Concrete Pavement. Retrieved May 4, 2003, from flp://165.206.203.34/design/stdrdpin/english/erh47b.pdf.
5. Guinn, R. J. Assessment of Highway Pavement Slab Dowel Bar Research. Masters Thesis. Ames, IA, Iowa State University, 2002.
6. Timo shenko, S. and J.M. Lessels. Applied Elasticity. Westinghouse Technical Night School Press, East Pittsburgh, Pennsylvania, 1925.
7. .Bradbury, R.D. Design of Joints in Concrete Pavements. Proceedings, 12 h̀ Annual Meeting o., f the Highway Research Board, pp. 105-141, Washington D.C., 1932.
8. Timoshenko, S. Strength of Materials- Part Il. Robert E. Krieger Publishing Co., Inc, Huntington, NY, 1976.
9. Friberg, B.F. Design of Dowels in Transverse Joints of Concrete Pavements. Transactions, American Society of Civil Engineers. Vol. 105, No. 2081, 1940.
10. Albertson, M.D. Fibersomposite and Steel Pavement Dowels. Masters Thesis. Ames, IA, Iowa State University, 1992.
11. Porter, M.L., M. Alberston, B. Barnes, E. Lorenz, and K. Viswanath. Thermoset Composite Concrete Reinforcement. Report HR-32S Submitted to Project Development Division of the Iowa Department of Transportation and Iowa Highway Research Board. Ames, IA, May 1992.

77
12. Porter, M.L., D. Davis, R. Guinn, A. Lundy and J. Rohner. Investigation of Glass Fiber Composite Dowel Bars for Highway Pavement Slabs. Report TR-408 Submitted to Project Development Division of the Iowa Department of Transportation and Iowa Highway Research Board. Ames, IA, June 2001.
13. Serra-Conrads, L. Structural Analysis Considering Shear Deformations. Masters Thesis. Ames, IA, Iowa State University, 1962.
14. Young, W.C., Roark's Formulas for Stress and Strain, Sixth Edition. McGraw-Hill, Inc., New York, NY, 1989.
15. ACI Committee 325. Structural Design Considerations for Pavement Joints. Journal of the American Concrete Institute, Vol. 28, No. 1, July 1956, pp. 1-28.
16. Porter, M.L., R. Guinn, and A. Lundy. Dowel Bar Optimization: Phases I and II, Final Report. Submitted to American Highway Technology, Center for Transportion Research and Education, and the Center for Portland Cement Concrete Pavement Technology. Ames, IA, Iowa State Universsty, 2001.
17. Walrath, D.E., and Adams, D.F., The Iosipescu Shear Test as Applied to Composite .Materials. Experimental Mechanics, pg. 105-110, Brookfield. Center, CT, March 1983.
18. American Association of State Highway and Transportation Officials (AASHTO). AASHTO Guide for Design of Pavement Structures. AASHTO, Washignton, D.C., 1993.
19. Rohner, J.G. Investigation of the Modulus of Dowel Support in Concrete Pavements. Masters Thesis. Ames, IA, Iowa State University, 1999.
20. Boris, T.A. Performance of Glass Fiber Reinforced Polymer Reinforcements in Simulated Concrete Environments. Masters Thesis. Ames, IA, Iowa State University, 1999.
21. Ugural, A.C., and Fenster, S.K., Advanced Strength and Applied Elasticity, 3rd edition. Prentice-Hall, Inc., Upper Saddle River, NJ, 1995.
22. Porter, M.L., B. Barnes, B. Hughes, and K. Viswanath. Non-Corrosive Tie Reinforcing and Dowel Bars for Highway Pavement Slabs. Final Report HR-343 Submitted to Highway Division of the Iowa Department of Transportation and Iowa Highway Research Board. Ames, IA, November 1993.
23. Porter, M.L., D. Davis, and J. Rohner. Investigation of Glass Fiber Composite Dowel Bars for Highway Pavement Slabs. Progress Report TR-408 Submitted to Project Development Division of the Iowa Department of Transportation and Iowa Highway Research Board. Ames, IA, January 1999.

~g
ACKNOWLEDGEMENTS
The research described herein was conducted at the Iowa State University Structural
Engineering Laboratories in the Department of Civil and Construction Engineering through
the promising success of the Engineering Research Institute and sponsored by the Highway
Division of the Iowa Department of Transportation (IDOT), the Center for Transportation
Research and Education (GYRE), the Center for Portland Cement Concrete Pavement (PCC
Center), and American Highway Technology (AHT). The author would like to thank the
personnel at the IDOT and AHT who provided support through their experience and
knowledge toward the project, namely, Mark Dunn (IDOT) and Steven L. Tritsch (AHT).
The author would especially like to thank Dr. M~ Porter for allowing the opportunity
to work on this research project. The author would also like to thank all of those involved for
their efforts, but special thanks are given to Dr. Jim Cable who provided support through his
expertise and knowledge toward the project and Dale Harrington, Director of the PCC
Center, for his project administration leadership.
The author would also like to recognize and thank several firms for providing
materials, services, and advice, including: Doug Gremel from Hughes Brothers, Inc. of
Seward, Nebraska; James P. McCallion from RJD Industries, Inc. of Laguna Hills,
California; and Technical Services, Inc. of Ames, Iowa.
The author would also like to acknowledge the support provided by Douglas L.
Wood, Structural Engineering Laboratory Supervisor, for his expertise and assistance.


![Slope Deflection Method[1]](https://img.pdfslide.us/doc/110x75/5571fe4449795991699b02b5/slope-deflection-method1.jpg)