Embed Size (px)
Citation preview
THE EFFECTS OF PERCEIVED OVERQUALIFICATION ON JOB SATISFACTION, ORGANIZATIONAL COMMITMENT, AND
TURNOVER: A STUDY OF AFIT GRADUATES
THESIS
Thomas E. Hoskins, Captain, USAF
AFIT/GAQ/ENG/03-01
DEPARTMENT OF THE AIR FORCE AIR UNIVERSITY
AIR FORCE INSTITUTE OF TECHNOLOGY
Wright-Patterson Air Force Base, Ohio
APPROVED FOR PUBLIC RELEASE; DISTRIBUTION UNLIMITED.
The views expressed in this thesis are those of the author and do not reflect the official policy or position of the United States Air Force, Department of Defense, or the United States Government.
AFIT/GAQ/ENG/03-01
THE EFFECTS OF PERCEIVED OVERQUALIFICATION ON JOB SATISFACTION, ORGANIZATIONAL COMMITMENT, AND TURNOVER: A
STUDY OF AFIT GRADUATES
THESIS
Presented to the Faculty
Department of Electrical and Computer Engineering
Graduate School of Engineering and Management
Air Force Institute of Technology
Air University
Air Education and Training Command
In Partial Fulfillment of the Requirements for the
Degree of Master of Science in Acquisition Management
Thomas E. Hoskins, B.A.
Captain, USAF
March 2003
APPROVED FOR PUBLIC RELEASE; DISTRIBUTION UNLIMITED.
AFIT/GAQ/ENG/03-01
THE EFFECTS OF PERCEIVED OVERQUALIFICATION ON JOB SATISFACTION, ORGANIZATIONAL COMMITMENT, AND TURNOVER: A
STUDY OF AFIT GRADUATES
Thomas E. Hoskins, B.A. Captain, USAF
Approved: ____________//signed// ______________ 15 Mar 03 Mikel Miller, LtCol, USAF (Chairman) date ____________//signed// __________ 15 Mar 03 Timothy Reed, Maj, USAF (Member) date
iv
Acknowledgments
I would like to thank LtCol Mikel Miller, Major Tim Reed, and Dr. Gloria Jones-
Johnson for their assistance in conducting this research. I would like to thank Kevin
Rankin for his assistance in conducting the survey. I would also like to thank those who
took the time to participate in the survey. Their participation was a vital part of this
research effort, without which this study could not have been completed. Finally, I
would like to thank my family for their unceasing support, patience, and understanding
during my time here at AFIT. They have been truly wonderful in allowing me the time
necessary to complete this effort.
Thomas E. Hoskins
v
Table of Contents Page
Acknowledgments.............................................................................................................. iv List of Tables .................................................................................................................... vii Abstract .............................................................................................................................. ix I. Introduction ..................................................................................................................... 1
Chapter Overview ....................................................................................................... 1 Background................................................................................................................. 1 Problem....................................................................................................................... 2 Scope........................................................................................................................... 3 Variables ..................................................................................................................... 4 Research Objectives.................................................................................................... 6 Research Questions..................................................................................................... 7 Scope and Limitations of the Research....................................................................... 7 Methodology............................................................................................................... 8 Expected Gain............................................................................................................. 9 Scope and Limitations of the Research....................................................................... 9
II. Literature Review......................................................................................................... 10
Introduction............................................................................................................... 10 Job Satisfaction and Turnover .................................................................................. 11 Job Descriptive Index (JDI) ...................................................................................... 13 Perceived Overqualification (POQ).......................................................................... 15 Match Quality and Overeducation ............................................................................ 16 Organizational Commitment..................................................................................... 20 Summary of Basic Conclusions ................................................................................ 21
III. Methodology............................................................................................................... 23
Independent Variables .............................................................................................. 23 Dependent Variables................................................................................................. 24 Survey and Data Collection ...................................................................................... 26 Population and Sampling Frame............................................................................... 28 Hypotheses................................................................................................................ 30 Data Analysis ............................................................................................................ 31 Limitations of Design ............................................................................................... 33
IV. Results......................................................................................................................... 34
Demographic Characteristics .................................................................................... 34
vi
Page
Perceived Overqualification Scores.......................................................................... 44 Job Descriptive Index Scores and Organizational Commitment .............................. 45 Hypothesis Testing.................................................................................................... 46 Summary ................................................................................................................... 71
V. Discussion and Reommendations ................................................................................ 72
Results....................................................................................................................... 72 Recommendations..................................................................................................... 76 Benefits and Contributions of Research ................................................................... 77 Limitations ................................................................................................................ 78 Opportunities for Research ....................................................................................... 80 Conclusion ................................................................................................................ 81
Attachment 1..................................................................................................................... 82 Attachment 2..................................................................................................................... 92 Bibliography ................................................................................................................... 100 Vita.................................................................................................................................. 102
vii
List of Tables
Page
Table 1. Respondents' Rank............................................................................................. 35
Table 2. Respondents' Years in Service (Tenure)............................................................ 36
Table 3. Respondents' Age............................................................................................... 37
Table 4. Respondents' Sex ............................................................................................... 37
Table 5. Respondents' Ethnic Background ...................................................................... 38
Table 6. Respondents' Marital Status............................................................................... 38
Table 7. Respondents' Air Force Specialty Code (AFSC)............................................... 39
Table 8. Repondents' Years in Current AFSC ................................................................. 40
Table 9. Respondents' Experience Prior to AFIT ............................................................ 41
Table 10. Respondents' Years Between Undergraduate Degree and AFIT..................... 42
Table 11. Respondents' Year of Graduation .................................................................... 43
Table 12. Respondents' Eligibility to Separate ................................................................ 44
Table 13. Perceived Overqualification and Job Satisfaction ........................................... 48
Table 14. Perceived Overqualification and Job Satisfaction (Group 1) .......................... 49
Table 15. Perceived Overqualification and Job Satisfaction (Group 2) .......................... 50
Table 16. Perceived Overqualification and Job Satisfaction (Group 3) .......................... 51
Table 17. Perceived Overqualification and Commitment................................................ 52
Table 18. Perceived Overqualification and Commitment (Group 1)............................... 53
Table 19. Perceived Overqualification and Commitment (Group 1) cont....................... 54
Table 20. Perceived Overqualification and Commitment (Group 2)............................... 55
viii
Page
Table 21. Perceived Overqualification and Commitment (Group 3)............................... 56
Table 22. Perceived Overqualification and Dimensions of Job Satisfaction.................... 58
Table 23. Perceived Overqualification and Dimensions of Job Satisfaction cont. .......... 59
Table 24. Intent to Leave and Perceived No-Grow ......................................................... 61
Table 25. Intent to Leave and Perceived Mismatch......................................................... 62
Table 26. Effort to Seek Job Outside the Air Force and Perceived No-Grow................. 64
Table 27. Effort to Seek Job Outside the Air Force and Perceived Mismatch ................ 65
Table 28. Efforts to Search for Job Within the Air Force and Perceived No-Grow........ 67
Table 29. Effort to Search for Job Within the Air Force and Perceived No-Grow ......... 68
Table 30. Intent to Stay 20 Years and Perceived No-Grow............................................. 70
Table 31. Intent to Stay 20 Years and Perceived Mismatch ............................................ 71
Table 32. Summary of Hypotheses Test Results ............................................................. 73
ix
AFIT/GAQ/ENG/03-01
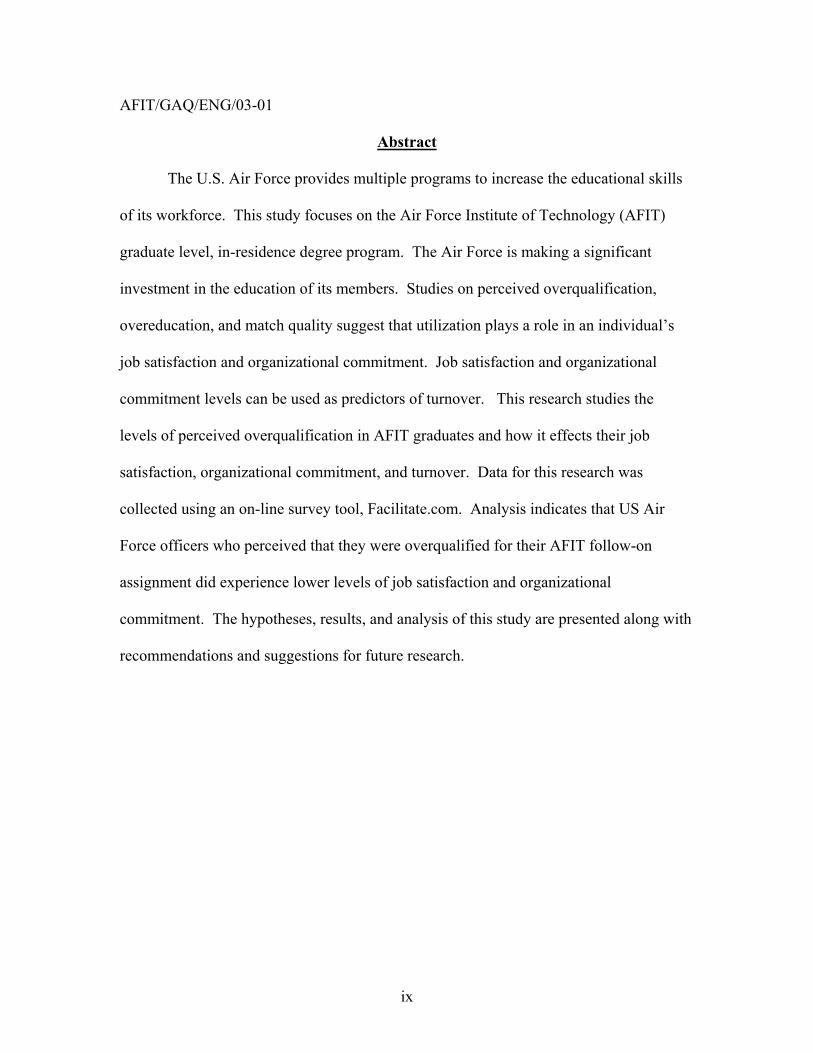
Abstract
The U.S. Air Force provides multiple programs to increase the educational skills
of its workforce. This study focuses on the Air Force Institute of Technology (AFIT)
graduate level, in-residence degree program. The Air Force is making a significant
investment in the education of its members. Studies on perceived overqualification,
overeducation, and match quality suggest that utilization plays a role in an individual’s
job satisfaction and organizational commitment. Job satisfaction and organizational
commitment levels can be used as predictors of turnover. This research studies the
levels of perceived overqualification in AFIT graduates and how it effects their job
satisfaction, organizational commitment, and turnover. Data for this research was
collected using an on-line survey tool, Facilitate.com. Analysis indicates that US Air
Force officers who perceived that they were overqualified for their AFIT follow-on
assignment did experience lower levels of job satisfaction and organizational
commitment. The hypotheses, results, and analysis of this study are presented along with
recommendations and suggestions for future research.
1
THE EFFECTS OF PERCEIVED OVERQUALIFICATION ON JOB SATISFACTION, ORGANIZATIONAL COMMITMENT, AND TURNOVER: A
STUDY OF AFIT GRADUATES
I. Introduction
Chapter Overview This chapter describes the fundamental motivation for my research. It provides
background information to explain the history of the subject, the problem statement, the
scope of the research, the variables of interest, an explanation of the research objectives,
the primary research questions, and a brief introduction to the hypotheses. It concludes
with a brief description of the methodology used, the expected gain, and other support.
Background
The welfare of workers ties to the welfare of the organization. This statement has
been the catalyst for many human resource studies. Human resources must not only be
obtained but also retained. Firms have recognized the importance of retaining the current
workforce. Retaining an existing worker is far more cost effective than hiring and
training a new one. Many firms have instituted extensive employee education programs
as a non-monetary benefit for the development of their employees. Employees can
further their education and increase their qualifications through these programs. Many
firms establish these programs assuming that the firm will benefit from the increases in
workforce education. Are employers realizing the benefits from the education programs
in which they anticipate?
2
Firms are making significant investments in their employees. Some firms
encourage additional education by provide partial reimbursement, while others provide
full reimbursement. The Air Force (AF) provides multiple education programs
encouraging education. One such program, the Air Force Institute of Technology (AFIT)
provides graduate education to Department of Defense members. More than 100 students
per year attend AFIT full time. The program is provided at no charge to the student.
While in attendance, students continue to receive their salary. The costs to the AF are
significant. This is only one of the many programs provided by the Air Force.
The skilled individual that emerges from one of these programs also must be
retained and utilized. Every employer wants to utilize its skilled employees to the
maximum degree possible. This is not only good business sense but how an organization
utilizes these resources has a direct impact on the retention of the resource. Studies on
perceived overqualification, overeducation, and match quality have shown that poor
utilization of resources affects the turnover of resources. Understanding the effects of
these variables may present opportunities for organizations to improve the retention of
this group and make informed decisions concerning employee education and placement.
Problem
The Air Force is offering multiple education programs to increase the educational
skills of its workforce. This study focuses on the Air Force Institute of Technology
(AFIT) and its in-residence program. Retention of the workforce in general continues to
be an issue of focus within the Air Force. There have been many studies focusing on
3
specific areas of retention such as pilots, engineers, and scientists. This study will
attempt to test hypotheses derived from extant research in concerns with utilization of
employees to determine the effects of an employee education program on job satisfaction,
commitment, and turnover. The effects of underutilization, such as perceived
overqualification, overeducation, and poor match quality, on job satisfaction and turnover
are well documented. Are these new resources being utilized or may underutilization of
these resources add to the retention problems of the Air Force? Within the AFIT sample:
1. Are there significant levels of perceived overqualification amongst AFIT graduates?
2. Do the levels of perceived overqualification correlate to reduced job satisfaction and
lower organizational commitment?
3. Do the levels of job satisfaction and organizational commitment correlate to higher
turnover within the group?
Scope
There have been extensive studies on the effects of match quality, perceived
overqualification, and overeducation on job satisfaction, and retention. Job matching is a
process that attempts to match a person’s qualifications, such as educational attainment
and experience, with the requirements for adequate performance of the job. Match
quality refers to the success of this process. Perceived overqualification occurs when an
individual believes that his or her skill set exceeds the requirements of the job (Johnson
and Johnson, 2001). Overeducation refers to the possession by the worker of educational
attainment in excess of the educational requirements of a job. Research shows that match
quality, perceived overqualification, and overeducation affect job satisfaction,
4
organizational commitment, and turnover (e.g. Hersch, 1991; Johnson and Johnson,
2001; Tsang, 1985 and 1987).
This study will focus on an employee education program. The program to be
studied will be the Air Force AFIT in-residence program. The AFIT program provides a
sample in which pay and promotion are relatively constant. Participant’s pay and
promotion are based on time in grade and is relatively standardized. This study will be
testing the generalizability of perceived overqualification theory on this new sample. The
testing will be accomplished using two generally accepted theories of turnover, job
satisfaction and organizational commitment.
Variables
The following is a summation of the demographic, independent, and dependent
variable collected from each participant. This collection of variables was used to develop
the research questions to follow.
Demographic Variable. Thirteen demographic variables were collected for each
participant in this study. They are as follows:
1. Rank.
2. Total Years in Service (Tenure).
3. Age.
4. Sex.
5. Race.
5
6. Education Level.
7. Marital Status.
8. Air Force Specialty Code (AFSC).
9. Experience in career field (AFSC).
10. Experience prior to attending AFIT.
11. Years between undergraduate and AFIT participation.
12. Year of Graduation.
13. Eligibility to separate from the Air Force.
Independent Variable. Two independent variables were collected for each
participant in this study. They are as follows:
1. Perceived Mismatch Index.
2. Perceived No Growth Index.
Perceived no-grow and perceived mismatch are defined by Johnson and Johnson (2000 a
& b) in their research on perceived overqualification and job satisfaction.
Dependent Variables. Four dependent variables were collected for each
participant in this study. They are as follows:
1. Work Satisfaction Index.
2. Supervision Satisfaction Index.
3. Pay Satisfaction Index.
4. Promotion Satisfaction Index.
5. Organizational Commitment Index.
6
6. Turnover intent.
7. Efforts to find new job outside the Air Force.
8. Efforts to find a new job within the Air Force.
9. Intent to stay until retirement.
All of the independent variables use indices that have been defined in previous
research. The Work, Supervision, Pay and Promotion Satisfaction Indexes were taken
from the Job Description Index defined by Smith, Kendall, and Hulin (1969) in their
research on job satisfaction. The Organizational Commitment Index was defined by
Porter, Steers, and Mowday (1974) in their research on organizational commitment and
turnover.
Research Objectives
Based on the literature review and the problem statement the following research
objectives were developed:
1. Describe and report the demographic, perceived overqualification levels,
organizational commitment levels, and job satisfaction levels of the AFIT graduate.
2. Determine if the correlations between perceived overqualification and organizational
commitment and job satisfaction for this population are consistent with those described in
pervious research.
3. Describe and report the relationships between the demographic variables and the
dependent variables.
7
4. Determine the correlation between the independent variables and the dependent
variables.
Research Questions
The following research questions will be addressed in this study:
1. Are the results of research on perceived overqualification generalizible to this
population?
2. How does job satisfaction and organizational commitment relate to turnover?
3. Which independent variables are the best predictors of turnover intent?
4. Which independent variables are the best predictors of efforts to find a new job?
5. Which independent variables are the best predictors of remaining until retirement?
Scope and Limitations of the Research
The following research hypotheses are developed from the literature review in
chapter 2. They are presented here for the purpose of introduction to the research.
Hypothesis 1. Graduates who report higher levels of POQ report lower levels of
job satisfaction.
Hypothesis 2. Graduates who report higher levels of POQ report lower levels of
commitment.
Hypothesis 3. Graduates who report higher levels of POQ report lower levels of
satisfaction with work than other JDI factors. Pay and promotion are held relatively
constant for this population sample.
8
Hypothesis 4. Graduates who turnover intent report higher levels of POQ.
Hypothesis 5. Graduates who report intent to search for a job with another
employer report higher levels of POQ.
Hypothesis 6. Graduates who report intent to search for a job within the Air
Force report higher levels of POQ.
Hypothesis 7. Graduates who report intent to stay 20 years in the Air Force report
lower levels of POQ.
Methodology
This study is a deductive study. These hypotheses are based on assumption from
previous research. This study intends to test these assumptions within the scope of an
employee education program.
This research will use cross-sectional data. Cross-sectional data will be collected
with a surveys measuring job satisfaction, organizational commitment, quit intention, and
perceived overqualification. The surveys will be administered to a sample of graduates
of the AFIT in-residence programs. The data collected will be analyzed using regression
and analysis of variance.
9
Expected Gain
It is expected that the results of this research will support the findings of pervious
research on perceived overqualification within this population. For the AF sample, it is
hypothesized that for the AFIT participants that experience higher levels of perceived
overqualification will experience lower levels of job satisfaction and lower levels of
organizational commitment. The lower levels of job satisfaction and organizational
commitment are expected to correlate to increased turnover intent, effort to find a new
job, and intent to stay 20 years.
Scope and Limitations of the Research
Dr. Gloria Jones Johnson, professor of sociology, Iowa State University, has done
extensive studies on perceived overqualification. Her contributions to the field are well
documented. She will be acting as a reader on the research committee and has offered
her assistance and resources. With her guidance, this research seeks to make a
meaningful contribution to the current body of knowledge.
The chapters that follow present: the findings of an in depth literature review
(chapter 2), the research methodology utilized (chapter 3), the results of the data
collection (chapter 4), and finally the analysis of the results, conclusions, and
recommendations (chapter 5).
10
II. Literature Review
Introduction
In business today, organizations are competing for resources. An organization’s
ability to obtain resources in the competitive market can determine the organization’s
success or failure. Employees are one resource that companies must not only obtain but
also retain. Competition for skilled workers has increased and obtaining and retaining
workers with the right skills mix has become increasingly difficult. Employers must
recognize the importance of matching an employee’s skills with his or her job and its
effects on job satisfaction and retention.
The Air Force has recognized the importance of retaining its workforce. The Air
Force Personnel Center (AFPC) tracks workforce retention and conducts studies to
understand turnover in the Air Force. The Air Force has also instituted a number of
incentives; such as enlistment bonuses for enlisted personnel, fight pay for pilots,
professional pay for critical career fields, and pay restructuring to improve retention. The
Air Force has also identified a need for more advance degrees in the workforce. The Air
Force has made a significant investment in these degree programs, such as AFIT, to
encourage the education of its workforce. This investment looks to increase as the Air
Force proceeds with new initiatives to increase the number of advance degrees. To
protect its investment, the Air Force must recognize that it is competing for resources
within the labor market and the effects of perceived overqualification and matching an
11
employee’s skill with his or her job can affect job satisfaction, commitment, and
turnover.
Match quality affects job satisfaction (Hersch, 1991). Perceived overqualification
has been shown to affect personal job satisfaction negatively (Johnson and Johnson,
2000). Perceived overqualification occurs when an individual believes that his or her
skill set exceeds the required qualifications of the job (Johnson & Johnson, 2000).
Mismatches due to overeducation or perceived overqualification encourage individuals to
search for a better job match, and that search may cause the individual to leave the firm
once a better match is found.
This chapter reviews the current state of research in the areas of job satisfaction,
perceived overqualification, match quality and overeducation, and organizational
commitment as they affect job retention. Content analysis of the research in each area
listed above identifies linkages between the constructs. Based on collective findings, I
develop hypotheses that improving match quality to reduce the occurrences of
overeducation and reducing perceived overqualification in the workforce would improve
job satisfaction and organizational commitment and thus improve retention.
Job Satisfaction and Turnover
Job satisfaction is the perception a worker has about his job. It can be expanded
to include the perception a worker has for individual aspects of the job. Job satisfaction
12
may be influenced by many variables. Herzberg’s motivation-hygiene theory identified
two components of job satisfaction; intrinsic motivators and extrinsic dissatisfiers, or
hygiene factors (Herzberg, 1967). Some intrinsic motivators include factors such as
achievement, growth opportunities, advancement opportunities, responsibility,
meaningful work, and recognition. These are motivators but when not present do not
cause high dissatisfaction. Extrinsic dissatisfiers include things such as pay, benefits,
working conditions, policies, and procedures. Dissatisfiers do not motivate but if not met
result in employee dissatisfaction. Herzberg (1967) stated the employers must meet and
maintain a level of what he termed “no dissatisfaction.”
Turnover is defined as the voluntary act of quitting by employees. Turnover is
costly to an organization. Employers lose their training investment in an employee as
well as incur cost associated with the recruitment and hiring of the replacement worker.
Mobley (1977) in his development of Turnover Decision Process Model found that there
was a strong correlation between the intent to quit and turnover and the intent to quit is
the immediate precursor to actual quitting (Mobley and others, 1978).
In the Lee, Mitchell, Holtom, McDaniel and Hill (1999) voluntary turnover study,
job satisfaction was identified as a major component of the turnover model. Low job
satisfaction, as defined in the turnover model, occurs when a job no longer meets an
individual’s required intellectual, emotional, or financial needs. Low job satisfaction
usually develops over an extended time period, allowing a manager to anticipate and
focus on preventing turnover.
13
In a study of quit data, Clark (2001) found that job satisfaction responses are
significantly correlated with future separation and quit probability. He states that “job
satisfaction data is a powerful predictor of both separation and quit, even controlling for
wages, hours and standard demographic and job variables” (Clark, 2001: 223). Using the
quit data from 10,000 individuals in 5500 British households, he identified the aspects of
a job that most likely induce separation and quit. He found seven dominant job
satisfaction measurements;
1. Job security.
2. Pay.
3. Use of initiative.
4. Relations with supervisors,
5. The work itself,
6. Promotion opportunities,
7. Hours of work.
Clark (2001) also advocates the use of job satisfaction as a suitable index of a poor job
match.
Job Descriptive Index (JDI)
The JDI was developed by Smith, Kendall, and Hulin and is presented in their
book, The Measurement of Satisfaction in Work and Retirement. In this book they
establish the JDI for use as a “generally applicable series of measurements of
satisfaction” (Smith, Kendall, Hulin, 1969: 10). Many studies have shown that job
satisfaction is comprised of multiple factors. Using a single measure of job satisfaction
14
may allow other factors to influence the results and create measurement errors. This can
be overcome by using multiple measures. The JDI uses five measures of different
aspects of a job:
1. Satisfaction with the work itself.
2. Satisfaction with supervision.
3. Satisfaction with work.
4. Satisfaction with pay.
5. Satisfaction with other workers on the job.
To measure each aspect, a series of negative and positive adjective
statements are presented to the respondent who answer yes, no, or undecided.
Each answer is scored based on the response. A yes response to a positive item
and a no response to a negative item are worth three points. An undecided
response is worth one point. A no response to a positive item and a yes response
to a negative item are worth no points. The answers are used to calculate a mean
score for each section. A high score indicates satisfaction. Since its creation, the
JDI has been used extensively as a tool to measure overall satisfaction. Porter,
Steers, and Mowday (1974); Hom, Katerburg, and Hulin (1979); and Johnson and
Johnson (2000a & b, 2002) all used the JDI in their research to measure job
satisfaction.
15
Perceived Overqualification (POQ)
“Perceived overqualification is defined as the extent to which an employed
individual perceives that he or she; (a) possesses surplus job qualifications, or (b) has
limited opportunities to acquire and use new job-related skills (Johnson and Johnson,
2002).” Johnson and Johnson’s (2000a & b) research identified two dimensions of
perceived overqualification, the perceived lack of growth opportunity and the perceived
mismatch. These two dimensions align with two of Hertzberg’s intrinsic motivators
(needs), growth opportunity and meaningful work. According to the Johnson and
Johnson’s studies, perceived overqualification may become a source of job dissatisfaction
because it destroys motivation and perceptions regarding opportunities for need
satisfaction inside the work situation. Hertzberg’s theory states that the lack of intrinsic
motivators does not cause high dissatisfaction. Hertzberg, et al. (1959), implies that the
lack of “motivators” in a job will increase the sensitivity of employees to real or
imagined job “hygiene” factors (extrinsic dissatisfiers). In a study of a Midwest
American Postal Workers Union, Johnson and Johnson (2000a & b) found evidence that
perceived overqualification has a negative effect on job satisfaction. The study found
that there was a significant negative relationship between perceived no-grow and job
satisfaction and perceived mismatch and job satisfaction (Johnson and Johnson, 2000).
Johnson and Johnson (2002) also conducted further research on the POQ scales across
work settings. They tested the scale on: (1) a sample of nurses from the staff of the
serves department of a large, Midwestern teaching hospital; (2) a sample of unionized
railroad workers; and (3) a sample of unionized U.S. Postal Service employees. The
results of their testing of the data from these samples suggest that the two dimensions of
16
perceived overqualification, no-grow and mismatch, are significantly and negatively
correlated with dimensions of job satisfaction and organizational commitment.
Match Quality and Overeducation
Match quality is how well a person’s specific qualifications, to include education
attainment and experience, are matched to the skill requirement of the job.
“Overeducation has been defined in one of three ways: as a decline in the economic
position of educated individuals relative to historically higher levels; as an under fulfilled
expectation of the educated with respect to their occupational attainment; or as the
possession by workers of greater educational skills than their job required
(underutilization of workers’ education)” (Tsang, 1987:239). These definitions contain
similarities to the definition of perceived overqualification. The perceived
overqualification scale measures two indicators, perceived no-grow and perceived
mismatch. The perceived mismatch scale includes four items: “my formal education
overqualifies me for my present job; my talents are not fully utilized on my job; my work
experience is more than necessary to do my present job; and based on my skills, I am
overqualified for the job I hold” (Johnson and Johnson, 2000a). These similarities
suggest that the research on POQ may produce results similar to the research findings for
match quality and overeducation. This implies that individuals with POQ may behave in
a similar manner to those with matched quality and overeducation.
Studies conducted by Bowlus (1985) have found that match quality fluctuates
throughout the labor market depending on the economy. Using unemployment rates as
17
an indicator of the economy, Bowlus found that during times of recession, mismatches
are more prevalent. Individuals are more willing to accept mismatches as stopgap
employment until the economy improves. Once the economy improves, workers
experiencing mismatches will seek to move out of these stopgap jobs (Bowlus, 1995).
Hersch’s (1991) research into educational match and job match in manufacturing
and warehouse firms found evidence that overqualified workers are less satisfied with
their jobs and more likely to quit. The study also identifies an inverse relationship
between overqualification and training time. The research suggests that overqualified
workers’ ability to learn is greater and a mismatch may be optimal (Hersch, 1991).
Using a representative sample of the Spanish labor force, Alba-Ramirez (2001)
studied the rates of returns of education. Individuals acquire education with the
expectation of future returns. These returns are affected by the quality of the job match.
He found that the rate of return to education for individuals with adequate education was
5.8 percent. The rate of return to education that exceeded the requirements of the job was
2.7 percent. The penalty for each year of undereducation was a 4.7 percent reduction in
wage. Individuals experiencing unsatisfactory returns are motivated to seek a better
match and a higher return on educational qualifications. He found that overeducated
individuals experienced higher job turnover than other comparable workers (Alba-
Ramirez, 2001). These finding were in agreement with the turnover theory of Arnott and
Stiglitz (1985). Their study suggests that when individuals pay the cost of education and
18
training, the pay must be sufficiently high for the individual to recoup the expenses of the
training plus interest. Turnover will occur when there are discrepancies.
Tsang and Levin (1985) explained the economics of overeducation. They state
that supply of college graduates has increased dramatically which has increased the
average education of the workforce, but the job structure has not adjusted to account for
this education increase in the workforce. Economic theory suggests that the market will
adjust and this problem only occurs in the short run. Tsang and Levin (1985) believe that
overeducation may become a persistent problem if job structures are unresponsive. They
used several labor-market models and economic theory to explain overeducation’s impact
on productivity. Tsang and Levin (1985) suggest employers consider strategies to change
the job structure to make jobs more challenging and productive.
Tsang (1987) tested the production model developed by Tsang and Levin (1985).
He used data from twenty-two U.S. Bell Companies for the period 1981-1982. He found
that overeducation was negatively and significantly related to productivity (Tsang, 1987).
“The results indicated that overeducation was negatively and significantly related to job
satisfaction which was positively related and significantly related to output…” (Tsang,
1987: 246). The overeducated worker has lower job satisfaction, which results in
reduced work effort, increased production costs, and consequently lower productivity.
Tsang suggest strategies to mitigate the impact of underutilization; (1) Raising the
educational requirements of the job or changing the job structure or, (2) lowering the
educational attainment through hiring controls (Tsang, 1987). He performs a cost benefit
19
analysis, which concludes that raising the educational requirements is the more effective
strategy (Tsang, 1987). Tsang also states that “education influences the needs and tastes
of individuals. Some studies have shown that more educated workers, compared with
less educated workers, set a higher priority on challenging work than financially
rewarding work” (Quinn and Mandilovitch, 1975) (Tsang, 1987: 97).
Tsang, Rumberger, and Levin (1991) did a comparative study on differing
measurements of overeducation, in particular surplus schooling. They compared the
measurements obtained subjectively and objectively. Subjectively overeducation was
measured by asking each worker the amount of schooling he or she thinks the job
requires. Objectively overeducation was measured using the Department of Labor’s
Dictionary of Occupational Titles, which specifies the amount of general and specific
training needed for “average performance” in each job situation (Tsang and others, 1991).
The study concluded that the objective measure showed higher levels of surplus
schooling than the subjective measure. These results show that in this case self-reporting
provided a more conservative estimation of overeducation. The dimension of perceived
overqualification, perceived mismatch, is very similar to what would be used in the
subjective measure of overeducation.
Vahey’s (2000) research does not support the theory that overeducated workers
are less productive because of lack of interest and motivation. Vahey (2000) used data
from the National Survey of Class Structure and Labor Process in Canada (NSCS) a
cross-sectional survey of the Canadian workforce. He found that overeducated males
20
experienced a positive return for overeducation in jobs requiring a bachelor’s degree, and
undereducated males did experience lower pay (Vahey, 2000). Buchel’s (2000) studies
of German productivity have produced findings that also contradict the theory. In
comparing employee with similar levels of requirements, Buchel (2000) found that
overqualified workers tended to be stronger workers, more career-minded, more likely to
participate in on-the-job training and experience longer periods of tenure. Buchel (2000)
analyzed cross-sectional and longitudinal data from a representative sample of the West
German workforce. In his studies he found that overeducated workers receive wage
premiums for their surplus schooling. He does acknowledge that returns are lower for
surplus education but they are positive (Buchel, 2000).
Organizational Commitment
Organizational commitment is defined as the strength of an individual’s
identification with and involvement in a particular organization (Porter and others, 1974).
Organizational Commitment has been shown to be powerful predictor of turnover. Porter
(1974) theorized that under certain circumstances, organizational commitment may be a
more effective predictor of turnover than job satisfaction. Individuals may have low job
satisfaction but their commitment to the organizations goals may override such
dissatisfaction and they will continue to participate in the organization (Porter and others,
1974). Porter (1974) validated his theory is a study of psychiatric technician trainees. In
his study, organizational commitment proved to be a more accurate predictor than job
satisfaction (Porter and others, 1974). Porter’s research was later validated by Hom,
Katerburg, and Hulin (1979) research on turnover prediction. They collected data from
21
534 National Guard members. The study measured job satisfaction using the five JDI
scales and organizational commitment using Porter’s commitment scale. Their research
concluded that organizational commitment was a more accurate predictor of turnover
than job satisfaction (Hom and others, 1979:282). They believed that organizational
commitment predicted turnover as well or better because:
When an employee quits, he or she ends all formal ties with a particular company. The employee may not necessarily be relinquishing a set of job duties, since the same kind of job may be assumed elsewhere. Resignation implies rejection of the organization but not necessarily rejection of the job. Consequently, organizational commitment is regarded as being more directly related to termination than are job attitudes. (Hom and others, 1979: 282)
Summary of Basic Conclusions
Current research supports the hypothesis that improving match quality to reduce
the occurrences of overeducation and reducing perceived overqualification in the
workforce would improve job satisfaction and organizational commitment and thus
reduce turnover. Job satisfaction is a powerful predictor of future separation and quit
(Clark, 2001). Organizational Commitment has been shown to be powerful predictor of
turnover (Porter and others, 1974). This supports the claim that increasing job
satisfaction and commitment would reduce turnover. Match quality affects an
individual’s return on education (Alba-Ramirez, 2001). Overeducation leads to positive
returns but the returns are lower for surplus education. Turnover increases when this
return is not adequate to cover the cost of acquiring the education employee.
Overeducation increases turnover. Perceived overqualification negatively affects job
satisfaction and commitment (Johnson and Johnson, 2002). Based on this literature
review, which summarized the current state of research in the areas of match quality,
22
perceived overqualification, and overeducation as they affect job satisfaction,
commitment, and turnover; we have developed the following strategic human resource
management theory: By improving match quality, a firm or an organization such as the
United States Air Force, can reduce the occurrences of overeducation and perceived
overqualification in its workforce. This leads to increased job satisfaction, commitment,
and reduced turnover.
23
III. Methodology
This chapter presents the research design and methodology used to conduct this
study. The first two sections operationally define the relevant variables, both
independent and dependent, for this study. In addition, the first two sections include the
measurement methodology used in this study. The Survey and Data Collection section
includes a description of the survey instrument as well as the methodology employed in
data collection. The Population and Sampling Frame section defines the target
population this study focuses on as well as identifies the sampling frame used. The
Hypotheses section includes a listing of the null (Ho) hypotheses tested in this study. The
Data Analysis section is a description of the analysis methodology used to test the
hypotheses. The final section, Limitations of Design, includes a discussion of the
potential limitations associated with the design and methodology of this research.
Independent Variables
In this study, I used two independent variables derived from perceived
overqualification to predict job satisfaction, commitment, and turnover intent. They are:
1. Perceived No-grow
2. Perceived Mismatch
Perceived overqualification is operationally defined as “the extent to which an employed
individual perceives that he or she (a) possesses surplus job qualifications or (b) has
limited opportunities to acquire and use new job-related skills” (Johnson and Johnson,
24
2002). POQ is a subjective assessment. Johnson and Johnson’s (2002) 10-item
Perceived Overqualification (POQ) Scale uses two dimensions, perceived no-grow and
perceived mismatch, to operationalize POQ. In this study, the target population consists
of United States Air Force officers who earned a graduate degree from the Air Force
Institute of Technology (AFIT) between 1992 and 2002. I expanded upon this existing
two-dimensional scale to include seven additional questions specific to the target
population. (I.e. “My qualifications exceed those of my peers outside the Air Force,”
“My education exceeds that of my peers within my career field,” and “The Air Force has
benefited from my AFIT education”). The scale utilizes a five-point Likert scale ranging
from “strongly agree” (5) to “strongly disagree” (1). The scale provided two scores for
each respondent, perceived no-grow and perceived mismatch, each was computed by
taking the average of the summed score from the POQ scale.
Dependent Variables
In this study, I had three dependent variables to study the effects of perceived
overqualification. The three dependent variables in this study are:
1. Job satisfaction
2. Commitment
3. Turnover intent.
a. Intent to leave
b. Intent to search for job with another employer
c. Intent to search for a job within the Air Force
d. Intent to remain in the Air Force for 20 years.
25
Job satisfaction and organizational commitment are dependent variables within
this study. One of the research objectives in this study is to determine if the effects of
perceived overqualification found in pervious research are generalizable to this
population. Pervious research has shown that the levels of perceived overqualification
correlate to the levels of job satisfaction and organizational commitment (Johnson and
Johnson, 2002).
Job satisfaction is defined as the feelings a worker has about his job (Smith,
Kendall, and Hulin, 1969:6). In this study job satisfaction is measured by soliciting the
workers feeling about specific aspects of the job. The Job Descriptive Index (JDI)
developed by Smith, Kendall, and Hulin (1969) has developed scales to operationalize
job satisfaction. This study utilizes four scales from the JDI to measure job satisfaction.
These scales measure satisfaction with work, satisfaction with supervision, satisfaction
with pay, and satisfaction with promotion. The fifth dimension, satisfaction with co-
workers, was excluded due to its lack of relevance to measures of perceived
overqualification. The exclusion of satisfaction with co-workers is in line with the
previous research conducted by Johnson and Johnson (2002). The JDI measures job
satisfaction by presenting the subject with a list of descriptive adjectives or phrases. The
respondent then answers yes, no, or cannot decide. Each response is weighted so that a
high score indicates satisfaction.
26
Commitment is operationally defined as “the strength of an individual’s
identification with and involvement in a particular organization” (Porter, Steers,
Mowday, and Boulian, 1974: 604). The organization in this study is the Air Force.
Commitment was operationalized using Porter’s Organizational Commitment Scale. The
scale, which is a 15-item questionnaire, “was designed to measure the degree to which
subjects feel committed to the employing organization” (Porter and others, 1974: 605).
The survey uses a five-point Likert scale and the respondent’s overall commitment is
computed by taking the total score across the items.
Turnover intent is operationally defined as the expressed behavioral intention to
quit. This is measured by using the following four questions:
1. Do you intend to leave the Air Force after your commitment?
2. Did you make any efforts to find a new job with another employer?
3. Did you seek a new job within the Air Force to better utilize you skills?
4. Do you intend to remain in the Air Force until retirement?
Responses to the questions were yes, no, or cannot decide.
Survey and Data Collection
The survey instrument developed for this study utilizes scales obtained from the
literature review to measure the dependent and independent variables. Attachment 1 is
the survey used for this study. The survey contains scales that have been used
extensively by researchers in this field of study. The survey is organized into four
sections.
27
1. Demographic Information
2. Perceived Overqualification (POQ) Scale
3. The Job Descriptive Index (JDI)
4. Organizational Commitment
The demographics section contained 12 questions. The respondents were asked
their age; rank; gender; race; marital status; Air Force Specialty Code (AFSC);
experience within AFSC (years); total years of service; year of graduation from AFIT;
time between undergraduate and graduate education; separation eligibility; experience
prior to attending AFIT. The demographics were compared to the responses given to the
other sections. The AFSC is the job specialty code that identifies an individual’s job title
and description. All Air Force members are assigned an AFSC code. In this study, the
AFSC identifies the specific degree program and allows for comparisons between the
different programs. The experience questions allowed for interaction testing for
significance. Total years in service allowed for testing to understand the effects of
tenure.
The validity and reliability of the JDI and Porter’s Organizational Commitment
Scale are well documented. The POQ scales are relatively new and one of the goals of
this research is to test the reliability and validity of this scale on a new population. The
survey was customized to include additional questions specific to the Air Force and to a
participant in an employee graduate programs. A pretest was conducted to check for
construct validity.
28
The study is cross-sectional, measuring data at one time point. The survey was
conducted via an internet survey tool, Facilitate.com. Invitations to respond were sent via
email to 1208 individuals. The email included the information necessary to access the
tool the survey. A reminder email was sent out seven days after the initial email. From
the 1208 invitations, 606 responses were received. The response rate was 50.16%. The
estimated time to complete this survey was 10-15 minutes. The instruments utilized
electronic media. The data collected by the surveys was quantitative. The surveys also
collected individual demographic data. The survey was administered over a two-week
period.
Population and Sampling Frame
The target population in this study is all AF officers that have attended AFIT in
residence between 1992 and 2002. Obtaining a graduate degree from AFIT requires 15-
18 months for a Master of Science (MS) degree and three-years for a Doctor of
Philosophy (PhD) degree. The participants are enrolled in a curriculum tailored for their
specific specialty designated by their Air Force Specialty Code (AFSC). For example, a
civil engineering officer would pursue a MS in Engineering and Environmental
Management and his or her AFSC would be 32E. The curriculum includes classes that
are tailored to the identified needs of the Air Force. Students take an average of 12 credit
hours per ten-week quarter to complete their degree. The school is accredited by The
Higher Learning Commission and is a member of the North Central Association (NCA).
The Aeronautical Engineering, Astronautical Engineering, Computer Engineering,
29
Electrical Engineering, Nuclear Engineering, and Systems Engineering curricula are also
accredited by the Accreditation Board for Engineering and Technology (ABET).
Individuals that apply to the program must meet admissions criteria and are competitively
selected. Participants in the program are Air Force, Army, Navy, Marine and Coast
Guard officers, as well as foreign military officers and Department of Defense civilians.
Air Force participants acquire a 3-5 year commitment to the Air Force at the completion
of the program. Pay and promotion opportunities are held relatively constant for this
population. The pay scale is set by Congress and is determined based on rank and years
in service. Promotion opportunities and increases in rank are based on years in service.
Participants do not receive increases in pay or promotion opportunities based on their
participation in the program.
The sampling frame was obtained from the Air Force Personnel Center Database,
MIL-PDS. The system contains all Air Force personnel. All AFIT graduates are
identified within the system. The sampling frame is a listing of Air Force officers that
attended AFIT in residence from 1992 to 2002 and are still in the Air Force. The listing
contained 1837 graduates. Of the 1837 graduates, email addresses could not be found
using the Air Force Global Address list for 494 of the graduates. Of the 1343 emails
sent, 135 were undeliverable. The total number of graduates contacted was 1208.
This study uses purposive sampling. The survey was sent out to 1208 AFIT
graduates still in the Air Force that graduated from 1992 to 2002. Those individuals
participating in the program that have graduated within the last three to four year are
30
ineligible to separate from the service due to the service commitment they acquired after
completion of the program. Those who graduated more than four years ago have
completed this service commitment and may voluntarily leave the service. The sample
does not include earlier graduates due to the potential effects of other variables such as
age and tenure.
Hypotheses
The following hypotheses were developed to test the overall POQ theories
presented in Ch. 2 and the research questions posed in Chapter 1. Hypotheses 1-3 were
developed to test the generalizability of pervious research, research question 1.
Hypothesis 4–7 were developed to answer research questions 2–5.
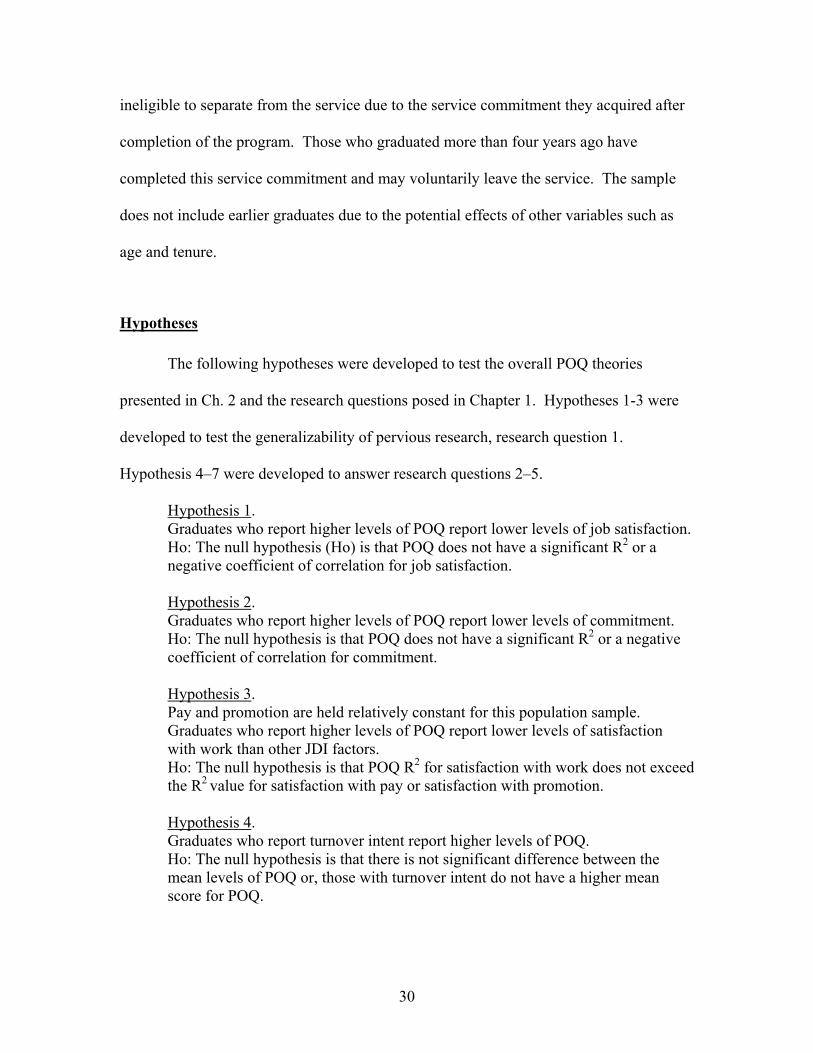
Hypothesis 1. Graduates who report higher levels of POQ report lower levels of job satisfaction. Ho: The null hypothesis (Ho) is that POQ does not have a significant R2 or a negative coefficient of correlation for job satisfaction. Hypothesis 2. Graduates who report higher levels of POQ report lower levels of commitment. Ho: The null hypothesis is that POQ does not have a significant R2 or a negative coefficient of correlation for commitment. Hypothesis 3. Pay and promotion are held relatively constant for this population sample. Graduates who report higher levels of POQ report lower levels of satisfaction with work than other JDI factors. Ho: The null hypothesis is that POQ R2 for satisfaction with work does not exceed the R2 value for satisfaction with pay or satisfaction with promotion. Hypothesis 4. Graduates who report turnover intent report higher levels of POQ. Ho: The null hypothesis is that there is not significant difference between the mean levels of POQ or, those with turnover intent do not have a higher mean score for POQ.
31
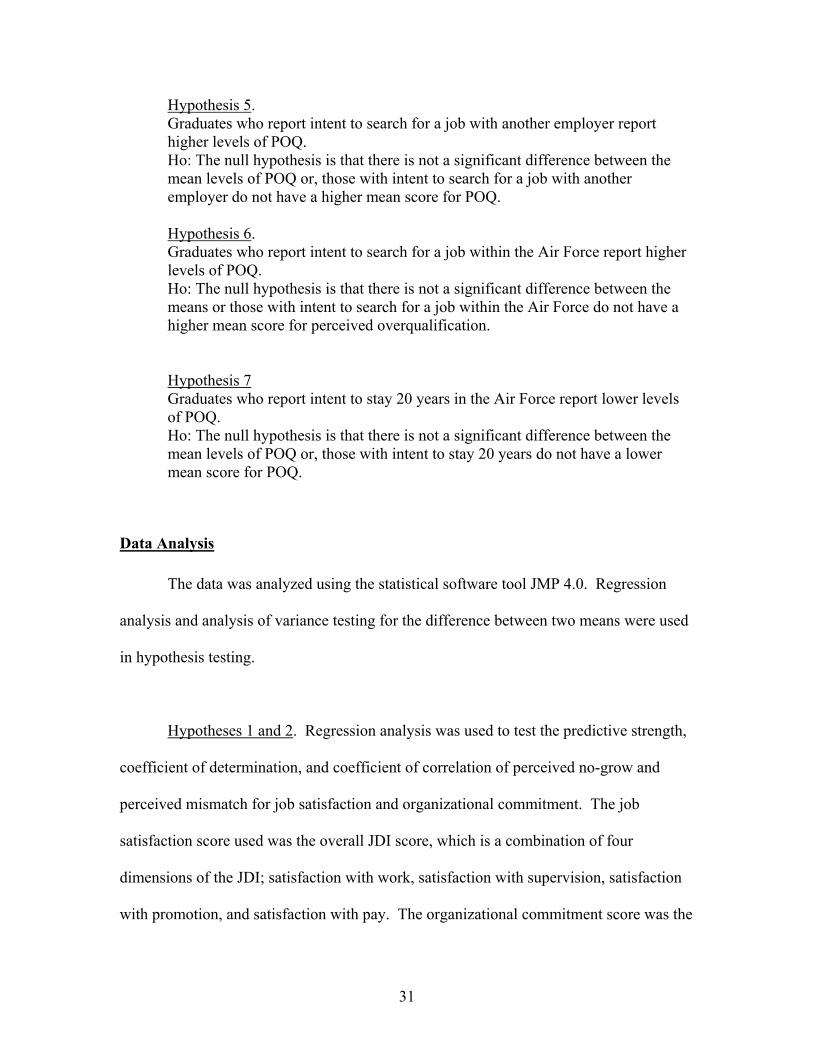
Hypothesis 5. Graduates who report intent to search for a job with another employer report higher levels of POQ. Ho: The null hypothesis is that there is not a significant difference between the mean levels of POQ or, those with intent to search for a job with another employer do not have a higher mean score for POQ. Hypothesis 6. Graduates who report intent to search for a job within the Air Force report higher levels of POQ. Ho: The null hypothesis is that there is not a significant difference between the means or those with intent to search for a job within the Air Force do not have a higher mean score for perceived overqualification.
Hypothesis 7 Graduates who report intent to stay 20 years in the Air Force report lower levels of POQ. Ho: The null hypothesis is that there is not a significant difference between the mean levels of POQ or, those with intent to stay 20 years do not have a lower mean score for POQ.
Data Analysis
The data was analyzed using the statistical software tool JMP 4.0. Regression
analysis and analysis of variance testing for the difference between two means were used
in hypothesis testing.
Hypotheses 1 and 2. Regression analysis was used to test the predictive strength,
coefficient of determination, and coefficient of correlation of perceived no-grow and
perceived mismatch for job satisfaction and organizational commitment. The job
satisfaction score used was the overall JDI score, which is a combination of four
dimensions of the JDI; satisfaction with work, satisfaction with supervision, satisfaction
with promotion, and satisfaction with pay. The organizational commitment score was the
32
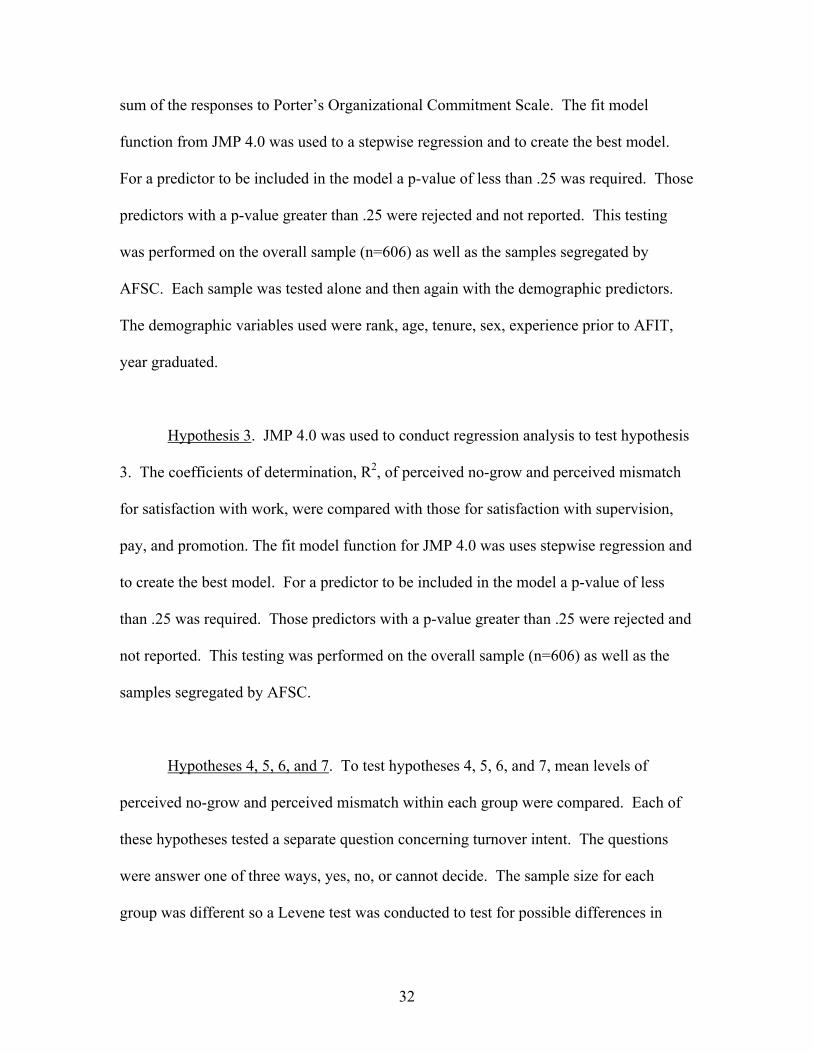
sum of the responses to Porter’s Organizational Commitment Scale. The fit model
function from JMP 4.0 was used to a stepwise regression and to create the best model.
For a predictor to be included in the model a p-value of less than .25 was required. Those
predictors with a p-value greater than .25 were rejected and not reported. This testing
was performed on the overall sample (n=606) as well as the samples segregated by
AFSC. Each sample was tested alone and then again with the demographic predictors.
The demographic variables used were rank, age, tenure, sex, experience prior to AFIT,
year graduated.
Hypothesis 3. JMP 4.0 was used to conduct regression analysis to test hypothesis
3. The coefficients of determination, R2, of perceived no-grow and perceived mismatch
for satisfaction with work, were compared with those for satisfaction with supervision,
pay, and promotion. The fit model function for JMP 4.0 was uses stepwise regression and
to create the best model. For a predictor to be included in the model a p-value of less
than .25 was required. Those predictors with a p-value greater than .25 were rejected and
not reported. This testing was performed on the overall sample (n=606) as well as the
samples segregated by AFSC.
Hypotheses 4, 5, 6, and 7. To test hypotheses 4, 5, 6, and 7, mean levels of
perceived no-grow and perceived mismatch within each group were compared. Each of
these hypotheses tested a separate question concerning turnover intent. The questions
were answer one of three ways, yes, no, or cannot decide. The sample size for each
group was different so a Levene test was conducted to test for possible differences in
33
variance. A larger Levene score indicates that the variances are equal. For hypotheses
testing an analysis of variance was conducted where those that answered “yes” were
compared to those who answered “no” to determine if their means were significantly
different.
Limitations of Design
This study tests these hypotheses using a sample limited to AFIT graduates still in
the Air Force. The traits associated with the sample may not be representative of all
employee graduate programs. The results may not be generalizable outside of this Air
Force population. The sample covers a limited number of AFSC. For example, there is
only one pilot and two navigator respondents in the sample. Therefore the results may
not be generalizable to the Air Force as a whole. There may be unique variables that only
affect this population and this may contribute to the results of this study. For example
the effects of the September 11, 2001 may have contributed to the results of this study.
Further studies utilizing a more representative sample may be necessary.
The study is cross sectional. There may be different factors that affect the
different graduation year groups. A panel study that tested year groups over time may
yield better results and reduce the effects of other factors.
34
IV. Results
This chapter presents the data collected using the survey instrument. The first
three sections present the demographic characteristics, perceived overqualification scores,
Job Description Index scores, and commitment scores for the sample of n=606.
Attachment 2 graphically presents the data collected from the survey. The chapter then
presents the results of the hypothesis testing for hypothesis 1-7. Each hypothesis is
restated and the results are presented in tabular format, a brief description of noteworthy
results is given with each section.
Demographic Characteristics
Twelve demographic variables were collected for each participant in this study.
They are summarized in the tables that follow. Each table provides the frequencies of the
occurrence of each category by count or number and by percentage of the whole.
35
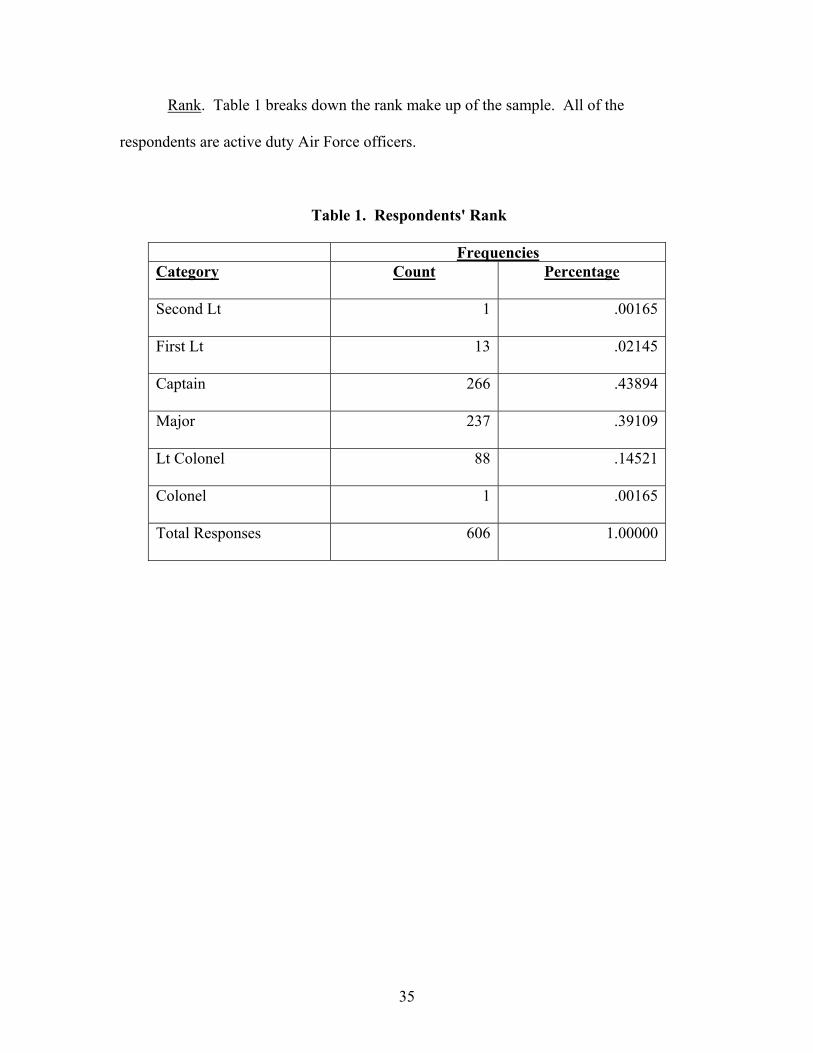
Rank. Table 1 breaks down the rank make up of the sample. All of the
respondents are active duty Air Force officers.
Table 1. Respondents' Rank
Frequencies Category Count Percentage
Second Lt 1 .00165
First Lt 13 .02145
Captain 266 .43894
Major 237 .39109
Lt Colonel 88 .14521
Colonel 1 .00165
Total Responses 606 1.00000
36
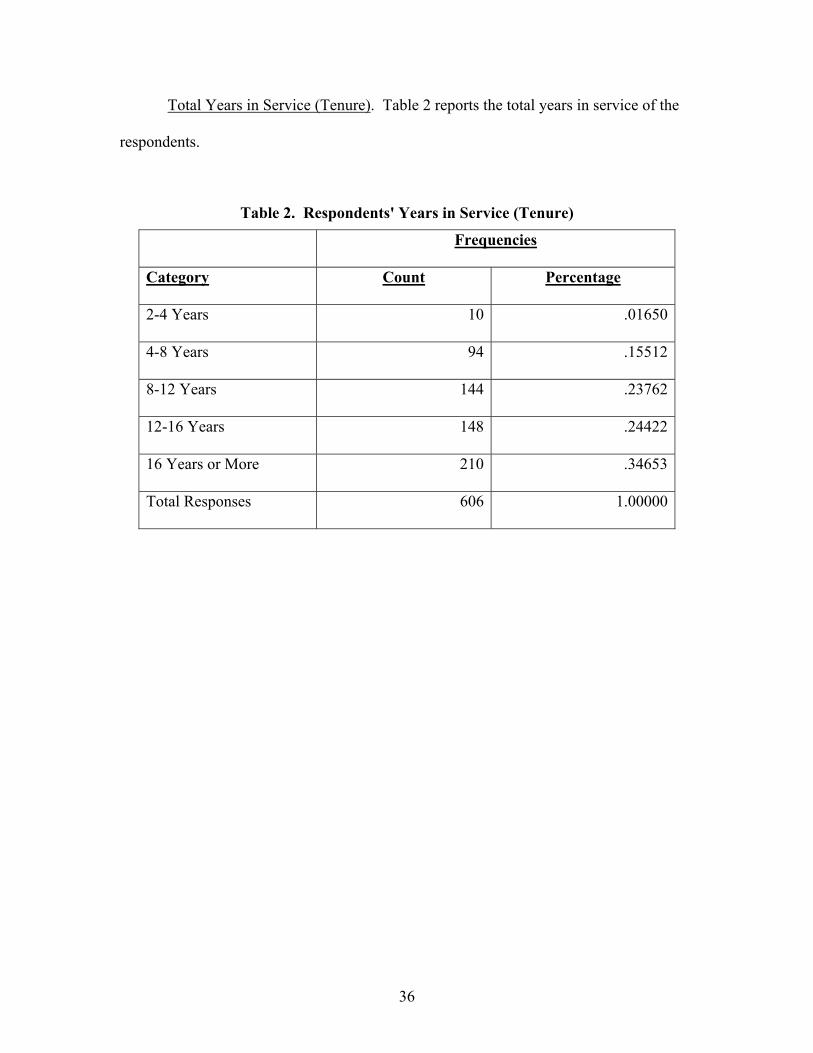
Total Years in Service (Tenure). Table 2 reports the total years in service of the
respondents.
Table 2. Respondents' Years in Service (Tenure)
Frequencies
Category Count Percentage
2-4 Years 10 .01650
4-8 Years 94 .15512
8-12 Years 144 .23762
12-16 Years 148 .24422
16 Years or More 210 .34653
Total Responses 606 1.00000
37
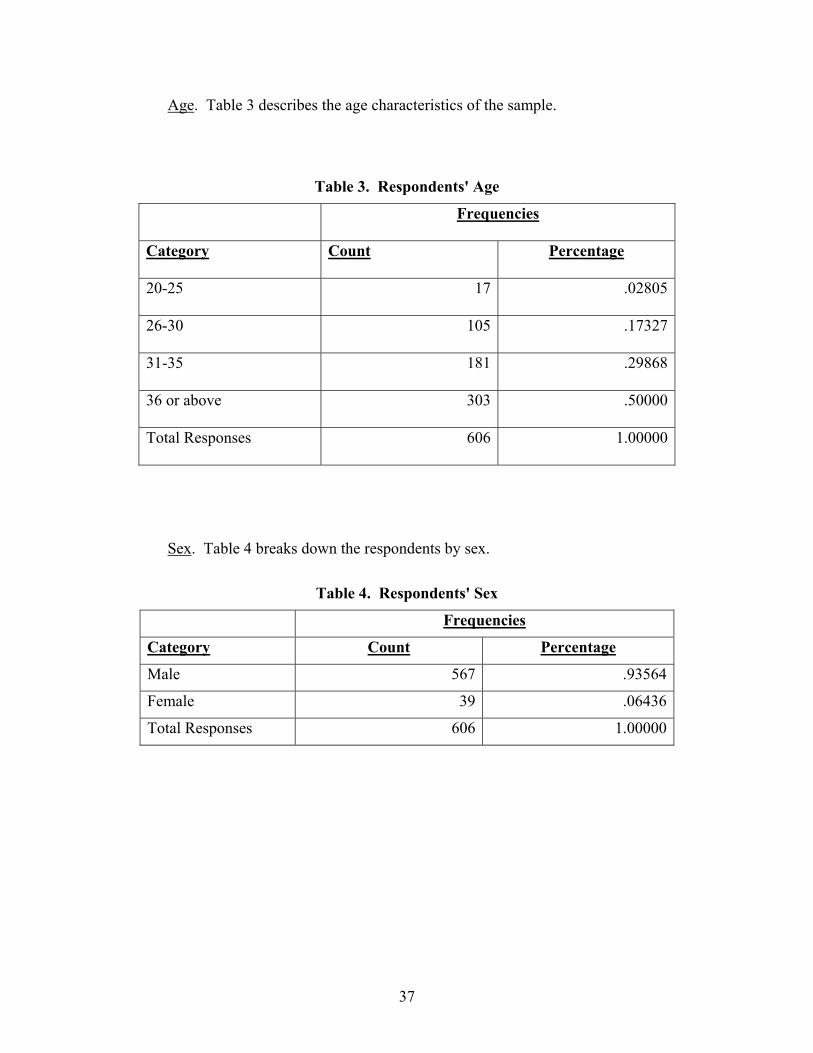
Age. Table 3 describes the age characteristics of the sample.
Table 3. Respondents' Age
Frequencies
Category Count Percentage
20-25 17 .02805
26-30 105 .17327
31-35 181 .29868
36 or above 303 .50000
Total Responses 606 1.00000
Sex. Table 4 breaks down the respondents by sex.
Table 4. Respondents' Sex
Frequencies
Category Count Percentage
Male 567 .93564
Female 39 .06436
Total Responses 606 1.00000
38
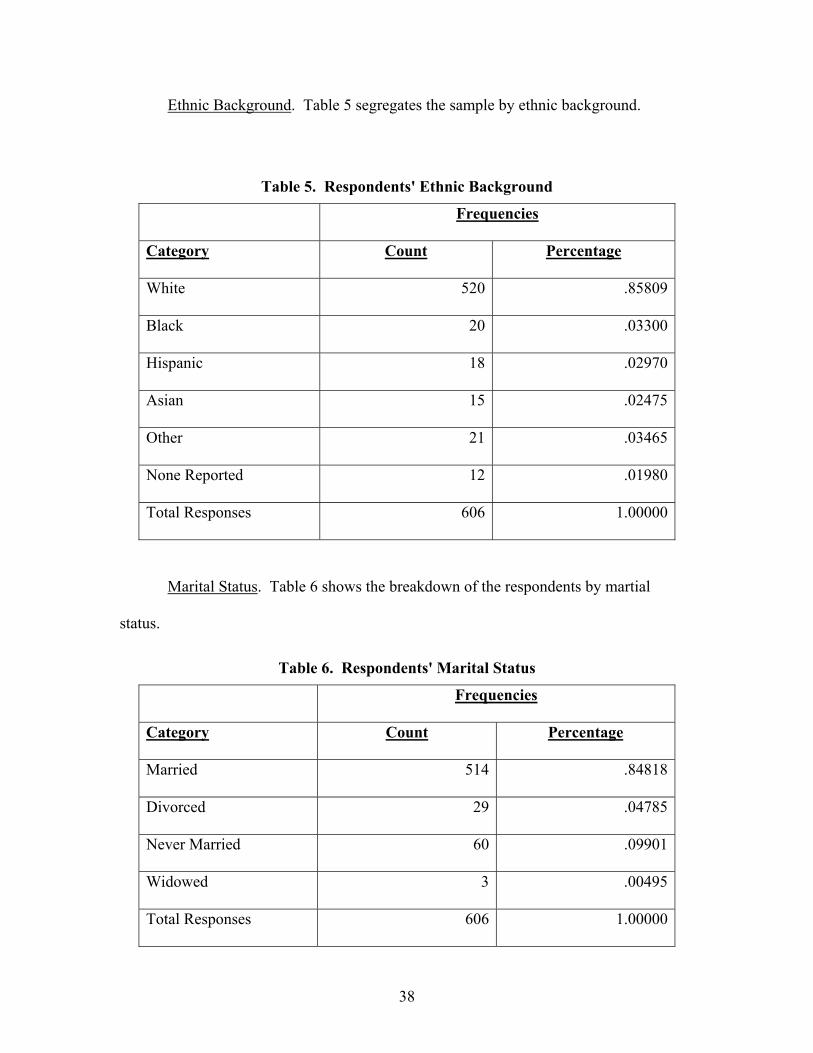
Ethnic Background. Table 5 segregates the sample by ethnic background.
Table 5. Respondents' Ethnic Background
Frequencies
Category Count Percentage
White 520 .85809
Black 20 .03300
Hispanic 18 .02970
Asian 15 .02475
Other 21 .03465
None Reported 12 .01980
Total Responses 606 1.00000
Marital Status. Table 6 shows the breakdown of the respondents by martial
status.
Table 6. Respondents' Marital Status
Frequencies
Category Count Percentage
Married 514 .84818
Divorced 29 .04785
Never Married 60 .09901
Widowed 3 .00495
Total Responses 606 1.00000
39
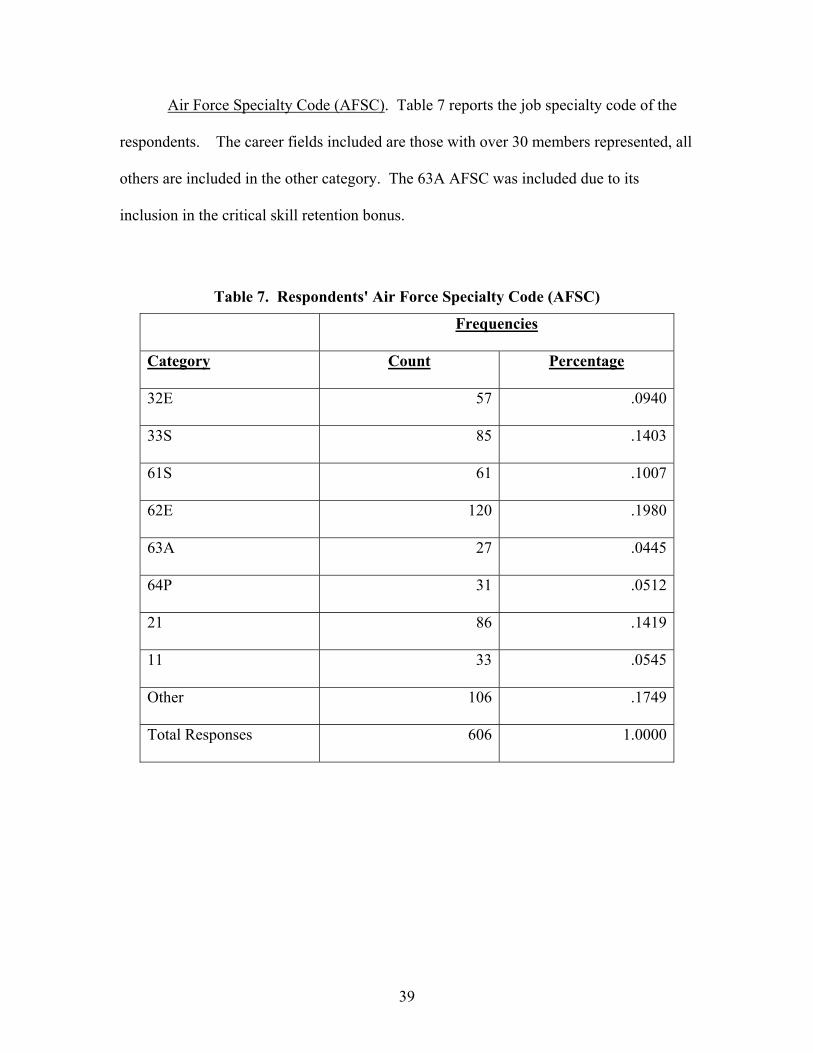
Air Force Specialty Code (AFSC). Table 7 reports the job specialty code of the
respondents. The career fields included are those with over 30 members represented, all
others are included in the other category. The 63A AFSC was included due to its
inclusion in the critical skill retention bonus.
Table 7. Respondents' Air Force Specialty Code (AFSC)
Frequencies
Category Count Percentage
32E 57 .0940
33S 85 .1403
61S 61 .1007
62E 120 .1980
63A 27 .0445
64P 31 .0512
21 86 .1419
11 33 .0545
Other 106 .1749
Total Responses 606 1.0000
40
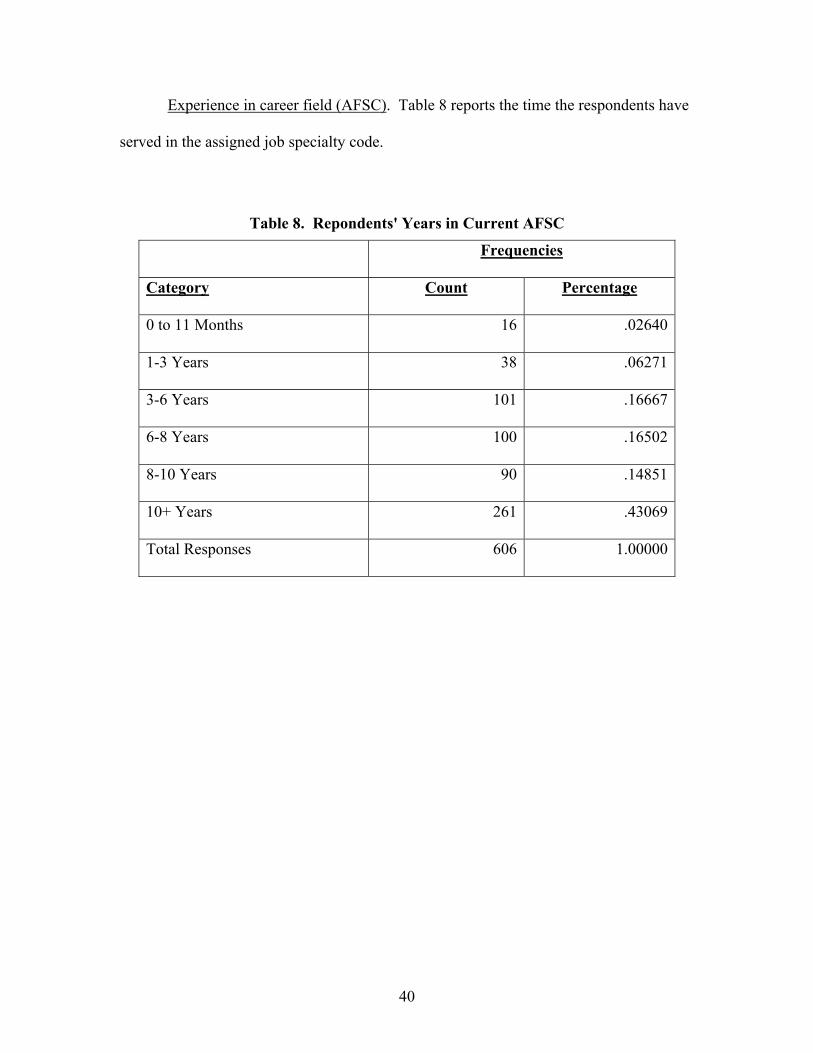
Experience in career field (AFSC). Table 8 reports the time the respondents have
served in the assigned job specialty code.
Table 8. Repondents' Years in Current AFSC
Frequencies
Category Count Percentage
0 to 11 Months 16 .02640
1-3 Years 38 .06271
3-6 Years 101 .16667
6-8 Years 100 .16502
8-10 Years 90 .14851
10+ Years 261 .43069
Total Responses 606 1.00000
41
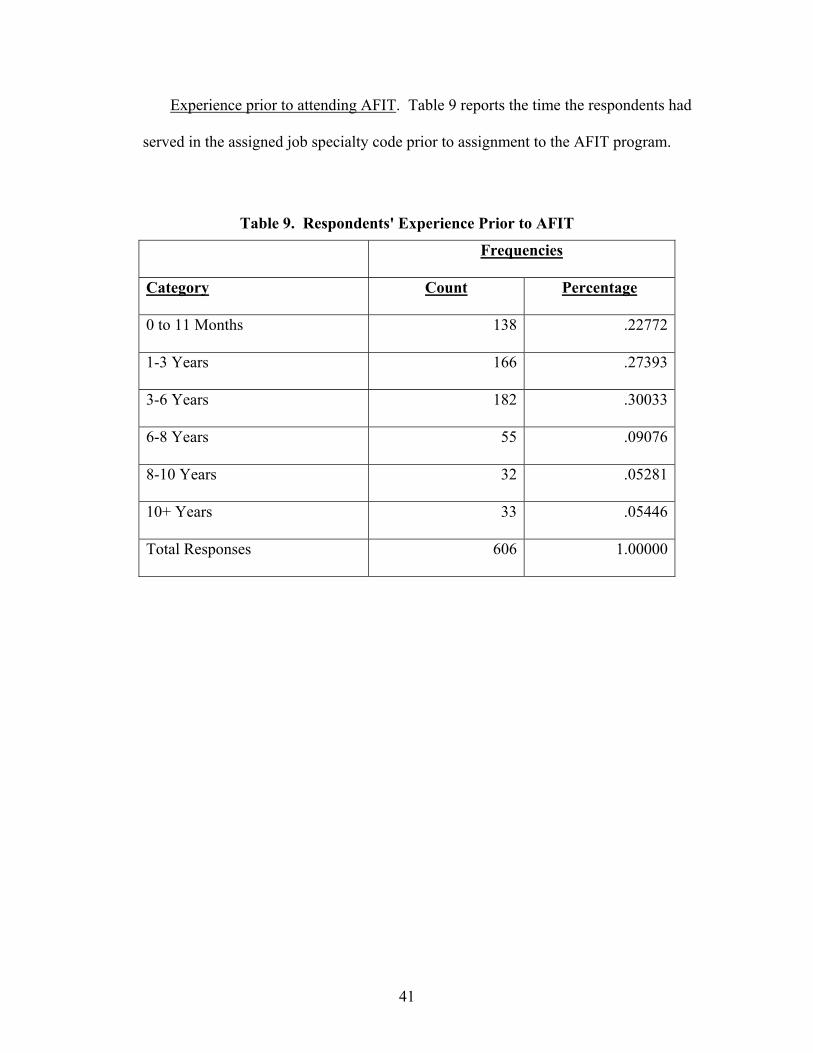
Experience prior to attending AFIT. Table 9 reports the time the respondents had
served in the assigned job specialty code prior to assignment to the AFIT program.
Table 9. Respondents' Experience Prior to AFIT
Frequencies
Category Count Percentage
0 to 11 Months 138 .22772
1-3 Years 166 .27393
3-6 Years 182 .30033
6-8 Years 55 .09076
8-10 Years 32 .05281
10+ Years 33 .05446
Total Responses 606 1.00000
42
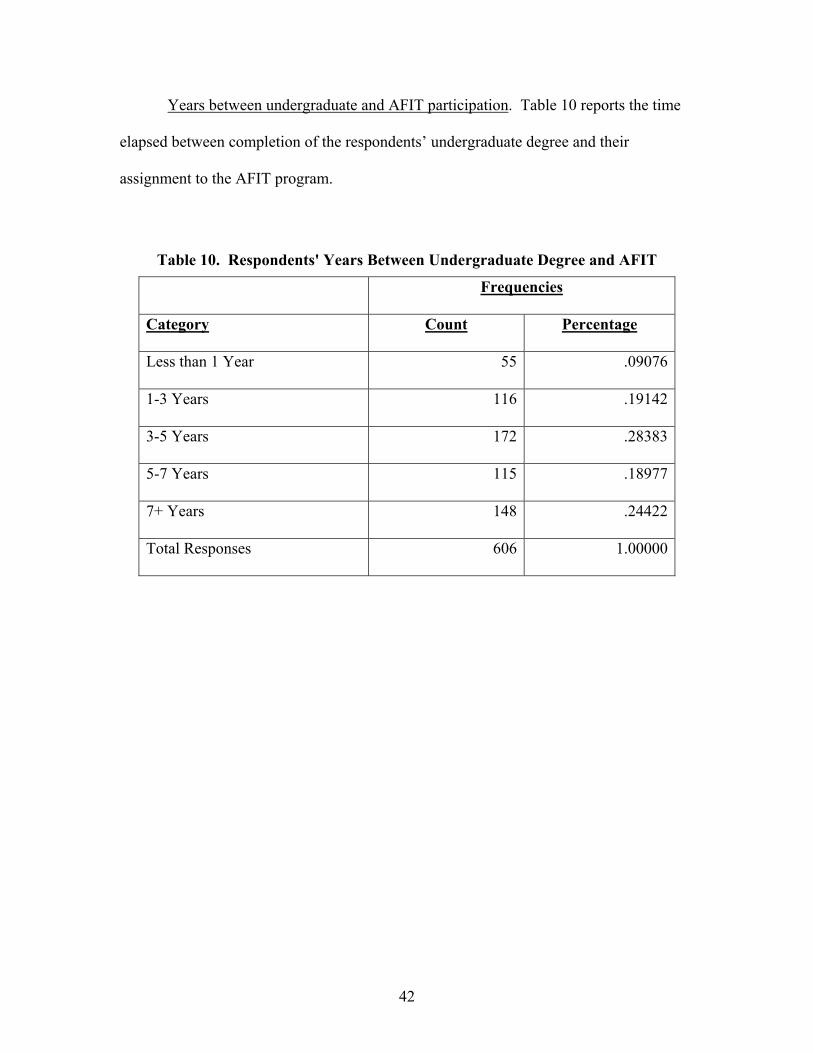
Years between undergraduate and AFIT participation. Table 10 reports the time
elapsed between completion of the respondents’ undergraduate degree and their
assignment to the AFIT program.
Table 10. Respondents' Years Between Undergraduate Degree and AFIT
Frequencies
Category Count Percentage
Less than 1 Year 55 .09076
1-3 Years 116 .19142
3-5 Years 172 .28383
5-7 Years 115 .18977
7+ Years 148 .24422
Total Responses 606 1.00000
43
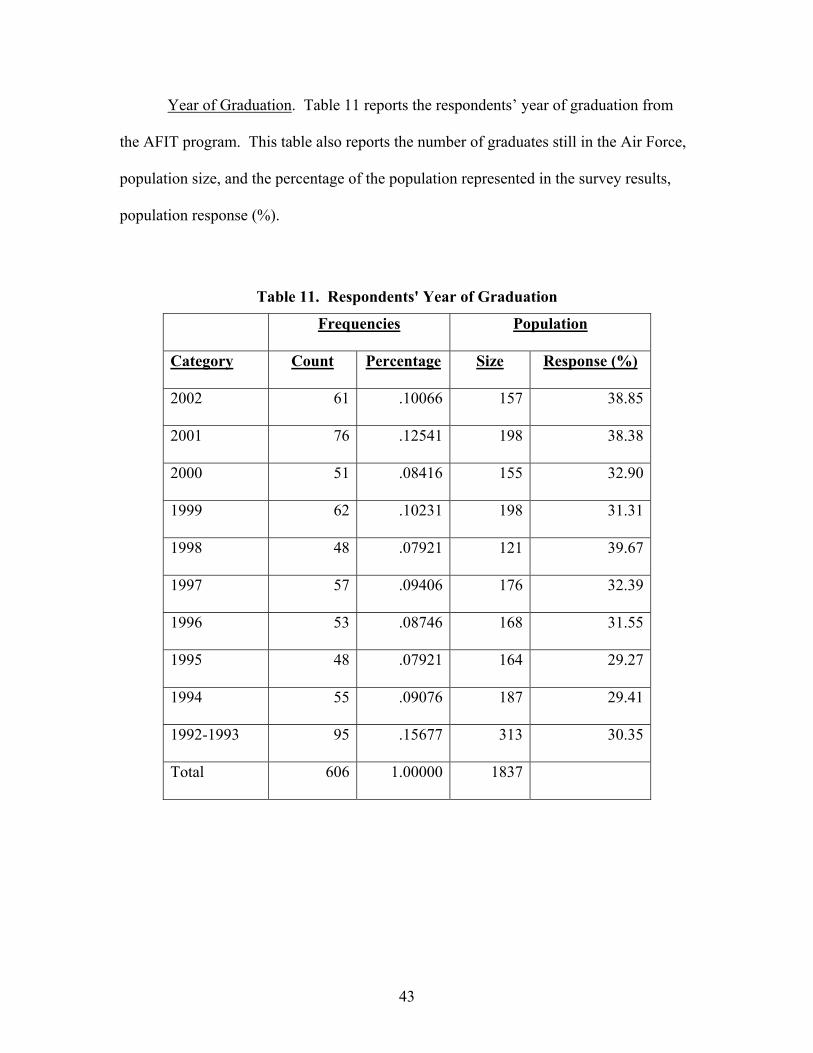
Year of Graduation. Table 11 reports the respondents’ year of graduation from
the AFIT program. This table also reports the number of graduates still in the Air Force,
population size, and the percentage of the population represented in the survey results,
population response (%).
Table 11. Respondents' Year of Graduation
Frequencies Population
Category Count Percentage Size Response (%)
2002 61 .10066 157 38.85
2001 76 .12541 198 38.38
2000 51 .08416 155 32.90
1999 62 .10231 198 31.31
1998 48 .07921 121 39.67
1997 57 .09406 176 32.39
1996 53 .08746 168 31.55
1995 48 .07921 164 29.27
1994 55 .09076 187 29.41
1992-1993 95 .15677 313 30.35
Total 606 1.00000 1837
44
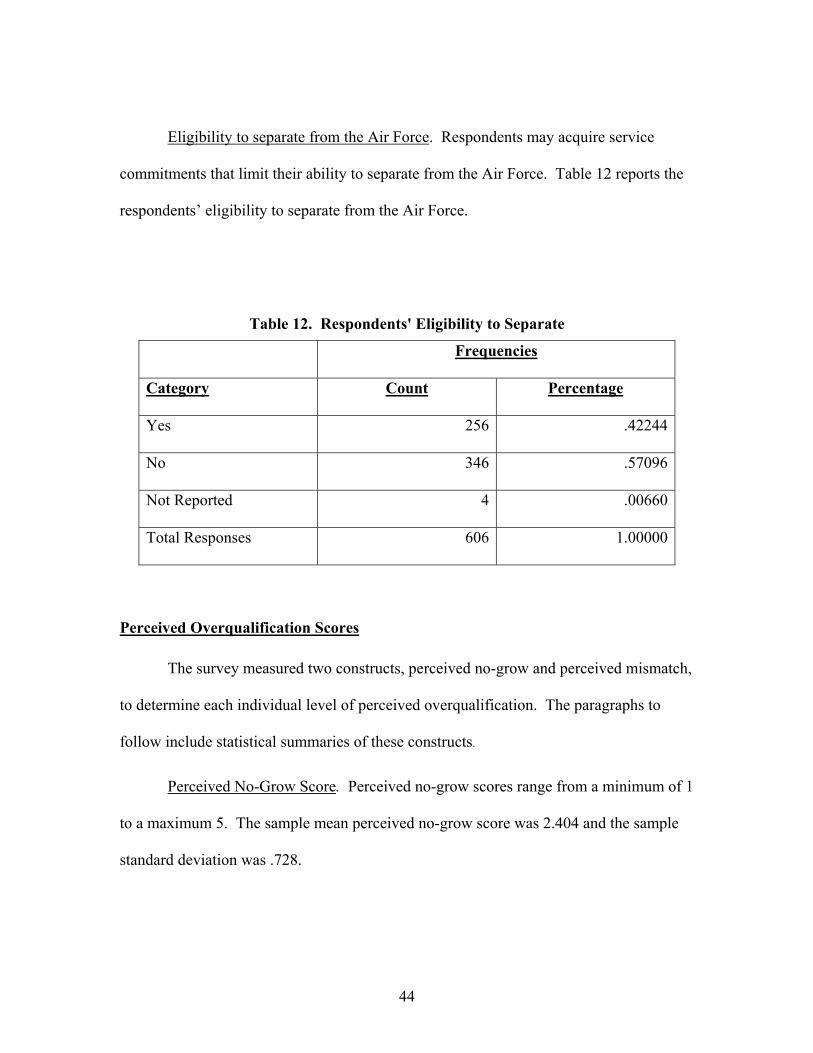
Eligibility to separate from the Air Force. Respondents may acquire service
commitments that limit their ability to separate from the Air Force. Table 12 reports the
respondents’ eligibility to separate from the Air Force.
Table 12. Respondents' Eligibility to Separate
Frequencies
Category Count Percentage
Yes 256 .42244
No 346 .57096
Not Reported 4 .00660
Total Responses 606 1.00000
Perceived Overqualification Scores
The survey measured two constructs, perceived no-grow and perceived mismatch,
to determine each individual level of perceived overqualification. The paragraphs to
follow include statistical summaries of these constructs.
Perceived No-Grow Score. Perceived no-grow scores range from a minimum of 1
to a maximum 5. The sample mean perceived no-grow score was 2.404 and the sample
standard deviation was .728.
45
Perceived Mismatch. Perceived Mismatch scores range from a minimum of 1 to a
maximum 5. The sample mean was 2.823 and the sample standard deviation was .892.
Job Descriptive Index Scores and Organizational Commitment
The survey used four indices from the JDI to measure job satisfaction and Porter
Organizational Commitment Scale to measure commitment. The paragraphs to follow
include statistical summaries of these indices.
Work Satisfaction Index. Work satisfaction scores range from a minimum of 3 to
a maximum of 54, a higher score meaning satisfaction. The sample mean was 33.98 and
the sample standard deviation was 11.00.
Supervision Satisfaction Index. Supervision satisfaction scores range from a
minimum of 5 to a maximum of 54, a higher score meaning satisfaction. The sample
mean was 42.15 and the sample standard deviation was 11.76.
Pay Satisfaction Index. Pay satisfaction scores range from a minimum of 0 to a
maximum of 24, a higher score meaning satisfaction. The sample mean was 15.58 and
the sample standard deviation was 5.53.
Promotion Satisfaction Index. Promotion satisfaction score range from a
minimum of 0 to a maximum of 24, a higher score meaning satisfaction. The sample
mean was 14.69 and the sample standard deviation was 7.88.
Organizational Commitment. Organizational commitment scores range from a
minimum of 22 to a maximum of 75, a higher score meaning higher commitment. The
sample mean was 52.68 and the sample standard deviation was 8.92.
46
Hypothesis Testing
Hypotheses 1-7 were tested in accordance with the data analysis methodology
described in chapter three. Hypotheses 1-3 were tested using regression analysis. If the
p-value for the predictor is greater than .25 it is included if not the predictor is excluded.
The models all have a significant p-value, less than .05. The tables for these three
sections display the following:
Coefficient (Coeff). The model coefficients are provided for the constant and
predictors for each regression test. Those predictors with a p-value greater than .25 were
rejected and not reported.
Standard Error (Std error). The standard error associated with each predictor was
reported. It allows us to tell whether a predictor is likely to overestimate or
underestimate a parameter.
Beta Coefficient (Beta). The beta coefficient is provided for each predictor in the
model. This provides the relative strength of the predictor within the model.
Coefficient of Determination (R2). The coefficient for the model is provided for
each model. The R2 provided is the adjusted R2. It has been adjusted for sample size and
number of parameters and is more conservative than R2. This describes the amount of
variation in the dependent variable that can be explained by the model.
F-statistic (F). The f-statistic for the model is provided for each model. The F-
statistic looks at strength of the relationship between the entire model and the dependent
variable. A higher f-statistic indicates a stronger relationship.

47
Hypotheses 4-7 were tested using analysis of variance (ANOVA). The tables
provided for these sections displays the following:
T-statistic (t-test). The t-statistic is provided for each test. The t-test is a test of
the difference between the means of the two samples. The null hypothesis is that the two
means are equal. A higher t-test value rejects the null and indicates that the means are
different.
P-value (Prob>|t|). The p-value is the significance of the test. A lower p-value
indicates significance. A p-value over .1 indicates that the test is insignificant.
48
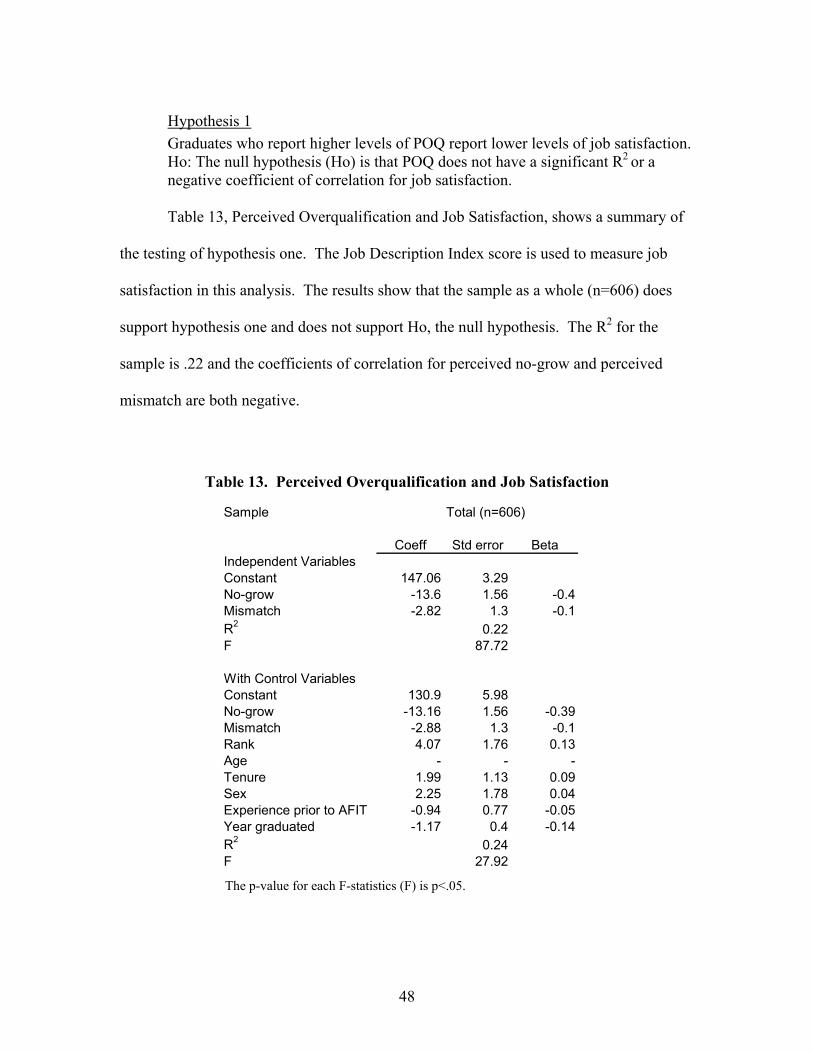
Hypothesis 1 Graduates who report higher levels of POQ report lower levels of job satisfaction. Ho: The null hypothesis (Ho) is that POQ does not have a significant R2 or a negative coefficient of correlation for job satisfaction.
Table 13, Perceived Overqualification and Job Satisfaction, shows a summary of
the testing of hypothesis one. The Job Description Index score is used to measure job
satisfaction in this analysis. The results show that the sample as a whole (n=606) does
support hypothesis one and does not support Ho, the null hypothesis. The R2 for the
sample is .22 and the coefficients of correlation for perceived no-grow and perceived
mismatch are both negative.
Table 13. Perceived Overqualification and Job Satisfaction
Sample Total (n=606)
Coeff Std error BetaIndependent VariablesConstant 147.06 3.29No-grow -13.6 1.56 -0.4Mismatch -2.82 1.3 -0.1R2 0.22F 87.72
With Control VariablesConstant 130.9 5.98No-grow -13.16 1.56 -0.39Mismatch -2.88 1.3 -0.1Rank 4.07 1.76 0.13Age - - -Tenure 1.99 1.13 0.09Sex 2.25 1.78 0.04Experience prior to AFIT -0.94 0.77 -0.05Year graduated -1.17 0.4 -0.14R2 0.24F 27.92 The p-value for each F-statistics (F) is p<.05.
49
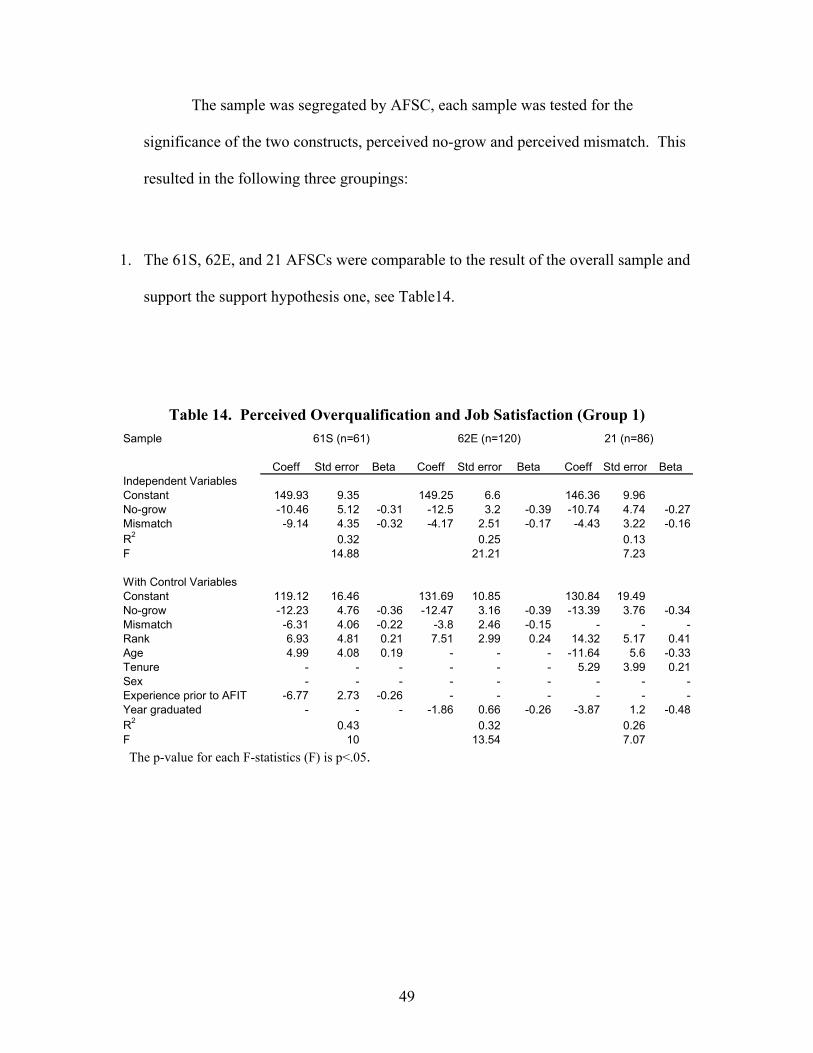
The sample was segregated by AFSC, each sample was tested for the
significance of the two constructs, perceived no-grow and perceived mismatch. This
resulted in the following three groupings:
1. The 61S, 62E, and 21 AFSCs were comparable to the result of the overall sample and
support the support hypothesis one, see Table14.
Table 14. Perceived Overqualification and Job Satisfaction (Group 1) Sample 61S (n=61) 62E (n=120) 21 (n=86)
Coeff Std error Beta Coeff Std error Beta Coeff Std error BetaIndependent VariablesConstant 149.93 9.35 149.25 6.6 146.36 9.96No-grow -10.46 5.12 -0.31 -12.5 3.2 -0.39 -10.74 4.74 -0.27Mismatch -9.14 4.35 -0.32 -4.17 2.51 -0.17 -4.43 3.22 -0.16R2 0.32 0.25 0.13F 14.88 21.21 7.23
With Control VariablesConstant 119.12 16.46 131.69 10.85 130.84 19.49No-grow -12.23 4.76 -0.36 -12.47 3.16 -0.39 -13.39 3.76 -0.34Mismatch -6.31 4.06 -0.22 -3.8 2.46 -0.15 - - -Rank 6.93 4.81 0.21 7.51 2.99 0.24 14.32 5.17 0.41Age 4.99 4.08 0.19 - - - -11.64 5.6 -0.33Tenure - - - - - - 5.29 3.99 0.21Sex - - - - - - - - -Experience prior to AFIT -6.77 2.73 -0.26 - - - - - -Year graduated - - - -1.86 0.66 -0.26 -3.87 1.2 -0.48R2 0.43 0.32 0.26F 10 13.54 7.07
The p-value for each F-statistics (F) is p<.05.
50
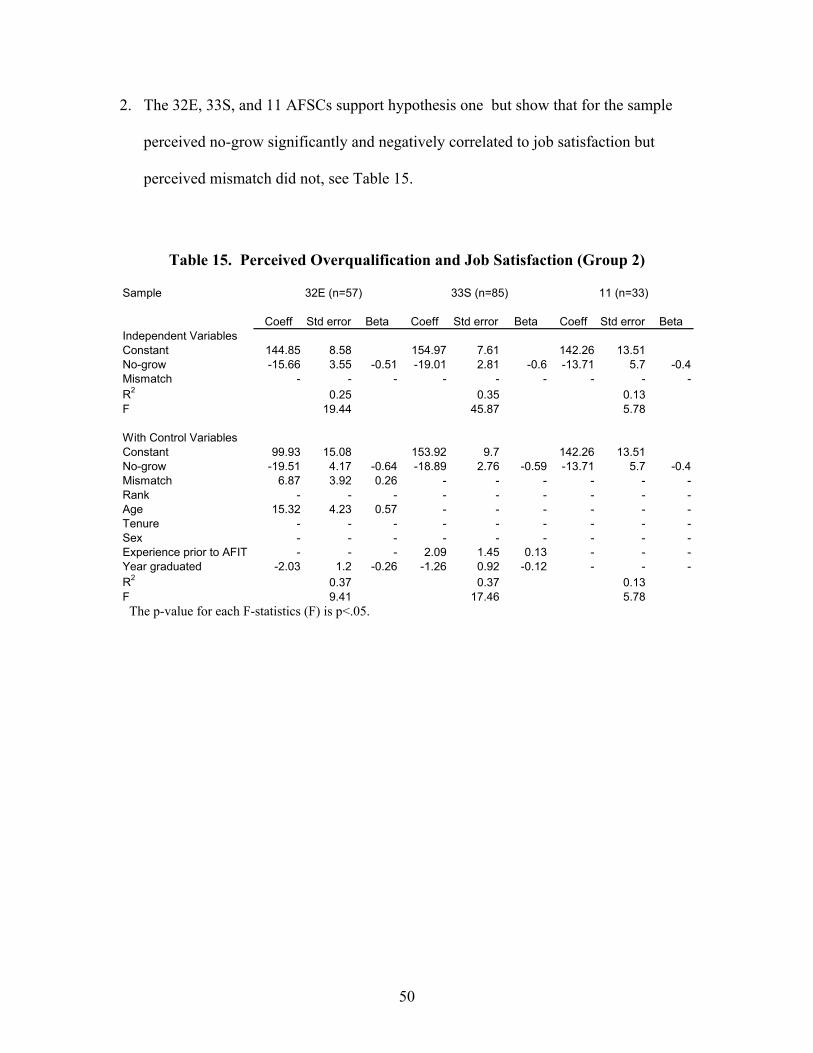
2. The 32E, 33S, and 11 AFSCs support hypothesis one but show that for the sample
perceived no-grow significantly and negatively correlated to job satisfaction but
perceived mismatch did not, see Table 15.
Table 15. Perceived Overqualification and Job Satisfaction (Group 2)
Sample 32E (n=57) 33S (n=85) 11 (n=33)
Coeff Std error Beta Coeff Std error Beta Coeff Std error BetaIndependent VariablesConstant 144.85 8.58 154.97 7.61 142.26 13.51No-grow -15.66 3.55 -0.51 -19.01 2.81 -0.6 -13.71 5.7 -0.4Mismatch - - - - - - - - -R2 0.25 0.35 0.13F 19.44 45.87 5.78
With Control VariablesConstant 99.93 15.08 153.92 9.7 142.26 13.51No-grow -19.51 4.17 -0.64 -18.89 2.76 -0.59 -13.71 5.7 -0.4Mismatch 6.87 3.92 0.26 - - - - - -Rank - - - - - - - - -Age 15.32 4.23 0.57 - - - - - -Tenure - - - - - - - - -Sex - - - - - - - - -Experience prior to AFIT - - - 2.09 1.45 0.13 - - -Year graduated -2.03 1.2 -0.26 -1.26 0.92 -0.12 - - -R2 0.37 0.37 0.13F 9.41 17.46 5.78
The p-value for each F-statistics (F) is p<.05.
51
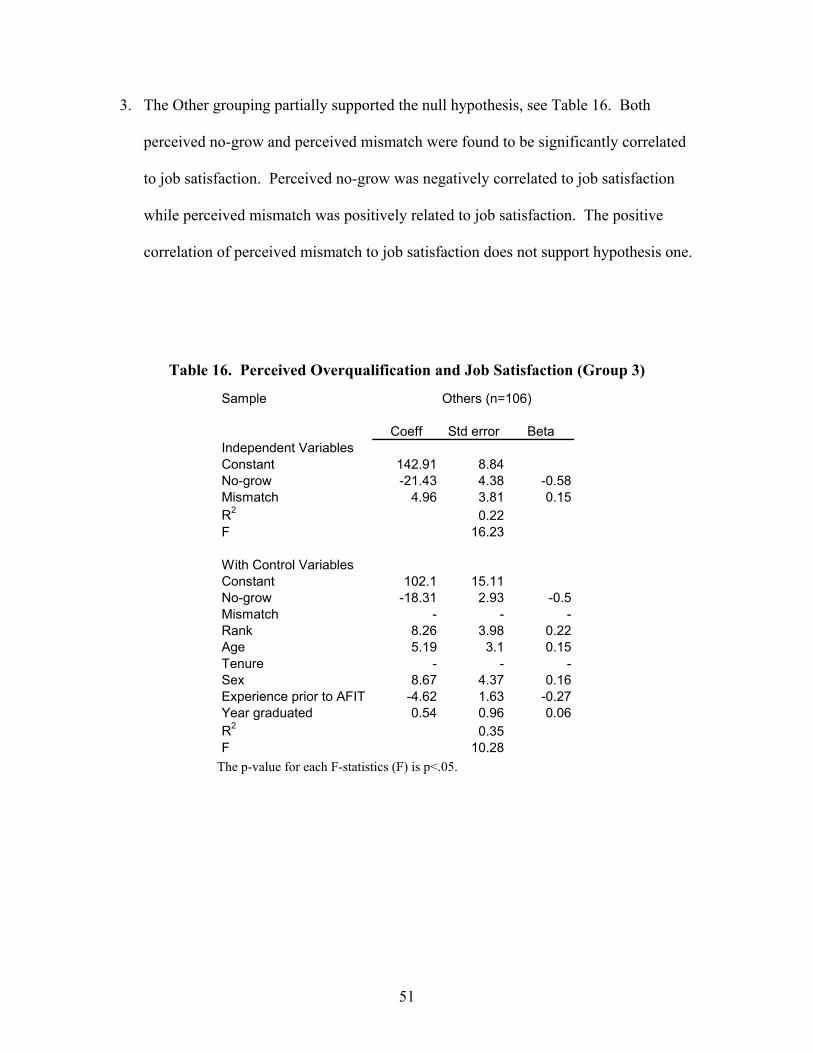
3. The Other grouping partially supported the null hypothesis, see Table 16. Both
perceived no-grow and perceived mismatch were found to be significantly correlated
to job satisfaction. Perceived no-grow was negatively correlated to job satisfaction
while perceived mismatch was positively related to job satisfaction. The positive
correlation of perceived mismatch to job satisfaction does not support hypothesis one.
Table 16. Perceived Overqualification and Job Satisfaction (Group 3)
Sample Others (n=106)
Coeff Std error BetaIndependent VariablesConstant 142.91 8.84No-grow -21.43 4.38 -0.58Mismatch 4.96 3.81 0.15R2 0.22F 16.23
With Control VariablesConstant 102.1 15.11No-grow -18.31 2.93 -0.5Mismatch - - -Rank 8.26 3.98 0.22Age 5.19 3.1 0.15Tenure - - -Sex 8.67 4.37 0.16Experience prior to AFIT -4.62 1.63 -0.27Year graduated 0.54 0.96 0.06R2 0.35F 10.28
The p-value for each F-statistics (F) is p<.05.
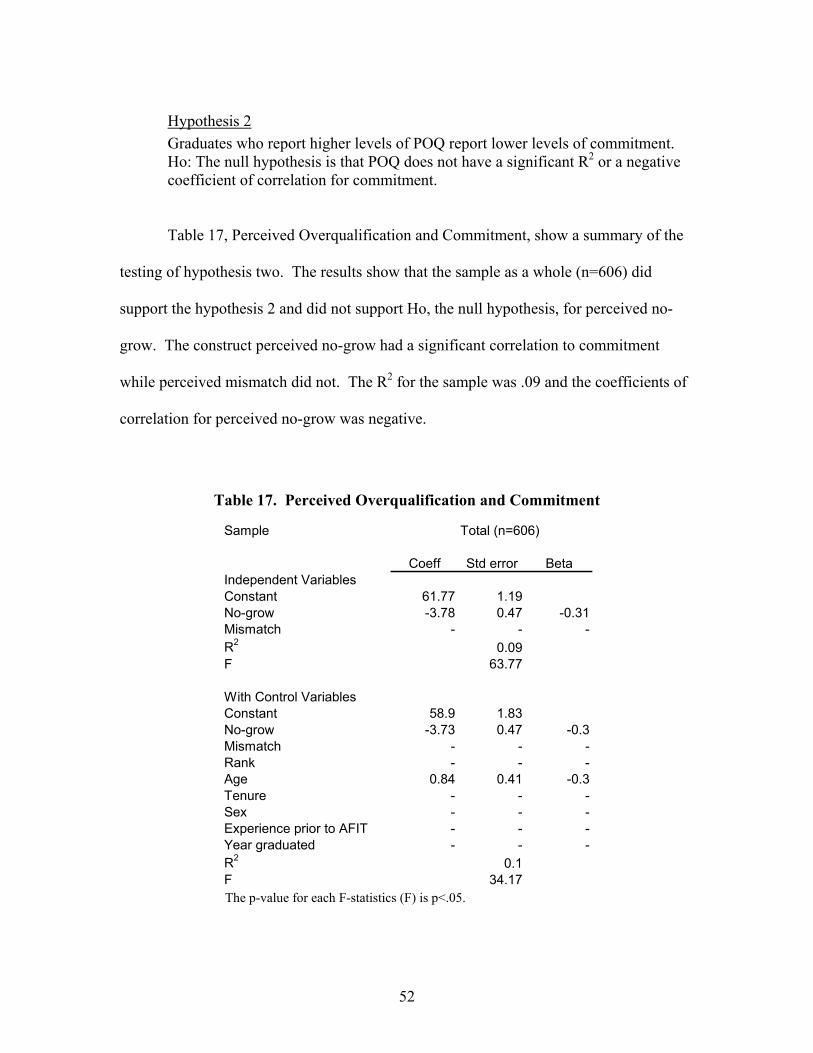
52
Hypothesis 2 Graduates who report higher levels of POQ report lower levels of commitment. Ho: The null hypothesis is that POQ does not have a significant R2 or a negative coefficient of correlation for commitment.
Table 17, Perceived Overqualification and Commitment, show a summary of the
testing of hypothesis two. The results show that the sample as a whole (n=606) did
support the hypothesis 2 and did not support Ho, the null hypothesis, for perceived no-
grow. The construct perceived no-grow had a significant correlation to commitment
while perceived mismatch did not. The R2 for the sample was .09 and the coefficients of
correlation for perceived no-grow was negative.
Table 17. Perceived Overqualification and Commitment
Sample Total (n=606)
Coeff Std error BetaIndependent VariablesConstant 61.77 1.19No-grow -3.78 0.47 -0.31Mismatch - - -R2 0.09F 63.77
With Control VariablesConstant 58.9 1.83No-grow -3.73 0.47 -0.3Mismatch - - -Rank - - -Age 0.84 0.41 -0.3Tenure - - -Sex - - -Experience prior to AFIT - - -Year graduated - - -R2 0.1F 34.17
The p-value for each F-statistics (F) is p<.05.
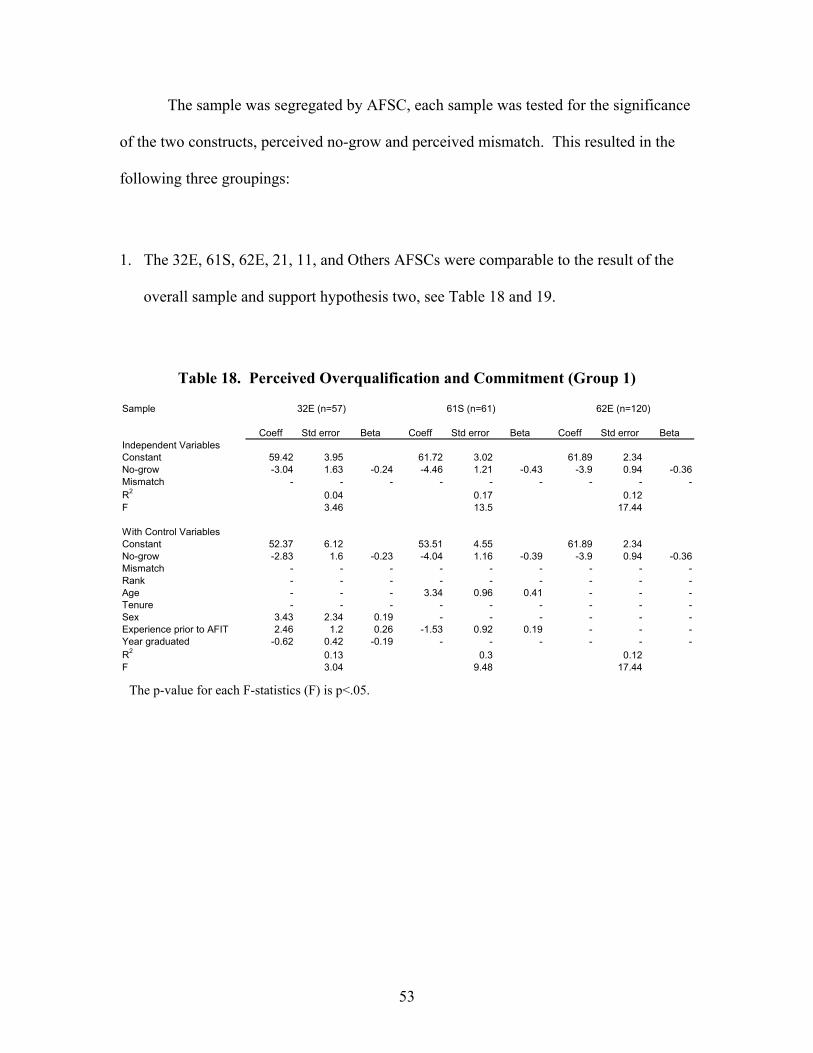
53
The sample was segregated by AFSC, each sample was tested for the significance
of the two constructs, perceived no-grow and perceived mismatch. This resulted in the
following three groupings:
1. The 32E, 61S, 62E, 21, 11, and Others AFSCs were comparable to the result of the
overall sample and support hypothesis two, see Table 18 and 19.
Table 18. Perceived Overqualification and Commitment (Group 1)
Sample 32E (n=57) 61S (n=61) 62E (n=120)
Coeff Std error Beta Coeff Std error Beta Coeff Std error BetaIndependent VariablesConstant 59.42 3.95 61.72 3.02 61.89 2.34No-grow -3.04 1.63 -0.24 -4.46 1.21 -0.43 -3.9 0.94 -0.36Mismatch - - - - - - - - -R2 0.04 0.17 0.12F 3.46 13.5 17.44
With Control VariablesConstant 52.37 6.12 53.51 4.55 61.89 2.34No-grow -2.83 1.6 -0.23 -4.04 1.16 -0.39 -3.9 0.94 -0.36Mismatch - - - - - - - - -Rank - - - - - - - - -Age - - - 3.34 0.96 0.41 - - -Tenure - - - - - - - - -Sex 3.43 2.34 0.19 - - - - - -Experience prior to AFIT 2.46 1.2 0.26 -1.53 0.92 0.19 - - -Year graduated -0.62 0.42 -0.19 - - - - - -R2 0.13 0.3 0.12F 3.04 9.48 17.44
The p-value for each F-statistics (F) is p<.05.
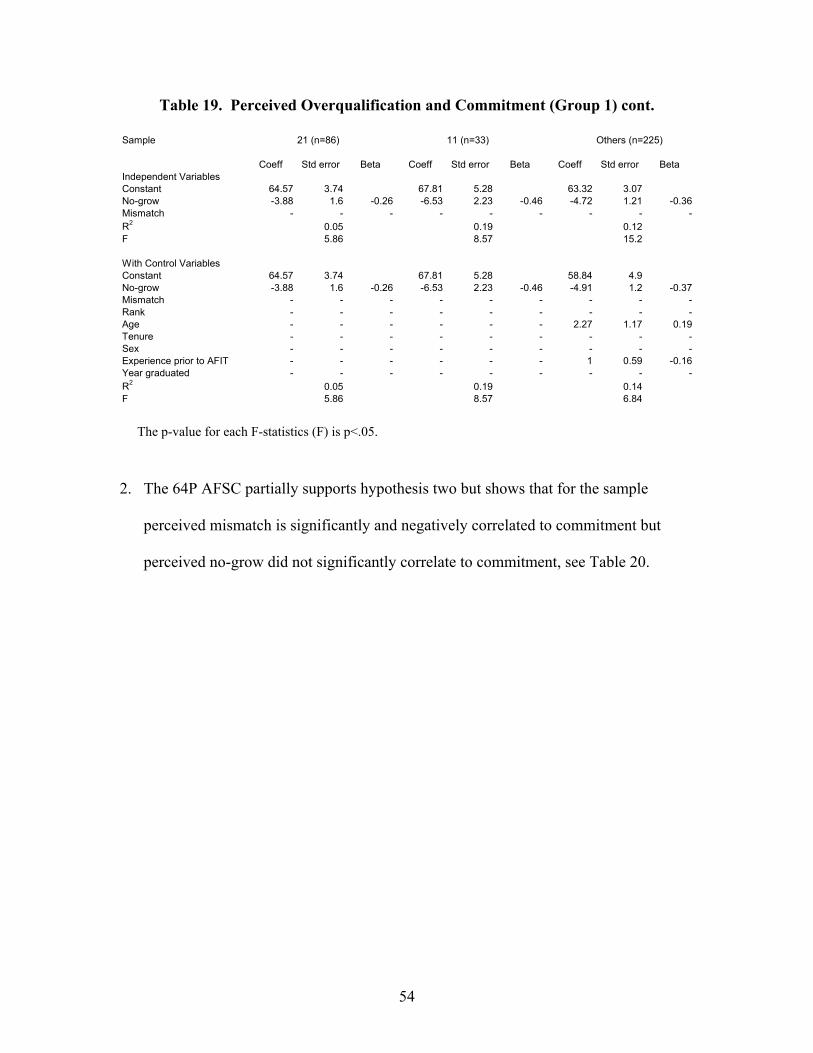
54
Table 19. Perceived Overqualification and Commitment (Group 1) cont.
Sample 21 (n=86) 11 (n=33) Others (n=225)
Coeff Std error Beta Coeff Std error Beta Coeff Std error BetaIndependent VariablesConstant 64.57 3.74 67.81 5.28 63.32 3.07No-grow -3.88 1.6 -0.26 -6.53 2.23 -0.46 -4.72 1.21 -0.36Mismatch - - - - - - - - -R2 0.05 0.19 0.12F 5.86 8.57 15.2
With Control VariablesConstant 64.57 3.74 67.81 5.28 58.84 4.9No-grow -3.88 1.6 -0.26 -6.53 2.23 -0.46 -4.91 1.2 -0.37Mismatch - - - - - - - - -Rank - - - - - - - - -Age - - - - - - 2.27 1.17 0.19Tenure - - - - - - - - -Sex - - - - - - - - -Experience prior to AFIT - - - - - - 1 0.59 -0.16Year graduated - - - - - - - - -R2 0.05 0.19 0.14F 5.86 8.57 6.84
2. The 64P AFSC partially supports hypothesis two but shows that for the sample
perceived mismatch is significantly and negatively correlated to commitment but
perceived no-grow did not significantly correlate to commitment, see Table 20.
The p-value for each F-statistics (F) is p<.05.
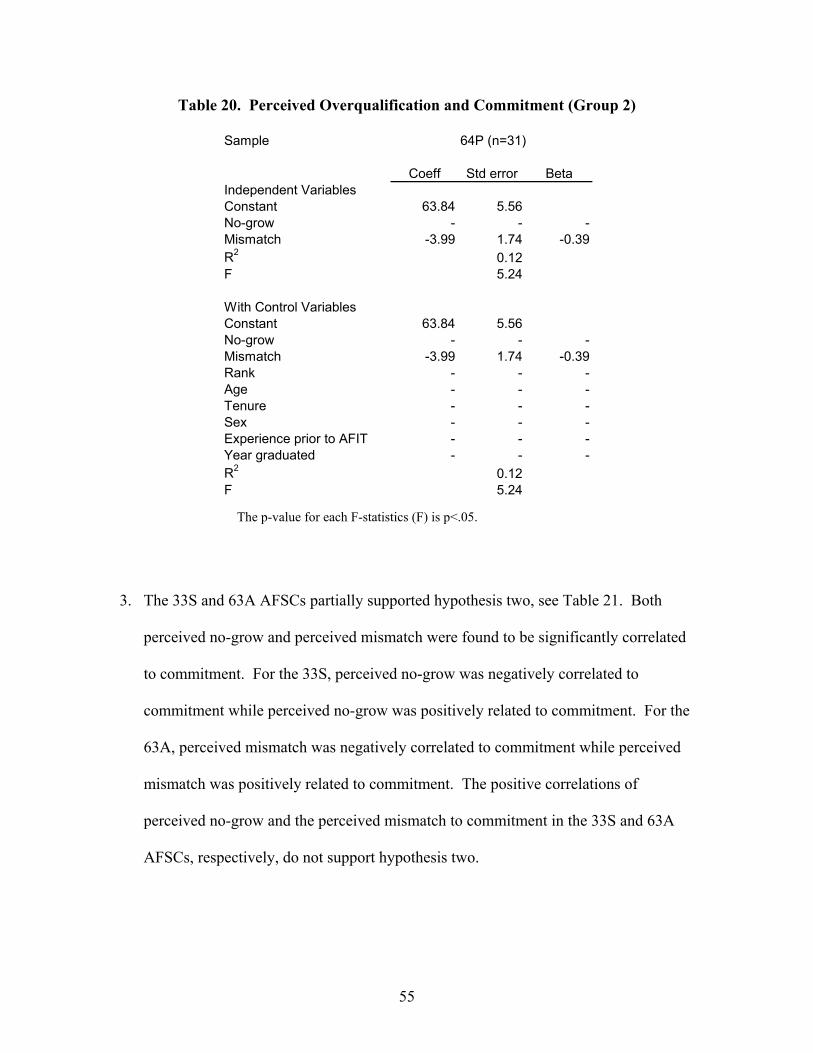
55
Table 20. Perceived Overqualification and Commitment (Group 2)
Sample 64P (n=31)
Coeff Std error BetaIndependent VariablesConstant 63.84 5.56No-grow - - -Mismatch -3.99 1.74 -0.39R2 0.12F 5.24
With Control VariablesConstant 63.84 5.56No-grow - - -Mismatch -3.99 1.74 -0.39Rank - - -Age - - -Tenure - - -Sex - - -Experience prior to AFIT - - -Year graduated - - -R2 0.12F 5.24
3. The 33S and 63A AFSCs partially supported hypothesis two, see Table 21. Both
perceived no-grow and perceived mismatch were found to be significantly correlated
to commitment. For the 33S, perceived no-grow was negatively correlated to
commitment while perceived no-grow was positively related to commitment. For the
63A, perceived mismatch was negatively correlated to commitment while perceived
mismatch was positively related to commitment. The positive correlations of
perceived no-grow and the perceived mismatch to commitment in the 33S and 63A
AFSCs, respectively, do not support hypothesis two.
The p-value for each F-statistics (F) is p<.05.
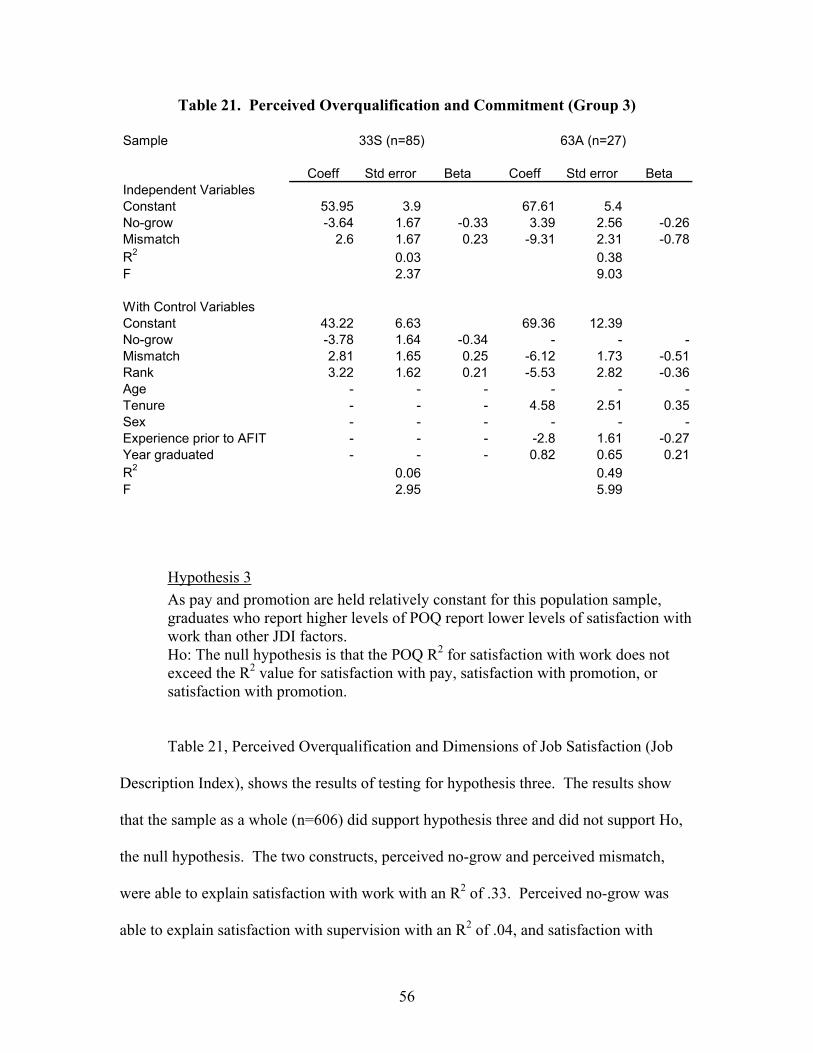
56
Table 21. Perceived Overqualification and Commitment (Group 3)
Sample 33S (n=85) 63A (n=27)
Coeff Std error Beta Coeff Std error BetaIndependent VariablesConstant 53.95 3.9 67.61 5.4No-grow -3.64 1.67 -0.33 3.39 2.56 -0.26Mismatch 2.6 1.67 0.23 -9.31 2.31 -0.78R2 0.03 0.38F 2.37 9.03
With Control VariablesConstant 43.22 6.63 69.36 12.39No-grow -3.78 1.64 -0.34 - - -Mismatch 2.81 1.65 0.25 -6.12 1.73 -0.51Rank 3.22 1.62 0.21 -5.53 2.82 -0.36Age - - - - - -Tenure - - - 4.58 2.51 0.35Sex - - - - - -Experience prior to AFIT - - - -2.8 1.61 -0.27Year graduated - - - 0.82 0.65 0.21R2 0.06 0.49F 2.95 5.99
Hypothesis 3 As pay and promotion are held relatively constant for this population sample, graduates who report higher levels of POQ report lower levels of satisfaction with work than other JDI factors. Ho: The null hypothesis is that the POQ R2 for satisfaction with work does not exceed the R2 value for satisfaction with pay, satisfaction with promotion, or satisfaction with promotion.
Table 21, Perceived Overqualification and Dimensions of Job Satisfaction (Job
Description Index), shows the results of testing for hypothesis three. The results show
that the sample as a whole (n=606) did support hypothesis three and did not support Ho,
the null hypothesis. The two constructs, perceived no-grow and perceived mismatch,
were able to explain satisfaction with work with an R2 of .33. Perceived no-grow was
able to explain satisfaction with supervision with an R2 of .04, and satisfaction with
57
promotion with an R2 of .14; however, it was unable to explain satisfaction with pay with
a significant R2. Perceived mismatch was unable to explain any of the three with a
significant R2.for the sample was .09 and the coefficients of correlation for perceived no-
grow was negative.
When the sample is segregated by AFSC, each sample was tested and the results
supported hypothesis three and were comparable to the overall sample. Each of the
AFSCs was able to explain the dimension satisfaction with work with a higher R2 than
they were able to explain any other dimension, see Table 22 and Table 23.
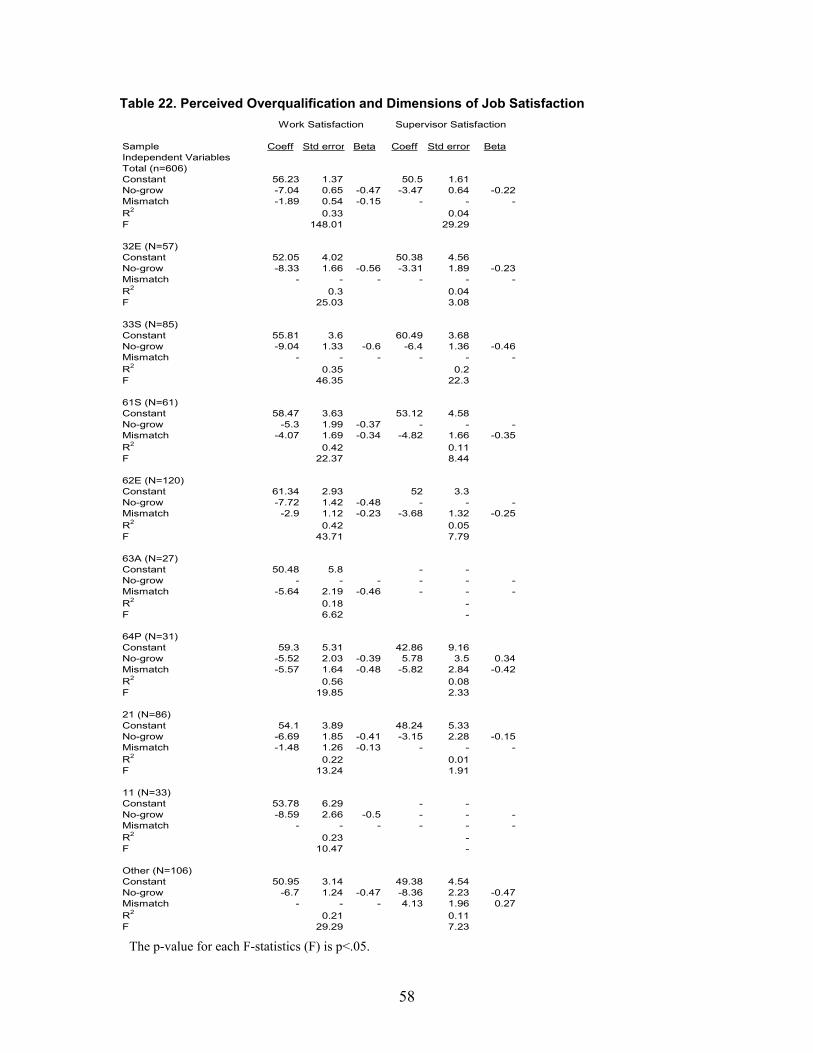
58
Table 22. Perceived Overqualification and Dimensions of Job Satisfaction
Sample Coeff Std error Beta Coeff Std error BetaIndependent VariablesTotal (n=606)Constant 56.23 1.37 50.5 1.61No-grow -7.04 0.65 -0.47 -3.47 0.64 -0.22Mismatch -1.89 0.54 -0.15 - - -R2 0.33 0.04F 148.01 29.29
32E (N=57)Constant 52.05 4.02 50.38 4.56No-grow -8.33 1.66 -0.56 -3.31 1.89 -0.23Mismatch - - - - - -R2 0.3 0.04F 25.03 3.08
33S (N=85)Constant 55.81 3.6 60.49 3.68No-grow -9.04 1.33 -0.6 -6.4 1.36 -0.46Mismatch - - - - - -R2 0.35 0.2F 46.35 22.3
61S (N=61)Constant 58.47 3.63 53.12 4.58No-grow -5.3 1.99 -0.37 - - -Mismatch -4.07 1.69 -0.34 -4.82 1.66 -0.35R2 0.42 0.11F 22.37 8.44
62E (N=120)Constant 61.34 2.93 52 3.3No-grow -7.72 1.42 -0.48 - - -Mismatch -2.9 1.12 -0.23 -3.68 1.32 -0.25R2 0.42 0.05F 43.71 7.79
63A (N=27)Constant 50.48 5.8 - -No-grow - - - - - -Mismatch -5.64 2.19 -0.46 - - -R2 0.18 -F 6.62 -
64P (N=31)Constant 59.3 5.31 42.86 9.16No-grow -5.52 2.03 -0.39 5.78 3.5 0.34Mismatch -5.57 1.64 -0.48 -5.82 2.84 -0.42R2 0.56 0.08F 19.85 2.33
21 (N=86)Constant 54.1 3.89 48.24 5.33No-grow -6.69 1.85 -0.41 -3.15 2.28 -0.15Mismatch -1.48 1.26 -0.13 - - -R2 0.22 0.01F 13.24 1.91
11 (N=33)Constant 53.78 6.29 - -No-grow -8.59 2.66 -0.5 - - -Mismatch - - - - - -R2 0.23 -F 10.47 -
Other (N=106)Constant 50.95 3.14 49.38 4.54No-grow -6.7 1.24 -0.47 -8.36 2.23 -0.47Mismatch - - - 4.13 1.96 0.27R2 0.21 0.11F 29.29 7.23
Work Satisfaction Supervisor Satisfaction
The p-value for each F-statistics (F) is p<.05.
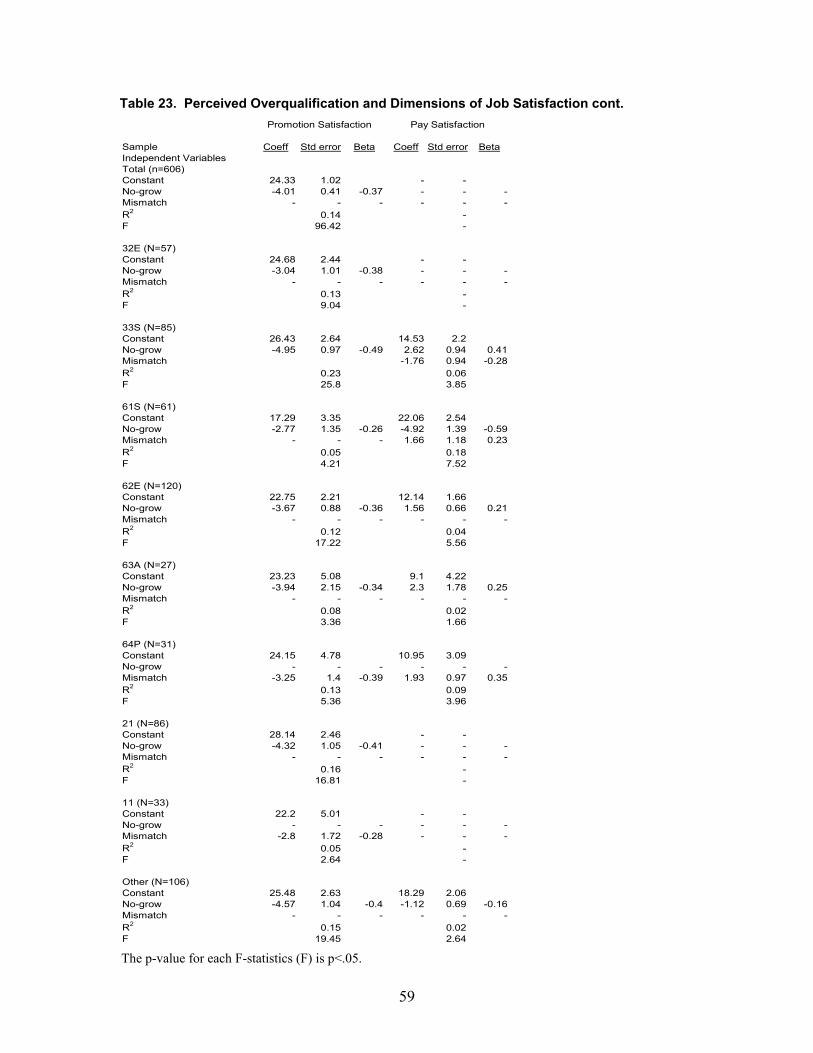
59
Table 23. Perceived Overqualification and Dimensions of Job Satisfaction cont.
Sample Coeff Std error Beta Coeff Std error BetaIndependent VariablesTotal (n=606)Constant 24.33 1.02 - -No-grow -4.01 0.41 -0.37 - - -Mismatch - - - - - -R2 0.14 -F 96.42 -
32E (N=57)Constant 24.68 2.44 - -No-grow -3.04 1.01 -0.38 - - -Mismatch - - - - - -R2 0.13 -F 9.04 -
33S (N=85)Constant 26.43 2.64 14.53 2.2No-grow -4.95 0.97 -0.49 2.62 0.94 0.41Mismatch -1.76 0.94 -0.28R2 0.23 0.06F 25.8 3.85
61S (N=61)Constant 17.29 3.35 22.06 2.54No-grow -2.77 1.35 -0.26 -4.92 1.39 -0.59Mismatch - - - 1.66 1.18 0.23R2 0.05 0.18F 4.21 7.52
62E (N=120)Constant 22.75 2.21 12.14 1.66No-grow -3.67 0.88 -0.36 1.56 0.66 0.21Mismatch - - - - - -R2 0.12 0.04F 17.22 5.56
63A (N=27)Constant 23.23 5.08 9.1 4.22No-grow -3.94 2.15 -0.34 2.3 1.78 0.25Mismatch - - - - - -R2 0.08 0.02F 3.36 1.66
64P (N=31)Constant 24.15 4.78 10.95 3.09No-grow - - - - - -Mismatch -3.25 1.4 -0.39 1.93 0.97 0.35R2 0.13 0.09F 5.36 3.96
21 (N=86)Constant 28.14 2.46 - -No-grow -4.32 1.05 -0.41 - - -Mismatch - - - - - -R2 0.16 -F 16.81 -
11 (N=33)Constant 22.2 5.01 - -No-grow - - - - - -Mismatch -2.8 1.72 -0.28 - - -R2 0.05 -F 2.64 -
Other (N=106)Constant 25.48 2.63 18.29 2.06No-grow -4.57 1.04 -0.4 -1.12 0.69 -0.16Mismatch - - - - - -R2 0.15 0.02F 19.45 2.64
Promotion Satisfaction Pay Satisfaction
The p-value for each F-statistics (F) is p<.05.
60
Hypothesis 4 Graduates that report turnover intent report higher levels of POQ. Ho: The null hypothesis is that there is not significant difference between the mean levels of POQ or, those with turnover intent do not have a higher mean score for POQ.
To test hypothesis four, the original sample (n=606) was sorted by responses to
the question “Did/do you intend to leave the Air Force when you complete(d) your AFIT
commitment?” The breakdown of responses was 75 “yes”, 462 “no”, and 69 “cannot
decide” or “did not respond.” To test hypothesis four, the mean levels of perceived no-
grow and perceived mismatch were compared for the “yes” responses, scored a “1”, and
the “no” responses, scored a “3”.
Perceived No-Grow. The results show that the sample (n=537) did support
hypothesis four and rejects Ho, the null hypothesis. Those that answered “yes” they
intend to separate, had a sample mean for perceived no-grow of 2.53 compared to a
sample mean of 2.37 for those who answered “no.” The mean score for those intending
to separate is higher compared to those not intending to separate. A Levene test was
conducted to test for equal variances. The results for the Levene test were a t-statistic of
6.35 with a p-value of less than .05. Therefore we can conclude that the variances are
equal. The t-statistic was 1.76 and the p-value for the significance of the test was .0791.
The test is significant and the results show that the means for the two groups are
significantly different, see Table 24.
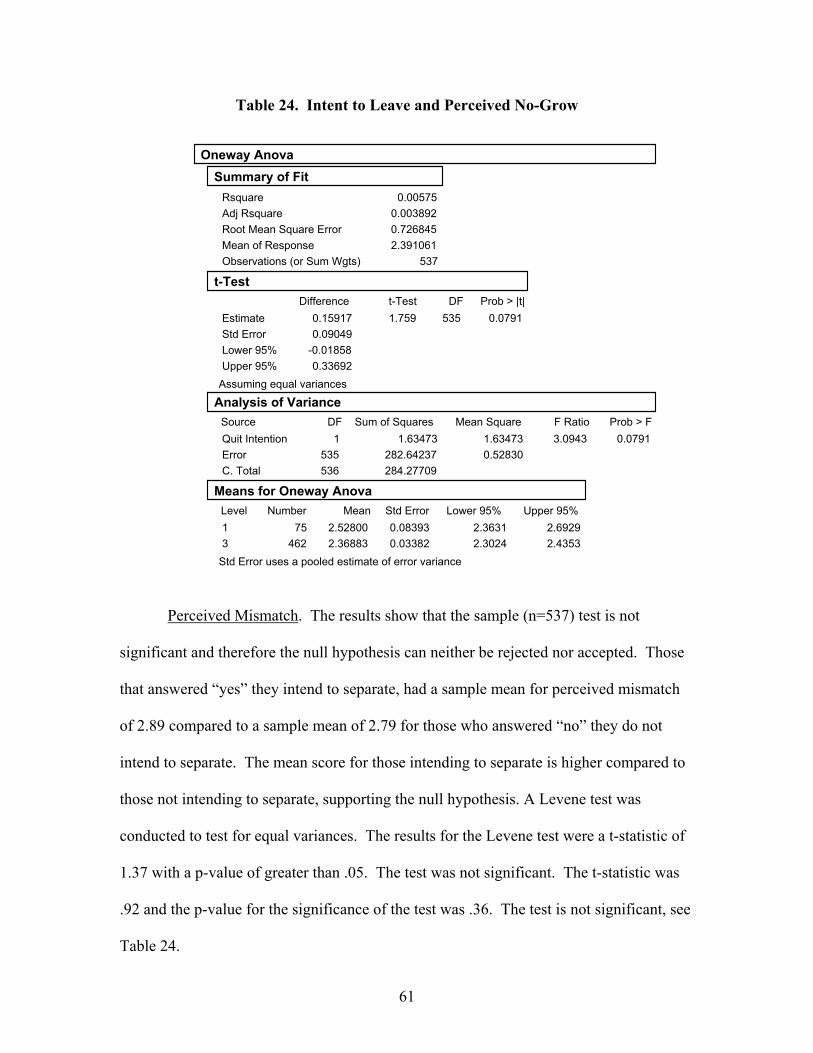
61
Table 24. Intent to Leave and Perceived No-Grow
Perceived Mismatch. The results show that the sample (n=537) test is not
significant and therefore the null hypothesis can neither be rejected nor accepted. Those
that answered “yes” they intend to separate, had a sample mean for perceived mismatch
of 2.89 compared to a sample mean of 2.79 for those who answered “no” they do not
intend to separate. The mean score for those intending to separate is higher compared to
those not intending to separate, supporting the null hypothesis. A Levene test was
conducted to test for equal variances. The results for the Levene test were a t-statistic of
1.37 with a p-value of greater than .05. The test was not significant. The t-statistic was
.92 and the p-value for the significance of the test was .36. The test is not significant, see
Table 24.
RsquareAdj RsquareRoot Mean Square ErrorMean of ResponseObservations (or Sum Wgts)
0.005750.0038920.7268452.391061
537
Summary of Fit
EstimateStd ErrorLower 95%Upper 95%
0.15917 0.09049-0.01858 0.33692
Difference 1.759
t-Test 535
DF 0.0791Prob > |t|
Assuming equal variances
t-Test
Quit IntentionErrorC. Total
Source 1
535 536
DF 1.63473
282.64237 284.27709
Sum of Squares 1.63473 0.52830
Mean Square 3.0943
F Ratio 0.0791Prob > F
Analysis of Variance
13
Level 75
462
Number 2.52800 2.36883
Mean0.083930.03382
Std Error 2.3631 2.3024
Lower 95% 2.6929 2.4353
Upper 95%
Std Error uses a pooled estimate of error variance
Means for Oneway Anova
Oneway Anova
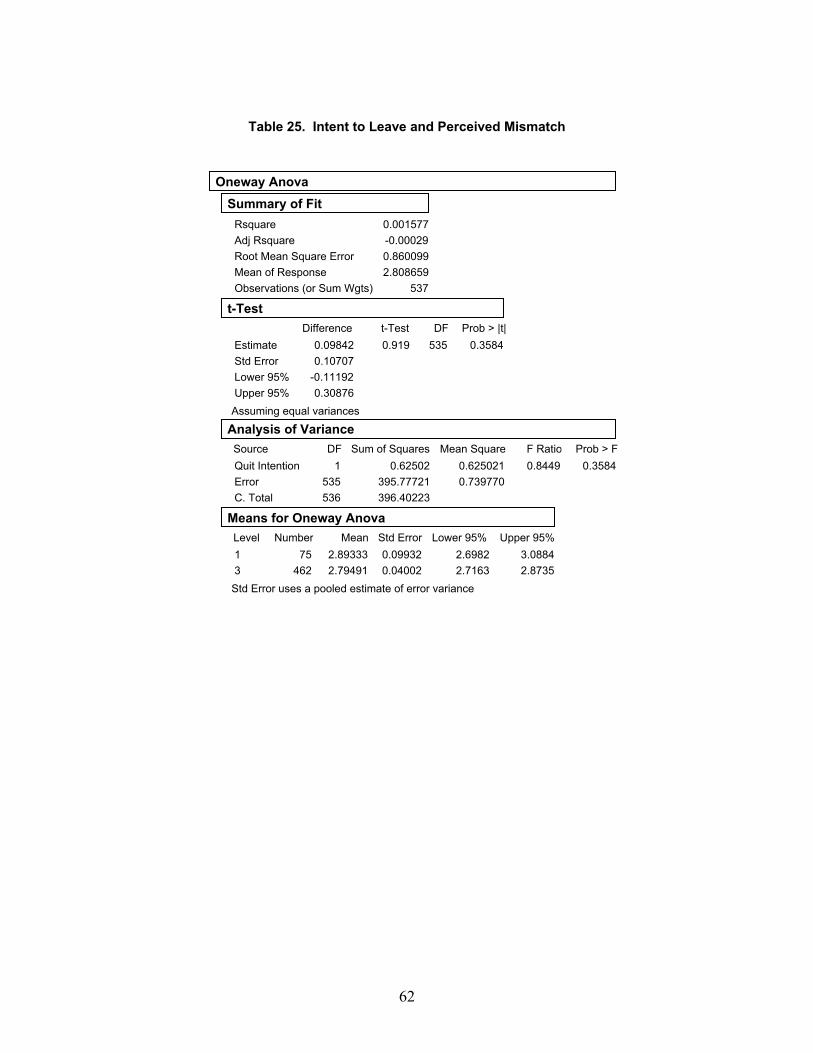
62
Table 25. Intent to Leave and Perceived Mismatch
RsquareAdj RsquareRoot Mean Square ErrorMean of ResponseObservations (or Sum Wgts)
0.001577-0.000290.8600992.808659
537
Summary of Fit
EstimateStd ErrorLower 95%Upper 95%
0.09842 0.10707-0.11192 0.30876
Difference 0.919
t-Test 535
DF 0.3584Prob > |t|
Assuming equal variances
t-Test
Quit IntentionErrorC. Total
Source 1
535 536
DF 0.62502
395.77721 396.40223
Sum of Squares0.6250210.739770
Mean Square 0.8449F Ratio
0.3584Prob > F
Analysis of Variance
13
Level 75 462
Number 2.89333 2.79491
Mean0.099320.04002
Std Error 2.6982 2.7163
Lower 95% 3.0884 2.8735
Upper 95%
Std Error uses a pooled estimate of error variance
Means for Oneway Anova
Oneway Anova
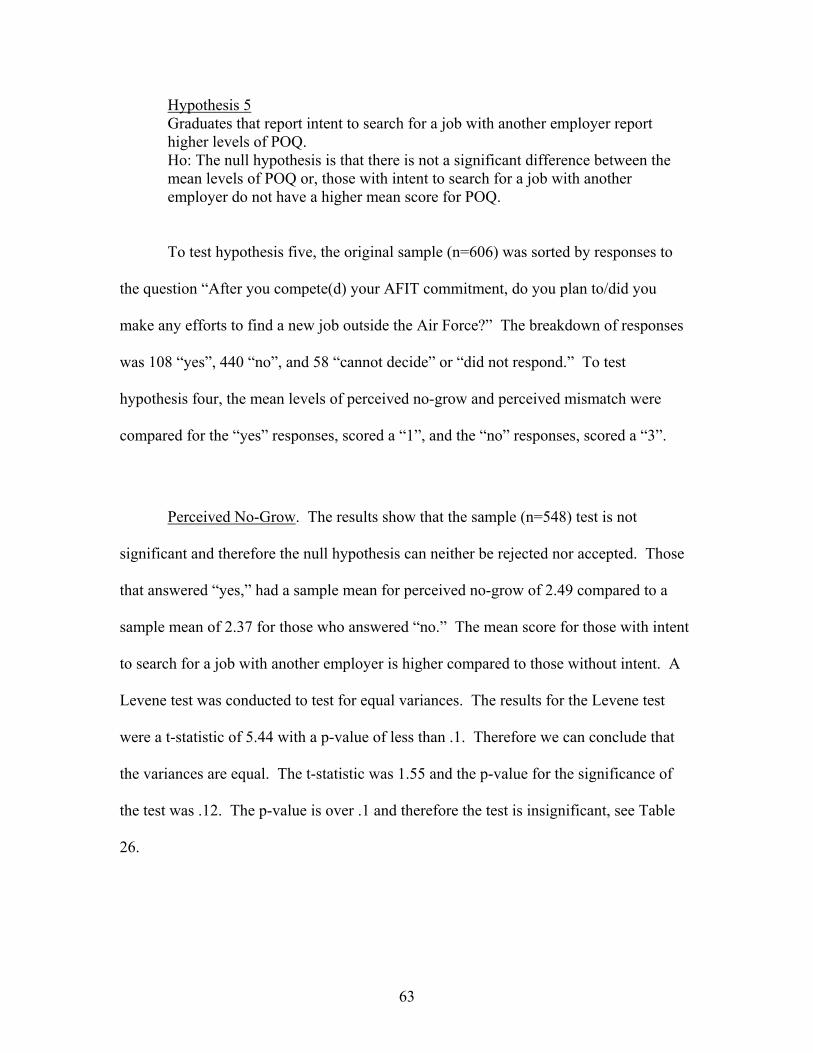
63
Hypothesis 5 Graduates that report intent to search for a job with another employer report higher levels of POQ. Ho: The null hypothesis is that there is not a significant difference between the mean levels of POQ or, those with intent to search for a job with another employer do not have a higher mean score for POQ.
To test hypothesis five, the original sample (n=606) was sorted by responses to
the question “After you compete(d) your AFIT commitment, do you plan to/did you
make any efforts to find a new job outside the Air Force?” The breakdown of responses
was 108 “yes”, 440 “no”, and 58 “cannot decide” or “did not respond.” To test
hypothesis four, the mean levels of perceived no-grow and perceived mismatch were
compared for the “yes” responses, scored a “1”, and the “no” responses, scored a “3”.
Perceived No-Grow. The results show that the sample (n=548) test is not
significant and therefore the null hypothesis can neither be rejected nor accepted. Those
that answered “yes,” had a sample mean for perceived no-grow of 2.49 compared to a
sample mean of 2.37 for those who answered “no.” The mean score for those with intent
to search for a job with another employer is higher compared to those without intent. A
Levene test was conducted to test for equal variances. The results for the Levene test
were a t-statistic of 5.44 with a p-value of less than .1. Therefore we can conclude that
the variances are equal. The t-statistic was 1.55 and the p-value for the significance of
the test was .12. The p-value is over .1 and therefore the test is insignificant, see Table
26.
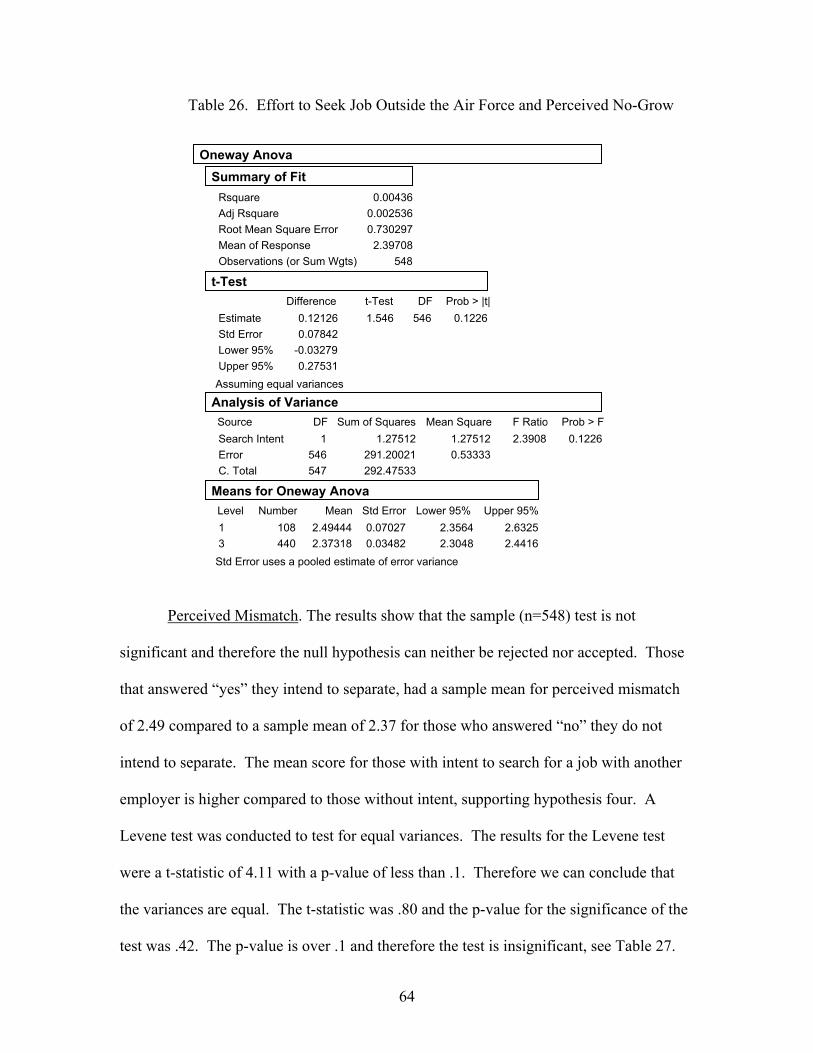
64
Table 26. Effort to Seek Job Outside the Air Force and Perceived No-Grow
Perceived Mismatch. The results show that the sample (n=548) test is not
significant and therefore the null hypothesis can neither be rejected nor accepted. Those
that answered “yes” they intend to separate, had a sample mean for perceived mismatch
of 2.49 compared to a sample mean of 2.37 for those who answered “no” they do not
intend to separate. The mean score for those with intent to search for a job with another
employer is higher compared to those without intent, supporting hypothesis four. A
Levene test was conducted to test for equal variances. The results for the Levene test
were a t-statistic of 4.11 with a p-value of less than .1. Therefore we can conclude that
the variances are equal. The t-statistic was .80 and the p-value for the significance of the
test was .42. The p-value is over .1 and therefore the test is insignificant, see Table 27.
RsquareAdj RsquareRoot Mean Square ErrorMean of ResponseObservations (or Sum Wgts)
0.004360.0025360.730297 2.39708
548
Summary of Fit
EstimateStd ErrorLower 95%Upper 95%
0.12126 0.07842-0.03279 0.27531
Difference 1.546
t-Test 546
DF 0.1226Prob > |t|
Assuming equal variances
t-Test
Search IntentErrorC. Total
Source 1
546 547
DF 1.27512
291.20021 292.47533
Sum of Squares 1.27512 0.53333
Mean Square 2.3908F Ratio
0.1226Prob > F
Analysis of Variance
13
Level 108 440
Number 2.49444 2.37318
Mean0.070270.03482
Std Error 2.3564 2.3048
Lower 95% 2.6325 2.4416
Upper 95%
Std Error uses a pooled estimate of error variance
Means for Oneway Anova
Oneway Anova
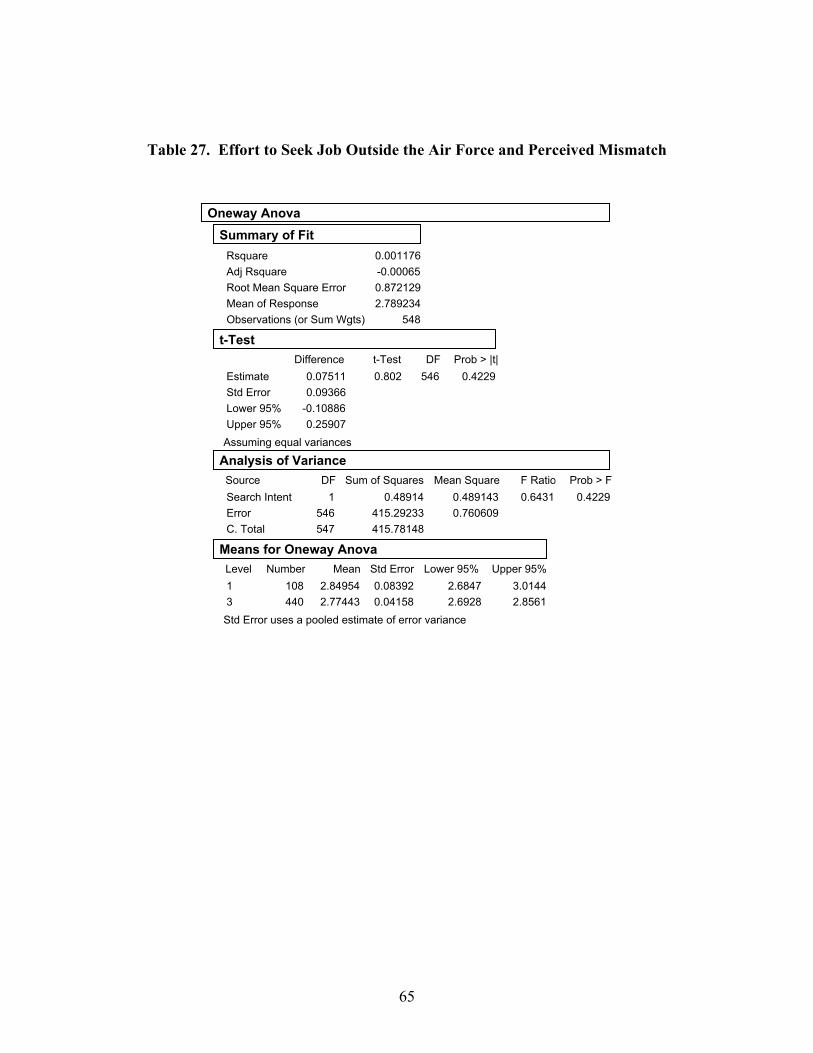
65
Table 27. Effort to Seek Job Outside the Air Force and Perceived Mismatch
RsquareAdj RsquareRoot Mean Square ErrorMean of ResponseObservations (or Sum Wgts)
0.001176-0.000650.8721292.789234
548
Summary of Fit
EstimateStd ErrorLower 95%Upper 95%
0.07511 0.09366-0.10886 0.25907
Difference 0.802
t-Test 546
DF 0.4229Prob > |t|
Assuming equal variances
t-Test
Search IntentErrorC. Total
Source 1
546 547
DF 0.48914
415.29233 415.78148
Sum of Squares0.4891430.760609
Mean Square 0.6431F Ratio
0.4229Prob > F
Analysis of Variance
13
Level 108 440
Number 2.84954 2.77443
Mean0.083920.04158
Std Error 2.6847 2.6928
Lower 95% 3.0144 2.8561
Upper 95%
Std Error uses a pooled estimate of error variance
Means for Oneway Anova
Oneway Anova
66
Hypothesis 6 Graduates that report intent to search for a job within the Air Force report higher levels of POQ. Ho: The null hypothesis is that there is not a significant difference between the mean levels of POQ or, those with intent to search for a job within the Air Force do not have a higher mean score for POQ.
To test hypothesis six, the original sample (n=606) was sorted by responses to the
question “Did you seek a new job within the Air Force to better utilize your skills?” The
breakdown of responses was 379 “yes”, 159 “no”, and 68 “cannot decide” or “did not
respond.” To test hypothesis six, the mean levels of perceived no-grow and perceived
mismatch were compared for the “yes” responses, scored a “1”, and the “no” responses,
scored a “3”. The distributions of the two samples are similar and variances are assumed
to be equal.
Perceived No-Grow. The results show that the sample (n=538) test rejects the
null hypothesis and supports hypothesis six. Those that answered “yes” they intend to
search for a job within the Air Force, had a sample mean for perceived no-grow of 2.46
compared to a sample mean of 2.25 for those who answered “no.” The mean score for
those intending to search for a job within the Air Force is higher when compared to those
not. A Levene test was conducted to test for equal variances. The results for the Levene
test were a t-statistic of 4.83 with a p-value of less than .1. Therefore we can conclude
that the variances are equal. The t-statistic was 2.98 and the p-value for the significance
of the test was less than .05. The test is significant and the results show that the means
for the two groups are significantly different, see Table 28.
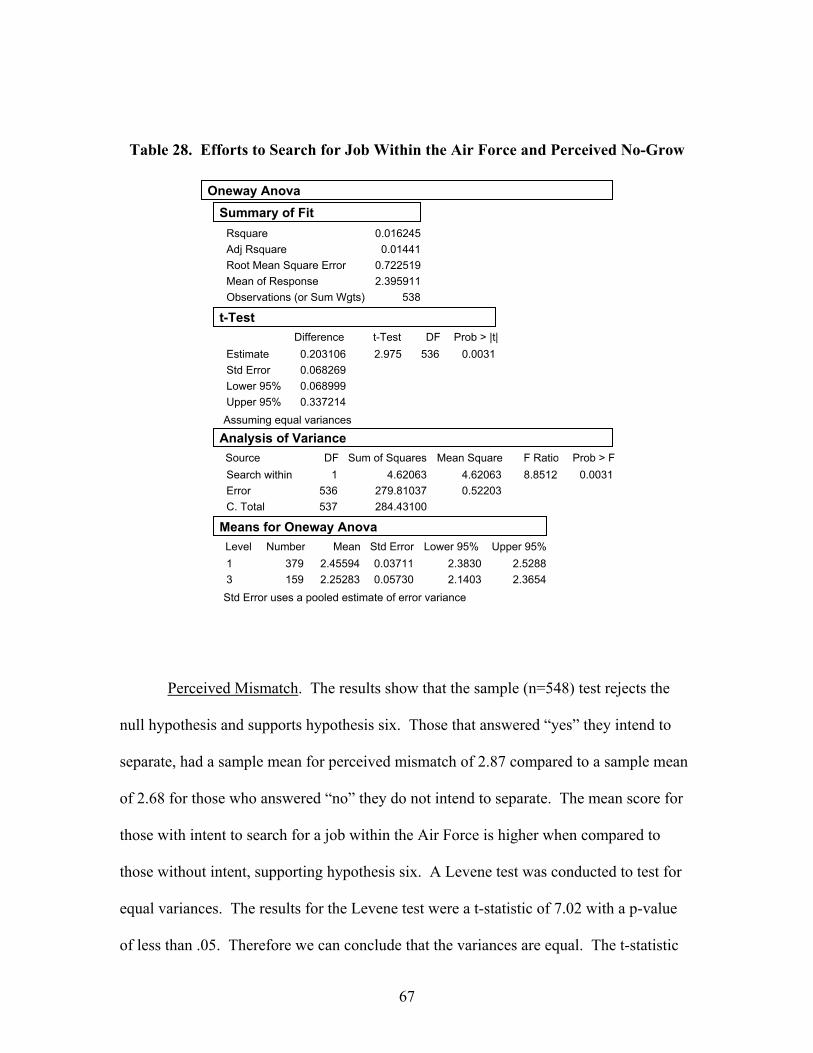
67
Table 28. Efforts to Search for Job Within the Air Force and Perceived No-Grow
Perceived Mismatch. The results show that the sample (n=548) test rejects the
null hypothesis and supports hypothesis six. Those that answered “yes” they intend to
separate, had a sample mean for perceived mismatch of 2.87 compared to a sample mean
of 2.68 for those who answered “no” they do not intend to separate. The mean score for
those with intent to search for a job within the Air Force is higher when compared to
those without intent, supporting hypothesis six. A Levene test was conducted to test for
equal variances. The results for the Levene test were a t-statistic of 7.02 with a p-value
of less than .05. Therefore we can conclude that the variances are equal. The t-statistic
RsquareAdj RsquareRoot Mean Square ErrorMean of ResponseObservations (or Sum Wgts)
0.016245 0.014410.7225192.395911
538
Summary of Fit
EstimateStd ErrorLower 95%Upper 95%
0.2031060.0682690.0689990.337214
Difference 2.975
t-Test 536
DF 0.0031Prob > |t|
Assuming equal variances
t-Test
Search withinErrorC. Total
Source 1
536 537
DF 4.62063
279.81037 284.43100
Sum of Squares 4.62063 0.52203
Mean Square 8.8512F Ratio
0.0031Prob > F
Analysis of Variance
13
Level 379 159
Number 2.45594 2.25283
Mean0.037110.05730
Std Error 2.3830 2.1403
Lower 95% 2.5288 2.3654
Upper 95%
Std Error uses a pooled estimate of error variance
Means for Oneway Anova
Oneway Anova
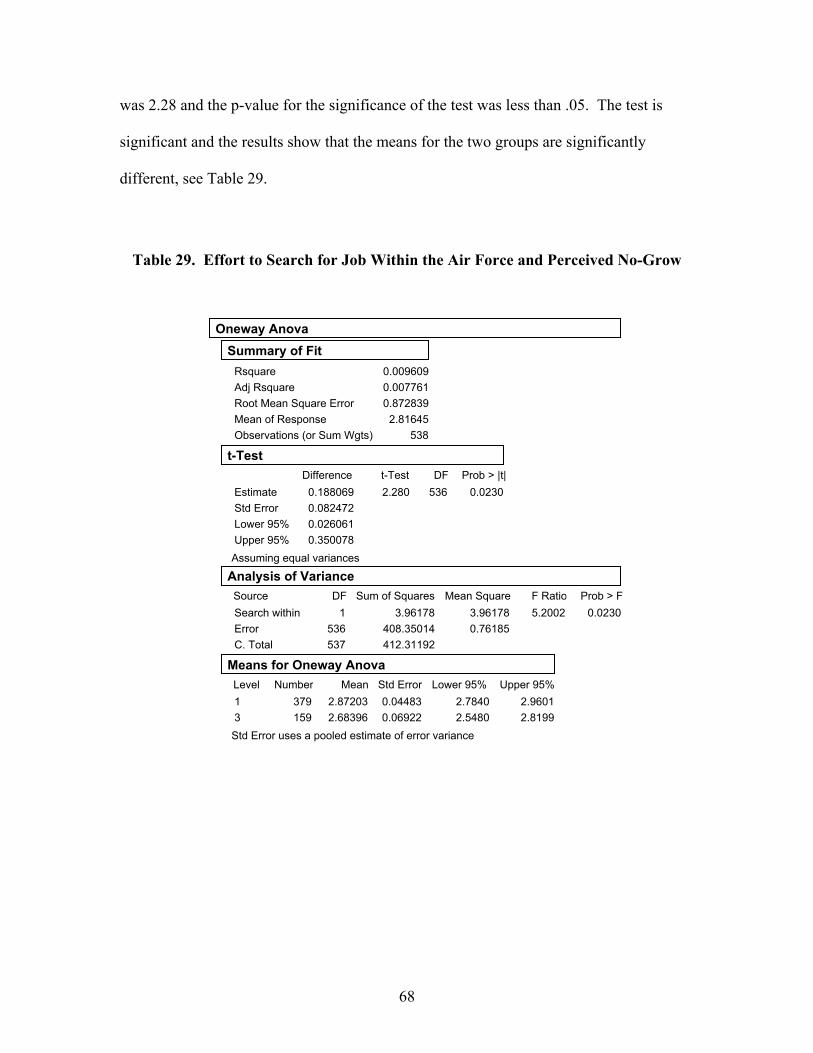
68
was 2.28 and the p-value for the significance of the test was less than .05. The test is
significant and the results show that the means for the two groups are significantly
different, see Table 29.
Table 29. Effort to Search for Job Within the Air Force and Perceived No-Grow
RsquareAdj RsquareRoot Mean Square ErrorMean of ResponseObservations (or Sum Wgts)
0.0096090.0077610.872839 2.81645
538
Summary of Fit
EstimateStd ErrorLower 95%Upper 95%
0.1880690.0824720.0260610.350078
Difference 2.280
t-Test 536
DF 0.0230Prob > |t|
Assuming equal variances
t-Test
Search withinErrorC. Total
Source 1
536 537
DF 3.96178
408.35014 412.31192
Sum of Squares 3.96178 0.76185
Mean Square 5.2002F Ratio
0.0230Prob > F
Analysis of Variance
13
Level 379 159
Number 2.87203 2.68396
Mean0.044830.06922
Std Error 2.7840 2.5480
Lower 95% 2.9601 2.8199
Upper 95%
Std Error uses a pooled estimate of error variance
Means for Oneway Anova
Oneway Anova
69
Hypothesis 7 Graduates who report intent to stay 20 years in the Air Force report lower levels of POQ. Ho: The null hypothesis is that there is not a significant difference between the mean levels of POQ or, those with intent to stay 20 years do not have a lower mean score for POQ.
To test hypothesis seven, the original sample (n=606) was sorted by responses to
the question “Do you intend to spend over 20 years in the Air Force?” The breakdown of
responses was 341 “yes”, 105 “no”, and 160 “cannot decide” or “did not respond.” To
test hypothesis four, the mean levels of perceived no-grow and perceived mismatch were
compared for the “yes” responses, scored a “1”, and the “no” responses, scored a “3”.
The distributions of the two samples are similar and variances are assumed to be equal.
Perceived No-Grow. The results show that the sample (n=446) test rejects the
null hypothesis and supports hypothesis seven. Those that answered “yes” they intend to
separate, had a sample mean for perceived no-grow of 2.32 compared to a sample mean
of 2.59 for those who answered “no.” The mean score for those intending to stay 20
years is lower compared to those not intending to stay 20 years, supporting hypothesis
seven. A Levene test was conducted to test for equal variances. The results for the
Levene test were a t-statistic of 3.36 with a p-value of less than .1. Therefore we can
conclude that the variances are equal. The t-statistic was –3.40 and the p-value for the
significance of the test was less than .05. The test is significant and the results show that
the means for the two groups are significantly different, see Table 30
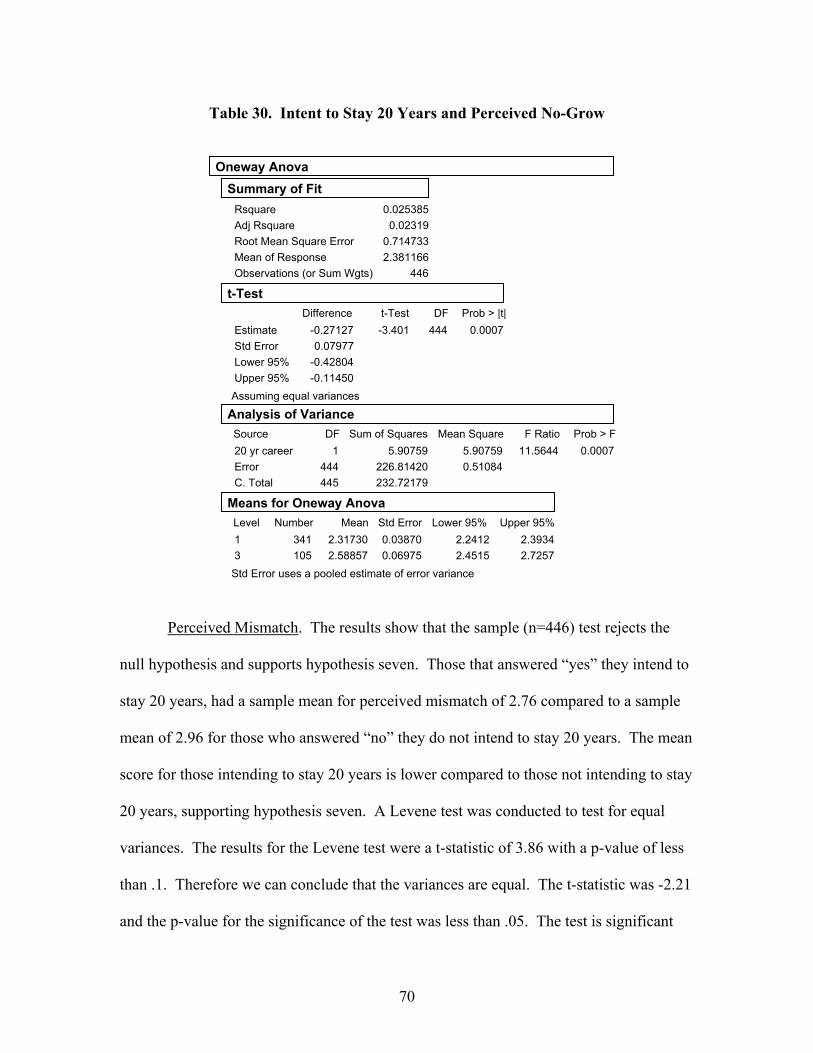
70
Table 30. Intent to Stay 20 Years and Perceived No-Grow
Perceived Mismatch. The results show that the sample (n=446) test rejects the
null hypothesis and supports hypothesis seven. Those that answered “yes” they intend to
stay 20 years, had a sample mean for perceived mismatch of 2.76 compared to a sample
mean of 2.96 for those who answered “no” they do not intend to stay 20 years. The mean
score for those intending to stay 20 years is lower compared to those not intending to stay
20 years, supporting hypothesis seven. A Levene test was conducted to test for equal
variances. The results for the Levene test were a t-statistic of 3.86 with a p-value of less
than .1. Therefore we can conclude that the variances are equal. The t-statistic was -2.21
and the p-value for the significance of the test was less than .05. The test is significant
RsquareAdj RsquareRoot Mean Square ErrorMean of ResponseObservations (or Sum Wgts)
0.025385 0.023190.7147332.381166
446
Summary of Fit
EstimateStd ErrorLower 95%Upper 95%
-0.27127 0.07977-0.42804-0.11450
Difference -3.401
t-Test 444
DF 0.0007Prob > |t|
Assuming equal variances
t-Test
20 yr careerErrorC. Total
Source 1
444 445
DF 5.90759
226.81420 232.72179
Sum of Squares 5.90759 0.51084
Mean Square 11.5644
F Ratio 0.0007Prob > F
Analysis of Variance
13
Level 341 105
Number 2.31730 2.58857
Mean0.038700.06975
Std Error 2.2412 2.4515
Lower 95% 2.3934 2.7257
Upper 95%
Std Error uses a pooled estimate of error variance
Means for Oneway Anova
Oneway Anova
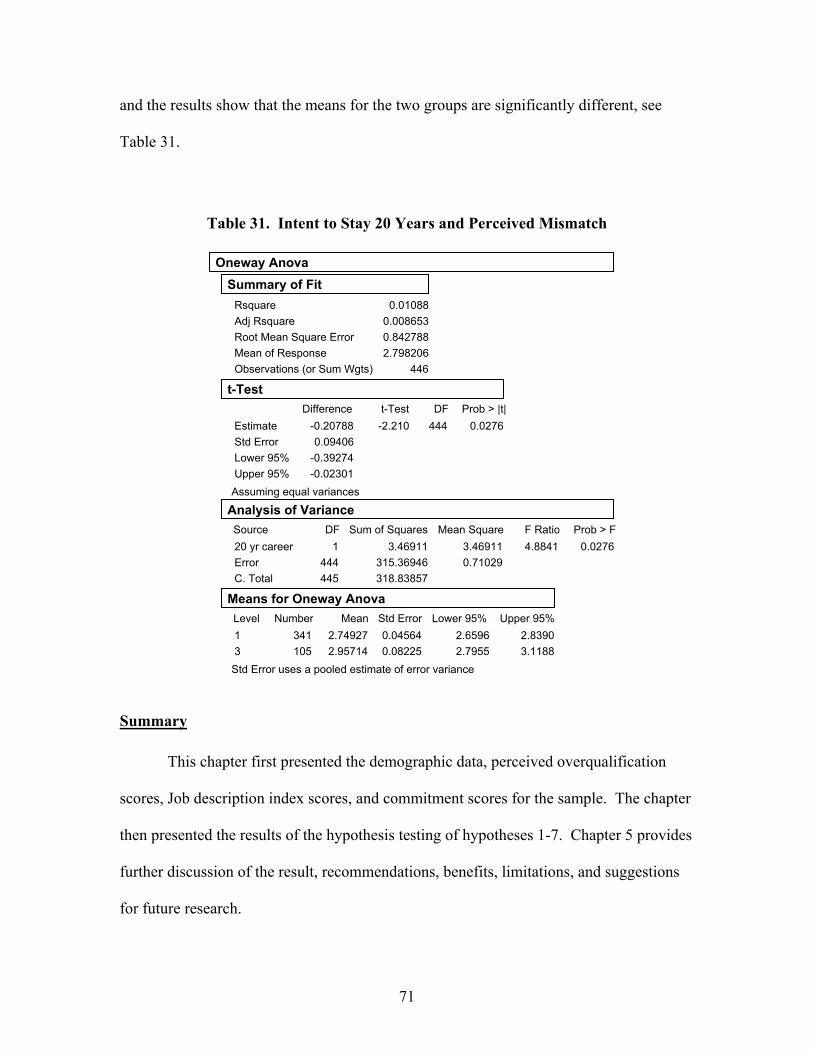
71
and the results show that the means for the two groups are significantly different, see
Table 31.
Table 31. Intent to Stay 20 Years and Perceived Mismatch
Summary
This chapter first presented the demographic data, perceived overqualification
scores, Job description index scores, and commitment scores for the sample. The chapter
then presented the results of the hypothesis testing of hypotheses 1-7. Chapter 5 provides
further discussion of the result, recommendations, benefits, limitations, and suggestions
for future research.
RsquareAdj RsquareRoot Mean Square ErrorMean of ResponseObservations (or Sum Wgts)
0.010880.0086530.8427882.798206
446
Summary of Fit
EstimateStd ErrorLower 95%Upper 95%
-0.20788 0.09406-0.39274-0.02301
Difference -2.210
t-Test 444
DF 0.0276Prob > |t|
Assuming equal variances
t-Test
20 yr careerErrorC. Total
Source 1
444 445
DF 3.46911
315.36946 318.83857
Sum of Squares 3.46911 0.71029
Mean Square 4.8841F Ratio
0.0276Prob > F
Analysis of Variance
13
Level 341 105
Number 2.74927 2.95714
Mean0.045640.08225
Std Error 2.6596 2.7955
Lower 95% 2.8390 3.1188
Upper 95%
Std Error uses a pooled estimate of error variance
Means for Oneway Anova
Oneway Anova
72
V. Discussion and Recommendations
This thesis is a follow-on research effort to that conducted by Johnson and
Johnson (2000) who proposed a connection between perceived overqualification and both
job satisfaction and commitment. Johnson and Johnson (2002) tested this proposed
connection on three independent samples. The purpose of this research is to determine if
the results of research on perceived overqualification are generalizable to this population,
the AFIT graduate. This study also looks to determine the effects of perceived
overqualification on turnover intent.
A survey was sent out to a sample of AFIT in-residence graduates using the
methodology described in chapter 3. Both regression and analysis of variances were
conducted to determine if perceived overqualification was affecting job satisfaction,
commitment, and turnover.
This chapter addresses this research effort’s results, recommendations, benefits,
limitations, and suggestions for future research.
Results
Table 32 provides a summary of the hypotheses test results. A brief discussion of
each hypothesis and test result follows.
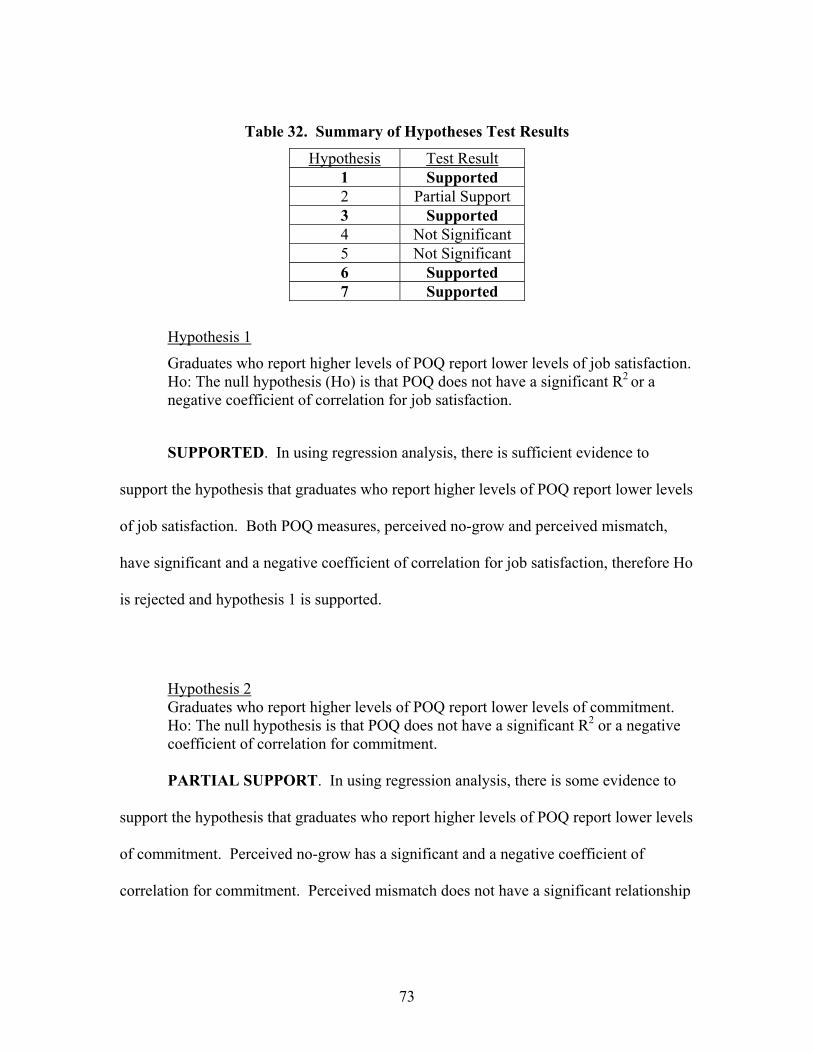
73
Table 32. Summary of Hypotheses Test Results
Hypothesis Test Result 1 Supported 2 Partial Support 3 Supported 4 Not Significant 5 Not Significant 6 Supported 7 Supported
Hypothesis 1
Graduates who report higher levels of POQ report lower levels of job satisfaction. Ho: The null hypothesis (Ho) is that POQ does not have a significant R2 or a negative coefficient of correlation for job satisfaction.
SUPPORTED. In using regression analysis, there is sufficient evidence to
support the hypothesis that graduates who report higher levels of POQ report lower levels
of job satisfaction. Both POQ measures, perceived no-grow and perceived mismatch,
have significant and a negative coefficient of correlation for job satisfaction, therefore Ho
is rejected and hypothesis 1 is supported.
Hypothesis 2 Graduates who report higher levels of POQ report lower levels of commitment. Ho: The null hypothesis is that POQ does not have a significant R2 or a negative coefficient of correlation for commitment. PARTIAL SUPPORT. In using regression analysis, there is some evidence to
support the hypothesis that graduates who report higher levels of POQ report lower levels
of commitment. Perceived no-grow has a significant and a negative coefficient of
correlation for commitment. Perceived mismatch does not have a significant relationship
74
with commitment. Therefore, hypothesis 2 is partially supported but Ho cannot be
rejected.
Hypothesis 3 As pay and promotion are held relatively constant for this population sample, graduates who report higher levels of POQ report lower levels of satisfaction with work than other JDI factors. Ho: The null hypothesis is that the POQ R2 for satisfaction with work does not exceed the R2 value for satisfaction with pay, satisfaction with promotion, or satisfaction with promotion. SUPPORTED. In using regression analysis, there is sufficient evidence to
support the hypothesis that graduates who report higher levels of POQ report lower levels
of satisfaction with work than other JDI factors. POQ measures, perceived no-grow and
perceived mismatch, were able to predict the variation within satisfaction with work with
a higher coefficient of correlation, R2, than any other JDI factor, therefore Ho is rejected
and hypothesis 3 is supported.
Hypothesis 4 Graduates that report turnover intent report higher levels of POQ. Ho: The null hypothesis is that there is not significant difference between the means or those with turnover intent do not have a higher mean score for perceived overqualification. NOT SIGNIFICANT. In using analysis of variance, there is neither sufficient
nor insufficient evidence to support the hypothesis that graduates that report turnover
intent report higher levels of POQ. The tests for both POQ measures were not
significant.
75
Hypothesis 5 Graduates that report intent to search for a job with another employer report higher levels of POQ. Ho: The null hypothesis is that there is not a significant difference between the means or those with intent to search for a job with another employer do not have a higher mean score for perceived overqualification. NOT SIGNIFICANT. In using analysis of variance, there is neither sufficient
nor insufficient evidence to support the hypothesis that graduates that report intent to
search for a job with another employer report higher levels of POQ. The tests for both
POQ measures were not significant.
Hypothesis 6 Graduates that report intent to search for a job within the Air Force report higher levels of POQ. Ho: The null hypothesis is that there is not a significant difference between the means or those with intent to search for a job within the Air Force do not have a higher mean score for perceived overqualification.
SUPPORTED. In using analysis of variance, there is sufficient evidence to
support the hypothesis that graduates that report intent to search for a job within the Air
Force report higher levels of POQ. POQ measures, perceived no-grow and perceived
mismatch, have significantly different means within the two groups. The means for both
POQ measures were higher for those with intent to search for a job within the Air Force.
Therefore, Ho is rejected and hypothesis 6 is supported.
Hypothesis 7 Graduates who report intent to stay 20 years in the Air Force report lower levels of POQ. Ho: The null hypothesis is that there is not a significant difference between the means or those with intent to stay 20 years do not have a lower mean score for perceived overqualification.
76
SUPPORTED. In using analysis of variance, there is sufficient evidence to
support the hypothesis that graduates that report intent to stay 20 years in the Air Force
report lower levels of POQ. POQ measures, perceived no-grow and perceived mismatch,
have significantly different means within the two groups. The means for both POQ
measures were lower for those with intent to stay 20 years in the Air Force. Therefore,
Ho is rejected and hypothesis 7 is supported.
Recommendations
The effects of perceived overqualification can be prevented. Perceived
overqualification is a combination of the two constructs perceived no-grow and perceived
mismatch. Implementing changes to focus on reducing these two constructs would
reduce the occurrences of perceived overqualification and reduce the probability of
turnover.
My first recommendation is to ensure opportunities for growth. This can be
accomplished by placing AFIT graduates in existing jobs with growth potential or
making changes to job structure to increase growth opportunities. Tsang (1985) found
that the job structure was lagging as the average education level increased. After
graduation, graduates are assigned to advance degree billets. These existing billets may
be candidates for job structure changes to improve growth opportunities or identifying
new advance degree billets may be necessary. Investing in job structure changes may
provide a better long-term investment than programs that increase pay over the short-
term. The organization may experience better returns from the short term investment but
77
when the pay incentives stop the benefit stops. Changes to the job structure would
continue to benefit the organization and may only require periodic updates.
My second recommendation is to reduce the occurrences of perceived mismatch.
The process of identifying advance degree billets should be reviewed to ensure matches.
Organizations with advance degree billets should justify the need and show how the
graduate skills will be used. Organizations seeking advance degree billets should have
the opportunity to justify their need and compete for these advance degree billets. Job
matching techniques such as interviews or a formal selection process may also improve
the match quality. The AFIT program is an internal program. The Air Force has the
latitude to make changes to the program. An area for consideration is curriculum
tailoring. If the graduates are not providing the skills that are desired then there may be
opportunities to make changes to the curriculum to better meet the needs of the Air Force.
Benefits and Contributions of Research
This research effort resulted in evidence to support the hypotheses that perceived
overqualification is affecting graduate job satisfaction, commitment, and turnover
mediators that have been linked to turnover behavior. These findings will be a
tremendous source of information for the Air Force (USAF/DP), the AFIT graduate
school, the U.S. Air Force and taxpayers.
USAF/DP will directly benefit from this study. As the Air Force’s office of
primary responsibility for personnel development and training, USAF/DP, with the
78
results of this study, will be armed with information and will be able to increase the
effectiveness of education and training programs. Based upon the results of this study,
USAF/DP has information that may help explain why some AFIT graduates leave the Air
Force. This research may assist USAF/DP in making intelligent and informed changes to
its policy and procedures in order to reduce the effects of perceived overqualification in
AFIT graduates. It may also help identify other population that may be affected by
perceived overqualification.
AFIT will benefit from this study. The better utilization of AFIT graduates could
lead to an increase impact of the graduates of the AFIT program within the Air Force.
AFIT equips it graduates with tools tailored to the needs of the Air Force. By providing
graduates opportunities to use these tools, the graduate can and will make impact.
The Air Force and taxpayers may also benefit from this study. The Air Force and
ultimately the taxpayer are making a significant investment in the individuals that
participate in advance degree programs. By understanding the effects of perceived
overqualification and implementing changes to reduce these effects, the Air Force can
protect this investment by increasing the retention of these resources. New graduates can
be used as tools to facilitate change to be inserted within the workforce to implement new
ideas. This is especially important in this time of transformation.
Limitations
79
The study may be limited by sample bias. The sample was not random. All AFIT
graduates from years 2002-1992 that were in the Air Force global address book were
invited to participate. This sampling frame may be biased and may not be an accurate
representation of the total population under study. The study did have between 29 and 38
percent representation of all graduates for each year group. The result of this study may
only generalizable to this population and may not be generalizable to other populations
within the Air Force or outside the Air Force. The sample is not representative of the Air
Force as a whole. The sample only includes one pilot and two navigators. Other AFSCs
are not represented in this sample. The sample is limited to U.S. Air Force officers so
the results may not be generalizable to populations outside the Air Force. There may be
unique factors that affect this population or unique characteristics that impact the results
of the research.
A second limitation of this study is the timing of the measurements of perceived
overqualification, job satisfaction, and commitment measurements. The survey had the
respondent answer scales to measure perceived overqualification and job satisfaction
associated with the job held immediately after AFIT. The graduate responses may have
been affected by the time between holding that job and responding to the survey. Some
respondents may still be serving in this job while some may have held the job as much as
three years ago. The organizational commitment scale measured the respondent’s current
commitment. Again time may have impacted the commitment scores. This may explain
POQ’s limited ability to explain the variance in commitment.
80
The measurement scale of turnover intent was limited. Respondents were limited
to a nominal response of yes, no, or cannot decide. The scale limited the analysis. An
analysis of variance was used to compare the means within those responding yes and no.
Regression analysis was not possible due to the nominal data.
Opportunities for Research
Future research should improve on the limitations involved in this research effort.
One possible recommendation for future research is to study the effects of perceived
overqualification over time. This may help understand how job satisfaction,
commitment, and turnover intent change over time. It may also provide insight into the
actual turnover behavior exhibited by the population.
This research may have potential benefits for other populations. Other
populations within the Air Force may also be affected by perceived overqualification
such as enlisted personnel, various training program participates, and AFSC not currently
represented in the research sample. Research in these areas may provide insight into the
behaviors exhibited by these groups.
Based upon the results of this research effort, there is evidence to support the
hypotheses that perceived overqualification affects job satisfaction, commitment, and
turnover intent. How can these effects being prevented? A potential area for future
research would be to study the effectiveness of preventive measure. The Air Force has
established a critical retention bonus for critical AFSC. What is the effect of this bonus?
81
Conclusion
Based on the research results, the proposed relationships of perceived
overqualification with both job satisfaction and organizational commitment are
generalizable to this population, U.S. Air Force AFIT graduates. The research results
also provided evidence that perceived overqualification levels may contribute to turnover.
This chapter provided a brief summary of this research effort. Areas addressed
included the research conclusions, recommendations, benefits, limitations, and
suggestions for future research.
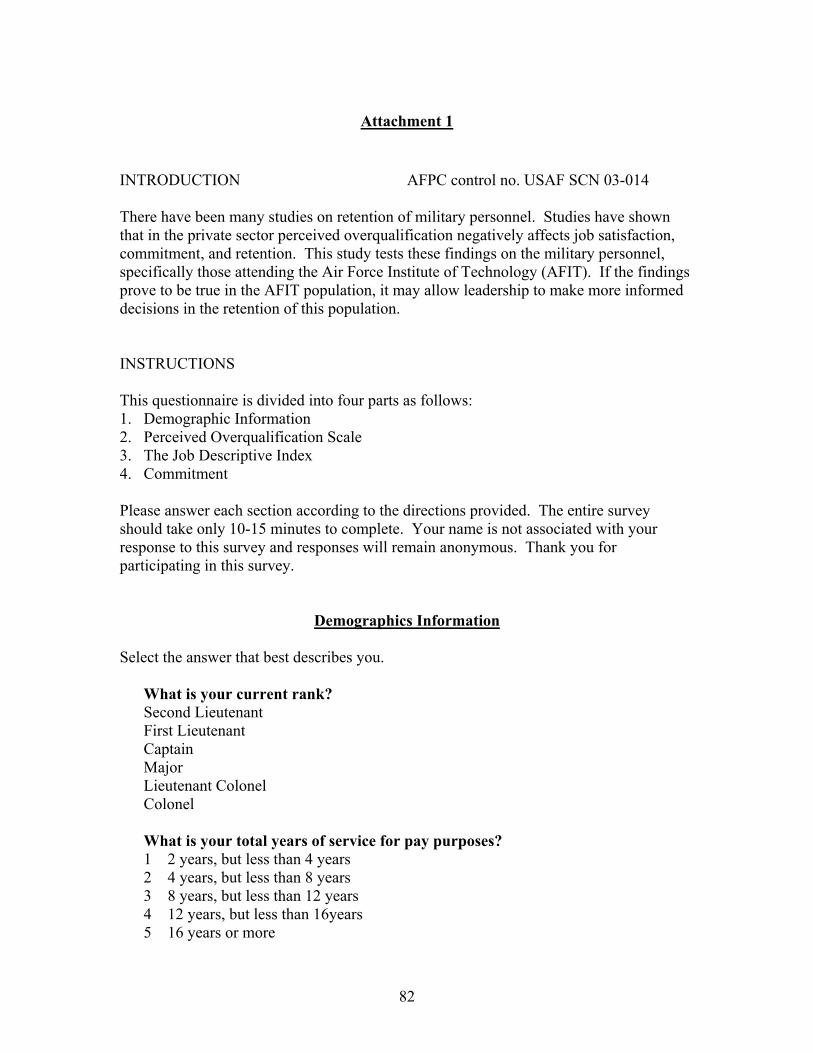
82
Attachment 1 INTRODUCTION AFPC control no. USAF SCN 03-014 There have been many studies on retention of military personnel. Studies have shown that in the private sector perceived overqualification negatively affects job satisfaction, commitment, and retention. This study tests these findings on the military personnel, specifically those attending the Air Force Institute of Technology (AFIT). If the findings prove to be true in the AFIT population, it may allow leadership to make more informed decisions in the retention of this population. INSTRUCTIONS This questionnaire is divided into four parts as follows: 1. Demographic Information 2. Perceived Overqualification Scale 3. The Job Descriptive Index 4. Commitment Please answer each section according to the directions provided. The entire survey should take only 10-15 minutes to complete. Your name is not associated with your response to this survey and responses will remain anonymous. Thank you for participating in this survey.
Demographics Information Select the answer that best describes you.
What is your current rank? Second Lieutenant First Lieutenant Captain Major Lieutenant Colonel Colonel
What is your total years of service for pay purposes? 1 2 years, but less than 4 years 2 4 years, but less than 8 years 3 8 years, but less than 12 years 4 12 years, but less than 16years 5 16 years or more
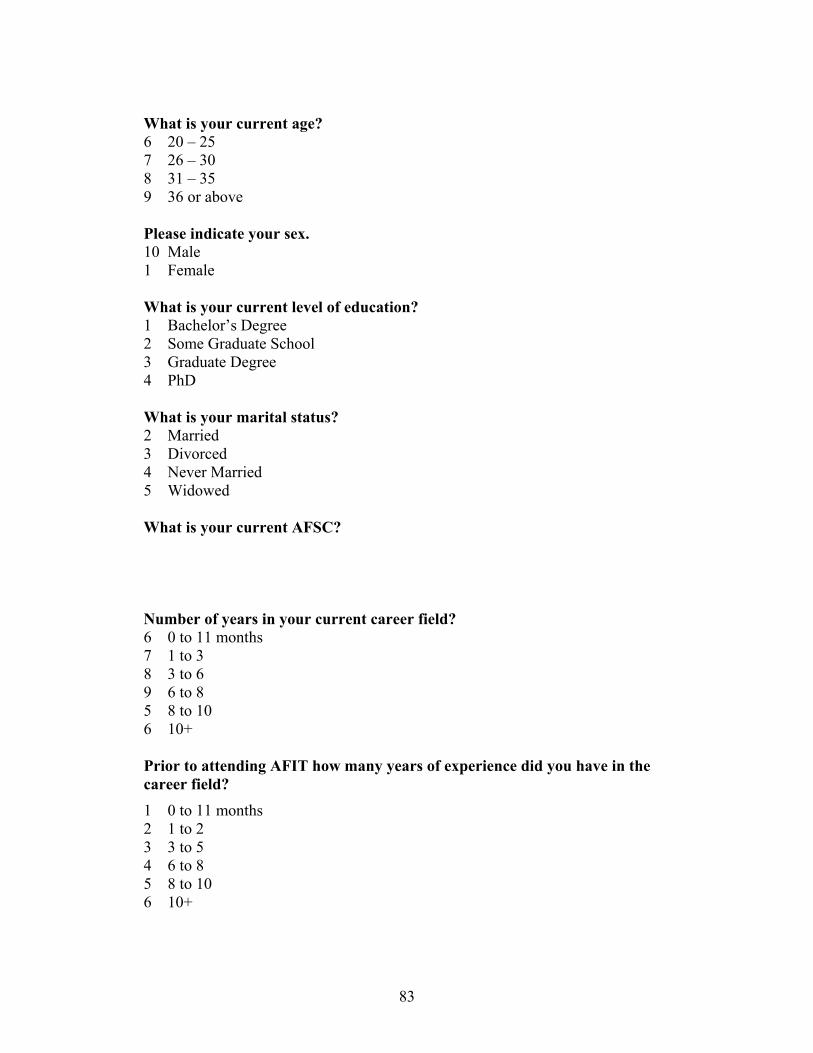
83
What is your current age? 6 20 – 25 7 26 – 30 8 31 – 35 9 36 or above Please indicate your sex. 10 Male 1 Female What is your current level of education? 1 Bachelor’s Degree 2 Some Graduate School 3 Graduate Degree 4 PhD What is your marital status? 2 Married 3 Divorced 4 Never Married 5 Widowed What is your current AFSC? Number of years in your current career field? 6 0 to 11 months 7 1 to 3 8 3 to 6 9 6 to 8 5 8 to 10 6 10+ Prior to attending AFIT how many years of experience did you have in the career field? 1 0 to 11 months 2 1 to 2 3 3 to 5 4 6 to 8 5 8 to 10 6 10+
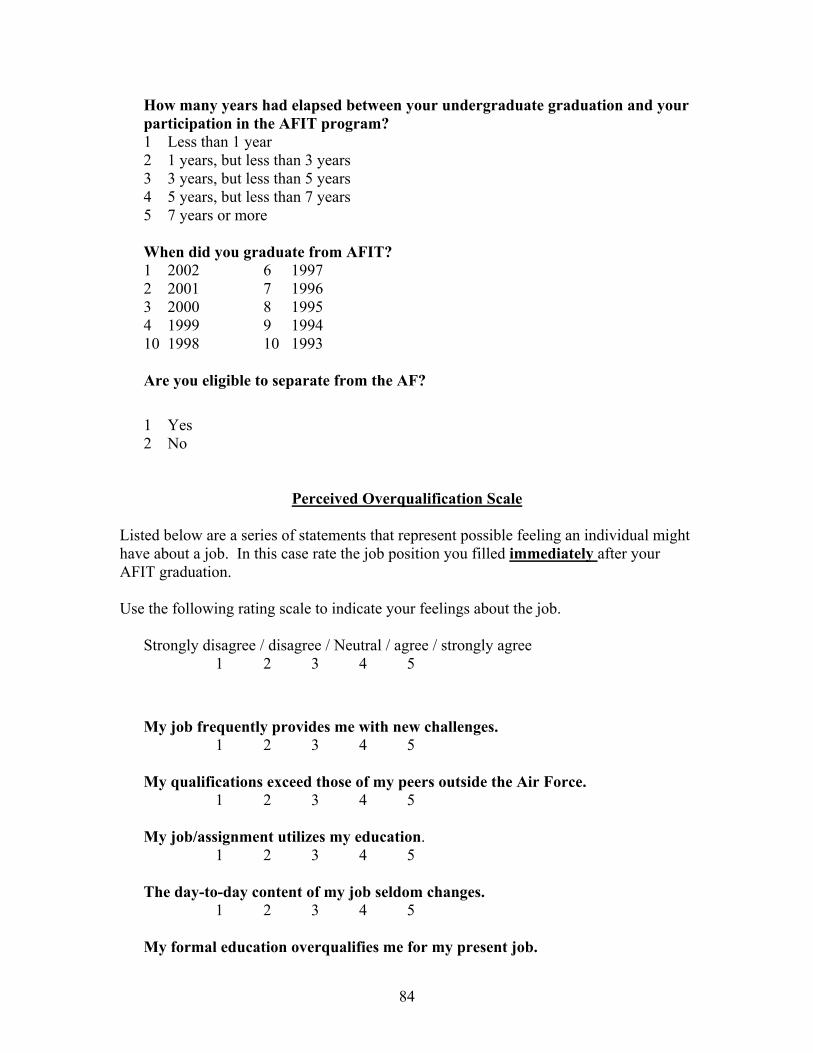
84
How many years had elapsed between your undergraduate graduation and your participation in the AFIT program? 1 Less than 1 year 2 1 years, but less than 3 years 3 3 years, but less than 5 years 4 5 years, but less than 7 years 5 7 years or more
When did you graduate from AFIT? 1 2002 6 1997 2 2001 7 1996 3 2000 8 1995 4 1999 9 1994 10 1998 10 1993 Are you eligible to separate from the AF?
1 Yes 2 No
Perceived Overqualification Scale
Listed below are a series of statements that represent possible feeling an individual might have about a job. In this case rate the job position you filled immediately after your AFIT graduation. Use the following rating scale to indicate your feelings about the job.
Strongly disagree / disagree / Neutral / agree / strongly agree
1 2 3 4 5
My job frequently provides me with new challenges. 1 2 3 4 5
My qualifications exceed those of my peers outside the Air Force.
1 2 3 4 5 My job/assignment utilizes my education. 1 2 3 4 5 The day-to-day content of my job seldom changes.
1 2 3 4 5 My formal education overqualifies me for my present job.
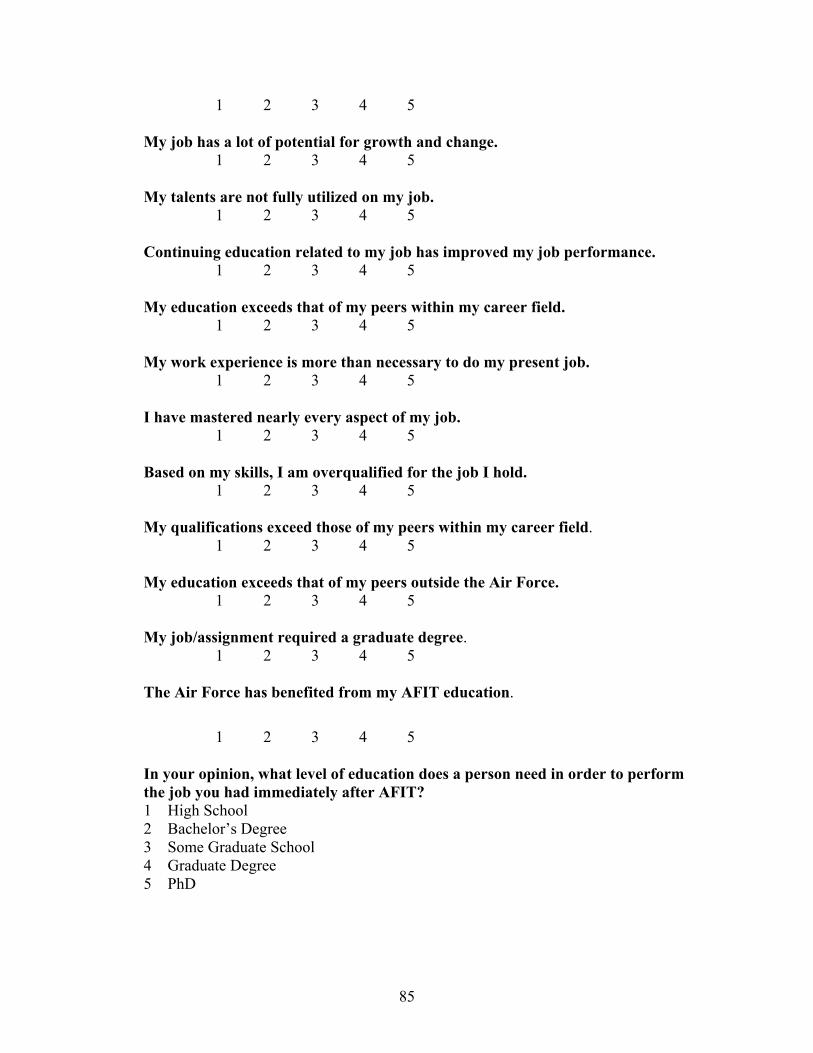
85
1 2 3 4 5 My job has a lot of potential for growth and change.
1 2 3 4 5 My talents are not fully utilized on my job.
1 2 3 4 5 Continuing education related to my job has improved my job performance.
1 2 3 4 5 My education exceeds that of my peers within my career field.
1 2 3 4 5 My work experience is more than necessary to do my present job.
1 2 3 4 5 I have mastered nearly every aspect of my job.
1 2 3 4 5 Based on my skills, I am overqualified for the job I hold.
1 2 3 4 5 My qualifications exceed those of my peers within my career field.
1 2 3 4 5 My education exceeds that of my peers outside the Air Force.
1 2 3 4 5 My job/assignment required a graduate degree.
1 2 3 4 5 The Air Force has benefited from my AFIT education.
1 2 3 4 5 In your opinion, what level of education does a person need in order to perform the job you had immediately after AFIT? 1 High School 2 Bachelor’s Degree 3 Some Graduate School 4 Graduate Degree 5 PhD
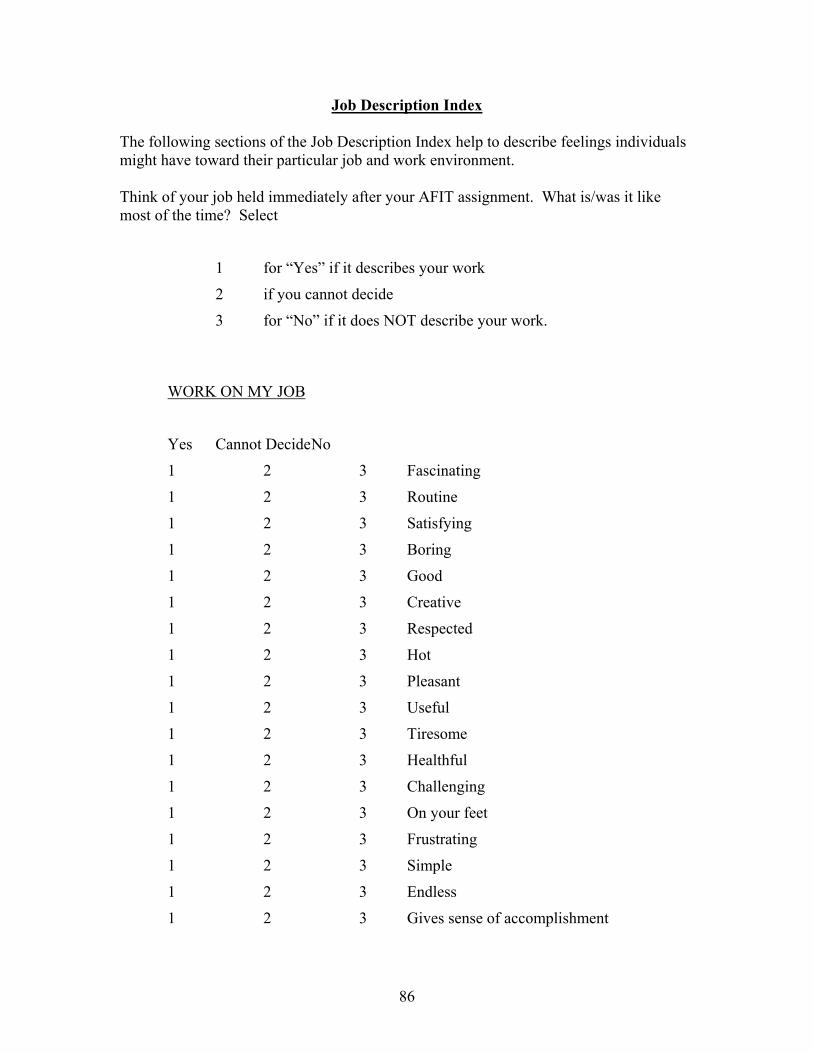
86
Job Description Index
The following sections of the Job Description Index help to describe feelings individuals might have toward their particular job and work environment. Think of your job held immediately after your AFIT assignment. What is/was it like most of the time? Select
1 for “Yes” if it describes your work
2 if you cannot decide
3 for “No” if it does NOT describe your work.
WORK ON MY JOB
Yes Cannot Decide No
1 2 3 Fascinating
1 2 3 Routine
1 2 3 Satisfying
1 2 3 Boring
1 2 3 Good
1 2 3 Creative
1 2 3 Respected
1 2 3 Hot
1 2 3 Pleasant
1 2 3 Useful
1 2 3 Tiresome
1 2 3 Healthful
1 2 3 Challenging
1 2 3 On your feet
1 2 3 Frustrating
1 2 3 Simple
1 2 3 Endless
1 2 3 Gives sense of accomplishment
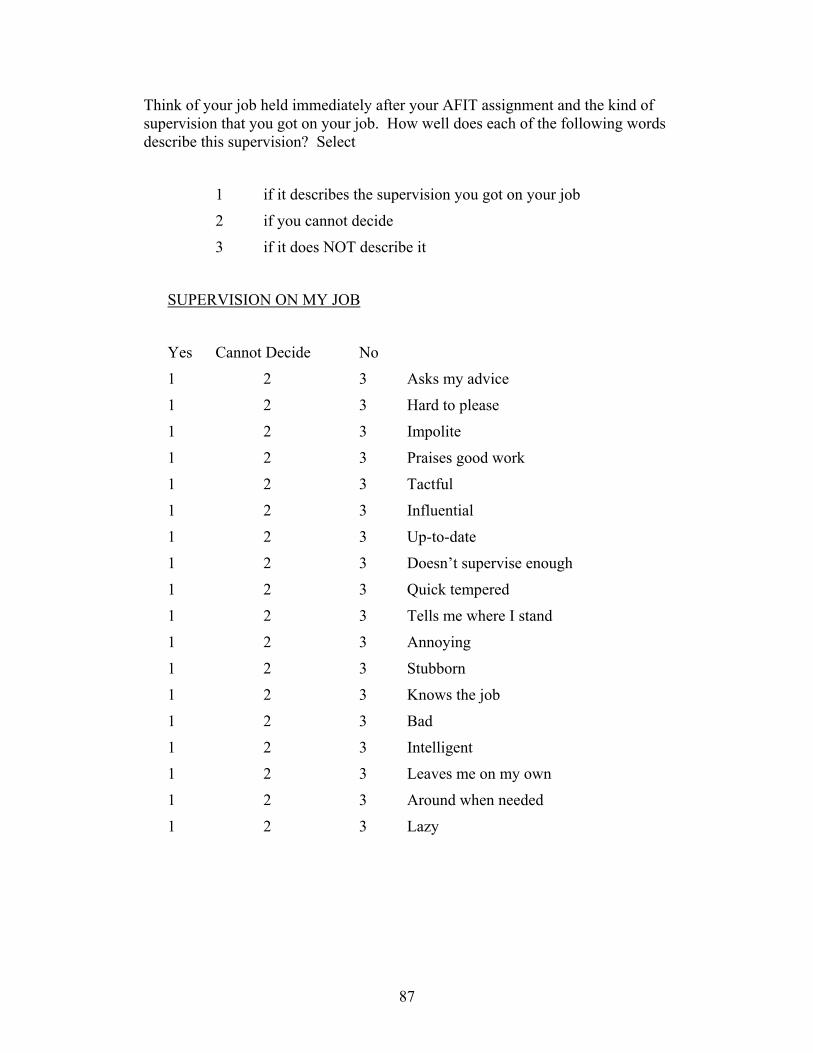
87
Think of your job held immediately after your AFIT assignment and the kind of supervision that you got on your job. How well does each of the following words describe this supervision? Select
1 if it describes the supervision you got on your job
2 if you cannot decide
3 if it does NOT describe it
SUPERVISION ON MY JOB
Yes Cannot Decide No
1 2 3 Asks my advice
1 2 3 Hard to please
1 2 3 Impolite
1 2 3 Praises good work
1 2 3 Tactful
1 2 3 Influential
1 2 3 Up-to-date
1 2 3 Doesn’t supervise enough
1 2 3 Quick tempered
1 2 3 Tells me where I stand
1 2 3 Annoying
1 2 3 Stubborn
1 2 3 Knows the job
1 2 3 Bad
1 2 3 Intelligent
1 2 3 Leaves me on my own
1 2 3 Around when needed
1 2 3 Lazy
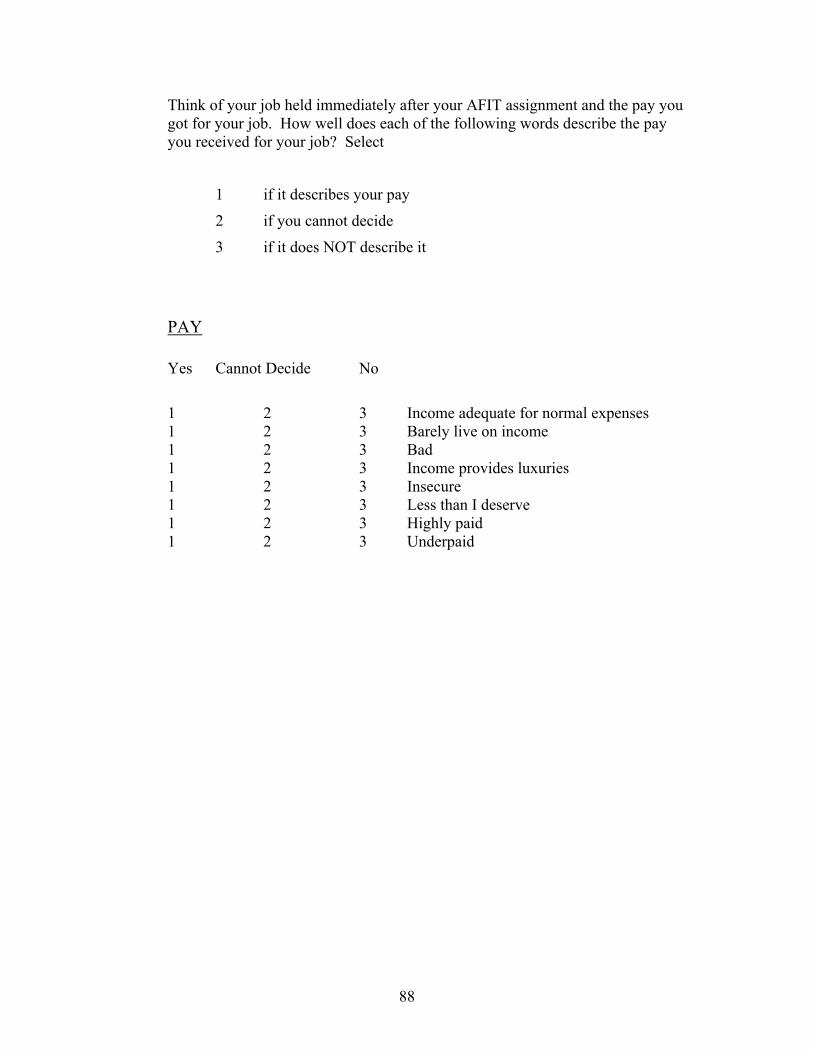
88
Think of your job held immediately after your AFIT assignment and the pay you got for your job. How well does each of the following words describe the pay you received for your job? Select
1 if it describes your pay
2 if you cannot decide
3 if it does NOT describe it
PAY
Yes Cannot Decide No
1 2 3 Income adequate for normal expenses 1 2 3 Barely live on income 1 2 3 Bad 1 2 3 Income provides luxuries 1 2 3 Insecure 1 2 3 Less than I deserve 1 2 3 Highly paid 1 2 3 Underpaid
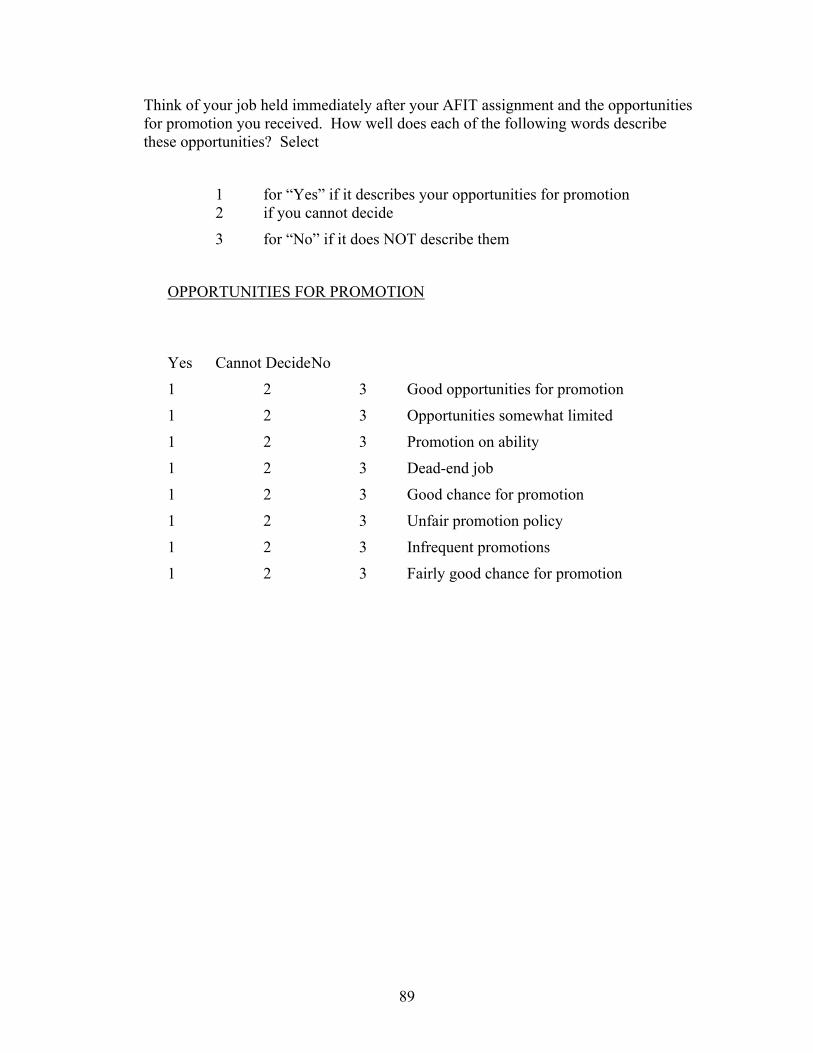
89
Think of your job held immediately after your AFIT assignment and the opportunities for promotion you received. How well does each of the following words describe these opportunities? Select
1 for “Yes” if it describes your opportunities for promotion 2 if you cannot decide
3 for “No” if it does NOT describe them
OPPORTUNITIES FOR PROMOTION
Yes Cannot Decide No
1 2 3 Good opportunities for promotion
1 2 3 Opportunities somewhat limited
1 2 3 Promotion on ability
1 2 3 Dead-end job
1 2 3 Good chance for promotion
1 2 3 Unfair promotion policy
1 2 3 Infrequent promotions
1 2 3 Fairly good chance for promotion
90
Answer the following concerning your intention following your job held immediately after your AFIT assignment. Select
1 for “Yes” if it describes your actions or intentions 2 if you cannot decide
3 for “No” if it does NOT describe them
TURNOVER INTENTION
Yes Cannot Decide No
1 2 3 Did/do you intend to leave the Air Force when you complete(d) your AFIT commitment? 1 2 3 After you compete(d) your AFIT commitment, do you plan to/did you make any efforts to find a new job outside the Air Force? 1 2 3 Did you seek a new job within the Air Force to better utilize your skills?
1 2 3 Do you intend to spend over 20 years in the Air Force?
Commitment
Listed below are a series of statement that represent possible feeling that individuals may have about an organization for which they work. In this case, as Air Force Officers, please consider the organization for which you work the Air Force and NOT your specific organization, MAJCOM, base, ect. Use the following rating scale to indicate your feelings about the job.
Strongly disagree / disagree / Neutral / agree / strongly agree
1 2 3 4 5
I am willing to put in a great deal of effort beyond that normally expected in order to help this organization be successful.
1 2 3 4 5 I talk up this organization to my friends as a great organization to work for. 1 2 3 4 5 I feel very little loyalty to this organization. 1 2 3 4 5
91
I would accept almost any type job assignment in order to keep working for this organization. 1 2 3 4 5 I find that my values and the organization’s values are very similar. 1 2 3 4 5 I am proud to tell others that I am part of this organization. 1 2 3 4 5 I could just as well be working for a different organization as long as the type of work was similar. 1 2 3 4 5 This organization really inspires the very best in me in the way of job performance. 1 2 3 4 5 It would take very little change in my present circumstances to cause me to leave this organization. 1 2 3 4 5 I am extremely glad that I chose this organization to work for, over others I was considering at the time I joined. 1 2 3 4 5 There’s not too much to be gained by sticking with this organization indefinitely. 1 2 3 4 5 Often, I find it difficult to agree with this organization’s policies on important matters relating to employees. 1 2 3 4 5 I really care about the fate of this organization. 1 2 3 4 5 For me this is the best of all possible organizations for which to work. 1 2 3 4 5 Deciding to work for this organization was a definite mistake on my part. 1 2 3 4 5
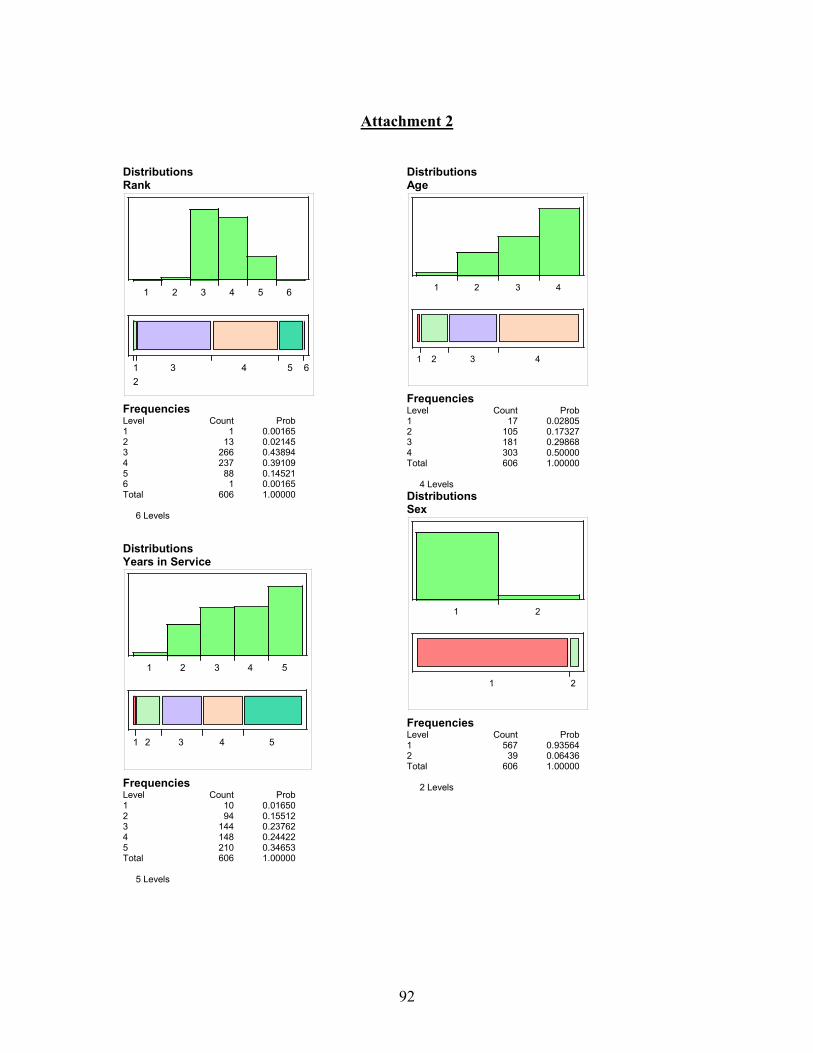
92
Attachment 2 Distributions Rank
1 2 3 4 5 6
12
3 4 5 6
Frequencies Level Count Prob 1 1 0.00165 2 13 0.02145 3 266 0.43894 4 237 0.39109 5 88 0.14521 6 1 0.00165 Total 606 1.00000 6 Levels Distributions Years in Service
1 2 3 4 5
1 2 3 4 5
Frequencies Level Count Prob 1 10 0.01650 2 94 0.15512 3 144 0.23762 4 148 0.24422 5 210 0.34653 Total 606 1.00000 5 Levels
Distributions Age
1 2 3 4
1 2 3 4
Frequencies Level Count Prob 1 17 0.02805 2 105 0.17327 3 181 0.29868 4 303 0.50000 Total 606 1.00000 4 Levels Distributions Sex
1 2
1 2
Frequencies Level Count Prob 1 567 0.93564 2 39 0.06436 Total 606 1.00000 2 Levels
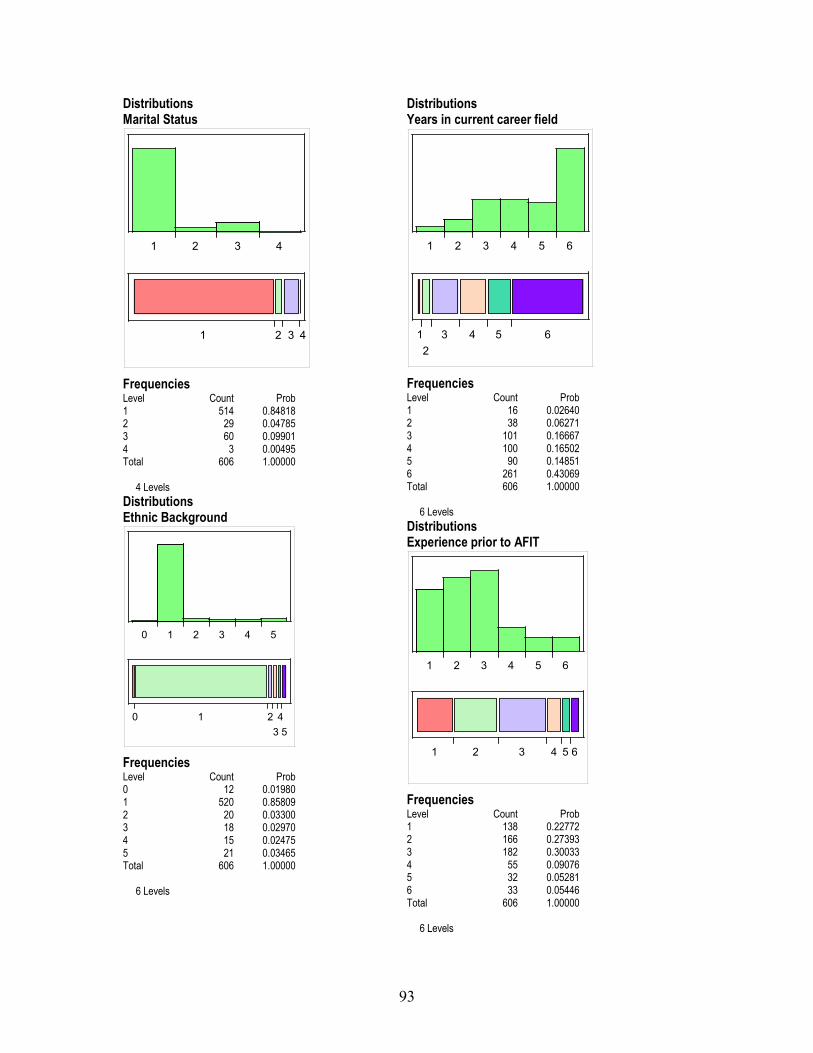
93
Distributions Marital Status
1 2 3 4
1 2 3 4
Frequencies Level Count Prob 1 514 0.84818 2 29 0.04785 3 60 0.09901 4 3 0.00495 Total 606 1.00000 4 Levels Distributions Ethnic Background
0 1 2 3 4 5
0 1 2345
Frequencies Level Count Prob 0 12 0.01980 1 520 0.85809 2 20 0.03300 3 18 0.02970 4 15 0.02475 5 21 0.03465 Total 606 1.00000 6 Levels
DistributionsYears in current career field
1 2 3 4 5 6
12
3 4 5 6
Frequencies Level Count Prob 1 16 0.02640 2 38 0.06271 3 101 0.16667 4 100 0.16502 5 90 0.14851 6 261 0.43069 Total 606 1.00000 6 Levels Distributions Experience prior to AFIT
1 2 3 4 5 6
1 2 3 4 5 6
Frequencies Level Count Prob 1 138 0.22772 2 166 0.27393 3 182 0.30033 4 55 0.09076 5 32 0.05281 6 33 0.05446 Total 606 1.00000 6 Levels
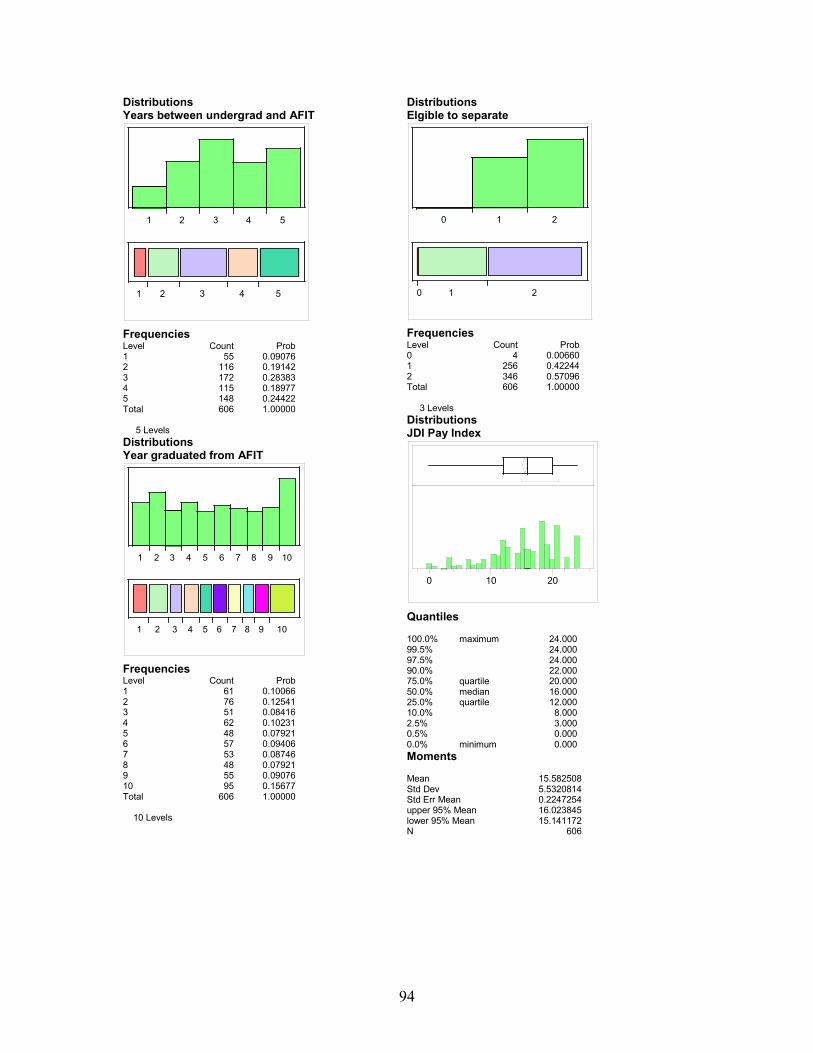
94
Distributions Years between undergrad and AFIT
1 2 3 4 5
1 2 3 4 5
Frequencies Level Count Prob 1 55 0.09076 2 116 0.19142 3 172 0.28383 4 115 0.18977 5 148 0.24422 Total 606 1.00000 5 Levels Distributions Year graduated from AFIT
1 2 3 4 5 6 7 8 9 10
1 2 3 4 5 6 7 8 9 10
Frequencies Level Count Prob 1 61 0.10066 2 76 0.12541 3 51 0.08416 4 62 0.10231 5 48 0.07921 6 57 0.09406 7 53 0.08746 8 48 0.07921 9 55 0.09076 10 95 0.15677 Total 606 1.00000 10 Levels
DistributionsElgible to separate
0 1 2
0 1 2
Frequencies Level Count Prob 0 4 0.00660 1 256 0.42244 2 346 0.57096 Total 606 1.00000 3 Levels Distributions JDI Pay Index
0 10 20
Quantiles 100.0% maximum 24.000 99.5% 24.000 97.5% 24.000 90.0% 22.000 75.0% quartile 20.000 50.0% median 16.000 25.0% quartile 12.000 10.0% 8.000 2.5% 3.000 0.5% 0.000 0.0% minimum 0.000 Moments Mean 15.582508 Std Dev 5.5320814 Std Err Mean 0.2247254 upper 95% Mean 16.023845 lower 95% Mean 15.141172 N 606
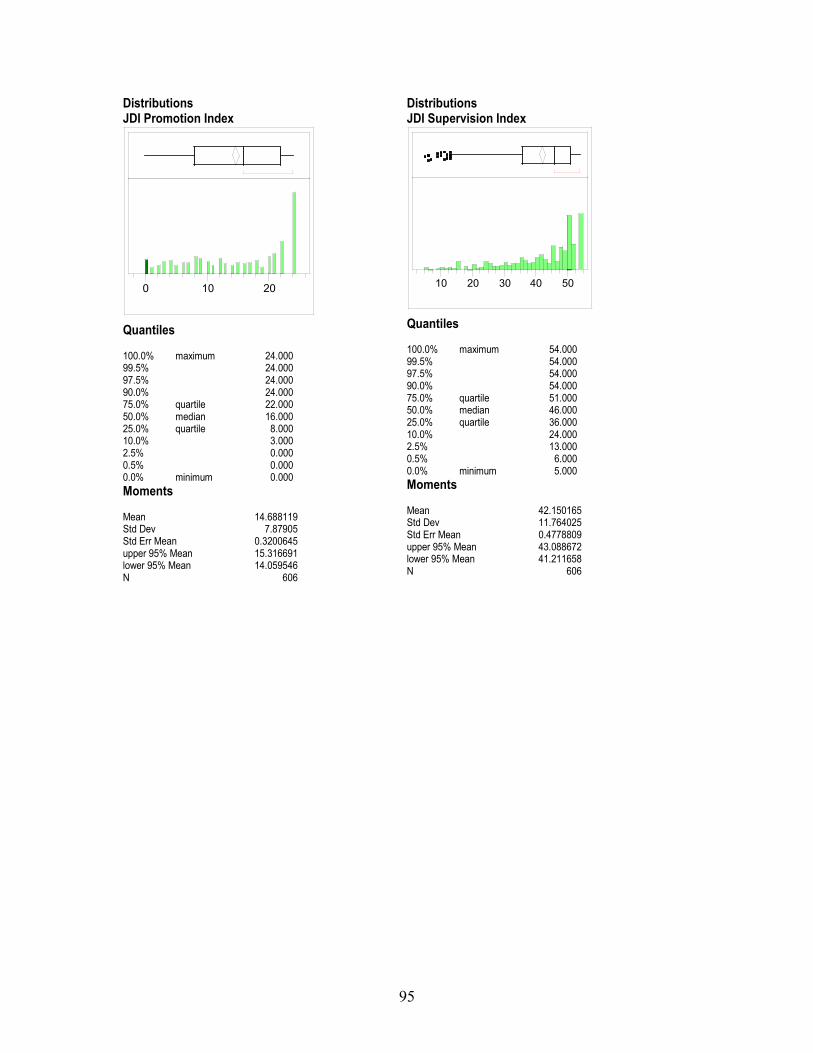
95
Distributions JDI Promotion Index
0 10 20
Quantiles 100.0% maximum 24.000 99.5% 24.000 97.5% 24.000 90.0% 24.000 75.0% quartile 22.000 50.0% median 16.000 25.0% quartile 8.000 10.0% 3.000 2.5% 0.000 0.5% 0.000 0.0% minimum 0.000 Moments Mean 14.688119 Std Dev 7.87905 Std Err Mean 0.3200645 upper 95% Mean 15.316691 lower 95% Mean 14.059546 N 606
DistributionsJDI Supervision Index
10 20 30 40 50
Quantiles 100.0% maximum 54.000 99.5% 54.000 97.5% 54.000 90.0% 54.000 75.0% quartile 51.000 50.0% median 46.000 25.0% quartile 36.000 10.0% 24.000 2.5% 13.000 0.5% 6.000 0.0% minimum 5.000 Moments Mean 42.150165 Std Dev 11.764025 Std Err Mean 0.4778809 upper 95% Mean 43.088672 lower 95% Mean 41.211658 N 606
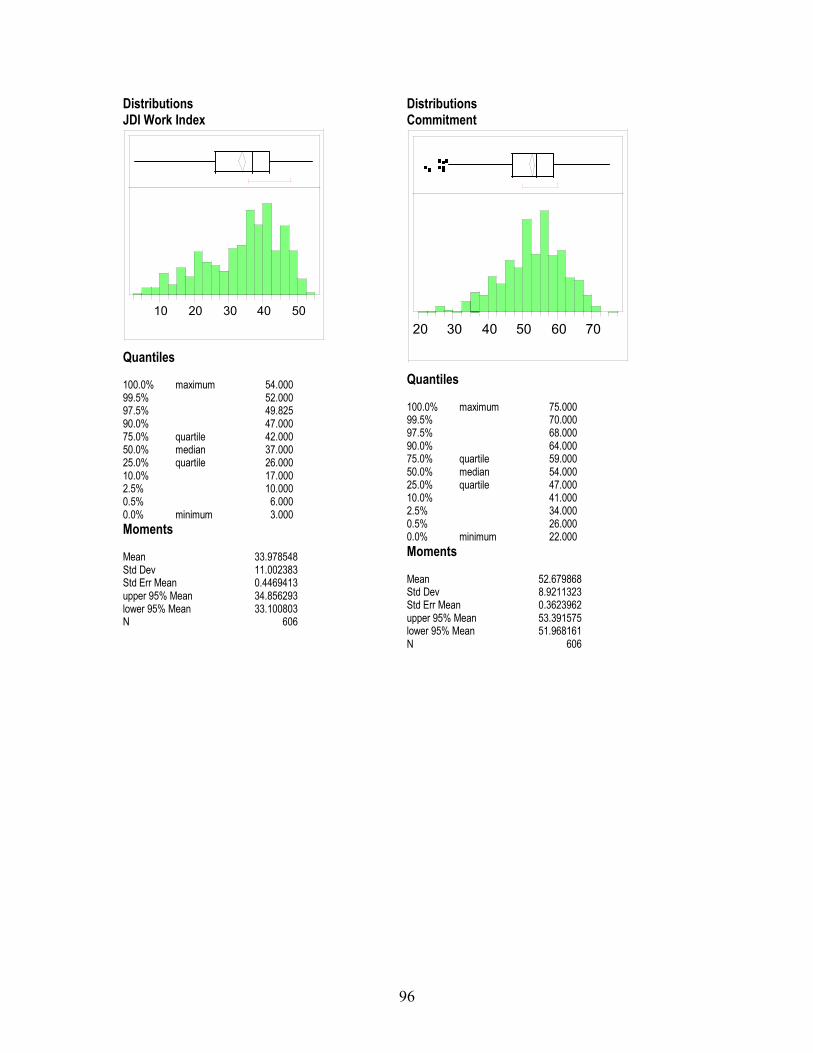
96
Distributions JDI Work Index
10 20 30 40 50
Quantiles 100.0% maximum 54.000 99.5% 52.000 97.5% 49.825 90.0% 47.000 75.0% quartile 42.000 50.0% median 37.000 25.0% quartile 26.000 10.0% 17.000 2.5% 10.000 0.5% 6.000 0.0% minimum 3.000 Moments Mean 33.978548 Std Dev 11.002383 Std Err Mean 0.4469413 upper 95% Mean 34.856293 lower 95% Mean 33.100803 N 606
DistributionsCommitment
20 30 40 50 60 70
Quantiles 100.0% maximum 75.000 99.5% 70.000 97.5% 68.000 90.0% 64.000 75.0% quartile 59.000 50.0% median 54.000 25.0% quartile 47.000 10.0% 41.000 2.5% 34.000 0.5% 26.000 0.0% minimum 22.000 Moments Mean 52.679868 Std Dev 8.9211323 Std Err Mean 0.3623962 upper 95% Mean 53.391575 lower 95% Mean 51.968161 N 606
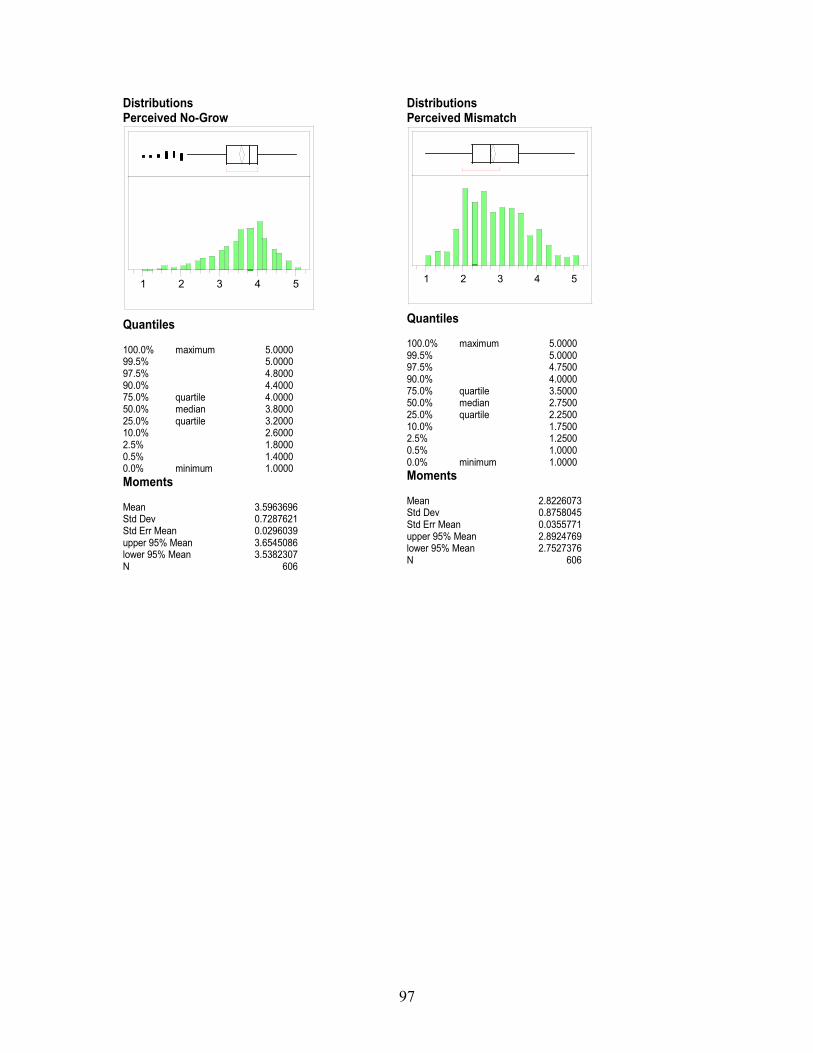
97
Distributions Perceived No-Grow
1 2 3 4 5
Quantiles 100.0% maximum 5.0000 99.5% 5.0000 97.5% 4.8000 90.0% 4.4000 75.0% quartile 4.0000 50.0% median 3.8000 25.0% quartile 3.2000 10.0% 2.6000 2.5% 1.8000 0.5% 1.4000 0.0% minimum 1.0000 Moments Mean 3.5963696 Std Dev 0.7287621 Std Err Mean 0.0296039 upper 95% Mean 3.6545086 lower 95% Mean 3.5382307 N 606
DistributionsPerceived Mismatch
1 2 3 4 5
Quantiles 100.0% maximum 5.0000 99.5% 5.0000 97.5% 4.7500 90.0% 4.0000 75.0% quartile 3.5000 50.0% median 2.7500 25.0% quartile 2.2500 10.0% 1.7500 2.5% 1.2500 0.5% 1.0000 0.0% minimum 1.0000 Moments Mean 2.8226073 Std Dev 0.8758045 Std Err Mean 0.0355771 upper 95% Mean 2.8924769 lower 95% Mean 2.7527376 N 606
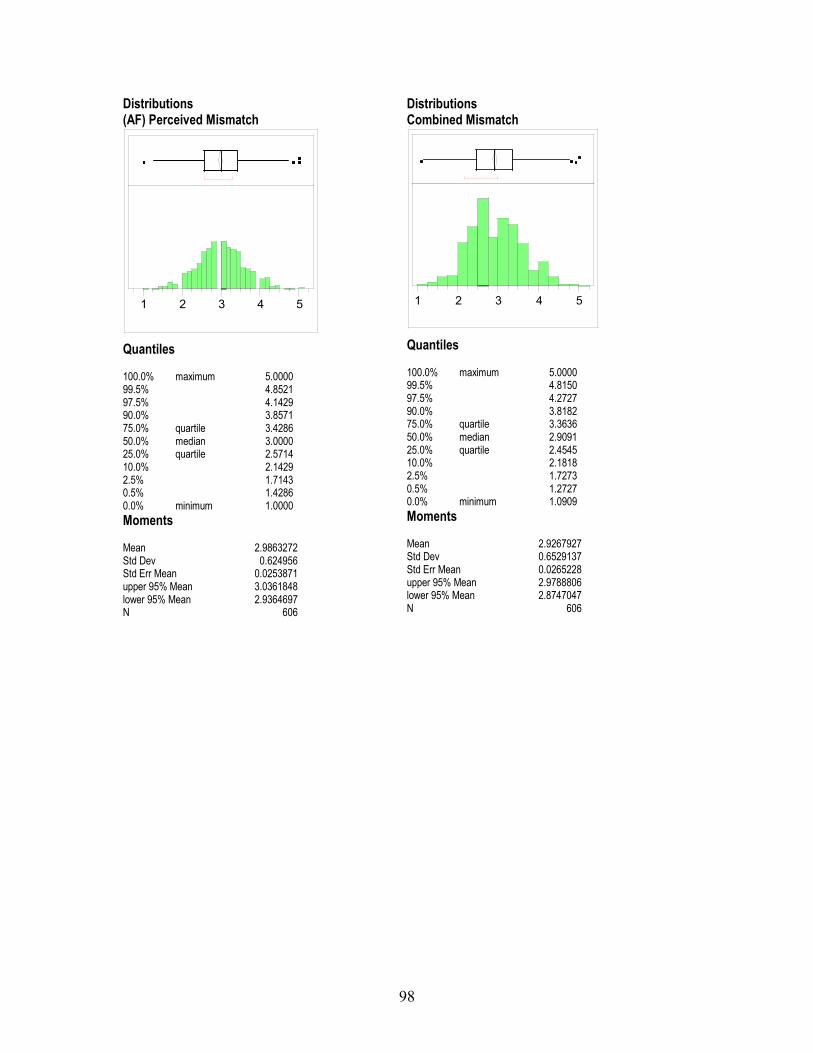
98
Distributions (AF) Perceived Mismatch
1 2 3 4 5
Quantiles 100.0% maximum 5.0000 99.5% 4.8521 97.5% 4.1429 90.0% 3.8571 75.0% quartile 3.4286 50.0% median 3.0000 25.0% quartile 2.5714 10.0% 2.1429 2.5% 1.7143 0.5% 1.4286 0.0% minimum 1.0000 Moments Mean 2.9863272 Std Dev 0.624956 Std Err Mean 0.0253871 upper 95% Mean 3.0361848 lower 95% Mean 2.9364697 N 606
DistributionsCombined Mismatch
1 2 3 4 5
Quantiles 100.0% maximum 5.0000 99.5% 4.8150 97.5% 4.2727 90.0% 3.8182 75.0% quartile 3.3636 50.0% median 2.9091 25.0% quartile 2.4545 10.0% 2.1818 2.5% 1.7273 0.5% 1.2727 0.0% minimum 1.0909 Moments Mean 2.9267927 Std Dev 0.6529137 Std Err Mean 0.0265228 upper 95% Mean 2.9788806 lower 95% Mean 2.8747047 N 606
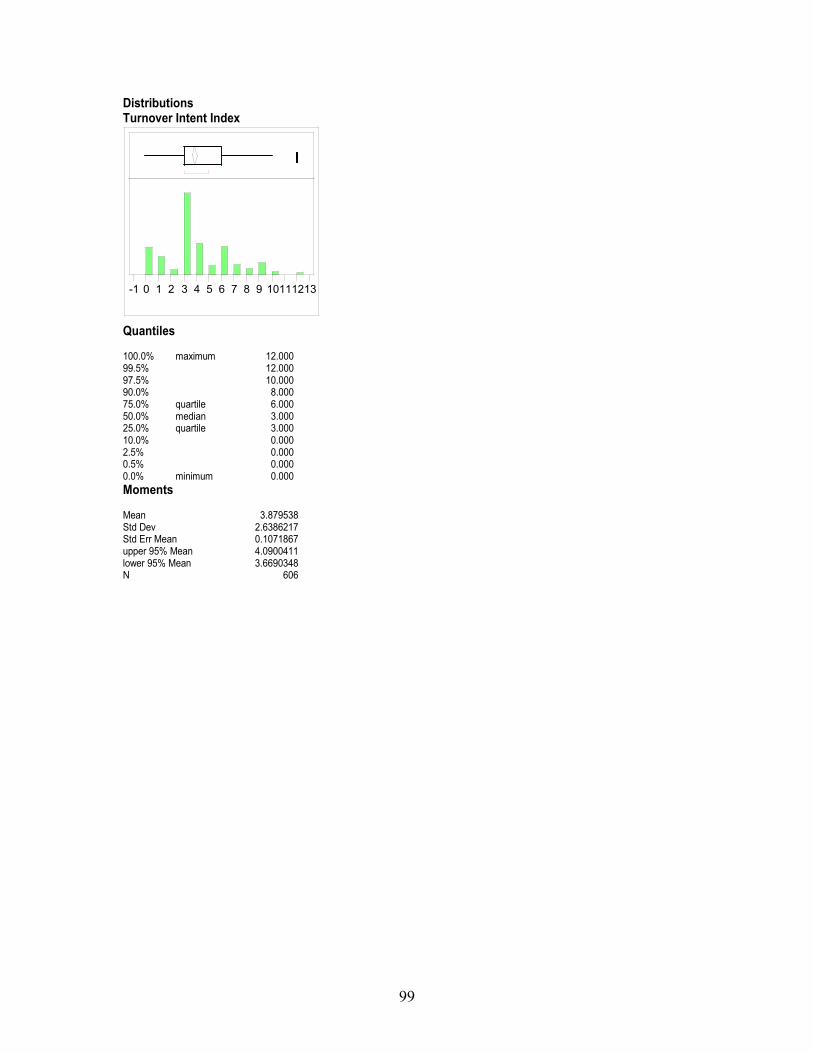
99
Distributions Turnover Intent Index
-1 0 1 2 3 4 5 6 7 8 9 10111213
Quantiles 100.0% maximum 12.000 99.5% 12.000 97.5% 10.000 90.0% 8.000 75.0% quartile 6.000 50.0% median 3.000 25.0% quartile 3.000 10.0% 0.000 2.5% 0.000 0.5% 0.000 0.0% minimum 0.000 Moments Mean 3.879538 Std Dev 2.6386217 Std Err Mean 0.1071867 upper 95% Mean 4.0900411 lower 95% Mean 3.6690348 N 606
100
Bibliography
Alba-Ramirez, Alfonso. “Mismatch in the Spanish labor market. Overeducation?,”
Journal of Human Resources, 28: 259-279 (Spring 1993). Arnott, Richard J. and Joseph E. Stiglitz. “Labor Turnover, Wage Structures, and Moral
Hazard: The Inefficiency of Competitive Markets,” Journal of Labor Economics 3: 434-463 (October 1985).
Bowlus, Audra J. “Matching Workers and Jobs: Cyclical Fluctuations in Match
Quality,” Journal of Labor Economics, 13: 335-351 (April 1995). Buchel, Felix. “ The effects of overeducation on productivity in Germany – the firms’
viewpoint,” Economics of Education Review, 21: 263-275 (2002). Clark, Andrew E. “What really matters in a job? Hedonic measurement using quit data,”
Labor Economics, 8: 223-242 (2001). Cohn, Elchanan and Shahina P. Khan. “The wage effect of overschooling revisited,”
Labor Economics, 2: 67-76 (1995) Dooley, David. Social Research Methods (Fourth Edition). New Jersey: Prentice Hall, 2001. Groot, Wim and Herriette Maassen van den Brink. “Overeducation in the labor market: a
meta-analysis,” Economics of Education Review, 19:149-158 (2000). Hersch, Joni. “Education Match and Job Match,” Review of Economics & Statistics,
73:140-145 (February 1991). Herzberg, Fredrick, Bernard Mausner, and Barbara B. Snyderman. The Motivation to
Work (2nd Edition). New York: John Wiley & Sons, Inc., 1959. Herzberg, Fredrick. Work and the Nature of Man. Cleveland: The World Publishing
Company, 1967. Hom, Peter W., Raoph Katerberg, Jr. and Charles L. Hulin. “Comparative Examination
of Three Approaches to the Prediction of Turnover,” Journal of Applied Psychology, 64: (June, 1979).
Hom, Peter W. and Charles L. Hulin. “A Competitive Test of the Prediction of
Reenlistment by Several Models,” Journal of Applied Psychology, 66: 23-39 (February, 1981).
101
Johnson, Gloria J. and W. Roy Johnson. “Perceived Overqualification, Positive and Negative Affectivity, and Satisfaction with Work,” Journal of Social Behavior & Personality, 15: 167-185 (June 2000).
Johnson, Gloria J. and W. Roy Johnson. “Perceived Overqualification and Dimensional
of Job Satisfaction: A Longitudinal Analysis,” Journal of Psychology, 134: 537-556 (September 2000).
Johnson, W. Roy, Paula C. Morrow, and Gloria Jones Johnson. “An Evaluation of a
Perceived Overqualification Scale Across Work Settings,” Journal of Psychology, 136: 425-442 (July, 2002).
Kehm, Barbara M. and Ulrich Teichler. “Higher Education and Employment,” European
Journal of Education, 30: 407-422 (April 1995). Lee, Thomas W., Terence R. Mitchell, Brooks C. Holtom, Linda S. McDaniel, and John
W. Hill. “The Unfolding Model of Voluntary Turnover: A Replication and Extension,” Academy of Management Journal, 42:450-462 (August, 1999).
Mobley, William H. “Intermediate Linkages in the Relationship Between Job
Satisfaction and Employee Turnover,” Journal of Applied Psychology, 62: 4 (April, 1977).
Mobley, William H., R. W. Griffeth, H. H. Hand and B. M. Meglino. “Review and
Conceptual Analysis of the Employee Turnover Process,” Psychological Bulletin, 86: 493-522 (1979).
Porter, Lyman W., Richard M. Steers, and Richard T. Mowday. “Organizational
Commitment, Job Satisfaction, and Turnover Among Psychiatric Technicians,” Journal of Applied Psychology, 59: 603-609 (1974).
Tsang, Mun C. and Henry M. Levin. “The Economics of Overeducation,” Economics of
Education Review, 4: 93-104 (1985). Tsang, Mun C. “The Impact of Underutilization of Education on Productivity: A Case
Study of the U.S. Bell Companies,” Economics of Education Review, 6: 239-254 (1987).
Tsang, Mun C., Russell W. Rumberger, and Henry M. Levin. “The Impact of Surplus
Schooling on Worker Productivity,” Industrial Relations, 30: 209-228 (Spring, 1991).
Vahey, Shaun P. “The great Canadian training robbery: evidence on the returns of
educational mismatch,” Economics of Education Review, 19: 219-227 (2000).
102
Vita
Captain Thomas E. Hoskins was born 2 October 1973 in Monmouth, Illinois. He
graduated from Moline High School in Moline, Illinois in 1991. In 1995, he graduated
from Virginia Military Institute with a Bachelor of Arts degree in Economics and
Business. His first assignment was to the 355th Operational Contracting Squadron at
Davis-Monthan AFB, Arizona. While there he served as a buyer in the construction,
commodities, and services branches. In 1998, he was assigned to the Launch program
office at Space and Missile Systems Center at Los Angeles AFB, California. While there
he worked as the procurement contracting officer for Atlas and IUS programs. Captain
Hoskins entered the school of Engineering and Management at the Air Force Institute of
Technology in August of 2001.
Permanent Address: 111 East 3rd Street Coal Valley, IL 61240
1
REPORT DOCUMENTATION PAGE Form Approved OMB No. 074-0188
The public reporting burden for this collection of information is estimated to average 1 hour per response, including the time for reviewing instructions, searching existing data sources, gathering and maintaining the data needed, and completing and reviewing the collection of information. Send comments regarding this burden estimate or any other aspect of the collection of information, including suggestions for reducing this burden to Department of Defense, Washington Headquarters Services, Directorate for Information Operations and Reports (0704-0188), 1215 Jefferson Davis Highway, Suite 1204, Arlington, VA 22202-4302. Respondents should be aware that notwithstanding any other provision of law, no person shall be subject to an penalty for failing to comply with a collection of information if it does not display a currently valid OMB control number. PLEASE DO NOT RETURN YOUR FORM TO THE ABOVE ADDRESS. 1. REPORT DATE (DD-MM-YYYY)
25-03-2003 2. REPORT TYPE
Master’s Thesis
3. DATES COVERED (From – To) Aug 2002 – Mar 2003
5a. CONTRACT NUMBER
5b. GRANT NUMBER
4. TITLE AND SUBTITLE THE EFFECTS OF PERCEIVED OVERQUALIFICATION ON JOB SATISFACTION, ORGANIZATIONAL COMMITMENT, AND TURNOVER: A STUDY OF AFIT GRADUATES
5c. PROGRAM ELEMENT NUMBER
5d. PROJECT NUMBER 5e. TASK NUMBER
6. AUTHOR(S) Hoskins, Thomas E. Captain, USAF 5f. WORK UNIT NUMBER
7. PERFORMING ORGANIZATION NAMES(S) AND ADDRESS(S) Air Force Institute of Technology Graduate School of Engineering and Management (AFIT/EN) 2950 Hobson Way, Building 640 WPAFB OH 45433-7765
8. PERFORMING ORGANIZATION REPORT NUMBER AFIT/GAQ/ENG/03-01
10. SPONSOR/MONITOR’S ACRONYM(S)
9. SPONSORING/MONITORING AGENCY NAME(S) AND ADDRESS(ES) USAF/DPLE USAF/DPLFA Attn: Col.(s) Sam Walker DSN: 223-3661 LtCol Mary Purdue 1040 Air Force Pentagon DSN: 255-9855 Washington, DC 20330-1040 Same Address
11. SPONSOR/MONITOR’S REPORT NUMBER(S)
12. DISTRIBUTION/AVAILABILITY STATEMENT APPROVED FOR PUBLIC RELEASE; DISTRIBUTION UNLIMITED.
13. SUPPLEMENTARY NOTES 14. ABSTRACT The U.S. Air Force provides multiple programs to increase the educational skills of its workforce. This study focuses on the Air Force Institute of Technology (AFIT) graduate level, in-residence degree program. The Air Force is making a significant investment in the education of its members. Studies on perceived overqualification, overeducation, and match quality suggest that utilization plays a role in an individual’s job satisfaction and organizational commitment. Job satisfaction and organizational commitment levels can be used as predictors of turnover. This research studies the levels of perceived overqualification in AFIT graduates and how it effects their job satisfaction, organizational commitment, and turnover. Data for this research was collected using an on-line survey tool, Facilitate.com. Analysis indicates that US Air Force officers who perceived that they were overqualified for their AFIT follow-on assignment did experience lower levels of job satisfaction and organizational commitment. The hypotheses, results, and analysis of this study are presented along with recommendations and suggestions for future research.. 15. SUBJECT TERMS Job Satisfaction, Organizational Theory, Organizational Commitment, Perceived Overqualification, Turnover, Overeducation
16. SECURITY CLASSIFICATION OF: 19a. NAME OF RESPONSIBLE PERSON Mikel M. Miller, LtCol, USAF
a. REPORT
U
b. ABSTRACT
U
c. THIS PAGE
U
17. LIMITATION OF ABSTRACT
UU
18. NUMBER OF PAGES
113 19b. TELEPHONE NUMBER (Include area code) (937) 255-6127, ext 4274
Standard Form 298 (Rev. 8-98) Prescribed by ANSI Std. Z39-18