Embed Size (px)
Citation preview
THE EFFECTS OF LOGO ON PROBLEM SOLVING, LOCUS OF
CONTROL, ATTITUDES TOWARD MATHEMATICS, AND ANGLE
RECOGNITION IN LEARNING DISABLED CHILDREN
by
CHARLOTTE M. HORNER, B.S., M.A.
A DISSERTATION
IN
EDUCATION
Submitted to the Graduate Faculty of Texas Tech University in
Partial Fulfillment of the Requirements for
the Degree of
DOCTOR OF EDUCATION
Approved
Accepted
May, 1984

I V-
No • / : / - ,^/- ACKNOWLEDGEMENTS
/ •
The completion of this document is a realization of
a personal goal. Although personal, this endeavor could
not have been completed without the understanding and
assistance from several individuals. First, the study
would not have been a reality without the cooperation of
the Lubbock Independent School District. Many thanks go
to Carroll Melnyk, Jerrell Snodgrass, and Curtis Gipson.
Next, I want to express gratitude to my committee
members who directed my work and supported my efforts.
Dr. Cleborne Maddux was not only an excellent chairman
but also a caring friend. He not only shared with me his
expertise in research and writing, but he also listened
to me, shared my experiences, carefully guided ray work,
and exhibited a great deal of patience. My other
committee members also played a significant role in the
completion of this document. I shall always value the
professional leadership and the friendship bestowed upon
me by Dr. Ann Candler, Dr. Paul Dixon, Dr. LaMont
Johnson, and Dr. Virginia Sowell.
Finally, I wish to express my love and appreciation
to my husband and my family. Perhaps I could have
completed this task without them, but I doubt it. It is
difficult to express what I feel. I think they will
understand if I simply say—Thanks.
ii
CONTENTS
ACKNOWLEDGEMENTS ii
LIST OF TABLES vi
I. INTRODUCTION 1
Statement of the Problem 1
Contribution of the Study 5
Limitations and Considerations
of the Study 6
II . REVIEW OF RELATED LITERATURE 9
Definition of Learning Disability 9
Problem Solving 15
Piaget's Theory of Cognitive Development 18
Stages and Skills of Problem Solving...20
Problem Solving Related to
LD Students 21
Suramary 24
Locus of Control 25
Math Achievement and Math Attitude 30
Math Achievement 30
Math Attitude 31
Computers in Education 33
Introduction 33
Summary of Research 36
Computers with Exceptional Children.... 39
Summary 42
iii

Logo 43
A Programming Language 43
Origin and Purpose of Logo 46
Logo Philosophy 47
Turtle Geometry 49
Studies and Projects 54
Logo with Exceptional Children 57
Summary 59
Summary of Review and Hypotheses 60
III. METHODOLOGY 63
Subjects 63
Instruments 64
Group Assessment of Logical
Thinking 65
lARQ 66
Fennemna-Sherman Math Attitudes
Scales 66
Horner Angle Recognition Test 68
Design and Analysis 69
Procedures 70
IV . RESULTS 7 2
Descriptive Data 72
Analysis of Covariance 76
Hypotheses 79
Hypothesis 1 79
Hypothesis 2 80
iv

Hypothesis 3 81
Hypothesis 4 84
Summary 87
V. DISCUSSION AND CONCLUSIONS 88
Summary of Study 88
Discussion of the Study 91
Results 91
Problem Solving 94
Locus of Control 95
Math Attitudes 97
Recognition of Geometric Angles....98
Summary of Results 99
Student Computer Experience 100
Educational Relevance 103
Implications For Further Research 104
Conclusion 105
LIST OF REFERENCES 107
APPENDICES
A. Horner Angle Recognition Test 118
B. Logo Curriculum 124
C . How Did You Do On Logo 147
v
Hypothesis 3 81
Hypothesis 4 84
Summary 87
V. DISCUSSION AND CONCLUSIONS 88
Summary of Study 88
Discussion of the Study 91
Results 91
Problem Solving 94
Locus of Control 95
Math Attitudes 97
Recognition of Geometric Angles....98
Summary of Results 99
Student Computer Experience 100
Educational Relevance 103
Implications For Further Research 104
Conclusion 105
LIST OF REFERENCES 107
APPENDICES
A. Horner Angle Recognition Test 118
B. Logo Curriculum 124
C. How Did You Do On Logo 147
v
LIST OF TABLES
1. Demographic Information for Each Group 7 3
2. Frequencies of Computer Experience Responses 75
3. LD Mean Scores and Standard Deviations (s) for Dependent Variable Measures 77
4. Non-LD Mean Scores and Standard Deviations (s)
for Dependent Variable Measures 78
5. Analysis of Covariance for Post-Gait Scores 79
6. Analysis of Covariance for Post-IARQ Scores 80
7. Analysis of Covariance for Post-Confidence
Scores 81
8. Analysis of Covariance for Post-Success Scores....82
9. Analysis of Covariance for Post-Anxiety Scores....82
10. Analysis of Covariance for Post-Male Domain
Scores 83
11. Analysis of Covariance for Post-Angle Scores 84
12. Comparison of Observed and Expected Frequencies of Internal and External Logo Attributions 87
VI

LIST OF TABLES
1. Demographic Information for Each Group 73
2. Frequencies of Computer Experience Responses 75
3. LD Mean Scores and Standard Deviations (s) for Dependent Variable Measures 77
4. Non-LD Mean Scores and Standard Deviations (s) for Dependent Variable Measures 78
5. Analysis of Covariance for Post-Gait Scores 79
6. Analysis of Covariance for Post-IARQ Scores 80
7. Analysis of Covariance for Post-Confidence
Scores 81
8. Analysis of Covariance for Post-Success Scores....82
9. Analysis of Covariance for Post-Anxiety Scores....82
10. Analysis of Covariance for Post-Male Domain
Scores 83
11. Analysis of Covariance for Post-Angle Scores 84
12. Comparison of Observed and Expected Frequencies of Internal and External Logo Attributions 87
VI

CHAPTER I
INTRODUCTION
Statement of the Problem
Among school children in America there is a subgroup
who have been diagnosed as having learning disabilities
(LD). These children do not fit into traditional
categories of exceptionality such as mental retardation,
sensory handicap, emotional disturbance, or physical
handicap. Historically, there has been disagreement about
the definition of a learning disabled child; however,
currently it is accepted that these children have
specific learning disabilities which can include a
disorder in one or more basic psychological processes
involved in understanding or using spoken or written
language. The disorders may be in listening, thinking,
talking, reading, writing, spelling or arithmetic
(Mercer, Forgone, & Wolking, 1976; Federal Register,
1977, p. 65083). Because these children can have diverse
learning disabilities due to various causes, operation-
alizing the definition for purposes of diagnosis has been
difficult and controversial. To alleviate some of the
confusion a simple discrepancy model is often used to
identify LD students. A discrepancy is proven by
documenting a significant difference between ability and
achievement. Ability is usually measured with an

individual intelligence test, while achievement is
measured with a variety of academic achievement tests
(Reger, 1979) .
Students who are classified as learning disabled may
be educationally categorized as a homogeneous group, but
in reality they have diverse specific learning disabili
ties. These problems include differing behavioral,
cognitive, and perceptual disorders. However, since LD
students are identified based on a discrepancy model, it
may be assumed that one unifying characteristic among
these children is academic failure (Reger, 1979).
Much of the literature, which will be reviewed in
detail in the next chapter, indicates that common factors
which have been linked to academic failure in school
include: (a) poor problem solving skills, (b) external
locus of control, and (c) negative attitudes toward
school subjects (Alley & Deshler, 1979; Johnson &
Myklebust, 1967). When considering these common factors,
there appears to be a need for research concerning
intervention methods which might positively affect these
factors and academic performance.
Teaching computer programming has been suggested as
an intervention to improve academic performance (Papert,
1980). It is believed that programming can teach problem
solving skills and mathematical concepts by providing

opportunities for estimation, interaction, experience,
and revision (Papert, 1980; Watt, 1982).
Seymour Papert (1980), the primary developer of the
computer language, Logo, suggests that computer program
ming can provide the experience children need for active
learning. Papert studied with Piaget in Geneva for five r
years and much of the Logo philosophy has its roots in
Piagetian theory. Consistent with a Piagetian develop
mental approach to learning, he believes that problem
solving skills will be enhanced through learning to
program in Logo by providing concrete experiences which
will promote thinking at a formal operational level. When
individuals reach this level they have the ability to
construct relationships, make inferences, and hypothesize
(Piaget, 1952). Further, Papert maintains that Logo can
promote academic achievement by creating an environment
in which children can create their own intellectual
structures.
With all the advantages which Logo is said to
provide, it is not surprising that it has been recom
mended for learning disabled students (Maddux & Johnson,
1983; Maddux, 1984; Weir, Russell, & Valente, 1982). Logo
may provide an environment to develop problem solving
skills by allowing students to work at their own pace
without the fear of being wrong. Also, it could possibly

help students overcome negative attitudes about academic
subjects, especially math (Papert, 1980).
Based on the literature concerning Logo it was
determined that instruction in Logo programming might be
beneficial to LD students, particularly in affecting the
variables of problem solving, locus of control, and atti
tudes toward academic subjects. Although Papert (1980)
believes Logo will enhance all academic areas, he gives
examples of how it may improve attitudes toward math and
math ability. Specifically, he states it will improve the
ability to recognize geometric angles (pp. 56-60).
Because Papert (1980) stresses the positive effects
of Logo on mathematical concepts, and since math is one
of the academic areas in which LD students experience
failure, the focus of this investigation was to determine
the effect Logo has on LD students who have difficulty in
mathematics. Specifically, the purpose of this study was
to investigate the effectiveness of teaching Logo to stu
dents identified as learning disabled students in the
areas of problem solving abilities, locus of control,
attitudes toward math, and what Papert ( 1980) refers to
as the mathematical concept of angle recognition.

Contribution of the Study
At the present time there is a paucity of evidence
to support the claims made by Seymour Papert and others
as to the benefits which Logo offers to all students. It
is hoped that this study will provide empirical infor
mation regarding the effect Logo has on problem solving
ability, locus of control, attitudes toward mathematics,
and the specific mathematical concept of geometric angle
recognition. If Logo provides the educational benefits
discussed above, it may be effective for learning dis
abled students for the following reasons:
1. LD students have poor problem solving skills;
Logo may enhance problem solving skills.
2. LD students have experienced academic failure;
Logo may teach skills which generalizes across
subject areas.
3. LD students' locus of control affects their
perceptions of outcomes, and they have negative
attitudes about their abilities; Logo may provide
an environment for success.
This study should provide more information con
cerning cognitive and attitudinal effects of learning to
program with Logo on learning disabled students. Another
contribution this study will provide is documentation of
the procedures used to coordinate the Logo instruction in
a public secondary school.
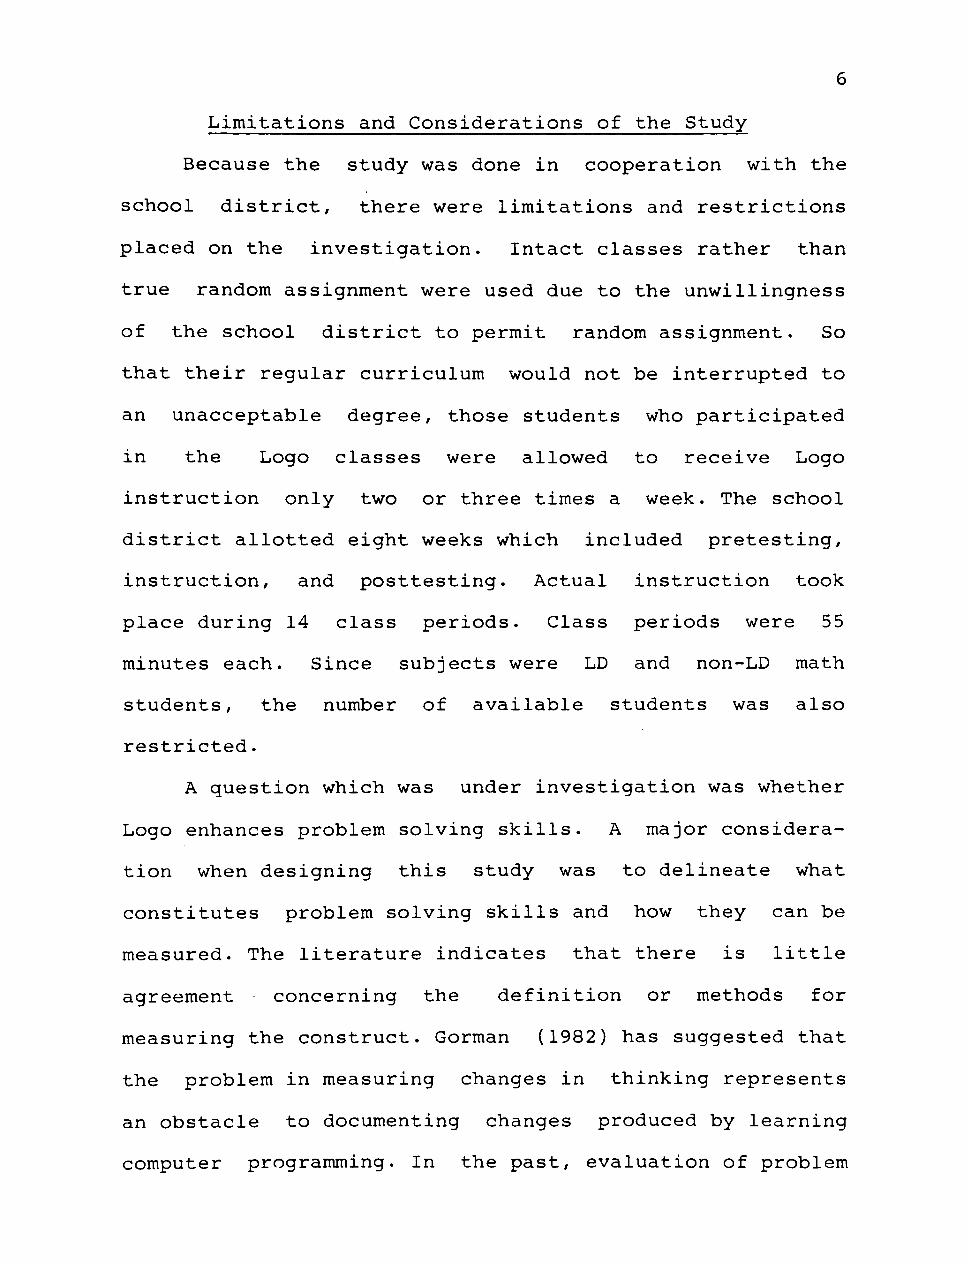
Limitations and Considerations of the Study
Because the study was done in cooperation with the
school district, there were limitations and restrictions
placed on the investigation. Intact classes rather than
true random assignment were used due to the unwillingness
of the school district to permit random assignment. So
that their regular curriculum would not be interrupted to
an unacceptable degree, those students who participated
in the Logo classes were allowed to receive Logo
instruction only two or three times a week. The school
district allotted eight weeks which included pretesting,
instruction, and posttesting. Actual instruction took
place during 14 class periods. Class periods were 55
minutes each. Since subjects were LD and non-LD math
students, the number of available students was also
restricted.
A question which was under investigation was whether
Logo enhances problem solving skills. A major considera
tion when designing this study was to delineate what
constitutes problem solving skills and how they can be
measured. The literature indicates that there is little
agreement concerning the definition or methods for
measuring the construct. Gorman (1982) has suggested that
the problem in measuring changes in thinking represents
an obstacle to documenting changes produced by learning
computer programming. In the past, evaluation of problem

7
solving has been accomplished primarily in one of two
ways. One method is to have problem solvers think aloud
as they work while the investigators record behaviors.
Another way is to have problem solvers reflect on what
they did and why after the problem solving activity has
taken place. There are definite weaknesses in these
methods of problem solving evaluation. First, thinking
aloud can affect the problem solving performance, and
there may be a tendency for the problem solvers to talk
about only the behaviors they think are safe or correct.
Next, it is unlikely that all of the behaviors can be
reconstructed in a retrospective analysis. Finally,
assessment involving thinking aloud or reflection may be
testing linguistic development rather than problem
solving ability (Lester, 1982).
In an effort to stay within Papert's philosophy of
Logo and its Piagetian roots, it was decided to use the
Group Assessment of Logical Thinking (Roadrangka, Yeany,
and Padilla, 1983), which is a paper and pencil
Piagetian-based measure of logical operations. Such
evaluation tools have definite weaknesses. As Furth
(1984) noted, logical operations are difficult to
observe, especially when one is asked to perform such
activities. The purpose, however, of using this type of
instrument was to gather information concerning the

8
possibility that Logo can advance students' logical
operations as Papert contends it can.
In conclusion, although LD students have various
types of learning disabilities, there are common factors
which have been linked to their academic failure. These
factors include poor problem solving, external locus of
control, and negative attitudes toward academic subjects.
An educational intervention which has been recommended to
positively affect these factors is teaching children to
program in Logo. There are also claims that Logo improves
mathematical concepts, particularly recognition of
geometric angles. One of the academic areas which poses
difficulty for LD students is math. Therefore, it was the
purpose of this study to investigate the efficacy of
using Logo with LD students who have math difficulty. The
areas investigated were (a) problem solving, (b) locus of
control, (c) attitudes toward math, and (d) recognition
of geometric angles.

CHAPTER II
REVIEW OF RELATED LITERATURE
There are numerous reasons why learning disabled
children experience academic failure in mathematics and
other school subjects. Factors such as problem solving
ability, external locus of control, and attitudes are
related to poor school performance for these children.
The purpose of this chapter is to discuss the definition
of learning disabilities and the literature which
demonstrates the complex nature of problem solving,
problem solving difficulties of LD students, the external
locus of control possessed by LD students, and attitu
dinal factors which may affect poor math performance by
LD students. In addition, the utility of microcomputer
use in education and the literature related to Logo will
be discussed.
Definition of Learning Disability
Prior to 1963 the category of learning disability
(LD) did not exist, but this is not to say that the
condition did not exist. Children with this condition
were given a variety of labels such as hyperactive,
brain-injured, neurologically impaired, minimally
brain-injured (MBI), perceptually disordered, aphasic,
9

10
dyslexic, and dysgraphic (Gearheart, 1981, p. 5). These
terms were derived from the fields of neurology, pyschol-
ogy, speech pathology, ophthalmology, and remedial read
ing (Kirk & Gallagher, 1983).
As early as the 1800 ' s publications described what
is referred to currently as learning disabilities. Phy
sicians worked with patients who had lost the ability to
speak or read as a result of brain injuries due to war,
accident, or disease. Some adults who had severe reading
problems were diagnosed by ophthalmologists and physi
cians as having word blindness and visual memory defects
(Gearheart, 1981, pp. 5-7). These disorders were often
called aphasia, dyslexia, dyscalculia, and dysgraphia.
Eventually work with these patients led to the
identification of children who had similar character
istics but had suffered no apparent neurological insult
(Kirk, 1981).
After the publication in 1947 of the book,
Psychopathology of Brain Injured Children by Alfred
Strauss and Laura Lehtinen, educational programs were
developed for children who were not learning in school.
Frustrated parents reported that their children were lan
guage delayed but were not auditorily handicapped; could
not visually perceive or discriminate accurately, yet
were not visually impaired; could not learn to read,
11
write, or spell but were not mentally retarded. In order
to provide special services, classes were organized for
"brain-injured" children (Kirk, 1981). Although these
children exhibited "brain-injured" behaviors, there was
little or no hard evidence of neurological damage (Cohn,
1964). Because of the difficulty of determining actual
brain damage the word "dysfunction" sometimes replaced
the words "injury" or "damage." These terms came to
indicate a malfunctioning of the brain rather than tissue
damage (Gearheart, 1981, p.7).
Labels used to describe these children were
confusing because they were too broad or too specific.
The term "brain-injured" was not adequate because the
condition was difficult to diagnose, and if it were
diagnosed it gave little indication for educational
treatment. The term "dyslexic," which refers to a severe
reading problem, was confusing because it described a
symptom which had a variety of causes from brain injury
to environmental disadvantage (Hallahan & Kauffman, 1982,
p. 92). "Perceptually disordered" was also inadequate
because it excluded language disorders and might only be
part of the problem of inability to learn (Hallahan &
Kauffman, 1982, pp. 90-95; Kirk, 1981).
In 1963 Kirk suggested the term "learning
disability" in order to circumvent the confusing labels

12
given to children who had normal intelligence but who
also had learning problems. This term was generally
accepted because it was related to teaching and learning,
and because educational services might be more easily
secured (Kirk, 1981).
Using the term learning disability, however, was
much easier than defining it. In 1969 the National
Advisory Committee on Handicapped Children (NACHC) de
fined a child with specific learning disabilities as
having a disorder in one or more basic psychological
processes involved in understanding or using spoken or
written language. The disorders may be in listening,
thinking, talking, reading, writing, spelling or arith
metic (Mercer, Forgone, & Wolking, 1976). Cruickshank
(1972) reported that the definition was influential but
still a multitude of definitions were in existence and
more than 40 English terms had been used in the
literature to refer to essentially the same child.
From the many definitions of an LD child which have
been suggested, the factors which are most common
include: (I) academic retardation, (2) uneven pattern of
development, (3) a possible central nervous system
dysfunction, (4) learning problems not due to environ
mental disadvantages, and (5) learning problems not due
to mental retardation or emotional disturbance (Hallahan
& Kauffman, 1982) .

13
Currently the Federal definition is:
"Specific learning disability" means a disorder in one or more of the basic psychological processes involved in understanding or in using language, spoken or written, which may manifest itself in an imperfect ability to listen, think, speak, read, write, spell, or to do mathematical calculations. The term includes such conditions as perceptual handicaps, brain injury, minimal brain dysfunction, dyslexia, and developmental aphasia. The term does not include children who have learning problems which are primarily the result of visual, hearing, or motor handicaps, of mental retardation, of emotional disturbance, or of environmental, cultural, or economic disadvantage (Federal Register, 1977, p. 65083).
The Federal definition has three main components:
the principle of discrepancy, basic psychological process
deficits, and the children who shall be excluded. Dis
crepancy refers to a difference in academic achievement
and measured intellectual ability. Psychological pro
cesses refer to the learning processes of auditory per
ception, visual perception, tactile perception, motoric
perception, and memory. There is an assumption that these
processes are related to academic or language success.
Myers and Hammill (1976) state:
...a process can be impaired in at least three ways : 1. Loss of an established basic process. 2. Inhibition of development of such a
process. 3. Interference with the function of such a
process (p.5).
Finally, the exclusion clause prohibits labeling as
learning disabled children whose main handicap is mental

14
retardation, emotional disturbance, or sensory deficit
(Kirk & Gallagher 1983).
The establishment of the Federal definition has not
ended the controversy as to how a learning disabled child
should be defined. The confusion is reflected by the fact
that the prevalence of learning disabled children is
reported from as low as one percent to as high as 30
percent (Hallahan & Kauffman, 1982).
According to the State Board of Education Rules for
Handicapped Students (Texas Education Agency, 1983)
learning disabled students are those who:
(a) demonstrate a significant discrepancy between academic achievement and intellectual abilities in one or more of the areas of oral expression, listening comprehension, v/ritten expression, basic reading skills, reading comprehension, mathematics calculation, mathematics reasoning, or spelling; (b) for whom it is determined that the discrepancy is not primarily the result of visual handicap, hearing impairment, mental retardation, emotional disturbance, or environmental, cultural, or economic disadvantage; and (c) for whom the inherent disability exists to a degree such that they cannot be adequately served in the regular classes of the public schools without the provision of special services (p. 94).
The State Board of Education states that a severe
discrepancy between achievement and intellectual ability
exists when the student's assessed intellectual ability
is above the mentally retarded range, but where the
student's assessed educational achievement in areas

15
specified is more than one standard deviation below the
student's intellectual ability (p. 94).
The definitions which are used to identify learning
disabled students indicate that regardless of specific
disabilities, academic failure is a common factor among
these children. Kirk and Gallagher (1983) separate
specific learning disabilities into two groups: academic
disabilities and developmental learning disabilities.
Academic disabilities are indicated by failure in
academic performance in reading, writing, spelling, and
arithmetic and is observed when a child fails in one or
more of the academic subjects. Developmental disabilities
are not as observable as academic disabilities; however,
they often underlie problems in academic performance.
These developmental disabilities can include disorders of
attention, perceptual and expressive disorders, limited
use of memory, understanding relationships, generalizing,
and a wide array of language disorders. Although children
who are labeled LD have various learning disabilities,
failure in one or more academic subjects is an experience
they have in common (Kirk and Gallagher, 1983).
Problem Solving
An area which has been linked to academic difficulty
for LD children is poor problem solving ability. Problem
solving has been defined as efforts which include

16
thinking, reasoning, judgment, and strategies (Johnson,
1972). As the world becomes characterized by more complex
activities and society becomes more technological,
problem solving becomes increasingly more important.
Because daily activities demand problem solving skills,
educators have been given the task of trying to improve
problem solving abilities of students. As previously
mentioned, inadequate problem solving ability may be a
factor in poor academic performance by LD students.
The task of improving problem solving may be aptly
described as a challenge. The presentation of this
challenge brings to bear two important questions: Can
problem solving ability be improved? If so, how? The
responses to these questions have been controversial
because problem solving is a complex human behavior which
is not well understood. Discovering processes underlying
problem solving has been a long-time concern of scholars;
however, to date there seems to be little agreement as to
the actual nature of these processes (Scandura, 1977).
Research in problem solving stems from several
different historical streams of thought. Forehand (1966)
classifies problem solving research into four approaches:
(1) behaviorism (2) Gestalt-cognitive, (3) information-
processing and (4) psychometric. The behaviorists have

17
helped clarify problem solving activities through the
examination of factors such as trial-and-error learning
and prior learning. Gestalt-cognitive psychologists have
researched the notions of restructuring problem elements
and the utility of transferring known principles in
finding problem solutions. Analysis of strategies in
problem solving via the computer has been the primary
interest of information-processing researchers. However,
from the psychometric research, no evidence has emerged
that problem solving is unidimensional (Davis, 1973;
Hill, 1977; Newell & Simon, 1972; Scandura, 1977;
Merrifield, Guilford, Christensen, & Frick, I960).
Research concerning problem solving from the
different areas has contributed specific pieces of
information about problem solving, but the complete
picture has not yet been established. Information gleaned
from the existing research seems to indicate that
individual problem solving is a combination of cognitive
ability and learned behavior. If so, then perhaps problem
solving can be enhanced to some degree by teaching
problem solving strategies.
Seymour Papert, a computer scientist, expert in
child development, and developer of Logo believes that
children's ability to solve problems can be enhanced by
learning to program a computer. Specifically, he
18
recommends learning to program with the language, Logo.
Both notions of cognitive ability and learned behavior
are woven into his hypothesis. His assumption, that
computer programming can assist in the development of
problem solving, is based on Piaget's theory of cognitive
development and the heuristics of problem solving
suggested by Polya (Papert, 1980).
Piaget's Theory of Cognitive Development
Piaget's theory of cognitive development offers a
theoretical foundation from which to investigate problem
solving in relation to cognitive development. This theory
centers around how an individual constructs knowledge
from infancy to adolescence. According to Piaget (1952)
individuals have schemes within which they assimilate
events so that they become meaningful. Accommodation
occurs so that new events or new information can fit into
one's existing framework. As knowledge develops, schemes
develop. In addition to schemes, Piaget theorized that
children go through four stages of development:
sensorimotor, preoperations, concrete operations, and
formal operations. Although the rate of passage through
these stages for individual children may be different,
the sequence is consistent (Inhelder & Piaget, 1957).
According to Piaget (1952) problem solving skills
begin to develop during the latter part of the concrete

19
operational stage. At this level children systemize class
inclusions, form consistent two-way classifications,
organize series of class inclusions, and organize
transitivity rules. For instance, if children know that A
is longer than B and B is longer than C, then they can
deduce the A-C relationship. However, it is not until
formal operations that an individual generalizes to
similar situations and hypothesizes. Individuals can also
examine relationships through a pattern of deductive
inference (Cowan, 1978, pp. 240-261).
Although Piaget has identified four stages of
cognitive development, it should not be assumed that
every individual reaches the formal operations stage.
Several studies have indicated that formal operations
does not come automatically when individuals reach
adolescence or even adulthood or that it is universal
(Elkind, 1961; Nadel & Schoeppe, 1973; Tomlinson-Keasey,
1972) .
If not every individual reaches the formal
operations level, not every individual will be able to
problem solve which demands generalization, hypothesis
generation, and inference of relationships. From a
cognitive developmental viewpoint, the question of
whether problem solving skills can be enhanced might be
rephrased as whether individuals can reach the formal

20
operational level through educational assistance.
In summary, Piaget's theory is based on the develop
ment of knowledge which he describes as a coordination of
action. Each individual goes through stages of develop
ment: sensorimotor, preoperations, concrete operations,
and formal operations. At the development of operations,
individuals begin taking on logical characteristics
(Furth, 1984) .
Stages and Skills of Problem Solving
Although there is little agreement about processes
underlying problem solving, stages of problem solving
have been identified. Polya (1957) developed a problem
solving model which includes four stages: (1) understand
the problem, (2) make a plan, (3) carry out the plan, and
(4) look back.
Polya (1957) suggests that the teacher can help a
student solve a problem by guiding the student to ask
pertinent questions. In the first stage, understand the
problem, he suggests that the student should decide what
is required to solve the problem. He states that one
should not try to answer a question if it is not
understood. The teacher can facilitate understanding by
encouraging the student to ask questions such as: what
are the principle parts of the problem, what is the
unknown, what data are given, what is the condition?

21
The second stage, "make a plan," is preparing an
outline of calculations, computations or constructions
that must be performed in order to find the unknown.
Often the knowledge needed can come from a similar
problem that has been solved previously. The path from
understanding the problem to developing a plan can be
very arduous. Again, Polya suggests that the teacher
should guide students to answer questions such as: Do you
know a related problem? If you find a familiar problem
with the same or a similar unknown, can you use the
solution?
"Carrying out the plan" is accomplished by executing
each step in the plan and checking each step for
correctness. He points out that if students do not work
out the plan for themselves, there is a danger they will
forget it. Individuals must be aware that errors are
always possible; therefore, verifications are needed. The
final step, "looking back," is reconsidering and
reexamining the completed solution.
Problem Solving Related to LD Students
Problem solving can be difficult for LD students
because several variables may interact. One variable that
should be considered is poor planning of curriculum.
According to Piagetian theory children go through the
various stages sequentially but not necessarily at the

22
same chronological age. Developmental readiness is
sometimes overlooked which is indicated by a curriculum
that assumes children are at the same developmental
level. Cowan (1978) hypothesizes that an increase in
referrals for learning disorders may come at
approximately fourth grade level. He feels this is a
critical time because many teachers assume that children
at this age are functioning in the latter part of the
concrete stage. In other words, they assume children are
able to understand more than one characteristic at a
time, that they have broad spatial and social pers
pectives, and that their value hierarchies are stable.
Therefore, if the curriculum is based on late concrete
operational structures, children who develop more slowly
may be mismatched to the wrong curriculum. It is pos
sible, therefore, for children to be out of synchroni
zation during a period of cognitive developmental
transition (p. 247). As a result skills may not be
learned or skills may be splintered.
Lack of self-confidence, which can result in lack of
effort, is a second variable which may come into play.
Often LD students who have experienced continuous failure
may become disorganized, anxious and insecure when trying
to solve problems and they may fail to solve the problem
or simply give up (Alley & Deshler, 1979).

23
Another area which has been related to poor problem
solving is noncomprehension of the problem situation. A
study by Havertape and Kass (1978) indicated that LD
students tend to read a problem in rote fashion several
times, if they read the problem at all. As a result, they
do not actually understand what to do.
Research concerning learning disabled students'
ability to problem solve is sparse. There are
indications, however, that LD students may have
difficulties in problem solving due to nonsynchronization
of developmental readiness and school curriculum, lack of
self-confidence, and difficulty in comprehending what the
problem requires (Cowan, 1978; Alley & Deshler, 1979;
Havertape & Kass, 1978). Consequently, LD students may
not be able to successfully progress through the stages
of problem solving.
Determining the exact cause of impaired problem
solving may be impossible. However, skills can be taught
to improve problem solving. Alley and Deshler (1979)
recommend teaching specific skills which are similar to
Polya's ideas. First, teach students to ask good
questions. Next, teach them to look for errors. Finally,
teach them to use errors as feedback to find correct
solutions.

24
Summary
From research and studies of problem solving it may
be concluded that there are cognitive processes which
underlie problem solving. Although there is little
agreement about the exact nature of the processes, it is
generally acknowledged that there are sequential stages
of cognitive development and problem solving begins
developing during the concrete stage.
When correct problem solving occurs, it is hypothe
sized that an individual has passed through certain sta
ges . However, not all individuals are efficient problem
solvers, nor do all individuals completely and correctly
solve problems. In order to complete the problem solving
process certain skills are required. Several reasons for
difficulty with problem solving by LD students have been
discussed in the literature: (I) skills may be splintered
due to an inappropriate curriculum, (2) continuous fail
ure may cause students to lose confidence, and (3) stu
dents may not comprehend the problem situation. Several
authors contend that problem solving strategies can be
taught (Alley & Deshler, 1979; Fraenkel, 1973; Polya,
1957). If so, then, perhaps students who are learning
disabled can develop or improve problem solving
strategies.

25
Locus of Control
Another factor related to poor academic achievement
of learning disabled students is locus of control. Locus
of control, a bipolar personality variable, refers to
individually perceived sources of control over certain
behaviors or events (Lefcourt, 1976). Rotter (1966)
describes locus of control as a perception of causal
relationship which varies in degree. External control is
the label given when reinforcement following an action is
perceived as the result of luck, chance, fate, under the
control of powerful others, or unpredictable. The term
internal control is used if a person believes the event
is contingent upon his/her own behavior or relatively
permanent characteristics.
There is evidence to indicate that students'
perception of control over success and failure is related
to school achievement (Crandall, Katkovsky, and Crandall,
1965; Crandall, Katkovsky, & Preston, 1962). Specifi
cally, internal locus of control has been shown to be
more characteristic of successful students (McGhee, 1968;
Shaw & Uhl, 1971). Successful students see success as a
result of internal factors such as effort and ability,
while less successful students attribute success to
external factors such as luck, powerful others, or other
conditions beyond their control (McGhee & Crandall, 1968;
Messer, 1972; Kifer, 1975).
26
Less successful students tend to be external
concerning success. Learning disabled children, in
particular, have been found to attribute their successes,
but not their failures, to external factors. In a review
of locus of control studies of learning disabled
students, Dudley-Marling, Snider, and Tarver (1982)
reported that three studies suggested that learning
disabled students accept responsibility for their failure
but not for success. The most consistent finding was
groups who fail tend to have external locus of control.
The studies concerning learning disabled students'
locus of control reveal that not only perceptions, but
qlso expectations are related to academic achievement.
The perceptions that LD students have about why they
succeed or fail affect their expectations regarding
outcomes. In a study by Boersma and Chapman (1978) it was
found that LD children had lower expectations for future
academic successes. Based on the results of another
study. Chapman and Boersma (1979a) suggested that
negative self-perceptions of ability may be associated
with the development of external perceptions of control.
These authors pointed out that LD children might view
success as being contingent upon the assistance of the
teacher, the ease of the task, or luck.
The locus of control research suggests failure-prone
students do not see much relationship between effort in

27
learning and outcomes; therefore, motivation for
subsequent tasks may decrease because they perceive they
do not have the ability. Chapman & Boersma (1979b)
investigated perceived control in achievement situations.
The result of their study indicated that LD students were
similar to normal students in perceptions of control over
failure, but they demonstrated an inability to assume
responsibility for success. These researchers suggest LD
students may develop generalized negative attitudes about
their academic abilities.
LD children exhibiting external locus of control may
attribute success to external uncontrollable causes such
as luck, task difficulty, or powerful others; while
failure may be internally perceived as lack of ability.
The implication of this research is that LD students
may react to occasional failure with an impaired
performance even in areas in which they do not have a
specific disability. This is underscored by their belief
that success is due to external factors such as ease of
task. With such perceptions LD students may become
pessimistic about the effect effort has on the outcome of
a task. As a result of negative expectations, these
students may not fully demonstrate their abilities, which
in turn may result in poor academic achievement (Pearl et
al., 1980).

28
Often students with external attributions show
deterioration of performance following failure, a
decrease in rate of problem solving, an increase in
errors, and withdrawal behaviors (Dweck, 1975). In a
study by Diener and Dweck (1978) failure-oriented
students focused on cause of failure, while mastery-
oriented students exhibited more self-instruction,
greater self-monitoring, and maintained a better attitude
toward present and future tasks. The observed positive
correlation between internality and academic achievement
has led to the belief that internal locus of control can
be advantageous for successful academic performance.
Marling, Snider, and Tarver (1982) state that this belief
has led to the assumption that if children could be
taught internality, it would be easier for them to
achieve success. However, they suggest that a reverse
relationship may exist: academic failure may affect
external locus of control. A study by Cunningham, Gerard,
and Miller (1978) indicated that increasing externality
is a result of, rather than a cause of long-term failure.
This is a significant point if internality increases
developmentally as suggested by Lefcourt (1972) and
Kifer (1975).
Changing learning disabled students' locus of
control may be extremely difficult. However, studying the

29
correlates that accompany locus of control and using
these as a focal point for remediation may be more
fruitful. If students believe they control their failures
but not successes, they may believe they have no power
over their environment. This then may interfere with
their employing effective learning strategies. Dudley-
Marling, Snider, and Tarver (1982) suggest that remedi
ation for learning disabled children should focus on
social-emotional correlates of failure by enabling LD
students to be successful and helping them learn that
effort is related to success.
In conclusion, the studies investigating locus of
control have indicated that children who have had
difficulty in learning may underestimate their abilities,
attribute academic outcomes to reasons that are not
necessarily accurate, and subsequently expect to do
poorly in future situations. According to Henker, Whalen,
and Hinshaw (1980) if motivational and affective
components of learning are lacking or misdirected, the
learning disabled child may not plan work according to
the actual difficulty of the task. As a result the child
may not select appropriate strategies, may not monitor
and evaluate results, or may not change routines when
necessary. This can affect the child's academic
performance.

30
Math Achievement and Math Attitude
Math Achievement
As mentioned previously, math is a subject in which
some learning disabled students experience academic
failure. Koppitz (1971) found that a high percentage of
children who were referred to LD classrooms were
approximately one to three years below the expected grade
level in computation. Kane (1979) found that arithmetic
was one area in which LD adolescents demonstrated greater
retardation than did their non-LD peers.
Several authors have outlined specific learning
disabilities which can be related to problems in
mathematics (Bartel, 1982; Cruickshank, 1948; Johnson &
Myklebust, 1967). Among these are difficulty in abstract
thinking, problem solving difficulties, failure to
discover generalizations, poor attitude or anxiety,
pre-arithmetic readiness, and ineffective teaching. In
addition, learning disabled students often have poor
organizational skills and may have difficulty
understanding what a tasks requires. Reisman (1983)
suggests that appropriate teaching techniques such as
concrete manipulatory experiences are often not utilized
and gaps in mathematical foundations may occur. This
difficulty can be further compounded by previous failure

31
which may cause them to tense up and not give the task
their full attention (Houck, Todd, Barnes, & Englehard,
1980) .
Math Attitude
Reasons for failure to achieve in mathematics can be
numerous. Achievement is often represented by good grades
or the ability to meet the curriculum standard.
Therefore, failure can be due to an inability to perform
a set of tasks or an unwillingness to perform tasks
(Cawley, Fiztmaurice, Shaw, Kahn, & Bates, 1979).
Inability and unwillingness to perform mathematics tasks
which result in failures may be connected with students'
attitude toward the task.
Reyes (1980) defines math attitude as "feelings
about mathematics and feelings about oneself as a learner
of mathematics which includes feelings such as confidence
and anxiety" (p. 164). Confidence in mathematics
encompasses how sure a person is of being able to learn
new mathematics, perform well in mathematics class or
perform on mathematics tests (Reyes, 1980, p. 164).
Several studies have suggested that confidence in
mathematics is related to mathematics achievement
(Sherman & Fennema, 1977; Dowling, 1978).
Mathematics anxiety has been described as, "feelings
of tension and anxiety that interfere with the

32
manipulation of numbers and the solving of mathematical
problems in a wide variety of ordinary life and/or
learning situations." It can be a variable in preventing
students from performing well, succeeding in basic math
courses, or taking advanced mathematics courses (Reyes,
1980, p.169). Although there is not a clear cause-effect
relationship, several investigations have reported that
there is a negative relationship between math anxiety and
math achievement (Aiken, 1970a, 1970b, 1976; Betz, 1978;
Callahan & Glennon, 1975; Crosswhite, 1972; Sarason,
Davidson, Lighthall, Waite, & Ruebush, 1960; Szetela,
1973).
Research indicates that scores on math attitude
scales are significantly related to math achievement by
both elementary and secondary students (Crosswhite, 1972;
Evans, 1972; Spickerman, 1970). Not only do attitudes
affect achievement, but achievement also affects atti
tudes (Neale, 1969). From research findings it seems that
there is a relationship between math achievement, math
anxiety, and math avoidance. (Reisman, 1983).
Students who have a positive attitude toward math
are often self-confident, persevering, and like detailed
work (Aiken, 1972). A study by Chapman and Boersma
(1979a) indicated that LD students do not possess these

33
attributes. Specifically, it was found that the LD
subjects had a more negative perception of their ability
in arithmetic than did the normal students.
Mathematics is an academic area in which LD students
may experience failure. Since math attitude has been
related to math achievement, it is logical that students
with positive attitudes toward math tend to succeed more
in mathematics. It has been found that LD students have
negative perceptions about their ability in math;
therefore, they may perform poorly in math not only
because they may have a specific disability, but a poor
attitude toward math may also be a contributing factor.
Computers in Education
Introduction
Some futurists believe that the full impact of
computers is yet to come. These individuals prophesy
computers will change our civilization: lifestyle, family
structure, and work habits. With the advent of the
microcomputer many predictions for education were made.
The microcomupter was perceived as an effective tool for
teaching children to think and learn in new ways. Even
more optimistically, the computer was envisioned as the
mechanism whereby the entire educational delivery system
could be altered by finding the correct match of
students' current knowledge and needed instruction, which

34
then could be retrieved from the computer (Coburn et al.,
1982, pp. 2-3; D'Angelo, 1983).
Unfortunately, these predictions for educational
computing have not yet become a reality. The reality is
that educational computing primarily consists of
computer-assisted instruction while other uses such as
programming, simulations, word processing, and management
are secondary. The term computer-based instruction (CBI)
was used initially to cover the limited, early educa
tional uses. Generally, CBI was divided into two categor
ies: computer-assisted instruction (CAI) and computer-
managed instruction (CMI). CAI programs present instruc
tional material directly to students, while CMI programs
are instructional management systems. CAI is often
divided into specific categories of drill and practice,
tutorial, and instructional games. Drill and practice
operates as its name suggests; it drills students on
previously learned material. A tutorial program, on the
other hand, presents material which is new to the
student. The third type, instructional games, is intended
to convey subject content or promote problem solving
skills while maintaining interest and motivation (Budoff
& Hutten, 1982; Olds, 1981).
As computer use has become more extensive in
education, suggestions for other categorizations of

35
applications have been made. For example, Maddux (1984)
has suggested that educational computing should be
categorized into Type One and Type Two uses. Type One are
those uses which are traditional educational activities,
but the computer does them perhaps in a more efficient
manner. Included in the Type One category are drill and
practice, assessment, and administrative tasks. Type Two
use includes more creative activities such as
programming, simulations, and word processing.
In general, computer use in education has not gone
much beyond making standard educational practices faster
and perhaps a little more efficient. Papert (1980)
believes this has happened because there is a
conservative bias built into educational computing.
Historically, the initial use of a new invention is to
use it to do what has always been done, but a little
differently. For example, automobiles were referred to as
"horseless carriages" for many years. Similarly, using
computers for drill and practice is appealing because it
is not a radical change from traditional teaching
methods. However, Papert suggests that computers can have
a profound affect on education by promoting different
cultural and philosophical perspectives. He believes that
the computer application which will change thinking and
learning is computer programming (pp.32-37).

36
The purpose of this section is to review the current
uses and the effectiveness of computers in education in
general and with exceptional children. There are
implications that most computer use in education can be
classified as Type One, traditional, and that the effects
of this type may not warrant the use of expensive
computers to do only Type One functions.
Summary of Research
The research concerning the effectiveness of
computers in education is somewhat scarce, and that which
is available presents findings that are not easy to
interpret. The complexity of the computer research is a
result of less than adequate research designs, vested
interests, and uncontrollable variables (Bracey, 1982).
In an attempt to analyze studies concerning educational
computer use, Kulik (1983) conducted a meta-analysis of
51 objective studies. Meta-analysis is the use of
objective procedures to locate studies, describe study
features and outcomes along with statistical methods to
summarize the overall findings and explore relationships
between the study features and outcomes. Drill and
practice, tutorial, computer-managed teaching,
simulation, and programming were areas which were
addressed in the studies. Educational outcomes which were
described were learning, academic attitudes, attitudes
37
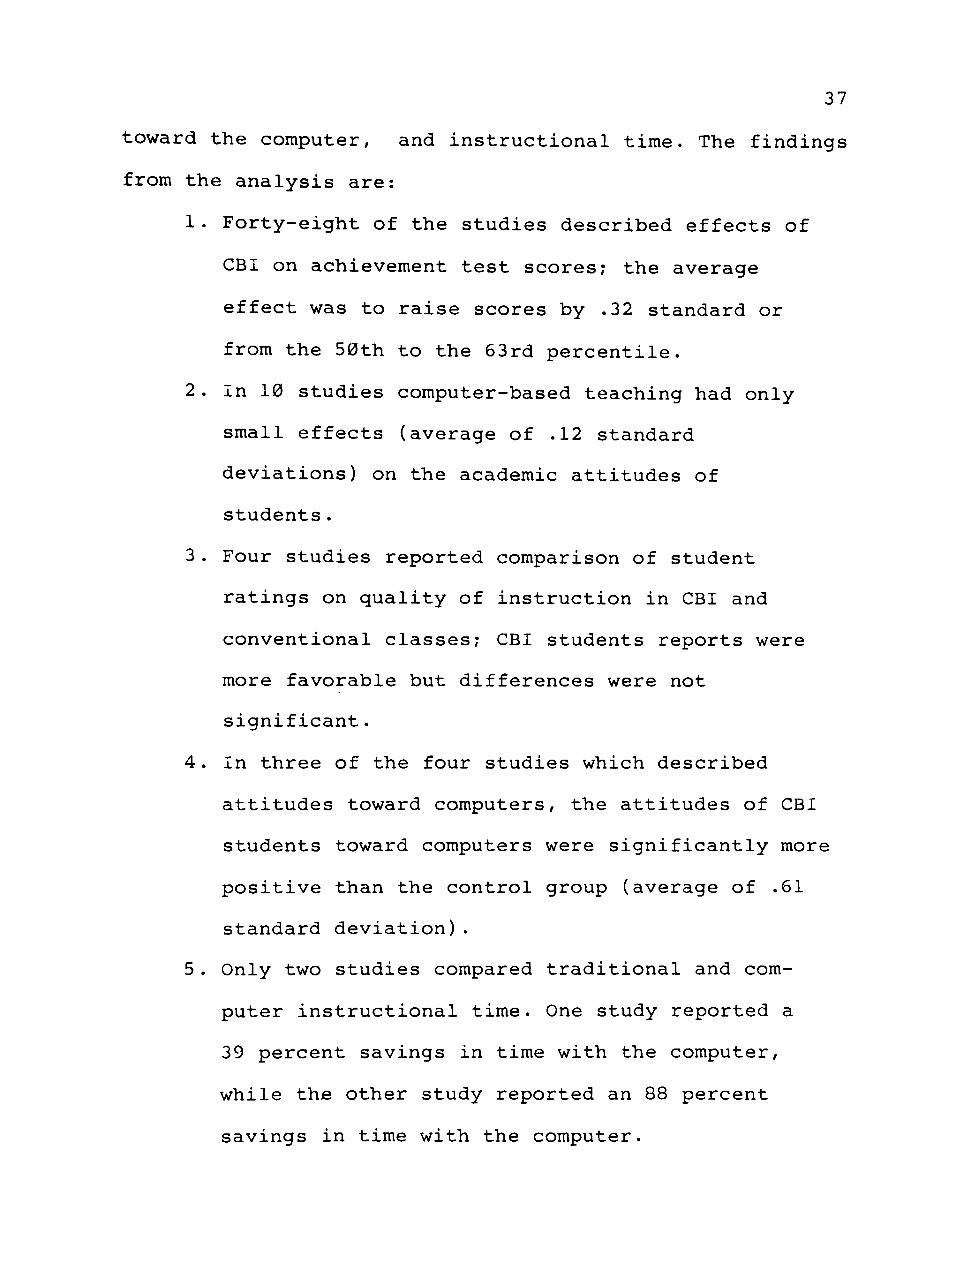
toward the computer, and instructional time. The findings
from the analysis are:
1. Forty-eight of the studies described effects of
CBI on achievement test scores; the average
effect was to raise scores by .32 standard or
from the 50th to the 63rd percentile.
2. In 10 studies computer-based teaching had only
small effects (average of .12 standard
deviations) on the academic attitudes of
students.
3. Four studies reported comparison of student
ratings on quality of instruction in CBI and
conventional classes; CBI students reports were
more favorable but differences were not
significant.
4. In three of the four studies which described
attitudes toward computers, the attitudes of CBI
students toward computers were significantly more
positive than the control group (average of .61
standard deviation).
5. Only two studies compared traditional and com
puter instructional time. One study reported a
39 percent savings in time with the computer,
while the other study reported an 88 percent
savings in time with the computer.

38
The Johns Hopkins University Center for Social
Organization of Schools issued a preliminary report of
the National Survey of School Uses of Microcomputers
(1983). The survey included 2,209 public, private, and
parochial elementary and secondary schools which were
considered representative of all schools in the United
States. The findings include: (1) secondary schools are
the largest pre-college users of microcomputers, (2)
emphasis in secondary schools is on teaching students
about computers and how to program them using the
language BASIC, (3) by January, 1983, 53% of all schools
in the United States had at least one microcomputer for
instructional use, (4) secondary schools are more likely
than elementary schools to own microcomputers, (5)
secondary schools are becoming new users at a faster
rate, (6) elementary schools that do have microcomputers
have smaller numbers with less capacity than secondary
schools, (7) besides computer literacy, programming is
the preferred activity in secondary schools, (8) drill
and practice use is more prevalent in elementary schools,
and (9) schools with more micro experience lean toward
programming uses. Teachers reported that they felt the
greatest impact of microcomputers has been on the social
organization of learning and enthusiasm toward learning.
Another opinion reported was that above-average students

39
learned more than average or below-average students from
having microcomputers in their school.
In conclusion, research seems to indicate some
positive effects. The most positive findings from the
Kulik study was time saved with the computer and
attitudes toward computers. The Johns Hopkins survey
implies that teachers experienced with educational
computing prefer using the computer for computer
programming in BASIC. Studies concerning educational
computing has been sketchy and there still is not a
complete picture, which indicates there is a a need for
more intensive and sophisticated research.
Computers With Exceptional Children
CAI has been the most popular use of computers with
exceptional children; however, there has been little
research concerning its effectiveness. The results of two
studies have been published which gives some empirical
information. In one project (Kleinman, Humphrey, &
Lindsay, 1981) hyperactive students were given the
opportunity to work math problems on paper one day and on
the computer the next. Accuracy, number of problems
attempted, and rate of problem solving were recorded. The
results showed no difference in number correct, average
time to work the problems, or average time between the
problems. There was a difference, however, in the number

40
of problems worked. The students worked about twice as
many problems on the computer, spending an average of 23
minutes for each session. This is an important difference
since hyperactive children have difficulty in attending
to a task.
In another experimental study (Carman & Kosberg,
1982) the effects of CAI on math achievement and atten
tion-to-task behavior was conducted with emotionally
disturbed children. The experimental group showed a
significant increase in math achievement from October to
February but not during the period from April to June.
Because achievement was also absent with the control
group, it was thought perhaps that the time of year may
also have been a variable. Students did attend more to
computer instruction than to the student-group instruc
tion (Carman & Kosberg, 1982). In both of these studies,
a Hawthorne effect may have been a variable.
CAI use with low-level students has been minimal
primarily because handicapped students often have reading
difficulty and many of the CAI programs require a great
deal of reading (Williams, Thorkildsen, & Grossman,
1983). However, there has been progress in this area with
special adaptations such as videodiscs, light interrupt
systems, and speech synthesis. Videodiscs, like video
tapes, provide true-to-life sound, motion, and color.

41
Although videodiscs are more expensive, they allow
quicker access than videotapes. Programs such as these
often also require a light interrupt system inside the
monitor which allows the student to respond simply by
touching the screen. Field tests of the Interactive
Videodisc for Special Education Technology (IVSET)
project revealed that these programs were least effective
with young (4-13 years) moderate to severe mentally
retarded and the most effective with learning disabled
and mild mentally retarded (Allard & Thorkildsen, 1981;
Thorkildsen, Allard, & Reid, 1983; Williams, Thorkildsen,
& Grossman, 1983). Programs which have incorporated
speech synthesis, which is artificial production of
speech by electronic means, have been particularly
beneficial for visually-handicapped, mentally retarded,
and reading disabled students (Geoffrion & Goldenberg,
1981; Ragan, 1982) .
Both problems and benefits of using CAI with the
handicapped have been reported. Problems include: (I)
often programs do not have clear educational objectives,
(2) language and reading levels may not be appropriate,
(3) prerequisite skills may not be documented, and (4)
the response demand (typing a word, phrase, or sentence)
may be inappropriate (Hannaford & Taber, 1982; Kleinman,
Humphrey, & Lindsay, 1981). It also should be noted that

42
the improvement of CAI with periphereals such as
videodiscs and speech synthesizers involves more expense.
On the other hand, positive benefits reported are: (1)
less instructional delivery time, (2) positive student
attitudes, (3) increased motivation, (4) increased
attention span, and (4) increased school attendance
(Schiffman, Tobin, & Buchanan, 1982).
Summary
There is some evidence that computers can have a
positive effect in education. From a national
representative school sample, it appears that programming
may become the most popular use in education. As with
regular students, the efficacy of computer use with
exceptional children has not been researched adequately.
There are reports of both problems and benefits of
computer use with handicapped students. The problems
which have been cited seem more related to CAI, while the
observed benefits could possibly be from computer use in
general.
The computer has also been praised because it can
accept the students' responses, evaluate them and present
appropriate feedback and reinforcement (Hannaford &
Taber, 1982; Schiffman, Tobin, & Buchanan, 1982). This in
itself is a good reason for using computers with
exceptional children. Using the computer for only CAI, a

43
Type One use, may not warrant expensive computer use;
however, there is a computer application which offers
these benefits but without the problems posed by CAI.
This application is computer programming with Logo.
Logo
There are claims concerning the attributes of the
programming language, Logo. According to these claims,
Logo should have a positive effect on factors related to
poor academic performance by LD students for the
following reasons: (1) Logo promotes problem solving by
providing concrete experiences and providing a framework
to develop problem solving skills, (2) it is easy to
learn and not only provides immediate success but also
allows the student to be in control of the environment,
and (3) it is a carrier of mathematical concepts and has
a positive effect on attitudes towards math. Following is
a discussion of Logo and these claims as well as a review
of Logo projects and research.
A Programming Language
At one time learning how to program was a science
primarily for adults; however, teaching programming
languages in both elementary and secondary schools is
becoming common. There are several reasons why it has
worked its way into the school curriculum. First,
programming has become less complicated and second, there
is more computer accessability in the schools.

44
There are more than 150 computer languages. A
computer language is a system of instructions which
control a computer. These instructions are referred to as
a language because there is a syntactical structure
composed of commands and statements similar to words.
True communication with the computer does not exist; the
computer originates nothing and operates only as
commanded. Each existing computer language was designed
for a specific purpose. These languages have a strict
syntax with no irregular verbs and a limited vocabulary.
Within the realm of computer languages there are
machine languages, assembly languages, and high level
languages. Machine language is actually the only language
a computer understands. Machine language consists of
binary bits with each bit represented as a 1 or 0.
Circuits of the computer are switches which are either
set at 1 or 0. The setting of the switches at any given
time gives the computer its command. In addition, each
sequence of eight digits is called a byte.
The next higher order language is assembly
language, which is an improvement over machine language.
In order to use assembly language a special program
called an assembler was written in machine language.
High-level languages were then developed in order to make
programming easier. A high-level language is written with

45
instructions in machine language, assembly language or
both. The high-level languages relieve the programmer
from working with the specific circuits of the computer.
These languages are translated to machine instructions
with a compiler or an interpreter so the computer can
understand the specific commands. A compiler translates
the program at once, while an interpreter translates the
program one instruction at a time.
High-level languages were designed for a special
purpose. The first of these languages FORTRAN (FORmula
TRANslator) was for mathematical and engineering
problems. Others include COBOL (COmmon Business Oriented
Language), and LISP (LISt Processing). LISP was designed
for experiments in artificial intelligence. It is a very
difficult language, but it makes the artificial
intelligence experiments easier. LISP is a processing
language which means it examines relationships of program
elements (Wold, 1983).
BASIC language is considered easy to learn because
it has a vocabulary of 50 words. Learning the vocabulary
is not difficult, but use of the vocabulary to obtain the
desired result is more difficult. Despite the fact that
there are other languages which are easier to learn and
more versatile, BASIC is usually taught in most high
schools. One reason for BASIC'S popularity may be that it

46
is built into many microcomputers. Papert (1980)
advocates computer programming as a medium for learning
and suggests that attention should be paid to the choice
of language for children to learn. He recommends that
teachers should not "ignorantly accept languages offered
by computer manufacturers" (pp. 33-35).
Origin and Purpose of Logo
Logo, one of the newest programming languages, was
originated by Seymour Papert and his collegues in the
late sixties at Bolt, Beranek and Newman, a social
science consulting firm in Cambridge, Massachusetts. In
1970 it was moved to the MIT Artificial Intelligence
laboratory (Carter, 1983). Initially, Logo was imple
mented on a large research computer. However, by the late
1970 ' s when microcomputers became more powerful, a ver
sion of Logo was developed for the Texas Instruments 99/4
microcomputer and subsequently for almost every other
brand of microcomputer with color capability. One of the
unique aspects of Logo's development is that it was not
solely designed by engineers and computer scientists. The
main contributors were a group of people interested in
the process of human learning (Carter, 1983).
Papert worked with Piaget in Geneva and much of the
Logo philosophy has roots in Piagetian thoery. Papert

47
states, "children do their best learning in the culture."
This observation led him to look for something that was
in the culture that could provide a medium for learning.
The integration of computers into the American culture
provided him with the medium and the idea to create Logo
(Kellam-Scott, 1983, p. 81).
With Logo, Papert feels that children can learn
programming, problem-solving and mathematics (Kellara-
Scott, 1983). He believes that the end result will be
that students will learn how to learn through estimation,
interaction, experience, and revison (Viatt, 1979; 1982).
Logo is adaptable to individual styles of learning
and different styles of thinking which Papert (Kellam-
Scott, 1983) notes is a strong reason to teach it. He
states.
Everybody will be able to learn in ways that are relevant and in styles that match their personalities...The children who are most important are those for whom the present school system isn't working. The school classifies them as deficient, where perhaps the school is actually the source of the deficiency, in its failure to teach them in an appropriate style (p. 82).
Logo Philosophy
Papert (1980) states that children learn mathetic
knowledge when they learn Logo. He defines mathetic as
knowledge about learning. He believes when children learn
Logo, they learn about learning. Two mathetic principles

48
which students learn from Logo are: (1) relate what is
new to something known and (2) take what is new and make
it your own. These are similar to Polya's heuristic
procedures. Also, these principles resemble what Piaget
describes as assimilation and accommodation. According to
Piaget assimilation and accommodation are part of
children's spontaneous learning. Children may learn
spontaneously, but Papert believes the materials in one's
environment influence the development of a child's
intellectual abilities.
Papert (1980) further contends that formal operation
develops slowly or perhaps not at all in our culture
because of the lack of opportunities to build intel
lectual structures. For example, one uses combinatorial
thinking when all possible combinations of a set are
considered; however, children are unable to perform such
a task until about the fifth or sixth grade. This may
occur, states Papert, because our culture lacks good
models of systematic procedure. However, he believes that
programming can offer the needed model, and he hypthe-
sizes that children exposed to a computer-rich environ
ment can engage in abstract thinking before adolescence,
which is the earliest time Piaget theorizes it will occur
(pp. 19-37).

49
Another aspect of the Logo philosophy is what
Papert terms as mathophobia. In essence, mathophobia is
the fear of math and the fear of learning in general.
Mathophobia can be overcome by allowing children to feel
free to experiment with their ideas without fear of being
wrong. According to Papert, (1980) this is accomplished
when children learn the concept of debugging, which means
finding errors in a program. For example, students may
assume a wrong math answer means that he or she does not
know how to solve the problem rather than consider that a
wrong procedure was used and it can be corrected. With
debugging knowledge students may approach learning
without the attitude of "it's right" or "it's wrong"
(Papert, 1980, pp. 135-155).
Turtle Geometry
Although Logo has many programming capabilities,
individuals usually first learn to program in Logo by
learning Turtle Geometry because of the ease of learning
it and the immediate graphic feedback it gives. Learners
are introduced to an imaginary turtle, which, is in most
versions of Logo, a triangular shape that appears on the
screen of the computer terminal (Papert, 1980). The
commands given to the turtle are called Turtle Talk. The
turtle is controlled by typing in predefined commands

50
known as primitives. These primitive commands include
FORWARD, BACK, RIGHT, LEFT. The abbreviations for these
commands are FD, BK, RT, and LT, respectively. FORWARD
causes the turtle to move in a straight line in the
direction of its heading, while BACK moves the turtle in
the opposite direction from its heading. RIGHT and LEFT
change the heading without changing position (Papert,
1980, p.56). By using these commands an individual can
learn to draw geometric pictures. For example, the turtle
is controlled by typing in commands such as FORWARD 100,
BACK 50, RIGHT 45, LEFT 90. FORWARD 100 moves the turtle
forward 100 "turtle steps," and LEFT 90 causes the turtle
to rotate to the left 90 degrees (Watt, 1979). The turtle
leaves tracings on the screen as it moves around
(Billstein, 1982).
Drawing pictures with the turtle is an initial
programming activity which can be done in the "immediate
mode." In other words, commands are carried out as soon
as they are typed. Another programming method is with the
"program mode." The commands are entered, and then can be
later carried out all at once (Maddux & Johnson, 1983).
Learning Turtle Geometry may help children learn
strategies for problem solving. As previously mentioned,
Polya (1957) suggested that strategies for solving
problems could be learned. He believed that problem

51
solving could be made easier if an individual would go
through a mental checklist and ask questions such as: (1)
Can this problem be subdivided into simpler problems, and
(2) Can it be related to a problem I already know how to
solve. With Turtle Geometry children learn to break a
programming task into parts, experiment with solutions,
use previous work to find solutions and edit and revise
(Papert, 1980, pp. 64-68).
Another benefit which Papert (1980) espouses is that
Turtle Talk can serve as a first representative for
learning formal mathematics. Children do not learn formal
rules but develop insight into movement in space. The
turtle is a fundamental entity analagous to the Euclidean
point in space, but has position and direction as a
person does (p. 55). When the turtle is at "home" it
faces straight up and its heading is 0. The heading of
90 is directly east, 180 is directly south, and 270 is
directly west. It is easy for children to think of the
screen's dimensions in terms of turtle steps. They can
decide how many turtle steps it will take to change
position (Billstein, 1982). Moving the triangular turtle
may help children conceptualize the movements that are
needed to complete a task. As a result of learning to
control the turtle the child learns to control the
computer (Papert, 1980).

52
During the next stage children learn that the
computer will respond to commands referred to as
procedures. Defining procedures is similar to the user
teaching the turtle a new command. For example, to teach
the turtle how to draw a square "TO SQUARE" is typed. The
word "TO" is a signal to the computer to go to the
program mode. The word after "TO" represents the name of
the procedure. When this is entered, the program mode is
in operation. After typing the commands which will make a
square, the user can use the new command, "SQUARE" when
he or she is in the immediate mode. Likewise, a procedure
to draw a triangle or any other shape can be defined.
By using procedures children can create their own
private language. Then procedures can become subpro-
cedures to create new designs in an efficient manner. For
example, after procedures for SQUARE and TRIANGLE have
been defined, they both can be used to create a house.
When doing Turtle Geometry Logo users receive
immediate graphic feedback on the screen. For example, by
watching the turtle move students can determine if a 50
degree turn is enough to get the desired effect. If the
commands do not produce what is expected, then the
student knows immediately which command was incorrect.
Correction or "debugging" can be done as soon as the
53
mistake is made (Carter, 1983). In a math class a child
may be criticized for errors and as a result may want to
forget a wrong answer as soon as possible. With Logo,
however, children are encouraged to study their errors so
they can learn to debug their program. They should then
begin to understand that what they program is not
necessarily completely right or completely wrong (Papert,
1980 p. 61).
Papert (1980) asserts that Turtle Geometry helps
children learn mathematical theory. It provides a
conceptual framework for coordinates, systems, positive
and negative numbers, use of variables, angles (30, 60,
90, 180, 360), and the understanding of procedural
hierarchy (Watt, 1979). Papert (1980) contends that
Turtle Geometry teaches:
1. Mathematics—Turtle geometry is an easily
learnable geometry and an effective carrier of
general mathematical ideas.
2. Mathetics—It gives a knowledge about learning
and makes sense of what one wants to learn.
3. Syntonics—Turtle Geometry is related to a
child's sense and knowledge about his or her own
body.
Papert believes Turtle Geometry is learnable because it
is syntonic and can aid in learning other things because
54
of its deliberate use of problem-solving and mathetic
strategies (pp.63-64).
Studies and Projects
Increasing problem-solving ability and enhancing
thought processes are among the claims made about Logo.
However, there is a lack of research to support these
claims. Gorman (1982) cites several reasons for such
limited empirical evidence:
1. Pioneers in Logo claim such dramatic changes in
students in case study work that they regard
formal testing as unnecessary.
2. Until recently Logo was only available on
expensive minicomputers which inhibited research
except with one or two children.
3. One study which was conducted used only
non-equivalent controls. Researchers reported
gains in angle estimation, line magnitude
estimation, and mirror-drawing. Problem solving
was not specifically tested.
4. The problem in measuring changes in thinking
represents an obstacle to documenting changes
produced by learning programming.
There have been attempts to empirically substantiate
the effects of Logo. One of the earliest studies reported
that fourth graders were able to understand recursion
')
55
after Logo, but no other gains were found. Measures of
success-failure on tasks were used, but it was thought
that this type of measure may not have been sensitive
enough to measure thinking processes (Statz, 1973).
There have been several Logo projects conducted in
association with Artificial Intelligence. The Brookline
Project was funded by the National Science Foundation and
conducted' by the MIT Logo Group in collaboration with
Brookline, Massachusetts Public Schools. Fifty
sixth-graders were involved in the project; however, only
the work of 16 students were monitored, documented, and
analyzed. The results indicated that Logo is suitable for
various kinds of students: academically gifted, those
with poor academic records, and learning disabled.
Limited objective data were obtained since the decision
was made not to use standardized tests because results on
standardized tests were thought to be irrelevant to the
goals of the project. Moreover, problem-solving tests and
math tests devised by the project had inconclusive
results. Again, testing problem-solving or procedural
thinking seems to be difficult (Watt, 1982).
A second Brookline Project was funded for the
purpose of developing materials for an introductory Logo
curriculum for grades 4-6 and advanced projects based on
"dynaturtle" games. The project reported that students

56
emerged as Logo teachers and spent time after school once
a week to work on projects and share ideas (Watt, 1982).
The Edinburgh Logo Project was conducted by the
University of Edinburgh, Edinburgh, Scotland, Department
of Artificial Intelligence. This two-year project
involved students at a private boys' .school and
designated the academically-lowest math class as the
experimental group, and the second lowest math class as
the control group. Results revealed the experimental
group improved slightly more than the control group on
measure of math attitudes; however, the reverse was true
on a math attainment test. The teachers reported the
students in the Logo group could talk sensibly about math
issues and explain their math difficulties clearly (Watt,
1982) .
Another project. Computers in the Schools, New York
City, did not produce empirical results; however,
teachers expressed that there were educational benefits
such as positive interaction among students and
self-sufficiency (Watt, 1982). Similarly, teachers at the
Lamplighter School Logo Project in Dallas report that
students experience a sense of accomplishment (Lamp
lighter teachers, 1981; Watt, 1982). An independent study
conducted at Lamplighter indicated that students with
more computer time did better on rule learning

57
(Gorman, 1982).
Over a period of two years, 1981-1983, several
studies were conducted at the Center for Children and
Technology, Bank Street College, New York (Hawkins et
al., 1982; Kurland & Pea, 1983; Pea, 1983; Pea & Kurland,
1983). Variables which were investigated include social
effects, learning recursion, knowledge of programming,
and planning skills. These studies revealed the
following:
1. Students were more likely to collaborate with each
other on computer tasks compared to other classroom
tasks .
2. Students perceived peers as resources for help
more consistently with computer-related tasks.
3. Students did not correctly understand recursion.
4. Only modest gains in programming were seen.
5. Learning to program in Logo did not generalize to
planning classroom chores.
From the findings of these studies. Pea (1983)
suggested the teaching of Logo should be more
structured, rather than expecting students to
discover and generalize skills on their own.
Logo With Exceptional Children
Logo has been used with all types of students with
differing abilities, and there are reports of positive

58
remedial effects for reading disabled, physically
handicapped, and autistic students. Logo was reported as
being successful for one child with low motivation diag-
agnosed as dyslexic because: (1) he was in control of the
learning environment, (2) he chose his own tasks, (3)
there was a match between his spatial strength and the
spatial nature of the Logo activities (Weir, 1981).
Another report stated that children with reading disa
bilities have been able to create their own reading
material by programming the computer to generate silly
sentences and randomly selecting words from lists of
nouns, verbs, and modifiers. After the words were
combined grammatically, the students could read through
their own sentences (Geoffrion & Goldenberg, 1981).
Not only mildly handicapped students, but also more
severely handicapped have been exposed to Logo. In one
case study with an autistic child it was reported that
the child demonstrated understanding of turtle commands.
This child worked on the computer for seven sessions
during a period of six weeks. A floor model mechanical
turtle and button-box were used. The button-box allowed
the user to only push one button in order to input the
Logo primitive commands. The interaction with the
computer resulted in the child verbalizing actions of the
turtle and vocalizing his thoughts during "play turtle."
The child had not previously displayed these types of

59
behaviors (Weir, 1981).
Logo has been used with children from preschool
through college levels. It has been used in various kinds
of academic settings, including those for students with
handicaps. Thus far, reports using Logo with a wide
variety of students have been positive, but there has
been a lack of controlled studies.
Summary
Logo is a programming language developed primarily
for children and is based extensively on Piagetian
theory. It was the purpose of the designers to create a
learning environment in which children could think about
thinking. One of the most important claims for Logo is
its capacity to increase problem solving ability and
enhance the thinking processes. Other claims are that it
puts children in control of their environment, develops
mathematical concepts and positively affects attitudes
toward math. Positive reports concerning the
effectiveness of Logo have been given, but there has been
little empirical research conducted to substantiate the
Logo claims. There are numerous reasons for the lack of
evidence, especially in the area of problem solving.
Therefore, it is important for more empirical research to
be conducted so that educators can have more insight and
knowledge about Logo.

60
Summary of Review and Hypotheses
The review of the literature suggests that children
who are identified as learning disabled may be a
heterogenous group. However, from the definitions which
have been introduced for learning disabilities and the
procedures which are used to identify LD children, it may
be assumed that academic failure is an experience they
have in common. The literature also indicates that
certain factors have been revealed to play a role in the
failure of these children. These factors include poor
problem-solving ability, external locus of control, and
negative attitudes. Currently, computers are being
implemented into the educational process of both
elementary and secondary students including the education
of exceptional children. Although more research is needed
concerning the effectiveness of computers in education,
thus far there are some positive results. Logo, a
computer programming language, has been credited with
enhancing problem-solving skills, creating a learning
environment which students can control, and positively
affecting attitudes toward learning.
Stemming from this review of the literature there
seems to be several questions which should be
investigated in relationship to LD students:
1. What is the effect of Logo on problem-solving
ability?

61
2. What is the effect of Logo on locus of control?
3. What is the effect of Logo on math attitudes?
4. What is the effect of Logo on mathematical
concepts?
In an effort to answer these questions the following
hypotheses were investigated:
Hypothesis 1. Learning disabled students who receive
Logo instruction will demonstrate greater gains in
problem solving ability as measured by the Group
Assessment of Logical Thinking than will learning
disabled students who receive only math instruction
without Logo.
Hypothesis 2. The locus of control of learning
disabled students who receive Logo instruction will
become more internal as measured by the Intellectual
Achievement Responsibility Questionnaire than will
learning disabled students who receive only math
instruction without Logo.
Hypothesis 3. Learning disabled students who receive
Logo instruction will demonstrate more positive change in
attitudes towards mathematics as measured by the
Fennema-Sherman Mathematics Attitudes Scales than will
learning disabled students who receive only math
instruction without Logo.
Hypothesis 4. Learning disabled students who receive
Logo instruction will demonstrate greater gains in

62
recognition of geometric angles as measured by a
geometric angles recognition test than will learning
disabled students who receive only math instruction
without Logo.

CHAPTER III
METHODOLOGY
The review of the literature pertaining to the
academic failure of learning disabled students, variables
which have been associated to failure, and Logo suggest
several questions which should be investigated. Based on
these questions the purpose of this investigation was to
test the hypotheses which were posed in the previous
chapter. This chapter will discuss the methods used in
testing those hypotheses.
Subjects
The main effort of this experiment was directed
toward determining the effect of instruction and prac
ticing Logo on students identified as learning disabled
at a junior high school in an urban West Texas school
district. The population of the school is 564 which in
cludes 333 Black, 213 Hispanic, and 18 Anglo students.
However, the ethnic makeup of the school is not repre
sentative of the district. Also, this school only serves
seventh and eighth grade students and is the only junior
high that has this particular grade combination. Although
the school has an atypical grade combination and ethnic
makeup, the site was chosen primarily because the school
63

64
was equipped with a computer lab consisting of 15 TI
99/4A microcomputers capable of running Logo.
The research involved four groups: two experimental
groups^ and two control groups. Both the experimental
groups and the control groups included one intact group
of mixed seventh and eighth grade LD math students and
one intact group of regular eighth grade math students.
Although the hypotheses of the study involved LD stu
dents, regular education students were included so that a
comparison of effects could be made between the LD and
non-LD students. Intact groups were used since random
assignment of subjects were not permitted by the school
district. The total number for the study was 74: (1)
experimental LD group, N=16; (2) experimental non-LD
group, N=21; (3) control LD group, N=20; and (4) control
non-LD group, N=17.
Instruments
Four sets of pre- and posttest data were collected
during the study: (1) scores on a measure of problem
solving skills, (2) scores on a measure of locus of
control, (3) scores on a measure of math attitudes and
(4) scores on a measure of geometric angle recognition.
The instruments which were used were The Group Assessment
of Logical Thinking (GALT) (Roadrangka, Yeany, & Padilla,
1982), the Intellectual Achievement Responsibility

65
Questionnaire (Crandall, Katkovsky, & Crandall, 1965),
the Fennema-Sherman Math Attitudes Scale (Fennema &
Sherman, 1976), and a researcher-designed geometric
angles recognition test which will hereafter be referred
to as the Horner Angle Recognition Test (HART).
The Group Assessment of Logical Thinking
The GALT was used as a measure of problem solving
skills. It is a paper-and-pencil test designed to assess
developmental reasoning capabilities. It includes a
measure of six characteristics: conservation, propor
tional reasoning, controlling variables, combinatorial
reasoning, probabilistic reasoning, and correlational
reasoning. Normative data have been obtained for grades
six through 12 and undergraduate and graduate level
college students. The test developers report total test
reliability (coefficient alpha) as .85. The validity of
the GALT is supported by a .80 correlation coefficient
between the the use of the GALT and the Piagetian
interview Tasks which were selected from those described
by Inhelder and Piaget (1957, 1975) and had been used by
other investigators (Lawson, 1978; Tobin & Capie, 1980).
Based on a factor analysis of subtest item scores, factor
loadings included three loadings at .70 or more, two at
.50 or more, and the lowest at .44 (Roadrangka, Yeany, &
Padilla, 1983).

66
lARQ
The lARQ is a measure of locus of control which has
reliability and validity data for grades six through
twelve. The lARQ consists of 34 dichotomized
forced-choice items which determine the degree to which
children believe that intellectual failures and successes
they encounter are a result of: (a) internal
attributions, whereby responsibility for outcome is
assumed by the subject and (b) an external attribution in
which responsibility for the outcome is relegated to the
property of the situation or other persons. Dweck and
Repucci (1973) believe lARQ scores are strongly related
to performance. McDonald (1973) states the lARQ is a
carefully developed scale that shows acceptable
reliability and evidence of both divergent and convergent
validity (p. 95). Finally, Phares (1976) reports that
this instrument's utility has been well-established, and
it is probably the most suitable measure for perceived
control, especially in terms of academic achievement.
Fennema-Sherman Math Attitudes Scales
Four subtests of this instrument were used to
measure students' attitudes toward math. The scales used
were the Attitudes Towards Success in Mathematics,
Mathematics as a Male Domain, Confidence in Learning
Mathematics, and Mathematics Anxiety. Fennema and Sherman

67
(1976) describe the subscales as follows:
The Attitude Toward Success in Mathematics Scale (AS) is designed to measure the degree to which students anticipate positive or negative consequences as a result of success in mathematics. They evidence this fear by anticipating negative consequences of success as well as by lack of acceptance or responsibility for the success, e.g., "It was just luck" (p. 2).
The Mathematics as a Male Domain Scale (MD) is intended to measure the degree to which students see mathematics as a male, neutral, or female domain in the following ways: a) the relative ability of the sexes to perform in mathematics; b) the masculinity/femininity of those who achieve well in mathematics; and c) the appropriateness of this line of study for the two sexes (p. 3).
The Confidence in Learning Mathematics Scale (C) is intended to measure confidence in one's ability to learn and to perform well on mathematical tasks. The dimension ranges from distinct lack of confidence to definite confidence. The scale is not intended to measure anxiety and/or mental confusion, interest, enjoyment or zest in problem solving (p. 4).
The Mathematics Anxiety Scale (A) is intended to measure feelings of anxiety, dread, nervousness and associated bodily symptoms related to doing mathematics. The dimension ranges from feeling at ease to those of distinct anxiety. The scale is not intended to measure confidence in or enjoyment of mathematics (p. 4).
Based on normative data collected from students in
grades 7 through 12 the following split-half reliabil
ities are reported: (1) Attitudes Towards Success in
Mathematics, .87; (2) Mathematics as a Male Domain, .86;
(3) Confidence in Learning Mathematics, .88; and (2)
Mathematics Anxiety, .89. Correlations between scale

68
scores indicate they are interrelated but are a somewhat
different construct (Fennema & Sherman, 1976). In a
factor analysis by Broadbooks, Elmore, Pedersen, and
Bleyer (1981) it was determined that that the scales
measure eight different constructs within the domain of
mathematics attitudes.
Each scale consists of six positively and six
negatively stated items with five Likert-type response
alternatives: strongly agree, agree, undecided, disagree,
and strongly disagree. For the purpose of this study the
scales were administered with six response alternatives
with the undecided category excluded because it was felt
that students, especially LD students, might tend to
choose that category rather to think carefully about the
alternatives. The responses used were: agree strongly,
agree, tend to agree, tend to disagree, disagree, and
disagree strongly. Because the students in the study were
being compared only to themselves and not to the norms of
the scales, it was felt this change was acceptable.
Horner Angle Recognition Test
A 28 item multiple-choice test was devised by the
researcher to determine students' abilities to recognize
the size of geometric angles (Appendix A ) . A pilot test
was administered to regular seventh and eighth grade

69
students (N=33) at a parochial school. A modified KR-20
reliability coefficient was .80.
Design and Analysis
Both the experimental and the control groups were
pretested and posttested using the instruments previously
described. Only the two experimental groups received in
struction in Logo from the school's computer instructor.
There were 14 sessions which lasted 55 minutes each. The
students in the control groups did not receive Logo in
struction but received their designated math curriculum.
Each of the four hypotheses was tested using a
two-way analysis of covariance. A two-way design was
chosen in the event there was an interaction effect among
the LD and non-LD groups. An alternate analysis would
have been a one-way design, but that would not have
yielded any interaction effect. A two-way analysis was
the most parsimonious because not only would it test the
hypotheses and reveal if there was interaction among the
LD and non-LD groups, but it would also dispense with the
necessity of doing a multiple classification analysis.
For each analysis the pretest score of criterion measure
for the dependent variable was used as the covariate.
The independent variables for the experiment were
the treatments and type of classes. Treatments included

70
Logo instruction for the experimental groups and the
regular math curriculum for the control groups. Classes
were LD and non-LD. The dependent variables for all
groups included the previously discussed measures of
problem solving skills, locus of control, math attitude,
and geometric angle recognition. Each dependent variable
was analyzed separately to determine the effect of the
treatments (Logo instruction vs. math curriculum) and to
determine if there was an interaction between the classes
(LD vs. non-LD).
Procedures
The researcher administered the GALT, Fennema-
Sherman Math Attitudes subscales, the lARQ, and the test
of geometric angles recognition to the 76 subjects
approximately one week before Logo instruction began.
Each item on each instrument was read orally so that the
effect of poor reading ability would be minimized. The
pretesting covered a period of two days. After students
were pretested, Logo instruction was given to both
experimental groups during their math classes. The
students received instruction for one class period (55
minutes) two or three times a week for a duration of six
weeks. The total treatment time was 14 class periods.
During this time the control groups received their
regular math curriculum from their math teachers.

71
The computer instructor at the school implemented
the instruction and was assisted by the students' math
teachers and the researcher. The researcher designed a
curriculum to be used during the treatment (Appendix B).
All students received instruction in the same sequence;
however, it was received on an individualized basis, and
students were allowed to go at their own pace. Students
were required to write down commands and procedures that
they used for each project. After one of the teachers saw
the students' projects and checked their work, they were
expected to go to the next project. After the treatment
ended, subjects were posttested in the same manner as
they were pretested.

CHAPTER IV
RESULTS
The purpose of this study was to determine if
certain variables related to academic failure in learning
disabled children would be positively affected by
learning the Logo computer programming language.
Specifically, the questions which were addressed in this
study were:
1. What is the effect of learning Logo on
problem solving ability of learning disabled
students?
2. V>rhat is the effect of learning Logo on locus
of control of learning disabled students?
3. What is the effect of learning Logo on math
attitudes of learning disabled students?
4. What is the effect of learning Logo on
mathematical concepts of learning disabled
students?
Descriptive Data
The subjects of the study consisted of 74 seventh
and eighth grade junior high students. Fifty-six students
were in the eighth grade and 18 were in the seventh
grade. Of these 74 students, 43 were male and 31 were
72

73
female. Their ages ranged from 12 to 16 years with a
median age of 13.7. There were three Anglos, 34
Hispanics, and 37 Blacks. These 74 students comprised
four intact groups: (1) LD experimental, (2) LD control,
(3) non-LD experimental, and (4) non-LD control. Treat
ment for the experimental groups was Logo programming
instruction for a total of 14 class periods during a six
week period, while treatment for the control groups was
their regular specified math curriculum. Table I shows
the demographic information for each group.
TABLE 1
DEMOGRAPHIC INFORMATION FOR EACH GROUP
Sex Male Female
Grade 7 8
Age 12 13 14 15 16
Ethnicity Anglo Black Hispanic
Ex.
12 4
7 9
1 6 7 2 0
0 9 7
LD Con.
17 3
11 9
2 8 6 4 0
2 12 6
Tot.
29 7
18 18
3 14 13 6 0
2 21 13
Ex.
9 12
0 21
0 5 14 1 I
0 7
14
NON-LD Con.
5 12
0 17
0 5
11 1 0
1 9 7
Grand Tot.
14 24
0 38
0 10 25 2 I
1 16 21
Tot.
43 31
18 56
3 24 38 8 1
3 37 34

74
Since the investigation concerned the effects of
learning how to program a computer, students were asked
several questions to determine what kind of computer
experience they had. The questions asked are as follows:
1. Do you have a computer at home (not a video
machine)?
2. Do you have a video machine?
3. Do you know how to program with your computer?
4. If so, what computer language do you knov/
(BASIC, Logo, PILOT, other)?
5. Do you know how to type?
6. Do you play video games?
7. If you play video games, how often do you play
(every day, three times a week, twice a week, not
often)?
Of the 74 students, 21 (28%) reported they had a
home computer, while 37 (50%) reported they had a home
video game machine. Fourteen of these students reported
they had both; therefore, 44 (59%) of the students had
either a home computer or a video machine. Seventy (95%)
students reported they played video games, and 28 (38%)
of these students said they played every day. Twenty-
eight (38%) students reported they knew how to program,
and all 28 reported that BASIC was the language they
knew. No students reported knowing Logo. Table 2 lists
frequencies of students' responses.

75
TABLE 2
FREQUENCIES OF COMPUTER EXPERIENCE RESPONSES
Q u e s t i o n LD
E x . C o n . T o t NON-LD GRA1>ID TOT
E x . C o n . T o t .
11
Home computer
Yes
No
Video Machine
Yes 9
No 7
Know Programming
Yes 6
14
11
25 16 12
II 20
16
8
12
No 10
8
12
14
22
8
13
6
11
Play videos
10
28
17
21
14
24
21
53
37
37
28
46
Language
BASIC
Other
How to type
Yes
No
6
0
2
14
8
0
7
13
14
0
9
27
8
0
2
19
6
0
5
12
14
0
7
31
28
0
16
58
Yes
No
How often
Every Day
2-3 X wk.
Not often
13
3
10
2
1
20
0
8
2
10
33
3
18
4
11
20
I
6
4
10
17
0
4
5
8
37
I
10
9
18
70
4
28
13
29

76
Analysis of Covariance
Each hypothesis was tested with an analysis of
covariance procedure. This procedure was chosen since
random assignment was not possible and intact groups were
used. Analysis of covariance is an extension of analysis
of variance. Analysis of variance is used when the
purpose is to determine if there is a significant
difference among group means. However, posttest group
differences are misleading if the groups were not
equivalent on the dependent variable when the study
began. Normally, random assignment results in equivalent
groups. If random assignment is not possible, however,
and intact groups must be used, lack of initial
equivalence becomes a threat to internal validity. In
such cases, intact groups may be equated statistically by
performing an analysis of covariance with pretest scores
as the covariate (Cornett & Beckner, 1975).
Each hypothesis in this study was tested with a
separate two-way analysis of covariance of posttest mean
scores with pretest scores as the covariate. The two-way
interaction consisted of treatment (experimental, con
trol) by class (LD, non-LD). Tables 3 and 4 indicate
pretest and posttest mean scores and standard deviations.

77
TABLE 3
LD MEAN SCORES AND STANDARD DEVIATIONS (s) FOR DEPENDENT
VARIABLE MEASURES
GALT lARQ CONF. SUCC. ANX. MALE D. ANGLES
EXP.(N=16)
Pre-Mean 2.31 23.38 51.88 52.13 48.69 47.31 8.56
s 1.70 4.88 8.25 12.73 6.22 8.40 2.28
Post-Mean 2.19 24.81 51.94 53.50 46.19 48.38 10.25
s 1.52 5.52 8.96 10.67 10.75 8.49 4.33
CON.(N=20)
Pre-Mean 1.65 22.65 46.50 53.05 43.10 48.15 8.20
s 1.18 4.45 10.54 10.84 7.62 10.88 2.75
Post-Mean 2.00 23.40 48.10 55.75 45.10 49.95 8.35
s 1.84 4.42 10.70 12.18 10.31 9.98 2.23
COMBINED (Exp./Con. N=36)
Pre-Mean 1.94 22.97 48.89 52.64 45.58 47.78 8.36
s 1.45 4.60 9.84 11.55 7.48 9.73 2.52
Post-Mean 2.08 24.03 49.81 54.75 45.58 49.25 9.19
s 1.68 4.91 10.02 11.43 10.37 9.25 3.41

78
TABLE 4
NON-LD MEAN SCORES AND STANDARD DEVIATIONS (s) FOR
DEPENDENT VARIABLE MEASURES
GALT lARQ CONF. SUCC. ANX. MALE D. ANGLES
EXP.(N=21)
Pre-Mean 2.10 25.43 51.43 58.05 47.29 51.86 10.86
s 1.64 4.29 9.24 8.02 10.59 10.00 1.98
Post-Mean 3.00 27.86 52.57 59.24 49.71 54.71 12.62
s 1.64 3.18 9.91 6.88 12.94 10.37 2.85
CONT.(N=17)
Pre-Mean 2.94 26.77 53.12 60.12 47.59 58.47 12.29
s 1.75 4.51 10.20 9.00 9.31 7.18 3.77
Post-Mean 3.06 27.24 48.65 61.65 46.94 59.06 13.00
s 1.48 2.68 12.49 7.15 9.93 7.82 4.56
COMBINED (Exp./Con. N=38)
Pre-Mean 2.47 26.03 52.18 58.97 47.42 54.82 11.50
s 1.72 4.38 9.59 8.39 9.91 9.35 2.97
Post-Mean 3.03 27.58 50.82 60.32 48.47 56.66 12.79
s 1.55 2.95 11.15 7.01 11.62 9.45 3.66

79
Hypotheses
Hypothesis 1
Hypothesis 1 stated that learning disabled students
who received Logo instruction would demonstrate greater
gains in problem solving ability as measured by the Group
Assessment of Logical Thinking (GALT) than would learning
disabled students who received only math instruction
without Logo. This hypothesis was tested by obtaining
pretest and posttest GALT scores and using an analysis of
covariance procedure with pretest GALT scores as the
covariate. As Table 5 indicates there v/as no significant
differences of adjusted mean post-GALT scores among
groups.
TABLE 5
ANALYSIS OF COVARIANCE FOR POST-GALT SCORES
Source SS df MS F p_
0.10 0.76
3.75 0.06
0.35 0.56
Treatment
Class
A X B
Within
Total
(B)
(A) 0.22
8.60
0.80
155.87
201.67
1
1
I
69
72
0.22
8.60
0.80
2.30
2.80

80
Hypothesis 2
The second hypothesis stated that the locus of
control of learning disabled students who received Logo
instruction would become more internal as measured by the
Intellectual Achievement Responsibility Questionnaire
(lARQ) than would learning disabled students who received
only math instruction without Logo. This hypothesis was
tested in the same manner as the first hypothesis.
Statistical analysis revealed that posttest lARQ adjusted
mean scores of the non-LD groups were significantly
higher than LD groups. However, there was no significance
among treatment groups (see Table 6).
TABLE 6
ANALYSIS OF COVARIANCE FOR POST-IARQ SCORES
Source SS df MS F p
Treatment (A) 34.13 I 34.13 2.91 0.09
Class (B) 76.09 1 76.09 6.48 0.013**
A X B 0.16 1 0.16 0.01 0.91
Within 798.53 69 11.74
Total 1394.68 72 19.37
**p<.02

81
Hypothesis 3
The third hypothesis stated that learning disabled
students who received Logo instruction would demonstrate
more positive change in attitudes towards mathematics as
measured by the Fennema-Sherman Mathematics Attitudes
Scales than would learning disabled students who received
only math instruction without Logo. To test this
hypothesis posttest scores of Confidence in Learning
Mathematics, Attitudes Toward Success in Mathematics,
Mathematics Anxiety, and Mathematics as a Male Domain
were analyzed separately. As Tables 7, 8, 9 and 10
indicate there were no significant differences among
groups.
TABLE 7
ANALYSIS OF COVARIANCE FOR POST-CONFIDENCE SCORES
Source
Treatment
Class (B)
A X B
Within
Total
(A)
SS
109.49
30.20
100.12
4252.88
8120.95
df
1
I
1
69
72
MS
109.49
30.20
100.12
62.54
112.79
F
1.75
0.48
1 .60
P
0.19
0.49
0.21

82
TABLE 8
ANALYSIS OF COVARIANCE FOR POST-SUCCESS SCORES
Source SS df MS
Treatment (A) 54.34 1 54.34 0.95 0.33
Class (B) 75.40 1 75.40 1.32 0.25
A X B 0.80 1 0.80 0.01 0.91
Within 3876.55 69 57.01
Total 6902.92 72 95.87
TABLE 9
ANALYSIS OF COVARIANCE FOR POST-ANXIETY SCORES
Source SS df MS
Treatment
Class
A X B
Within
Total
(B)
(A) 0.37
96.28
88.66
5984.89
8909.86
I
1
1
69
72
0.37
96.28
88.66
88.01
123.75
0.00 0.95
1.09 0.30
1.01 0.32

83
TABLE 10
ANALYSIS OF COVARIANCE FOR POST-MALE DOMAIN SCORES
Source SS df MS
Treatment (A) 1.90 1 1.90 0.05 0.82
Class (B) 75.63 I 75.63 2.05 0.16
A X B 11.12 1 11.12 0.30 0.59
Within 2514.64 69 36.98
Total 7054.45 72 97.98

84
Hypothesis 4
This hypothesis stated that learning disabled
students who received Logo instruction would demonstrate
greater gains in recognition of geometric angles as
measured by the Horner Angle Recognition Test than would
learning disabled students who received only math
instruction without Logo. The only significance revealed
was that adjusted mean scores of the non-LD groups were
significantly higher than the LD groups (p=.02). Table II
illustrates these findings.
TABLE II
ANALYSIS OF COVARIANCE FOR POST-ANGLE SCORES
Source SS df MS F p
Treatment (A) 22.21 I 22.21 2.19 0.14
Class (B) 59.67 I 59.67 5.89 0.02*
A X B 16.61 I 16.61 1.64 0.21
Within 688.97 69 10.13
Total 1138.98 72 15.82
*p<.05
85
None of the hypotheses of the study were supported.
However, after the design of the study was developed, it
was decided to investigate another question: What kind of
causal attributions would students make concerning Logo
tasks? In an effort to answer these questions, students
were asked to complete a weekly attribution checksheet
(Appendix C ) . Students were instructed to report if they
felt successful or unsuccessful on the week's Logo
activities. They were also asked to choose a reason for
their perceived performance. Reasons which could be
selected indicated attributions to effort, ability, task
difficulty, and luck/chance.
The validity of the checksheet was considered to be
prima facie. Psychometric procedures for obtaining
reliability and validity could not be applied to this
type of measure since normal correlational statistics
cannot be applied to categorical data. Meehl (1978)
states:
...once a "self-rating" has been obtained, it can be looked upon in two rather different ways. The first, and by far the commonest approach, is to accept a self-rating as a second best source of information when the direct observation of a behavior is inaccessible for practical or other reasons. This view in effect forces a self-rating or self-description to act as surrogate for a behavior-sample (p. 518).
Measures similar to the attribution checksheet used in
this study are commonly used in studies concerning

86
perceived attributions (Bugental, Collins, Collins, &
Chaney, 1978; Cauley & Murray, 1982; Nicholls, 1978).
At the end of the treatment period, students were
categorized as internal or external concerning the Logo
activities based on their reported attributions. If
students reported at least four out of six effort and
ability statements, they were classified as internal, or
if they had at least four out of six task difficulty and
luck attributions, they were classified as external.
Next, students were classified by a median split
(pre-IARQ) as internal or external.
The purpose of the classifications was to determine
if students' attribution classification (internal or
external) would be similar to their lARQ classifications.
V/hen the frequencies were tallied and the median split
accomplished, there were 14 internal and 14 external lARQ
categorizations, while there were 26 internal and two
external Logo attribution categorizations (N=28). To test
if there was a significant difference between expected
Logo attributions and observed attributions a chi-square
analysis was performed. As Table 12 indicates, there were
significantly more students (p<.01) categorized as
internal based on Logo attributions than were expected.

87
TABLE 12
COMPARISON OF OBSERVED AND EXPECTED FREQUENCIES OF
INTERNAL AND EXTERNAL LOGO ATTRIBUTIONS
Internal External N df X^
Observed 26 2 28 1 20.61**
Expected 14 14
**p<.01
Summary
None of the proposed hypotheses of this study were
supported. Another question, whether students' general
academic locus of control would differ from reported
attributions of Logo tasks, was investigated. Statistical
analysis revealed there was a significantly greater
number of students who reported internal attributions
about Logo than students with internal locus of control
as measured by lARQ pretest scores.

CHAPTER V
DISCUSSION AND CONCLUSIONS
Summary of Study
From a review of the literature it was determined
that although learning disabled children have diverse
learning problems, academic failure is one of the common
characteristics of this group. Factors which have been
found to contribute to their poor academic achievement
include poor problem solving ability, external locus of
control, and negative attitudes toward academic subjects.
Computer programming instruction has been suggested as a
method to improve these variables and other cognitive
abilities. The Logo programming language has been
recommended for children, including learning disabled
children, as an effective learning tool.
Seymour Papert (1980), the primary developer of Logo,
believes programming in Logo can enhance problem solving
skills by allowing individuals to think abstractly
through a concrete medium. He believes that programming
can provide children with experiences which will nurture
all learning. Although the Logo philosophy is based on
Piagetian learning theory, Papert differs with Piaget by
hypothesizing that children can develop formal opera-
88

89
tional thinking at an earlier age than Piaget suggests if
given the appropriate opportunities. Papert's purpose in
designing Logo was to make programming comprehensible for
children. Logo is appealing to children because they can
do interesting things with the language after a five to
ten minute orientation to turtle graphics. A turtle,
usually in the shape of a triangle, is seen on the screen
and the child can command it to draw different
geometrical designs and receive immediate feedback.
Students can watch the turtle draw and know immediately
if they gave the correct command.
Papert (1980) believes that the unique features of
Logo can teach children abstract problem solving skills,
teach mathematical concepts such as geometric angles,
alleviate fear of math, and then generalize the concepts
they have learned to all subjects. This study was an
attempt to investigate the claims that Logo can improve
problem solving ability, increase students' feeling of
control over their environment, positively affect
attitudes toward mathematics, and improve mathematical
concepts. Specifically, it was hypothesized that for
learning disabled students Logo would improve problem
solving skills, increase internal locus of control,
affect a positive change in attitudes toward mathematics,
and improve ability to recognize size of geometric
angles .

90
The study was conducted at a public junior high
school, and some limitations were placed on the research
design. First of all, random assignment of students was
not permitted and intact classes had to be used. Second,
due to administrative policy and scheduling conflicts,
only 14 class periods were allotted for Logo instruction.
Two experimental groups and two control groups were
designated (N=74). Experimental and control groups each
consisted of an LD intact class and a non-LD intact
class. All groups were pretested and posttested with
measures of problem solving (GALT), locus of control
(lARQ), math attitudes (Fennema-Sherman), and recognition
of geometric angles (HART). The examiner read all in
structions and questions orally to all groups to equalize
the effect of reading ability. During the pretesting
time, students reported information concerning computer
experience. Treatment for the experimental groups was
Logo instruction for a total of 14 class periods during a
span of six weeks, while treatment for the control groups
was the regular math curriculum. Each hypothesis was
tested with an analysis of covariance procedure with pre
test scores serving as the covariate. No support for the
research hypotheses was found. An additional statisti
cal analysis was conducted to determine if there was a
significant difference between the observed number of
91
students classified as internal or external based on
reported Logo attributions and the expected number based
on pre-IARQ scores. A chi-square procedure revealed there
were significantly more students (p<.01) classified as
internal and fewer classified as external based on Logo
attributions than would be expected based on pre-IARQ
scores.
Discussion of the Study
Results
The study indicated no support for the research
hypotheses. There are several possible explanations for
finding no significant difference between experimental
and control groups on the measures of problem solving,
locus of control, math attitudes, and recognition of size
of geometric angles. Possible factors which may be
related to the overall nonsignificant differences
include: (1) length of treatment, (2) posttest apathy,
(3) lack of generalization of Logo due to the
instructionl procedure, and (4) Logo's lack of power.
According to Papert (1980, p.21) "the new knowledge
(learning to program) is a source of power and is
experienced as such from the moment it begins to form in
the child's mind." Although Papert maintains that Logo
is a powerful teaching medium, the length of treatment
in the present study was quite brief. The span of

92
instructional time was six weeks and students received
only 14 class periods of Logo instruction. Also, the fact
that students did not receive instruction every day might
have been disadvantageous. Students worked with Logo two
or three times weekly and had, on the average, three days
between weekly sessions.
Another factor which may have contributed to
nonsignificant findings was posttest apathy. When
students took the pretests, they were aware that they
were going to be involved in a computer project. Students
seemed to look forward to working in the computer lab.
During the pretest the researcher informally observed
that students seemed to be attempting to do well.
However, during the posttest administrations, student
effort seemed less intense. For example, some students,
both LD and non-LD, answered questions before the
examiner finished orally reading them. Some students may
have anticipated the questions and preferred to answer
them at their own pace. However, others may not have
given enough thought to the questions or comprehended
what the questions asked.
Lack of incentive may account for the seeming lack
of effort during the posttests. During the pretesting
students could look forward to going to the computer lab
in lieu of their regular class, but during the posttest

93
sessions they knew that the computer project was
completed.
The instructional procedure may be a third reason
for nonsignificant differences. It may not have been
structured so that students could generalize what they
learned with Logo. Students were taught Logo commands and
were given examples of how to program the turtle to draw
different designs but were not directly told what
concepts they were learning or that they were learning
mathematical concepts. This instructional procedure was
based on Papert's (1980) philosophy that children will
become epistemologists and that they will learn concepts
simply by programming with Logo. Others who have worked
with Logo have stated that generalizations do not occur
spontaneously and that students need to be shown how Logo
principles apply to other situations (Euchner, 1983).
Watt (1984) believes that research on Logo will
probably be incomplete because both the use of Logo and
research on problem solving are not well established. He
states, "Logo is not magic. It takes a lot of planning
and good educators to make it work."
General reasons for overall nonsignificance have
been discussed. At this point additional reasons for
nonsignificance will be specifically related to each
dependent variable: problem solving, locus of control,

94
math attitudes, and recognition of geometric angles.
Problem Solving. The first hypothesis stated that
Logo would improve problem solving skills of learning
disabled students. Neither the learning disabled nor the
non-learning disabled students who received Logo
instruction had posttest scores on the GALT which were
significantly different from those who did not receive
Logo instruction. A significant difference may not have
been found because the GALT test is not sensitive enough
to measure change in operational thinking, and/or because
Logo is not a powerful enough treatment to advance
operational thinking to a higher level.
Because Papert specifically states that Logo can
improve problem solving by producing abstract thinking in
terms of Piagetian theory, the GALT test was used as a
measure of developmental reasoning capabilities. On the
basis of scores students can be categorized as concrete,
transitional, or formal thinkers. All students in the
study fell into the concrete category on both pre- and
posttests. No one moved into the transitional or formal
category. Actually, these results are consistent with
traditional Piagetian theory. According to Piaget (1966)
attempts to expand cognitive abilities lead to
superficial rather than genuine learning. Englemann and
Englemann (1968) described techniques to speed up and

95
expand cognitive abilities. Kamili and Dermon (1972)
evaluated an attempt by Englemann to teach the concept of
gravity to six-year olds. They concluded that the
children had gained only partial understanding of the
concept and still functioned at a preoperational level in
rote fashion. Further, the children had to be told what
information they needed and could not apply the
information they had learned. In other words, proof has
not yet been established that specific teaching
techniques can advance cognitive development. In an
analysis of Piaget's theory, Keating (1980) concluded
that change in thinking at adolescence is gradual rather
than abrupt. There is a possibility that students did
perform specific abstract tasks while using Logo, and the
thinking processes they used did not generalize to other
tasks. This could be because a shift to formal thinking
is gradual and is difficult to measure, especially in
studies of brief duration.
Locus of Control. The second hypothesis, that the
locus of control of students identified as learning
disabled will become significantly more internal through
the use of Logo was not supported. There are several
possible reasons for this outcome. First, LD students may
have too many failures for one successful treatment to
overcome. Second, LD students may assess their situation

96
in a realistic manner. Dudley-Marling, Snider, and Tarver
(1982) suggest that LD children who perceive failure in
school as a result of lack of ability may have made a
reasonable assessment of the situation. They may, in
fact, lack ability to perform certain academic tasks and
be aware of this lack of ability. More research is
needed, but the conclusion drawn from the results of this
portion of the study was that no evidence was found to
support the hypothesis that Logo can produce more
internality of LD students.
Locus of control is described as a trait which
develops from generalized expectancies; however,
individuals' attributions for a specific task may differ
somewhat from their generalized expectancies. Although
this study did not support the idea that Logo can produce
more internality, a chi-square analysis revealed that
there were more students in the experimental groups
categorized as internal based on Logo attributions than
on lARQ scores. That the analysis revealed significantly
more internal attributions to the specific Logo tasks
than for the generalized expectancy, locus of control,
reflects the state versus trait nature of the two sets of
responses. This seems to suggest that Logo successes are
unable to overcome the trait externality associated with
years of academic failure. Yet, that the state Logo
97
specific attributions are largely internal provides some
support for the effectiveness of Logo and optimism for
broader scoped Logo instruction than that of the
treatment.
Math Attitudes. Next, it was hypothesized that Logo
instruction would result in a significant positive change
in attitudes toward mathematics. Attitudes considered
were confidence in learning math, attitudes toward
success in math, math anxiety, and math as a male domain.
Again, there were no significant differences between the
experimental and control groups. Reasons for the
nonsignificant differences may be similar to the reasons
previously discussed for nonsignificance of the other
hypotheses: the treatment may have been too brief or Logo
may not be powerful enough to change attitudes. Another
critical factor may be that students were not directly
informed they were performing mathematical tasks.
Students may not have been aware of the relationship
between the Logo programming activities and doing math
problems. If students did not make a connection between
Logo programming and doing math, this may account for the
failure to produce a change in attitudes toward
mathematics. The conclusion is that no support was found
for the idea that Logo can produce positive changes in
attitudes toward math.

98
Recognition of Geometric Angles. The final
hypothesis stated that instruction in Logo would
significantly improve the ability of students identified
as learning disabled to recognize the size of geometric
angles. One plausible explanation for nonsignificance is
a combination of brief duration of treatment and lack of
direct information concerning size of angles. Bloom
(1964, p. 391) states:
...the research worker must not expect major modification of teaching practices in a brief period of time. Nor should he expect to secure significant evidence of growth toward new objectives in a single study carried on over a one-year period. If possible, the research worker must plan for two and even three repetitions of a study which actively involves both teachers and evaluators before significant student growth is likely to become evident.
Regardless of the length of treatment, if students
are expected to learn to approximate size of geometric
angles through Logo activities, they may need to receive
direct information about what they are learning rather
than to be left to discover it. A third factor which may
have contributed to the outcome is the sensitivity of the
criterion measure. Schwartz and Oseroff (1975, p. 35)
point out that a criticism of using achievement tests as
dependent measures is their insensitivity to significant
gains in studies of short duration. The angles
recognition test may not have been sensitive enough to
detect grov/th which may have occurred as a result of
learning Logo.

99
Summary of Results. This investigation involved four
hypotheses which stated that Logo would positively affect
certain variables related to the academic achievement of
learning disabled students. The outcomes of the study
failed to support the research hypotheses. Possible
reasons for the nonsignificant outcomes include:
1. Learning how to program with Logo may not be
enough to produce change in the dependent
variables tested.
2. The duration of treatment was too brief.
3. Students may have put forth less effort during
the posttest administrations.
4. The treatment procedure was too indirect for
students to generalize concepts and principles
to other situations.
5. Criterion measures may not have been sensitive
enough to detect change which may have occurred.
Research on Logo is in its early stage, and no firm
conclusions can be legitimately drawn from nonsignificant
findings. It can only be stated that this study failed to
find support for the claims for Logo which were tested. A
tentative indication was found that Logo may produce
internal attributions toward success with Logo tasks;
however, more research is needed.

100
It is cautioned that the results of this study may
not be generalizable to all public school populations nor
to classically diagnosed LD children. The study sample
consisted primarily of minority students and the students
in the study classified as LD were not identified based
on a classical definition which includes a disorder in
one or more of the basic psychological processes involved
in understanding or using language. Psychological
processes include auditory perception, visual perception,
tactile perception, motoric perception, and memory. The
students in this study were identified as learning
disabled based on the Texas Education Agency's
discrepancy model. This model omits psychological process
deficits as a criterion. LD students are identified as
learning disabled if assessed achievement in one or more
areas of language, reading, mathematics, or spelling is
more than one standard deviation below their intellectual
ability, and the discrepancy is not due to a sensory
impairment. Thus, subjects in this study cannot be
considered classically learning disabled.
Student Computer Experience
The data concerning the students' computer
experience, although not of central importance to the
study, brought attention to data about the subjects which
are of interest. First of all, of the 74 students, 21

101
(28%) reported they had home computers and 37 (50%)
reported they had home video game machines. Of the
students who reported having a home computer or home
video machine, only 14 students reported having both.
This means that 44 (59%) students in the study had access
to either a computer or a video game machine. The fact
that over half of this population had some type of
computer is surprising since the majority of the sample
consisted of minority students (50% Black, 46% Hispanic)
as does the school where the study was conducted (59%
Black, 38% Hispanic). In a more typical ethnic
distribution even more students might have some type of
computer.
Seventy (95%) of the students reported they played
video games; 28 (38%) reported playing every day, 13
(18%) reported playing two to three times a week, and 29
(39%) reported playing infrequently. Four (5%) students
reported they did not play video games; however, three of
these students said they knew how to program. Only one
student in the sample reported having no computer
experience of any kind.
The number of students who have access to a computer
is important when considering the future of educational
computing. Often schools offer only computer literacy
classes. If the rate of students who have home computers

102
continues to rise, then the idea of having computer
literacy classes may become obsolete rather quickly. Watt
(1984) suggests that within five years, computer literacy
classes can be put on the shelf along with telephone
literacy classes which were popular at one time.
Rather than investing time, effort, and money in
literacy classes, perhaps educators should consider
teaching computer programming. Programming cannot be
learned at home as easily as computer literacy. The
computer questionnaire also revealed that of the 74
students, 28 (38%) reported that they knew how to program
using the BASIC language. Sixteen of these students did
not report having a home computer. All of the students
who reported knowing how to program reported that BASIC
was the only programming language they knew. This is
probably due to the fact that BASIC is often built into
computers and it is the most popular programming language
for microcomputers. The fact that none of the students
knew Logo or any other "easy" language besides BASIC
indicates that students may be unaware of different types
of languages. It could be that if other languages were
made more accessible, more students would learn to
program.
The microcomputer industry is growing and changing
rapidly. The questionnaire from this study indicates that

103
students have a great deal of computer experience of some
sort. Educators may not be aware of how computer literate
students actually are. With microcomputing changing so
rapidly and with the increasing number of students who
are familiar with microcomputers, educators should be
prepared to offer more advanced computer instruction than
mere literacy in the near future.
Educational Relevance
This investigation did not provide support for
Papert's claims concerning Logo; however, it did show
some evidence that Logo may be effective in making both
LD and non-LD students feel responsible for their success
with the Logo activities. The curriculum for this study
was set up on an individual basis and was not difficult
to administer. Therefore, since Logo is an environment in
which students can feel successful and since it can be
easily individualized, there is a possibility that a Logo
class might be a positive way to integrate regular and
special education students.
Logo may also be useful as a method for helping
students to generalize success attributions. It has been
suggested that failure-prone children should be reminded
that if they try, they will succeed and that emphasizing
real abilities of LD children may help to weaken their
attributions concerning ability and encourage general-
104
ization of success (Englemann, 1969; Dudley-Marling et
al., 1982). This objective might be facilitated by
teaching students Logo and specifically relating their
Logo success to successes in other areas.
Finally, students in the project became familiar
with a microcomputer and how to program with Logo. Some
students in the study were already familiar with com
puters and the BASIC programming language. Those students
gained additional information. The students seemed to
have little difficulty learning to program with Logo;
therefore, pending further research, consideration should
be given to adding Logo as an option for programming.
Implications for Further Research
Although no support was found for the claims tested
in this study, Logo still may be an effective medium to
produce positive changes in students. Future researchers
should consider: (1) administering Logo on a regular
basis for a more extended time than the length of this
study, (2) structuring the instruction to give students
specific information so they would realize what they were
learning, and (3) demonstrating to students how the
principles and concepts they learn can be applied to
other situations.
There are a multitude of questions to be researched
concerning Logo. Reports of studies which have been

105
conducted have not produced evidence to support the idea
that Logo significantly improves problem solving skills.
Perhaps investigations should focus on specific
applications. Future studies might include the
application of Logo in conjunction with traditional math
curriculums, teaching Logo as a programming language in
the place of BASIC or other languages, or the possibility
of effectively mainstreaming handicapped students into
Logo classes.
Results of this study brought other questions to
mind. For example, was the reported computer experience
in this study similar or different from the computer
experience of students in a more ethnically balanced
population? " Specifically, do students from a more
representative ethnic distribution have more or fewer
home computers, do they play video games more or less, or
is there a larger or smaller percentage who report
knowing how to program?
Conclusion
From a computer experience questionnaire it was
discovered that all but one student in the sample had
some kind of computer experience. The questionnaire
responses indicate that the majority of the students in
this sample were computer literate to some degree. The
educational implication is that in the near future.

106
computer literacy courses may be unnecessary and more
sophisticated computer classes will need to be available
to keep up with the rapid changes in microcomputing.
The results of this study have not supported the
hypotheses that instruction in Logo will positively
affect problem solving ability, produce more internal
locus of control, produce more positive attitudes toward
mathematics, or increase the ability to recognize the
size of geometric angles. A significant difference was
found between the number of students observed as having
internal attributions (perceiving outcomes due to ability
or effort) based on a Logo attribution checksheet than
would be expected based on pretest locus of control
scores (lARQ). This finding implies that students may
have more internal attributions toward Logo tasks than
academic tasks in general. Although the results and
information gathered from this study may not be
generalized to a broad population of students, it has
stimulated more questions concerning Logo and computer
use in general.

LIST OF REFERENCES
Aiken, L. (1970a). Attitudes toward mathematics. Review of Educational Research, 40, 551-596.
Aiken, L. (1970b). Nonintellective variables and mathematics achievement: Directions for research. Journal of School Psychology, £, 28-36.
Aiken, L. (1972). Biodata correlates of attitudes toward mathematics in three age and two sex groups. School Science and Mathematics, 72, 386-395.
Aiken, L. (1976). Update on attitudes and other affective variables in learning mathematics. Review of Eduation-al Research, 46, 293-311.
Allard, K., & Thorkildsen, R. (1981). Intelligent videodiscs for special education. Videodisc News, 1981, 2,(4).
Alley, G., & Deshler, D. (1979). Teaching the learning disabled adolescent; Strategies and methods. Denver: Love Publishing Co.
Bartel, N.R. (1982). Problems in mathematics achievement. In D.D. Hammill, & N.R. Bartel (Eds.) Teaching Children With Learning and Behavior Problems. Boston: Allyn and Bacon, Inc.
Betz, N. (1978). Prevalence, distribution, and correlates of math anxiety in college students. Journal of Counseling Psychology, 25, 441-448.
Billstein, R. (1982, November). Learning Logo and liking it. The Computing Teacher, 18-31.
Bloom, B.S. (1964). Testing cognitive ability and achievement. In N.S. Gage (Ed.) Handbook on Research on Teaching. Chicago: Rand McNally & Co.
Boersma, F.J., & Chapman, J.W. (1978, September). Perceptions and expectancies: Their influences on cognitive an affective develpment in learning disabled children. Canada Council Final Report, (Grant No. 576-0624)
Bracey, G.W. (1982). Computers in education: What the research shows. Electronic Learning, 2 , (3), 51-54.
107

108
Broadbooks, W.J., Elmore, P.B., Pedersen, K., & Bleyer, D.R. (1981). A construct validation study of the Fennema-Sherman Mathematics Attitudes Scales. Educational and Psychological Measurement, 41, 551-5^7";
Budoff, M., & Hutten, L. (1982). Microcomputers in special education: Promises and pitfalls. Exceptional Children, 49, 123-128.
Bugental, D.B., Collins, S., Collins, L. & Chaney, L.A. (1978). Attributional and behavioral changes following two behavior management interventions with hyperactive boys: A follow-up study. Child Development, 49, 247-250.
Callahan, L., & Glennon, V. (1975). Elementary school mathematics: A guide to current research. Washington, D.C.: Association of Supervision and Curriculum Development.
Carman, G., & Kosberg, B. (1982, February). Educational technology research : Computer technology and the education of emotionally handicapped children. Educational Technology, 26-30.
Carter, R. (1983). The complete guide to Logo. Classroom Computer News, _3, (5), 35-39.
Cauley, K.M., & Murray, F.B. (1982). Structure of children's reasoning about attributes of school success and failure. American Educational Research Journal, 19, 473-480.
Cawley, J.F., Fitzmaurice, A.M., Shaw, R., Kahn, H., & Bates, H. (1979). LD youth and mathematics: A review of characteristics. Learning Disability Quarterly, 2 , 29-44.
Chapman, J.W., & Boersma, F.J. (1979). Academic self-concept in elementary learning disabled children: A study with the student's perception of ability scale. Psychology in the Schools, 16, 201-206.
Chapman, J.W., & Boersma, F.J. (1979b). Learning disabilities, locus of control, and mother attitudes. Journal of Educational Psychology, 71, 250-258.
Coburn, R. , Kelman, P., Roberts, N., Snyder, T., Watt, D., & Weiner, C. (1982). Practical guide to computers

109
in education. Reading, MS: Addison-Wesley Pub. Co.
Cohn, R. (1964). The neurological study of children with learning disabilities. Exceptional Children, 31, 185-197.
Cornett, J., & Beckner, W. (1975). Introductory Statistics for the behavioral sciences. Columbus, OH: Charles E. Merrill Pub. Co.
Cowan, P. (1978). Piaget with feeling. Dallas: Holt, Rinehart, and Winston.
Crandall, V.J., Katkovsky, W., & Preston, A. (1962). Motivational and ability determinants of young children's intellectual achievement behaviors. Child Development, 33, 643-661.
Crandall, V.J., Katkovsky, W., & Crandall, V.S. (1965). Intellectual Achievement Responsibility Questionnaire. In Children's beliefs in their own control of reinforcements in intellectual-academic situations. Child Development, 36, 91-109.
Crosswhite, F. (1972). Correlates of attitudes toward mathematics: National longitudinal study of mathematical abilities (Report No. 20). Palo Alto, CA: Stanford University Press.
Cruickshank, W. (1948). Arithmetic ability of mentally retarded children: I. Ability to differentiate extraneous materials from needed arithmetical facts. Journal of Educational Research, 42, 161-170.
Cruickshank, W. (1972). Some issues facing the field of learning disability. Journal of Learning Disabilities, 5 , 380-388.
Cunningham, J.D., Gerald, H., & Miller, N. (1978). Effects of success and failure on children's perception of internal-external locus of control. Social Behavior and Personality, 6, 1-9.
D'Angelo, J. (1983). The microprocessor as pencil. AEDS Monitor, November, 1979, Association of Educational Data Systems. In D. Harper, & J. Stewart (Eds.), Run: Computer Education. Monterey, CA: Brooks/Cole Pub. Co.
Davis, G. (1973). Psychology of problem solving. New York: Basic Books Pub.

110
Diener, C., & Dweck, C. (1978). An analysis of learned helplessness: Continuous changes in performance, strategy, and achievement cognitions following failure. Journal of Personality and Social Psychology, 36, 451-462.
Dowling, D. (1978). The development of a mathematics confidence scale and its application in the study of confidence in women college students. Unpublished doctor-al dissertation, Ohio State University, Columbus.
Dudley-Marling, D., Snider, V., & Tarver, S. (1982). Locus of control and learning disabilities: A review and discussion. Perceptual and Motor Skills, 54, 503-514.
Dweck, C. (1975). The role of expectations and attributions in the alleviation of learned helplessness. Journal of Personality and Social Psychology, 31, 674-685.
Dweck, C., & Repucci, N. (1973). Learned helplessness and reinforcement responsibility in children. Journal of Personality and Social Psychology, 25, 109-116.
Elkind, D. (1961). Quantity conceptions in junior and senior high school students. Child Development, 32, 551-560.
Englemann, S., & Englemann, T. (1968). Give your child a superior mind. New York: Simon & Schuster.
Englemann, S. (1969). Preventing failure in the primary grades. Chicago: Science Research Associates.
Euchner, C. (1983, November 23). Debate grows on LOGO'S effect in thinking skills. Education Week, pp. 10, 15.
Evans, R. (1972). A study of the reliabilities of four arithmetic attitude scales and an investigation of component mathematics attitudes (Doctoral dissertation. Case Western Reserve University, 1971) Dissertation Abstracts International, 32, 5337A. (University Microfilms No. 70-10,932)
Federal Register. (1977, December). Procedures for evalu-evaluating specific learning disabilities. Washington, D.C: Department of Health, Education, and Welfare.
Fennema, E., & Sherman, J. (1976). Fennema-Sherman mathe-

Ill
matics attitudes scales. Washington: American Psychological Association.
Forehand, G. (1966). Epilogue: Constructs for problem-solving research. In Benjamin Kleinmuntz (Ed.) Problem Solving, Research, Method, and Theory. New York: John Wiley & Sons.
Fraenkel, J. (1973). Helping students think and value: Strategies for teaching the social studies. Englewood Cliffs, NJ: Prentice-Hall.
Furth, H. (1984, February). Piaget's key concepts. Presented at the 32nd Annual M. Don Ryan Symposium, at Texas Woman's University, Department of Communication Sciences, Denton, TX.
Gearheart, B.R. (1981). Learning disabilities educational strategies. St. Louis: The C.V. Mosby Co.
Geoffrion, L., & Goldenberg, E. (1981). Computer-based exploratory learning systems for communication-handicapped children. The Journal of Special Education, 15, 325-332.
Gorman, H. (1982). Learning to think by learning Logo: Rule learning in third grade computer programmers. Unpublished manuscript, Austin College, Sherman,TX.
Hallahan, D., & Kauffman, J. (1982). Exceptional children introduction to special education. Englewood Cliffs, NJ: Prentice-Hall, Inc.
Hannaford, A., & Taber, F. (1982). Microcomputer software for the handicapped: Development and evaluation. Exceptional Children, 49, 137-142.
Havertape, J., & Kass, C. (1978). Examination of problem-solving in learning disabled adolescents through verbalized self-instructions. Learning Disability Quarterly, ] , 94-99.
Hawkins, J., Sheingold, K., Gearhart, M., Berger, C. (1982). Microcomputers in schools: Impact on the social life of elementary classrooms. Journal of Applied Developmental Psychology, 3_, 361-373.
Henker, B., Whalen, C., & Hinshaw, S. (1980). The attributional contexts of cognitive intervention strategies. Exceptional Education Quarterly, ] , 17-30.

112
Hill. w. (1977). Learning: A survey of psychological interpretations. San Francisco: Harper & Row.
Houck, C , Todd, R. , Barnes, D., & Englehard, J. (1980). LD and math: Is it the math or the child? Academic Therapy, 15 , 557-570.
Inhelder, B., & Piaget, J. (1957). The growth of logical thinking: From childhood to adolescence. New York: Basic Books.
Inhelder, B., & Piaget, J. (1975). The origin of the idea of chance in children. New York: N.W. Norton and Company.
Johns Hopkins University. (1983, April). School uses of microcomputers. (Report No. 1). Baltimore, MD: Center for Social Organization of Schools.
Johnson, J., & Myklebust, H. (1967). Learning disabil-ties: Educational principles and practices. New York: Grune & Stratton.
Johnson, D. (1972). The Psychology of thought and judgment . New York: Harper.
Kamili, C., & Dermon, L. (1972). The Englemann approach to teaching logical thinking: Findings from the administration of some Piagetian tasks. In D.R. Green, M.P. Ford, & G. Flamer (Eds.), Piaget and Measurement. New York: McGraw-Hill.
Kane, J. (1979). A comparison of learning disabled children with learning disabled adolescents relative to non-learning disabled peers in terms of selected achievement, affective and behavioral variables. Ann Arbor, MI: The Johns Hopkins University.
Keating, D.P. (1980). Thinking processes in adolescence. In J. Adelson (Ed.), Handbook of Adolescent Psychology. New York: Wiley.
Kellam-Scott, B. (1983). Papert reflects on Logo past and future. Teaching, Learning, Computing, 1 , 81-82.
Kifer, E. (1975). Relationships between academic achievement and personality characteristics: A quasi-longitudinal study. American Educational Research Journal, 12, 191-210.
113
Kirk, S. (1981). Learning disabilities: A historical note. Academic Therapy, 17, (1), 5-11.
Kirk, S., Sc Gallagher, J. (1983). Educating exceptional children. Dallas: Houghton Mifflin.
Kleinman, G., Humphrey, M., & Lindsay, P. (1981, March). Microcomputers and hyperactive children. Creative Computing Magazine, 19-27.
Koppitz, E. (1971). Children with learning disabilities: A five year follow-up study. New York: Grune & Stratton.
Kulik, J. (1983, September). Synthesis of research on computer-based instruction. Educational Leadership, 19-21.
Kurland, D., & Pea, R. (1983, May). Children's mental models of recursive Logo programs. Proceedings of the Fifth Annual Cognitive Science Society, Rochester, N.Y.
Lamplighter Teachers. (1981, September). Learning with Logo at the Lamplighter school. Microcomputing, 42-47.
Lawson, A. (1978). The development and validation of a Classroom Test of Formal Reasoning. Journal of Research in Science Teaching, 15, 11-24.
Lefcourt, H. (1976). Locus of control: Current trends in theory and research. Hillsdale, N.J.: Erlsbaum.
Lester, F. (1982). A procedure for studying the cognitive processes used during problem solving. Journal of Experimental Education, 48, 323-327.
Maddux, C , & Johnson, D. (1983). Microcomputers in LD: Boon or boondoggle? Academic Therapy, 19, 113-124.
Maddux, C. (1984, January). Using microcomputers with the learning disabled: Will the potential be realized? Educational Computer, 31-32.
McDonald, A.J. (1973). Internal-external locus of control. In J. Robinson, P. Shaver (Eds.), Measure of Social-psychological Attitudes. Ann Arbor, MI: University of Michigan, Institute for Social Research.

114
McGhee, P., & Crandall, V. (1968). Beliefs in internal-external control of reinforcement and academic performance. Child Development, 39, 91-102.
Meehl, P.E. (1978). The dynamics of "structured" personality tests. In D.N. Jackson and S. Messick (Eds.) Problems in Human Assessment. Huntington, NY: Robert E. Krieger Pub. Co.
Mercer, C , Forgone, C , & Wolking, W. (1976). Definitions of learning disabilities used in the United States. Journal of Learning Disabilities 1976, 9^, 376-385.
Merrifield, P., Guilford, J., Christensen, P., & Frick, J. (1960). A factor-analytic study of problem solving abilities. (Report No. 22). Los Angeles: The University of Southern California, The Psychological Laboratory.
Messer, S. (1972). The relation of internal-external control to academic performance. Child Development, 43, 1456-1462.
Myers, P.I., & Hammill, D.D. (1976). Methods for learning disorders. New York: John Wiley & Sons, Inc.
Nadel, C. & Schoeppe, A. (1973). Conservation of mass, weight and volume as evidenced by adolescent girls in the eighth grade. Journal of Genetic Psychology, 122, 309-313.
Neale, D. (1969). The role of attitudes in learning mathematics. Arithmetic Teacher, 16, 631-640.
Newell, A., & Simon, H. (1972). Human problem solving. Englewood Cliffs, NJ: Prentice-Hall, Inc.
Nicholls, J.G. (1978). The devleopment of the concepts of effort and ability, perception of academic attainment, and the understanding that difficult tasks require more ability. Child Development, 49, 800-814.
Olds, H. (1981, September). Through a new looking glass. Microcomputing, 62-74.
Papert, S. (1980). Mindstorms. New York: Basic Books.
Pea R. (I9B3). Logo programming and problem solving.

115
Paper presented at meeting of AERA. Montreal.
Pea, R., & Kurland, D.M. (1983). Logo programming and the development of planning skills (Report No. TR-16). New York, NY: Bank Street College of Education, Center for Children and Technology.
Pearl, R. , Bryan, T., & Donahue, M. (1980). Learning disabled children's attributions for success and failure. Learning Disability Quarterly, 3_, 3-9.
Phares, E. (1976). Locus of control in personality. Mor-ristown, NJ: General Learning Press.
Piaget, J. (1952). The origins of intelligence in children . New York: International Universities Press.
Piaget, J. (1966). Foreward. In M. Almy, E. Chittenden, & P. Miller, Young Children's Thinking: Studies of Some Aspects- of Piaget's Theory. New York: Teachers College Press .
Polya, G. (1957). How to solve it. Garden City, N.Y.: Doubleday and Company, Inc.
Ragan, A. (1982).The miracle worker how computers help handicapped students. Electronic Learning, 3 , pp. 57-58; 83.
Reger, R. (1979). Learning disabilities: Futile attempts at simplistic definition. Journal of Learning Disabilities, 12, 529-532.
Reisman, F. (1983). A guide to the diagnostic teaching of arithmetic. Columbus, OH: Charles E. Merrill Pub. Co.
Reyes, L. (1980). Attitudes and mathematics. In Mary M. Lindquist (Ed.) Selected Issues in Mathematics Educa-tion. Berkley: McCutchan Pub. Corp.
Roadrangka, \l. , Yeany, R. , & Padilla, M. (1982). Group Assessment of Logical Thinking. Athens, GA: University of Georgia.
Roadrangka, V., Yeany, R., & Padilla, M. (1983, April). The construction and validation of group assessment of logical thinking (GALT). Paper presented at meeting of the National Association For Research in Science Teaching, Dallas, TX.

116
Rotter, J. (1966). Generalized expectancies for internal versus external control of reinforcement. Psychological Monographs, 80( whole no. 609).
Sarason, S., Davidson, K., Lighthall, F., Waite, R., & Ruebush, B. (1960). Anxiety in elementary school children. New York: Wiley & Sons.
Scandura, J. (1977). Problem solving: A structural/ process approach with instructional implications. New York: Academic Press.
Schiffman, G., Tobin, D., & Buchanan, B. (1982). Microcomputer instruction for the learning disabled. Journal of Learning Disabilities, 15, 557-559.
Schwartz, L., & Oseroff, A. (1975). The clinical teacher for special education. (Final Report, Volume 2) Washington, D.C: U.S. Department of Health, Education, and Welfare.
Shaw, R.L., & Uhl, N.P. (1971). Control of reinforcement and academic achievement. Journal of Educational Research, 64, 226-228.
Sherman, J., & Fennema, E. (1977). The study of mathematics by high school girls and boys: Related variables . American Educational Research Journal, 14, 159-168.
Spickerman, W. (1970). A study of the relationships between attitudes toward mathematics and some selected pupil characteristics in a Kentucky high school (Doctoral dissertation. University of Kentucky, 1968). Dissertation Abstracts International, 30, 2733A. (University Microfilms, No. 70-311).
Statz, J. (1973). The development of computer programming concepts and problem-solving abilities among ten-year olds learning Logo. Unpublished doctoral dissertation, Syracuse University, Syracuse, NY.
Szetela, W. (1973). The effects of test anxiety and success-failure on mathematics performance in grade eight. Unpublished doctoral dissertation. University of Georgia, Athens.
Texas Education Agency. (1983). State board of education

117
rules for handicapped students. Austin: Texas Education Agency, Dept. of Special Education, 1983.
Thorkildsen, R. , Allard, K., & Reid, B. (1983). The interactive videodisc for special education project: Providing CAI for the mentally retarded. The Computing Teacher, 10, 73-76.
Tobin, K., & Capie, W. (1980, April). The development and validation of a group test of logical thinking. A paper presented at the annual meeting of American Educational Research Association, Boston: Massachusetts.
Tomlinson-Keasey, C. (1972). Formal operations in females from eleven to fifty-four years of age. Developmental Psychology, £, 364.
Watt, D. (1979). A comparison of the problem solving styles of two students learning a computer language for children. Creative Computing, 5 , (2), 86-91.
Watt, D. (1982, August). Logo in the schools. Byte, 116-134.
Watt, D. (1984). Computer literacy. Popular Computing, 3^, (5), 75-78.
Weir, S. (1981, September). Logo and the exceptional child. Microcomputing, 76-84.
Weir, S., Russell, S., & Valente, J. (1982, September). Logo: An approach to educating disabled children. Byte, 342-347.
Williams, J., Thorkildsen, R., & Grossman, E. (1983). Applications of computers to the needs of handicapped persons. In Dennis O. Harper & James. H. Stewart (Eds.) Run: Computer Education. Monterey, CA: Brooks/ Cole Publishing Company.
Wold, A. (1983). What is a programming language? Class-room Computer News, 3_, (5), 46-49.
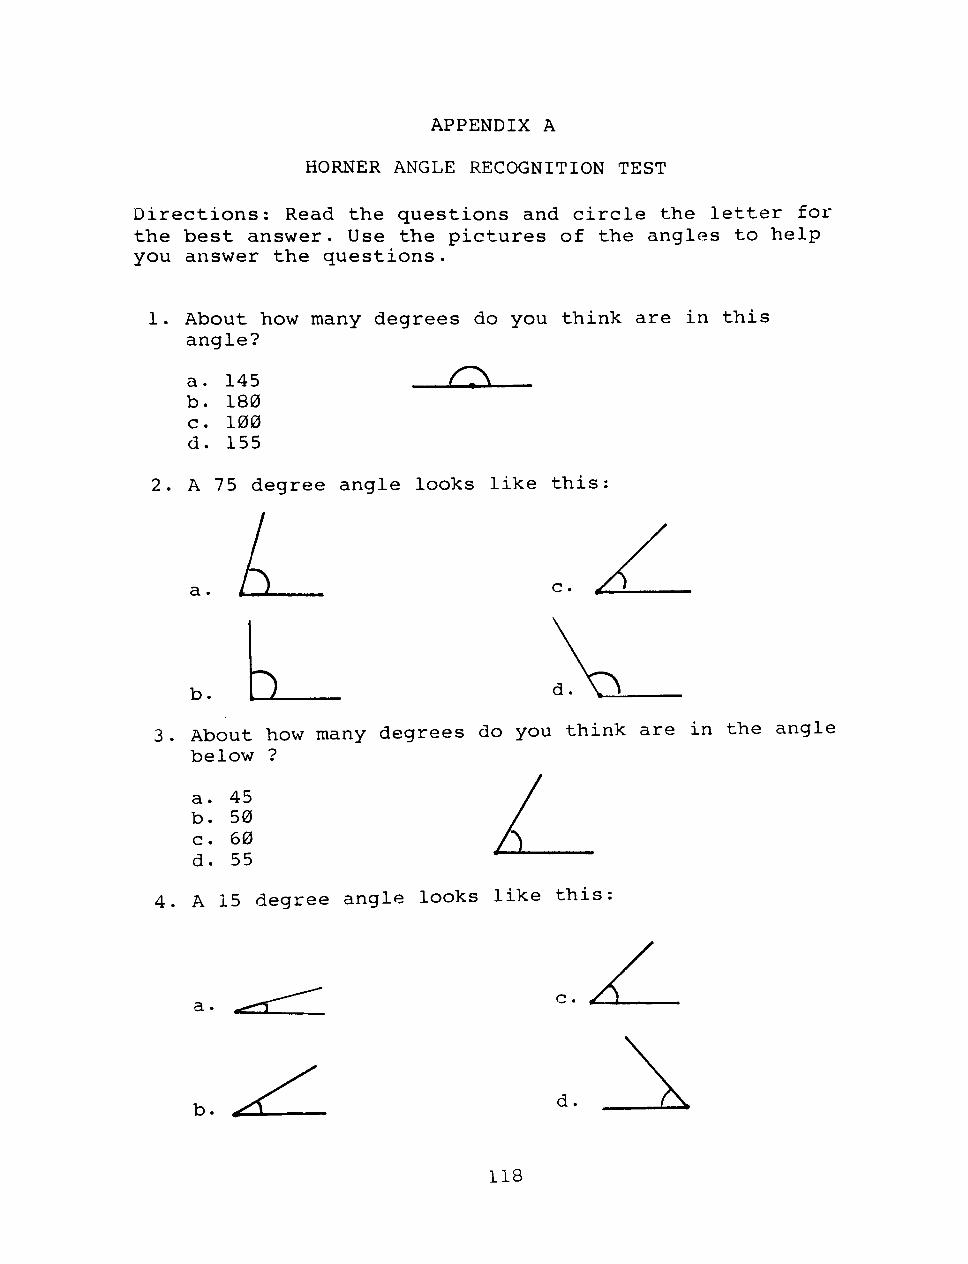
APPENDIX A
HORNER ANGLE RECOGNITION TEST
Directions: Read the questions and circle the letter for the best answer. Use the pictures of the angles to help you answer the questions.
1. About how many degrees do you think are in this angle?
r7\ a . b . c . d .
145 180 100 155
2. A 75 degree angle looks like this:
a.
b. Q 3. About how many degrees do you think are in the angle
below ?
a. 45 b. 50 c. 60 d. 55
4. A 15 degree angle looks like this
a.
b.
118

119
5. The angle below can be made from which two angles?
a. ti . ^ A
b. k_ . /
6. If you took 45 degrees from a 75 degree angle, the new angle would look like:
a. c.
b. d. ^
7. About how many degrees do you think are in the angle below?
a. 120 b. 105 c. 145 d. 95
8. An 80 degree angle looks like this
a. jOl
. a d.

120
9. About how many degrees do you think are in the angle below?
a. 45 degrees b. 55 degrees c. 35 degrees d. 15 degrees
10. About how many degrees do you think are in the angle below?
a. 45 degrees b. 55 degrrees c. 60 degrees d. 70 degrees
II. A 40 degree angle looks like this
c.
b. d.
12. A 60 degree angle looks like this
a. c.
b.
For questions 13, 14, 15, and 16 how many degrees are in the outside angle. Look at the direction of the arrov/.
13. How many degrees are there in the outside angle?
a. 200 degrees b. 100 degrees c. 250 degrees d. 90 degrees

121
14. How many degrees are there in the outside angle?
a. 45 degrees b. 315 degrees c. 360 degrees d. 90 degrees
15. How many degrees are there in the outside angle?
a. 200 degrees b. 300 degrees c. 190 degrees d. 270 degrees &
16. How many degrees are there in the outside angle?
a. 180 degrees b. 260 degrees c. 345 degrees d. 290 degrees
17. Which outside angle is about 190 degrees?
a. c.
b. d. (h 18. Which outside angle is about 290 degrees?
a.
b.

122
19. Which outside angle is about 345 degrees?
c.
20.
d.
Which angle is made when the two angles below are put together?
. / c.
d. - \
21. Which two angles make the angle below ?
.:L^ . z 'o.
V 22. If you put the two angles below together, about how
many degrees would the new angle have?
a. 60 degrees b. 90 degrees c. 100 degrees d. 45 degrees
23. The angle below can be divided into a 45 degree angle and a ? degree angle.
a. b. c. d.
30 50 45 15 h

123
24. This angle can be divided into a 90 degree angle and a ? degree angle.
a. 30 b. 20 G. 15 d. 40
25. Which angle is made when the two angles below are put together?
a. c.
b. d.
26. Which angle is made when the angles below are added together?
• A c.
27. If you put these two angles together, about how many degrees would the new angle have?
a. 360 degrees b. 145 degrees c. 100 degrees d. 180 degrees ^ H
28. If you put these two angles together, about how many degrees would the new angle have?
a. 60 degrees b. 45 degrees c. 90 degrees d. 30 degrees

124
APPENDIX B
LOGO CURRICULUM*
Students will successfully demonstrate for the teacher
the following objectives. An activity sheet accompanies
each objective.
I. Students will learn to turn on the system and
insert the Logo cartridge (Activity Sheet 1).
II. Students will learn and use primitive commands
(Activity Sheet 2).
A. FORWARD or FD
B. BACK or BK
C. RIGHT or RT
D. LEFT or LT
E. The primitive commands need numbers after them
to tell the turtle how many steps or how many
degrees to turn.
F. Every time a command is typed, ENTER must be
pressed.
*Compiled from the following sources:
Bearden, J., Jim Muller Young Peoples' LOGO Association, & Martin, K. (1982). The Turtle's Sourcebook. Richardson, TX: Young Peoples' LOGO Association.
Mass, L., Kuffler, J., Rubin, M., Toll, D. (1983). Kids Working With Computers. New York: Trillium Press.
Musha, D.R. (1981). TI LOGO. Lubbock,TX: Texas. Instruments.

125
G. Other commands
1. HOME—The turtle will return to the middle
of the screen when this is typed
2. CLEARSCREEN or CS~Type this to clear the
screen and start over.
III. Students will be able to tell in which direction
the turtle is heading (Activity Sheet 3).
Suggestion: Have students think of the screen as
a compass.
iV. Students will be able to change the background
color of the screen and the pen color
(Activity 4) .
V. Students will learn and use the following
commands: (Activity 5)
A. PENUP or PU—Type this to move the turtle
without drawing lines.
B. PENDOWN or PD—Type this after you move the
turtle and you want him to draw again.
C. PENERASE or PE—Type this to erase one line
without erasing the whole drawing.
D. PENREVERSE or PR—When the Turtle crosses or
covers a line it has drawn, it can erase that
part of the line. At the same time, it draws a
line where one hasn't been drawn before.(type
PENDOV^ to draw normally again).

126
E. HIDETURTLE or HT—Type this if you don't want
to see the Turtle drawing.
F. SHOWTURTLE or ST~Type this when you want to
see the turtle again.
VI. Students will demonstrate an understanding of the
following messages:
A. TELL ME MORE—This message appears if primi
tive commands are typed without telling the
turtle how much.
B. TELL ME HOW TO—This message appears if a
mistake is made.
C. OUT OF INK—This message appears when the
turtle cannot draw anymore. Clear the screen,
and give the Turtle new commands.
VII. Students will be able to write a program to draw
a square (Activity Sheet 6).
VIII. Students will learn and use the REPEAT command
(Activity 7).
REPEAT is a shortcut. It must be followed by a
space and a number that tells the Turtle how many
times to repeat the command inside the brackets.
IX. Students will draw specified designs which
incorporate squares and the REPEAT command
(Activity Sheet 8).
X. Students will learn how to write a procedure

127
(Activity Sheet 9).
A procedure is a program which teaches the com
puter a new command. To do this the word TO must
be typed along with a title for the program.
Press ENTER. For example, to teach the computer
to draw a square, the title could be SQUARE). Now
the computer is in the program mode. Type in the
correct commands to get the desired result, l- en
the commands are typed in, press FCTN 9 (BACK).
XI. Students will write a procedure to draw a flag
(Activity Sheet 10).
XII. Students will write a procedure to draw a wind
mill which uses the Flag procedure (Activity
Sheet 10).
XIII. Students will write a procedure to draw a pin-
wheel using the windmill procedure (Activity
Sheet 10).
XIV. Students will write procedures to draw different
designs using squares (Activity Sheet 11).
XV. Students will learn to draw a triangle (Activity
Sheet 12).
XVI. Students will learn to draw a triangle using the
repeat command (Activity Sheet 12).
XVII. Students will write a procedure to draw a tri
angle (Activity Sheet 13).
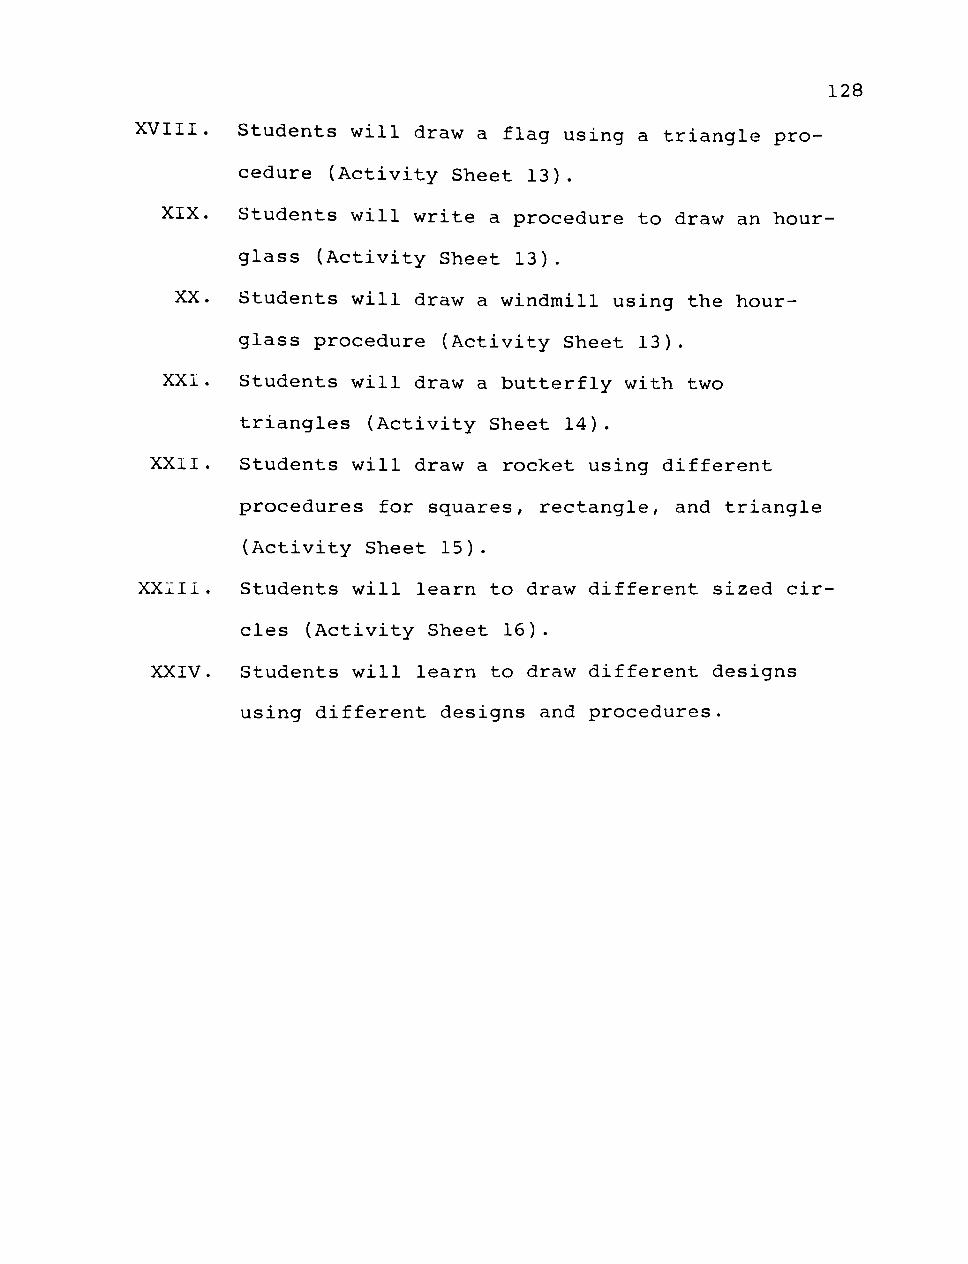
128
XVIII. Students will draw a flag using a triangle pro
cedure (Activity Sheet 13).
XIX. Students will write a procedure to draw an hour
glass (Activity Sheet 13).
XX. Students will draw a windmill using the hour
glass procedure (Activity Sheet 13).
XXI. Students will draw a butterfly with two
triangles (Activity Sheet 14).
XXII. Students will draw a rocket using different
procedures for squares, rectangle, and triangle
(Activity Sheet 15).
XXIII. Students will learn to draw different sized cir
cles (Activity Sheet 16).
XXIV. Students will learn to draw different designs
using different designs and procedures.
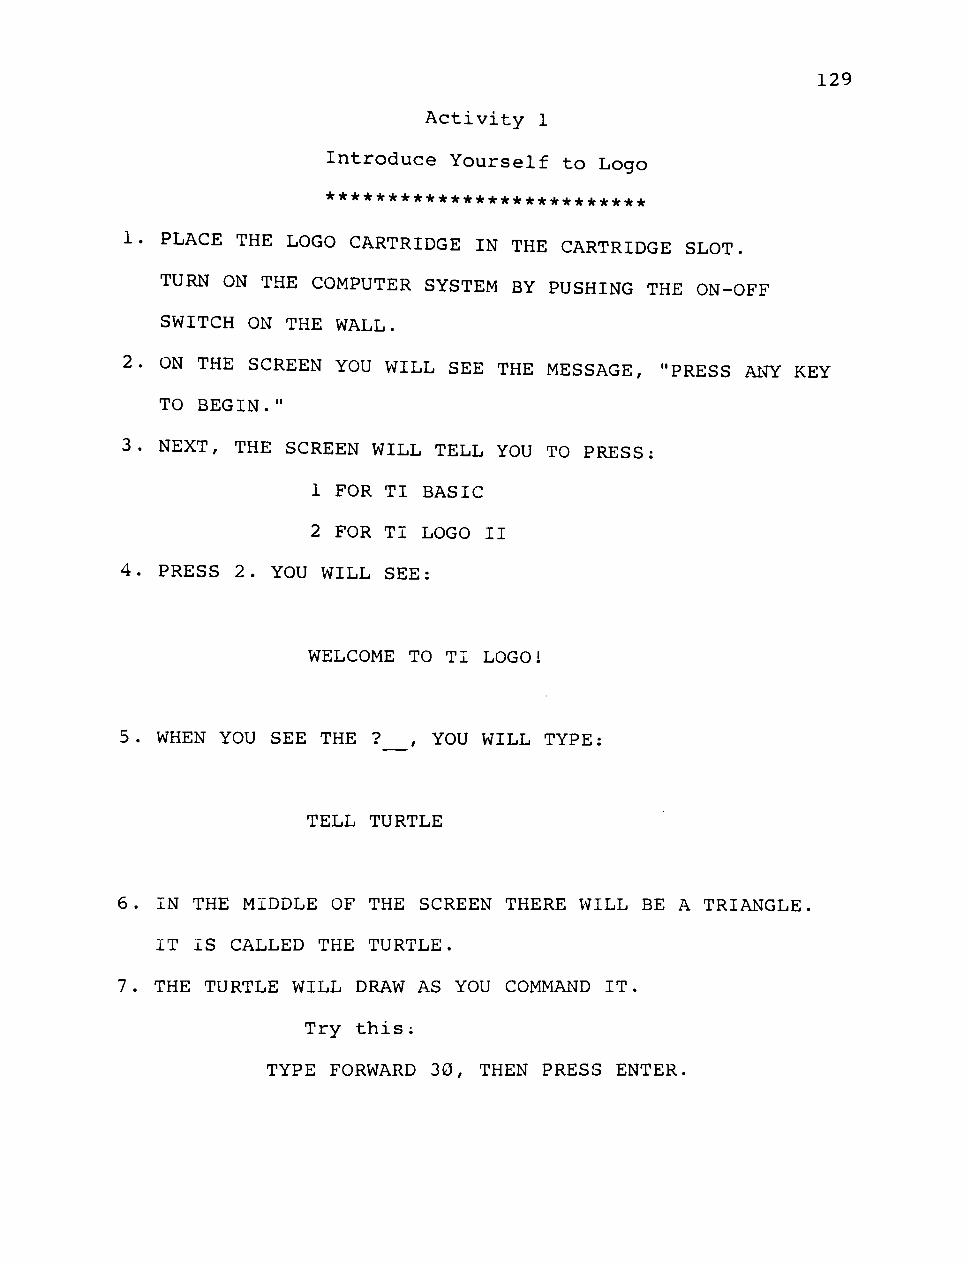
129
Activity 1
Introduce Yourself to Logo
* * * * * * * * * * * * * * * * * * * * * * * * * *
1. PLACE THE LOGO CARTRIDGE IN THE CARTRIDGE SLOT.
TURN ON THE COMPUTER SYSTEM BY PUSHING THE ON-OFF
SWITCH ON THE WALL.
2. ON THE SCREEN YOU WILL SEE THE MESSAGE, "PRESS Al^ KEY
TO BEGIN."
3. NEXT, THE SCREEN WILL TELL YOU TO PRESS:
1 FOR TI BASIC
2 FOR TI LOGO II
4. PRESS 2. YOU WILL SEE:
WELCOME TO TI LOGO 1
5. WHEN YOU SEE THE ? , YOU WILL TYPE
TELL TURTLE
6. IN THE MIDDLE OF THE SCREEN THERE WILL BE A TRIANGLE
IT IS CALLED THE TURTLE.
7. THE TURTLE WILL DRAW AS YOU COMMAND IT.
Try this:
TYPE FORWARD 30, THEN PRESS ENTER.

130
Activity 2
COMMANDS
* * * * * * * *
TALK TO THE TURTLE. YOU CAN GIVE IT COMMANDS (YOU'RE THE
BOSS). FOUR IMPORTANT ONES ARE:
FORWARD—FD
BACK ~ BK
RIGHT— RT
LEFT— LT
EACH COMMAND MUST HAVE A NUMBER AFTER IT SO THE TURTLE
WILL KNOW HOW MUCH TO MOVE. FOR EXAMPLE, IF YOU TYPE FD
100 THE TURTLE WILL MOVE FORWARD 100 TURTLE STEPS.
TWO MORE IMPORTANT COMMANDS TO REMEMBER...
HOME—WHEN YOU TYPE THIS THE TURTLE RETURNS TO THE
MIDDLE OF THE SCREEN.
CLEARSCREEN—TYPE THIS TO ERASE THE SCREEN AND
START OVER

131
Activity 3
THINK ABOUT A COMPASS
* * * * * * * * * * * * * * * * * * * * *
THINK OF THE COMPUTER SCREEN AS A COMPASS. THE TOP IS
NORTH. RIGHT IS EAST. THE BOTTOM IS SOUTH. LEFT IS WEST.
YOU CAN TELL WHICH WAY THE TURTiE IS HEADING BY LOOKING
AT THE TOP POINT OF THE TRIANGLE. THE TURTLE ALWAYS FACES
NORTH AFTER YOU TYPE TELL TURTLE AND PRESS THE ENTER KEY.
IF YOU TYPE FD 10 AND PRESS ENTER, THE TURTLE WILL LEAVE
A LINE 10 STEPS LONG AS IT MOVES 10 STEPS NORTH. IF YOU
TYPE RIGHT 90 AND PRESS ENTER, THE TURTLE WILL TURN TO
FACE EAST BUT IT DOESN'T TAKE ANY STEPS. BY TYPING BACK
30 AND PRESSING ENTER THE TURTLE WILL KEEP FACING EAST
BUT WILL MOVE BACKWARDS! AS IT MOVES BACK IT WILL DRAW A
LINE 30 STEPS LONG.
X
^—6 (S
e?

132
Activity 4
TURTLE COLORS
* * * * * * * * * * * * *
IF YOU WANT TO BE CREATIVE, YOU CAI CHANGE THE COLOR OF
THE SCREEN AND THE PEN COLOR. THESE ARE THE COMMANDS:
CB—COLOR OF BACKGROUND
SC—SET PEN COLOR
THE FOLLOWING ARE CODE IWMBERS FOR THE DIFFERENT COLORS
0—CLEAR
1—BLACK
2—GREEN
3—LIME
4 — BLUE
5 —SKY
6 — RED
7—CYAN
8—RUST
9—ORANGE
10—YELLOW
11—LEMON
12—OLIVE
13—PURPLE
14—GRAY
15—WHITE

133
Activity 5
MORE COMMANDS...
* * * * * * * * * * * * * * * * * * * *
PENUP (PU) IF YOU WANT TO MOVE THE TURTLE WITHOUT
DRAWING LINES .
PENDOWN (PD) TYPE THIS AFTER YOU MOVE THE TURTLE AND
YOU V7ANT IT TO DRAW AGAIN.
PENERASE(PE) IF YOU MAKE A MISTAKE, YOU CAN ERASE IT
BY TYPING PENERASE AND TELLING THE
TURTLE TO DRAW OVER THE LINE.
PENREVERSE(PR) WHEN THE TURTLE CROSSES OR COVERS A
LINE IT HAS DRAWN, IT CAN ERASE THAT
PART OF THE LINE. AT THE SAME TIME, IT
DRAWS A LINE WHERE ONE HASN'T BEEN
DRAWN BEFORE. TYPE PENDOVfl TO DRAW
NORMALLY AGAIN.
HIDETURTLE (HT) TYPE THIS IF YOU DON'T WANT TO SEE THE
TURTLE DRAWING. PRESS ENTER. YOU CAN'T
SEE THE TURTLE, BUT YOU CAN STILL GIVE
IT COMMANDS. YOU CAN SEE THE LINES IT
DRAWS BUT NOT THE TURTLE.
SHOWTURTLE (ST) TYPE THIS WHEN YOU WANT TO SEE THE
TURTLE AGAIN. PRESS ENTER.

134
Activity 6
SQUARE ONE
* * * * * * * * * *
IF !>rOU WERE THE TURTLE HOW WOULD YOU DRAW A SQUARE? SINCE
WE NEED TO DECIDE OUT HOW MUCH TO TURN TO MAKE A SQUARE
CORNER, KEEP THE FD NUMBER THE SAME EACH TIME AND JUST
CHANGE THE RT NUMBER.
FD 50
RT _
FD 50
DOES IT LOOK LIKE A SQUARE CORNER? IF IT DOESN'T, CLEAR
YOUR SCREEN AND TRY AGAIN. WRITE DOWN THE NUMBERS YOU TRY
AND WHETHER THEY WERE TOO BIG (TURNED TOO MUCH) OR TOO
SMALL (DIDN'T TURN ENOUGH).

135
Activity 7
REPEAT COMMAND
* * * * * * * * * * * * * *
IF YOU WANT THE TURTLE TO DO THE SAME THING SEVERAL
TIMES, YOU DON'T HAVE TO TYPE IT AGAIN AND AGAIN. YOU CAN
USE A SHORTCUT —THE REPEAT COMMAND.
FIRST TELL THE TURTLE HOW MANY TIMES TO REPEAT:
REPEAT 4
THEN YOU GIVE IT THE COMMANDS YOU WANT REPEATED IN
BRACKETS
REPEAT 4 [FD 50 RT 90]
TO PRINT BRACKETS THIS IS WHAT YOU DO:
PRESS THE FNCT KEY AND R FOR [
AND FNCT KEY AND T FOR ]
PRACTICE REPEAT ....
DRAW A SQUARE USING REPEAT. WRITE THE COMMANDS YOU USED

136
Activity 8
MORE SQUARES
* * * * * * * * * * * *
WHEN YOU ARE DRAWING, THERE ARE TIMES YOU MIGHT LIKE THE
TURTLE TO DISAPPEAR. FOR EXAMPLE, YOU MIGHT WANT A SQUARE
WITHOUT A LITTLE TRIANGLE IN THE CORNER. USE THE COMMAND:
HIDETURTLE OR HT
TO SEE THE TURTLE AGAIN TYPE;
SHOWTURTLE OR ST
DRAW FOUR SQUARES IN A ROW AND WRITE DOWN THE COMMANDS
DRAW TWO SQUARES ON TOP OF TWO OTHER SQUARES. V7RITE DOWN
THE COMMANDS YOU WOULD USE
TRY THESE SQUARES::::::: • • • •
D D D

137
Activity 9
TURTLE PROCEDURES
* * * * * * * * * * * * * * * * *
YOU CAN TEACH THE TURTLE NEW COMMANDS. YOU WRITE A
PROCEDURE (A PROGRAM). THIS IS HOW TO DO IT.
1. DECIDE WHAT YOU WANT THE TURTLE TO DO.
FOR PRACTICE LET'S TEACH THE TURTLE HOW TO DRAW
A SQUARE.
2. FIRST, TYPE THE WORD TO. THEN TYPE A TITLE FOR
THE PROCEDURE. LET'S CALL OURS SQUARE.
YOU V7ILL TYPE TO SQUARE
WHAT HAPPENED TO THE COLOR OF THE SCREEN????
IT TURNED GREEN. THAT MEANS IT IS IN THE PROGRAM
MODE.
3. TYPE IN THE COMMANDS TO DRAW A SQUARE.
4. WHEN YOU ARE ARE FINISHED TYPING THE COMMANDS, DO
NOT PRESS ENTER. PRESS FNCT 9 (BACK).
5. ONCE YOU HAVE DEFINED A PROCEDURE, YOU CANNOT USE
THAT NAME FOR A DIFFERENT SQUARE UNLESS YOU ERASE
THE MEMORY. TO ERASE THE MEMORY TYPE ERASE SQUARE
(THE TITLE)
6. NOW YOU CAN GIVE THE NEW COMMAND, SQUARE. WATCH
THE TURTLE DRAW A SQUARE 1
EXPERIMENT WITH OTHER PROCEDURES.

138
Activity 10
SQUARES WORKSHEET
* * * * * * * * * * * * * * * * * *
DRAW A FLAG. WRITE DOWN THE COMMANDS YOU WOULD USE TO
DRAW A FLAG. NEXT, WRITE A FLAG PROCEDURE.
DRAW WINDMILL. USE THE FLAG PROCEDURE TO DRAW A WINDMILL
NEXT, WRITE A WINDMILL PROCEDURE.
DRAW A PINWHEEL. USE THE WINDMILL PROCEDURE TO DRAW A
PINWHEEL. NEXT WRITE A PINWHEEL PROCEDURE.

139
Activity 11
PICTURE THESE SQUARES
* * * * * * * * * * * * * * * * * * * * *
LOOK AT THE DIFFERENT PICTURES MADE WITH SQUARES. WRITE A
PROCEDURE TO DRAW ONE OR MORE OF THEM. IF YOU LIKE, MAKE
UP YOUR OWN PICTURE AND ADD YOURS TO THE COLLECTION OF
SQUARES.
o
FANCY SQUARES
* * * * * * * * * * * * *
THESE SQUARES MIGHT TICKLE YOUR FANCY !!!
4
• •

140
Activity 12
TRIANGLES
* * * * * * * * *
TRY TO FIGURE OUT HOW TO DRAW A TRIANGLE. TYPE IN THE
FOLLOWING COMMANDS. THE RT NUMBERS HAVE BEEN LEFT BLANK.
EXPERIMENT TO SEE WHAT NUMBER YOU SHOULD USE. USE THE
SAME NUMBER FOR BOTH RIGHT TURNS.
WRITE DOWN THE NUMBERS YOU TRY. IF THE NUMBERS ARE TOO
BIG,THE THIRD LINE WILL CROSS THE FIRST. IF THEY'RE TOO
SMALL, THE THIRD LINE WON'T MEET THE FIRST.
FD 50
RT
FD 50 (Use the same number for both turns)
RT
FD 50
THE ANSWER IS
WRITE A PROCEDURE FOR A TRIANGLE USING THE REPEAT
COMMAND.
REPEAT [FD RT ]

Activity 13
DRAW WITH TRIANGLES
* * * * * * * * * * * * * * * * * * *
141
1. DRAW A FLAG.
>
2. WRITE A PROCEDURE TO DRAW AN HOURGLASS.
3. DRAW A WINDMILL. USE YOUR HOURGLASS PROCEDURE TO DRAW
A WINDMILL.
4. PUT TWO TRIANGLES TOGETHER TO MAKE A DIAMOND

142
Activity 14
BUTTERFLY
* * * * * * * * *
WITH TWO TRIANGLES YOU CAN DRAW A BUTTERFLY. TO GET YOU
STARTED, TYPE IN THESE COMMANDS:
RT 60
FD 50
RT 120
NOW, YOU FINISH IT!
OR YOU CAN MAKE A DIFFERENT KIND OF BUTTERFLY.

143
Activity 15
BLAST OFF i1 i
* * * * * * * * * * * *
CREATE A ROCKET USING DIFFERENT PROCEDURES. DON'T FORGET
TO WRITE DOWN THE COMMANDS.

144
Activity 16
MAKE A CIRCLE
* * * * * * * * * * * * *
TRY TO FIGURE OUT THE MISSING NUMBER IN THIS CIRCLE
COMMAND:
REPEAT [FD 1 RT ]
FIRST TRY A NUMBER. IF IT'S NOT ENOUGH KEEP ADDING TO IT
UNTIL YOU MAKE A COMPLETE CIRCLE. WRITE DOWN THE NUMBERS
YOU USE.
THE ANSWER IS
N0V7 SEE WHAT HAPPENS IF YOU CHANGE ONE OF THE NUMBERS IN
THE PROCEDURE. TRY TO FIGURE OUT THE MISSING NUMBERS IN
THESE CIRCLE COMMANDS:
REPEAT 180 [FD 1 RT _
REPEAT 72 [FD 1 RT _
REPEAT 10 [FD 1 RT _
REPEAT [FD 1 RT 4
REPEAT 36 [FD 1 RT
WHAT HAPPENS TO THE SIZE OF THE CIRCLE AS YOU CHANGE THE
AMOUNT THE TURTLE TURNS EACH TIME. AS THE RT NUMBER GETS
BIGGER, THE CIRCLE GETS

145
Activity 17
CIRCLE PROCEDURES
* * * * * * * * * * * * * * * * *
DRAW A SLINKY. WRITE DOWN THE COMMANDS YOU USE. WRITE A
PROCEDURE AND NAME IT SLINKY.
CHANGE THE SLINKY PROCEDURE TO MAKE A CURVED SLINKY.
WRITE DOWN THE COMMANDS. WRITE A PROCEDURE.
USE THE CURVED SLINKY TO DRAW A DONUT. WRITE DOWN THE
COMMANDS
USE DIFFERENT SIZES OF CIRCLES TO DRAW A TEDDY BEAR.

146
Activity 18
MORE CIRCLE PICTURES
* * * * * * * * * * * * * * * * * * * *
HERE ARE SOME MORE IDEAS FOR USING CIRCLES TO MAKE
PICTURES. TRY TO DRAW THESE OR USE THEM TO MAKE YOUR OWN
PICTURES.

APPENDIX C
147
HOW DO YOU THINK YOU DID THIS WEEK
ON LOGO?
THIS WEEK I DID... n o o o D n NOT SO cm
I DID WELL ECAUSE-
^, I TRIED HARD.
_ 3 . I JUST KNEW WHAT TO DO.
.C. THE PROJECTS WM'J TOO HARD.
_ J ) . I WAS LUCKY.
I DID POORLY BECAUSE-
_ A . I DIDN'T TRY VERY HARD.
_ B . I DIDN'T KNOW HOW.
C. THE PROJECTS WERE HARD.
_ J ) . SOftTHING HAPPENED WHICH
KEPT ft FROM DOING WELL.