Embed Size (px)
Citation preview

University of ConnecticutOpenCommons@UConn
Honors Scholar Theses Honors Scholar Program
Spring 5-9-2010
The Effects of Heat Acclimation Followed by SleepDeprivation on Perceived Exertion, Thirst, andThermal Sensations in Exercising MalesCandice WilliamsUniversity of Connecticut - Storrs, [email protected]
Follow this and additional works at: https://opencommons.uconn.edu/srhonors_theses
Part of the Sports Sciences Commons
Recommended CitationWilliams, Candice, "The Effects of Heat Acclimation Followed by Sleep Deprivation on Perceived Exertion, Thirst, and ThermalSensations in Exercising Males" (2010). Honors Scholar Theses. 145.https://opencommons.uconn.edu/srhonors_theses/145
The Effects of Heat Acclimation Followed by Sleep Deprivation on Perceived
Exertion, Thirst, and Thermal Sensations in Exercising Males
Candice Williams, B.S, University of Connecticut, 2010
Human Performance Laboratory, Department of Kinesiology at the
University of Connecticut, Storrs, CT 06269

Williams 2
Introduction
The human body is expertly designed to function at 37˚C, or 98.6˚F. When this
temperature is raised, a great deal of stress is placed on multiple organ systems, causing
undesirable effects and potential bodily harm. These effects have been especially witnessed in
those such as athletes, laborers, and soldiers who perform physically demanding tasks under
great thermal stress. While sudden increases in heat cause great stress, the human body is
capable of adapting to heat stress over a period of just days so that it may better function in an
environment that may once have caused overheating, dysfunction, and possibly death (McArdle,
Katch, & Katch, 2007). The human body is extremely complex, and continued research in this
field is beneficial to the understanding of the processes that are involved in heat acclimation. The
current literature is in general agreement regarding physiological stresses, the body’s coping
mechanisms, and effective means to prevent the dangers caused by overheating. The effects of
sleep deprivation on the adaptations of acclimation, however, are much less known. While a few
studies have been conducted on the effects of sleep loss on exercise in temperate environments,
none have examined sleep loss and heat acclimation.
Those who should be especially wary of heat stress and heat illness are athletes, soldiers,
and laborers who are not used to working in the heat and are suddenly expected to perform at
optimal levels, possibly with varying degrees of sleep loss. This study aims to determine the
effect of 10 days of heat acclimation on subjects’ ratings of thirst, thermal sensations, and RPE.
Additionally, after acclimation has been established, the effects of 28 hours of sleep deprivation
on the newly acquired adaptations will be observed. It is predicted that ratings of thirst, thermal
sensations, and RPE will all be lower after exercise on day 10 than on day 1, and they will be
higher after exercise following sleep loss on day 11 than they were at the end of day 10.
Williams 3
Physiologic Stresses from the Heat
Cooling
Thermosensitive neurons in the hypothalamus monitor the temperature of blood flowing
through the brain and monitor core temperature by integrating this information with that from
thermoreceptors throughout the body. When core body temperature rises above 37˚C, the
hypothalamus initiates mechanisms to lower the temperature back down to the set point (Wendt
et al., 2007). During intense physical activity, the heat that is produced by the body alone is 15-
20 times greater than that which is produced at rest. This can be attributed to the fact that over
75% of the energy generated by skeletal muscle is released as heat; and this extra heat can raise
internal body temperature by 1˚C every 5 minutes if cooling does not occur (Armstrong et al.,
2007) & (Wendt et al., 2007). Therefore, once core temperature begins to rise, it is vital that the
body be able quickly to release the accumulating heat.
The same mechanisms are implemented whether the stored heat comes from the
environment, muscular metabolism, or both. The circulatory system releases heat as it shunts
blood from the core to the skin so heat can be released to the environment (Sparling, 2000). Once
blood reaches the capillaries of the skin, the heat that it is carrying is released through
conduction, convection, radiation, and evaporation. During exercise in the heat, conduction does
not generally provide significant cooling, and convection and radiation are dependent upon a
temperature gradient between the body and the air. When the air is cool enough, the blood in the
capillaries will dissipate heat through these mechanisms, however once the air temperature
exceeds about 36˚C, the body begins to gain heat from the environment instead, adding to the
stored heat and an ever increasing body temperature (Wendt et al., 2007). Once this occurs,
Williams 4
evaporation of sweat becomes the only means of releasing energy from the body. Evaporation
will remove heat even when the ambient temperature exceeds body temperature as long as the air
is dry. When the ambient temperature is above 36˚C and relative humidity is high, the body gains
heat through radiation and convection and sweat will no longer evaporate from the skin
(Sparling, 2000). Physical activity becomes extremely dangerous under these conditions because
the body has no way of cooling itself. Heat from the environment combines with that produced
by the muscles and accumulates inside of the body until the core temperature reaches critical
levels and the body no longer can function.
Dehydration
Although it may seem like common sense to replace lost fluids, especially during
exercise in the heat, this does not always occur. While dehydration causes significant issues
during exercise in a temperate environment, it becomes especially dangerous under hot
conditions. Dehydration causes plasma volume and peripheral vasodilation to decrease as the
rate of sweating decreases in an attempt to conserve water (Wendt et al., 2007).
Thermoregulation therefore becomes more difficult as evaporative heat loss becomes impaired.
In addition to increased core temperature, dehydration also results in reduced endurance
performance, early fatigue (Armstrong et al., 2007), decreased blood plasma volume, lowered
stroke volume, increased heart rate, and a general decline in the efficiency of circulatory and
thermoregulatory mechanisms (McArdle et al., 2007). These effects combine not only to make
dehydration during exercise a serious health threat, but they also severely impact sport
performance. Compared to euhydration, a loss of 4.3% body mass due to dehydration was found
to decrease endurance by 48% and VO2max by 22% (McArdle et al., 2007). The same
Williams 5
experimental procedure performed at a dehydration level of only 1.9% body mass resulted in a
22% reduced endurance and a 10% reduced VO2max indicating that even slight dehydration
significantly affects performance (McArdle et al., 2007). For this reason, athletes who compete
in hot environments should be particularly wary of their water consumption so as not to place
themselves at an avoidable disadvantage.
Sensations of Thirst
Greenleaf (1992) defines thirst as “A desire to drink resulting from a deficit of water.”
The question, therefore, is how much of a water deficit must be present before one feels thirsty,
and do certain situations affect the thirst response? In general an individual does not develop the
urge to drink until the body has already lost 2% body mass due to dehydration (Wendt et al.,
2007). Thirst results from an increase in the osmotic pressure of extracellular fluid and is
adjusted by various hormones that are sensitive to fluid levels in the body. While at rest,
voluntary drinking resulting from sensations of thirst is generally sufficient to maintain
euhydration, however during exercise, the thirst mechanism may not be capable of adequately
maintaining water balance in the body (Maresh et al., 2004). Therefore, when an individual is not
forced to drink during exercise and only consumes the amount of water that he or she feels
necessary, dehydration is likely to occur. This phenomenon is known as voluntary dehydration
(Armstrong, 1997), (Maresh et al., 2004), and has been observed in various situations involving
exercise and increased environmental heat (Greenleaf, 1992). When left to drink voluntarily
during exercise, most individuals replace only half of the water lost as sweat (McArdle et al.,
2007). Although unintentional, this failure to replace lost fluids prevents the body from working
at its optimum level and forces the body to work harder than normal.
Williams 6
As one of the first groups to study voluntary dehydration in 1945, Eichna, Bean, Ashe,
and Nelson found that after the first day of working in the heat, their subjects had incurred a
water deficit of 1L, however, by the end of day five they had reduced their dehydration levels to
0.5L. This left them wondering whether the progressive activity in the heat had resulted in an
increased sensitivity of thirst mechanisms, an elimination of some mechanism that had been
initially disguising thirst, or simply a new awareness by the subjects that they needed to drink
more (Greenleaf, 1992). Since more is currently known about heat acclimatization and
acclimation than in 1945, the question could also be posed whether the alterations in thirst
resulted from heat acclimatization. A more recent examination of data from eight endurance
competitions showed that 1077 of 2134 of the participating athletes were more that 2%
dehydrated (Carter, 2008). While this study examined water deficits after only one day of
exercise, it contributes to the idea of an altered thirst mechanism in response to exercise.
Roughly half of these athletes allowed themselves to become dehydrated to the point where
endurance capacity is significantly reduced. In doing so, they made the event more difficult for
themselves as it would have been harder to keep up with those who were adequately hydrated.
Even though thirst may not directly match the actual level of dehydration, this is not to
say that thirst is not amplified during exercise and increased environmental temperatures. Maresh
et al. (2004) found that those subjects who exercised in the heat without water and who were in a
euhydrated state upon commencement rated themselves as being significantly thirstier by the end
of exercise than at the beginning. Similarly, a strong relationship has been previously shown
between the intensity of the thirst sensation and the degree of dehydration both prior to and
following exercise in elevated climactic conditions (Maresh et al., 2004). This research suggests
that although exercise and/or environmental heat may alter or stunt the mechanisms that produce

Williams 7
thirst, these mechanisms are not completely masked and do still produce elevated levels of thirst
in response to stressful conditions.
While the substantial amount of water lost from the body as sweat works to enable
evaporative cooling, its purpose is negated if adequate water is not consumed and the core body
temperature rises anyway due to dehydration. Since the body has already lost 2% body weight by
the time one feels thirsty, it is important to consciously consume enough water during exercise in
the heat even if the stimulus to drink is not present. Fluid requirements range from 4-10 liters per
day in a hot environment and will vary according to activity level, climatic conditions, heat
acclimation, and clothing worn (Sawka et al., 2000). The best way to prevent dehydration is to
match fluid intake to that lost through sweating. If the extent of fluid loss is unknown, the ACSM
recommends consuming 150-300ml of water every 15 minutes during running-based activities
(Sparling, 2000). If one is planning to compete in an endurance event where dehydration could
significantly impact competitiveness, it would be beneficial to obtain pre and post exercise
weights to determine sweat rate. The amount of water lost during an event can be calculated and
the athlete will know the appropriate amount of water to consume for optimum performance.
Stress on Bodily Systems
Exercise in the heat places considerable stress on the body even when dehydration is not
a factor. As metabolic heat production adds to environmental heat during exercise, the body
becomes overwhelmed as it attempts to restore homeostasis. Some bodily systems significantly
reduce their workload, while others go into overdrive in an attempt to dissipate heat while still
supplying the necessary energy to continue exercise. As the skin and working muscles compete
for adequate blood flow, that which is available to other bodily systems is decreased. As a result,

Williams 8
renal, splanchnic, and hepatic blood flows are drastically reduced resulting in their decreased
capacity for work (Neilson et al., 1993). Cardiovascular function, however, which increases
drastically with exercise in any environment, must work overtime in the heat in order supply
oxygen to working muscles in addition to meeting the thermoregulative demands of the body
(Sparling, 2000). The circulatory system attempts to simultaneously accomplish both of these
tasks, but the necessary shunting of blood to the skin for cooling purposes results in a diminished
blood and oxygen supply to the muscles (Sparling, 2000). Clearly when muscular blood and
oxygen flow must be reduced, it becomes impossible to maintain the level of exercise that could
be achieved in a cooler setting.
As larger amounts of blood are sent to the skin for cooling, a great amount of strain is
placed on the heart as a result of a reduced central blood volume. This results in a lowered blood
pressure, reduced stroke volume and an increased heart rate as the heart attempts to compensate
(Nielson & Nybo, 2003). These cardiovascular stresses are exaggerated if the interstitial and
plasma volumes are additionally reduced due to dehydration (Taylor & Cotter, 2006). With a
continued rise in internal body temperature, the cardiovascular system eventually becomes
incapable of sufficiently supplying both the skin and the muscles. Once these needs can no
longer be met, fatigue, impaired performance, and termination of exercise occur as a result of
high core and brain temperatures (Neilson & Nybo, 2003), a reduction in neuromuscular drive,
and a reduced metabolic function (Taylor & Cotter, 2006). Even with precautions, exercise in the
heat places extreme stress on the body. The cardiovascular system and cooling mechanisms of
the body are not designed for acute bouts of exercise in extreme heat. This is not to say however
that exercise in the heat is impossible. The body is very capable of effectively adapting to
repeated heat exposure making exercise possible in conditions that were once dangerous.

Williams 9
Heat Acclimation
Why Acclimate
While virtually anyone who is exposed to a hot environment can experience a rise in
internal body temperature resulting in heat stress, athletes, laborers, and soldiers should be
particularly wary of the heat. These groups commonly perform highly demanding physical tasks
in hot environments, and often their bodies are not prepared for the resulting stress. Heat stress is
an issue that is commonly encountered by athletes, especially those who compete in outdoor
events that are typically held during the hottest months of the year. Hot and humid conditions
ideal for the development of heat illness were a major worry for the athletes who competed in the
Summer Olympic Games in both Barcelona and Atlanta (Sparling, 2000). While athletes tend to
be very well conditioned aerobically, which does help the body to deal with heat stress, those
who come from cooler environments to compete in the heat must acclimate themselves if they
wish to be competitive (Sparling, 2000). Those who are not prepared for the heat will at best
perform less than optimally, and will at worst fall victim to heat stroke.
Soldiers must also be wary of heat stress especially since their heavy uniforms tend to
trap heat against their bodies. Like athletes, most conditioned soldiers are afforded some
protection as a result of their aerobic adaptations. New recruits, however, are in particular danger
of heat illness because their bodies must deal with the extreme physical intensity of boot camp
coupled with heat stress. The United States military regards heat illness as a significant cause of
morbidity during recruitment training even during peace time, and identifies heat stroke as a
“common cause of preventable nontraumatic exertional death” both during the current conflict in
Williams 10
the Middle East as well as in past involvements including World War II (O’Connor et al., 2007).
Whether it is new recruits in boot camp or trained soldiers outfitted in full uniforms in a desert
over seas, this is a prescription for disaster as the soldiers’ bodies fight to adjust to the new
thermal stress while trying to keep up with added physical activity.
Many laborers are faced with a similar problem while working during the warm months.
While they are often facing the same environmental conditions as athletes and soldiers, laborers
tend to have much less aerobic conditioning as well as a higher incidence of heart, circulatory,
lung, and skin disorders which make it even more difficult to adapt to the heat (“Heat Stress”,
2008). Consequently, the U.S. Department of Labor provides specific guidelines, rules, and
regulations to help to protect laborers from heat illnesses (“Heat Stress,” 2008).
Athletes, soldiers, and laborers alike, as well as anyone else who is exposed to high
thermal stress, can benefit from heat acclimation. This process allows the body to adapt
physiologically to better function in a hot climate. After acclimation, one will not only be
capable of continuing physical activity in a hot environment for a longer period of time and at a
higher level of exertion, but the risk of developing a dangerous heat illness will also significantly
decrease.
The Acclimation Process
Adaptation is achieved only by repeated exposure to stressful conditions that push the
body past its homeostatic threshold until bodily systems alter in order to maximally function
under the new conditions. This is the exact process that occurs during heat acclimation as the
body adapts so as to reduce physiological strain by better expelling heat without compromising
function. Up to 14 days are required for complete heat acclimation, although not all systems of
Williams 11
the body adapt at the same time (Armstrong, 1998), with about 75% of the adaptations occurring
within the first five days of the acclimation process (Sparling, 2000). The cardiovascular system
is the first to undergo major adaptations leading to a decreased perception of workload as
evidenced by lower ratings on the RPE scale by test subjects (Taylor et al., 1997). Ultimately, all
of the changes that occur in the body during the early stages of heat acclimation can be attributed
to an expanded plasma volume. As fewer plasma proteins are lost to the interstitial fluid and
sodium chloride losses in sweat and urine decrease (Taylor et al., 1997), (Armstrong, 1998),
(Sparling, 2000), the increased retention of water by the kidneys as well as the increased
osmolality in the blood vessels result in plasma volume elevation. This amounted to as much as a
13% elevation in the subjects who participated in a study by Neilson et al. (1993).
Since a decreased plasma volume is to blame for many of the stresses during acute heat
exposure, the elevation of this volume effectively relieves many of the issues that result from
heat stress. Naturally an increase in plasma volume augments veinous return as well as cardiac
filling resulting in an increased stroke volume, which in turn affords the heart a break and lowers
the heart rate (Armstrong, 1998), (Taylor & Cotter, 2006), (Taylor et al., 1997), (Sparling, 2000)
(Neilson et al., 1993). These cardiovascular changes also permit the body to better regulate blood
pressure (Taylor & Cotter, 2006), yet another aspect that suffers during acute heat exposure. In
addition to placing less stress on the heart, all of these adaptations allow for a larger blood
volume to be distributed throughout the body more effectively. The newly adapted
cardiovascular system allows for increased blood flow to the periphery resulting in more
effective heat loss from the core and lower skin and core body temperatures at a fixed workload
and temperature relative to those before adaptation (Taylor et al., 1997), (Taylor & Cotter, 2006).
An elevated plasma volume and the accompanying adaptations during the initial days of
Williams 12
acclimation are vital to increasing safety and performance during physical activity in the heat.
Since an extremely elevated core temperature is responsable for dangerous heat illnesses, it is
only natural that the body adapts to improve these areas the quickest.
The body does not stop adapting after the cardiovascular system has adjusted but instead
continues to increase efficiency in the heat. From days 8-14 (Taylor et al., 1997), (Taylor &
Cotter, 2006), one of the most noticeable changes begins to occur as sweat rate increases.
Evaporative cooling is one of the most effective ways of cooling the body, and so it is vital to
augment sweat rate. Interestingly however, while sweat rate nearly doubles during heat
acclimation a 30% increase in sweat production has been found to increase cooling by only 10%
(Taylor & Cotter, 2006). An increased sweat response is however a vital component of
acclimation and occurs as a result of hypertrophy of the sweat glands and increased glandular
secretion, although the actual number of sweat glands remains unchanged (Taylor & Cotter,
2006). Adaptations also result in a lower temperature threshold for the onset of sweating (Taylor
et al., 1997), (Sparling, 2000), (Taylor & Cotter, 2006) and an increased glandular sensitivity to
rises in core temperature (Taylor et al., 1997), (Taylor & Cotter, 2006). Heat acclimation
additionally results in a greater reabsorption of sodium chloride through the sweat glands thus
resulting in less loss of electrolytes (Taylor et al., 1997), (Taylor & Cotter, 2006). After fourteen
days of heat acclimation, the vast majority of adaptations will have occurred to protect the body
and allow it to function at optimal levels under heat stress. Heat exposure must continue however
for the protection to remain, as these adaptations are not permanent and will be lost within days
or weeks of discontinuing heat exposure (Armstrong, 1998), (Taylor et al., 1997). All athletes,
soldiers, and laborers alike should be required to undergo heat acclimation especially for safety
purposes, and once fully adapted will be much more capable of performing their duties.
Williams 13
Thermal Sensations and Rating of Perceived Exertion
While many changes occur physiologically during heat acclimation, psychological
changes occur as well. Although cardiovascular, respiratory, and thermal changes arise, it is the
subjects’ perceptions of these changes, as evidenced by thermal ratings and rating of perceived
exertion (RPE), that ultimately determine the level of stress that the subjects feel as well as the
duration of exercise. In a study by Aoyagia et al. (1998), exercise-heat stress was used to induce
heat acclimation over 12 days, and they ultimately found a close correlation between thermal
rating and RPE as well as a strong correlation between these ratings and almost all measured
variables including rectal temperature, heart rate, VO2, and skin temperature. These results
support the abundance of research that has led to the understanding that acclimation produces a
progressive reduction in physiological strain (Taylor & Cotter, 2006) which is then translated
psychologically into a reduction in perceived strain. As RPE changes in a manner proportional to
alterations in cardiorespiratory stress, the reductions in cardiovascular strain that occur within the
first 5 days of exercise-heat exposure also result in reductions in RPE during this same time
frame (Armstrong, 1998).
Although RPE and thermal ratings increased significantly over an entire 150 minute
session of exercise in the heat during the study by Aoyagia et al. (1998), subjects exhibited a
significant decrease in these ratings post exercise between the first and the twelfth day of
acclimation, reflecting a likely decrease in physiological strain as evidenced by heart rate, rectal,
and skin temperatures. It is reasonable that subjects would become hotter and feel as though they
are working harder during the course of any exercise session even in a temperate environment.
Additionally, increased skin blood flow and a lowered threshold for vasodilation, both resulting
from cardiovascular adaptations during acclimation, have been shown to allow for rapid heat
Williams 14
transfer from the core to the periphery for dissipation (Taylor & Cotter, 2006). This increased
capacity for heat loss can account for the reported changes that were observed in RPE and
thermal ratings. Although an elevation in skin blood flow does allow for an increase in heat
dissipation through radiation, sweating is the most effective way to rid the body of excess heat.
Sweat rate elevation requires 7-14 days of acclimation to fully adapt, yet it is the most commonly
observed adaptation (Taylor & Cotter, 2006). As RPE and thermal ratings are closely correlated
(Aoyagia et al., 1998), adaptations such as elevated skin blood flow, resulting in heat loss
through radiation, and elevated sweat rate, resulting in evaporative heat loss, promote the
dissipation of heat and thus a lowered thermal rating resulting in a lowered RPE.
In a state of dehydration, however, these positive changes in RPE and thermal sensations
are not necessarily witnessed. Even minor dehydration, as low as 1 to 2% of body weight, places
significant strain on the cardiovascular system and the body’s ability to dissipate heat
(Armstrong, 1997). Since cardiovascular strain is directly related to RPE, and retention of heat is
naturally related to feelings of hotness, dehydration during exercise should result in both higher
RPE and thermal ratings. As expected, the amount of strain that is felt by the body during
exercise is directly related to the level of dehydration (Armstrong, 1997). Thus, in order to
improve acclimation and reduce feelings of exertion, exercisers should ensure that they remain
adequately hydrated during any exercise, but especially during exercise in the heat.
Heat Illness
Development of Heat Illness
As the third leading cause of death among high school athletes (Coris et al., 2004) and a
real danger to all those who are active in extreme heat, the signs and symptoms of heat illness

Williams 15
should be familiar to everyone at risk. While various risk factors including obesity, low physical
fitness, certain medications, sleep deprivation, recent or current illness, and dehydration
significantly increase the probability that one will develop a heat illness (Coris et al., 2004),
(Armstrong et al., 2007), even highly trained athletes and those who are highly heat acclimated
have fallen victim to the entire spectrum of heat illnesses. Although one is never entirely
protected, heat acclimation is by far the most effective way to defend against a possible heat
illness.
While heat exhaustion is the most common form of heat illness in those who are
physically active (Armstrong et al., 2007), heat cramps and heat stroke are two other common
forms, with heat stroke being by far the most dangerous. Especially in those who are not
acclimated, the body’s energy stores are depleted faster during exercise in the heat than in a cool
environment resulting in rapid fatigue and exhaustion (Armstrong et al., 2007). As one might
predict, heat illnesses are most prevalent within the first five days of physical activity in the heat
(Taylor et al., 1997) when individuals are required to perform physically demanding tasks before
cardiovascular adaptations have occurred. This heat stress is exacerbated by heavy uniforms and
equipment and can be extremely dangerous. To remain safe, both those in charge and those who
are active must be aware of the dangers of heat illness, the risk factors, the signs and symptoms,
and the effective prevention and treatment methods in order fully to be prepared for a dangerous
situation. Knowledge of these factors and prevention strategies are critical to the prevention of
heat illness in those who are not accustomed to working in a hot environment.
Heat Cramps
Williams 16
Although extremely uncomfortable and detrimental to performance, heat cramps may be
the least dangerous of heat illnesses and pose no threat of permanent damage. Heat cramps
typically present as painful spasms of the skeletal muscle of the arms, legs, and abdomen after
extended intense exercise in the heat (Armstrong, 1998), (Armstrong et al., 2007), (Coris et al,
2004). These spasms are thought to occur as a result of sodium losses during exercise, and are
typically observed in those who have replaced large volumes of sweat with hypotonic solutions
without an adequate amount of sodium (Armstrong, 1998), (Armstrong et al., 2007). As a result,
sodium depletion is thought to be the cause of heat cramps (Armstrong, 1998) especially since
those with an elevated sodium concentration in their sweat seem to be more likely to fall victim
to this illness (McArdle et al., 2007). Although painful and inconvenient, heat cramps are not
permanent, and can be reversed relatively easily. Effective treatment for this condition includes
rest and replacement of fluid and sodium losses (Armstrong et al., 2007), (Coris et al., 2004).
Since elevated core temperatures are not to blame for heat cramps (McArdle et al., 2007), they
are merely uncomfortable and not dangerous. Prevention of cramps is ideal however, since they
interfere severely with performance. Therefore fluid and salt intake should be monitored and
increased if necessary to prevent sodium depletion to levels low enough that heat cramps may
develop.
Heat Exhaustion
Heat exhaustion is the most common heat illness, and as such is defined by a wide array
of varying symptoms. These symptoms include a combination of headache, dizziness, fatigue,
low blood pressure, elevated heart rate and respiration, syncope, nausea, and decreased muscular
coordination to name a few (Armstrong, 1998), (Armstrong et al., 2007), (McArdle et al., 2007).
Williams 17
Since heat exhaustion can present itself through a myriad of different symptoms, it tends to be a
diagnosis of exclusion when something is clearly wrong with an individual who has been in the
heat but the symptoms do not fit neatly with any of the other heat illnesses. In some cases, severe
heat exhaustion may present almost exactly like heat stroke, and therefore the illnesses are
distinguished by severity with the fact that although the core temperature is increased in those
with heat exhaustion, it always remains below 40˚ C (Armstrong et al., 2007), (McArdle et al.,
2007). Heat exhaustion is very treatable with removal to a cool environment, replacement of
fluid losses, rest, and treatment of any specific symptoms (Armstrong et al., 2007), (Coris et al.,
2004). Although individuals do recover from even extreme heat exhaustion, coaches, instructors,
and bosses should never force someone to work though this illness as it could potentially result
in heat stroke. Heat exhaustion can be seen as a physical break that the body pulls when on the
path to developing heat stroke. Since heat exhaustion, unlike heat stoke, is very treatable, it may
act as a protective mechanism by forcing an individual to cease activity before the development
of heatstroke.
Heat Stroke
As the most dangerous form of heat illness and the only one that can result in death or
permanent damage, every possible effort should be made to avoid the development of heat
stroke. Many of the symptoms of heat stroke are similar to those of heat exhaustion, however
those experiencing heat stroke also exhibit significant neurological dysfunction, multi-system
organ failure, and rectal temperatures greater than 40˚C (Armstrong et al., 2007), (Coris et al.,
2004), (McArdle et al., 2007), (Wendt et al., 2007). Heat stroke occurs when metabolic heat
production continues to combine with environmental heat even after all cooling mechanisms

Williams 18
have been exhausted. Eventually the body reaches a critical threshold where cell membranes and
cell energy systems become damaged to the point where the organs of the body can no longer
properly function (Armstrong et al., 2007). Unlike heat cramps and heat exhaustion, heat stroke
is a medical emergency since its effects will not reverse if simply removed from the heat. Once
heat stroke has been diagnosed by a rectal temperature of 40˚C or greater, rapid total body
cooling in either cold water or an ice bath has been determined as the ideal treatment (Coris et
al., 2004). If left untreated, neurological, cardiovascular, and other organ system failure can
result in permanent multi-system organ dysfunction (Armstrong et al., 2007) or even a mortality
rate possibly greater than 10% (Coris et al., 2004). Because of the severe, and many times
permanent, effects of heat stroke, prevention is essential.
Anyone who is physically active in the heat should be required to learn the signs and
symptoms as well as the treatment for heat stroke. As with the other heat illnesses, heat stroke is
most likely to occur during the first few days of heat exposure before the cardiovascular system
has adapted. Since many athletic events and training programs take place during the hottest
months of the year, those exercising in the heat should be closely monitored and watched
especially for changes in behavior or mood that may suggest the neurological dysfunction
indicative of heat stroke.
Sleep Deprivation
It is not uncommon for those who are exposed to exercise-heat stress to also suffer from
sleep loss. Athletes may lose sleep on a long flight or bus ride immediately preceding a
competition; military recruits may endure sleepless nights or fly overseas and then be thrown
directly into battle; and laborers may work long hours and then be afforded little sleep as a result
Williams 19
of commitments at home before returning to work in the hot sun the next day. Even if the
individuals involved in all of these situations have been acclimated, they may still be at a
significant risk of heat stress and/or injury resulting from sleep deprivation
While relatively recent sources hold that sleep loss negatively affects heat acclimation
and can be a risk factor for heat illness (Armstrong, 1997), (Sparling, 2000), very little research
has been done on the effects of sleep deprivation on heat acclimation. The best predictors may be
a few older studies that examine at the effects of sleep loss on exercise in temperate
environments. According to two separate studies, exercise at submaximal levels following
significant sleep loss resulted in no significant changes in physiological variables such as heart
rate, blood pressure, or oxygen uptake (Sawka et al., 1984), (Martin & Gaddis, 1981). Sleep loss
did, however, significantly decrease exercise duration during submaximal exercise (Sawka et al.,
1984) and increase RPE in subjects exercising at 50% an 75% of their VO2max (Martin & Gaddis,
1981). Also, while sleep loss seemingly had no effect on submaximal heart rate, subjects’
maximal heart rates, or heart rates at which they terminated exercise, were significantly lowered
by sleep deprivation (Sawka et al., 1984), (Martin & Gaddis, 1981), (Hsiun-Ing, 1991). Under
normal conditions, there is thought to be a shift to sympathetic dominance of the heart as heart
rate and work load increase during exercise (Martin & Gaddis, 1981). These lowered maximum
heart rates may be the result of altered sympathetic activity due to suppression of sympathetic
regulation as a result of sleep loss (Hsiun-Ing, 1991) (Martin & Gaddis, 1981).
While they do not examine any aspects of heat acclimation, these earlier studies provide
at least some basis for the effects that may be observed during exercise-heat stress in a state of
sleep deprivation. Very little research exists regarding the effects of sleep loss on exercise, and

Williams 20
no studies could be found that examine the effects on acclimation. Since sleep loss is an area that
is applicable in many situations, increased research in this area would be highly beneficial.
Conclusion
Environmental heat alone can place a great deal of stress on the cooling systems of the
body, however when coupled with metabolic heat production during exercise, homeostatic
systems can quickly become overwhelmed. When the body becomes overheated, the
cardiovascular system becomes overworked and less efficient. If exercise is stopped and the
body is able to cool, homeostatic function will return to normal. If the body continues to store
heat however, the body can go into multiple system organ failure that could quickly lead to
permanent damage or even death. However, with its remarkable ability for adaptation, the body
is able to adjust to chronic heat exposure through the process of acclimation. Heat acclimation
dramatically decreases the risk of an individual developing a dangerous heat illness and allows
for an extended duration of more comfortable physical activity.
Thermal ratings as well as RPE have both been shown to decrease with heat acclimation,
indicating a reduced cardiovascular workload and more effective methods for heat dissipation.
Although data was not found on whether thirst levels differ between the first and last days of
heat acclimation, thirst has been shown to increase during activity in the heat. Voluntary
dehydration is a serious problem, however, and can significantly increase both thermal
sensations and RPE. As data regarding sleep loss and exercise is relatively scarce, no data could
be found regarding the effects of sleep loss on thirst during exercise. RPE was, however, found
to increase as a result of sleep loss, suggesting that thermal sensations may have been increased
as well since these factors have been found to be highly correlated.
Williams 21
Methods
Subjects and pre-study requirements. Eleven healthy males participated in this study
(aged 20 ± 1 yr; maximal aerobic power (VO2max) = 53.2 ± 8.8 ml·kg-1·min-1) that was approved
by the University of Connecticut Institutional Review Board. A medical history questionnaire
and an activity / heat exposure questionnaire were administered to determine eligibility. Subjects
were required to come to the lab three days prior to the first 90-minute heat exposure to be
introduced to the heat acclimation (HA) procedures, the heat tolerance test (HTT), and the
questionnaires/surveys that would be administered on test days
Experimental Design: Heat Acclimation (HA) Program. Subjects participated in 11
consecutive days of exercise-heat exposure. Subjects were tested in three groups of three
individuals and one group of two individuals. These testing iterations occurred during the
months of October to February 2009, when natural heat acclimatization (developed during
Summer, 2009) had decayed for residents of New England.
After successfully completing screening procedures, and participating in three
familiarization days, subjects underwent exercise-heat acclimation on consecutive days. Indoor
HA sessions took place in climatically-controlled conditions of 33ºC (92°F) and 30 to 50 %
relative humidity (%rh). No fluid was consumed during HA or HTT sessions. Subjects reported
to the laboratory each morning in a euhydrated state, following a minimum 3-h fast. Subjects
were not allowed to undertake testing if urine specific gravity was greater than 1.025, suggesting
dehydration, or if they had an initial rectal temperature > 37.8°C, indicating a fever. In the event
of the former, subjects consumed 400 ml of water and waited until they could produce a urine
sample which had a specific gravity < 1.025.
Williams 22
Subjects ate a standardized breakfast each day of 1 or 2 food bars (as determined by the
test subject) plus 300 ml water. Subjects then inserted a rectal temperature probe 10 cm past the
anal sphincter and rectal temperature was taken and then HR was recorded. Upon entering the
environmental chamber, subjects stood quietly for 15 minutes to allow body fluids, plasma
volume and skin temperature (Tsk) to stabilize. After this equilibration, subjects walked on a
motorized treadmill at 93.6 m·min-1 (5.6 km·h-1, 5% grade). When exercise was not terminated as
a result of the criteria specified later in the methods section, the subjects walked for 90 minutes
before exiting the heat chamber. Data collection on HA days was used only for purposes of
safety and not for data calculations. HA days functioned as a means to acclimate subjects on
consecutive days.
Heat Tolerance Testing (HTT). The course of adaptations to heat was evaluated by a
standardized exercise-heat tolerance test (HTT) on days +1, +4, +7 and +10 of exercise-heat
exposure. One additional HTT was conducted on day +11 to evaluate the effects of mild sleep
loss. Successful heat acclimation was determined by tracking daily heart rate and rectal
temperature responses.
Upon entering the environmental chamber, subjects stood quietly for 15 minutes before
walking on a motorized treadmill at 93.6 m·min-1 (5.6 km·h-1, 5% grade). No water was
consumed during the HTT. Throughout the HTT, physiological and perceptual measures were
obtained Body weight (+ 100g, floor scale) was evaluated at the beginning of standing
equilibration and at the conclusion of the EHT. Changes in body weight were used to calculate
whole body sweat rate, corrected for urine production and sweat absorbed by clothing.

Williams 23
Heart rate, rectal temperature, thirst, thermal sensations, and ratings of perceived exertion
(6 - 20 point scale; Borg 1970) were determined after test subjects equilibrated in the heat, and
immediately before the end of exercise. .
Criteria for Termination of Exercise. A trained investigator will monitor all HA and
HTT sessions. During HA and HTT sessions, exercise was terminated if one of the following
predetermined criteria was reached:
1. rectal temperature (Tre) > 40.0ºC
2. inability to continue due to exhaustion (determined by test subject)
3. HR > 180 beats·min-1 for five consecutive minutes
-- or --
4. signs of exertional heat illness appear (e.g., nausea, mental disorientation, lack of
coordination, or dizziness).
If exercise was discontinued prior to the 90 minute goal, the subject rested quietly in the
environmental chamber for the remainder of the normally-scheduled heat exposure and
measurements were taken.
Mild sleep Loss (28 hours). After the HTT on day +10, subjects remained in the Human
Performance Laboratory for 28 hours before a final HTT. Subjects were monitored by
investigators and encouraged to stay awake by planned activities. After 28 hours without sleep,
subjects underwent one final HTT. All procedures were the same as described above.
Results
Williams 24
Analysis of variance (ANOVA) was utilized to evaluate HTT data, (across 5 HTT days),
and an alpha level of 0.05 was used for all significance tests. Follow-up repeated-measures t-
tests and the Bonferroni alpha correction was used when appropriate.
Some of the most prominent, and perhaps most important, changes that arise during heat
acclimation occur in terms of heart rate (HR) and rectal temperature (Trec). Both of these changes
tend to occur early in the acclimation process. By day 4, both post exercise HR and Trec had
decreased significantly (p = 0.002 and p = 0.003 respectively). These lowered values persisted
until the end of the heat acclimation period on day 10, but did not decrease by any additional
significant amount from day 4 to day 10. Post exercise HR and Trec then proceeded to decrease
significantly (p = 0.001 and p = 0.047 respectively) from day 10 to day 11 after the subjects had
experienced sleep loss.
Paired samples T-tests were run on all of the data regarding thirst, thermal sensations, and
RPE. Subjects were found to be significantly thirstier after exercising than before exercise on the
first day of testing, the last day of acclimation (day 10), and the last day of the study after sleep
loss (day 1 pre-post: p<0.001, day 10 pre-post: p = 0.001, and day 11 pre-post: p<0.001). These
same results were found in regards to thermal sensations, with subjects rating themselves as
being significantly hotter after exercise than before exercise on days 1, 10, and 11 (day 1 pre-
post: p = 0.002, day 10 pre-post: p = 0.002, and day 11 pre-post: p = 0.011).
Additionally, subjects were significantly less thirsty after exercise (p = 0.027) on day 10,
after ten days of heat acclimation, than they were after exercise on the first day. They also
showed an increase in thirst (p = 0.025) after exercise on day 11, after 28 hours of sleep
deprivation, from their thirst levels after exercise on day 10. Perceived thirst responses can be
viewed in figure 1. Significant differences in this data were based upon individual differences

Williams 25
across the 11 day time frame instead of on means for the entire data pool. This is because even
though the majority of subjects exhibited similar trends in perceived thirst, they all experienced
different absolute intensities of thirst on any given day. For example, subject 9 perceived his
thirst level to be at an 8 on day 1 and at a 5 on day 10, while subject 6 perceived his thirst to be at
a 3 on day 1 and a 1 on day 10. While both subjects exhibited a significant decrease in level of
thirst after exercise over the 10 day period, subject 9 may have an inherently higher thirst level
that subject 6. For this reason, subjects’ thirst levels must be compared to their own previous
perceptions of thirst in order for significance to be determined.
Fig. 1.
Perceptions of Thirst
0
1
2
3
4
5
6
7
8
9
10
0 2 4 6 8 10 12
Days
Th
irst
Rati
ng
s (
scale
of
1-1
0)
Subject 1Subject 2Subject 3Subject 4Subject 5Subject 6Subject 7Subject 8Subject 9Subject 10Subject 11
Inter-subject changes in perceptions of thirst on all HTT days throughout the course of the study. There is a significant drop in ratings of thirst from day 1 to day 10, and then a significant rise in perceived thirst from day 10 to day 11. This significance was found between post exercise values for these days.
The significant trend in ratings of thirst was not equally visible in subjects’ ratings of
thermal sensations and RPE. Perceived thermal responses and RPE values can be viewed in
figures 2 and 3 respectively. No significant difference was found between thermal sensations on
day 1 before acclimation and day 10 after acclimation or between day 10 and day 11 after sleep
Williams 26
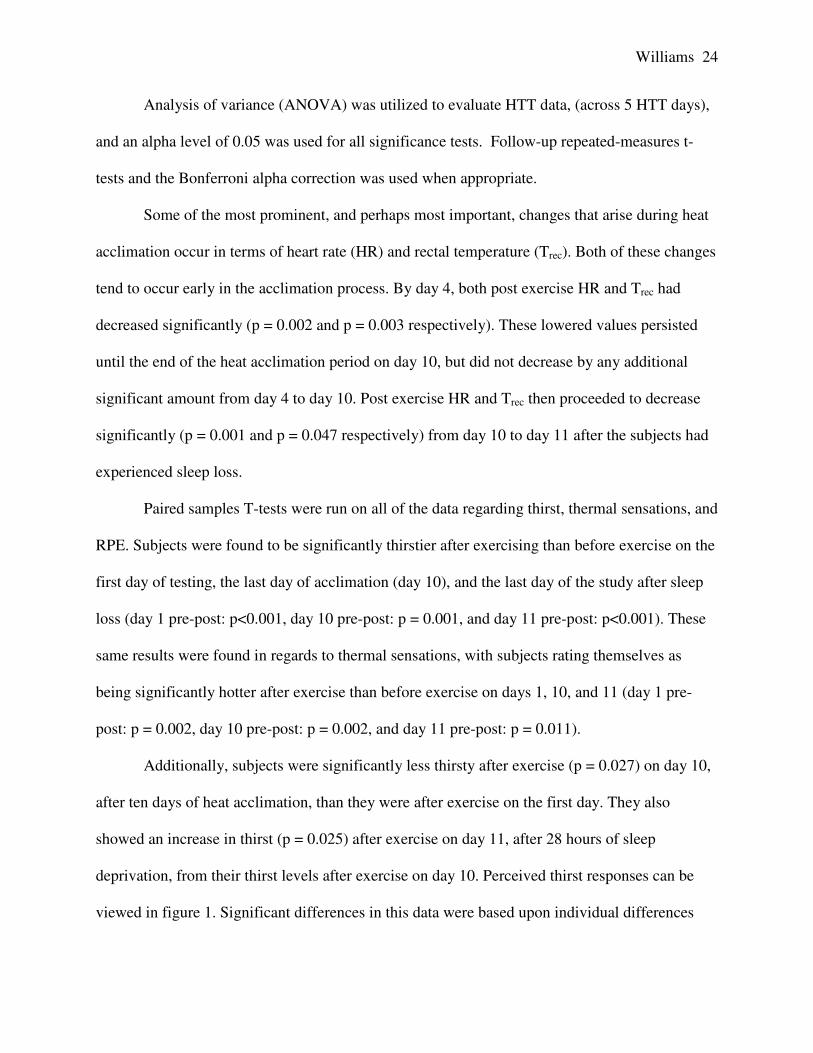
loss. As can be viewed in the graph, thermal sensations tend to remain relatively constant barring
a few exceptions, particularly with subject 11 on day 4. Since subject 11 was the only subject to
show a large increase in perceived thermal strain from day 1 to day 4, which dropped back down
on subsequent test days, it is likely that this subject was experiencing some level of stress that
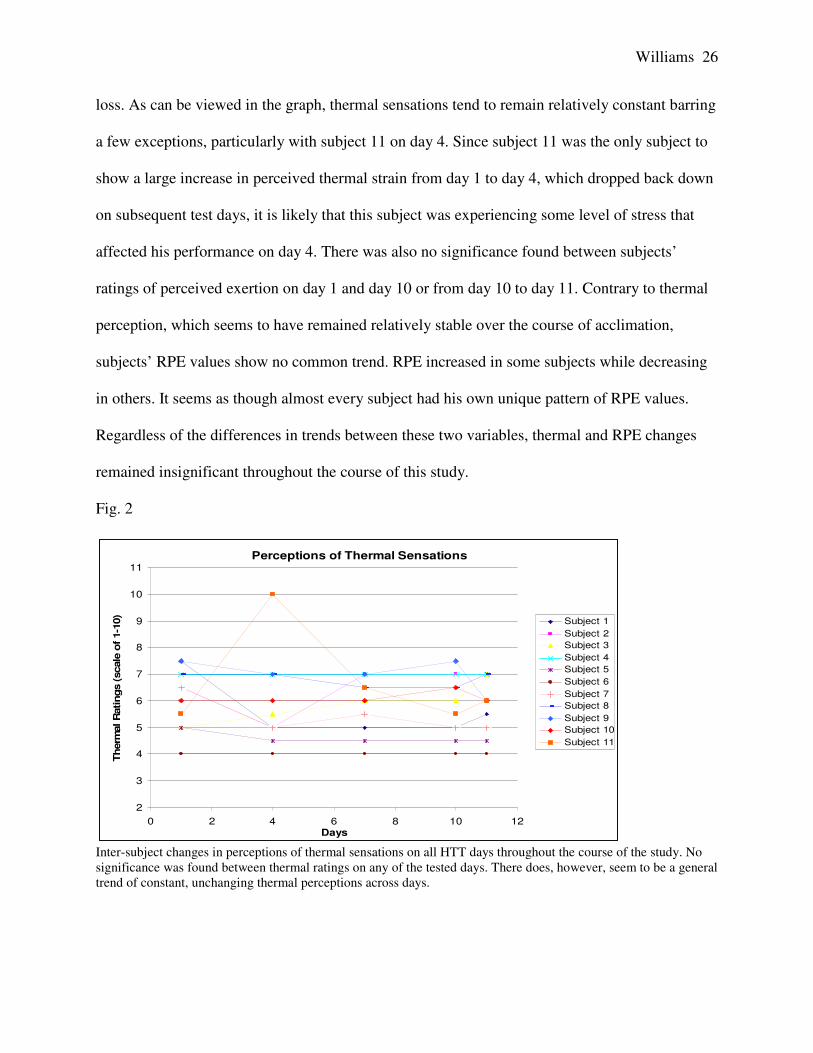
affected his performance on day 4. There was also no significance found between subjects’
ratings of perceived exertion on day 1 and day 10 or from day 10 to day 11. Contrary to thermal
perception, which seems to have remained relatively stable over the course of acclimation,
subjects’ RPE values show no common trend. RPE increased in some subjects while decreasing
in others. It seems as though almost every subject had his own unique pattern of RPE values.
Regardless of the differences in trends between these two variables, thermal and RPE changes
remained insignificant throughout the course of this study.
Fig. 2
Perceptions of Thermal Sensations
2
3
4
5
6
7
8
9
10
11
0 2 4 6 8 10 12Days
Therm
al R
atings (scale
of 1-1
0)
Subject 1
Subject 2
Subject 3
Subject 4
Subject 5
Subject 6
Subject 7
Subject 8
Subject 9
Subject 10
Subject 11
Inter-subject changes in perceptions of thermal sensations on all HTT days throughout the course of the study. No significance was found between thermal ratings on any of the tested days. There does, however, seem to be a general trend of constant, unchanging thermal perceptions across days.
Williams 27
Fig. 3
Ratings of Percieved Exertion
6
8
10
12
14
16
18
20
0 2 4 6 8 10 12
Days
RP
E (B
org
scale
of 6-2
0)
Subject 1
Subject 2
Subject 3
Subject 4
Subject 5
Subject 6
Subject 7
Subject 8
Subject 9
Subject 10
Subject 11
Inter-subject changes in ratings of perceived exertion on all HTT days throughout the course of the study. No significance was found between RPE scale ratings on any of the days. There also seems to be no general trends through this data.
Absolute changes in perceived thirst, thermal, and RPE ratings from day 1 to day 10 and
from day 10 to day 11 can be viewed in tables 1 and 2 respectively. Similarly to what is shown in
the graphs above, a definite decrease in sensations of thirst can be seen from day 1 to day 10,
followed by a slight, but significant, increase of about 1 point on the thirst scale from day 10 to
day 11. Thermal sensations can be seen to have remained about the same over the eleven days,
with some subjects experiencing slightly (many not more than a change of 0.5) higher or lower
thermal sensations, and many subjects reporting no change at all in their perceived thermal
stress. Conversely, the RPE data is not nearly as constant as that for thermal stress. From day 1
to day 10, a few subjects showed a large decrease (up to 9 points) in RPE, while many showed a
slight increase in perceived exertion, and two subjects experienced no change at all. The wide
variety of responses persists through the changes in RPE from day 10 to day 11. After exercise
following sleep loss, many subjects perceived no change in RPE, while some felt as though they
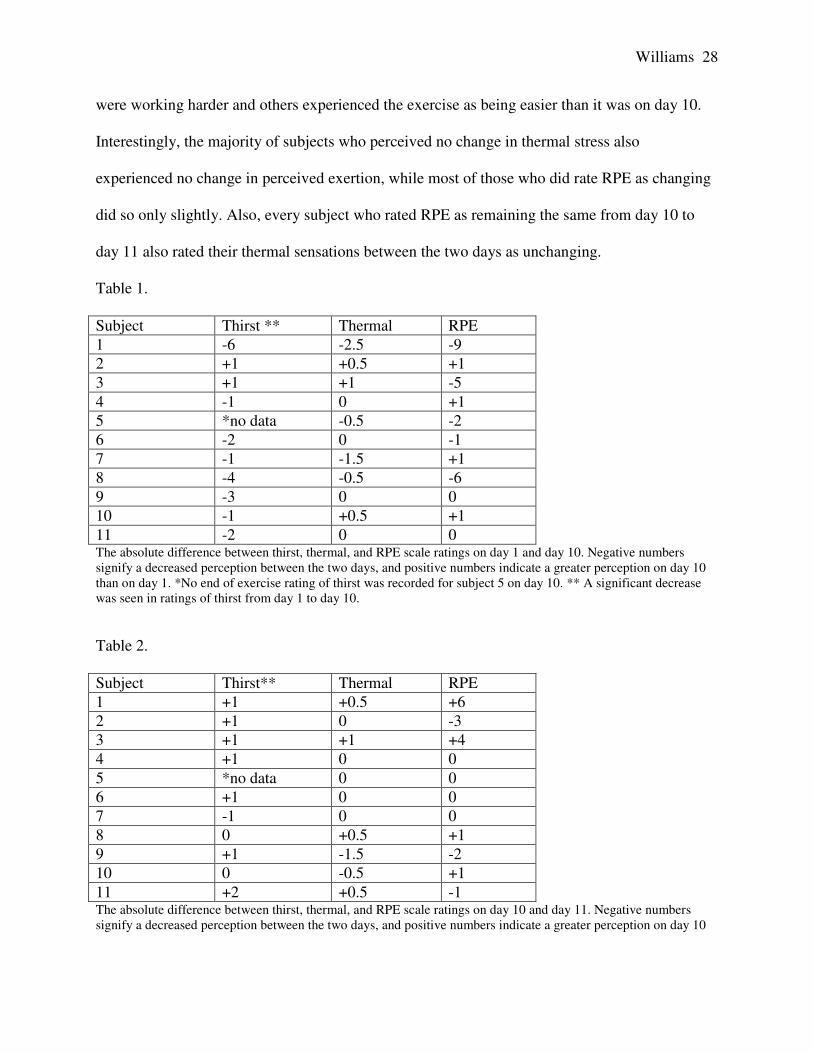
Williams 28
were working harder and others experienced the exercise as being easier than it was on day 10.
Interestingly, the majority of subjects who perceived no change in thermal stress also
experienced no change in perceived exertion, while most of those who did rate RPE as changing
did so only slightly. Also, every subject who rated RPE as remaining the same from day 10 to
day 11 also rated their thermal sensations between the two days as unchanging.
Table 1.
Subject Thirst ** Thermal RPE
1 -6 -2.5 -9
2 +1 +0.5 +1
3 +1 +1 -5
4 -1 0 +1
5 *no data -0.5 -2
6 -2 0 -1
7 -1 -1.5 +1
8 -4 -0.5 -6
9 -3 0 0
10 -1 +0.5 +1
11 -2 0 0 The absolute difference between thirst, thermal, and RPE scale ratings on day 1 and day 10. Negative numbers signify a decreased perception between the two days, and positive numbers indicate a greater perception on day 10 than on day 1. *No end of exercise rating of thirst was recorded for subject 5 on day 10. ** A significant decrease was seen in ratings of thirst from day 1 to day 10.
Table 2.
Subject Thirst** Thermal RPE
1 +1 +0.5 +6
2 +1 0 -3
3 +1 +1 +4
4 +1 0 0
5 *no data 0 0
6 +1 0 0
7 -1 0 0
8 0 +0.5 +1
9 +1 -1.5 -2
10 0 -0.5 +1
11 +2 +0.5 -1 The absolute difference between thirst, thermal, and RPE scale ratings on day 10 and day 11. Negative numbers signify a decreased perception between the two days, and positive numbers indicate a greater perception on day 10
Williams 29
than on day 1. *No end of exercise rating of thirst was recorded for subject 5 on day 10. ** A significant increase was seen in ratings of thirst from day 10 to day 11.
Discussion
Thirst
The portion of the study involving thirst was noteworthy in multiple ways. The results of
the pre-exercise to post-exercise thirst analysis agree with those of Maresh et al. (2004) showing
that subjects who were in a state of euhydration at the start of exercise rated themselves as being
thirstier by the end of exercise when denied water. This was expected since it is known that the
body loses water, particularly through sweating, during heat-exercise stimuli, and if this water is
not replaced, an increase in thirst will eventually result signifying a need for fluid replacement.
Since individuals are known to be about 2% dehydrated by the time they feel thirsty (Wendt et
al., 2007), the subjects in this study who rated their thirst as being very high on the thirst scale
were most likely experiencing a state of dehydration well past the point of 2% body mass. This
speculation is supported by the finding of Maresh et al. (2004) that there is a strong relationship
between the intensity of thirst that is felt by a subject and his degree of dehydration.
With the progression of heat acclimation, subjects’ ratings of thirst after exercise
decreased significantly by day 10. Since subjects were exercising at the same absolute intensity
and in the same environmental conditions, this lowered sensation of thirst may have resulted
from a suppression of the mechanisms that generate the thirst response, or from a conservation of
water by the body. If heat acclimation results in a suppression of thirst mechanisms, this may be
the result of an increased plasma volume resulting from increased circulatory efficiency
(Armstrong, 1998), (Taylor & Cotter, 2006), (Taylor et al., 1997), (Sparling, 2000) (Neilson et
Williams 30
al., 1993), as indicated by the significant drop in HR and Trec that occurred on day 4 and lasted
throughout the study.
Adaptations may also have occurred resulting in a conservation of water by the body,
thus decreasing thirst. One such adaptation may have resulted in a blunting of the increased
sweat rate typical of acclimation. Since an expected increase in sweat rate was not observed and
levels of thirst decreased, the body may have attempted to reduce dehydration by failing to
initiate the typical increase in sweat loss. This is a realistic assumption since the environmental
temperature of 33˚C is lower than body temperature, thus allowing body heat to be dissipated
through radiation as well as evaporation. In the documented studies of heat acclimation where
sweat rate increased significantly, the environmental temperature was 37˚C (98.6˚F), which is
equal to the typical body temperature. Since body heat could not be dissipated through radiation
in these circumstances, evaporation became the only means for heat loss, and thus an increase in
sweat rate was vital. This postulation may not only account for the decreases in thirst that were
observed, but also for the surprising lack of an increased of sweat rate. Another possible way in
which retention of water may have occurred could result from adaptation by the kidneys. As
acclimation progresses, retention of water by the kidneys contributes to the increase in plasma
volume that relieves the circulatory system (Neilson et al., 1993). While Eichna, Bean, Ashe, and
Nelson (Maresh et al., 2004) assumed that the reduction in the water deficit of their subjects after
5 days of working in the heat resulted from their consuming additional amounts of water as the
days progressed, this may also have occurred because of an increase in the retention of water by
the kidneys and possible other mechanisms. It is beneficial for the kidneys to retain water since
high levels of body water act to keep Trec low. This retention will effectively decrease levels of
dehydration and thirst. It would be valuable to examine the total urine outputs of subjects over
Williams 31
the course of a 10-day heat acclimation period to determine whether the kidneys retain an
amount of water significant enough to affect levels of dehydration and thus sensations of thirst.
Thermal Strain and Rating of Perceived Exertion
Although acclimation was found to have an effect on the thirst response, the same is not
true for the perception of thermal sensations and RPE. Since the environmental temperature was
lower than typical acclimation temperatures, the body may have been capable of fairly
adequately maintaining body temperature from the first day of the study. Since heat could be
dissipated through both radiation and evaporation, the observed drops in HR and Trec may only
have affected heat loss mildly, if at all, resulting in insignificant changes in RPE and thermal
ratings. Although this contradicts, the findings of Aoyagia et al. (1998) and almost every other
study on heat acclimation, as stated earlier, these other studies all tested at a higher temperature.
This assumption is also supported by the fact that skin temperatures, in addition to the
unchanging thermal ratings, remain unchanged, again suggesting an adequate level of initial heat
loss. It is surprising that Trec decreased without the subsequent decrease in thermal sensations,
however it is interesting to note that recorded skin temperatures also did not change significantly
from day 1 to day 10. This could explain the constant thermal ratings since thermal receptors do
not exist deep within the body’s core, but instead reside in the skin. Thus, the subjects would not
have sensed the changes in Trec, but would instead have been very receptive to the fact that skin
temperature did not change, resulting in constant ratings of thermal sensations.
As with ratings of thermal stress, the RPE data also showed no significant changes over
the 10-day acclimation period. However, unlike thermal sensations, many of the subjects seemed
to perceive RPE very differently. The majority of subjects rated their perceived thermal stress as

Williams 32
equal from one test day to the next. The insignificance in the RPE data, however, results from
five of the subjects experiencing a decrease in RPE over the 10 days, four subjects experiencing
an increase, and two subjects perceiving no change at all in RPE. Those who claimed a rise in
RPE did so by not more than 1 point on the RPE scale, while three of those who felt a decrease
experienced a drastic decrease of 5 or more points. Additionally, the within-subject ratings
during acclimation spiked and dipped considerably from one day to the next. It can safely be
assumed that some degree of reduction in physical strain did occur as evidenced by the decrease
in HR, Trec, and possibly by the decrease in sensations of thirst over the 10-day acclimation. It is
unclear why this reduced level of strain was not felt by the subjects since these changes likely
indicate increased physical efficiency by the body. As RPE has been determined on numerous
occasions to be directly linked with levels of cardiovascular strain (Taylor & Cotter, 2006),
(Armstrong, 1998), (Aoyagia et al., 1998), RPE should theoretically have been seen to decrease
by day 4 when HR and Trec decreased significantly. In many subjects, however, RPE actually
increased from day 1 to day 4, indicating that there had to be other factors affecting subjects’
ratings of RPE. A possible explanation may be that not all of the cardiovascular changes
occurred that were necessary to decrease RPE. Since HR was the only cardiovascular factor that
was tracked during this study, it can not be known whether or not this is actually the case. The
fact that skin temperature remained constant may also contribute to the reason why RPE did not
decrease as it was expected
Another surprising finding was that RPE and thermal ratings exhibited very different
patterns throughout this study although Aoyagia et al. (1998) determined RPE and thermal strain
to be highly correlated. While technically there was no significant change in either of these
factors, the differences in inter-subject ratings of thermal strain were relatively constant between
Williams 33
day 1 and day 10, yet inter-subject RPE values were all over. For example, subjects 1, 3, 7, and 8
all exhibited decreases in RPE from 2.5 scale points to 6.5 points. At the same time, over half of
the subjects experienced either no change in RPE or a slight increase of 1 scale point. Aoyagia et
al. (1998) also discovered a strong correlation between perceived thermal strain, RPE, Trec, HR,
and skin temperature. While this study is in agreement with regards to the correlation between
thermal strain and possibly RPE with skin temperature, no correlation was found with HR and
Trec. It is possible that the lack of change in skin temperature affected both thermal sensations
and RPE by blunting the subjects’ ability to sense the decrease in physical strain that comes with
a lowered HR and core temperature. The lack of an increase in sweat rate may have been a
contributing factor to the unchanging skin temperatures, resulting in constant thermal and
perceived physical strain. While these variables could plausibly affect both thermal sensations
and RPE, they do not offer any explanation as to why these factors show such different patterns
over the acclimation period. Yet another possibility for why subjects did not perceive RPE as
decreasing could be that elevated levels of dehydration, resulting from their not drinking during
exercise, may have produced increased levels of heat retention and thus higher RPE and thermal
ratings than would have been present in euhydrated subjects. This seems plausible as strain is
known to be directly related to an individual’s level of dehydration (Armstrong, 1997).
Sleep Deprivation
Twenty eight hours of sleep deprivation was hypothesized to increase the total amount of
stress placed on the body during the heat tolerance test on the eleventh day of exercise. While
adaptations were seen over the first ten days resulting from acclimation, these adaptations were
predicted to suffer greatly from the addition of this new stressor. In actuality, these predicted

Williams 34
results were visible only when looking at sensations of thirst. From day 10 to day 11, thirst
increased significantly over the pool of participants. There was only one subject who
experienced a decrease in thirst between the two days while two subjects perceived no change;
the remaining 8 subjects all perceived their thirst as increasing. Although thirst only increased by
one scale point, this was still a significant increase. If the decrease in thirst during acclimation
resulted from increased water retention by the kidneys as hypothesized earlier, this sudden
increase in thirst after sleep loss may be due to a blunting of these mechanisms of retention.
Since sympathetic activation of the kidneys results in decreased urine production, this hypothesis
agrees with the suggestions by Hsiun-Ing (1991) and Martin & Gaddis (1981) that sleep loss may
result in a suppression of sympathetic regulation, which effectively would increase urine
production by the kidneys, increase water loss, and produce increased levels of thirst.
Unlike thirst, perceived thermal strain and RPE did not change significantly from day 10
to day 11. Both of these variables increased in some subjects while decreasing in others; and five
subjects perceived thermal stress to be the same between the two days while four perceived RPE
to be the same. These two variables seem to have been well correlated during the sleep loss
portion of this study, and unlike during the acclimation tests, RPE and thermal ratings seem to
follow the same within-subject trends. Every subject who rated RPE as being unchanging from
day 10 to day 11 also rated their perceived thermal stress as unchanging. Also, in many cases
those subjects who rated their thermal stress as lower also rated RPE as lower while many who
rated thermal stress as increased claimed that RPE had also increased. Although the subjects did
not necessarily rate the two variables as changing by the same amount, this may be because
different scales were used to rate RPE and thermal stress. Also, while perceived thermal strain
Williams 35
and RPE are related, there are many other factors that also contribute to an individual’s rating of
RPE.
Compared to the results of previous studies on sleep deprivation and exercise, this study
did not result in the increase in RPE after sleep loss that was witnessed by Martin & Gaddis
(1981) or the decrease in duration of submaximal exercise that was observed by Sawka et al.
(1984). Also, while all of the previous studies report a lowered maximal HR after sleep loss yet
no change in submaximal HR (Sawka et al., 1984), (Martin & Gaddis, 1981), (Hsiun-Ing, 1991),
this study resulted in a significantly lowered submaximal HR during testing on day 11 after 28
hours of sleep loss. All of these studies were, however, performed over 18 years ago and did not
look at heat acclimation, and so their relevance to this study may be questionable in some areas.
It is also possible that the added heat stress affected the heart and circulatory system differently
than in the earlier studies, resulting in a submaximal HR that was affected in the same way as the
maximal HR during the aforementioned studies. As with possible decreased water retention by
the kidneys, a suppression of the sympathetic regulation of the heart could also explain the
observed decrease in HR. It is possible that minor sleep loss acts to blunt the sympathetic
responses that normally occur with exercise and heat stress.
Discrepancies in Design
The results of this study were different from those that would be expected of a typical
study of heat acclimation. While HR and Trec both decreased over the 10-day acclimation period
indicating that some degree of heat acclimation had occurred, many of the other changes typical
of acclimation, such as decreased RPE and increased VO2submax, sweat rate, and sweat sensitivity,
were absent. All eleven subjects were also capable of completing the 90 minutes of exercise

Williams 36
during the first days of testing, a condition that is rare among heat studies with unacclimated and
untrained subjects. This lack of many of the typical changes is thought to be the result of an
environmental temperature much lower than that which is typically used in acclimation studies.
The heat chamber during this study was set to 33˚C (91.4˚F), while the majority of documented
heat acclimation studies are conducted with temperatures around 37˚C (98.6˚F). Although
exercise in 33˚C heat was enough to produce changes in HR and Trec, these environmental
conditions may not have been extreme enough to produce the other changes typical of
acclimation. Additionally, while 28 hours of sleep loss was seen to affect some of the tested
parameters, this may not have been sufficient to produce the results that were expected. Sleep
loss of only 28 hours is relatively mild, and a greater degree of sleep deprivation may have
produced more pronounced results.
Williams 37
Works Cited
1. Aoyagi, Yukitoshi , McLellan, Tom M. & Shephard, Roy J.(1998). Effects of endurance training and heat acclimation on psychological strain in exercising men wearing protective clothing. Ergonomics, 41, 328-357. 2. Armstrong, L.E. (1998). Heat acclimatization. In T.D. Fahey (Ed.), Encyclopedia of Sports
Medicine and Science. Internet Society for Sport Science: http://sportsci.org. 10 March 1998. 3. Armstrong, L.E., Maresh, C.M., Gabaree, C.V., Hoffman, J.R., Kavouras, S.A., Kenefick,
R.W., Castellani, J.W., & Ahlquist, L.E. (1997). Thermal and circulatory responses during exercise: effects of hypohydration, dehydration, and water intake. Journal of
Applied Physiology, 82:2028-2035. 4. Armstrong, L.E., Casa, D.J, Millard-Stafford, M., Moran, D.S., Pyne, S.W., & Roberts, W.O. (2007). American College of Sports Medicine. Exertional Heat Illness During Training and Competition. Medicine and Science in Sports and Exercise, 556-572. 5. Carter III, R. (2008). Exertional Heat Illness and Hyponatremia: An Epidemiological Perspective. Current Sports Medicine Reports, 7.4: S20-27. 6. Coris, E. E., Ramirez, A.M., & Van Durme, D.J. (2004). Heat Illness in Athletes: The Dangerous Combination of Heat, Humidity and Exercise. Sports Medicine,34.1: 9-16. 7. Febbraio, M. A. (2001). Alterations in Energy Metabolism during Exercise and Heat Stress. Sports Medicine, 31.1: 47-59. 8. Greenleaf, J.E. (1992). Problem: Thirst, Drinking Behavior, and Involuntary Dehydration. Medicine and Science in Sport and Exercise, 24.6: 645-656. 9. Hsiun-Ing, C. (1991). Effects of 30-h Sleep Loss on Cardiorespiratory Functions at Rest and in Exercise. Medicine and Science in Sports and Exercise, 23.2: 193-198. 10. Martin, B.J. & Gaddis, G.M. (1981). Exercise after Sleep Deprivation. Medicine and Science
in Sports and Exercise, 13.4: 220-223. 11. McArdle, W. D., Katch, F.I., & Katch, V.L. (2007). Exercise Physiology: Energy, Nutrition,
& Human Performance. 6th ed. Philadelphia: Lippincott Williams & Wilkins. 12. Nielsen, B., Hales, J. R. S., Strange, S., Juel Christensen, N., Warberg, J., & Saltin, B. (1993). Human Circulatory and Thermoregulatory Adaptations with Heat Acclimation and Exercise in a Hot, Dry Environment. Journal of Physiology, 468: 467-485.
Williams 38
13. Nielsen, B., & Nybo, L. (2003). Cerebral Changes during Exercise in the Heat. Sports
Medicine,33.1: 1-11. 14. O'Connor, F. G., Williams, A.D., Blivin, S., Heled, Y., Deuster, P., & Flinn S.D. (2007). Guidelines for Return to Duty (Play) After Heat Illness: A Military Perspective. Journal
of Sport Rehabilitation,16: 227-237. 15. Sawka, M.N., Gonzalez, R.R., & Pandolf, K.B. (1984). Effects of Sleep Deprivation on Thermoregulation during Exercise. American Journal of Physiology - Regulatory,
Integrative and Comparative Physiology, 246:72-77. 16. Sawka, M. N., & Montain, S. (2000). Fluid and Electrolyte Supplementation for Exercise- Heat Stress. American Journal of Clinical Nutrition,72.2: 564-572. 17. Sparling, P. B. (2000). Heat Acclimatization: Preparing Athletes to Compete in Hot Environments. International Sport Medicine Journal, 1.2. 18. Taylor, N. & Cotter, J. (2006). Heat adaptation: Guidelines for the optimization of human performance. International Sport Medicine Journal, 7.1: 33-57. 19. Taylor, N.A.S., Patterson, M.J., Regan, J.M., & Amos, D. (1997). Department of Defense. Defense Science and Technology Organization. Heat Acclimation Procedures:
Preparation for Humid Heat Exposure (DSTO Publication No.AR-010-35). Melbourne, Victoria: DSTO Aeronautical and Maritime Research Laboratory. 20. United States Department of Labor. (2008). Heat Stress. Mine Safety and Health Administration.Web. 27 Nov. 2009. <http://www.msha.gov/s&hinfo/heatstress/heat.htm>. 21. Wendt, D., Van Loon, L.J.C., & Van Marken Lichtenbelt, W.D. (2007). Thermoregulation During Exercise in the Heat: Strategies for Maintaining Health and Performance. Sports
Medicine, 37.8: 669-682.
![INDIVIDUALIZED HEAT ACCLIMATION TOOL AND …...Individualized Heat Acclimation Tool and Method [0001] The patent application claims priority to and the benefit of U.S. Patent Application](https://img.pdfslide.us/doc/110x75/5e9cd651c1323a33727973f6/individualized-heat-acclimation-tool-and-individualized-heat-acclimation-tool.jpg)