Embed Size (px)
Citation preview
The Effects of Digital Tools on Third Graders’
Understanding of Concepts and Development of Skills in Multiplication
Esther Jiyoung Yoon
Submitted in partial fulfillment of the requirements for the degree of
Doctor of Philosophy under the Executive Committee
of the Graduate School of Arts and Sciences
COLUMBIA UNIVERSITY
2015

© 2015 Esther J. Yoon
All Rights Reserved
ABSTRACT
The Effects of Digital Tools on Third Graders’
Understanding of Concepts and Development of Skills in Multiplication
Esther Jiyoung Yoon
The purpose of this research study was to examine the effectiveness of two digital tools: a
virtual number line (Jumper Tool); and a dynamic hundreds chart (Morphing Chart) in
improving children’s understanding of multiplication and number sense. One hundred twenty-
two third grade students (69 girls), ages ranging from 8 years-0 months to 10 years-3 months (M
= 8.88 years, SD = 0.44) from three New York City public elementary schools, were recruited to
participate in the study. Participants were randomly assigned to one of two math treatment
groups or a reading control group. Students in the Jumper group used a number line tool, while
those in the Morphing group used a morphing hundreds chart. Children’s number sense ability
and understanding of multiplication were tested at pre- and posttest to examine group
differences. Researchers recorded children’s strategy use and a back-end logging system
collected data on accuracy during treatment sessions. No group differences across the Jumper,
Morphing, or Control groups were found at posttests when controlling for pretest performance.
However, the presence of a tool (Jumper or Morphing) during treatment sessions resulted in
better performance than the absence of a tool (No Tool). Strategy use had a significant effect on
session performance as well. Fast and Tool Use responses performed better than Delayed
responses. Additionally, Fast responses were more likely to be correct than those who used an
Advanced strategy. Finally, the results indicated that Fast responses were predictive of
children’s performance on multiplication facts and number sense tests and Tool use was

predictive of performance on multiplication facts. These findings suggest that having a tool,
Jumper or Morphing, helped children solve multiplication problems and that tool use is related to
superior mastery of multiplication facts.
i
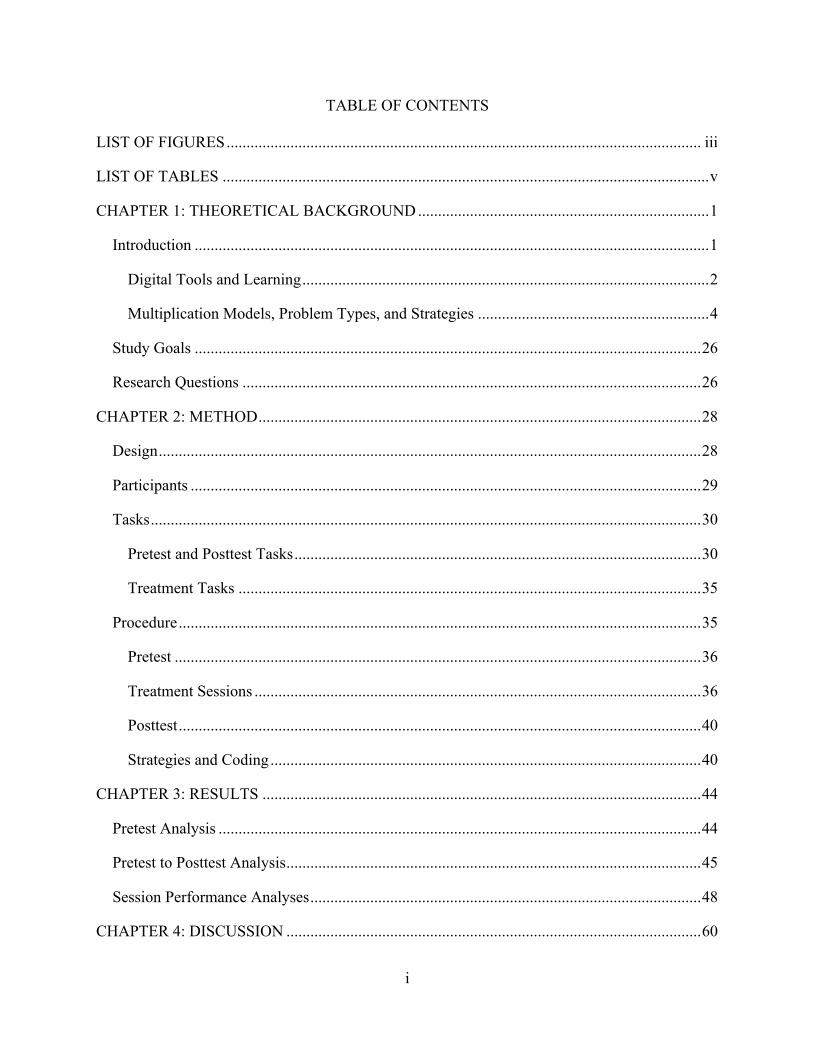
TABLE OF CONTENTS
LIST OF FIGURES ....................................................................................................................... iii
LIST OF TABLES .......................................................................................................................... v
CHAPTER 1: THEORETICAL BACKGROUND ......................................................................... 1
Introduction ................................................................................................................................. 1
Digital Tools and Learning ...................................................................................................... 2
Multiplication Models, Problem Types, and Strategies .......................................................... 4
Study Goals ............................................................................................................................... 26
Research Questions ................................................................................................................... 26
CHAPTER 2: METHOD ............................................................................................................... 28
Design ........................................................................................................................................ 28
Participants ................................................................................................................................ 29
Tasks .......................................................................................................................................... 30
Pretest and Posttest Tasks ...................................................................................................... 30
Treatment Tasks .................................................................................................................... 35
Procedure ................................................................................................................................... 35
Pretest .................................................................................................................................... 36
Treatment Sessions ................................................................................................................ 36
Posttest ................................................................................................................................... 40
Strategies and Coding ............................................................................................................ 40
CHAPTER 3: RESULTS .............................................................................................................. 44
Pretest Analysis ......................................................................................................................... 44
Pretest to Posttest Analysis ........................................................................................................ 45
Session Performance Analyses .................................................................................................. 48
CHAPTER 4: DISCUSSION ........................................................................................................ 60
ii
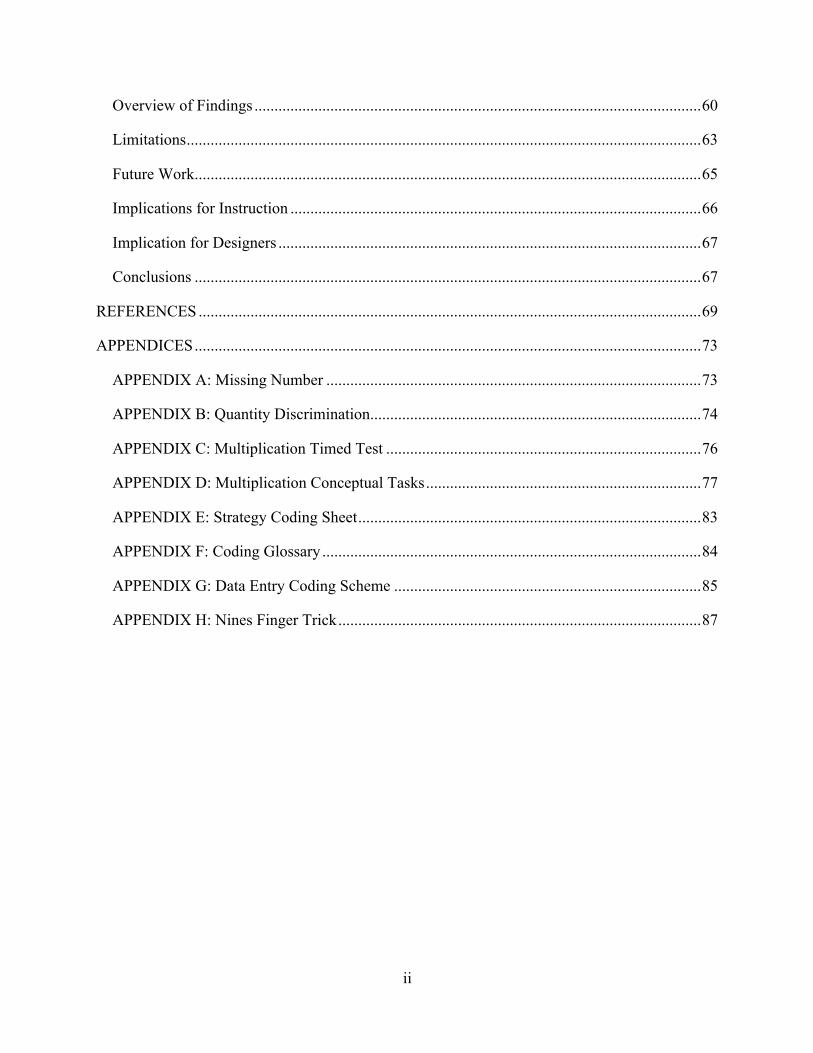
Overview of Findings ................................................................................................................ 60
Limitations ................................................................................................................................. 63
Future Work ............................................................................................................................... 65
Implications for Instruction ....................................................................................................... 66
Implication for Designers .......................................................................................................... 67
Conclusions ............................................................................................................................... 67
REFERENCES .............................................................................................................................. 69
APPENDICES ............................................................................................................................... 73
APPENDIX A: Missing Number .............................................................................................. 73
APPENDIX B: Quantity Discrimination ................................................................................... 74
APPENDIX C: Multiplication Timed Test ............................................................................... 76
APPENDIX D: Multiplication Conceptual Tasks ..................................................................... 77
APPENDIX E: Strategy Coding Sheet ...................................................................................... 83
APPENDIX F: Coding Glossary ............................................................................................... 84
APPENDIX G: Data Entry Coding Scheme ............................................................................. 85
APPENDIX H: Nines Finger Trick ........................................................................................... 87
iii
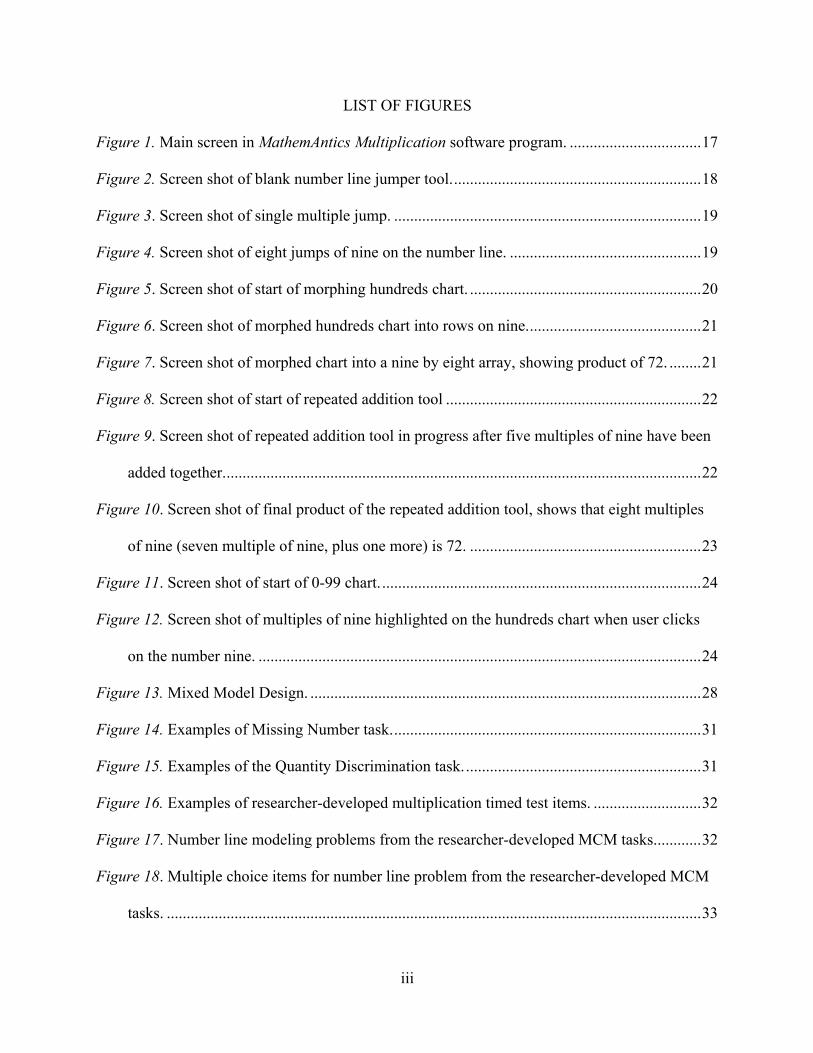
LIST OF FIGURES
Figure 1. Main screen in MathemAntics Multiplication software program. ................................. 17
Figure 2. Screen shot of blank number line jumper tool. .............................................................. 18
Figure 3. Screen shot of single multiple jump. ............................................................................. 19
Figure 4. Screen shot of eight jumps of nine on the number line. ................................................ 19
Figure 5. Screen shot of start of morphing hundreds chart. .......................................................... 20
Figure 6. Screen shot of morphed hundreds chart into rows on nine. ........................................... 21
Figure 7. Screen shot of morphed chart into a nine by eight array, showing product of 72. ........ 21
Figure 8. Screen shot of start of repeated addition tool ................................................................ 22
Figure 9. Screen shot of repeated addition tool in progress after five multiples of nine have been
added together. ....................................................................................................................... 22
Figure 10. Screen shot of final product of the repeated addition tool, shows that eight multiples
of nine (seven multiple of nine, plus one more) is 72. .......................................................... 23
Figure 11. Screen shot of start of 0-99 chart. ................................................................................ 24
Figure 12. Screen shot of multiples of nine highlighted on the hundreds chart when user clicks
on the number nine. ............................................................................................................... 24
Figure 13. Mixed Model Design. .................................................................................................. 28
Figure 14. Examples of Missing Number task. ............................................................................. 31
Figure 15. Examples of the Quantity Discrimination task. ........................................................... 31
Figure 16. Examples of researcher-developed multiplication timed test items. ........................... 32
Figure 17. Number line modeling problems from the researcher-developed MCM tasks. ........... 32
Figure 18. Multiple choice items for number line problem from the researcher-developed MCM
tasks. ...................................................................................................................................... 33
iv
Figure 19. Array problems from the researcher-developed MCM tasks. ..................................... 33
Figure 20. Area problems from the researcher-developed MCM tasks. ....................................... 34
Figure 21. Bar model problems from the researcher-developed MCM tasks. .............................. 34
Figure 22. Symbolic multiplication problem from the researcher-developed MCM tasks. .......... 34
Figure 23. Multiplication word problem from the researcher-developed MCM tasks. ................ 34
Figure 24. Ordering convention of treatment sessions by group name. ....................................... 38
Figure 25. Multiplication software with no tools. ......................................................................... 40
Figure 26. Multiplication software with jumper tool. .................................................................. 40
Figure 27. Multiplication software with morphing chart. ............................................................ 40
Figure 28. BRAINtastic reading software. .................................................................................... 40
Figure 29. Mean proportion correct on multiplication conceptual tasks at pretest by condition. . 45
Figure 30. Mean proportion correct on multiplication facts at pretest by condition. .................... 45
Figure 31. Mean proportion correct on missing number at pretest by condition. ......................... 45
Figure 32. Mean proportion correct on quantity discrimination at pretest by condition. ............. 45
Figure 33. Mean proportion correct for Multiplication Conceptual Models tasks ....................... 47
Figure 34. Mean proportion correct for Multiplication Timed Tests ............................................ 47
Figure 35. Mean proportion correct for Missing Number task ..................................................... 47
Figure 36. Mean proportion correct for Quantity Discrimination ................................................ 47
Figure 37. Mean performance during treatment sessions by tool condition. ................................ 49
Figure 38. Observed performance for tool condition by order from Session 1 to 4. .................... 50
Figure 39. Count of coded strategies. ........................................................................................... 55
Figure 40. Count of new strategies. .............................................................................................. 56
Figure 41. Accuracy (likelihood of correctness) by strategies. ..................................................... 57
v
LIST OF TABLES
Table 1. Multiplication Problem Types ........................................................................................... 7
Table 2. Multiplication Models ....................................................................................................... 8
Table 3. Calculation Strategies for Whole-Number Multiplication Problems .............................. 15
Table 4. Demographics of Participants in Study ........................................................................... 29
Table 5. Demographics of Schools ................................................................................................ 29
Table 6. Summary of Pretest and Posttests Scores (Proportion Correct) by Condition ................ 46
Table 7. Summary of MANCOVA Analysis on Posttest Scores .................................................. 48
Table 8. Summary of Session Accuracy by Order and Tool Condition ........................................ 51
Table 9. Summary of Linear Binary Logistic Regression Mixed Model ...................................... 52
Table 10. Summary of Linear Binary Logistic Regression Mixed Model with Strategies ........... 52
Table 11. Post-hoc Least Significant Difference Pairwise Comparisons of Tool Condition ........ 53
Table 12. Summary of Mean Likelihood of Correctness of Tool Condition by Order ................. 54
Table 13. Definitions of Strategy Categories for Data Analysis ................................................... 56
Table 14. Summary of Post-hoc Least Significant Difference Pairwise Comparisons ................. 58
Table 15. Frequencies of Strategies Used by Tool Condition Cross Tabulation of Strategy Use
and Tool Condition ................................................................................................................ 59
vi
ACKNOWLEDGMENTS
I owe many thanks to my advisor, Professor Herbert Ginsburg, for his invaluable
guidance and support. His work and accomplishments have been an inspiration and his advice
was critical to my academic growth and my professional success thus far. I owe him
tremendously for his vision in conducting research on children’s math learning and the use of
technology to support that learning.
I am thankful to the members of my committee. Thank you to Professor James Corter and
Professor Caryn Block for helping me design my study and for welcoming my questions since
early on in this endeavor. They helped me think critically about my measures and how to analyze
my data. Also, I am grateful to Professor Matthew Johnson for patiently listening to my
questions and helping me solve what seemed to be impossible statistical questions. And thank
you to Professor Lisa Son for agreeing to be on my committee at the last minute and for
providing valuable feedback for future research.
I would like to thank the Institute of Education Sciences (IES), National Science
Foundation, Cleveland Dodge Foundation, and the Zankel Fellowship program for providing
generous financial support throughout my research and doctoral studies. I could not have
accomplished this study without the support and wisdom of my fellow MathemAntics team
members: Azadeh Jamalian, Samantha Creighan, Kara Carpenter, Rachael Labrecque, Dana
Pagar, Ben Friedman, and Ama Awotwi. I learned so much from our discussions each week.
Thank you also to my team of dedicated research assistants: Julia (Chen Mu) Xing, Kristin
Slamar, Saba Abebe, Nicole Fletcher, Jessica Lopez, Shimin Kai, Shani Greenman, Krystal
Astwood, Stephanie Realegano, and Jackie Suginaga. I am grateful for your were eagerness to
vii
learn about conducting research in a school setting and your willingness to collect data for this
study.
I am also indebted to my mentors and professors from University of California, Berkeley.
Dr. Della Peretti has been my biggest support and mentor for more than a decade and without
her, I don’t know where I would be. I thank her for academic advice, but more importantly life
advice. I am also deeply grateful to Professor Paul Ammon, Professor Meryl Gearhart, Professor
Alan Schoenfeld, and Professor Dor Abrahamson for their advice and encouraging me to pursue
my doctorate.
My many friends and colleagues at Columbia University – our shared experiences bond
us together and resulted in lasting friendships. Thank you to my office mate and dear friend, Dr.
Azadeh Jamalian. She encouraged me to persevere and always offered a helping hand whenever
I needed her. I offer many thanks to Jenny Kao, with whom I started this journey and am now
graduating with this semester. The writing process and defending our theses at the same time
made this road much smoother. Finally, thank you to my friends from Biology, Physics,
Chemistry, and Anthropology at Columbia: Vitalay Fomin, Daniel Flanigan, Dat Hoang, and
Meghan Chidsey. Thank you for giving me another perspective on research, the many coffees,
and enduring these years of studies with me.
Last, but not least, thank you to my mother, Alice Bog Soo Yoon, my sisters, Grace Yoon
and Suzanne Yoon Molloy, and my brother, David Yoon, for their endless support throughout
my life. I especially thank my mother for making many sacrifices while raising four children on
her own – sometimes working two or three jobs to make ends meet – and for never doubting my
potential to succeed. Also, thank you to my nephews, Max and Oscar Yoon Molloy, for letting
me teach them about math and being my test subjects at all times.

viii
My father, although not with us today, dedicated his life to supporting our family. He
inspired me to work hard and always remember the importance of family. I was the first woman
in my family to earn a master’s degree and now am the first person to earn a doctoral degree.
This dissertation is dedicated to him.

ix
To my dad, David Chang Suk Yoon
1
CHAPTER 1:
THEORETICAL BACKGROUND
Introduction
Mastery of multiplication concepts and procedures is vital to children’s mathematical
achievement in the middle and upper elementary grades. Research shows that children’s early
understanding of math strongly predicts their later success in math (Clements & Sarama, 2007).
However, the most recent report from the National Assessment of Educational Progress (2013)
shows that 58 percent of 4th graders and 64 percent of 8th graders scored at or below basic levels
of math performance. Also, previous research has found that many primary grade children lack
conceptual understandings of multiplication (National Mathematics Advisory Panel, 2008;
O’Brien & Casey, 1983). According to the Common Core State Standards Initiative (National
Governors Association Center for Best Practices & Council of Chief State School Officers [NGA
Center & CCSSO], 2010), by the end of third grade, children need to memorize multiplication
facts up to 100, interpret multiplication equations, and solve word problems involving
multiplicative comparisons. Children need to develop an understanding of arithmetic and we
need a better way of helping children master multiplication – both facts and concepts.
Digital tools, or virtual manipulatives, in math software can help children master their
understanding of mathematical concepts and skills. Several research studies on the usefulness of
virtual manipulatives have shown that children can learn mathematical concepts from
manipulating objects on a computer screen as well as or better than when handling physical
objects (Johnson-Gentile, Clements, & Battista, 1994; Moyer, Niezgoda, & Stanley, 2005;
Reimer & Moyer, 2005). While there are many types of concrete and digital tools that have been
designed to teach math, few tools have been designed to foster the use of specific strategies to
2
improve overall performance on multiplication tasks. This research study empirically examines
two such tools designed to help children master concepts and skills in multiplication.
Digital Tools and Learning
There is increasing potential for children to use computers in elementary school settings
(Clements, 2002). Computer games, web-based lessons, and applications for handheld devices
are now a regular medium for teaching in many schools. Although there is an abundance of
software available, very little offer a comprehensive or research-based curriculum (Ginsburg,
Carpenter, & Labrecque, 2011). One exception to this is a program called Building Blocks
(Sarama & Clements, 2002), which includes printed materials and physical manipulatives for
early childhood classrooms. An evaluative study showed that this program was effective for pre-
kindergarten students, especially for those with low socioeconomic status (Clements & Sarama,
2007). Therefore, it is possible for children to gain valuable experience and learn necessary
mathematical content from engaging with at least some software programs on the computer.
In an effort to connect everyday knowledge of mathematical ideas with formal
representations, researchers have proposed the use of physical objects (Fuson & Briars, 1990;
Moyer, 2001) or graphical displays (Moyer-Packenham, 2005; Moyer-Packenham & Suh, 2012;
Sarama & Clements, 2002). The use of pictures is a common teaching tactic, as one can witness
in many elementary textbooks and everyday practice in classrooms. Since the creation of digital
media and computer games, many designers have attempted to capture these manipulatives and
pictures in a virtual environment. Ohlsson (1987) describes these as interactive illustrations,
where computer graphics allow for the design of visual qualities of an illustration as well as the
structure of the actions associated with them to help the learner grasp the mathematical objects
3
and to observe the laws which regulate their behavior. Interactive illustrations and the language
associated with these pictures and symbols are tools for communicating and transforming
mathematical understanding and thinking processes.
The affordances of digital tools offer researchers an opportunity to rethink the ways in
which representations influence learning (Noss & Hoyles, 2009). Actions performed with digital
tools provide ways for children to make conjectures about mathematical ideas in ways that are
not as easy to do with physical models. Also, children can explore the use of visual models and
strategies more efficiently because of the precision and flexibility of digital models. For
example, using a computer, one can more easily cut a shape into a variety of different
combinations than by using paper and pencil (e.g. cut a hexagon into two trapezoids, two
triangles and two rhombuses, six triangles, triangle and pentagon, and many more). With the
click of a mouse or using a touchscreen, one can manipulate a shape or visual model more
quickly and precisely than when doing these manipulations by hand. This is especially useful for
young children who may still be developing fine motor skills.
Several studies have demonstrated that learners can grasp important mathematical
concepts from manipulating objects on the computer screen as well as or better than when
handling physical objects. One study, by Johnson-Gentile et al. (1994), showed that students
using computers worked with more precision and exactness, demonstrated a higher level of
geometric thinking, and retained their learning better than those using paper and pencil. Reimer
and Moyer (2005) conducted a study on fractions with third-graders, where participants
interacted with virtual manipulatives on the computer. Results showed that students working
with the computer manipulatives made significant gains in conceptual knowledge of fractions.
Additionally, student interviews and attitude surveys indicated that the virtual manipulatives
4
were easier and faster to use than paper-and-pencil methods, enhanced student enjoyment, and
helped by providing immediate and specific feedback. Another study (Moyer et al., 2005)
compared how kindergartners learned with physical versus virtual manipulatives on the
computer. Children who worked on the computer made more patterns and used more elements of
their patterns, and only those who worked with the software created new shapes. These studies
show that using computer-based manipulatives has many advantages and are appropriate for use
in an educational setting.
Multiplication Models, Problem Types, and Strategies
Cognitive scientists and mathematics educators believe that students make sense of
computational procedures by constructing mental models (English, 1997; Grouws, 1992).
Building an understanding of how to use appropriate models in various contexts is essential in
children’s mastery of mathematical operations. In order to mathematize, children must learn to
see, organize, and interpret math problems through the use of mathematical models (Fosnot,
2010). Children may begin modeling math problems using cubes or a drawing, and eventually
these models can be used across different mathematical scenarios. For example, children can use
a number line across various operations, such as addition, subtraction, multiplication, division,
fractions, and more. Although some models have general uses, other models work best for
specific contexts. Multiplication models, such as arrays, number lines, 0-99 charts, and area are
useful in solving problems. Children may learn how to use these models on paper; however,
digitizing these tools can provide a more dynamic learning experience than pencil and paper.
This section discusses important multiplication models, problem types, and strategies to
consider when designing digital tools and software for teaching children multiplication. The
5
researcher differentiates between models and strategies. Models include external structures that
can be manipulated, while strategies are the actions or mental procedures that one uses to solve
problems. Also, models are discussed as they relate to multiplication problem types.
Models and Problem Types. One of the greatest challenges in teaching multiplication is
helping children understand that multiplication has a variety of meanings and is not just a
sequence of isolated facts. Multiplication involves computation and concrete representations
(Lampert, 1986), where one must assess the mathematical scenario, mentally model the problem,
and apply a procedure or strategy to come to a solution. Multiplication problem types or
situations can be classified according to the structure of the quantities involved and the relation
between them (Nesher, 1988; Vergnaud, 1988). Greer (1994) classified multiplication of whole
numbers into four categories: equivalent groups (see 1a in Table 1), multiplicative comparisons,
(see 1b in Table 1), rectangular arrays (see 1e in Table 1), and Cartesian products (see 1d in
Table 1). Wallace and Gurganus (2005) outlined multiplication problems as five types: repeated
addition or grouping and partitioning, (see 1a in Table 1), scalar or multiplicative comparisons
see 1b in Table 1), rate (see 1c in Table 1), Cartesian products (see 1d in Table 1), and area (see
1e in Table 1). Providing experiences with the different meanings of multiplication, especially in
contextual situations, is extremely useful.
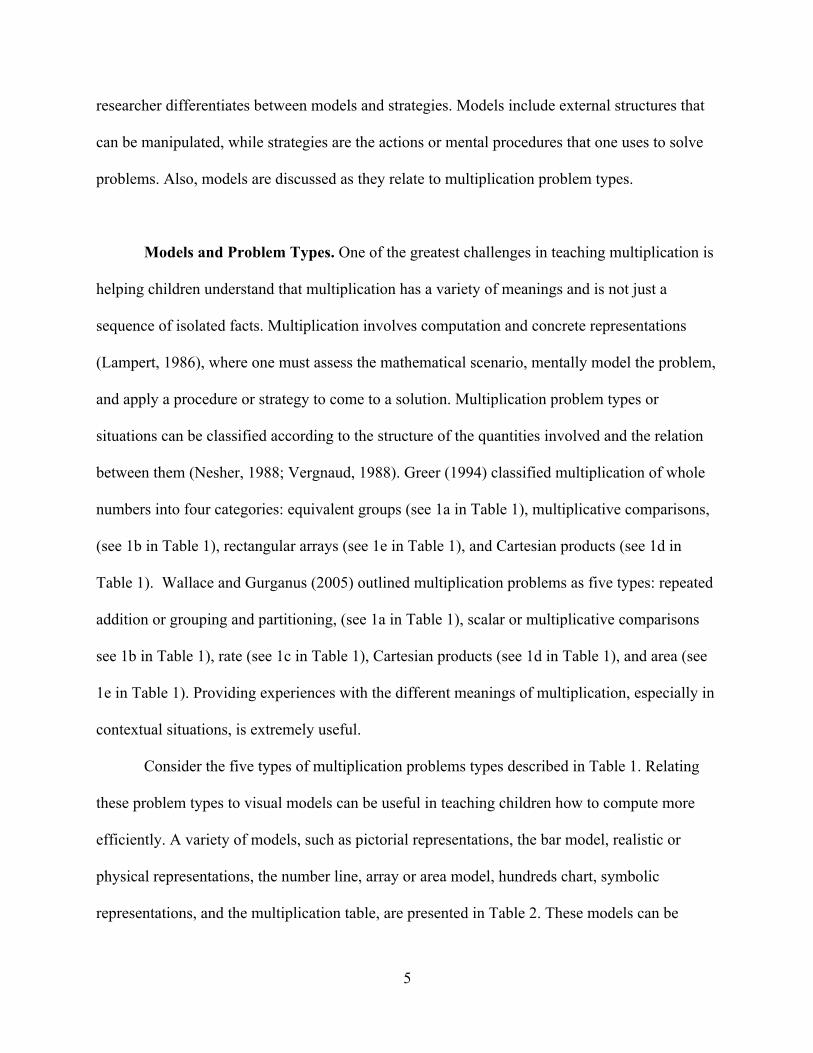
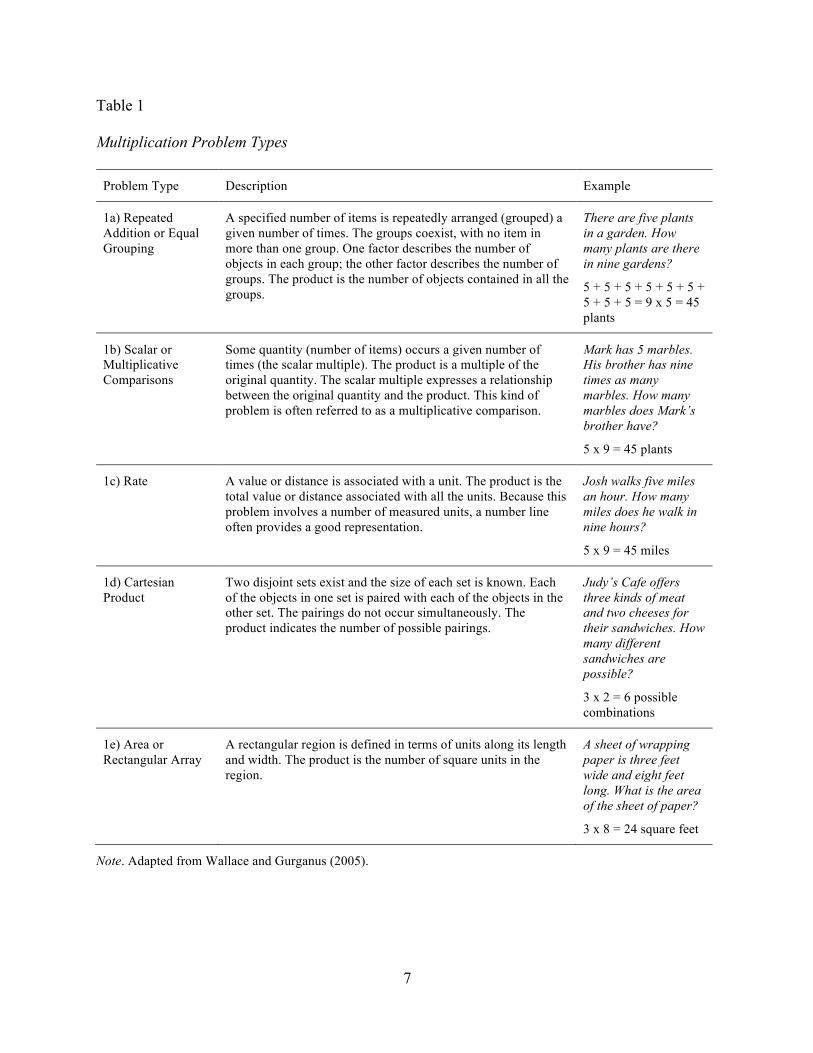
Consider the five types of multiplication problems types described in Table 1. Relating
these problem types to visual models can be useful in teaching children how to compute more
efficiently. A variety of models, such as pictorial representations, the bar model, realistic or
physical representations, the number line, array or area model, hundreds chart, symbolic
representations, and the multiplication table, are presented in Table 2. These models can be

6
useful for conceptualizing and solving various problem types. The following is a discussion on
how specific models are useful for solving particular multiplication problem types.
7
Table 1
Multiplication Problem Types
Problem Type Description Example
1a) Repeated Addition or Equal Grouping
A specified number of items is repeatedly arranged (grouped) a given number of times. The groups coexist, with no item in more than one group. One factor describes the number of objects in each group; the other factor describes the number of groups. The product is the number of objects contained in all the groups.
There are five plants in a garden. How many plants are there in nine gardens?
5 + 5 + 5 + 5 + 5 + 5 + 5 + 5 + 5 = 9 x 5 = 45 plants
1b) Scalar or Multiplicative Comparisons
Some quantity (number of items) occurs a given number of times (the scalar multiple). The product is a multiple of the original quantity. The scalar multiple expresses a relationship between the original quantity and the product. This kind of problem is often referred to as a multiplicative comparison.
Mark has 5 marbles. His brother has nine times as many marbles. How many marbles does Mark’s brother have?
5 x 9 = 45 plants
1c) Rate A value or distance is associated with a unit. The product is the total value or distance associated with all the units. Because this problem involves a number of measured units, a number line often provides a good representation.
Josh walks five miles an hour. How many miles does he walk in nine hours?
5 x 9 = 45 miles
1d) Cartesian Product
Two disjoint sets exist and the size of each set is known. Each of the objects in one set is paired with each of the objects in the other set. The pairings do not occur simultaneously. The product indicates the number of possible pairings.
Judy’s Cafe offers three kinds of meat and two cheeses for their sandwiches. How many different sandwiches are possible?
3 x 2 = 6 possible combinations
1e) Area or Rectangular Array
A rectangular region is defined in terms of units along its length and width. The product is the number of square units in the region.
A sheet of wrapping paper is three feet wide and eight feet long. What is the area of the sheet of paper?
3 x 8 = 24 square feet
Note. Adapted from Wallace and Gurganus (2005).
8
Table 2
Multiplication Models
Model Example Problem Types
2a) Pictorial
Repeated Addition
Scalar or Multiplicative Comparison
2b) Realistic Manipulatives
Repeated Addition
Scalar or Multiplicative Comparison
2c) Bar
Repeated Addition
Scalar or Multiplicative Comparison
Rate
2d) Number Line
Repeated Addition
Scalar or Multiplicative Comparison
2e) Area or Array
Area
Array
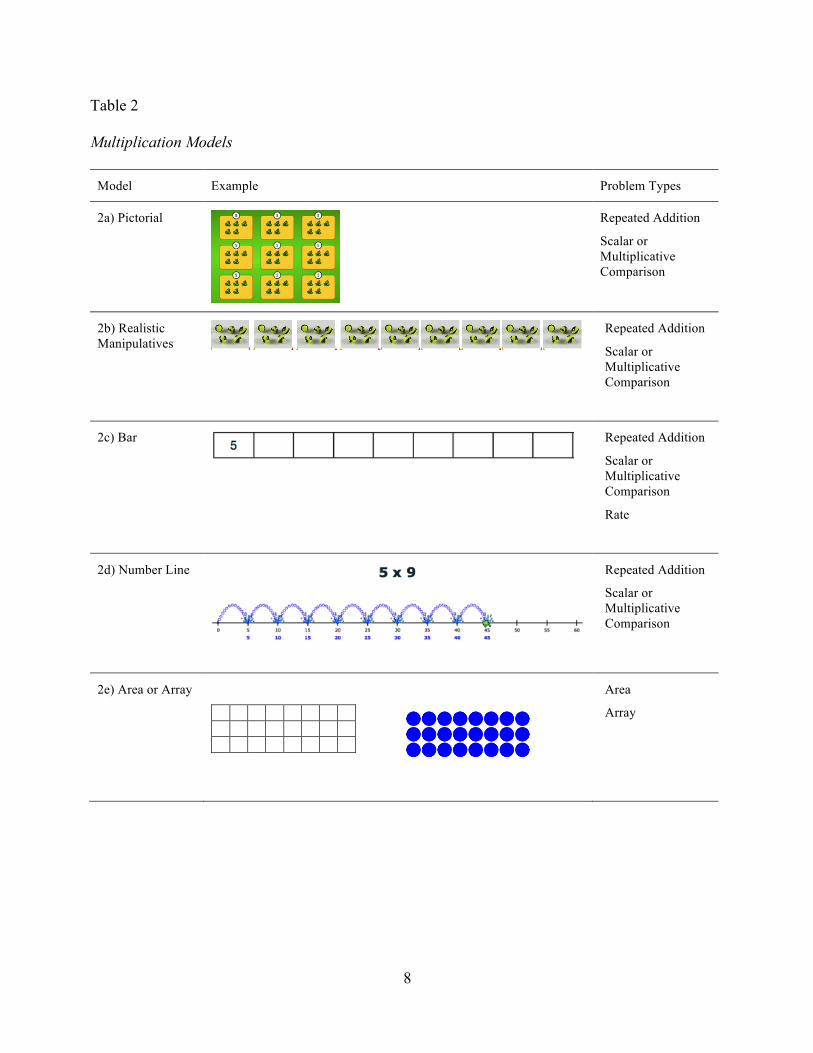
9
2f). Tree Model
Cartesian Product
2g) Hundreds Chart
Repeated Addition
2h) Symbolic 9 x 5 = 45
5 + 5 + 5 + 5 + 5 + 5 + 5 + 5 + 5 = 9 x 5 = 45
All
2i) Multiplication Table
Trivett (1980)
Multiplication Facts and Computation
10
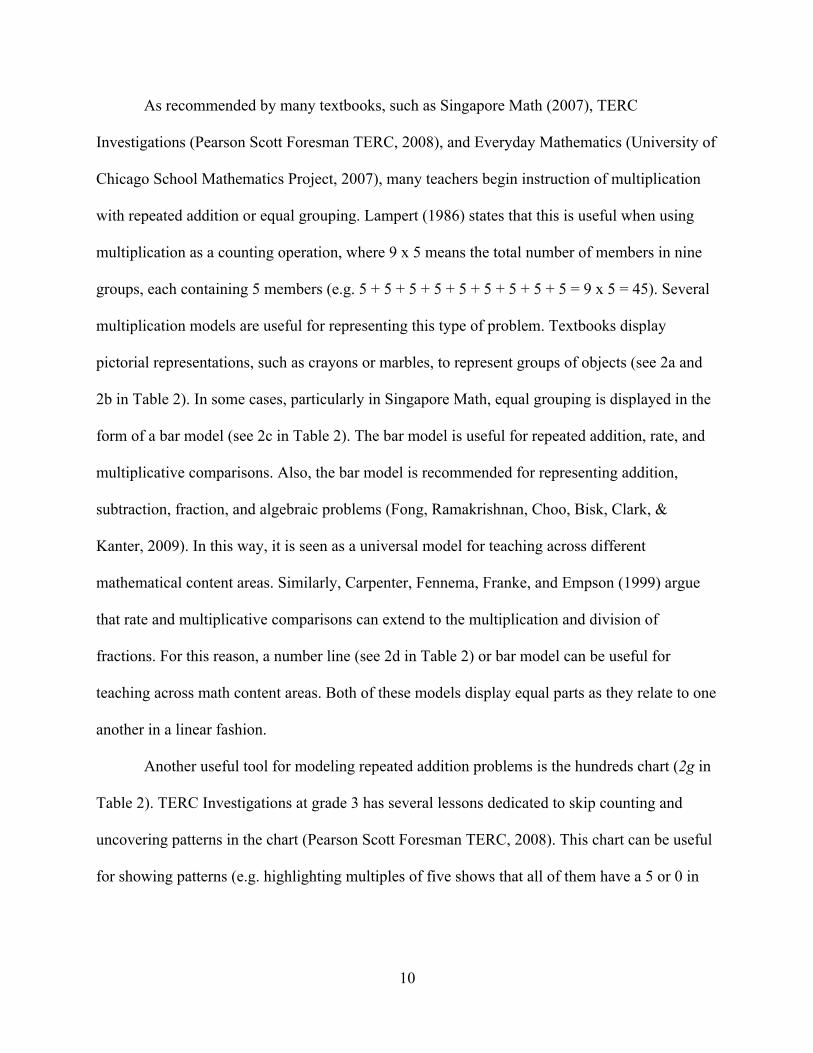
As recommended by many textbooks, such as Singapore Math (2007), TERC
Investigations (Pearson Scott Foresman TERC, 2008), and Everyday Mathematics (University of
Chicago School Mathematics Project, 2007), many teachers begin instruction of multiplication
with repeated addition or equal grouping. Lampert (1986) states that this is useful when using
multiplication as a counting operation, where 9 x 5 means the total number of members in nine
groups, each containing 5 members (e.g. 5 + 5 + 5 + 5 + 5 + 5 + 5 + 5 + 5 = 9 x 5 = 45). Several
multiplication models are useful for representing this type of problem. Textbooks display
pictorial representations, such as crayons or marbles, to represent groups of objects (see 2a and
2b in Table 2). In some cases, particularly in Singapore Math, equal grouping is displayed in the
form of a bar model (see 2c in Table 2). The bar model is useful for repeated addition, rate, and
multiplicative comparisons. Also, the bar model is recommended for representing addition,
subtraction, fraction, and algebraic problems (Fong, Ramakrishnan, Choo, Bisk, Clark, &
Kanter, 2009). In this way, it is seen as a universal model for teaching across different
mathematical content areas. Similarly, Carpenter, Fennema, Franke, and Empson (1999) argue
that rate and multiplicative comparisons can extend to the multiplication and division of
fractions. For this reason, a number line (see 2d in Table 2) or bar model can be useful for
teaching across math content areas. Both of these models display equal parts as they relate to one
another in a linear fashion.
Another useful tool for modeling repeated addition problems is the hundreds chart (2g in
Table 2). TERC Investigations at grade 3 has several lessons dedicated to skip counting and
uncovering patterns in the chart (Pearson Scott Foresman TERC, 2008). This chart can be useful
for showing patterns (e.g. highlighting multiples of five shows that all of them have a 5 or 0 in
11
the ones places) and for identifying common multiples (e.g. twelve is a multiple of 2, 3, 4, and
6).
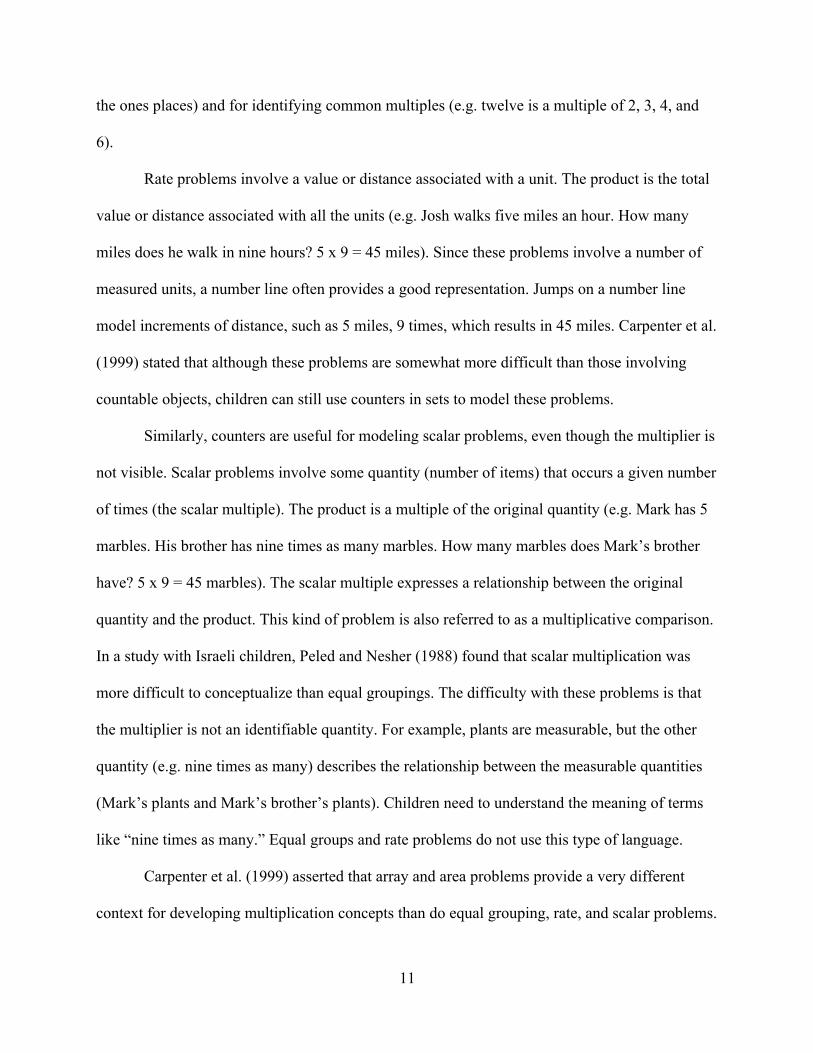
Rate problems involve a value or distance associated with a unit. The product is the total
value or distance associated with all the units (e.g. Josh walks five miles an hour. How many
miles does he walk in nine hours? 5 x 9 = 45 miles). Since these problems involve a number of
measured units, a number line often provides a good representation. Jumps on a number line
model increments of distance, such as 5 miles, 9 times, which results in 45 miles. Carpenter et al.
(1999) stated that although these problems are somewhat more difficult than those involving
countable objects, children can still use counters in sets to model these problems.
Similarly, counters are useful for modeling scalar problems, even though the multiplier is
not visible. Scalar problems involve some quantity (number of items) that occurs a given number
of times (the scalar multiple). The product is a multiple of the original quantity (e.g. Mark has 5
marbles. His brother has nine times as many marbles. How many marbles does Mark’s brother
have? 5 x 9 = 45 marbles). The scalar multiple expresses a relationship between the original
quantity and the product. This kind of problem is also referred to as a multiplicative comparison.
In a study with Israeli children, Peled and Nesher (1988) found that scalar multiplication was
more difficult to conceptualize than equal groupings. The difficulty with these problems is that
the multiplier is not an identifiable quantity. For example, plants are measurable, but the other
quantity (e.g. nine times as many) describes the relationship between the measurable quantities
(Mark’s plants and Mark’s brother’s plants). Children need to understand the meaning of terms
like “nine times as many.” Equal groups and rate problems do not use this type of language.
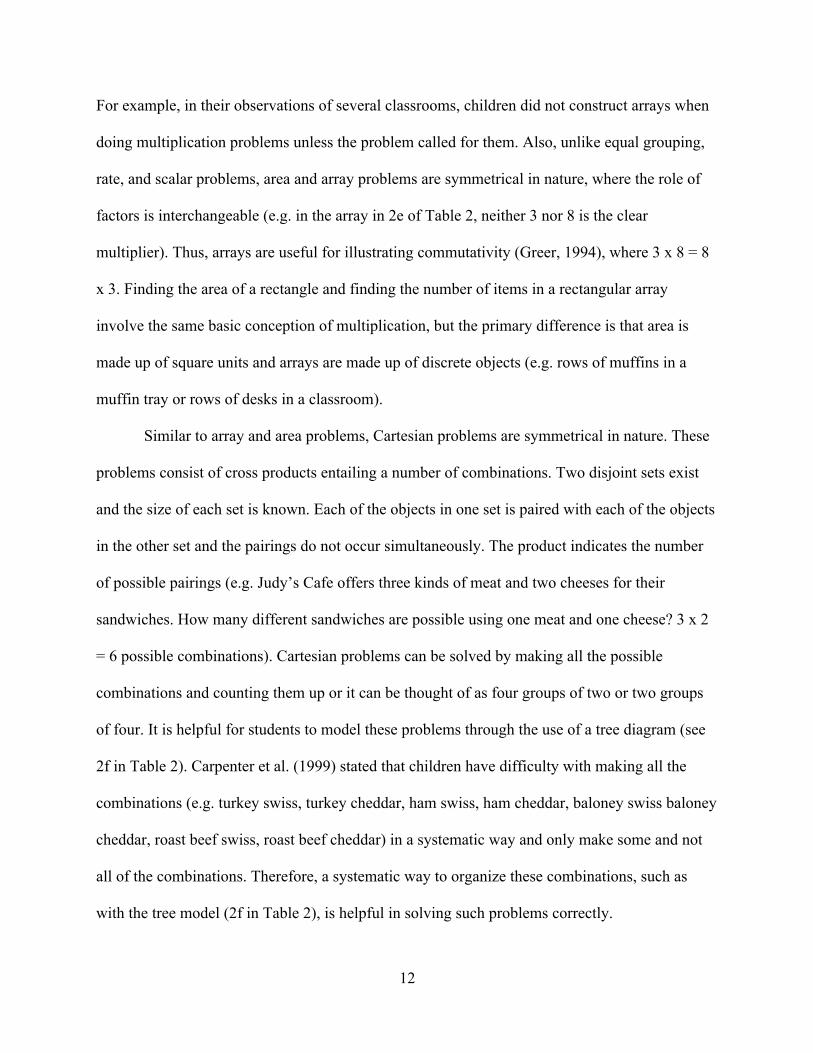
Carpenter et al. (1999) asserted that array and area problems provide a very different
context for developing multiplication concepts than do equal grouping, rate, and scalar problems.
12
For example, in their observations of several classrooms, children did not construct arrays when
doing multiplication problems unless the problem called for them. Also, unlike equal grouping,
rate, and scalar problems, area and array problems are symmetrical in nature, where the role of
factors is interchangeable (e.g. in the array in 2e of Table 2, neither 3 nor 8 is the clear
multiplier). Thus, arrays are useful for illustrating commutativity (Greer, 1994), where 3 x 8 = 8
x 3. Finding the area of a rectangle and finding the number of items in a rectangular array
involve the same basic conception of multiplication, but the primary difference is that area is
made up of square units and arrays are made up of discrete objects (e.g. rows of muffins in a
muffin tray or rows of desks in a classroom).
Similar to array and area problems, Cartesian problems are symmetrical in nature. These
problems consist of cross products entailing a number of combinations. Two disjoint sets exist
and the size of each set is known. Each of the objects in one set is paired with each of the objects
in the other set and the pairings do not occur simultaneously. The product indicates the number
of possible pairings (e.g. Judy’s Cafe offers three kinds of meat and two cheeses for their
sandwiches. How many different sandwiches are possible using one meat and one cheese? 3 x 2
= 6 possible combinations). Cartesian problems can be solved by making all the possible
combinations and counting them up or it can be thought of as four groups of two or two groups
of four. It is helpful for students to model these problems through the use of a tree diagram (see
2f in Table 2). Carpenter et al. (1999) stated that children have difficulty with making all the
combinations (e.g. turkey swiss, turkey cheddar, ham swiss, ham cheddar, baloney swiss baloney
cheddar, roast beef swiss, roast beef cheddar) in a systematic way and only make some and not
all of the combinations. Therefore, a systematic way to organize these combinations, such as
with the tree model (2f in Table 2), is helpful in solving such problems correctly.
13
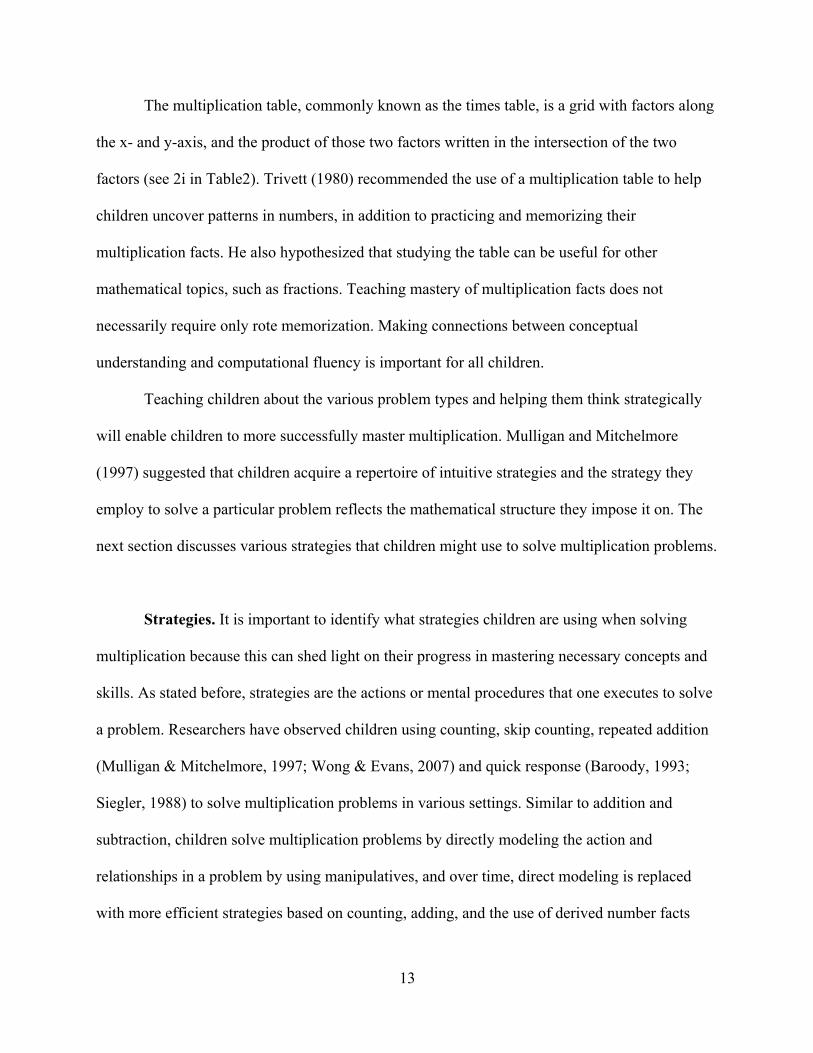
The multiplication table, commonly known as the times table, is a grid with factors along
the x- and y-axis, and the product of those two factors written in the intersection of the two
factors (see 2i in Table2). Trivett (1980) recommended the use of a multiplication table to help
children uncover patterns in numbers, in addition to practicing and memorizing their
multiplication facts. He also hypothesized that studying the table can be useful for other
mathematical topics, such as fractions. Teaching mastery of multiplication facts does not
necessarily require only rote memorization. Making connections between conceptual
understanding and computational fluency is important for all children.
Teaching children about the various problem types and helping them think strategically
will enable children to more successfully master multiplication. Mulligan and Mitchelmore
(1997) suggested that children acquire a repertoire of intuitive strategies and the strategy they
employ to solve a particular problem reflects the mathematical structure they impose it on. The
next section discusses various strategies that children might use to solve multiplication problems.
Strategies. It is important to identify what strategies children are using when solving
multiplication because this can shed light on their progress in mastering necessary concepts and
skills. As stated before, strategies are the actions or mental procedures that one executes to solve
a problem. Researchers have observed children using counting, skip counting, repeated addition
(Mulligan & Mitchelmore, 1997; Wong & Evans, 2007) and quick response (Baroody, 1993;
Siegler, 1988) to solve multiplication problems in various settings. Similar to addition and
subtraction, children solve multiplication problems by directly modeling the action and
relationships in a problem by using manipulatives, and over time, direct modeling is replaced
with more efficient strategies based on counting, adding, and the use of derived number facts
14
(Carpenter et al., 1999). Counting of objects, physical or virtual, is considered to be the least
sophisticated of the strategies listed. In a series of interviews of teachers in grades one to three,
teachers reported that students used multiple strategies to solve problems and that they
discouraged children from using less sophisticated ones, such as counting on fingers (Siegler,
1988). As one advances in mastery of multiplication, the use of physical objects to represent
quantities in calculations is replaced by an increased ability to create abstract representations
linguistically, visually, mentally, or by an increased ability to memorize or use algorithms
(Levine, Jordan, & Huttenlocher, 1992).
In discussing strategy, the researcher differentiates between a mental strategy (done in
one’s head) and the manipulation of a tool (pencil and paper or digital). Consider the list of
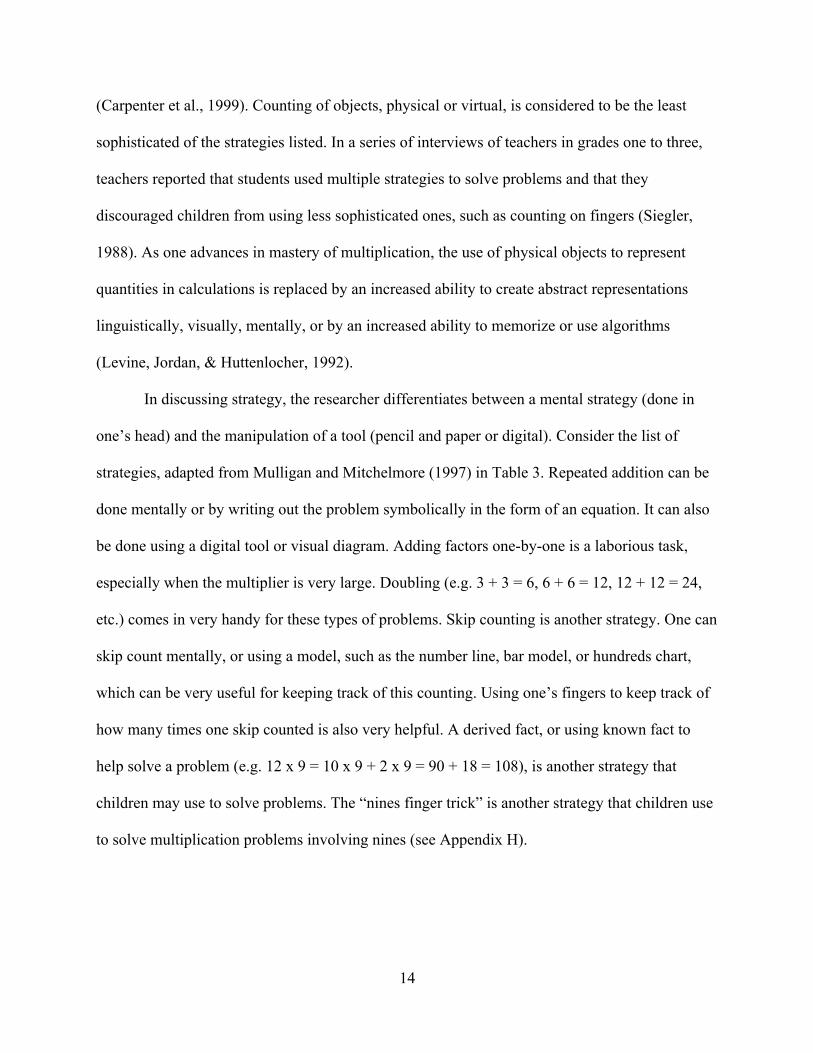
strategies, adapted from Mulligan and Mitchelmore (1997) in Table 3. Repeated addition can be
done mentally or by writing out the problem symbolically in the form of an equation. It can also
be done using a digital tool or visual diagram. Adding factors one-by-one is a laborious task,
especially when the multiplier is very large. Doubling (e.g. 3 + 3 = 6, 6 + 6 = 12, 12 + 12 = 24,
etc.) comes in very handy for these types of problems. Skip counting is another strategy. One can
skip count mentally, or using a model, such as the number line, bar model, or hundreds chart,
which can be very useful for keeping track of this counting. Using one’s fingers to keep track of
how many times one skip counted is also very helpful. A derived fact, or using known fact to
help solve a problem (e.g. 12 x 9 = 10 x 9 + 2 x 9 = 90 + 18 = 108), is another strategy that
children may use to solve problems. The “nines finger trick” is another strategy that children use
to solve multiplication problems involving nines (see Appendix H).
15
Table 3
Calculation Strategies for Whole-Number Multiplication Problems
Strategy Definition
1. Fast Answer in less than 3 seconds 2. Repeated Addition Adding each factor one-by-one (e.g. 3 + 3 = 6, 6 + 3 = 9)
or doubling (e.g. 3 + 3 = 6, 6 + 6 =12). 3. Skip Counting Count by multiples to find answer (e.g. 3x4, "Three, six,
nine, twelve."). 4. Derived Fact Use a known fact to help solve a problem (e.g. 12 x 9,
child says, “10 times 9 equals 90, 90 plus 18 equals 108." or 12 x 9, child says, “11 times 9 equals 99, 99 plus 9 equals 108.").
5.Nines Finger Trick Child uses fingers to figure out multiples of nine. 6. Tool Manipulation of a digital tool or use of a diagram, such as
hundreds chart, multiplication chart, chart paper. 7. Counting Direct counting of physical objects, pictures, or diagrams. 8. Delayed Answer is stated without any expressed strategy in 3
seconds or more.
Note. Adapted from Mulligan and Mitchelmore (1997).
16
Finally, children will often solve a problem by simply stating an answer to a
multiplication problem without using any apparent strategy. There has been some debate on what
a quick response means. Does a quick response mean the answer is from a memorized fact?
Research studies measuring children’s strategy use code behavior based on what children
express. Siegler (1988) defined a retrieved response as an expressed answer in four seconds or
less, whereas Baroody (1993) argued that these quick, correct answers may stem either from
accessing a relationship or retrieving facts from memory. Quick responses can be from memory
or a known relationship such as the commutative property (e.g. “I know 3 x 6 = 18, so 6 x 3 =
18.”). Instead of focusing so much on whether these quick responses are indeed from memory, in
this study, quick response is defined as an automatized or fast strategy, where one can produce a
response correctly in three seconds or less. A delayed response is one that displays no other
strategy and is expressed in more than three seconds.
As discussed in previously, children use various strategies to solve multiplication
problems. Using models can help children organize their thoughts and more accurately execute a
strategy. Digitizing multiplication models offer a way for children to learn, practice, and acquire
skills in solving multiplication problems. The next section discusses the design of multiplication
tools within MathemAntics, a comprehensive mathematics software program developed by
Ginsburg and colleagues, which is the focus of the present studies.
Teaching and Learning of Multiplication Procedures and Concepts through the Use of Digital Tools
Focusing on the operation of multiplying two numbers or memorizing facts without
understanding multiplicative situations and the quantities involved, narrows children’s focus and
gives the wrong impression about the need to understand what it means to multiply. Further,
17
children may not understand how to apply multiplicative computations to real world problems.
Digital tools in Multiplication, such as the Number Line Tool, Morphing Hundreds Chart,
Repeated Addition Tool, and 0-99 Chart can help children understand what multiplication means
and provides models to illustrate the underlying concepts in multiplying.
In the context of school-aged children, there seems to be an overemphasis on facts and
procedures, which can result in an impoverished understanding of concepts of multiplication
(Smith & Smith, 2006). Posing questions and providing adequate opportunities to practice using
procedures, along with conceptual knowledge to support the operations, can lead to mastery of
multiplication.
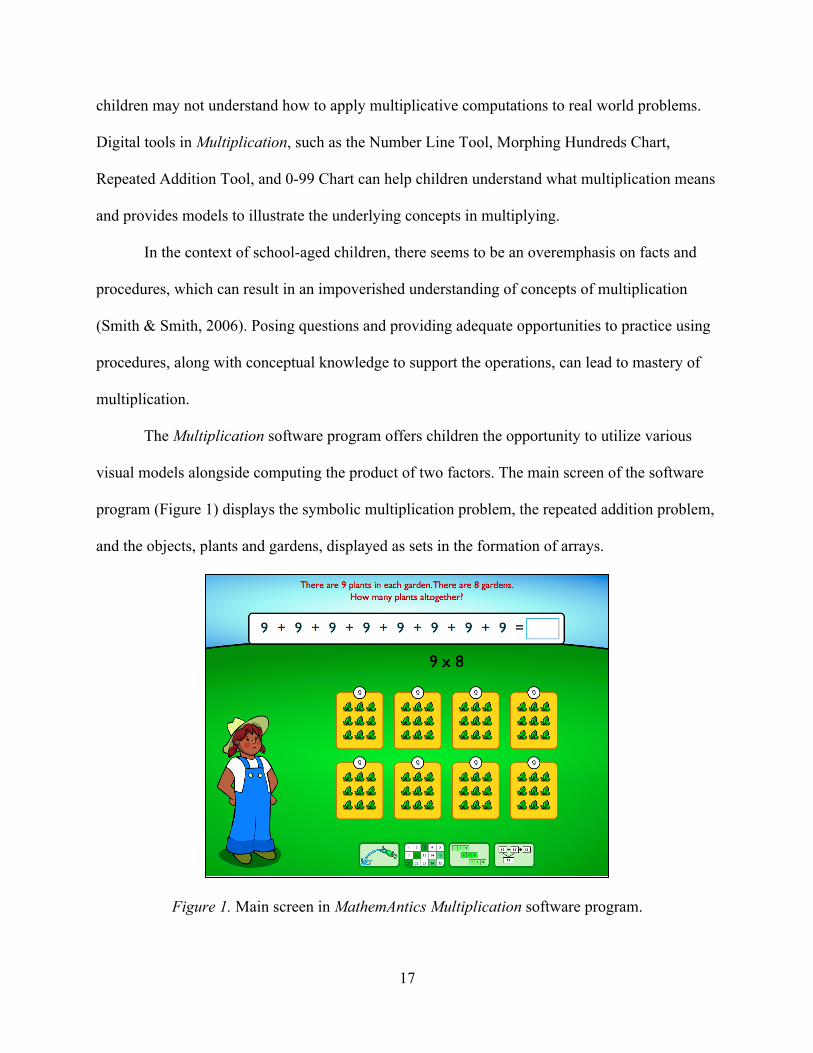
The Multiplication software program offers children the opportunity to utilize various
visual models alongside computing the product of two factors. The main screen of the software
program (Figure 1) displays the symbolic multiplication problem, the repeated addition problem,
and the objects, plants and gardens, displayed as sets in the formation of arrays.
Figure 1. Main screen in MathemAntics Multiplication software program.
18
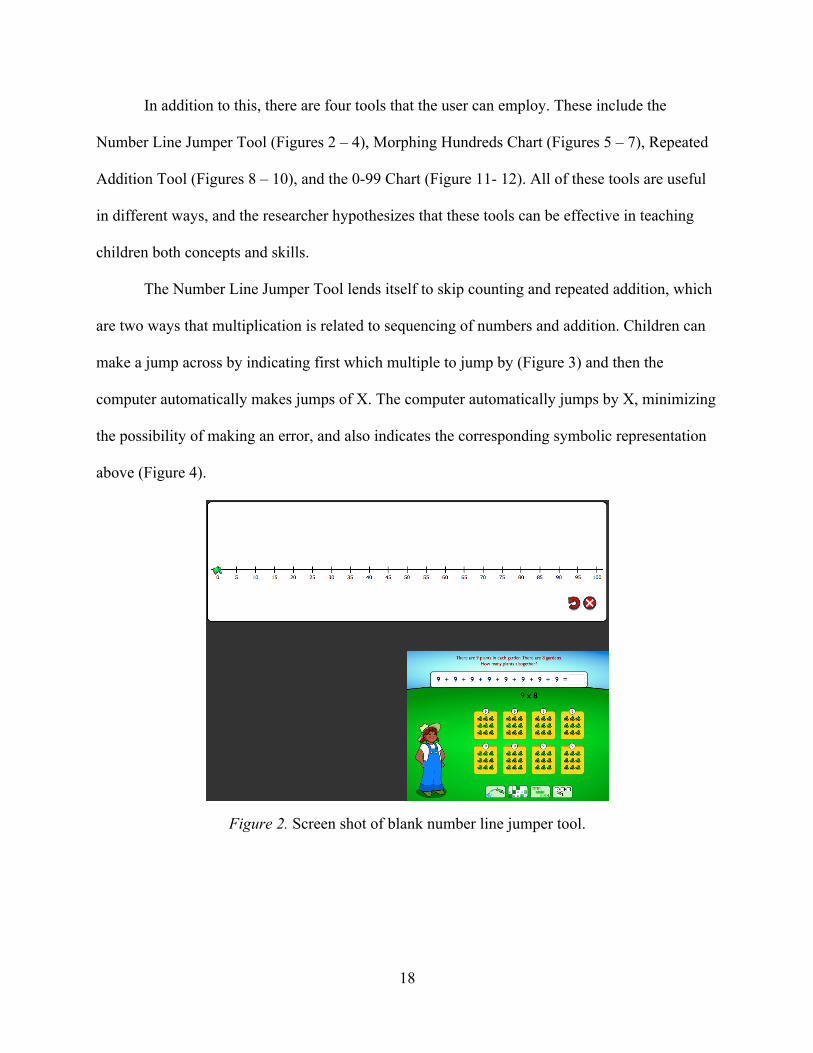
In addition to this, there are four tools that the user can employ. These include the
Number Line Jumper Tool (Figures 2 – 4), Morphing Hundreds Chart (Figures 5 – 7), Repeated
Addition Tool (Figures 8 – 10), and the 0-99 Chart (Figure 11- 12). All of these tools are useful
in different ways, and the researcher hypothesizes that these tools can be effective in teaching
children both concepts and skills.
The Number Line Jumper Tool lends itself to skip counting and repeated addition, which
are two ways that multiplication is related to sequencing of numbers and addition. Children can
make a jump across by indicating first which multiple to jump by (Figure 3) and then the
computer automatically makes jumps of X. The computer automatically jumps by X, minimizing
the possibility of making an error, and also indicates the corresponding symbolic representation
above (Figure 4).
Figure 2. Screen shot of blank number line jumper tool.
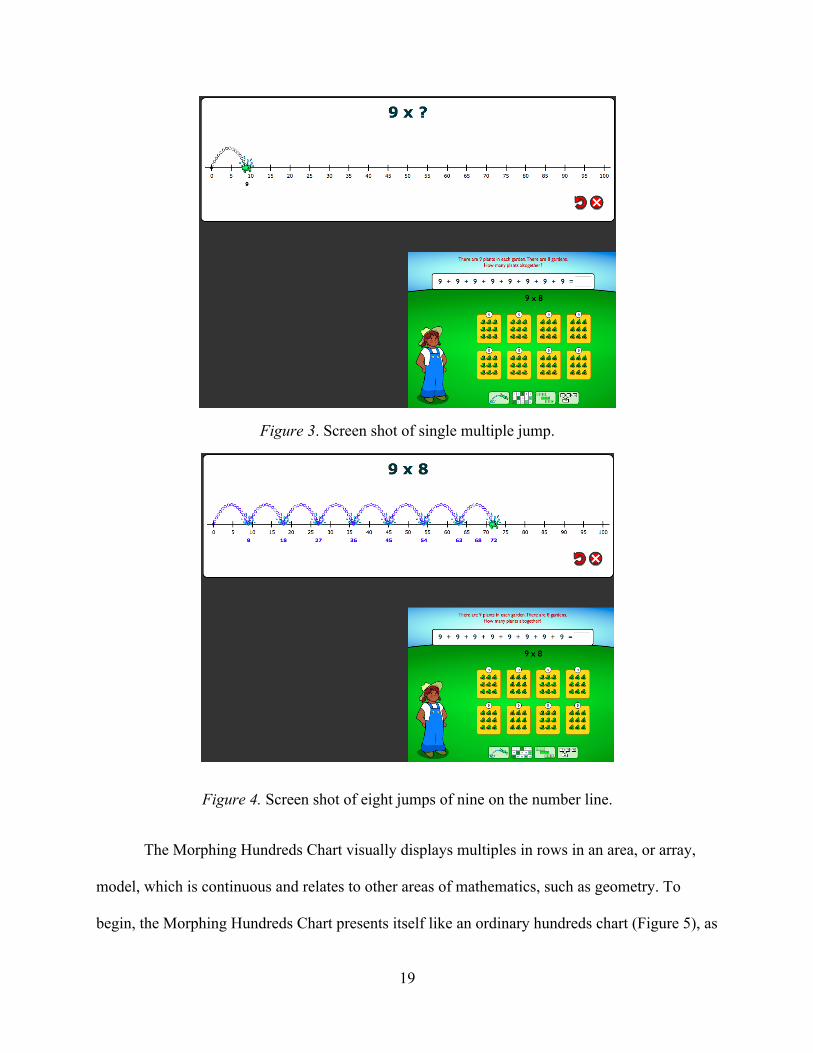
19
Figure 3. Screen shot of single multiple jump.
Figure 4. Screen shot of eight jumps of nine on the number line.
The Morphing Hundreds Chart visually displays multiples in rows in an area, or array,
model, which is continuous and relates to other areas of mathematics, such as geometry. To
begin, the Morphing Hundreds Chart presents itself like an ordinary hundreds chart (Figure 5), as
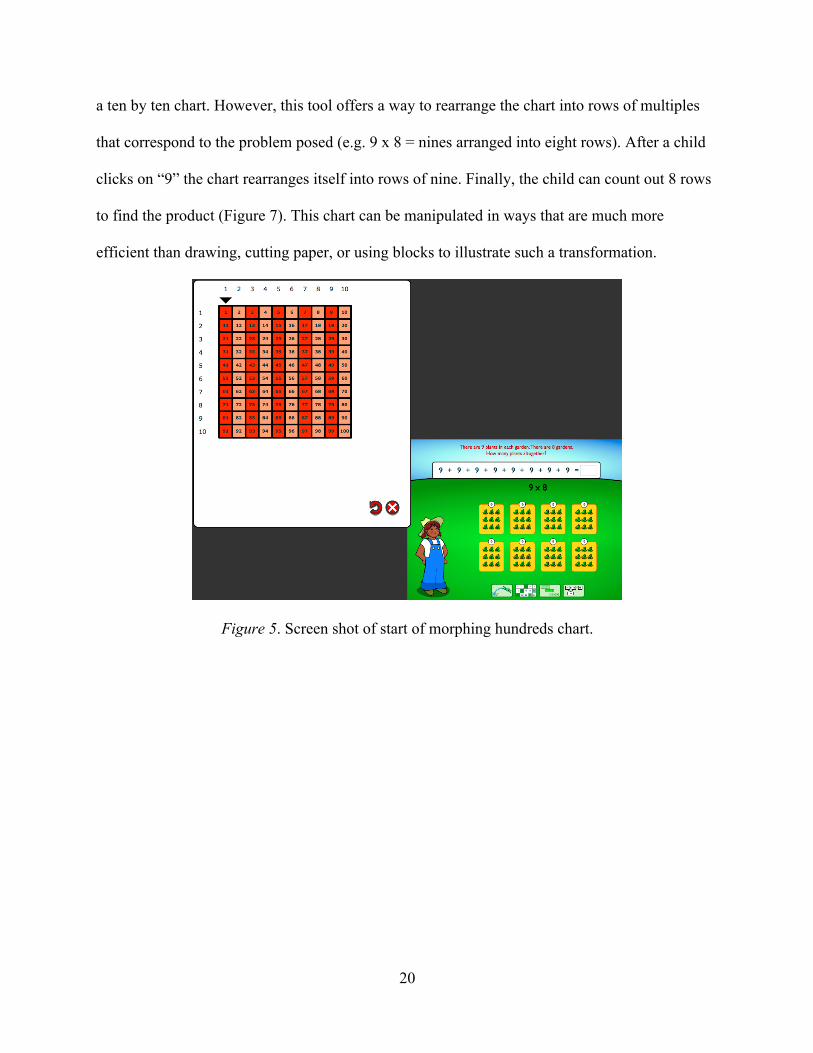
20
a ten by ten chart. However, this tool offers a way to rearrange the chart into rows of multiples
that correspond to the problem posed (e.g. 9 x 8 = nines arranged into eight rows). After a child
clicks on “9” the chart rearranges itself into rows of nine. Finally, the child can count out 8 rows
to find the product (Figure 7). This chart can be manipulated in ways that are much more
efficient than drawing, cutting paper, or using blocks to illustrate such a transformation.
Figure 5. Screen shot of start of morphing hundreds chart.
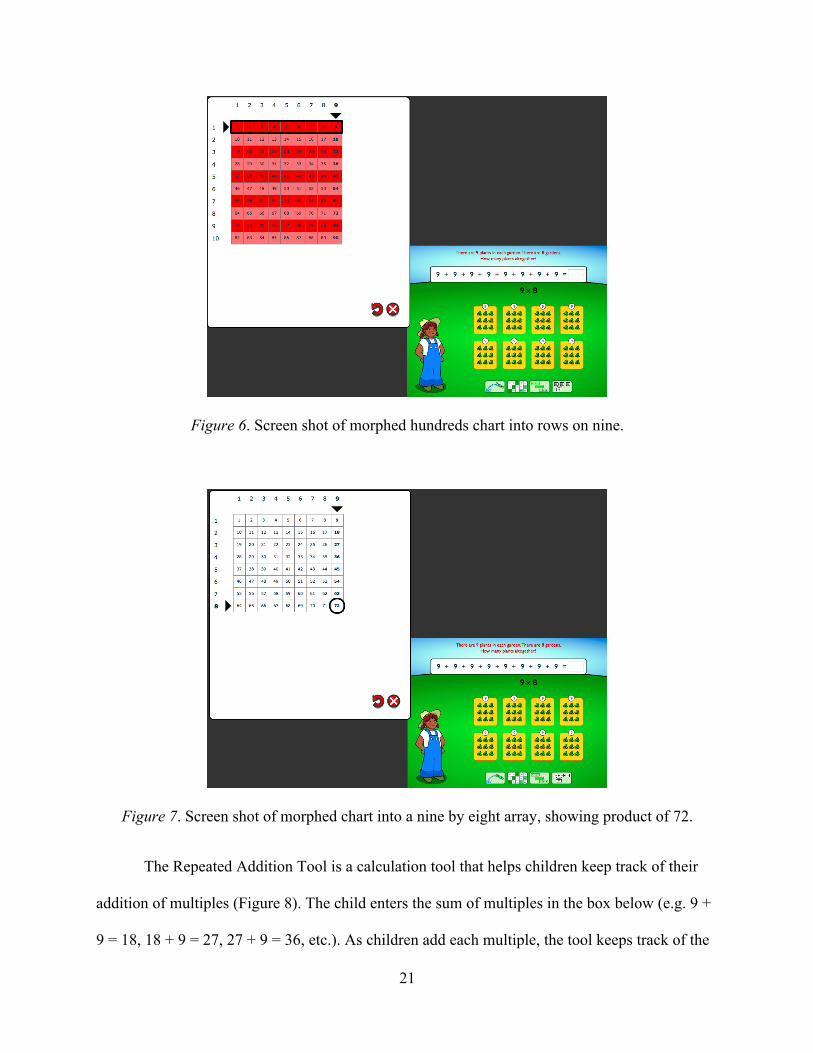
21
Figure 6. Screen shot of morphed hundreds chart into rows on nine.
Figure 7. Screen shot of morphed chart into a nine by eight array, showing product of 72.
The Repeated Addition Tool is a calculation tool that helps children keep track of their
addition of multiples (Figure 8). The child enters the sum of multiples in the box below (e.g. 9 +
9 = 18, 18 + 9 = 27, 27 + 9 = 36, etc.). As children add each multiple, the tool keeps track of the
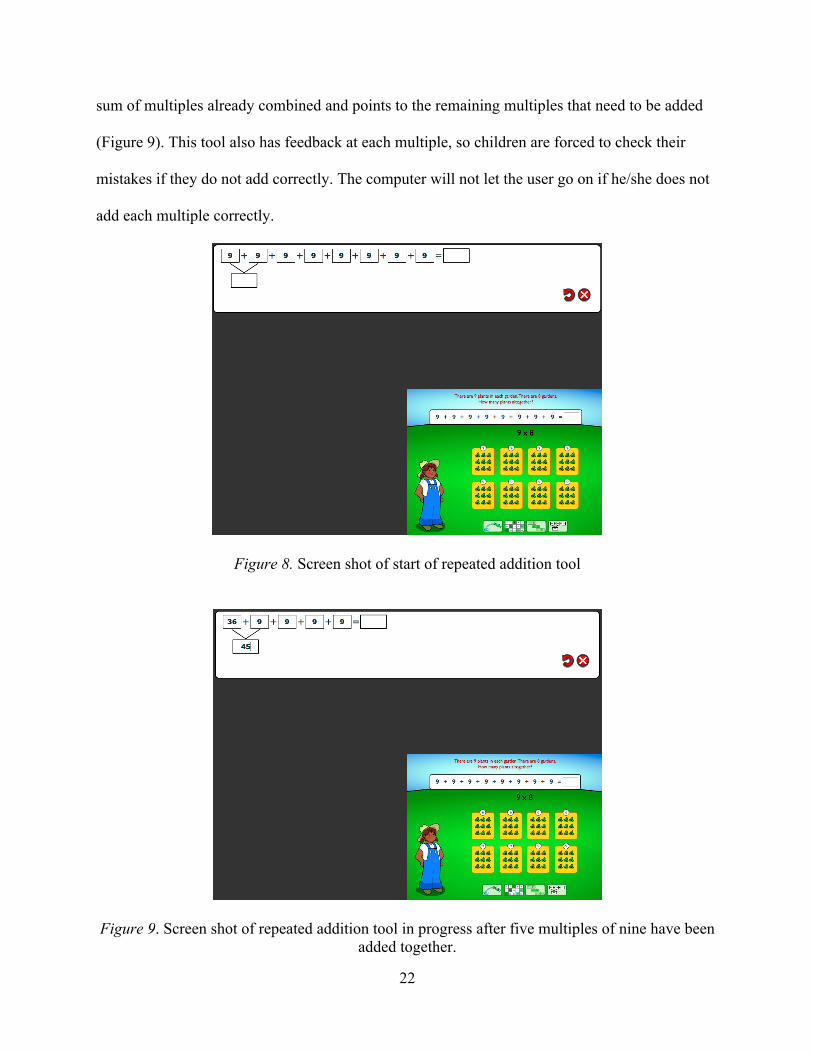
22
sum of multiples already combined and points to the remaining multiples that need to be added
(Figure 9). This tool also has feedback at each multiple, so children are forced to check their
mistakes if they do not add correctly. The computer will not let the user go on if he/she does not
add each multiple correctly.
Figure 8. Screen shot of start of repeated addition tool
Figure 9. Screen shot of repeated addition tool in progress after five multiples of nine have been added together.
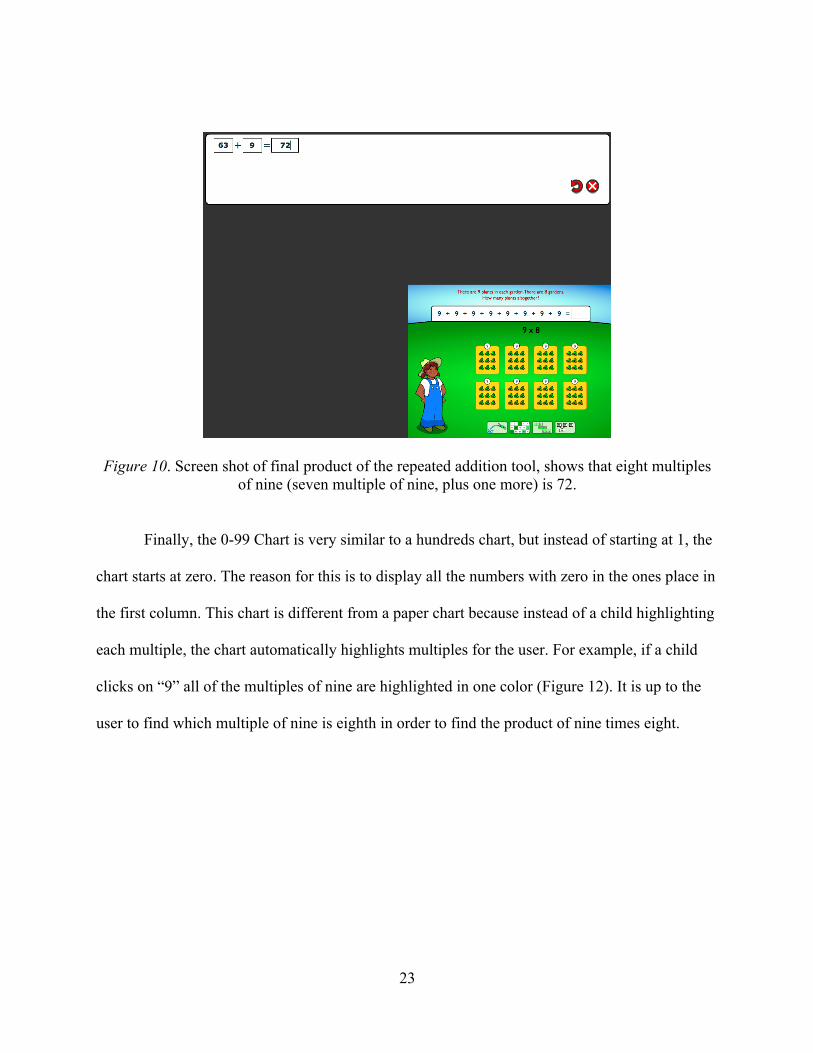
23
Figure 10. Screen shot of final product of the repeated addition tool, shows that eight multiples of nine (seven multiple of nine, plus one more) is 72.
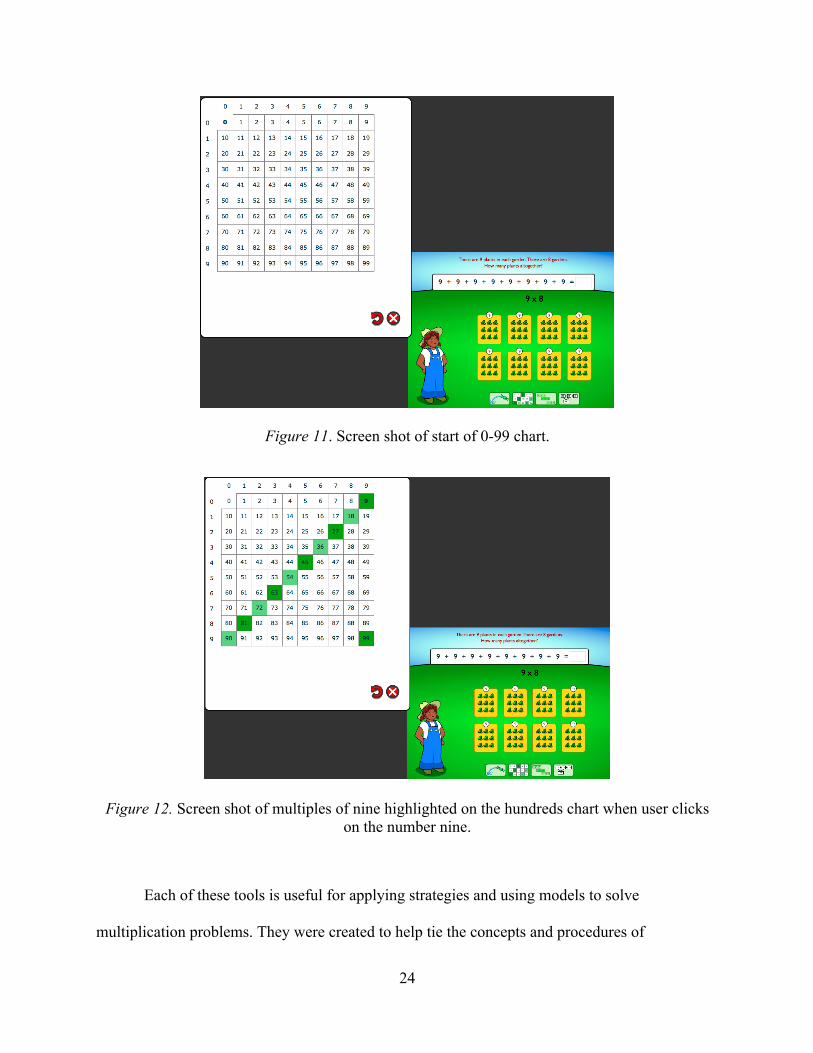
Finally, the 0-99 Chart is very similar to a hundreds chart, but instead of starting at 1, the
chart starts at zero. The reason for this is to display all the numbers with zero in the ones place in
the first column. This chart is different from a paper chart because instead of a child highlighting
each multiple, the chart automatically highlights multiples for the user. For example, if a child
clicks on “9” all of the multiples of nine are highlighted in one color (Figure 12). It is up to the
user to find which multiple of nine is eighth in order to find the product of nine times eight.
24
Figure 11. Screen shot of start of 0-99 chart.
Figure 12. Screen shot of multiples of nine highlighted on the hundreds chart when user clicks on the number nine.
Each of these tools is useful for applying strategies and using models to solve
multiplication problems. They were created to help tie the concepts and procedures of

25
multiplication together. They provide a way for children to see and also manipulate models that
help them conceptualize and compute the product of two numbers in ways that are more efficient
and might not be possible on paper, particularly in the case of the Morphing Hundreds Chart.
26
Study Goals
The aim of this research study is to examine the effectiveness of two digital tools with the
MathemAntics Multiplication software program: a virtual number line (Jumper Tool); and a
dynamic hundreds chart (Morphing Chart) in improving children’s understanding of
multiplication and number sense. To measure the overall effectiveness of the software and the
individual tools, three groups (Jumper, Morphing, and Control) are compared to one another.
Because the Jumper Tool enables children to explore multiplication as a linear function and the
Morphing Chart enables children to manipulate an area model, the hypothesis is that there will be
differences in performance between the two treatment groups from pre- to posttest and during
treatment sessions. Also, because the Jumper Tool might be easier to understand and relate to
commonly used models, such as a number line, it is expected that those children who use the
Jumper Tool will perform better than when using the Morphing Chart. Additionally, it is
expected that strategies, such as using known multiplication facts and efficient counting
strategies will help children solve problems more successfully than other strategies, such as
adding multiples one-by-one.
Research Questions
1) Is the Multiplication software program effective in improving children’s conceptual and
procedural understanding of multiplication and/or general number sense?
2) Are there differences in performance when given two different tools, Jumper or Morphing,
while using the Multiplication software program?

27
3) Are specific strategies, such as known multiplication facts and efficient counting strategies,
predictive of children’s success on multiplication and/or number sense tasks? If so, which
strategies?
28
CHAPTER 2:
METHOD
Design
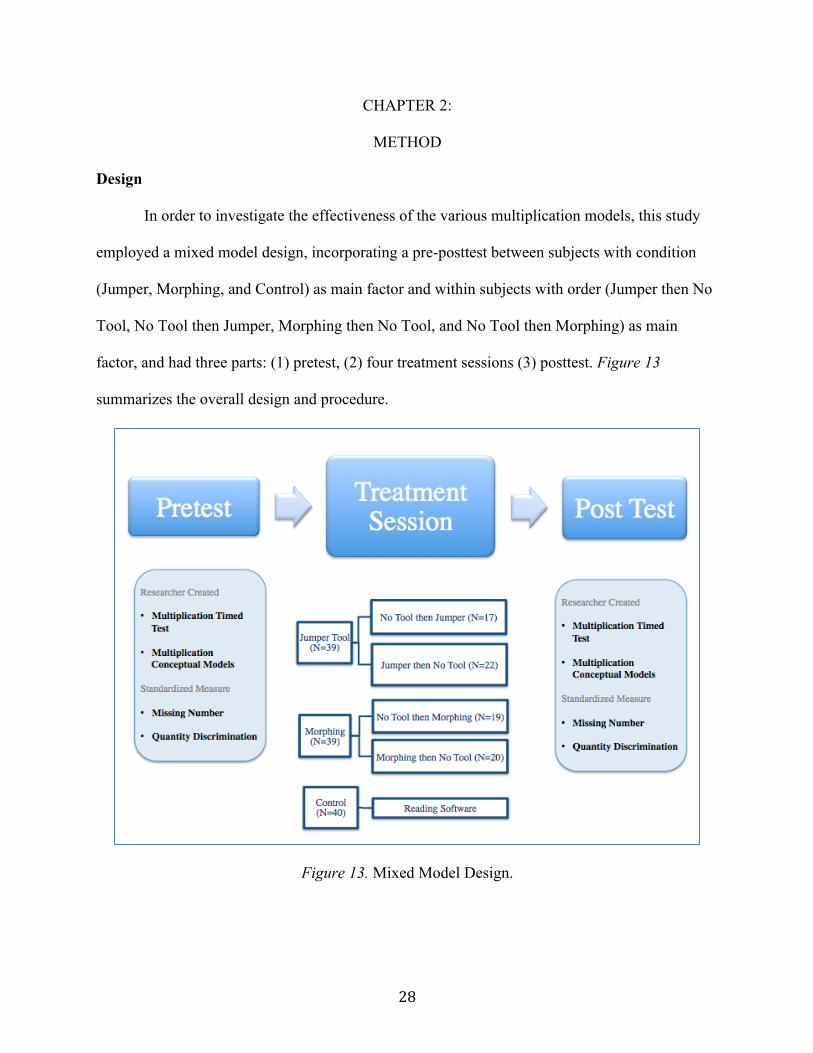
In order to investigate the effectiveness of the various multiplication models, this study
employed a mixed model design, incorporating a pre-posttest between subjects with condition
(Jumper, Morphing, and Control) as main factor and within subjects with order (Jumper then No
Tool, No Tool then Jumper, Morphing then No Tool, and No Tool then Morphing) as main
factor, and had three parts: (1) pretest, (2) four treatment sessions (3) posttest. Figure 13
summarizes the overall design and procedure.
Figure 13. Mixed Model Design.
29
Participants
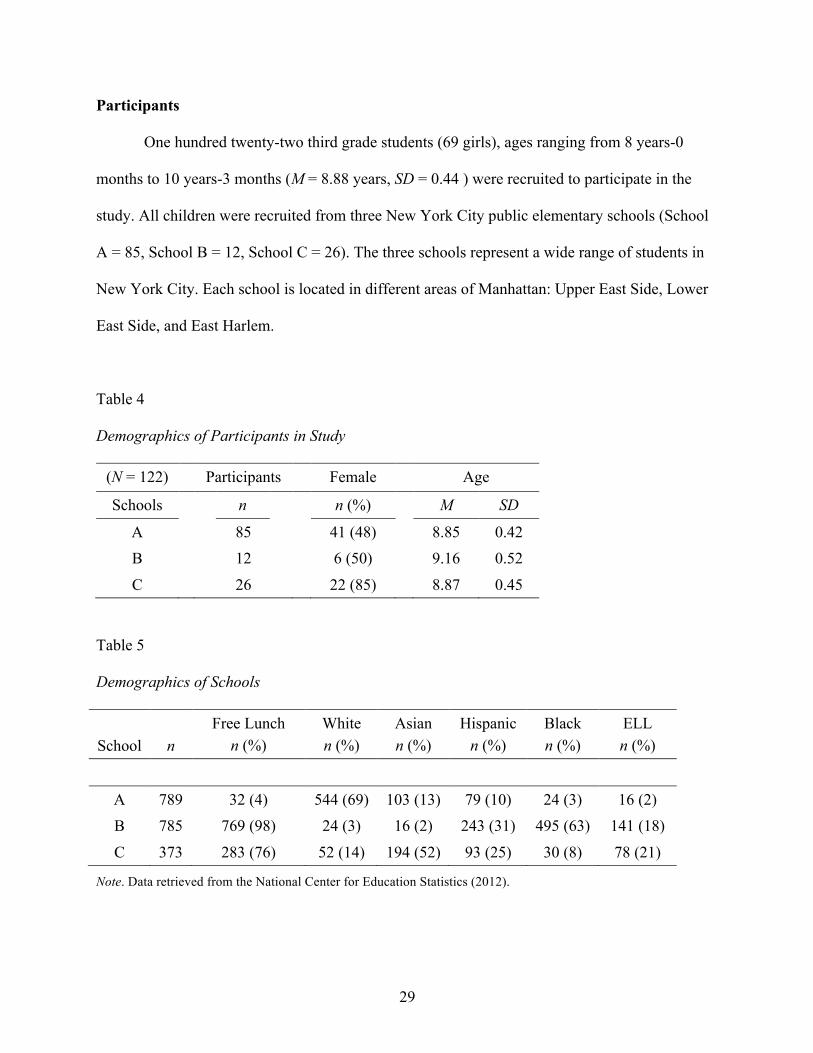
One hundred twenty-two third grade students (69 girls), ages ranging from 8 years-0
months to 10 years-3 months (M = 8.88 years, SD = 0.44 ) were recruited to participate in the
study. All children were recruited from three New York City public elementary schools (School
A = 85, School B = 12, School C = 26). The three schools represent a wide range of students in
New York City. Each school is located in different areas of Manhattan: Upper East Side, Lower
East Side, and East Harlem.
Table 4
Demographics of Participants in Study
(N = 122) Participants Female Age
Schools n n (%) M SD
A 85 41 (48) 8.85 0.42 B 12 6 (50) 9.16 0.52
C 26 22 (85) 8.87 0.45 Table 5
Demographics of Schools
School n Free Lunch
n (%) White n (%)
Asian n (%)
Hispanic n (%)
Black n (%)
ELL n (%)
A 789 32 (4) 544 (69) 103 (13) 79 (10) 24 (3) 16 (2) B 785 769 (98) 24 (3) 16 (2) 243 (31) 495 (63) 141 (18)
C 373 283 (76) 52 (14) 194 (52) 93 (25) 30 (8) 78 (21)
Note. Data retrieved from the National Center for Education Statistics (2012).
30
Participants were recruited through fliers sent home by their teachers and through parent
meetings at schools. Parents consented to having their children video or audio taped and to
sharing the videos in an educational setting. Children also signed assent forms before pretests
were administered. Principals and teachers were compensated with gift cards for school supplies.
Random assignment was performed within classrooms, where each class was randomly divided
into the three treatment groups – Jumper, Morphing, and Control – and within the treatment
groups, children were assigned to two different ordering conventions – Tool then No Tool and
Tool then No Tool. Finally, three participants dropped out of the study due to one child opting
out on her own, and two others who were repeatedly absent due to family vacations during the
study.
Tasks
This section gives a brief description of the pretest, intervention, and posttest tasks. The
pre- and post-test tasks measured children’s knowledge of number sense, conceptual
understanding of multiplication, and mastery of multiplication facts. The treatment tasks
consisted of Multiplication software items and a reading software program. Additional
information on how these tasks were administered is described in more detail in the Procedure
section.
Pretest and Posttest Tasks
Missing Number task (MN). The MN task is a standardized measure from an assessment
program called mClass:Math (Lee et al., 2010). The tests from mClass:Math are standardized,
paper-based assessments that were designed to assess number skills and understanding for
children from kindergarten to third grade. The MN task evaluates a student’s recognition of basic
31
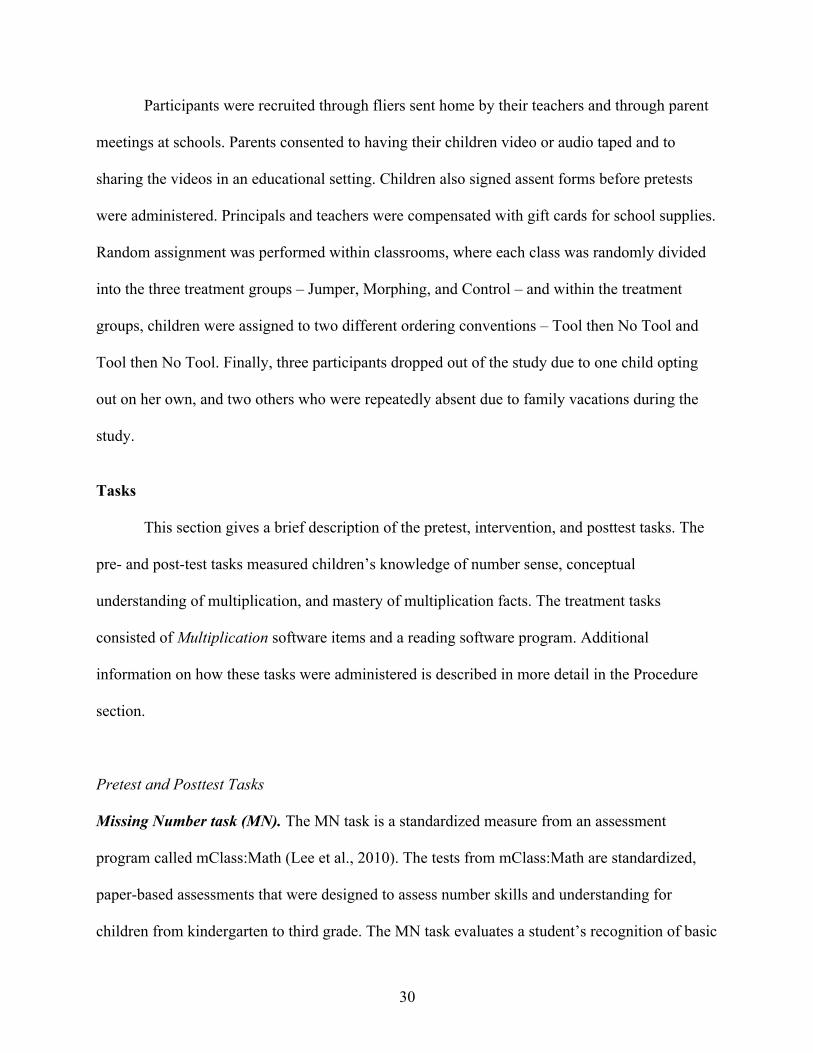
and complex number patterns and familiarity with printed numbers (Figure 14). See Appendix A
for full measure. Those who can quickly and accurately identify the number that is missing
demonstrate that they can recognize and make use of fundamental patterns within a number
sequence.
Figure 14. Examples of Missing Number task.
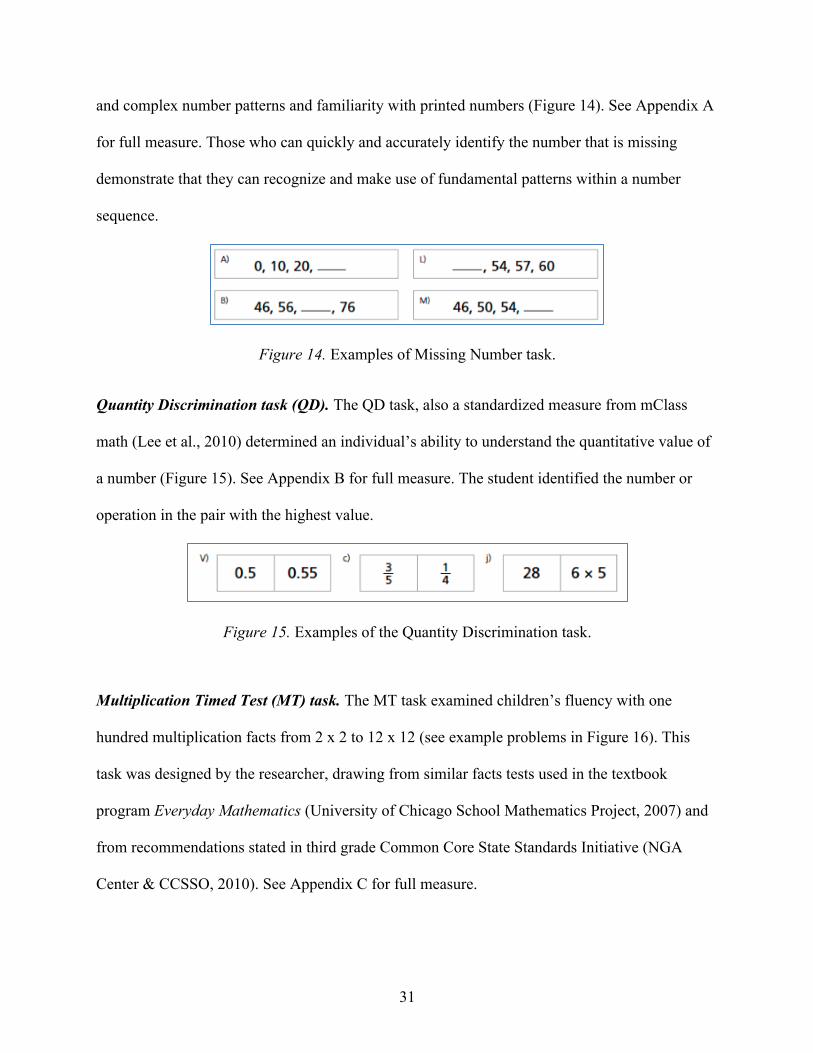
Quantity Discrimination task (QD). The QD task, also a standardized measure from mClass
math (Lee et al., 2010) determined an individual’s ability to understand the quantitative value of
a number (Figure 15). See Appendix B for full measure. The student identified the number or
operation in the pair with the highest value.
Figure 15. Examples of the Quantity Discrimination task.
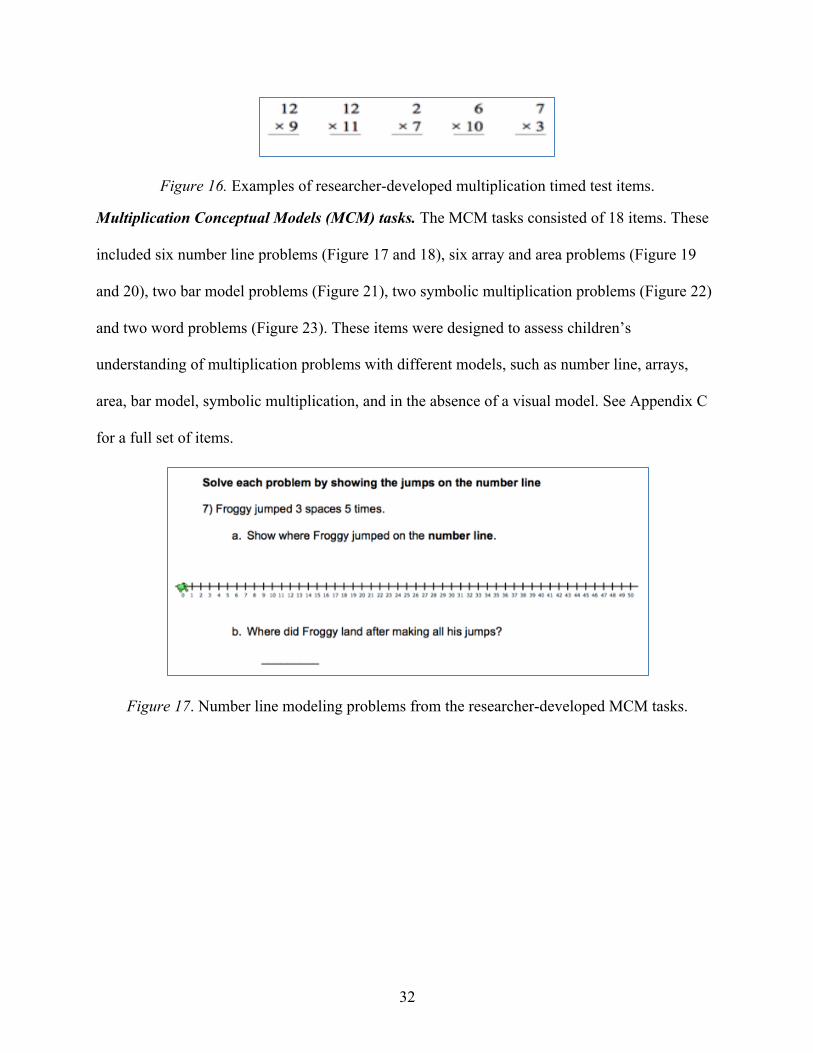
Multiplication Timed Test (MT) task. The MT task examined children’s fluency with one
hundred multiplication facts from 2 x 2 to 12 x 12 (see example problems in Figure 16). This
task was designed by the researcher, drawing from similar facts tests used in the textbook
program Everyday Mathematics (University of Chicago School Mathematics Project, 2007) and
from recommendations stated in third grade Common Core State Standards Initiative (NGA
Center & CCSSO, 2010). See Appendix C for full measure.
32
Figure 16. Examples of researcher-developed multiplication timed test items.
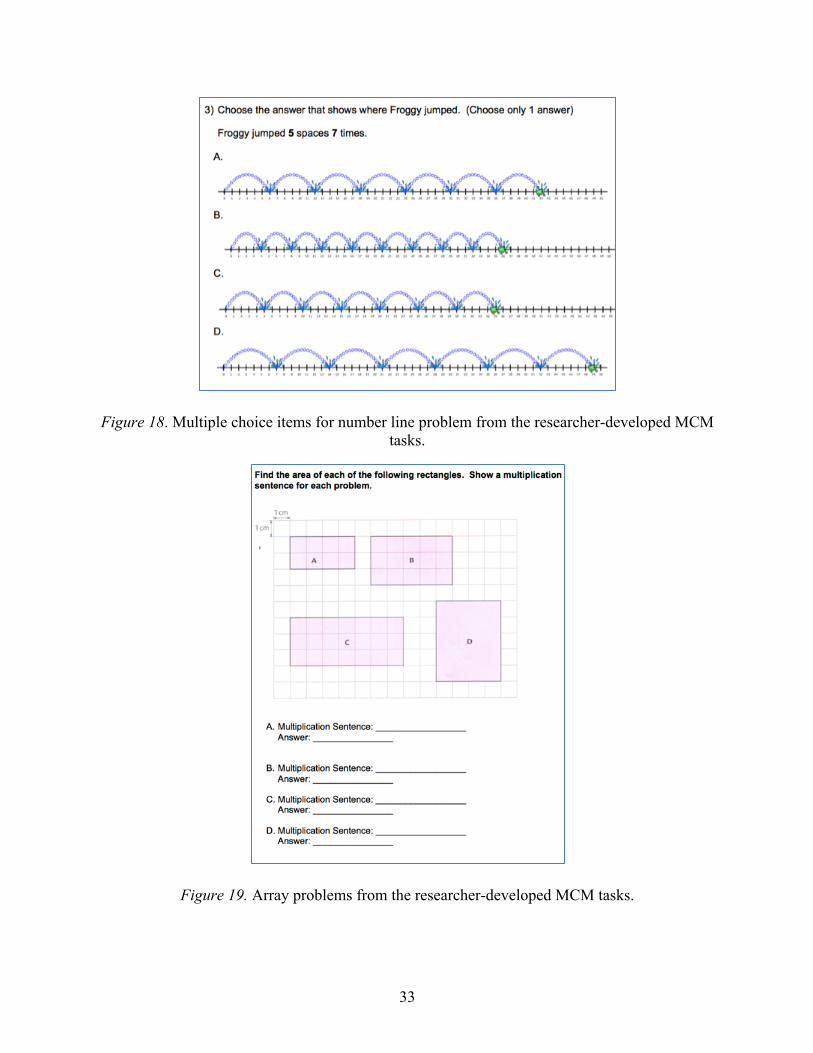
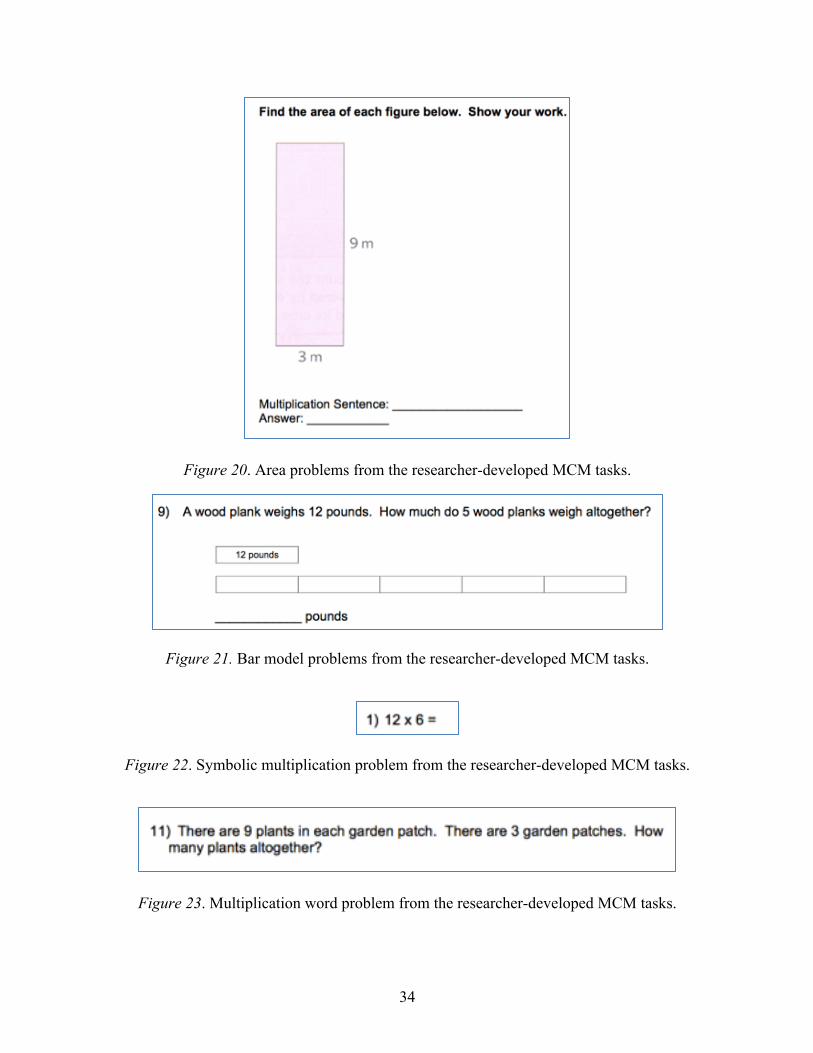
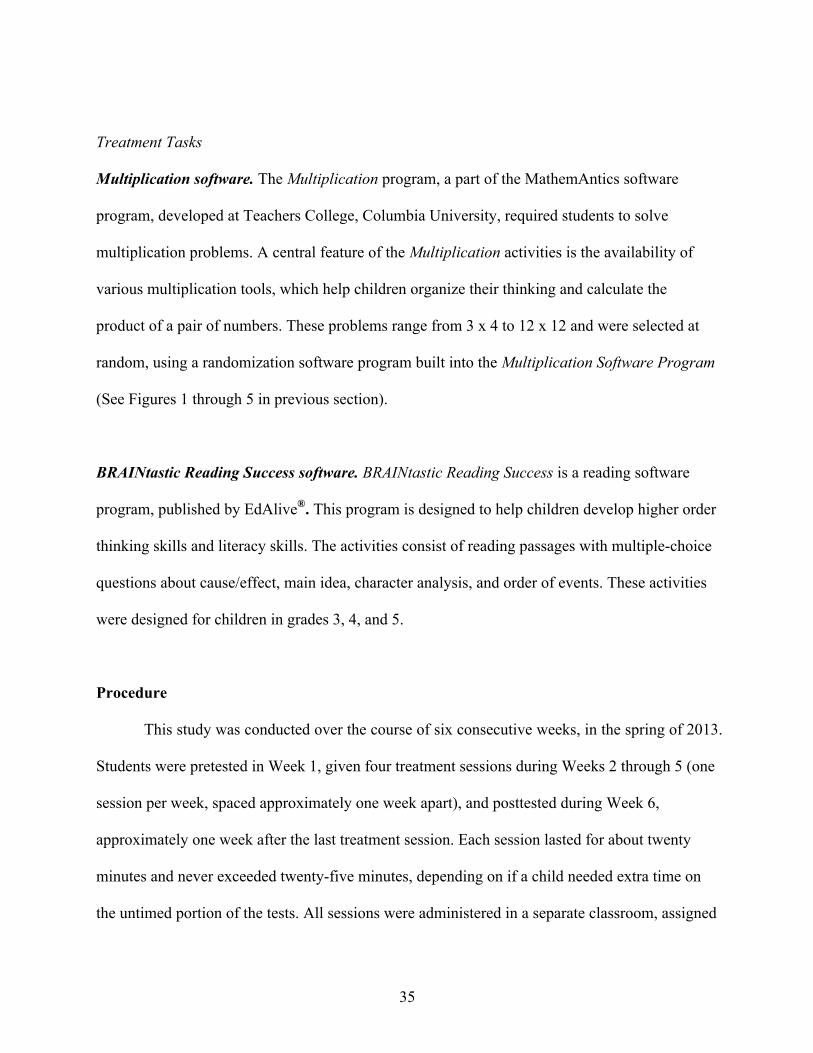
Multiplication Conceptual Models (MCM) tasks. The MCM tasks consisted of 18 items. These
included six number line problems (Figure 17 and 18), six array and area problems (Figure 19
and 20), two bar model problems (Figure 21), two symbolic multiplication problems (Figure 22)
and two word problems (Figure 23). These items were designed to assess children’s
understanding of multiplication problems with different models, such as number line, arrays,
area, bar model, symbolic multiplication, and in the absence of a visual model. See Appendix C
for a full set of items.
Figure 17. Number line modeling problems from the researcher-developed MCM tasks.
33
Figure 18. Multiple choice items for number line problem from the researcher-developed MCM tasks.
Figure 19. Array problems from the researcher-developed MCM tasks.
34
Figure 20. Area problems from the researcher-developed MCM tasks.
Figure 21. Bar model problems from the researcher-developed MCM tasks.
Figure 22. Symbolic multiplication problem from the researcher-developed MCM tasks.
Figure 23. Multiplication word problem from the researcher-developed MCM tasks.
35
Treatment Tasks
Multiplication software. The Multiplication program, a part of the MathemAntics software
program, developed at Teachers College, Columbia University, required students to solve
multiplication problems. A central feature of the Multiplication activities is the availability of
various multiplication tools, which help children organize their thinking and calculate the
product of a pair of numbers. These problems range from 3 x 4 to 12 x 12 and were selected at
random, using a randomization software program built into the Multiplication Software Program
(See Figures 1 through 5 in previous section).
BRAINtastic Reading Success software. BRAINtastic Reading Success is a reading software
program, published by EdAlive®. This program is designed to help children develop higher order
thinking skills and literacy skills. The activities consist of reading passages with multiple-choice
questions about cause/effect, main idea, character analysis, and order of events. These activities
were designed for children in grades 3, 4, and 5.
Procedure
This study was conducted over the course of six consecutive weeks, in the spring of 2013.
Students were pretested in Week 1, given four treatment sessions during Weeks 2 through 5 (one
session per week, spaced approximately one week apart), and posttested during Week 6,
approximately one week after the last treatment session. Each session lasted for about twenty
minutes and never exceeded twenty-five minutes, depending on if a child needed extra time on
the untimed portion of the tests. All sessions were administered in a separate classroom, assigned
36
by the school principal. No researchers from the pre and posttest sessions collected data during
intervention sessions. All researchers who collected session data were blind to the pre- and
posttest items.
Pretest
The pretest was administered in small groups (4-6 children at a time) in a separate
classroom setting, where participants worked in a partitioned workspace, separated by a privacy
board. Children could not see what others were doing. One researcher read instructions to the
children and another researcher passed out papers and helped monitor the students during the
assessments. All of these tasks were paper-based and children handwrote their responses.
The researcher was interested in measuring children’s general number sense as well as
multiplication facts fluency and understanding of conceptual models of multiplication. Four
measures were employed: Missing Number (MN), Quantity Discrimination (QD), Multiplication
Timed Test (MT) task, and Multiplication Conceptual Models (MCM) tasks. For MN and QD,
participants were required to answer as many questions as they could in under 2 minutes, by
recommendation of the assessment manual from mClass:Math. For the MT task, participants had
three minutes to answer as many questions as they could. Children were not timed for the MCM
task and could take as much time as they needed to complete the tasks. Children were
encouraged to complete the items to the best of their ability, to show their work, and not leave
any questions blank. These items were scored using an answer key by a group of trained
researchers at a later time.
Treatment Sessions
Four treatment sessions were conducted one-on-one with each participant. Participants
were blocked by school (A, B, and C) and classroom (A-1, A-2, A-3, A-4, B-1, B-2, C-1, C-2, C-
37
3), and then assigned to one of three conditions: Jumper, Morphing, and Control. Traditionally in
a learning study, children would carry out the treatment condition for the entirety of the
treatment, which in this case is four sessions. However, it was possible that that if children had
the availability of the tool for all sessions, children were not likely to use any strategies other
than Tool Use. Therefore, a within subjects manipulation was used for the two treatment groups,
Jumper and Morphing. The within subject groups, Jumper 1 (tool then no tool) Jumper 2 (no tool
then tool), Morphing 1 (tool then no tool), and Morphing 2 (no tool then tool), only differed in
the order in which children played sessions with a tool or without tool (see Figure 24).
A researcher sat next to each participant at every session. Altogether, students played 48
trials, two sessions of 12 trials with a tool and two sessions of 12 trials without a tool.
Participants playing Multiplication were given up to two attempts to answer each multiplication
problem. If the child answered the problem incorrectly, he or she received immediate feedback
from the software program that the answer was incorrect and he or she could try to answer the
problem one more time. If incorrect a second time the correct answer was provided by the
software program and the session proceeded to the next problem.
38
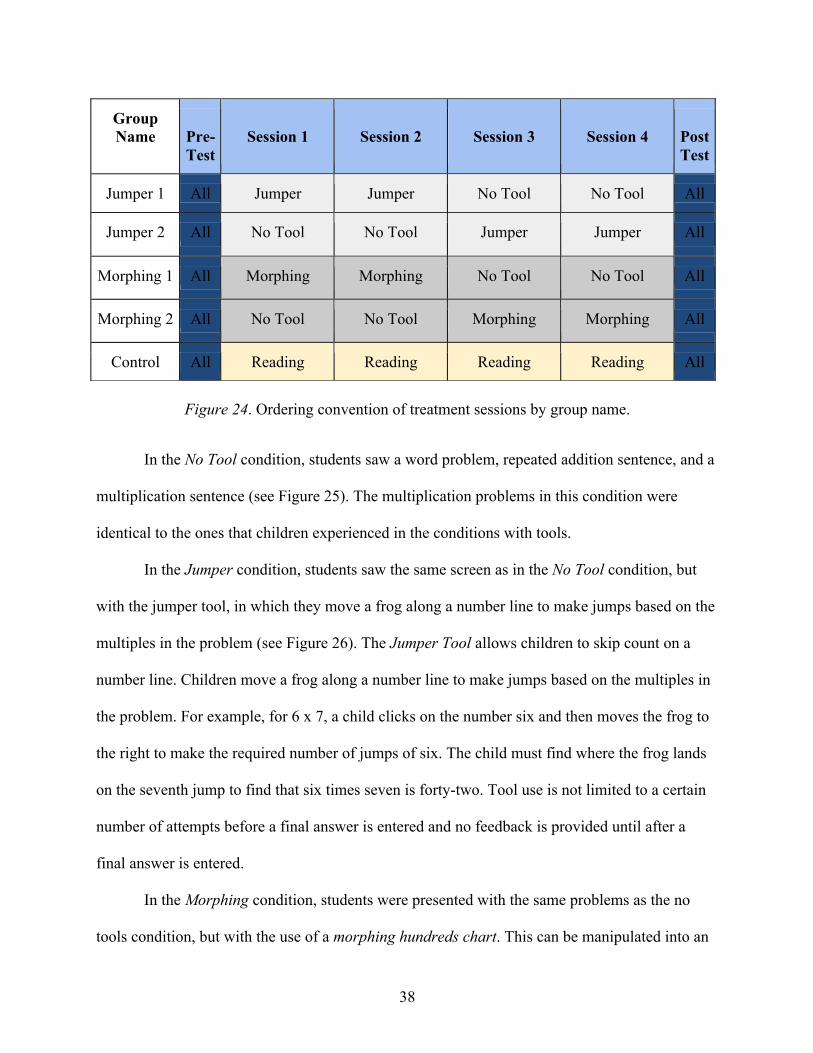
Figure 24. Ordering convention of treatment sessions by group name.
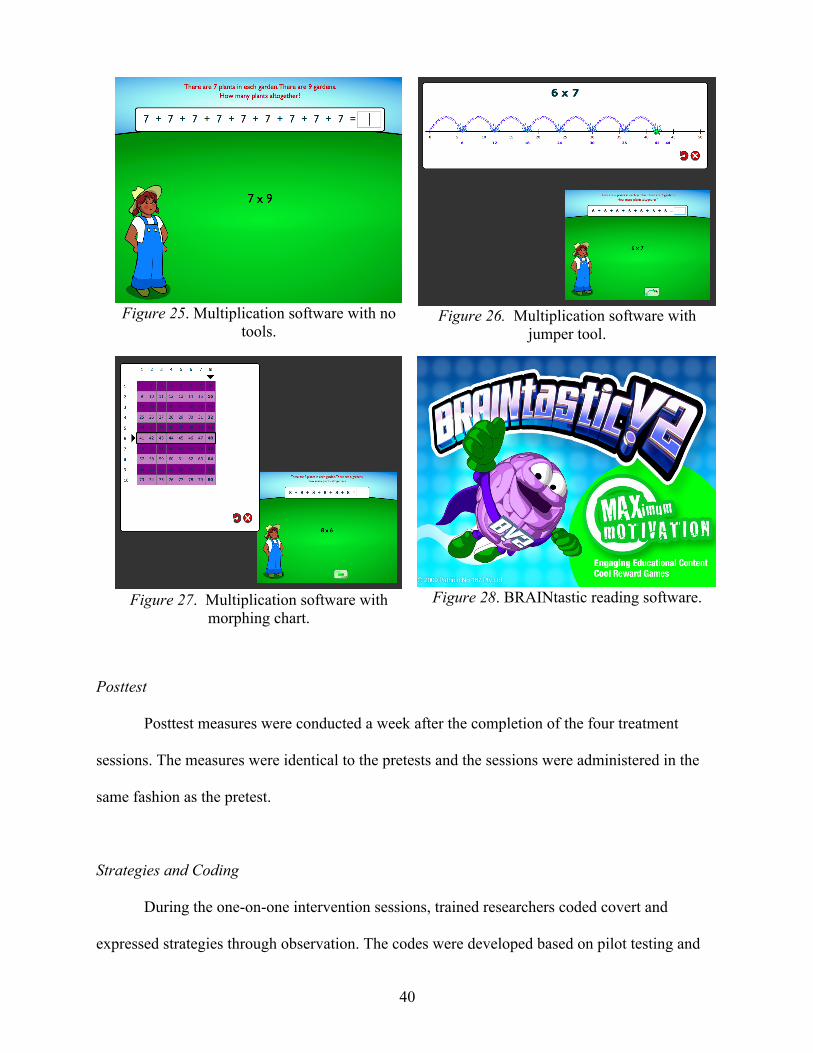
In the No Tool condition, students saw a word problem, repeated addition sentence, and a
multiplication sentence (see Figure 25). The multiplication problems in this condition were
identical to the ones that children experienced in the conditions with tools.
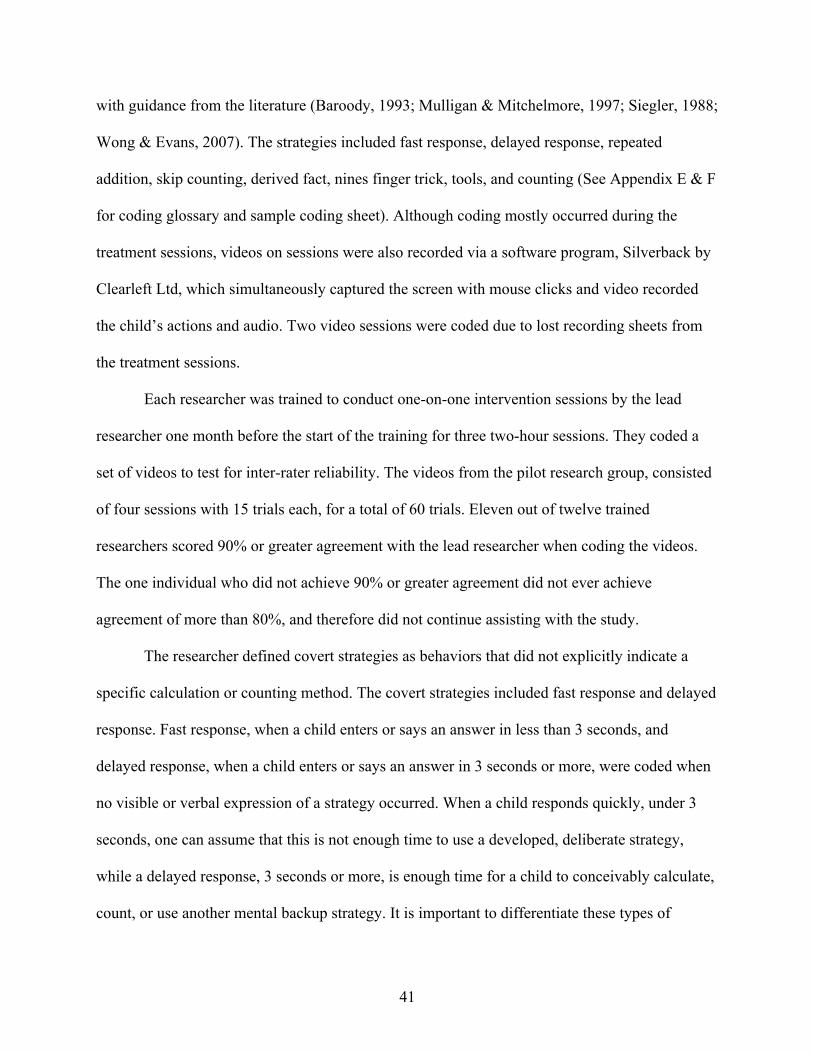
In the Jumper condition, students saw the same screen as in the No Tool condition, but
with the jumper tool, in which they move a frog along a number line to make jumps based on the
multiples in the problem (see Figure 26). The Jumper Tool allows children to skip count on a
number line. Children move a frog along a number line to make jumps based on the multiples in
the problem. For example, for 6 x 7, a child clicks on the number six and then moves the frog to
the right to make the required number of jumps of six. The child must find where the frog lands
on the seventh jump to find that six times seven is forty-two. Tool use is not limited to a certain
number of attempts before a final answer is entered and no feedback is provided until after a
final answer is entered.
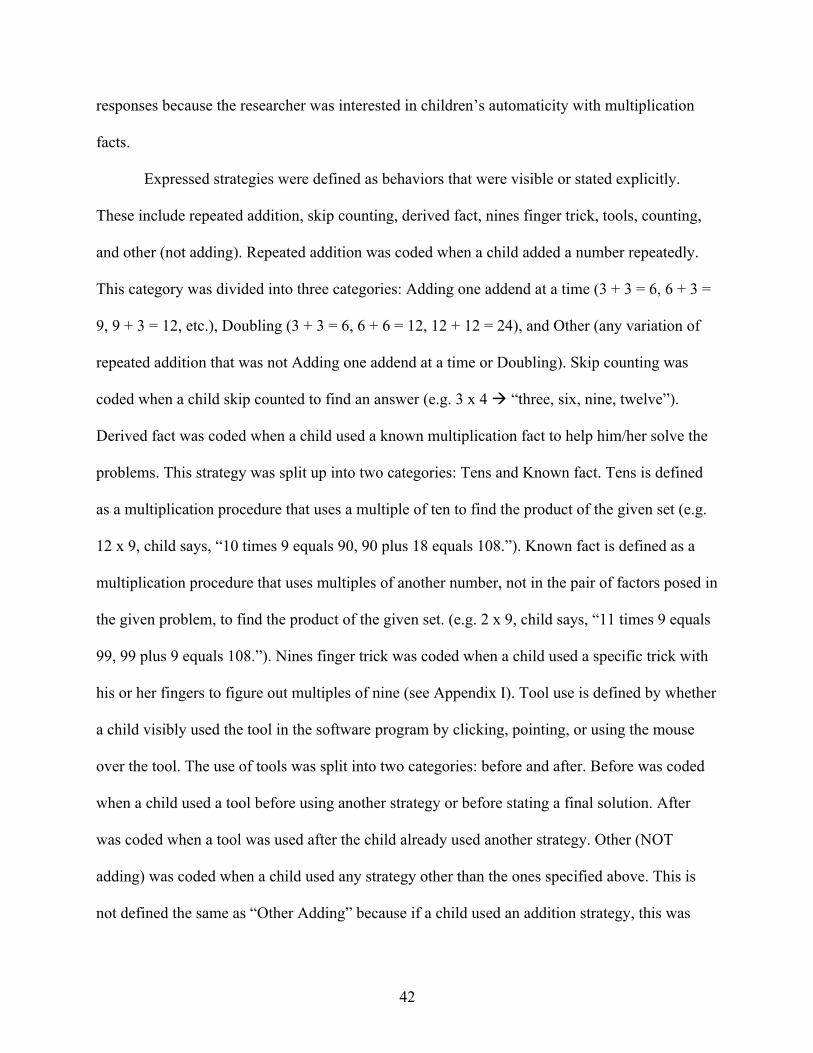
In the Morphing condition, students were presented with the same problems as the no
tools condition, but with the use of a morphing hundreds chart. This can be manipulated into an
Group Name
Pre-Test
Session 1
Session 2
Session 3
Session 4
Post Test
Jumper 1 All Jumper Jumper No Tool No Tool All
Jumper 2 All No Tool No Tool Jumper Jumper All
Morphing 1 All Morphing Morphing No Tool No Tool All
Morphing 2 All No Tool No Tool Morphing Morphing All
Control All Reading Reading Reading Reading All
39
array based on the multiples in the problem (see Figure 27). This tool possesses dynamic,
customizable characteristics, which would not be so easily accessible with a static image.
Children can rearrange the rows and columns to fit specific number combinations. For example,
the chart starts as a 10 x 10 (1 to 100) array, showing each row as a group of ten. For the problem,
8 x 6, the child can rearrange the rows into groups of eight by clicking on the number eight. Then,
the child needs to find the sixth row to find out the product of eight times six. For problems that
are larger than 10 x 10, such as the 11s or 12s, the chart starts out as a 14 x 14 chart (14 rows of
14), so that the child is forced to rearrange the chart into the appropriate array. Tool use was also
unlimited for the Morphing tool and the same type of feedback was provided as in the Jumper
condition.
Finally, the control group played twenty-minute sessions of a reading software program,
called BRAINtastic Reading Success (see Figure 28). All children played the intermediate levels,
which were designed for children in the end of third grade. These children received the same
instruction in the classroom as everyone else and were pulled out at the same times as all the
other participants.
40
Posttest
Posttest measures were conducted a week after the completion of the four treatment
sessions. The measures were identical to the pretests and the sessions were administered in the
same fashion as the pretest.
Strategies and Coding
During the one-on-one intervention sessions, trained researchers coded covert and
expressed strategies through observation. The codes were developed based on pilot testing and
Figure 25. Multiplication software with no
tools.
Figure 26. Multiplication software with
jumper tool.
Figure 27. Multiplication software with
morphing chart.
Figure 28. BRAINtastic reading software.
41
with guidance from the literature (Baroody, 1993; Mulligan & Mitchelmore, 1997; Siegler, 1988;
Wong & Evans, 2007). The strategies included fast response, delayed response, repeated
addition, skip counting, derived fact, nines finger trick, tools, and counting (See Appendix E & F
for coding glossary and sample coding sheet). Although coding mostly occurred during the
treatment sessions, videos on sessions were also recorded via a software program, Silverback by
Clearleft Ltd, which simultaneously captured the screen with mouse clicks and video recorded
the child’s actions and audio. Two video sessions were coded due to lost recording sheets from
the treatment sessions.
Each researcher was trained to conduct one-on-one intervention sessions by the lead
researcher one month before the start of the training for three two-hour sessions. They coded a
set of videos to test for inter-rater reliability. The videos from the pilot research group, consisted
of four sessions with 15 trials each, for a total of 60 trials. Eleven out of twelve trained
researchers scored 90% or greater agreement with the lead researcher when coding the videos.
The one individual who did not achieve 90% or greater agreement did not ever achieve
agreement of more than 80%, and therefore did not continue assisting with the study.
The researcher defined covert strategies as behaviors that did not explicitly indicate a
specific calculation or counting method. The covert strategies included fast response and delayed
response. Fast response, when a child enters or says an answer in less than 3 seconds, and
delayed response, when a child enters or says an answer in 3 seconds or more, were coded when
no visible or verbal expression of a strategy occurred. When a child responds quickly, under 3
seconds, one can assume that this is not enough time to use a developed, deliberate strategy,
while a delayed response, 3 seconds or more, is enough time for a child to conceivably calculate,
count, or use another mental backup strategy. It is important to differentiate these types of
42
responses because the researcher was interested in children’s automaticity with multiplication
facts.
Expressed strategies were defined as behaviors that were visible or stated explicitly.
These include repeated addition, skip counting, derived fact, nines finger trick, tools, counting,
and other (not adding). Repeated addition was coded when a child added a number repeatedly.
This category was divided into three categories: Adding one addend at a time (3 + 3 = 6, 6 + 3 =
9, 9 + 3 = 12, etc.), Doubling (3 + 3 = 6, 6 + 6 = 12, 12 + 12 = 24), and Other (any variation of
repeated addition that was not Adding one addend at a time or Doubling). Skip counting was
coded when a child skip counted to find an answer (e.g. 3 x 4 ! “three, six, nine, twelve”).
Derived fact was coded when a child used a known multiplication fact to help him/her solve the
problems. This strategy was split up into two categories: Tens and Known fact. Tens is defined
as a multiplication procedure that uses a multiple of ten to find the product of the given set (e.g.
12 x 9, child says, “10 times 9 equals 90, 90 plus 18 equals 108.”). Known fact is defined as a
multiplication procedure that uses multiples of another number, not in the pair of factors posed in
the given problem, to find the product of the given set. (e.g. 2 x 9, child says, “11 times 9 equals
99, 99 plus 9 equals 108.”). Nines finger trick was coded when a child used a specific trick with
his or her fingers to figure out multiples of nine (see Appendix I). Tool use is defined by whether
a child visibly used the tool in the software program by clicking, pointing, or using the mouse
over the tool. The use of tools was split into two categories: before and after. Before was coded
when a child used a tool before using another strategy or before stating a final solution. After
was coded when a tool was used after the child already used another strategy. Other (NOT
adding) was coded when a child used any strategy other than the ones specified above. This is
not defined the same as “Other Adding” because if a child used an addition strategy, this was

43
coded separately. Finally, the researchers coded strategies for each attempt, since each child had
two chances to answer the problem.
44
CHAPTER 3:
RESULTS
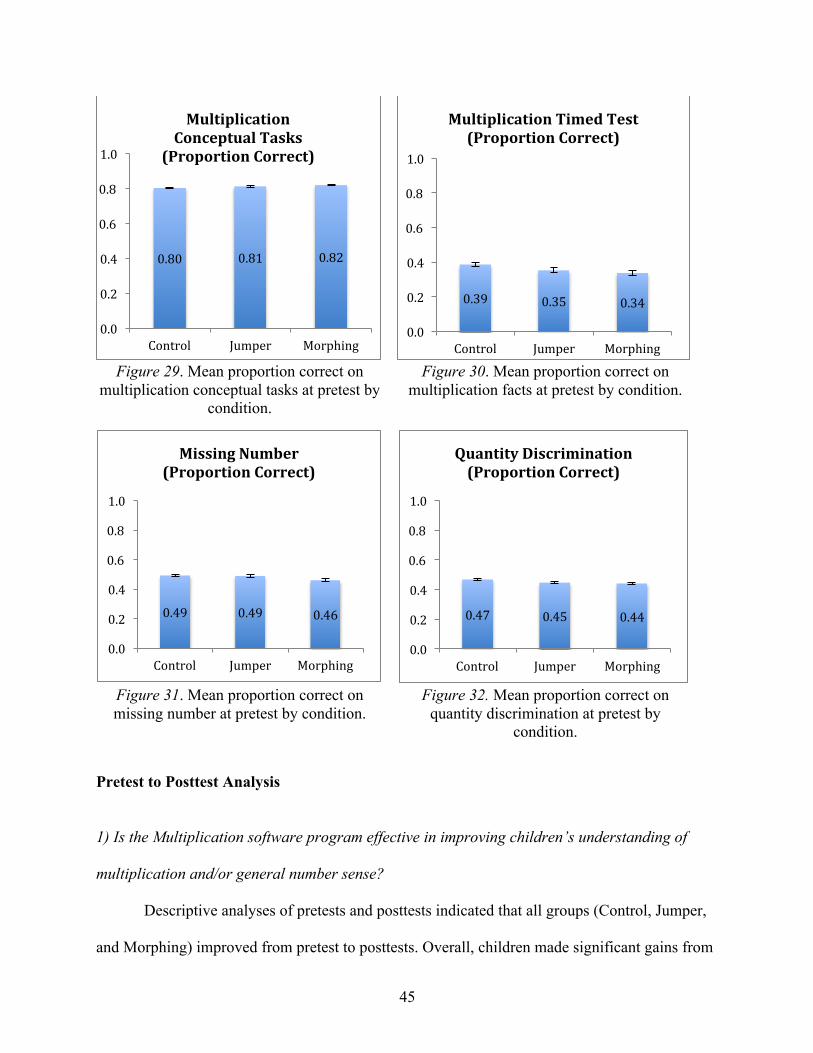
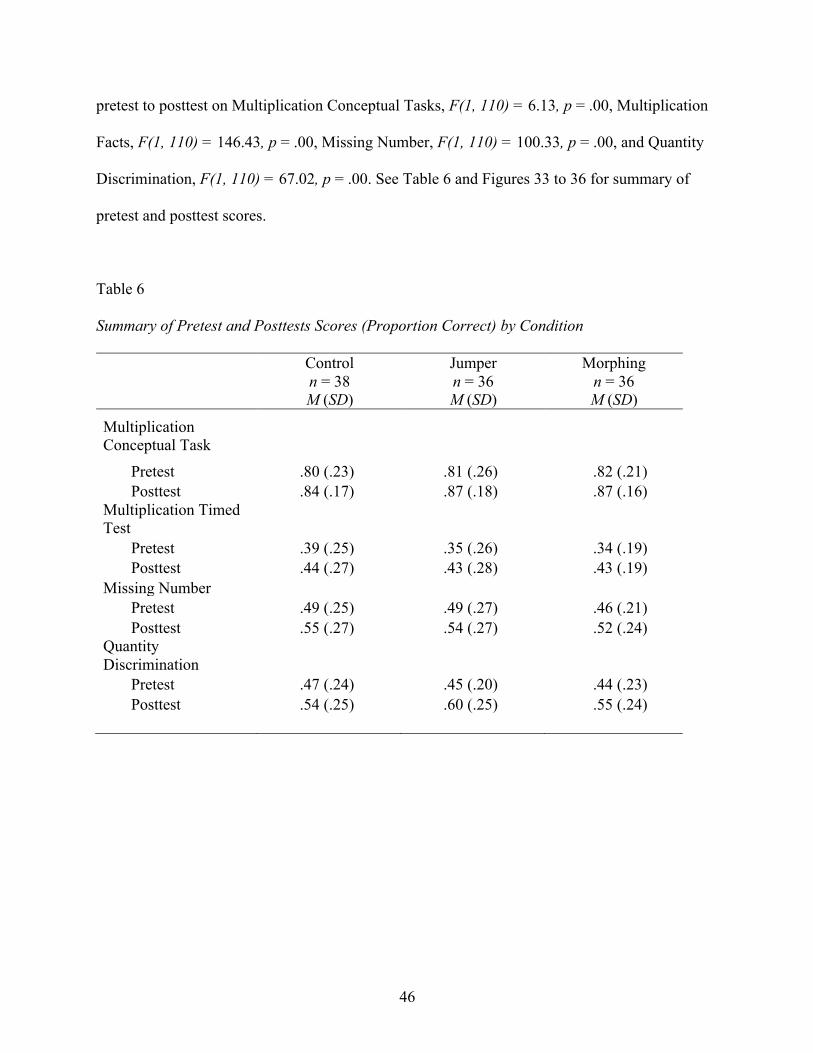
Pretest Analysis
In order to ensure that groups were equivalent at pretest, a Multivariate Analysis of
Variance (MANOVA) with Condition (Control, Jumper, Morphing) as the independent variable
and four pretests (Multiplication Conceptual Models, Multiplication Facts, Missing Number, and
Quantity Discrimination,) as dependent variables was conducted. The average proportion correct
(out of 16) on the Multiplication Conceptual Tasks for Control, Jumper, and Morphing were .80
(SD = .23), .81 (SD = .26), and .82 (SD = .21), respectively. The average proportion correct (out
of 100) for Multiplication Facts for Control, Jumper, and Morphing were .39 (SD = .25), .35 (SD
= .26), and .34 (SD = .19). For Missing Number, the average proportion correct (out of 22) for
Control, Jumper, and Morphing were .49 (SD = .25), .49 (SD = .27), and .46 (SD = .21),
respectively. The average proportion correct (out of 42) for the fourth pretest, Quantity
Discrimination for Control, Jumper, and Morphing were .46 (SD = .24), .45 (SD = .20), and .44
(SD = .23), respectively. The results confirmed that there were no statistical differences by
condition at pretests, Wilks’ Lambda = 0.99, F(8, 208) = 0.19, p = .99. Figures 29 to 32 show
performance on four pretest measures across conditions.
45
Figure 29. Mean proportion correct on
multiplication conceptual tasks at pretest by condition.
Figure 30. Mean proportion correct on
multiplication facts at pretest by condition.
Figure 31. Mean proportion correct on missing number at pretest by condition.
Figure 32. Mean proportion correct on
quantity discrimination at pretest by condition.
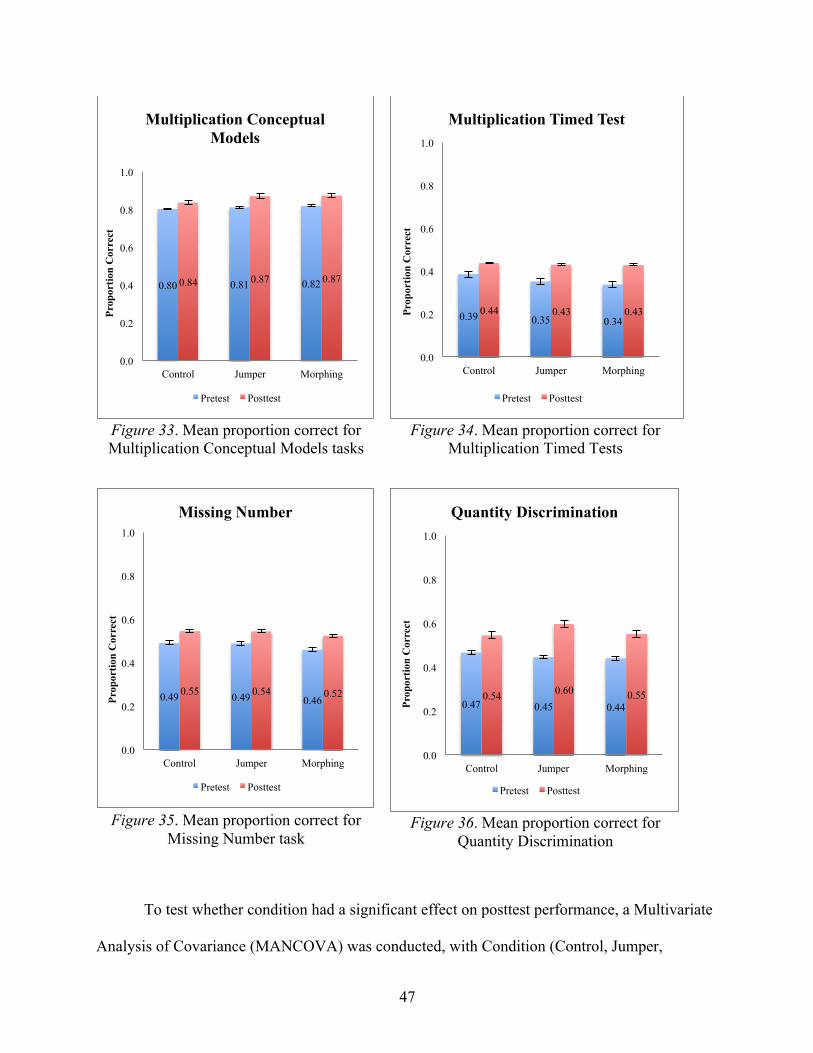
Pretest to Posttest Analysis
1) Is the Multiplication software program effective in improving children’s understanding of
multiplication and/or general number sense?
Descriptive analyses of pretests and posttests indicated that all groups (Control, Jumper,
and Morphing) improved from pretest to posttests. Overall, children made significant gains from
0.80 0.81 0.82
0.0
0.2
0.4
0.6
0.8
1.0
Control Jumper Morphing
Multiplication Conceptual Tasks
(Proportion Correct)
0.39 0.35 0.34
0.0
0.2
0.4
0.6
0.8
1.0
Control Jumper Morphing
Multiplication Timed Test (Proportion Correct)
0.49 0.49 0.46
0.0
0.2
0.4
0.6
0.8
1.0
Control Jumper Morphing
Missing Number (Proportion Correct)
0.47 0.45 0.44
0.0
0.2
0.4
0.6
0.8
1.0
Control Jumper Morphing
Quantity Discrimination (Proportion Correct)
46
pretest to posttest on Multiplication Conceptual Tasks, F(1, 110) = 6.13, p = .00, Multiplication
Facts, F(1, 110) = 146.43, p = .00, Missing Number, F(1, 110) = 100.33, p = .00, and Quantity
Discrimination, F(1, 110) = 67.02, p = .00. See Table 6 and Figures 33 to 36 for summary of
pretest and posttest scores.
Table 6
Summary of Pretest and Posttests Scores (Proportion Correct) by Condition
Control n = 38 M (SD)
Jumper n = 36 M (SD)
Morphing n = 36 M (SD)
Multiplication Conceptual Task
Pretest .80 (.23) .81 (.26) .82 (.21) Posttest .84 (.17) .87 (.18) .87 (.16) Multiplication Timed Test Pretest .39 (.25) .35 (.26) .34 (.19) Posttest .44 (.27) .43 (.28) .43 (.19) Missing Number Pretest .49 (.25) .49 (.27) .46 (.21) Posttest .55 (.27) .54 (.27) .52 (.24) Quantity Discrimination Pretest .47 (.24) .45 (.20) .44 (.23) Posttest .54 (.25) .60 (.25) .55 (.24)
47
Figure 33. Mean proportion correct for Multiplication Conceptual Models tasks
Figure 34. Mean proportion correct for
Multiplication Timed Tests
Figure 35. Mean proportion correct for
Missing Number task
Figure 36. Mean proportion correct for
Quantity Discrimination
To test whether condition had a significant effect on posttest performance, a Multivariate
Analysis of Covariance (MANCOVA) was conducted, with Condition (Control, Jumper,
0.80 0.81 0.82 0.84 0.87 0.87
0.0
0.2
0.4
0.6
0.8
1.0
Control Jumper Morphing
Prop
ortio
n C
orre
ct
Multiplication Conceptual Models
Pretest Posttest
0.39 0.35 0.34 0.44 0.43 0.43
0.0
0.2
0.4
0.6
0.8
1.0
Control Jumper Morphing
Prop
ortio
n C
orre
ct
Multiplication Timed Test
Pretest Posttest
0.49 0.49 0.46 0.55 0.54 0.52
0.0
0.2
0.4
0.6
0.8
1.0
Control Jumper Morphing
Prop
ortio
n C
orre
ct
Missing Number
Pretest Posttest
0.47 0.45 0.44 0.54 0.60 0.55
0.0
0.2
0.4
0.6
0.8
1.0
Control Jumper Morphing
Prop
ortio
n C
orre
ct
Quantity Discrimination
Pretest Posttest
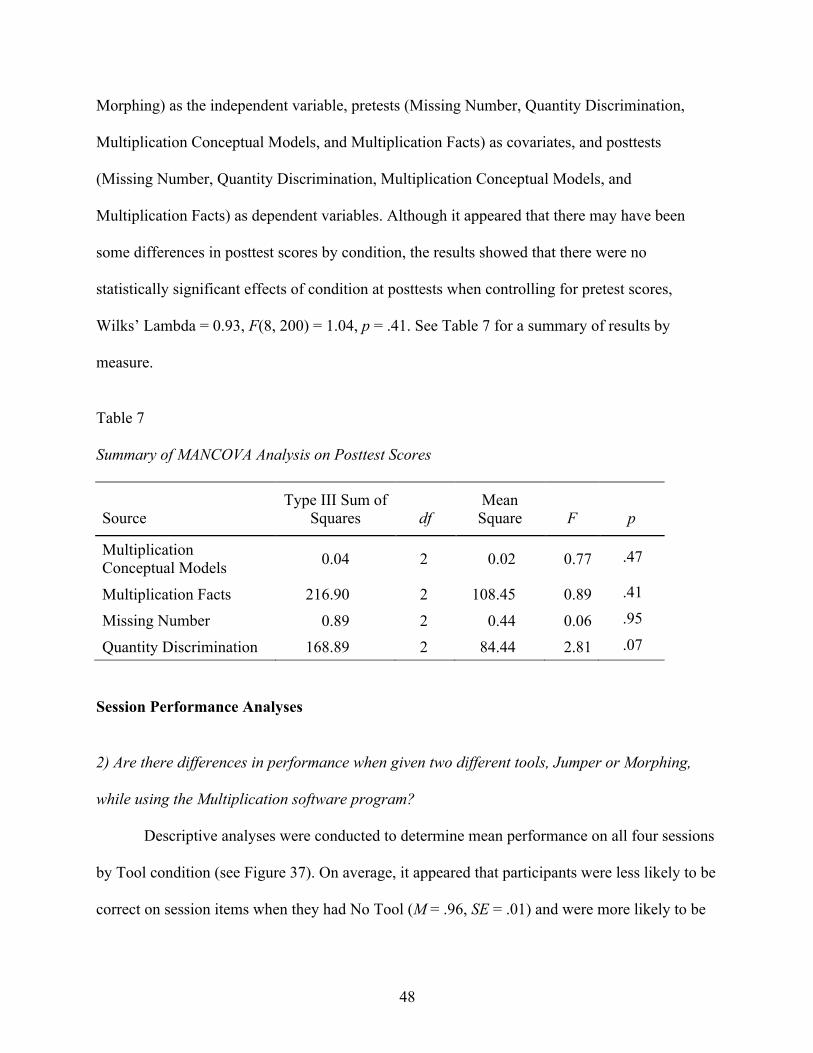
48
Morphing) as the independent variable, pretests (Missing Number, Quantity Discrimination,
Multiplication Conceptual Models, and Multiplication Facts) as covariates, and posttests
(Missing Number, Quantity Discrimination, Multiplication Conceptual Models, and
Multiplication Facts) as dependent variables. Although it appeared that there may have been
some differences in posttest scores by condition, the results showed that there were no
statistically significant effects of condition at posttests when controlling for pretest scores,
Wilks’ Lambda = 0.93, F(8, 200) = 1.04, p = .41. See Table 7 for a summary of results by
measure.
Table 7
Summary of MANCOVA Analysis on Posttest Scores
Source Type III Sum of
Squares df Mean Square F p
Multiplication Conceptual Models 0.04 2 0.02 0.77 .47
Multiplication Facts 216.90 2 108.45 0.89 .41
Missing Number 0.89 2 0.44 0.06 .95
Quantity Discrimination 168.89 2 84.44 2.81 .07
Session Performance Analyses
2) Are there differences in performance when given two different tools, Jumper or Morphing,
while using the Multiplication software program?
Descriptive analyses were conducted to determine mean performance on all four sessions
by Tool condition (see Figure 37). On average, it appeared that participants were less likely to be
correct on session items when they had No Tool (M = .96, SE = .01) and were more likely to be
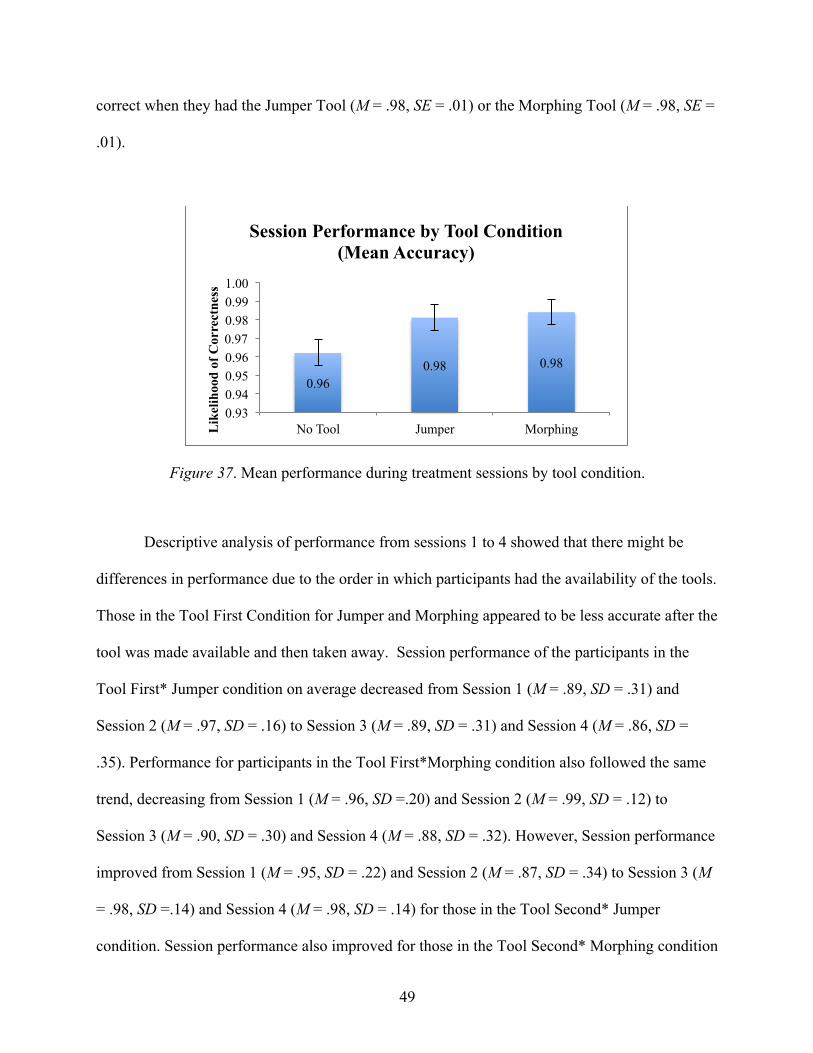
49
correct when they had the Jumper Tool (M = .98, SE = .01) or the Morphing Tool (M = .98, SE =
.01).
Figure 37. Mean performance during treatment sessions by tool condition.
Descriptive analysis of performance from sessions 1 to 4 showed that there might be
differences in performance due to the order in which participants had the availability of the tools.
Those in the Tool First Condition for Jumper and Morphing appeared to be less accurate after the
tool was made available and then taken away. Session performance of the participants in the
Tool First* Jumper condition on average decreased from Session 1 (M = .89, SD = .31) and
Session 2 (M = .97, SD = .16) to Session 3 (M = .89, SD = .31) and Session 4 (M = .86, SD =
.35). Performance for participants in the Tool First*Morphing condition also followed the same
trend, decreasing from Session 1 (M = .96, SD =.20) and Session 2 (M = .99, SD = .12) to
Session 3 (M = .90, SD = .30) and Session 4 (M = .88, SD = .32). However, Session performance
improved from Session 1 (M = .95, SD = .22) and Session 2 (M = .87, SD = .34) to Session 3 (M
= .98, SD =.14) and Session 4 (M = .98, SD = .14) for those in the Tool Second* Jumper
condition. Session performance also improved for those in the Tool Second* Morphing condition
0.96 0.98 0.98
0.93 0.94 0.95 0.96 0.97 0.98 0.99 1.00
No Tool Jumper Morphing Lik
elih
ood
of C
orre
ctne
ss
Session Performance by Tool Condition (Mean Accuracy)
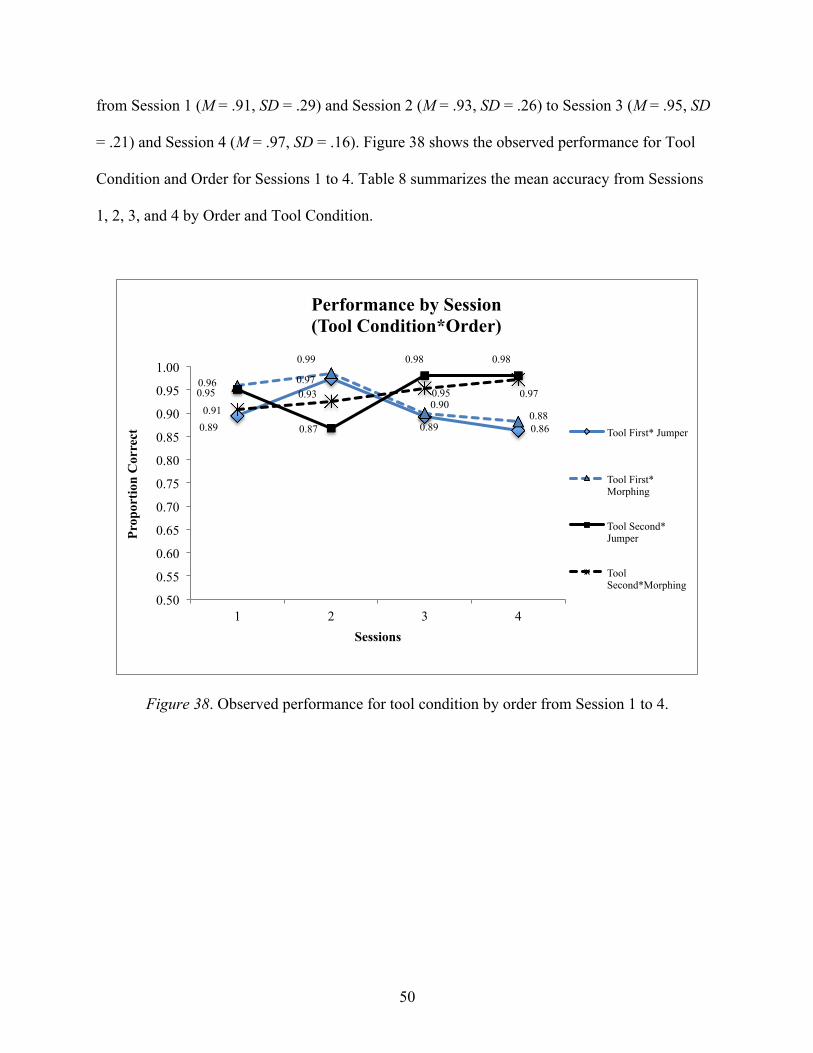
50
from Session 1 (M = .91, SD = .29) and Session 2 (M = .93, SD = .26) to Session 3 (M = .95, SD
= .21) and Session 4 (M = .97, SD = .16). Figure 38 shows the observed performance for Tool
Condition and Order for Sessions 1 to 4. Table 8 summarizes the mean accuracy from Sessions
1, 2, 3, and 4 by Order and Tool Condition.
Figure 38. Observed performance for tool condition by order from Session 1 to 4.
0.89
0.97
0.89 0.86
0.96
0.99
0.90 0.88
0.95
0.87
0.98 0.98
0.91 0.93 0.95 0.97
0.50
0.55
0.60
0.65
0.70
0.75
0.80
0.85
0.90
0.95
1.00
1 2 3 4
Prop
ortio
n C
orre
ct
Sessions
Performance by Session (Tool Condition*Order)
Tool First* Jumper
Tool First* Morphing
Tool Second* Jumper
Tool Second*Morphing
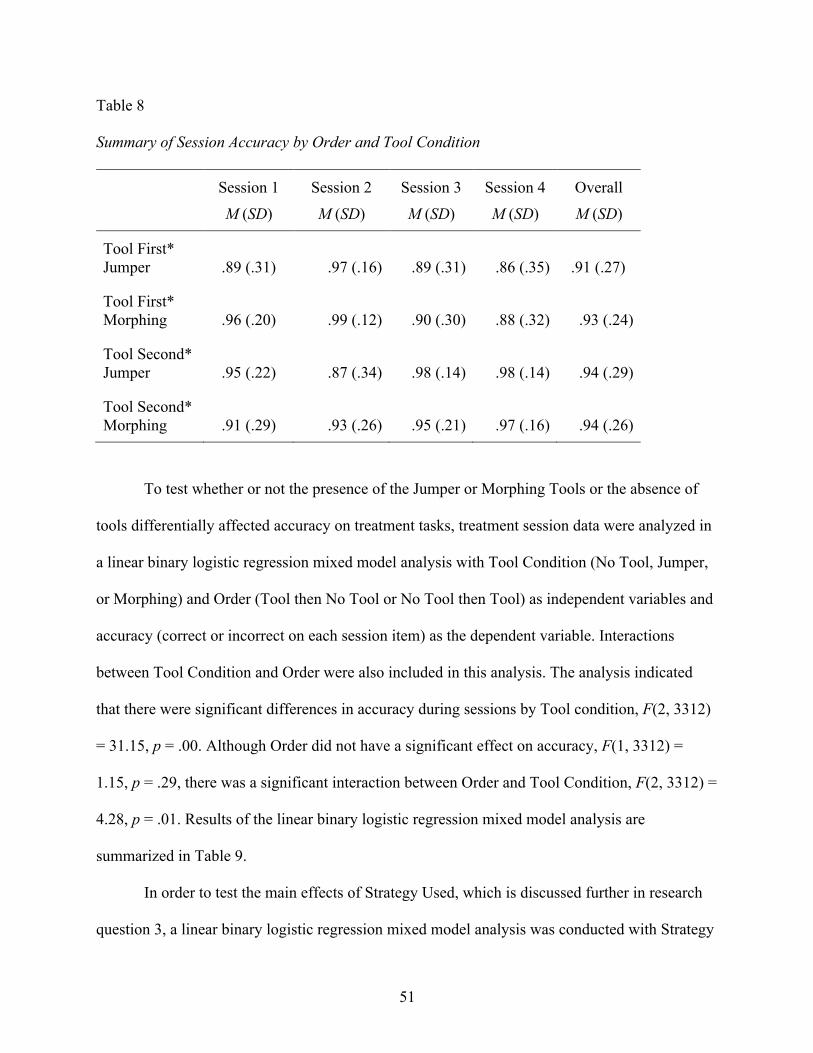
51
Table 8
Summary of Session Accuracy by Order and Tool Condition
Session 1
M (SD)
Session 2
M (SD)
Session 3
M (SD)
Session 4
M (SD)
Overall
M (SD)
Tool First* Jumper .89 (.31) .97 (.16) .89 (.31) .86 (.35) .91 (.27)
Tool First* Morphing .96 (.20) .99 (.12) .90 (.30) .88 (.32) .93 (.24)
Tool Second* Jumper .95 (.22) .87 (.34) .98 (.14) .98 (.14) .94 (.29)
Tool Second* Morphing .91 (.29) .93 (.26) .95 (.21) .97 (.16) .94 (.26)
To test whether or not the presence of the Jumper or Morphing Tools or the absence of
tools differentially affected accuracy on treatment tasks, treatment session data were analyzed in
a linear binary logistic regression mixed model analysis with Tool Condition (No Tool, Jumper,
or Morphing) and Order (Tool then No Tool or No Tool then Tool) as independent variables and
accuracy (correct or incorrect on each session item) as the dependent variable. Interactions
between Tool Condition and Order were also included in this analysis. The analysis indicated
that there were significant differences in accuracy during sessions by Tool condition, F(2, 3312)
= 31.15, p = .00. Although Order did not have a significant effect on accuracy, F(1, 3312) =
1.15, p = .29, there was a significant interaction between Order and Tool Condition, F(2, 3312) =
4.28, p = .01. Results of the linear binary logistic regression mixed model analysis are
summarized in Table 9.
In order to test the main effects of Strategy Used, which is discussed further in research
question 3, a linear binary logistic regression mixed model analysis was conducted with Strategy
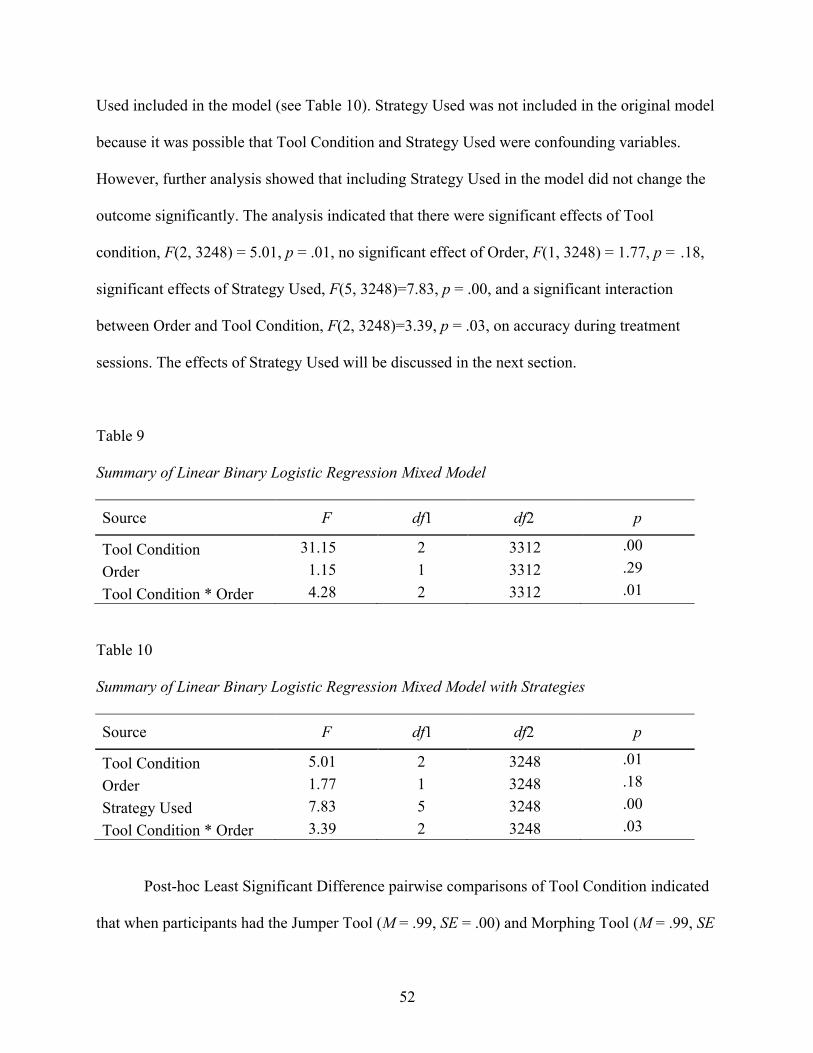
52
Used included in the model (see Table 10). Strategy Used was not included in the original model
because it was possible that Tool Condition and Strategy Used were confounding variables.
However, further analysis showed that including Strategy Used in the model did not change the
outcome significantly. The analysis indicated that there were significant effects of Tool
condition, F(2, 3248) = 5.01, p = .01, no significant effect of Order, F(1, 3248) = 1.77, p = .18,
significant effects of Strategy Used, F(5, 3248)=7.83, p = .00, and a significant interaction
between Order and Tool Condition, F(2, 3248)=3.39, p = .03, on accuracy during treatment
sessions. The effects of Strategy Used will be discussed in the next section.
Table 9
Summary of Linear Binary Logistic Regression Mixed Model
Source F df1 df2 p
Tool Condition 31.15 2 3312 .00
Order 1.15 1 3312 .29
Tool Condition * Order 4.28 2 3312 .01
Table 10
Summary of Linear Binary Logistic Regression Mixed Model with Strategies
Source F df1 df2 p
Tool Condition 5.01 2 3248 .01
Order 1.77 1 3248 .18
Strategy Used 7.83 5 3248 .00
Tool Condition * Order 3.39 2 3248 .03
Post-hoc Least Significant Difference pairwise comparisons of Tool Condition indicated
that when participants had the Jumper Tool (M = .99, SE = .00) and Morphing Tool (M = .99, SE
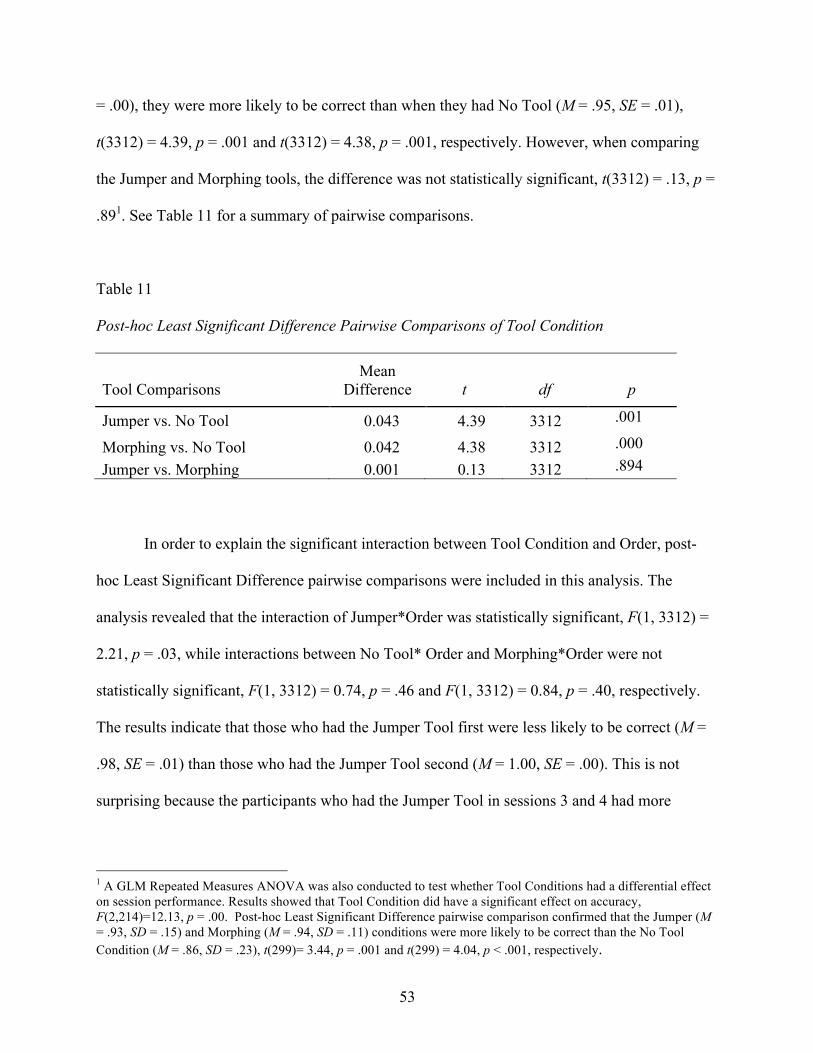
53
= .00), they were more likely to be correct than when they had No Tool (M = .95, SE = .01),
t(3312) = 4.39, p = .001 and t(3312) = 4.38, p = .001, respectively. However, when comparing
the Jumper and Morphing tools, the difference was not statistically significant, t(3312) = .13, p =
.891. See Table 11 for a summary of pairwise comparisons.
Table 11
Post-hoc Least Significant Difference Pairwise Comparisons of Tool Condition
Tool Comparisons Mean
Difference t df p
Jumper vs. No Tool 0.043 4.39 3312 .001
Morphing vs. No Tool 0.042 4.38 3312 .000
Jumper vs. Morphing 0.001 0.13 3312 .894
In order to explain the significant interaction between Tool Condition and Order, post-
hoc Least Significant Difference pairwise comparisons were included in this analysis. The
analysis revealed that the interaction of Jumper*Order was statistically significant, F(1, 3312) =
2.21, p = .03, while interactions between No Tool* Order and Morphing*Order were not
statistically significant, F(1, 3312) = 0.74, p = .46 and F(1, 3312) = 0.84, p = .40, respectively.
The results indicate that those who had the Jumper Tool first were less likely to be correct (M =
.98, SE = .01) than those who had the Jumper Tool second (M = 1.00, SE = .00). This is not
surprising because the participants who had the Jumper Tool in sessions 3 and 4 had more
1 A GLM Repeated Measures ANOVA was also conducted to test whether Tool Conditions had a differential effect on session performance. Results showed that Tool Condition did have a significant effect on accuracy, F(2,214)=12.13, p = .00. Post-hoc Least Significant Difference pairwise comparison confirmed that the Jumper (M = .93, SD = .15) and Morphing (M = .94, SD = .11) conditions were more likely to be correct than the No Tool Condition (M = .86, SD = .23), t(299)= 3.44, p = .001 and t(299) = 4.04, p < .001, respectively.
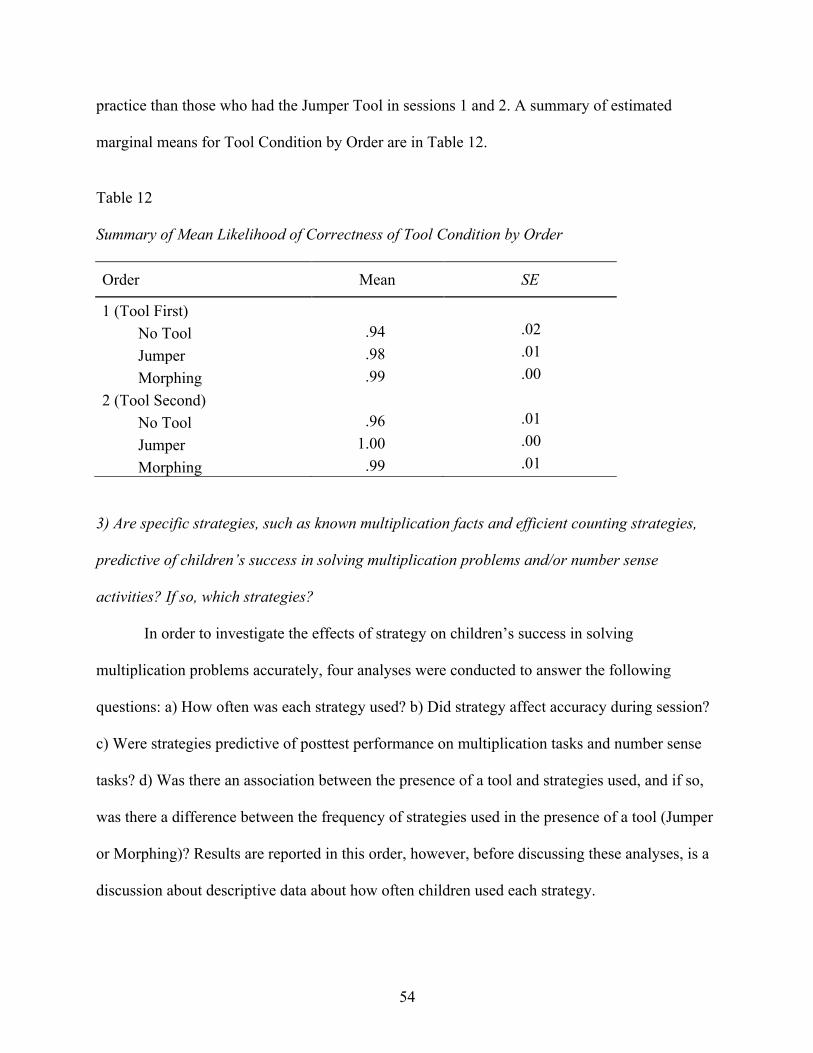
54
practice than those who had the Jumper Tool in sessions 1 and 2. A summary of estimated
marginal means for Tool Condition by Order are in Table 12.
Table 12
Summary of Mean Likelihood of Correctness of Tool Condition by Order
Order Mean SE
1 (Tool First)
No Tool .94 .02
Jumper .98 .01
Morphing .99 .00
2 (Tool Second)
No Tool .96 .01
Jumper 1.00 .00
Morphing .99 .01
3) Are specific strategies, such as known multiplication facts and efficient counting strategies,
predictive of children’s success in solving multiplication problems and/or number sense
activities? If so, which strategies?
In order to investigate the effects of strategy on children’s success in solving
multiplication problems accurately, four analyses were conducted to answer the following
questions: a) How often was each strategy used? b) Did strategy affect accuracy during session?
c) Were strategies predictive of posttest performance on multiplication tasks and number sense
tasks? d) Was there an association between the presence of a tool and strategies used, and if so,
was there a difference between the frequency of strategies used in the presence of a tool (Jumper
or Morphing)? Results are reported in this order, however, before discussing these analyses, is a
discussion about descriptive data about how often children used each strategy.
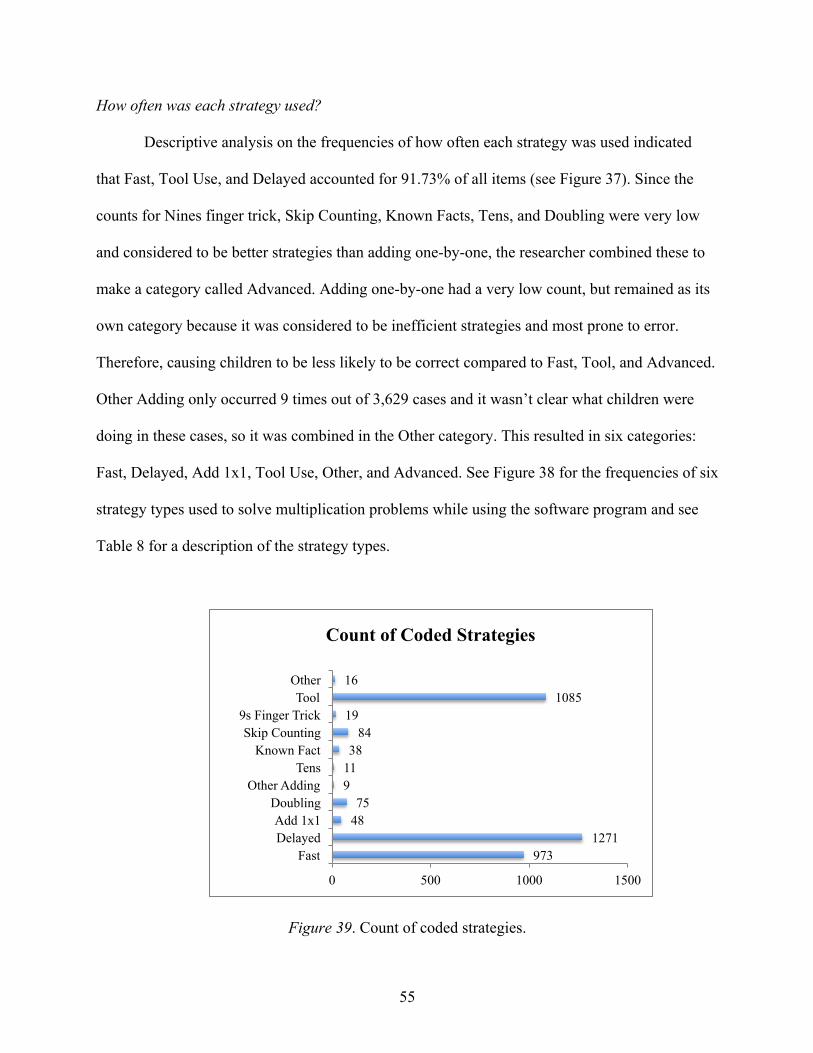
55
How often was each strategy used?
Descriptive analysis on the frequencies of how often each strategy was used indicated
that Fast, Tool Use, and Delayed accounted for 91.73% of all items (see Figure 37). Since the
counts for Nines finger trick, Skip Counting, Known Facts, Tens, and Doubling were very low
and considered to be better strategies than adding one-by-one, the researcher combined these to
make a category called Advanced. Adding one-by-one had a very low count, but remained as its
own category because it was considered to be inefficient strategies and most prone to error.
Therefore, causing children to be less likely to be correct compared to Fast, Tool, and Advanced.
Other Adding only occurred 9 times out of 3,629 cases and it wasn’t clear what children were
doing in these cases, so it was combined in the Other category. This resulted in six categories:
Fast, Delayed, Add 1x1, Tool Use, Other, and Advanced. See Figure 38 for the frequencies of six
strategy types used to solve multiplication problems while using the software program and see
Table 8 for a description of the strategy types.
Figure 39. Count of coded strategies.
973 1271
48 75
9 11 38
84 19
1085 16
0 500 1000 1500
Fast Delayed Add 1x1
Doubling Other Adding
Tens Known Fact
Skip Counting 9s Finger Trick
Tool Other
Count of Coded Strategies
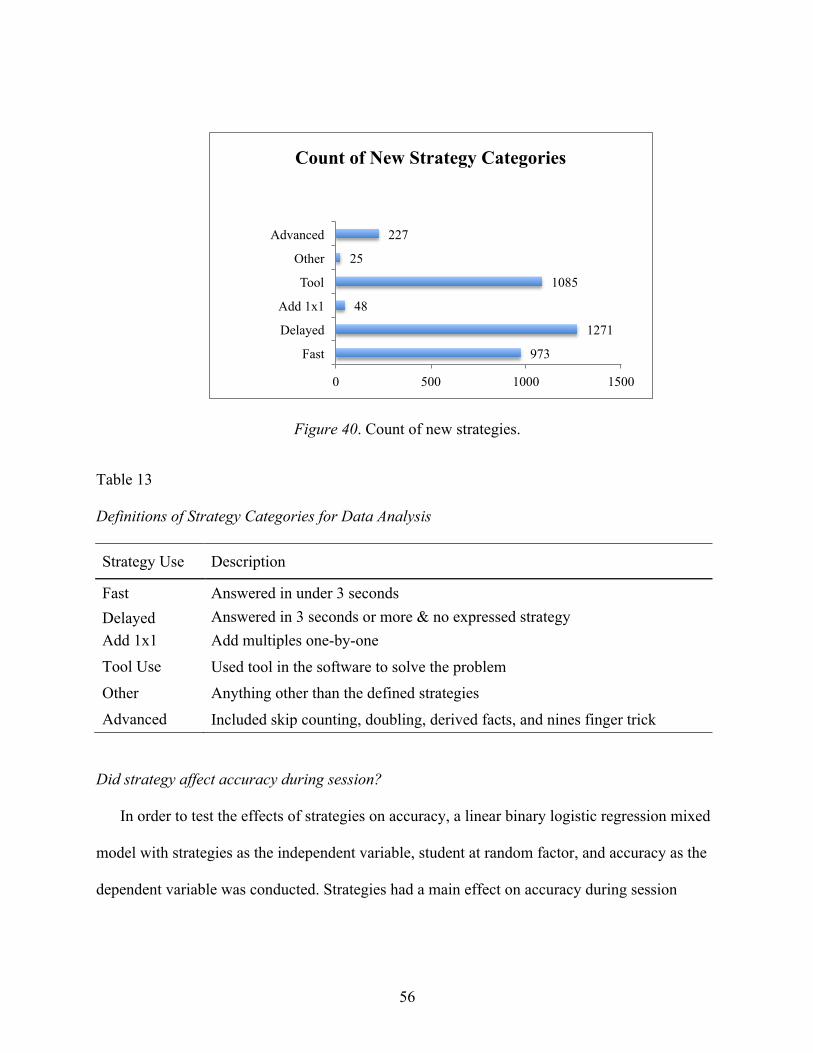
56
Figure 40. Count of new strategies.
Table 13
Definitions of Strategy Categories for Data Analysis
Strategy Use Description
Fast Answered in under 3 seconds Delayed Answered in 3 seconds or more & no expressed strategy Add 1x1 Add multiples one-by-one Tool Use Used tool in the software to solve the problem Other Anything other than the defined strategies Advanced Included skip counting, doubling, derived facts, and nines finger trick
Did strategy affect accuracy during session?
In order to test the effects of strategies on accuracy, a linear binary logistic regression mixed
model with strategies as the independent variable, student at random factor, and accuracy as the
dependent variable was conducted. Strategies had a main effect on accuracy during session
973
1271
48
1085
25
227
0 500 1000 1500
Fast
Delayed
Add 1x1
Tool
Other
Advanced
Count of New Strategy Categories
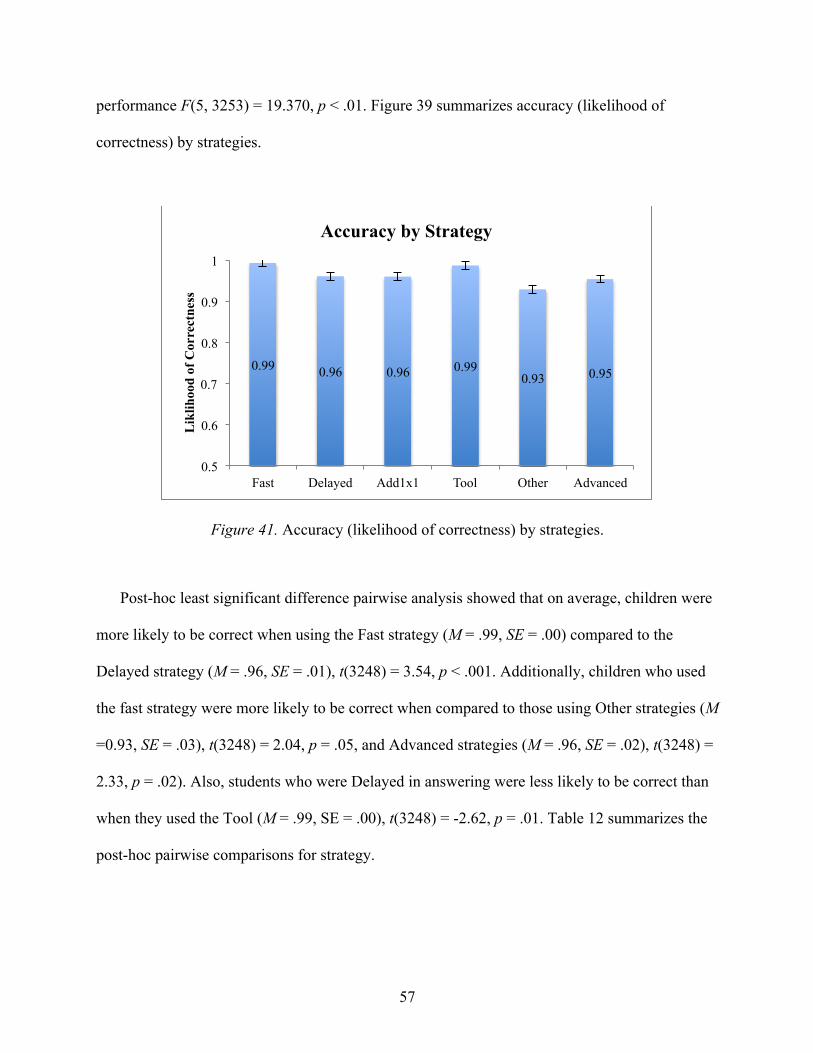
57
performance F(5, 3253) = 19.370, p < .01. Figure 39 summarizes accuracy (likelihood of
correctness) by strategies.
Figure 41. Accuracy (likelihood of correctness) by strategies.
Post-hoc least significant difference pairwise analysis showed that on average, children were
more likely to be correct when using the Fast strategy (M = .99, SE = .00) compared to the
Delayed strategy (M = .96, SE = .01), t(3248) = 3.54, p < .001. Additionally, children who used
the fast strategy were more likely to be correct when compared to those using Other strategies (M
=0.93, SE = .03), t(3248) = 2.04, p = .05, and Advanced strategies (M = .96, SE = .02), t(3248) =
2.33, p = .02). Also, students who were Delayed in answering were less likely to be correct than
when they used the Tool (M = .99, SE = .00), t(3248) = -2.62, p = .01. Table 12 summarizes the
post-hoc pairwise comparisons for strategy.
0.99 0.96 0.96 0.99 0.93 0.95
0.5
0.6
0.7
0.8
0.9
1
Fast Delayed Add1x1 Tool Other Advanced
Lik
lihoo
d of
Cor
rect
ness
Accuracy by Strategy
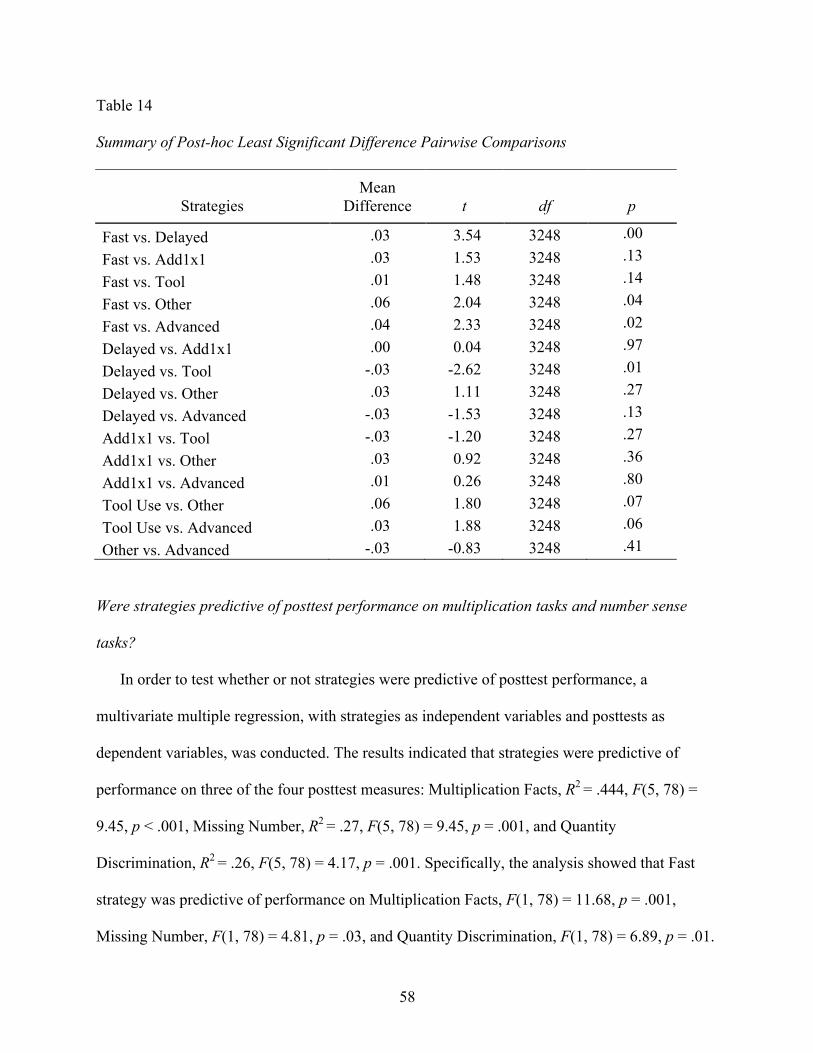
58
Table 14
Summary of Post-hoc Least Significant Difference Pairwise Comparisons
Strategies Mean
Difference t df p
Fast vs. Delayed .03 3.54 3248 .00
Fast vs. Add1x1 .03 1.53 3248 .13
Fast vs. Tool .01 1.48 3248 .14
Fast vs. Other .06 2.04 3248 .04
Fast vs. Advanced .04 2.33 3248 .02
Delayed vs. Add1x1 .00 0.04 3248 .97
Delayed vs. Tool -.03 -2.62 3248 .01
Delayed vs. Other .03 1.11 3248 .27
Delayed vs. Advanced -.03 -1.53 3248 .13
Add1x1 vs. Tool -.03 -1.20 3248 .27
Add1x1 vs. Other .03 0.92 3248 .36
Add1x1 vs. Advanced .01 0.26 3248 .80
Tool Use vs. Other .06 1.80 3248 .07
Tool Use vs. Advanced .03 1.88 3248 .06
Other vs. Advanced -.03 -0.83 3248 .41
Were strategies predictive of posttest performance on multiplication tasks and number sense
tasks?
In order to test whether or not strategies were predictive of posttest performance, a
multivariate multiple regression, with strategies as independent variables and posttests as
dependent variables, was conducted. The results indicated that strategies were predictive of
performance on three of the four posttest measures: Multiplication Facts, R2 = .444, F(5, 78) =
9.45, p < .001, Missing Number, R2 = .27, F(5, 78) = 9.45, p = .001, and Quantity
Discrimination, R2 = .26, F(5, 78) = 4.17, p = .001. Specifically, the analysis showed that Fast
strategy was predictive of performance on Multiplication Facts, F(1, 78) = 11.68, p = .001,
Missing Number, F(1, 78) = 4.81, p = .03, and Quantity Discrimination, F(1, 78) = 6.89, p = .01.
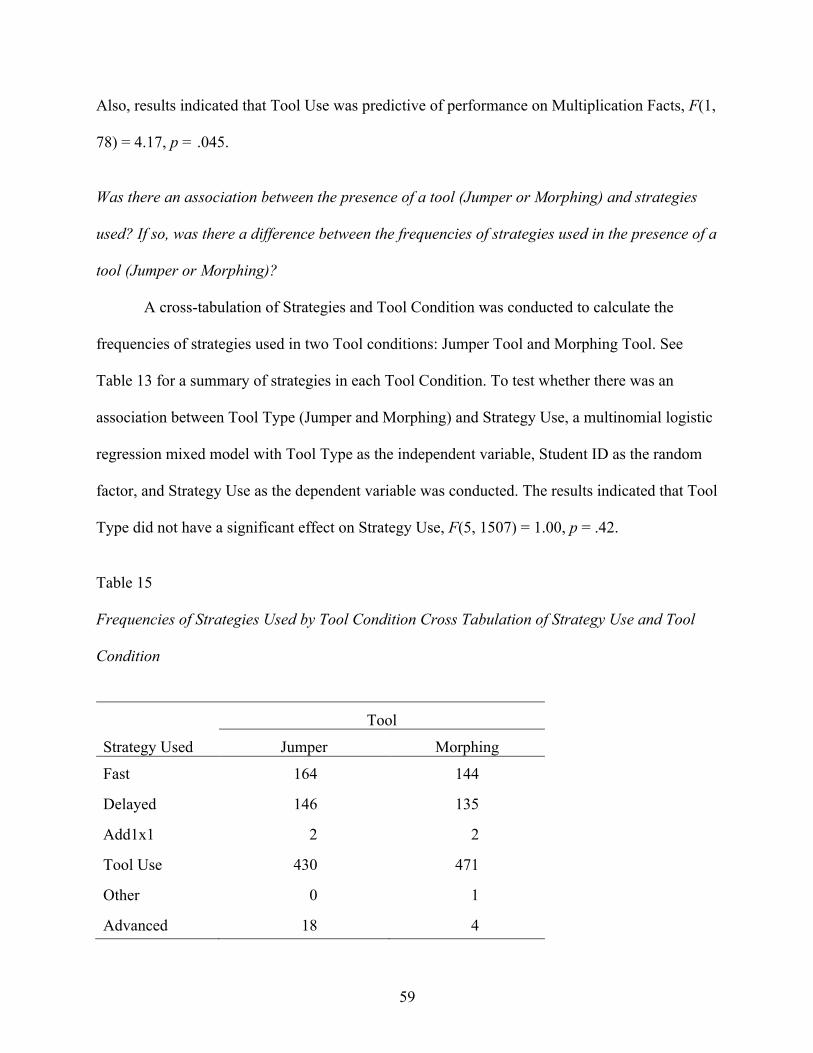
59
Also, results indicated that Tool Use was predictive of performance on Multiplication Facts, F(1,
78) = 4.17, p = .045.
Was there an association between the presence of a tool (Jumper or Morphing) and strategies
used? If so, was there a difference between the frequencies of strategies used in the presence of a
tool (Jumper or Morphing)?
A cross-tabulation of Strategies and Tool Condition was conducted to calculate the
frequencies of strategies used in two Tool conditions: Jumper Tool and Morphing Tool. See
Table 13 for a summary of strategies in each Tool Condition. To test whether there was an
association between Tool Type (Jumper and Morphing) and Strategy Use, a multinomial logistic
regression mixed model with Tool Type as the independent variable, Student ID as the random
factor, and Strategy Use as the dependent variable was conducted. The results indicated that Tool
Type did not have a significant effect on Strategy Use, F(5, 1507) = 1.00, p = .42.
Table 15
Frequencies of Strategies Used by Tool Condition Cross Tabulation of Strategy Use and Tool
Condition
Tool
Strategy Used Jumper Morphing
Fast 164 144
Delayed 146 135
Add1x1 2 2
Tool Use 430 471
Other 0 1
Advanced 18 4
60
CHAPTER 4:
DISCUSSION
This study examined the effectiveness of two digital tools: a virtual number line (Jumper
Tool); and a dynamic hundreds chart (Morphing Chart) in improving children’s conceptual and
procedural understanding of multiplication. It also explored strategy use while solving
multiplication problems and how these strategies affected children’s performance on
multiplication tasks and how this improved children’s number sense in general. This section
interprets the results of each research question, discusses limitations, presents areas for future
research, and offers implications for designers and educators.
Overview of Findings
Research Question 1. The first research question asked whether the Multiplication
Software improved children’s conceptual and procedural understanding of multiplication and/or
number sense. Specifically, the study examined whether those children using the software
outperformed those who did not use the software. The findings indicate that all groups – Control,
Jumper, Morphing – made significant gains from pre- to posttests, however, there were no
significant differences in performance between those in the treatment group and those in the
control group. Also, the two treatment groups did not differ from one another from pre- to
posttest. There were limitations in the design of the study that contributed to a lack of significant
findings from pre- to posttests, which will be discussed further under Limitations.
Research Question 2. The second research question asked whether or not there were
differences in performance in the presence or absence of the Jumper or Morphing tools while
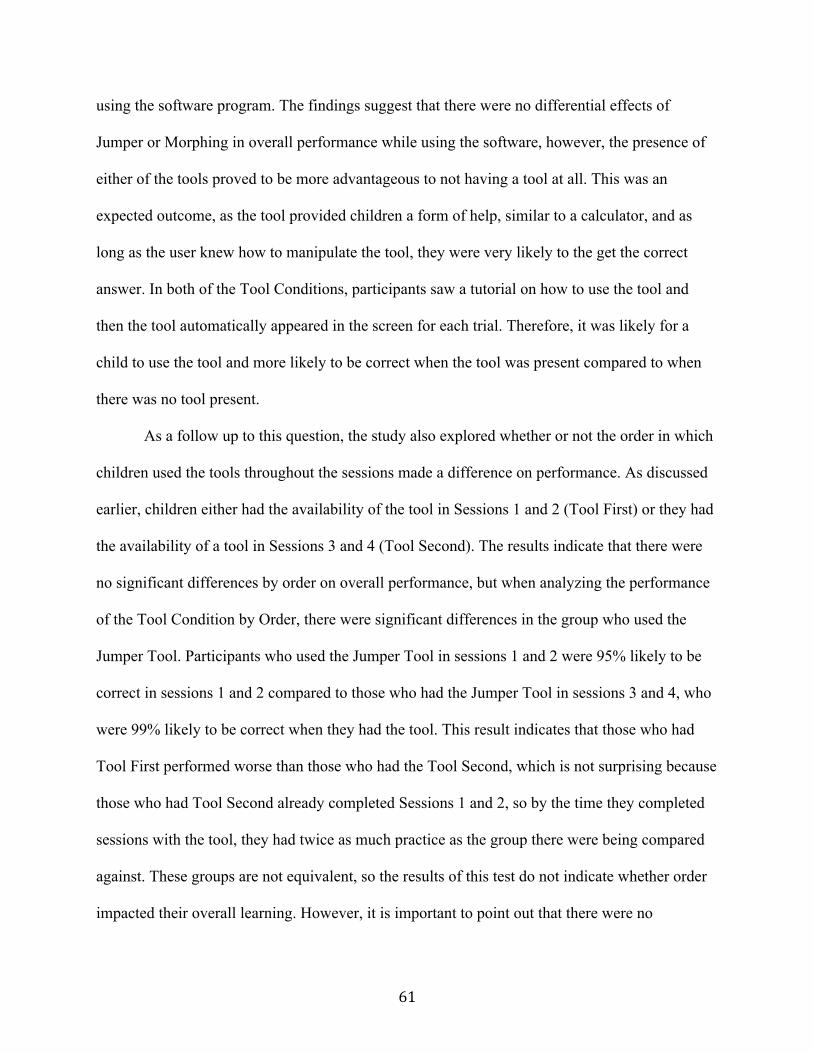
61
using the software program. The findings suggest that there were no differential effects of
Jumper or Morphing in overall performance while using the software, however, the presence of
either of the tools proved to be more advantageous to not having a tool at all. This was an
expected outcome, as the tool provided children a form of help, similar to a calculator, and as
long as the user knew how to manipulate the tool, they were very likely to the get the correct
answer. In both of the Tool Conditions, participants saw a tutorial on how to use the tool and
then the tool automatically appeared in the screen for each trial. Therefore, it was likely for a
child to use the tool and more likely to be correct when the tool was present compared to when
there was no tool present.
As a follow up to this question, the study also explored whether or not the order in which
children used the tools throughout the sessions made a difference on performance. As discussed
earlier, children either had the availability of the tool in Sessions 1 and 2 (Tool First) or they had
the availability of a tool in Sessions 3 and 4 (Tool Second). The results indicate that there were
no significant differences by order on overall performance, but when analyzing the performance
of the Tool Condition by Order, there were significant differences in the group who used the
Jumper Tool. Participants who used the Jumper Tool in sessions 1 and 2 were 95% likely to be
correct in sessions 1 and 2 compared to those who had the Jumper Tool in sessions 3 and 4, who
were 99% likely to be correct when they had the tool. This result indicates that those who had
Tool First performed worse than those who had the Tool Second, which is not surprising because
those who had Tool Second already completed Sessions 1 and 2, so by the time they completed
sessions with the tool, they had twice as much practice as the group there were being compared
against. These groups are not equivalent, so the results of this test do not indicate whether order
impacted their overall learning. However, it is important to point out that there were no
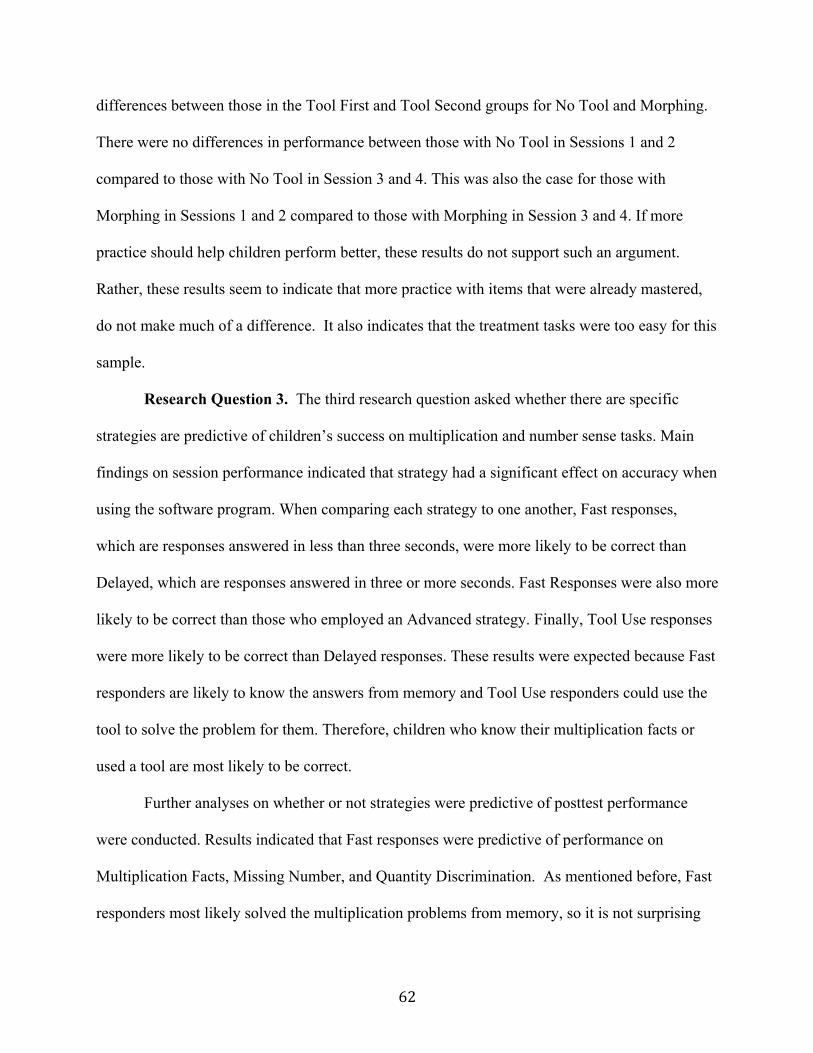
62
differences between those in the Tool First and Tool Second groups for No Tool and Morphing.
There were no differences in performance between those with No Tool in Sessions 1 and 2
compared to those with No Tool in Session 3 and 4. This was also the case for those with
Morphing in Sessions 1 and 2 compared to those with Morphing in Session 3 and 4. If more
practice should help children perform better, these results do not support such an argument.
Rather, these results seem to indicate that more practice with items that were already mastered,
do not make much of a difference. It also indicates that the treatment tasks were too easy for this
sample.
Research Question 3. The third research question asked whether there are specific
strategies are predictive of children’s success on multiplication and number sense tasks. Main
findings on session performance indicated that strategy had a significant effect on accuracy when
using the software program. When comparing each strategy to one another, Fast responses,
which are responses answered in less than three seconds, were more likely to be correct than
Delayed, which are responses answered in three or more seconds. Fast Responses were also more
likely to be correct than those who employed an Advanced strategy. Finally, Tool Use responses
were more likely to be correct than Delayed responses. These results were expected because Fast
responders are likely to know the answers from memory and Tool Use responders could use the
tool to solve the problem for them. Therefore, children who know their multiplication facts or
used a tool are most likely to be correct.
Further analyses on whether or not strategies were predictive of posttest performance
were conducted. Results indicated that Fast responses were predictive of performance on
Multiplication Facts, Missing Number, and Quantity Discrimination. As mentioned before, Fast
responders most likely solved the multiplication problems from memory, so it is not surprising
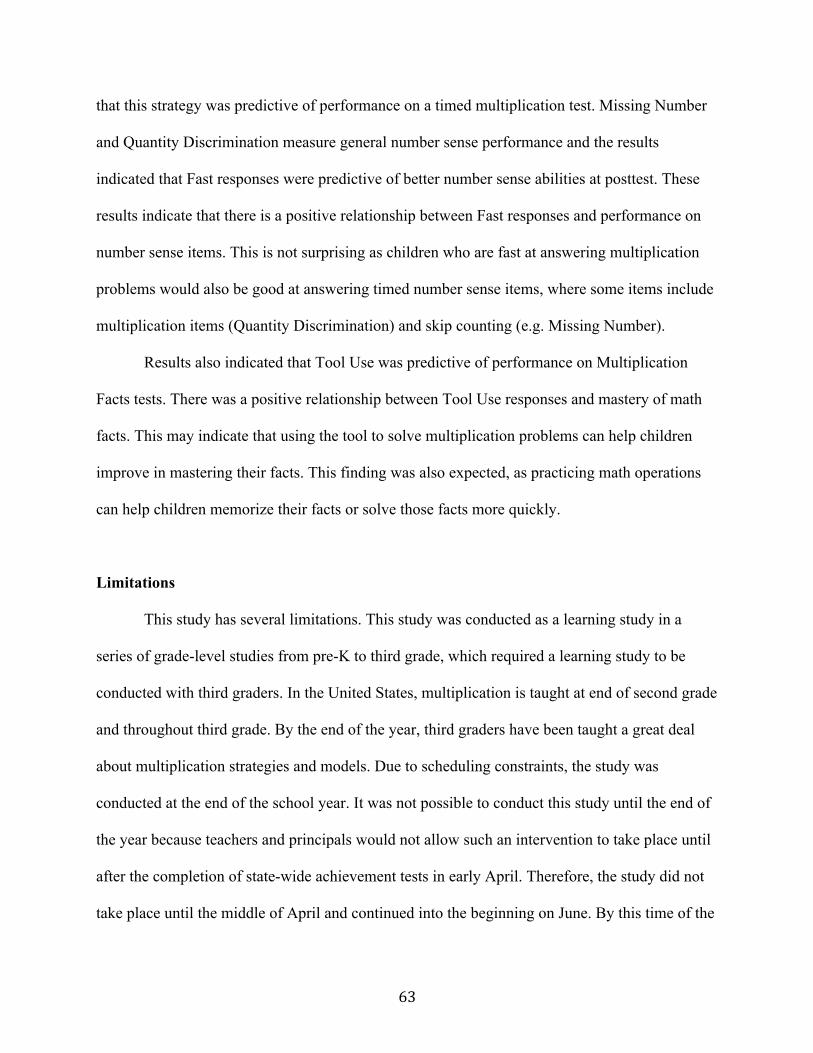
63
that this strategy was predictive of performance on a timed multiplication test. Missing Number
and Quantity Discrimination measure general number sense performance and the results
indicated that Fast responses were predictive of better number sense abilities at posttest. These
results indicate that there is a positive relationship between Fast responses and performance on
number sense items. This is not surprising as children who are fast at answering multiplication
problems would also be good at answering timed number sense items, where some items include
multiplication items (Quantity Discrimination) and skip counting (e.g. Missing Number).
Results also indicated that Tool Use was predictive of performance on Multiplication
Facts tests. There was a positive relationship between Tool Use responses and mastery of math
facts. This may indicate that using the tool to solve multiplication problems can help children
improve in mastering their facts. This finding was also expected, as practicing math operations
can help children memorize their facts or solve those facts more quickly.
Limitations
This study has several limitations. This study was conducted as a learning study in a
series of grade-level studies from pre-K to third grade, which required a learning study to be
conducted with third graders. In the United States, multiplication is taught at end of second grade
and throughout third grade. By the end of the year, third graders have been taught a great deal
about multiplication strategies and models. Due to scheduling constraints, the study was
conducted at the end of the school year. It was not possible to conduct this study until the end of
the year because teachers and principals would not allow such an intervention to take place until
after the completion of state-wide achievement tests in early April. Therefore, the study did not
take place until the middle of April and continued into the beginning on June. By this time of the
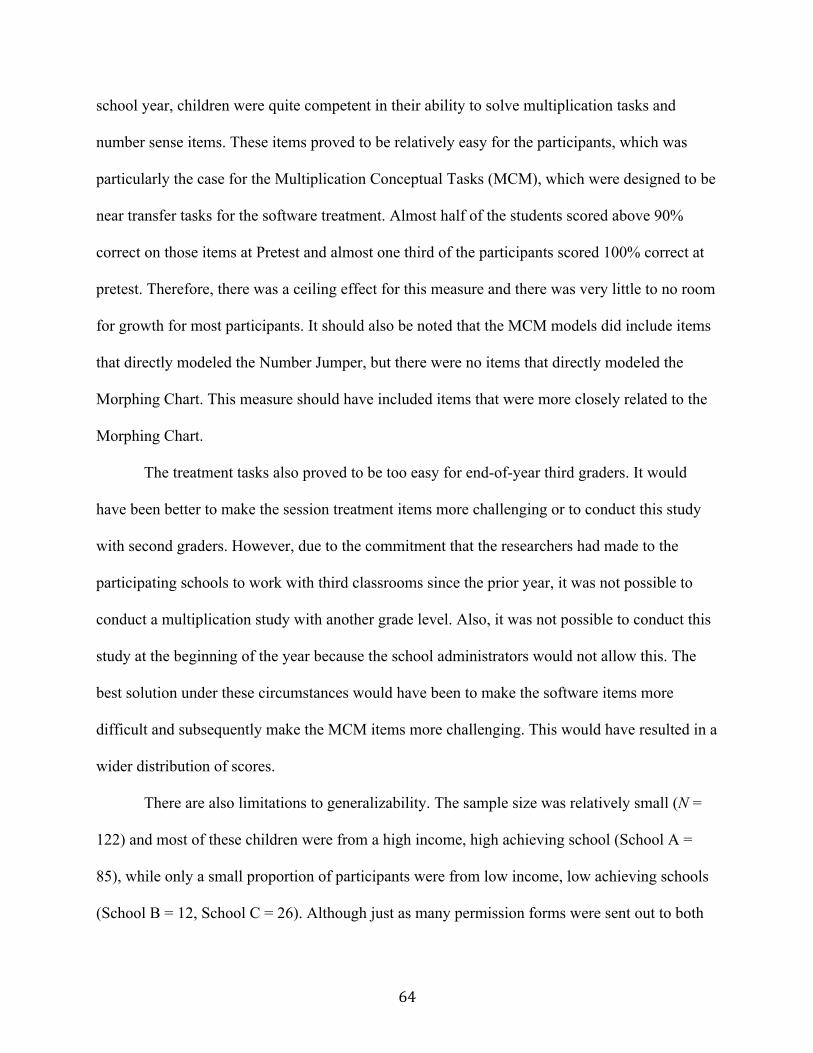
64
school year, children were quite competent in their ability to solve multiplication tasks and
number sense items. These items proved to be relatively easy for the participants, which was
particularly the case for the Multiplication Conceptual Tasks (MCM), which were designed to be
near transfer tasks for the software treatment. Almost half of the students scored above 90%
correct on those items at Pretest and almost one third of the participants scored 100% correct at
pretest. Therefore, there was a ceiling effect for this measure and there was very little to no room
for growth for most participants. It should also be noted that the MCM models did include items
that directly modeled the Number Jumper, but there were no items that directly modeled the
Morphing Chart. This measure should have included items that were more closely related to the
Morphing Chart.
The treatment tasks also proved to be too easy for end-of-year third graders. It would
have been better to make the session treatment items more challenging or to conduct this study
with second graders. However, due to the commitment that the researchers had made to the
participating schools to work with third classrooms since the prior year, it was not possible to
conduct a multiplication study with another grade level. Also, it was not possible to conduct this
study at the beginning of the year because the school administrators would not allow this. The
best solution under these circumstances would have been to make the software items more
difficult and subsequently make the MCM items more challenging. This would have resulted in a
wider distribution of scores.
There are also limitations to generalizability. The sample size was relatively small (N =
122) and most of these children were from a high income, high achieving school (School A =
85), while only a small proportion of participants were from low income, low achieving schools
(School B = 12, School C = 26). Although just as many permission forms were sent out to both
65
types of schools, participation at School A was 82%, while participation at School B was 37%
and School C was 24%. Therefore, the sample consisted of a greater proportion of students from
a high-income, high-achieving school compared to those in low-income, low-achieving schools.
This may have contributed to the ceiling effect of the MCM items as well.
In an effort to offer children a similar experience of working one-on-one with a
researcher while using a computer program, Braintastic Reading software was chosen as a grade-
level appropriate program. However, choosing Braintastic Reading did not address mathematical
topics and therefore, was not the best choice for use with the Control group. Instead, paper-based
multiplication activities would have been a better activity for comparison purposes.
Future Work
Future studies should consider modifying the near transfer tasks, such as those in the
MCM tasks, to be appropriately designed for students in a given age group and time of year that
they are participating in such a study. The measures should also include items that are more
closely related to the Morphing Chart. Studies with younger children, or early in the school year,
should be conducted because instruction of multiplication typically begins in second grade and
not in third grade.
Studies using software programs as intervention are valuable because novel tools in a
digital setting can be tested out and backend data can be collected easily while students use
software. Although data mining techniques were not employed in these analyses, log data from
this study could be used to analyze more about children’s behavior while using such software.
As a follow-up study, researchers could explore which students were fast and correct in
the sessions 1 and 2 to see who already knew their facts. Eliminating such cases would allow
66
researchers to learn more about those who had not mastered their facts yet. Also, order effects
could be explored further. The timing of interventions seems to matter and having time to
explore and invent before receiving explicit instruction about how to solve math problems
appears to have an advantage over a “tell and practice” approach to teaching (Schwartz &
Martin, 2004). Investigating how the timing of when interventions are implemented affects
learning could have important implications for instruction and the design of software programs.
More studies should include information on how children solve problems, rather than just
looking at performance on activities. Exploring conditions that affect the choices that children
make on the type of strategy employed would also be valuable. As a follow up to this study,
more analyses could be conducted on which strategies children choose in the absence of a tool,
after they have already used a tool.
Implications for Instruction
There are varying philosophies on how to teach children math concepts and skills.
Memorizing facts seems to be a useful way to solve multiplication facts, but what do you teach
when children have not memorized their facts yet and they are just learning about the idea of
multiplying? This study indicated that overall performance during the treatment sessions was
better when children had the tool present compared to having no tool at all. It appears that the
tool had a positive effect on performance. It is not clear what aspect of the tool was providing the
most aid to children, but it does appear that having some help was better than having none at all.
Also, tool use was associated with better outcomes in the Multiplication Timed Test, which
indicates that using the tool was associated with better mastery of facts. Since the tool can be
67
seen as a type of calculator, it appears that practice with the tool can help children master their
multiplication facts and therefore, using calculators should be considered as useful.
The use of math software can also prove to be useful for teaching. Software can certainly
replace worksheets and teachers can leave the scoring up to the software instead of grading a
whole set of papers. Software also has the ability to give students immediate feedback. Typically
a child might complete their homework or test and have to wait a few days before the teacher has
a chance to look over the work and provide feedback, but with software, the child can find out if
he s/he is correct and many programs can even pinpoint the type of errors that children make.
Implication for Designers
Digital tools can help children solve problems in ways that they may not be able to on
paper or in their minds. Software designers can improve the design of educational software by
conducting research on the effectiveness of such tools.
This study utilized backend data for studying children’s interaction with the software.
When designing educational software, it is important to build in backend log systems and it
would be useful to also include backend data analytics that can report performance for users,
teachers, and parents. Although there are many educational apps on the market, very few of these
offer reports on performance. Much of this is due to a lack of backend data collection and
analytical systems.
Conclusions
Although there has been much research conducted on how children learn about basic
number concepts, addition, and subtraction, there are not many studies about children’s learning
68
of multiplication, nor has there been much research with young children using software. This
study sought out to show that certain models and digital tools were effective in helping children
learn about multiplication. Although the study could not show that these tools had a differential
effect on children’s learning or performance, the study did demonstrate that having a tool or
visual model is better than having none at all. The results of this study also provide evidence that
children who know their facts from memory have better number sense abilities. Therefore,
educators should not discount the value of learning and mastering multiplication facts. Efforts to
help children master their facts, as well as understand concepts, should be a focus of elementary
math education and further research should be conducted on how to best help children reach
mastery. Additionally, this study demonstrates that research on digital learning has to be very
different from traditional learning studies. In traditional learning studies, reinforcement of
learning is compared to the absence of reinforcement, but in the case of software, there are many
more factors that impact learning (e.g. graphics, timing of intervention, game mechanics, types
of feedback, frequency of feedback and tutorials, quality of tutorials and feedback, etc.).
Experimental studies may not capture all these factors, so case studies and qualitative studies
may make more sense in studying learning with software.
69
REFERENCES
Baroody, A. J. (1993). Early mental multiplication performance and the role of relational knowledge in mastering combinations involving two. Learning and Instruction, 3, 93-111.
Baroody, A. J. (1994). An evaluation of evidence supporting fact-retrieval models. Learning and Individual Differences, 6, 1–36.
Baroody, A. J. (1999). The roles of estimation and the commutativity principle in the development of third graders’ mental multiplication. Journal of Experimental Child Psychology, 74, 157–193.
Baroody, A. J., & Ginsburg, H. P. (1986). The relationship between initial meaningful and mechanical knowledge of arithmetic. In J. Hiebert (Ed.), Conceptual and procedural knowledge: The case of mathematics (pp. 75–112). Hillsdale, NJ: Erlbaum.
Baroody, A. J., & Ginsburg, H. P. (1991). A cognitive approach to assessing the mathematical difficulties of children labeled learning disabled. In H. L. Swanson (Ed.), Handbook on the assessment of learning disabilities: Theory, research and practice (pp. 177–277). Austin: Pro-Ed.
Carpenter, T. P., Fennema, E., Franke, M. L., Levi, L., & Empson, S. B. (1999). Children’s mathematics: Cognitively guided instruction. Portsmouth, NH: Heinemann and Reston, VA: National Council of Teachers of Mathematics.
Clements, D. H. (2002). Computers in early childhood mathematics. Contemporary Issues in Early Childhood, 3, 160-181.
Clements, D. H., & Sarama, J. (2007). Effects of a preschool mathematics curriculum: Summative research on the Building Blocks project. Journal for Research in Mathematics Education, 38, 136-163.
Collars, C., Lee, K. P., Hoe, L. N., & Seng, T. C. (2007). Shaping maths coursebook 3A. Singapore: Marshall Cavendish Education.
English, L. D. (Ed.). (1997). Mathematical reasoning: Analogies, metaphors, and images. Mahwah, NJ: Erlbaum.
Fong, H. K., Ramakrishnan, C., Choo, M., Bisk, R., Clark, A., & Kanter, P. (2009). Math in focus: Singapore Math. Grades 1-5. Singapore: Marshall Cavendish Education.
Fosnot, C. T. (2010), Investigate Multiplication Getting Started with Contexts for LearningMathematics, Grades 3-5, Portsmouth, NH: Heinemann.
Fuson, K. C., & Briars, D. (1990). Using a base-ten blocks learning/teaching approach for first and second-grade place-value and multidigit addition and subtraction. Journal for Research in Mathematics Education, 21, 180-206.
70
Ginsburg, H. P., Carpenter, K. K., & Labrecque, R. (2011, March). Introduction to MathemAntics:Software for children from age 3 to grade 3. Paper presented at the International Society for Design and Development Conference, Boston, MA.
Grouws, D. A. (Ed.). (1992). Handbook of research on mathematics teaching and learning. New York: Macmillan.
Greer, B. (1994). Extending the meaning of multiplication and division. In G. Harel & J. Confrey (Eds.) The development of multiplicative reasoning in the learning of mathematics (pp. 61-85). Albany, NY: SUNY Press.
Johnson-Gentile, K., Clements, D. H., & Battista, M. T. (1994). The effects of computer and noncomputer environments on students’conceptualizations of geometric motions. Journal of Educational Computing Research, 11, 121–140.
Lampert, M. (1986). Knowing, doing, and teaching multiplication. Cognition and Instruction, 3, 305-342.
Lee, Y.-S., Pappas, S., Chiong, C., & Ginsburg, H. P. (2010). mCLASS®: MATH – Technical manual. Brooklyn, NY: Wireless Generation.
Levine, S. C., Jordan, N., & Huttenlocher, J. (1992). Development of calculation abilities in young children. Journal of Experimental Child Psychology, 53 (1), 72-103.
Moyer, P. S. (2001). Are we having fun yet? How teachers use manipulatives to teach mathematics. Educational Studies in Mathematics, 47(2), 175-197.
Moyer, P. S., Niezgoda, D., & Stanley, J. (2005). Young children’s use of virtual manipulatives and other forms of mathematical representations. In W. Masalski & P. C. Elliott (Eds.), Technology-supported mathematics learning environments: 67th yearbook (pp. 17–34). Reston, VA: National Council of Teachers of Mathematics.
Moyer-Packenham, P. S. (2005). Using virtual manipulatives to investigate patterns and generate rules in algebra. Teaching Children Mathematics, 11(8), 437-444.
Moyer-Packenham, P. S., & Suh, J. M. (2012). Learning mathematics with technology: The influence of virtual manipulatives on different achievement groups. Journal of Computers in Mathematics and Science Teaching, 31(1), 39-59.
Mulligan, J. T., & Mitchelmore, M. C. (1997). Young children’s intuitive models of multiplication and division. Journal for Research in Mathematics Education, 28(3), 309-331.
National Assessment of Educational Progress (2013). 2013 mathematics assessment. Washington, DC: U.S. Department of Education, Institute of Education Sciences, National Center for Education Statistics.
71
National Governors Association Center for Best Practices, & Council of Chief State School Officers (2010). Common Core State Standards Initiative. Washington, DC: Author. Retrieved from http://www.corestandards.org/assets/CCSSI_Math%20Standards.pdf
National Mathematics Advisory Panel. (2008). Foundations for success. Washington, DC: US Department of Education.
Nesher, P. (1988). Multiplicative school word problems: Theoretical approaches and empirical findings. In J. Hiebert & M. Behr (Eds.), Number concepts and operations in the middle grades (pp. 19-41). Hillsdale, NJ: Erlbaum.
Noss, R., & Hoyles, C. (2009). The technological mediation of mathematics and its learning. Human Development, 52(2). 129-147.
O’Brien, T. C., & Casey, S. A. (1983). Children learning multiplication: Part I. School Science and Mathematics, 83(1), 246-251.
Ohlsson, S. (1987). Sense and reference in the design of interactive illustrations for rational numbers. In R.W. Lawler & M. Yazdani (Eds.), Artificial intelligence and education: Vol 1. Learning environments and tutoring systems (pp. 304-377). Norwood, NJ: Ablex.
Pearson Scott Foresman TERC. (2008). Investigations in number, data, and space (2nd ed.). Glenview, IL: Pearson Scott Foresman.
Peled, I., & Nesher, P (1988). What children tell us about multiplication work problems. Journal of mathematical behavior, 7, 239-262.
Reimer, K., & Moyer, P. S. (2005). Third graders learn about fractions using virtual manipulatives: A classroom study. Journal of Computers in Mathematics and Science Teaching, 24(1), 5-25.
Sarama, J., & Clements, D. H. (2002). Building Blocks for young children's mathematical development. Journal of Educational Computing Research, 27, 93-110.
Schwartz, D. L., & Martin, T. (2004). Inventing to prepare for future learning: The hidden efficiency of encouraging original student production in statistics instruction. Cognition and Instruction, 22, 129-184
Siegler, R. S. (1988). Strategy choice procedures and the development of multiplication skill. Journal of Experimental Psychology: General, 117, 258–275.
Trivett, J. (1980). The multiplication table: To be memorized or mastered? For Learning of Mathematics, 1, 21-25.
University of Chicago School Mathematics Project. (2007). Everyday Mathematics. Chicago: Wright Group/McGraw-Hill.

72
Vergnaud, G. (1988). Multiplicative structures. In J. Hiebert& M. Behr (Eds.), Number concepts and operations in the middle grades (pp. 141-162). Hillsdale, NJ: Erlbaum.
Wallace, A. H., & Gurganus, S. P. (2005). Teaching for mastery of multiplication. Teaching Children Mathematics, 12(1), 26-33.
Wong, M., & Evans, D. (2007). Improving basic multiplication fact recall for primary school students. Mathematics Education Research Journal, 19(1), 89-106.
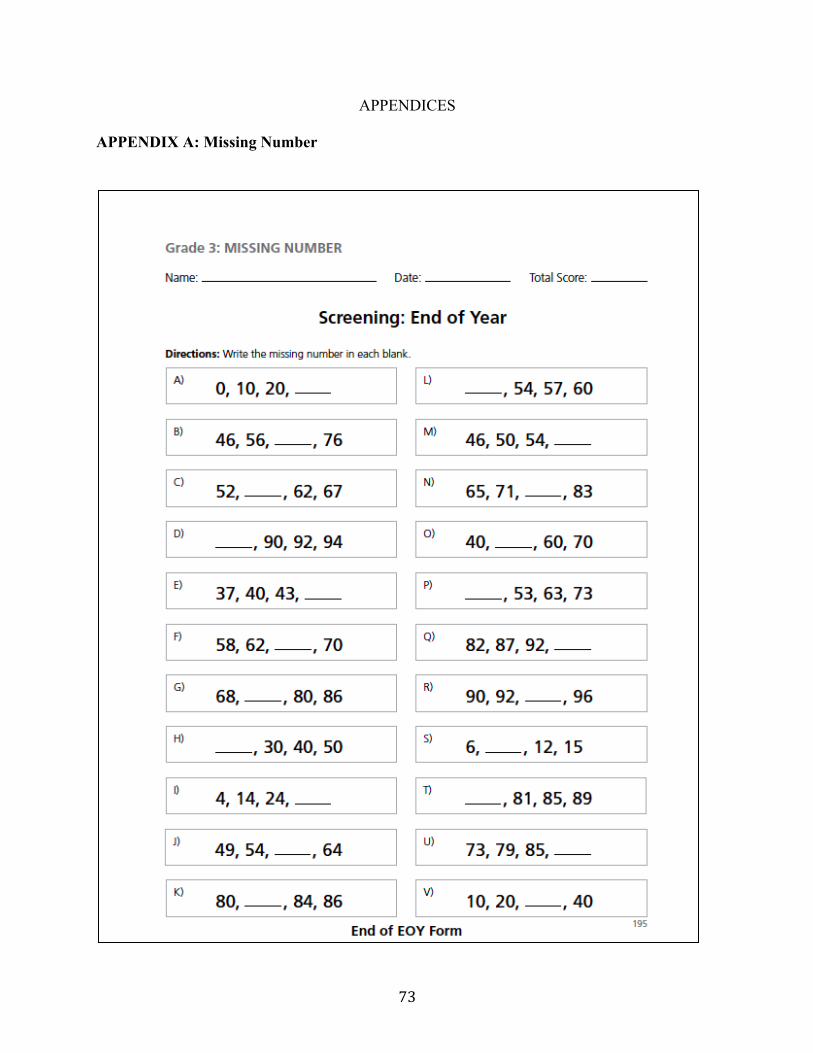
73
APPENDICES
APPENDIX A: Missing Number
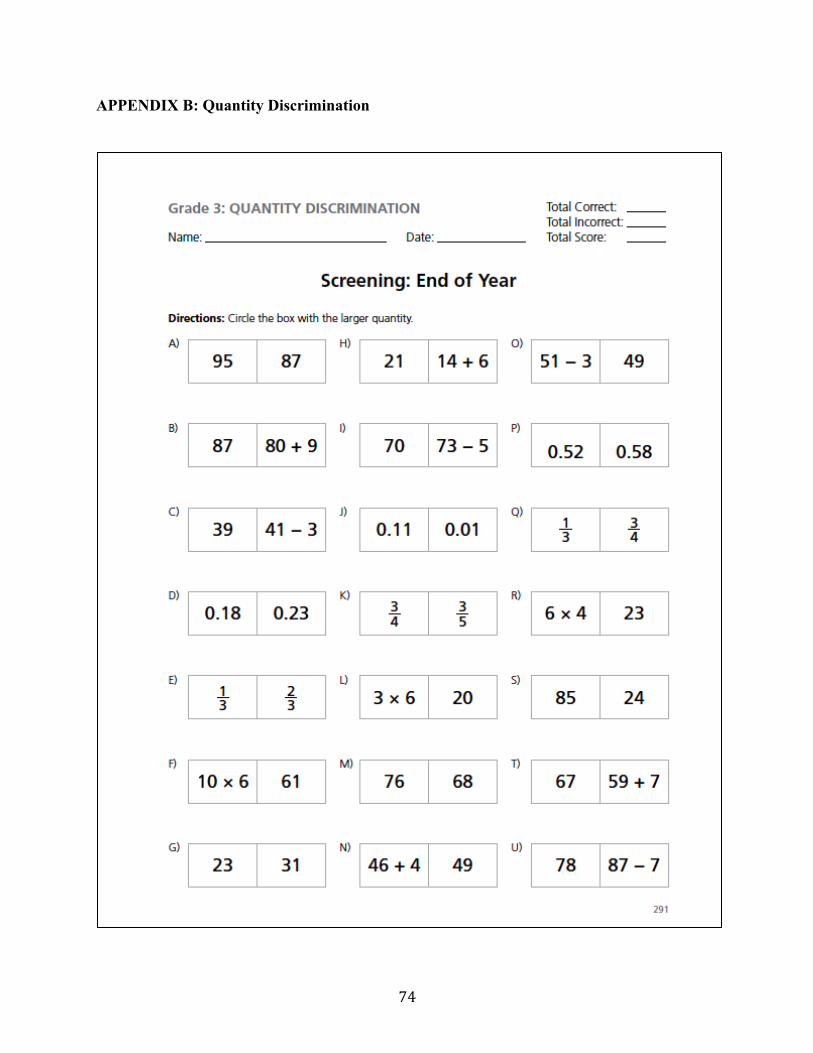
74
APPENDIX B: Quantity Discrimination
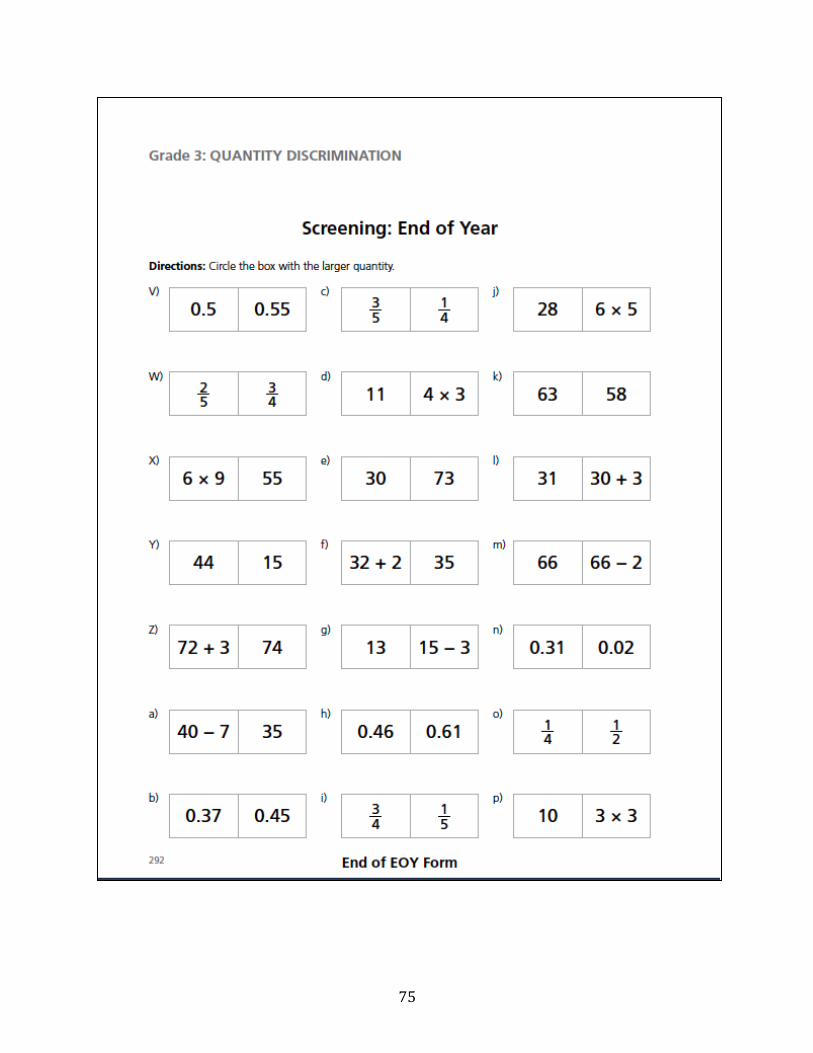
75
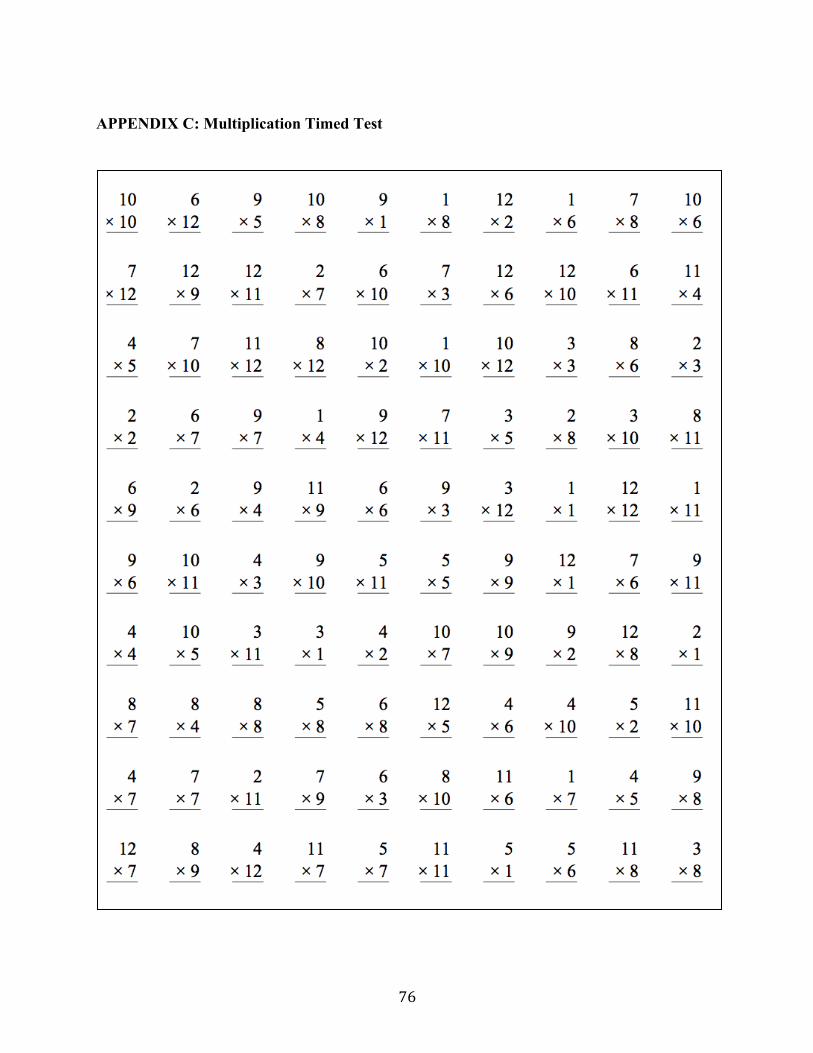
76
APPENDIX C: Multiplication Timed Test
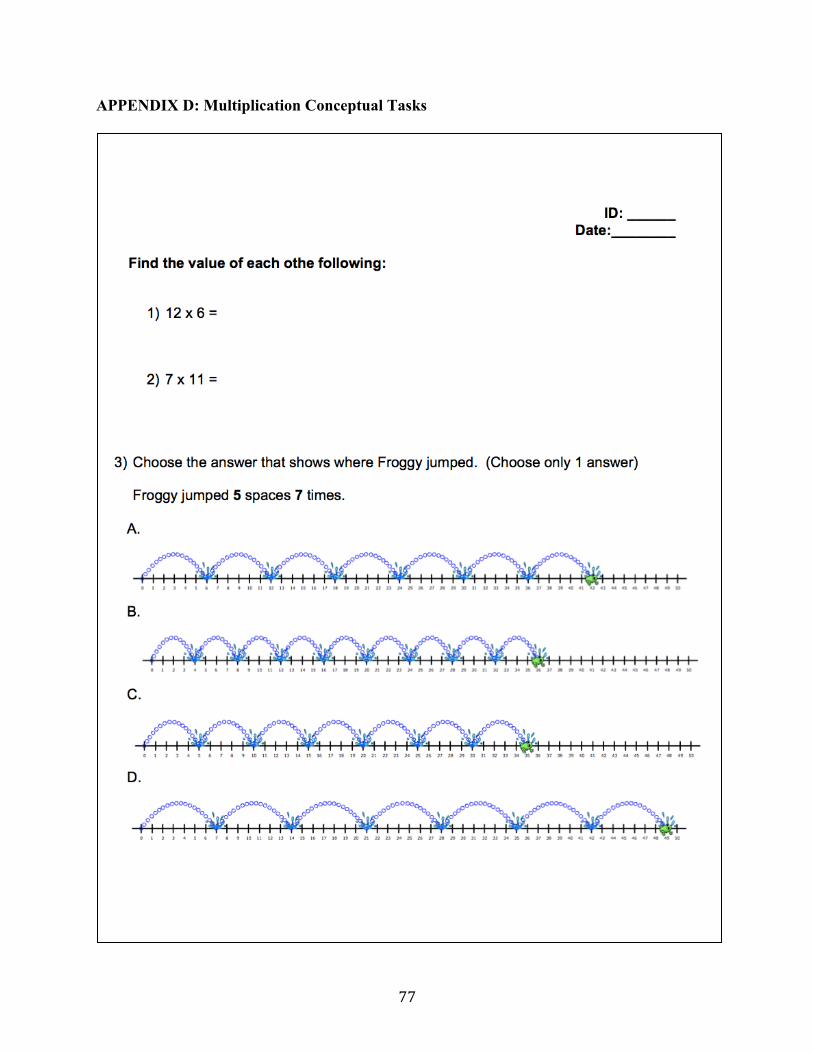
77
APPENDIX D: Multiplication Conceptual Tasks
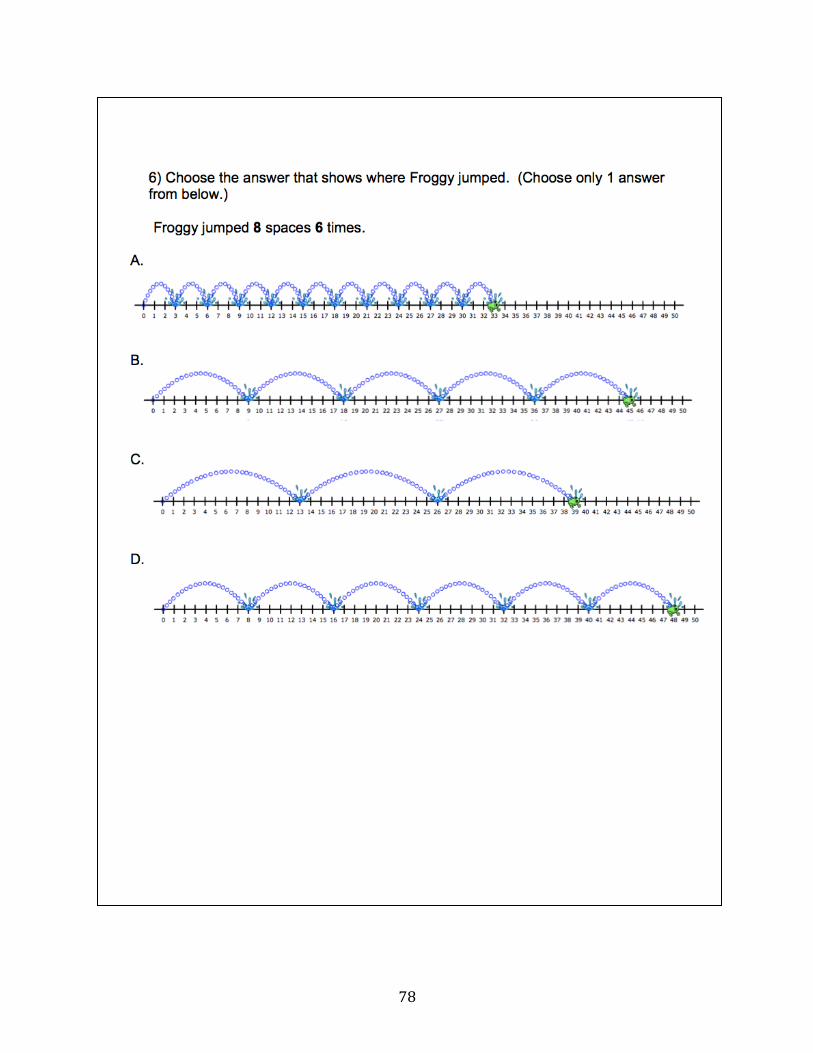
78
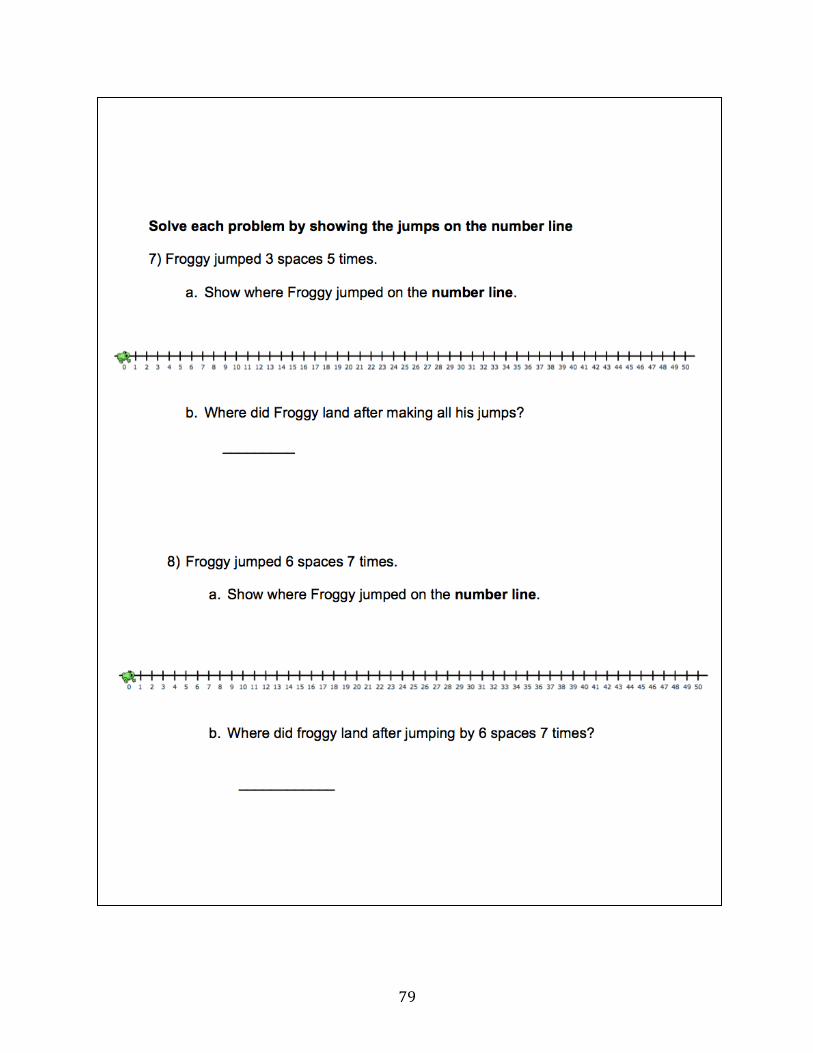
79
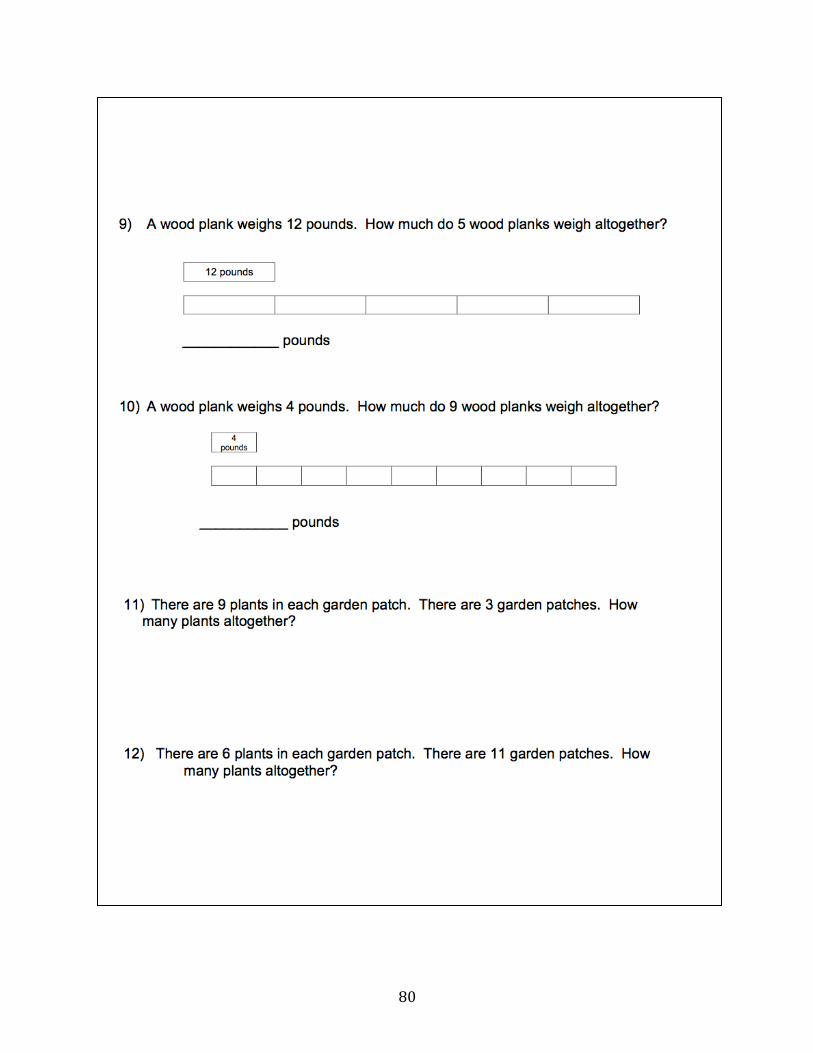
80
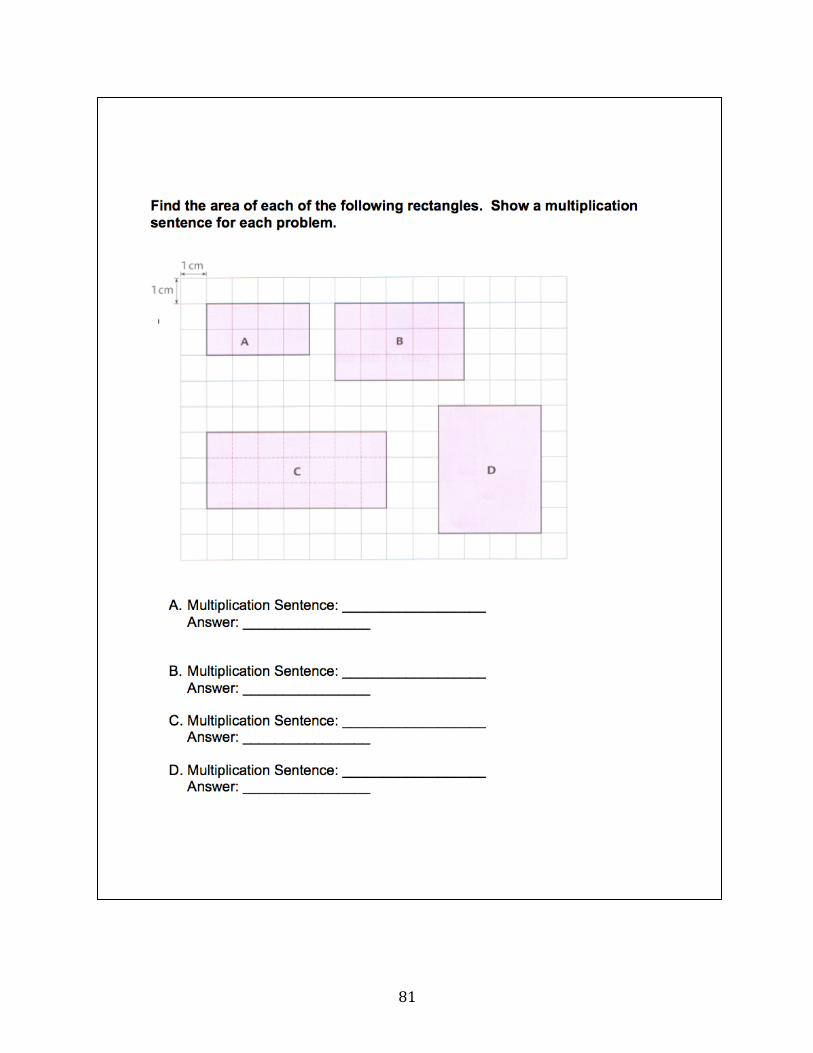
81
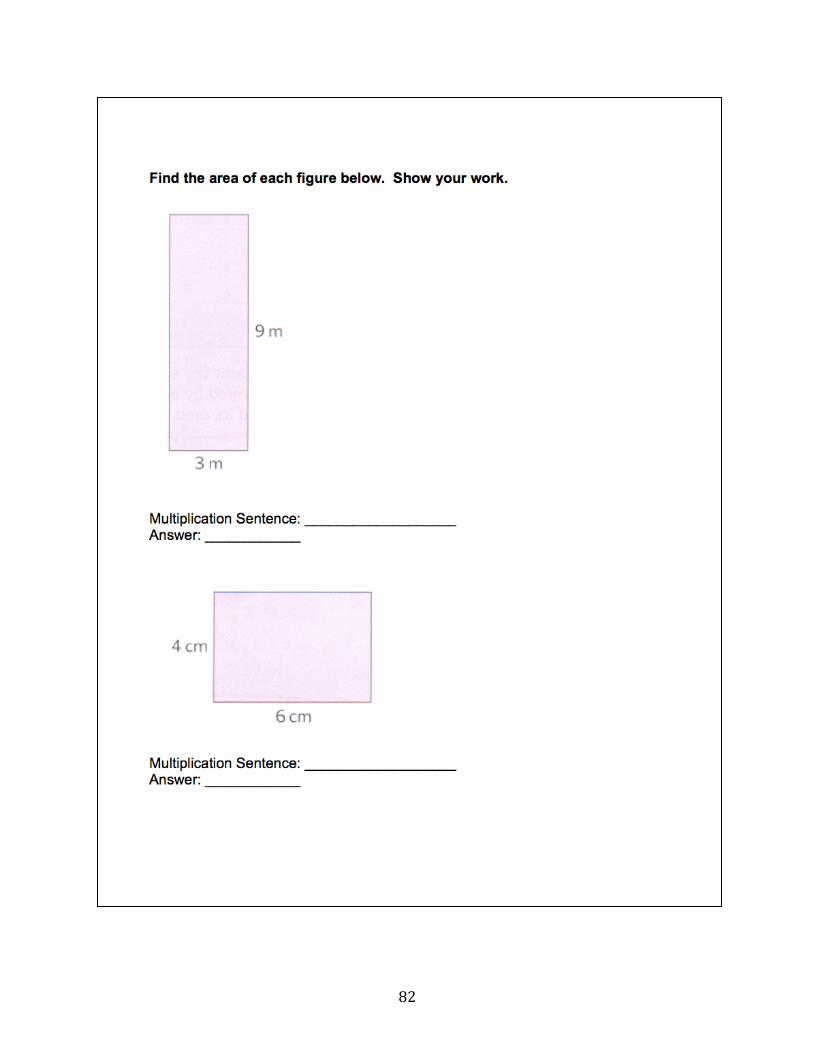
82
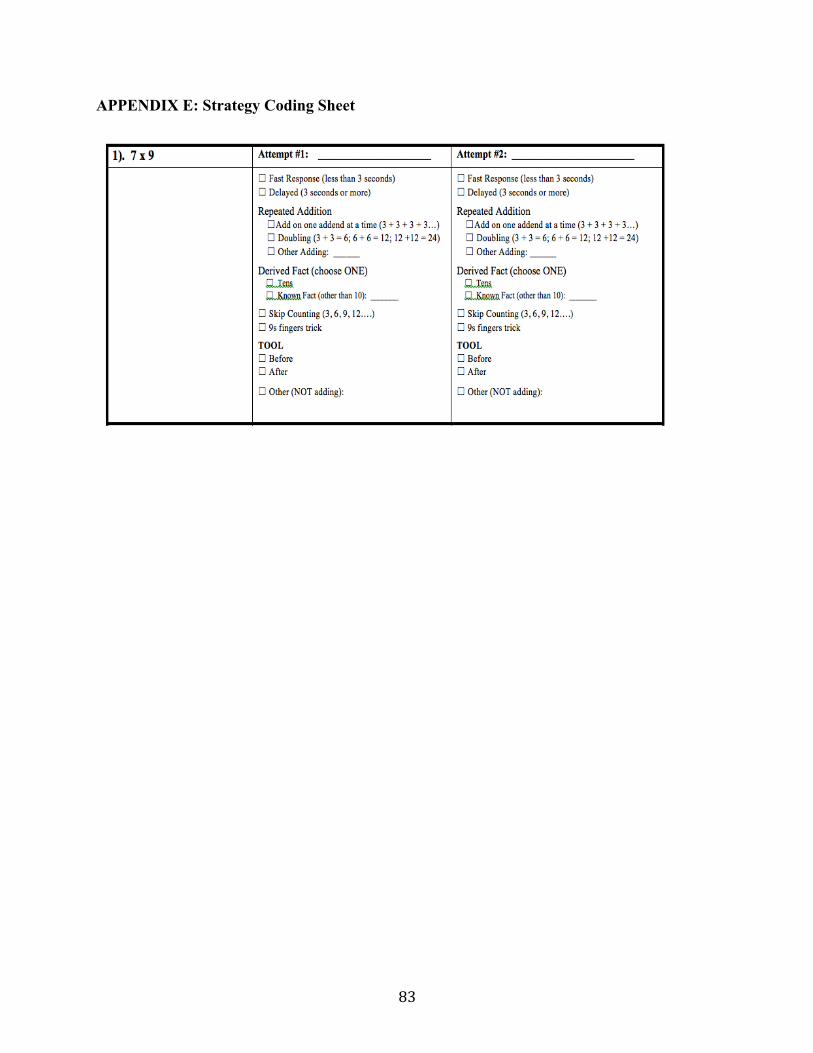
83
APPENDIX E: Strategy Coding Sheet
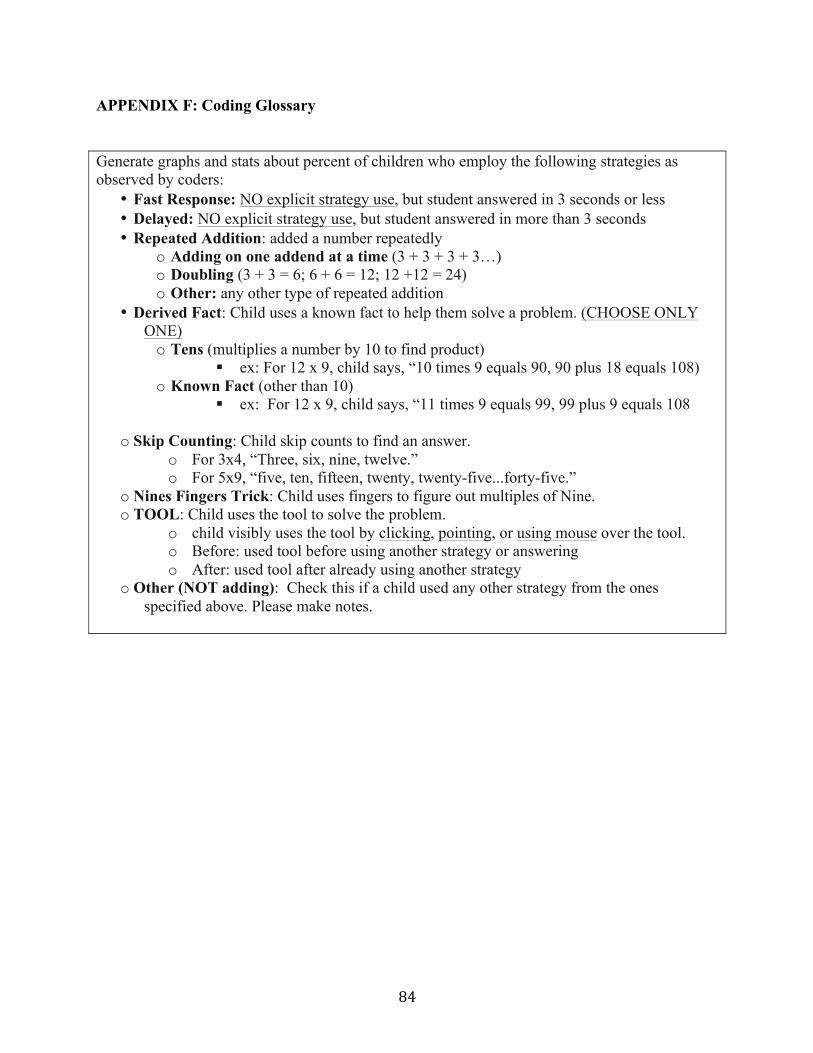
84
APPENDIX F: Coding Glossary
Generate graphs and stats about percent of children who employ the following strategies as observed by coders:
• Fast Response: NO explicit strategy use, but student answered in 3 seconds or less • Delayed: NO explicit strategy use, but student answered in more than 3 seconds • Repeated Addition: added a number repeatedly
o Adding on one addend at a time (3 + 3 + 3 + 3…) o Doubling (3 + 3 = 6; 6 + 6 = 12; 12 +12 = 24) o Other: any other type of repeated addition
• Derived Fact: Child uses a known fact to help them solve a problem. (CHOOSE ONLY ONE) o Tens (multiplies a number by 10 to find product)
" ex: For 12 x 9, child says, “10 times 9 equals 90, 90 plus 18 equals 108) o Known Fact (other than 10)
" ex: For 12 x 9, child says, “11 times 9 equals 99, 99 plus 9 equals 108
o Skip Counting: Child skip counts to find an answer. o For 3x4, “Three, six, nine, twelve.” o For 5x9, “five, ten, fifteen, twenty, twenty-five...forty-five.”
o Nines Fingers Trick: Child uses fingers to figure out multiples of Nine. o TOOL: Child uses the tool to solve the problem.
o child visibly uses the tool by clicking, pointing, or using mouse over the tool. o Before: used tool before using another strategy or answering o After: used tool after already using another strategy
o Other (NOT adding): Check this if a child used any other strategy from the ones specified above. Please make notes.
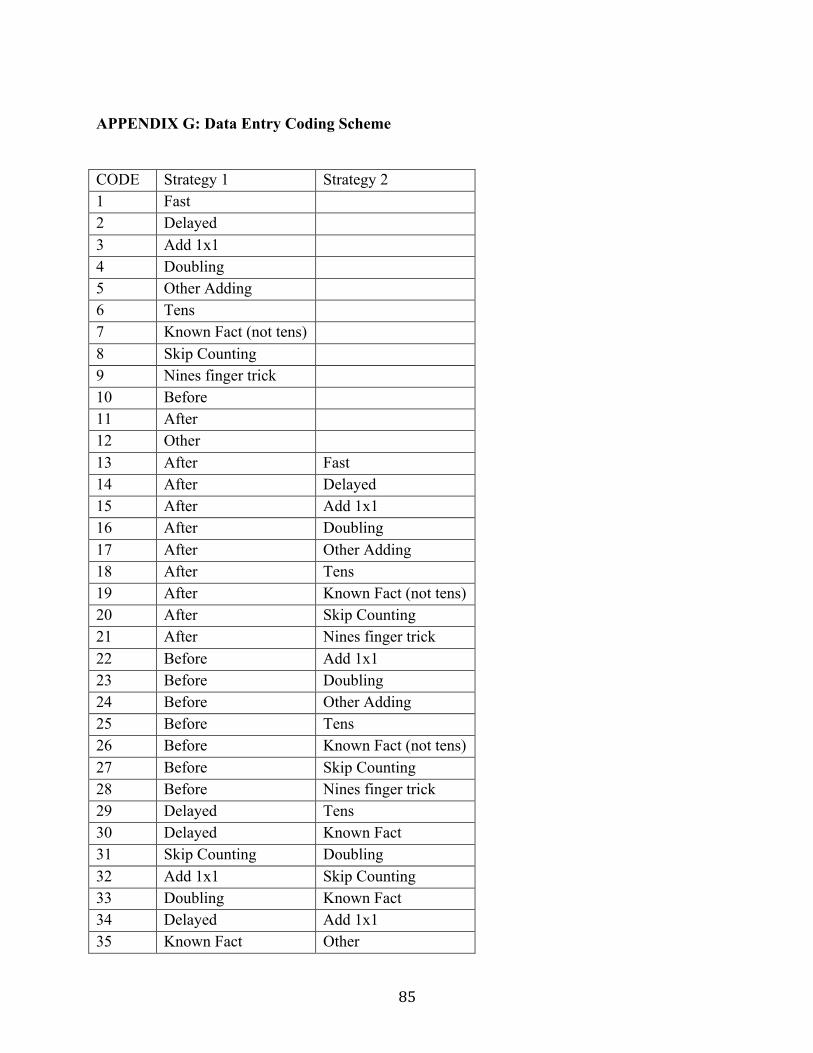
85
APPENDIX G: Data Entry Coding Scheme
CODE Strategy 1 Strategy 2 1 Fast 2 Delayed 3 Add 1x1 4 Doubling 5 Other Adding 6 Tens 7 Known Fact (not tens) 8 Skip Counting 9 Nines finger trick 10 Before 11 After 12 Other 13 After Fast 14 After Delayed 15 After Add 1x1 16 After Doubling 17 After Other Adding 18 After Tens 19 After Known Fact (not tens) 20 After Skip Counting 21 After Nines finger trick 22 Before Add 1x1 23 Before Doubling 24 Before Other Adding 25 Before Tens 26 Before Known Fact (not tens) 27 Before Skip Counting 28 Before Nines finger trick 29 Delayed Tens 30 Delayed Known Fact 31 Skip Counting Doubling 32 Add 1x1 Skip Counting 33 Doubling Known Fact 34 Delayed Add 1x1 35 Known Fact Other
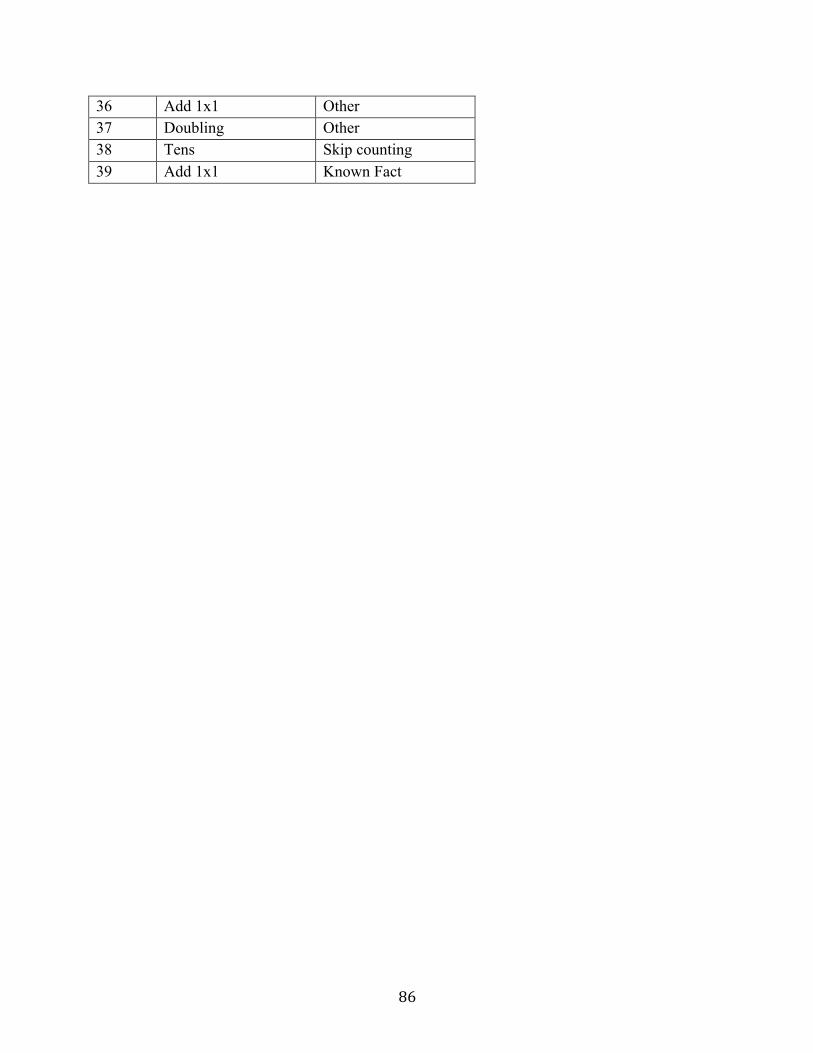
86
36 Add 1x1 Other 37 Doubling Other 38 Tens Skip counting 39 Add 1x1 Known Fact
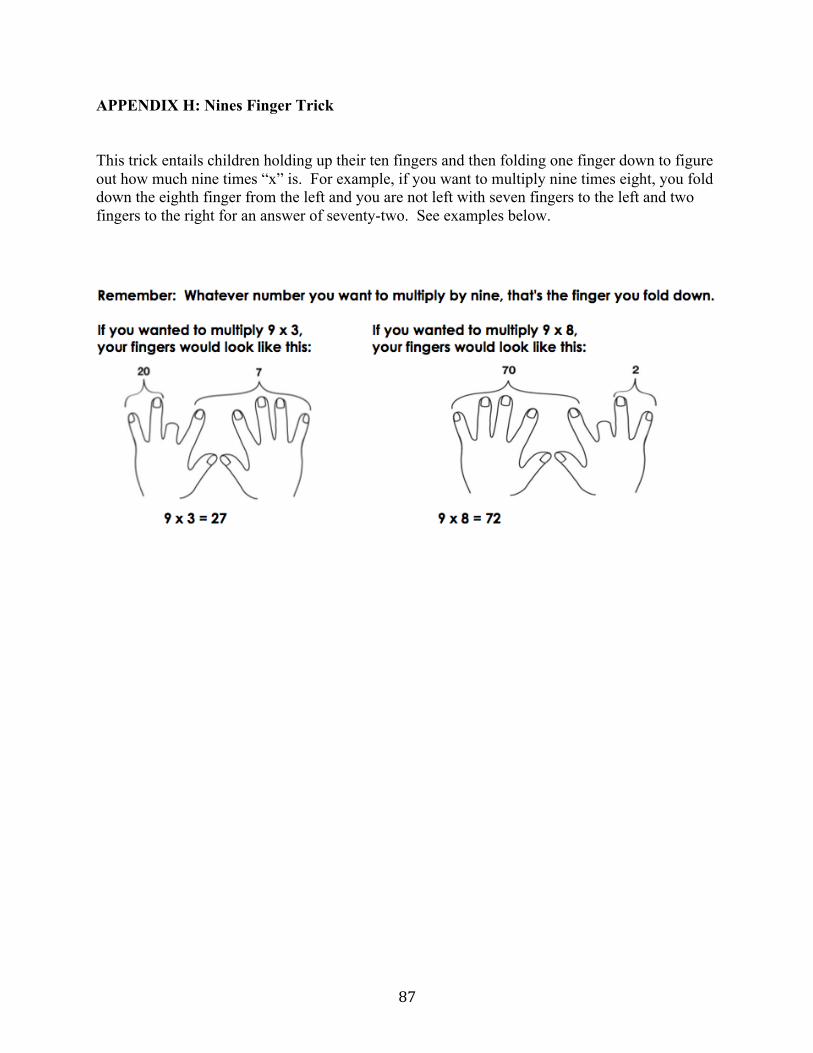
87
APPENDIX H: Nines Finger Trick
This trick entails children holding up their ten fingers and then folding one finger down to figure out how much nine times “x” is. For example, if you want to multiply nine times eight, you fold down the eighth finger from the left and you are not left with seven fingers to the left and two fingers to the right for an answer of seventy-two. See examples below.