Embed Size (px)
Citation preview
The Effects of Coopetition and Coopetition Capability
on Firm Innovation Performance
Byung-Jin (Robert) Park
Virginia Polytechnic Institute and State University
Dissertation submitted to the faculty in partial fulfillment of the requirements for
the degree of
Doctor of Philosophy in Business Management
Devi R. Gnyawali, Chair
Kevin D. Carlson
Donald E. Hatfield
Manish K. Srivastava
May 11, 2011
Blacksburg, Virginia
Keywords: Coopetition, Innovation, Coopetition Capabilities
The Effects of Coopetition and Coopetition Capability
on Firm Innovation Performance
Byung-Jin (Robert) Park
ABSTRACT
This dissertation is motivated by two research questions: 1) to what extent
does coopetition impact firm innovation performance? and 2) to what extent does a
firm‘s coopetition capability influence the relationship between coopetition and
firm innovation performance? Despite the popularity of coopetition in both the
academic and business arenas, empirical studies on the effects of coopetition on
firm innovation performance are rare. With the dynamic and paradoxical nature of
coopetition, the role of a firm‘s specific capability to manage coopetition (i.e.,
coopetition capability) is an important issue that has remained under-researched in
the literature.
In an endeavor to contribute to the coopetition literature in the context of
technological innovation, both theoretical and methodological improvements were
pursued for this dissertation. From a theoretical perspective, I conceptualize
coopetition as composed of three components: 1) competition between partners, 2)
cooperation between partners, and 3) the interplay between competition and
cooperation. It is argued that the balance between competition and cooperation is
iii
essential to generate greater innovation performance in the paradoxical relationship.
Further, I newly conceptualize coopetition-based innovation that is composed of
three components: 1) joint innovation, 2) innovation through knowledge
application, and 3) innovation in the partner‘s domains. Methodologically, I
measure coopetition as a continuous variable.
Using both a longitudinal research design in the semiconductor industry and
an exemplar case study of coopetition, I examine the effects of coopetition and
coopetition capability on coopetition-based innovation. To represent coopetition, I
employed four combinations with two types of competition (technology
competition and market competition) and two types of cooperation (type strength
of a focal alliance and tie strength between partners). The empirical evidence
indicates that the balance between competition and cooperation at both the dyadic
and portfolio levels increases the potential of firms to generate greater innovation
performance from coopetition. This study demonstrates that firms with coopetition
capabilities can manage coopetition and create greater common value with a
partner and appropriate more value from the dynamic and paradoxical relationship.
The research findings also have important managerial implications.
iv
ACKNOWLEDGEMENTS
The last five years have been an intriguing and unforgettable experience. For me, who
had been away from academic research, the research process has been thrilling and interesting as
well as challenging. Wonderful colleagues and people who I have worked and interacted with
helped me overcome the challenges. This dissertation could not have been completed without the
help, support, sacrifices, and love of several people whose contributions I want to acknowledge.
I would like first to thank my committee members Dr. Devi Gnyawali, Dr. Kevin
Carlson, Dr. Donald Hatfield, and Dr. Manish Srivastava. Without your guidance, help, and
support I could not have completed my dissertation. Each member has his own strengths and
helped me in different ways. Working with Dr. Gnyawali has been a wonderful experience. He
has been a true mentor. When we first met, he introduced me to the research of coopetition and
innovation, which perfectly matched my knowledge and interests. As a very sharp thinker, he
gave me advice throughout the research process. While developing this dissertation and working
with him to develop two journal papers, I have learned so much from him. Dr. Carlson has
supported me throughout my research. My discussions with him have influenced my thinking in
different ways. He often forced me to think harder and to provide more detail to my logic and
procedures. Thanks to him, I can analyze data in a more comprehensive way. More importantly,
he was always there whenever I needed him. Dr. Hatfield has supported me particularly in terms
of methodological issues. With his engineering background, he is knowledgeable about software.
Even though innovation is our common research area, the research focus was somewhat
different. My discussions with him helped me understand my own perspective better. Dr.
Srivastava played a key role in executing this dissertation. His dissertation was the foundation of
my quantitative study. For data collection, I followed his procedures in some respects. Thus, his

v
direct guidance and advice were very helpful in conducting my research. I also like to thank Dr.
Anju Seth and Dr. Richard Wokutch for their support and help during my doctoral program. Dr.
Dong-Sam Ha and Dr. Song in other departments provided me valuable advices and comments.
I started my research journey after 14 years at the Federation of Korean Industries (FKI)
and was almost 40 years old. Under such circumstances, it was not easy for me to make a career
change. Since my wife started to pursue her PhD in the USA, I put my values first and decided
that we could pursue the same career in the same place. This new journey was really challenging
because my wife and I were always at the same stage of the program for the entire PhD process
and we had to take care of two daughters. Thus, I wish to thank my family for their
understanding and support during this time consuming and stressful process. Without the strong
support of my mother-in-law and father-in-law, we could not have started and completed the
PhD journey. My mother and father taught me the values of hard work and an optimistic view.
Whenever I was struggling, I gained spiritual strength from them up in heaven. My daughters,
Junghyun (Jenny) and Minjoo, have endured the lack of time to spent together. Instead, their
brightness, happiness, and love gave me the courage to overcome difficulties.
Finally, my gratitude goes to my colleagues and cohorts who I have worked, laughed, and
played with. Their faith in me as well as their smiles and support made my doctoral program
journey a wonderful experience. I cannot acknowledge everyone who has helped me accomplish
this dissertationm but my heart still remembers your contributions. I am grateful to you all.

vi
DEDICATION
I dedicate this dissertation to my loving wife, Dohee Kim; my daughters, Junghyun and
Minjoo; and my mother-in law and father-in law without whose love, support, and sacrifices
this monumental task could not have been completed. I would also like to dedicate this
dissertation to my mother and father in heaven who are proud of their son.
vii
TABLE OF CONTENTS
1. INTRODUCTION························································································1
1.1 Research Motivation ··············································································1
1.2 Conceptual Overview··············································································7
1.3 Contributions·····················································································9
2. LERATURE LIVIEW··················································································12
2.1 The Evolution of Coopetition Literature·····················································12
2.1.1 Competition-cooperation research················································12
2.1.1.1 The competitive perspective
2.1.1.2 The cooperative perspective
2.1.1.3 Collective competition versus competitive collaboration
2.1.2 The Coopetitive Perspective··························································19
2.1.2.1 Why do we need the term of coopetition?
2.1.2.2 Different views of coopetition
2.1.2.3 Trends in the coopetition literature
2.1.3 Research gaps in the coopetition literature································24
2.2 Role of Inter-firm Dynamics in Innovation···············································31
2.2.1 Role of competition in innovation···················································31
2.2.2 Role of cooperation in innovation·················································33
2.2.3 Role of coopetition in innovation·····················································36
2.2.4 Research gaps in the role of coopetition in innovation···························37
2.3 The Role of Coopetition Tension in Firm Innovation·······································39
2.3.1 Tension from the risk perspective·····················································40
2.3.2 Tension from a balance approach····················································41
2.3.3 Tension from a paradox perspective····················································42
2.3.4 Research gaps in the role of coopetition tension in firm innovation··········43
2.4 The Role of a Firm’s Dynamic Capabilities in Firm Innovation··············45
2.4.1 Dynamic capabilities····································································45
2.4.2 Alliance capabilities······································································46
2.4.3 Research gaps in the role of dynamic capabilities in firm innovation···········47
viii
3. CONCEPTUAL DEVELOPMENT AND HYPOTHESES····································51
3.1 Coopetition, Coopetition Tension, and Their Roles in Firm Innovation··············51
3.1.1 Typology of coopetition·································································51
3.1.2 Coopetition-based innovation performance·········································54
3.1.3 Locus of tension – Knowledge sharing versus knowledge protection··········58
3.1.4 Coopetition capability··································································61
3.2 Conceptual Model ···············································································63
3.3 Hypotheses Development·······································································64
3.3.1 Innovation and the intensity of competition between partners···············64
3.3.2 Innovation and the intensity of cooperation between partners···············68
3.3.3 Innovation and the balance between competition and cooperation···············72
3.3.4 The moderating role of coopetition capability ········································80
4. RESEARCH METHODOLOGY····································································87
4.1 Qualitative Research: An In-Depth Case Study············································88
4.1.1 Research setting···········································································88
4.1.2 Data collection·············································································90
4.1.3 Analysis····················································································91
4.2 Quantitative Research: The Semiconductor Industry······························92
4.2.1 Research setting···········································································92
4.2.2 Overview of the semiconductor industry···············································92
4.2.3 Sample and data collection·······························································95
4.2.4 Measures··················································································100
4.2.4.1 Dependent variables
4.2.4.2 Independent variables
4.2.4.3 Moderators
4.2.4.4 Control variables
4.2.5 Statistical Methods·······································································116
5. RESULTS AND ANALYSIS·······································································119
5.1 Descriptive Statistics (Sample Characteristics) ·········································119
5.2 The Role of Competition between Partners in Innovation·······························127
ix
5.3 The Role of Cooperation between Partners in Innovation······························130
5.4 The Role of Balance between Competition and Cooperation in Innovation at the Dyadic
Level····························································································134
5.4.1 Polynomial regression analysis: interplay between competition and
cooperation·············································································134
5.4.2 The dummy variables of balanced-strong coopetition at the dyadic
level····················································································146
5.5 The Role of Balanced-Strong Coopetition in Innovation at the Alliance
Portfolio····························································································150
5.6 The Moderating Role of Coopetition Capability in Innovation························157
5.7 Results of Qualitative Research: A Case Study············································160
5.7.1 Analysis on an ex-ante relationship between partners·······················160
5.7.2 Dynamics of Samsung-Sony coopeitition·········································163
5.7.3 Outcomes of Samsung-Sony coopetition·········································167
5.7.4 The role of coopetition capabilities················································169
5.7.5 Summary of the case study·······················································179
5.8 Summary of Results·············································································180
6. DISCUSSSION AND IMPLICATIONS·························································183
6.1 Discussion of Research Findings······························································186
6.1.1 The role of competition between partners in innovation····························186
6.1.2 The role of cooperation between partners in innovation····························188
6.1.3 The role of balance between competition and cooperation in innovation at the
dyadic level··············································································190
6.1.4 The role of balanced-strong coopetition in innovation at the alliance
portfolio··················································································191
6.1.5 The moderating role of cooperation capability in innovation··············192
6.2 Contributions and Implications ······························································195
6.2.1 Contribution to the coopetition literature············································195
6.2.2 Contribution to the innovation literature·············································197
6.2.3 Contribution to the competition literature·········································198
6.2.4 Contribution to the cooperation literature············································199
x
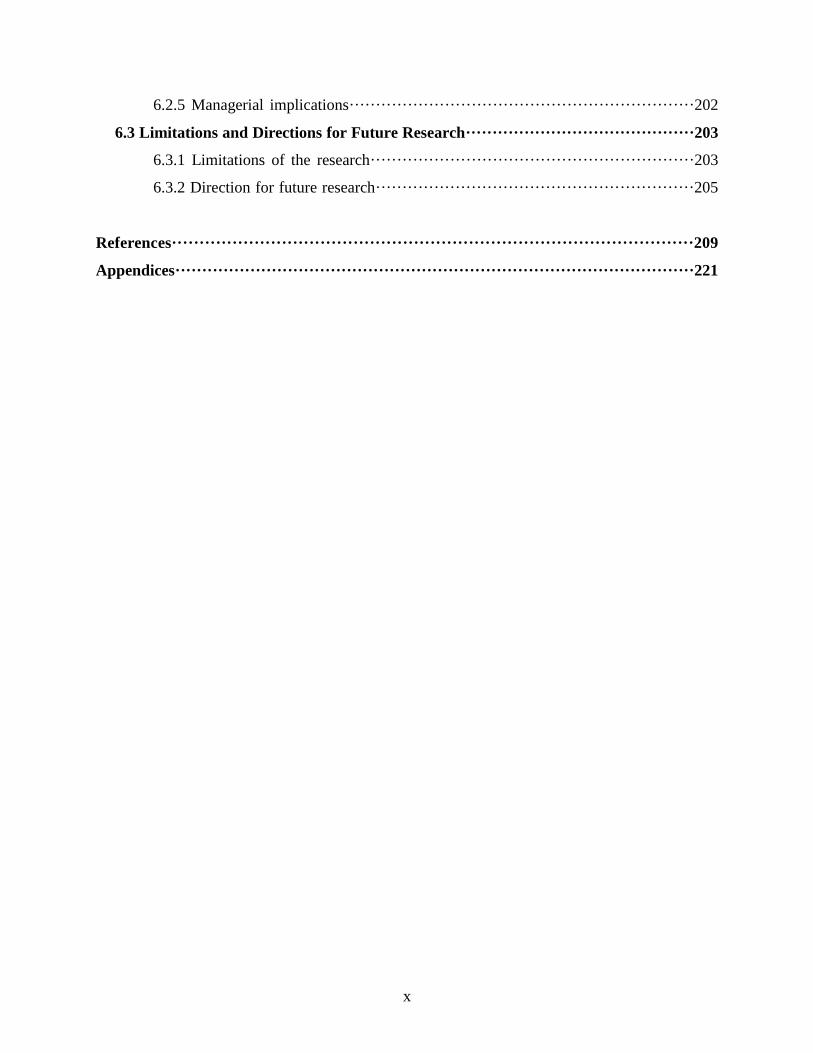
6.2.5 Managerial implications·································································202
6.3 Limitations and Directions for Future Research···········································203
6.3.1 Limitations of the research·····························································203
6.3.2 Direction for future research····························································205
References·······························································································209
Appendices·································································································221
xi
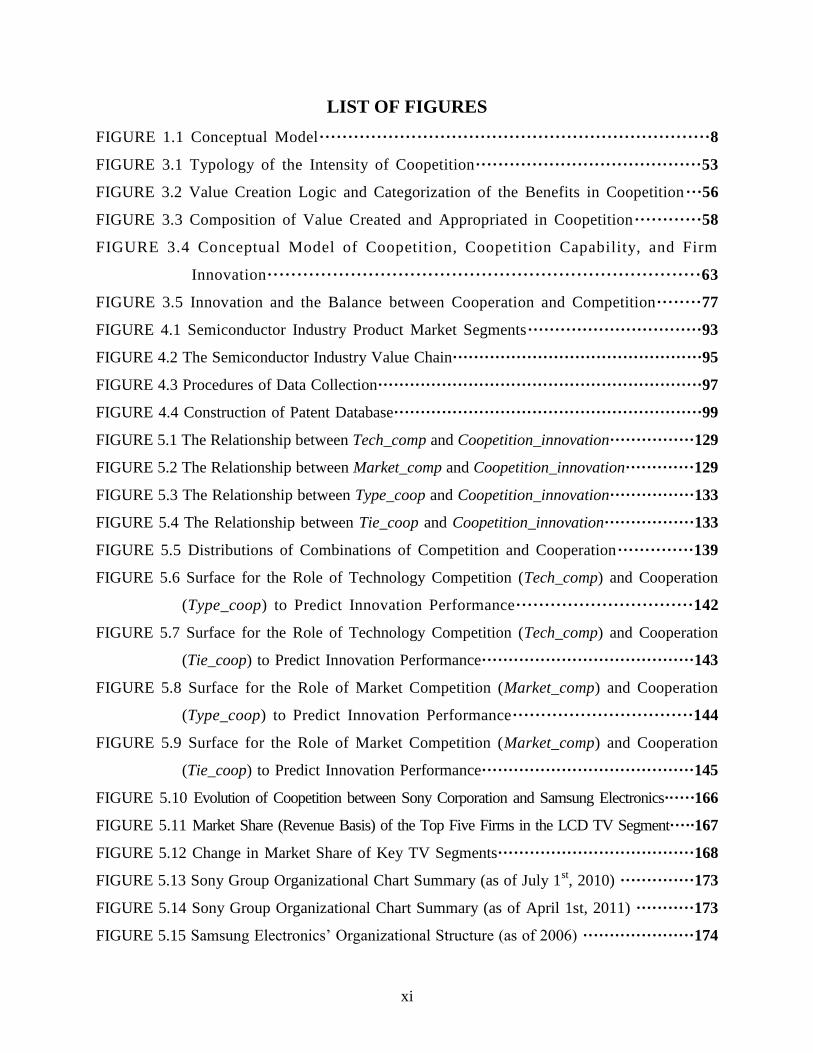
LIST OF FIGURES
FIGURE 1.1 Conceptual Model····································································8
FIGURE 3.1 Typology of the Intensity of Coopetition········································53
FIGURE 3.2 Value Creation Logic and Categorization of the Benefits in Coopetition···56
FIGURE 3.3 Composition of Value Created and Appropriated in Coopetition············58
FIGURE 3.4 Conceptual Model of Coopetition, Coopetition Capability, and Firm
Innovation·········································································63
FIGURE 3.5 Innovation and the Balance between Cooperation and Competition········77
FIGURE 4.1 Semiconductor Industry Product Market Segments································93
FIGURE 4.2 The Semiconductor Industry Value Chain···············································95
FIGURE 4.3 Procedures of Data Collection·····························································97
FIGURE 4.4 Construction of Patent Database··························································99
FIGURE 5.1 The Relationship between Tech_comp and Coopetition_innovation················129
FIGURE 5.2 The Relationship between Market_comp and Coopetition_innovation·············129
FIGURE 5.3 The Relationship between Type_coop and Coopetition_innovation················133
FIGURE 5.4 The Relationship between Tie_coop and Coopetition_innovation·················133
FIGURE 5.5 Distributions of Combinations of Competition and Cooperation··············139
FIGURE 5.6 Surface for the Role of Technology Competition (Tech_comp) and Cooperation
(Type_coop) to Predict Innovation Performance·······························142
FIGURE 5.7 Surface for the Role of Technology Competition (Tech_comp) and Cooperation
(Tie_coop) to Predict Innovation Performance········································143
FIGURE 5.8 Surface for the Role of Market Competition (Market_comp) and Cooperation
(Type_coop) to Predict Innovation Performance································144
FIGURE 5.9 Surface for the Role of Market Competition (Market_comp) and Cooperation
(Tie_coop) to Predict Innovation Performance········································145
FIGURE 5.10 Evolution of Coopetition between Sony Corporation and Samsung Electronics······166
FIGURE 5.11 Market Share (Revenue Basis) of the Top Five Firms in the LCD TV Segment·····167
FIGURE 5.12 Change in Market Share of Key TV Segments·····································168
FIGURE 5.13 Sony Group Organizational Chart Summary (as of July 1st, 2010) ··············173
FIGURE 5.14 Sony Group Organizational Chart Summary (as of April 1st, 2011) ···········173
FIGURE 5.15 Samsung Electronics‘ Organizational Structure (as of 2006) ·····················174
xii
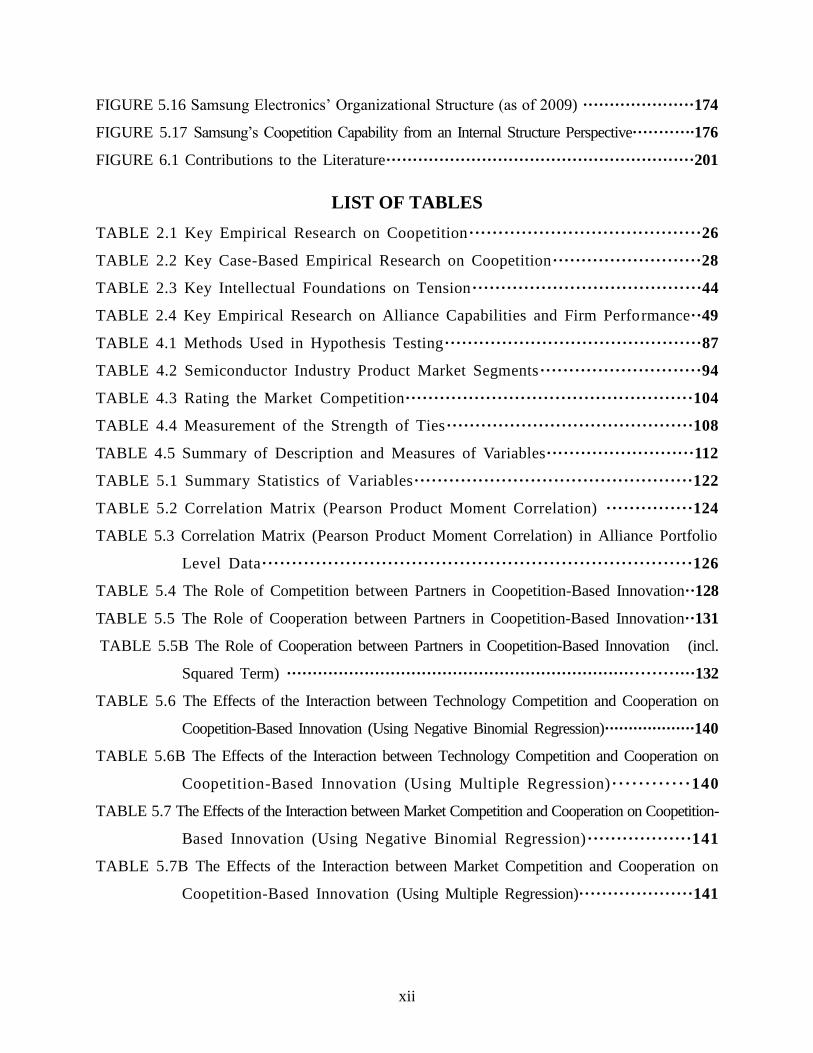
FIGURE 5.16 Samsung Electronics‘ Organizational Structure (as of 2009) ·····················174
FIGURE 5.17 Samsung‘s Coopetition Capability from an Internal Structure Perspective············176
FIGURE 6.1 Contributions to the Literature··························································201
LIST OF TABLES
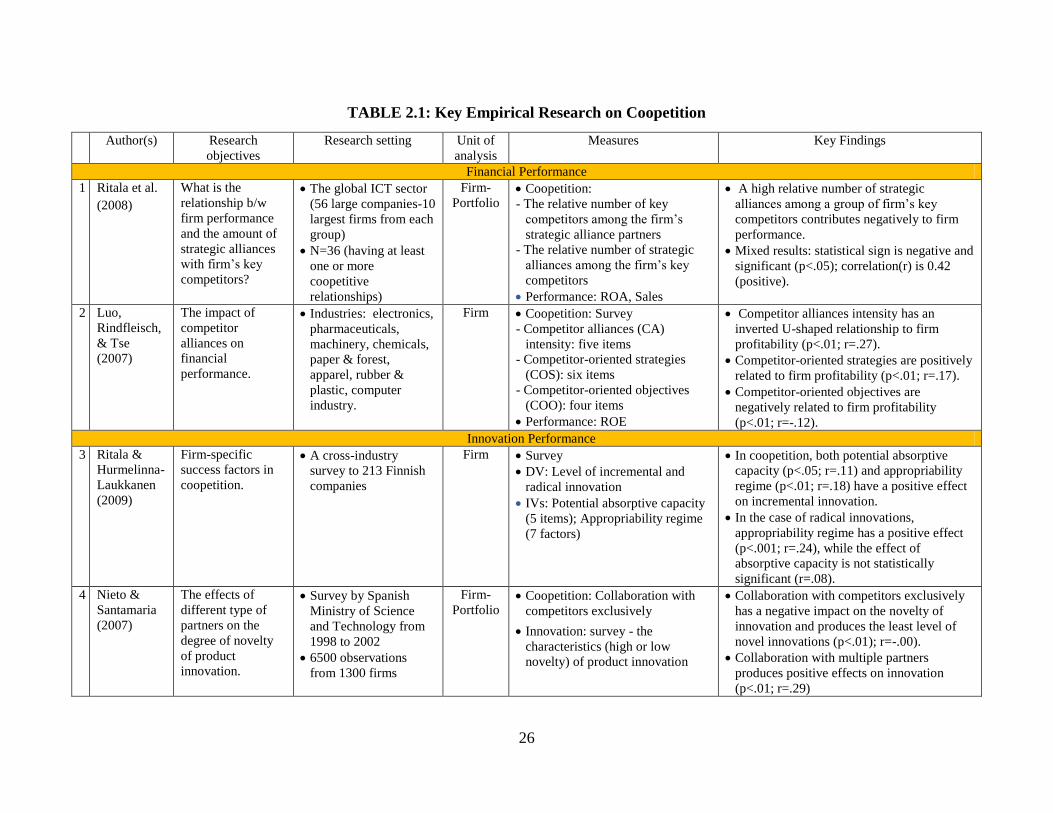
TABLE 2.1 Key Empirical Research on Coopetition········································26
TABLE 2.2 Key Case-Based Empirical Research on Coopetition··························28
TABLE 2.3 Key Intellectual Foundations on Tension········································44
TABLE 2.4 Key Empirical Research on Alliance Capabilities and Firm Performance··49
TABLE 4.1 Methods Used in Hypothesis Testing·············································87
TABLE 4.2 Semiconductor Industry Product Market Segments····························94
TABLE 4.3 Rating the Market Competition··················································104
TABLE 4.4 Measurement of the Strength of Ties···········································108
TABLE 4.5 Summary of Description and Measures of Variables··························112
TABLE 5.1 Summary Statistics of Variables················································122
TABLE 5.2 Correlation Matrix (Pearson Product Moment Correlation) ···············124
TABLE 5.3 Correlation Matrix (Pearson Product Moment Correlation) in Alliance Portfolio
Level Data········································································126
TABLE 5.4 The Role of Competition between Partners in Coopetition-Based Innovation··128
TABLE 5.5 The Role of Cooperation between Partners in Coopetition-Based Innovation··131
TABLE 5.5B The Role of Cooperation between Partners in Coopetition-Based Innovation (incl.
Squared Term) ··············································································132
TABLE 5.6 The Effects of the Interaction between Technology Competition and Cooperation on
Coopetition-Based Innovation (Using Negative Binomial Regression)···················140
TABLE 5.6B The Effects of the Interaction between Technology Competition and Cooperation on
Coopetition-Based Innovation (Using Multiple Regression)············140
TABLE 5.7 The Effects of the Interaction between Market Competition and Cooperation on Coopetition-
Based Innovation (Using Negative Binomial Regression)··················141
TABLE 5.7B The Effects of the Interaction between Market Competition and Cooperation on
Coopetition-Based Innovation (Using Multiple Regression)····················141
xiii
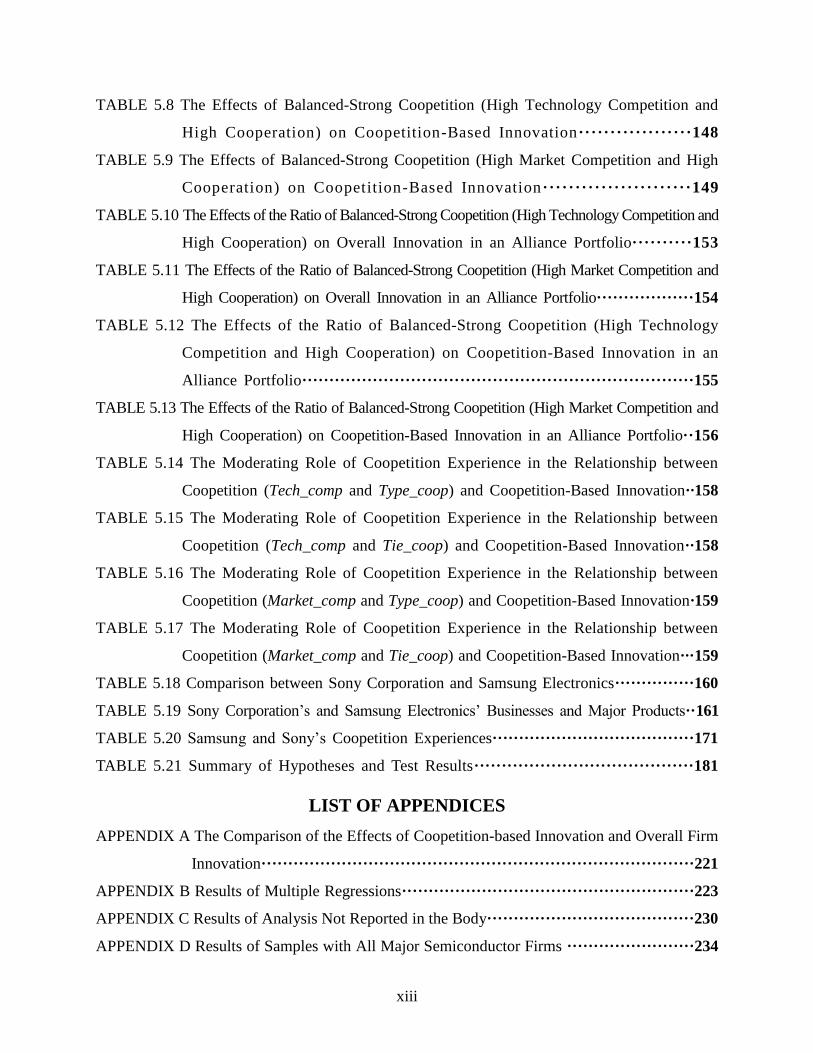
TABLE 5.8 The Effects of Balanced-Strong Coopetition (High Technology Competition and
High Cooperation) on Coopetition-Based Innovation··················148
TABLE 5.9 The Effects of Balanced-Strong Coopetition (High Market Competition and High
Cooperation) on Coopetition-Based Innovation·······················149
TABLE 5.10 The Effects of the Ratio of Balanced-Strong Coopetition (High Technology Competition and
High Cooperation) on Overall Innovation in an Alliance Portfolio··········153
TABLE 5.11 The Effects of the Ratio of Balanced-Strong Coopetition (High Market Competition and
High Cooperation) on Overall Innovation in an Alliance Portfolio··················154
TABLE 5.12 The Effects of the Ratio of Balanced-Strong Coopetition (High Technology
Competition and High Cooperation) on Coopetition-Based Innovation in an
Alliance Portfolio········································································155
TABLE 5.13 The Effects of the Ratio of Balanced-Strong Coopetition (High Market Competition and
High Cooperation) on Coopetition-Based Innovation in an Alliance Portfolio··156
TABLE 5.14 The Moderating Role of Coopetition Experience in the Relationship between
Coopetition (Tech_comp and Type_coop) and Coopetition-Based Innovation··158
TABLE 5.15 The Moderating Role of Coopetition Experience in the Relationship between
Coopetition (Tech_comp and Tie_coop) and Coopetition-Based Innovation··158
TABLE 5.16 The Moderating Role of Coopetition Experience in the Relationship between
Coopetition (Market_comp and Type_coop) and Coopetition-Based Innovation·159
TABLE 5.17 The Moderating Role of Coopetition Experience in the Relationship between
Coopetition (Market_comp and Tie_coop) and Coopetition-Based Innovation···159
TABLE 5.18 Comparison between Sony Corporation and Samsung Electronics···············160
TABLE 5.19 Sony Corporation‘s and Samsung Electronics‘ Businesses and Major Products··161
TABLE 5.20 Samsung and Sony‘s Coopetition Experiences······································171
TABLE 5.21 Summary of Hypotheses and Test Results········································181
LIST OF APPENDICES
APPENDIX A The Comparison of the Effects of Coopetition-based Innovation and Overall Firm
Innovation·················································································221
APPENDIX B Results of Multiple Regressions·······················································223
APPENDIX C Results of Analysis Not Reported in the Body·······································230
APPENDIX D Results of Samples with All Major Semiconductor Firms ························234
1
1.0 INTRODUCTION
1.1 Research Motivation
In the dynamic, complex, and global business world, firms have increasingly engaged in
coopetition, i.e., simultaneous pursuit of collaboration and competition (Bengtsson & Kock,
2000; Brandenburger & Nalebuff, 1996b; Gnyawali, He, & Madhavan, 2008; Luo, 2007), to
generate competitive advantage. Scholars argue that coopetition is a new lens to understand the
benefits that arise from both cooperation and competition (Bengtsson, Eriksson, & Wincent,
2010). Because competing firms possess relevant resources and face similar pressures,
collaboration with competitors enables firms to acquire and create new technological knowledge
and use the knowledge in pursuit of innovation (Quintana-García & Benavides-Velasco, 2004;
Ritala, Hurmelinna-Laukkanen, & Blomqvist, 2009). Coopetition can stimulate search for new
rent-generating combinations of resources, skills, and processes (Lado, Boyd, & Hanlon, 1997;
Yami, Castaldo, Dagnino, & Roy, 2010). In practice, the phenomenon of coopetition has become
increasingly popular in recent years. An increasing number of new alliances are being formed
between competing firms (Harbison & Pekar, 1998). Coopetition is particularly important for
innovation in high-tech industries (Carayannis & Alexander, 1999; Dagnino & Rocco, 2009;
Gnyawali et al., 2008; Jorde & Teece, 1990; Quintana-García & Benavides-Velasco, 2004)
where firms are confronting challenges such as short product life cycles, technological
convergence, and massive R&D costs (Gnyawali & Park, 2009). An exemplar case of
coopetition is a joint venture between Samsung Electronics and Sony Corporation to
manufacture liquid crystal display (LCD) panels for large television sets. While collaborating in
LCD panel production, the two rivals compete fiercely in the LCD TV market. This on-going
coopetition, which has lasted over eight years, has helped the two firms to establish their
2
leaderships in the TV industry, set technological standards, and develop technologies related to
the panel and TV industry. That is, coopetition between Samsung and Sony had a tremendous
impact on both firms, the LCD segment, and the TV industry as a whole. As a result, the case
demonstrates that coopetition can play a critical role in addressing technological challenges.
Despite the popularity of coopetition from both the academic and business arenas,
empirical studies on the effects of coopetition on firm performance, including innovation, are
rare (Walley, 2007; Yami, Castaldo, Dagnino, & Le Roy, 2010). The majority of relevant studies
are focused on conceptual developments or based on case studies. Further, limited empirical
studies that examined the effects of coopetition on firm innovation performance provide
inconsistent findings. While Quintana-García and Benavides-Velasco (2004) report positive
effects of coopetition on innovation, Nieto and Santamaria (2007) report a negative relationship
between alliances with competitors (i.e., coopetition) and innovation performance, and Knudsen
(2007) finds no evidence that coopetition leads to an increase in innovation performance.
Considering the importance of coopetition and innovation in high-tech industries, the
inconsistent results of empirical research on the effects of coopetition on innovation should be
addressed systematically. Also, although it is considered a win-win strategy, coopetition is a
dynamic and paradoxical phenomenon. Firms struggle with a dilemma between the need to work
together in order to create value and the temptation to be opportunistic in order to appropriate a
greater share of the created value (Lavie, 2007; Gnyawali & Park, 2009; Ritala & Hurmelinna-
Laukkanen, 2009). The case of coopetition between Samsung and Sony in the TV industry shows
that the firms‘ capabilities (e.g., coopetition mindset) might play a critical role in the successful
coopetitive relationship (Chang, 2008; Dvorak & Ramstad, 2006; Gnyawali & Park, 2011).
However, the role of a firm‘s capabilities in managing coopetitive relationships is rarely
3
discussed in the coopetition literature. This study aims to address these critical gaps by focusing
on the following questions: (a) to what extent does coopetition impact firm innovation
performance? and (b) to what extent does a firm‘s coopetition capability influence the
relationship between coopetition and firm innovation performance? In addressing these issues, I
extend the conceptualization of coopetition and innovation performance, develop knowledge on
coopetition tension and firm-specific coopetition capabilities, and advance methodological
approach to study coopetition.
To understand the relationship between coopetition and innovation, it is necessary to
clarify the distinctive features of value creation and value appropriation in coopetition. That is,
coopetition means cooperating to create a bigger business ―pie‖ (or value), while competing to
divide it up (Brandenburger & Nalebuff, 1996). Although value creation and appropriation is
central to coopetition, the composition of value (―innovation‖ in this dissertation) has not been
examined systematically. I suggest that the value (i.e., firm innovation performance) a focal firm
can obtain through coopetition can be conceptualized by three dimensions: 1) joint innovation
(co-created value within alliance boundaries), 2) innovation through the application of partner
knowledge (value created by applying the partner‘s knowledge, which is beyond alliance
boundaries), and 3) innovation within the partner‘s domains (value created by the focal firm‘s
additional efforts for competition, which is related to, but beyond, alliance boundaries). That is,
value is created by both cooperation and competition and then is appropriated by collaboration
arrangement and private efforts and capabilities by the firms.
In addition, to examine the relationship between coopetition and innovation, it is critical
to understand the tension arising from paradoxical factors in coopetition. Coopetition is
extremely challenging due to diametrically opposing forces – value creation versus value
4
appropriation, knowledge sharing versus knowledge protection, and mutual learning versus
learning race. For example, firms need to share knowledge for mutual gain, while protecting core
knowledge. These opposing forces (or the paradox) in coopetition create a great deal of tension
that can either help or hurt firm innovation performance. That is, coopetition will provide both
payoffs (in terms of resource potential, efficiency, and/or standard setting) and risks (in terms of
dependence, opportunism, and potential competition). However, previous research has paid little
attention to the role of tension in coopetition. A fundamental source of tension is a paradox that
denotes ―contradictory yet interrelated elements that seem logical in isolation but absurd and
irrational when appearing simultaneously‖ (Lewis, 2000). Therefore, to understand the tension in
coopetition, it is essential to examine the contradictory elements. In this regard, I note that we
need to consider the cooperation side of the relationship to understand the tension in coopetition.
That is, the tension from the paradoxical and dynamic nature of coopetition will clearly appear
when the degrees of competition and cooperation are both high (Gnyawali et al., 2008). In
addition, some scholars (e.g., Chen, 2008; Das & Teng, 2000) suggest that firms should balance
the contradictory forces (i.e., competition and cooperation) in which tension from the paradox
can lead to the most positive effects.1 For example, Das and Teng (2000) suggest that the balance
between competition and cooperation will increase alliance stability. Chen (2002) paid attention
to the Chinese ―middle way‖ philosophy that emphasizes the balance and integration of
opposites. Integrating the paradox perspective and the Chinese ―middle way‖ philosophy, Chen
(2008) suggests the transparadox perspective in which two opposites may be interdependent in
nature and together form a totality. Building on the transparadox (Chen, 2008) and balancing
strategy (Das & Teng, 2000) perspectives, I argue that coopetition needs to be captured in three
1 I note that most previous studies regarding tension in inter-firm relationships approach it from a risk perspective,
such as competitive tension (the competitive dynamics literature), threat of opportunism (the alliance literature), and
role conflicts (the coopetition literature).
5
dimensions: 1) competition between partners, 2) cooperation between partners, and 3) the
interplay between competition and cooperation. Further, I suggest that the balance between
competition and cooperation may generate positive effects on innovation.
The dynamic and paradoxical nature of coopetition raises an important issue – the role of
a firm‘s specific capability to manage coopetition, which I will term as ―coopetition capability‖
that has remained an under-researched topic in the literature. As coopetition is dynamic in nature
(Luo, 2007b), tension also stems from coordination problems that coopetitors often overlook
(Bonel & Rocco, 2007). ―Companies may succeed or fail based on differences in their capability
to manage paradox‖ (Lado, Boyd, Wright, & Kroll, 2006, p.115). While tension is inherent in all
collaborative relationships (Das & Teng, 2000), it may be much more critical in coopetition
because of the paradoxical (Chen, 2008) and dynamic (Luo, 2007b) nature and unstable tendency
(Das & Teng, 2000) of coopetition. Thus, a firm‘s specific capability for managing coopetition at
both ex ante and ex post stages may be critical for generating superior firm innovation
performance.
From empirical standpoints, scholars (e.g., Yami et al., 2010) call for developing
appropriate operational measures for coopetition, in order to facilitate more quantitative research.
The coopetition measures used in previous studies have several limitations. First, previous
studies typically used categorical variables, such as alliances with suppliers, clients, or
competitors (e.g., Quintana-García & Benavides-Velasco, 2004; Nieto & Santamaria, 2007).
Although those studies provided a valuable foundation to understand the effects of coopetition
on innovation, little is known about the effects across various types of coopetition, such as
competition-dominant, cooperation-dominant, and equal coopetition (Bengtsson & Kock, 2000).
Although the effects of various types of coopetition may be different, they have not been
6
operationalized and examined in empirical studies. Second and related to the above, previous
studies measure coopetition based only on competition, while implicitly assuming that each
alliance has a constant strength of cooperation. As coopetition is the interplay between
collaboration and competition, I suggest that coopetition needs to be measured by both the
degree of competition and the degree of collaboration. The degree of cooperation that captures
both the type-strength of a focal alliance and the strength of ties between two firms will
significantly influence the transfer of knowledge between partners. That is, the type of
collaboration of a focal alliance (e.g., R&D, marketing, or licensing) offers different strength
from the strategic linkages and/or interorganizational dependencies (Contractor & Lorange,
1988; Nohria & Garcia-Point, 1991) and different levels of practice (e.g., co-location) that
influence knowledge transfer between partners especially when the knowledge is tacit in nature.
Further, the strength of ties between two firms, i.e., the quality of overall cooperative
relationship, plays an informal safeguarding mechanism that reduces the threat of opportunism
(Parkhe, 1993; Rowley et al., 2000), which will facilitate knowledge sharing. Further, the tension
in coopetition will clearly appear when we consider both competition and cooperation. Some
scholars (Bengtsson et al., 2010; Gnyawali et al., 2008) suggest that it is necessary to examine
coopetition where both competition and cooperation are simultaneously present and high.
However, the strength of cooperation in individual alliances still has not been operationalized in
empirical research. Finally, previous studies typically categorized coopetition based on the
partners industry (SIC code), which seems too broad to capture firms‘ competitors in a certain
product or geographical market. From a cognitive perspective, not all firms operating in the same
industry are necessarily perceived as competitors by a certain actor (Porac, Thomas, Wilson,
Paton, & Kanfer, 1995; Ritala, Hallikas, & Sissonen, 2008). Further, previous studies focused on
7
competition in the product markets, but ignored the competition surrounding technology (i.e.,
technology competition) that may more directly impact innovation. In sum, to better understand
the concept of coopetition and its implications, it is necessary to develop measures of varying
degrees (or different types) of coopetition that consider both competition and cooperation.
1.2 Conceptual Overview
I develop a conceptual framework of the relationship between coopetition and innovation
performance that includes a moderating role of the firm‘s coopetition capability. I argue that
coopetition, which should be captured by both the degree of competition and the degree of
collaboration as well as the balance between competition and cooperation, influences a firm‘s
ability to generate technological innovation. Also, based on the balancing strategy and transparadox
perspectives, I examine if the balance between competition and cooperation generates superior
innovation performance. Further, I examine the moderating role of firm-specific coopetition
capability on the relationship between coopetition and firm innovation. This study also attempts to
separate coopetition-based innovation from the overall firm innovation performance.
Scholars have used a wide variety of definitions and perspectives in examining
coopetition (Yami et al., 2010). Gnyawali et al. (2008) provide a framework that explains how
coopetition occurs very intensely (when a dyad engages in simultaneous collaboration and
competition) and much less intensely (when several firms engage in some forms of collaboration
and competition at different time). Bengtsson et al. (2010) suggest that coopetition has been
defined in at least two different ways and the definitions are related to the levels of analysis.
According to Bengtsson et al. (2010), in some studies, the authors (e.g., Brandenburger &
Nalebuff, 1996; Lado et al., 1997) view coopetition as the sum of many different relationships
and the cooperative and competitive parts are divided between different actors, which is relevant
8
to network (or portfolio) level analysis. In other studies, the authors (e.g., Bengtsson & Kock,
1999, 2000) view collaboration and competition as two interrelated parts of one dyadic
relationship and argue that the different parts of the relationship are divided between activities,
which is relevant to dyadic level analysis (Bengtsson et al., 2010). Bengtsson and Kock (1999,
2000) and Bengtsson et al. (2010) suggest that coopetition should be defined more narrowly to
better grasp the tension and complexity in coopetition. As this study focuses on understanding
the tension in coopetition, I test the model at the dyadic level.
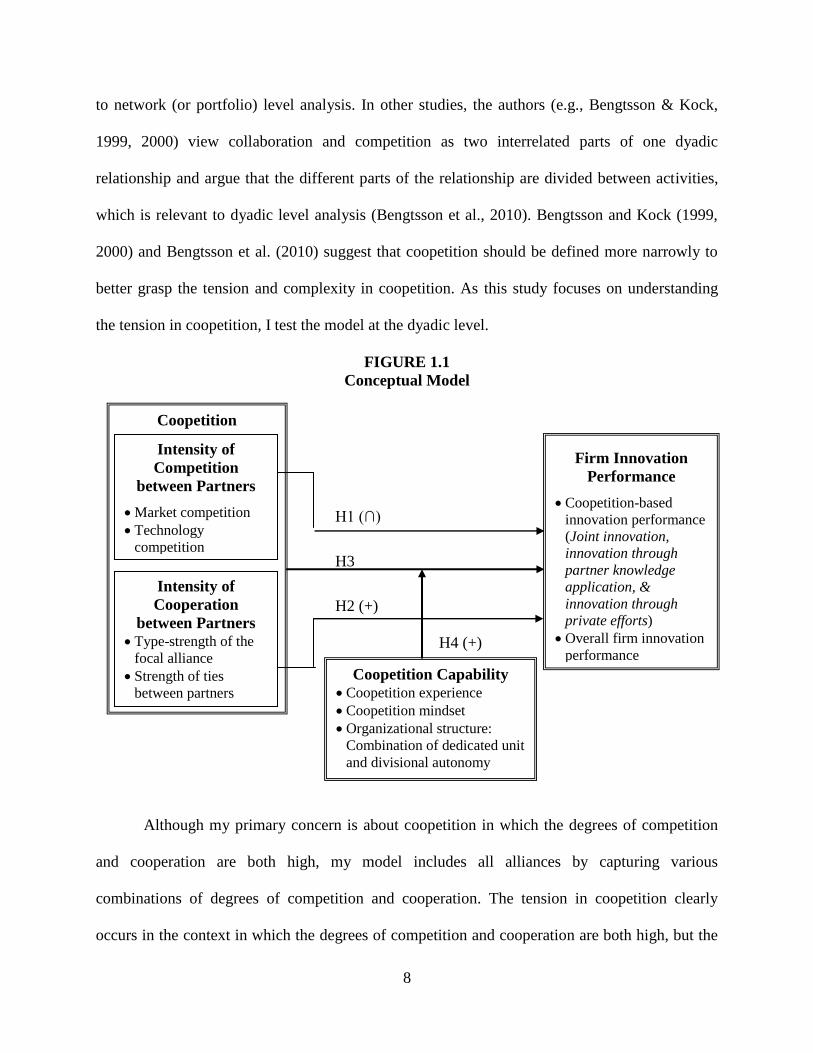
FIGURE 1.1
Conceptual Model
H1 (∩)
H3
H2 (+)
H4 (+)
Although my primary concern is about coopetition in which the degrees of competition
and cooperation are both high, my model includes all alliances by capturing various
combinations of degrees of competition and cooperation. The tension in coopetition clearly
occurs in the context in which the degrees of competition and cooperation are both high, but the
Coopetition
Intensity of
Cooperation
between Partners
Type-strength of the
focal alliance
Strength of ties
between partners
Intensity of
Competition
between Partners
Market competition
Technology
competition
Coopetition Capability
Coopetition experience
Coopetition mindset
Organizational structure:
Combination of dedicated unit
and divisional autonomy
Firm Innovation
Performance
Coopetition-based
innovation performance
(Joint innovation,
innovation through
partner knowledge
application, &
innovation through
private efforts)
Overall firm innovation
performance
9
logic can be applied to all alliances. In fact, tension is inherent in all collaborative relationships
(Das & Teng, 2000) and all alliances have a certain degree of competition between partners.
Further, examining coopetition in all alliances enables us to compare narrowly defined
coopetition (i.e., the degree of competition and that of cooperation are both high) with different
types of coopetition, by categorizing the observations into various types of coopetition. This
conceptualization is similar to Bengtsson et al‘s (2010) arguments because they view coopetition
in which collaboration and competition are divided between activities at one dyadic relationship
but do not limit it to only cooperation with key competitors. As a result, this study will show not
only the extent to which coopetition has an effect on innovation, but also the extent to which the
balance of cooperation and competition between partners produces superior innovation
performance.
1.3 Contributions
This dissertation makes four important contributions to the coopetition and innovation
literatures. First, it extends our understanding of coopetition through a conceptualization and
operationalization of coopetition. Building on previous works (Bengtsson et al., 2010; Chen,
2008; Das & Teng, 2000; Luo, 2007a), I conceptualize coopetition as being composed of three
components: 1) competition between partners, 2) cooperation between partners, and 3) the
interplay between competition and cooperation. Such conceptualization is essential for exploring
the role of tension in coopetition. The tension in coopetition stems from the paradoxical factors,
such as value creation versus value appropriation, knowledge sharing versus knowledge
protection, and so on. The role of tension is critical for understanding the relationship between
coopetition and innovation (Gnyawali, 2010) but tension is an unresolved issue in the coopetition
literature. By adopting the transparadox approach (Chen, 2008; Lewis, 2000) based on the
10
Chinese Middle Way perspective (Chen, 2002), this study extends the notion of the balance of
opposites (Das & Teng, 2000).
Second, this study advances our understanding of the role of coopetition on firm
innovation performance by shifting the focus of the discussion from whether coopetition is
beneficial for innovation to how, when, and to what extent firms can reap the benefits of
coopetition. Based on the above conceptualizations of coopetition, this study examines the
relationship between coopetition and firm innovation through methodological advancement. The
lack of appropriate measures for coopetition is one of the most critical obstacles to large scale
empirical studies (Yami et al., 2010). Previous studies have measured coopetition by establishing
categorical variables, based on partners‘ industries, which limits researchers‘ ability to capture
varying degrees of competition and cooperation. By measuring coopetition as a continuous
variable, this dissertation demonstrates that coopetition based on market competition has an
inverted-U relationship with innovation. Further, by capturing coopetition based both on the
intensity of competition and the intensity of cooperation between partners, this study shows that
the balance between competition and cooperation generates superior innovation performance.
Third, and related to the above, this study shows that a firm‘s coopetition capability, i.e.,
accumulated managerial competencies regarding how to manage a firm‘s coopetitive ties, plays a
critical role in moderating the relationship between coopetition and innovation performance.
Coopetition is considered as a paradoxical (Chen, 2008), dynamic (Luo, 2007b), and unstable
(Das & Teng, 2000) relationship. Thus, managing coopetition is a much more challenging task
than managing general alliances and requires unique managerial capabilities. From a managerial
standpoint, how to understand and manage the tension from paradoxical factors is critical for
selecting partners and managing (or coordinating) the paradoxical factors and conflicts within
11
and between firms. Through both the case study and the quantitatitive study, this dissertation
demonstrates that a firm‘s coopetition capability plays a critical role in coopetition.
Finally, this dissertation contributes to the innovation literature as well. Building on the
rationale of value creation and appropriation, which is a central part of coopetition, I
conceptualize the composition of value (―innovation‖ in this study) that a focal firm can create
and appropriate through coopetition as follows: 1) value co-creation, 2) value creation through
knowledge application, and 3) value creation through competition with partners (refer to Figure
3.3). Based on such a conceptualization, I isolated innovation performance through coopetition,
which is composed of three components: 1) joint innovation, 2) innovation through the
application of partner knowledge, and 3) innovation in the partner‘s domains. Ahuja, Lampert,
and Tandon (2008) raised an issue in alliance research on innovation – the difficulty in matching
innovations directly to alliances. In this dissertation, I provide a new measure (i.e., coopetition-
based innovation), which captures only the value (innovation performance) related to
coopetition. Thus, this dissertation helps resolve an important challenge in the coopetition (or
general alliance) research on innovation.
12
2. LITERATURE REVIEW
This chapter is composed of four parts. The first part presents a review of the evolution of
coopetition literature. This part begins with the existing literature on the competitive perspective,
the cooperative perspective, and collaboration with competitors, providing a basis to understand
how such an increasing phenomenon – collaborating with competitors – has been approached
from the competition and cooperation perspectives. Then, I address the different definitions
(focused vs. broad) and recent trends of coopetition. The second part presents the role of inter-
firm dynamics (competition, cooperation, and coopetition) in innovation. The third part
addresses the tension and paradox in coopetition as the theoretical foundation of this study. The
fourth part reviews the role of dynamic capabilities.
2.1 The Evolution of Coopetition Literature
In recent decades, competitive advantage and firm performance have been heavily
emphasized in strategic management research and practice. The focus in this stream has shifted
from the competitive perspective, based on organizational economics and resource-based view
(RBV), to the cooperative perspective, based on the collaborative or relational benefits from
inter-organizational alliances and networks (RBV is extended to beyond the firm boundary), and
more recently to the interplay of the two perspectives. In the section below, I briefly review the
competition and collaboration literatures that helped to develop coopetition studies. Then I
review the coopetition literature.
2.1.1 Competition-cooperation research
2.1.1.1 The competitive perspective
To accomplish their performance goals (i.e., achieving and sustaining competitive
advantage), firms formulate competitive strategies on how to compete with their rivals.
13
Competitive strategy is concerned with the question of how a firm can gain advantage over its
competitors (Bowman & Faulkner, 1997; Porter, 1985). There are two broad traditions of
thinking about competitive strategy from either external or internal aspects of the firm.
Hoskisson and colleagues note that the field of strategic management has shifted its focus from
one to the other like the swing of a pendulum (Hoskisson, Hitt, Wan, & Yiu, 1999). On the one
hand, competitive strategy is based on the structure-conduct-performance (S-C-P) paradigm of
industrial-organization (IO) economics. Contributing to this paradigm, Porter (1980) provides a
model in which the structure of an industry determines the state of competition within that
industry and structural forces, the so called five forces, determine the average profitability of the
industry. On the other hand, the development of the resource-based view (RBV) of the firm (e.g.,
Barney, 1986, 1991; Penrose, 1959; Wernerfelt, 1984) has increased emphasis on firms‘ internal
attributes such as resources, capabilities, and knowledge. Different from IO economics, the RBV
sees resources and capabilities as the heart of a company‘s competitiveness. Based on the
assumption of resource heterogeneity, researchers try to explain how firms‘ different resources
influence firm performance.
Meanwhile, another stream of research explicitly focuses on the interactive, dynamic
nature of firm competition. Although the dynamic competition may be discussed from multiple
perspectives,2 I focus on competitive dynamics research in this chapter and dynamic capabilities
in section 2.4. Competitive dynamics research (Chen, 1996; Chen, Su & Tsai, 2007; Ferrier,
Smith & Grimm, 1999) has examined the dynamics of how firms compete with one another and
how they make use of strategy to build competitive advantages over competitors (Hoskisson et
al., 1999). Grounded in Schumpeter‘s (1942) theory of creative destruction and Austrian
2 Elling and Lin (2001) introduced the term “dynamic competition” and argue that dynamic theories include 1)
Schumpeterian, 2) revolutionary, 3) Austrian, 4) path dependence, and 5) resource-based view (RBV).
14
Economics, competitive dynamics research emphasizes the dynamic process of how firms act
and react to the competitive environment in order to achieve competitiveness (Smith, Ferrier, &
Ndofor, 2001). Emphasizing a dyadic, pair-wise analysis, Chen (1996) introduced two firm-
specific concepts – market commonality and resource similarity – to help elucidate the pre-battle
competitive tension between two firms and to predict how firms may interact with each other as
competitors. There are three elements – awareness, motivation and capability (AMC) – that
provide the theoretical foundation for analyzing factors that can influence the characteristics of
competitive reaction at various levels. Chen et al. (2007) argue that competitors can offer
responses to a competitive move only if they are aware of the move, motivated to respond to the
move, and capable of responding to the move. Accordingly, they argue that AMC will influence
the competitive tension.
In competition-dominated relationships, firms show competitive rent-seeking behavior
(Lado et al., 1997). According to Lado et al. (1997), competition arguably generates economic
efficiency in the following ways: a) it encourages firms to optimally allocate scarce resources
and b) it provides the impetus for innovation and entrepreneurship (Nelson, 1991; Schumpeter,
1942). However, this approach is based on the theoretical assumption that the creation of
economic value occurs within the firm whereas inter-firm interactions influence the distribution
of that value (Dagnino, 2009). Thus, firms may be blinded to opportunities to realize positive-
sum benefits through effective collaboration (Kanter, 1994). Also, this approach encompasses a
zero-sum orientation toward the firm‘s stakeholders (Lado et al., 1997; Dagnino, 2009). Lado et
al. (1997) point out that by perceiving and structuring relationships with their stakeholders as
zero-sum games where one firm‘s gain is another firm‘s loss, competitive behavior may
encourage firms either to erect barriers around their distinctive competencies and then make
15
cooperation difficult or to behave opportunistically toward others (Williamson, 1985). In the case
of a company adopting competitive behavior, the risk of a ‗learning race‘ emerges (Quintana-
García & Benavides-Velasco, 2004), where firms simultaneously look for a maximum
absorption of distinctive competencies from its partner and try to protect their own core
resources and capabilities (Kale, Singh & Perlmutter, 2000). Consequently, although competitive
behavior helps earn temporary rents, it may be difficult for firms with such behavior to maintain
a competitive advantage for a long time.
2.1.1.2 The cooperative perspective
More recently, scholars have paid increasing attention to ―cooperative strategy‖ that ―is
the attempt by organizations to realize their objectives through cooperation with other
organizations rather than in competition with them‖ (Child, Faulkner, & Tallman, 2005: 1). This
strategic perspective emphasizes the development and nurturing of ―collaborative‖ or
―relational‖ advantage. Few firms have all the resources needed to compete effectively in the
current dynamic business environment (Ireland, Hitt, & Vaidyanath, 2002). Companies that are
lacking in particular competencies or resources can secure these through links (i.e., establishing
alliances or joint ventures) with other organizations possessing complementary resources or
capabilities (Child et al., 2005). Within the collaborative paradigm, the business world is
composed of networks of interdependent relationships and firms are intertwined in complex
networks of interactions with other organizations (Dyer & Singh, 1998; Gulati, 1998; Gulati,
Nohria, & Zaheer, 2000). According to the research on inter-organizational alliances and
networks, a cooperative strategy can offer significant advantages for companies to pool and
utilize valuable resources and capabilities, offer easier access to new markets, and obtain
opportunities for mutual synergies and learning (Dyer & Singh, 1998; Ireland et al., 2002).
16
In cooperation-dominated relationships, firms show collaborative rent-seeking behavior
(Lado et al., 1997). Dagnino (2009) argues that the sources of economic value creation in
cooperative relationships are located within the structure of firms‘ interdependence, which is
based on a positive-sum game with the goal of deriving mutual benefits. In the same vein, Lado
et al. (1997) echoed Kanter‘s (1994) argument that collaborative advantage is generated when
companies develop a behavior that emphasizes altruism, trust, and reciprocity among the
partners. ―Trust generates economic rents in several ways such as serving as a mechanism for
social control and reducing the transaction costs that would otherwise be incurred in building
governance mechanisms to safeguard against the hazards of partner opportunism (Lado et al.,
1997: 121).‖ Axelrod (1984) noted that for cooperation to succeed, it must be based on
reciprocity and on mutual expectations that economic exchanges between the parties will
continue in the future. Vis-à-vis the competitive approach, the cooperative perspective
significantly reduces the threat of opportunistic behaviors (Dagnino, 2009).
However, cooperative rent-seeking behavior has several limitations. Lado et al. (1997)
noted that habitually cooperative firms, which tend to perceive and structure inter-firm
relationships as positive-sum games, might fail to differentiate between genuinely cooperative
and trustworthy partners and opportunistic ones (Frank, 1988). Also, cooperative rent-seeking
behavior might generate strategic inflexibility. While inter-firm relationships may help firms
enhance their strategic flexibility and learning capability (Volberda, 1996), Bresser and Harl
(1986) noted that greater cooperation heightens reciprocal commitments of idiosyncratic and
specialized resources to the cooperative efforts, which, in turn, exacerbates strategic inflexibility.
In a similar vein, Uzzi (1997) reports that, beyond a threshold, embeddedness can hurt
performance by making firms vulnerable to exogenous shocks or insulating them from
17
information that exists outside their network. Consequently, although cooperative behavior is
necessary to generate collaborative benefits, it may be not sufficient for achieving sustained
superior performance and viability.
2.1.1.3 Collective competition versus competitive collaboration
Until recently, researchers have tended to view competition and cooperation as opposite
ends of a single continuum (Quintana-García & Benavides-Velasco, 2004). From two different
perspectives, existing theory and research on relationships among competitors have focused
either on competitive or on cooperative relationships between them, with one relationship to
arguably harm or threaten the other (Bengtsson & Kock, 2000).
However, recently the phenomenon of collaboration with competitors has been studied
from the viewpoints of cooperation theory and competition theory. As collaboration between
competitors becomes more common, scholars in alliance or competitive dynamics pay attention
to the phenomena, even though they use different terms, such as ―competitive collaboration,‖
―collective competition‖ as well as ―cooperation with rivals,‖ depending on their approach or
focus (competition-oriented or cooperation-oriented) (see Chen, 2008; Gomes-Casseres, 1994;
Hamel, Doz & Prahalad, 1989). With regard to collaboration with competitors, the alliance
literature takes a zero-sum approach and adopts an opportunistic perspective, based on the TCE
framework. Hamel et al. (1989) analyze the phenomenon of collaborating with competitors, what
they call ―competitive collaboration,‖ focusing on how to win (or get more value) over
competitor-partners in the relationship. Hamel (1991) argues that collaboration between
competitors often leads to a ―learning race‖ in which firms compete over who can acquire more
knowledge from the relationship before its termination. Such a setting implies a zero-sum (or
negative-sum) game between the collaborating partners. In the similar vein, Park and Russo
18
(1996: 878) show that ‗the potential for appropriability in a joint venture setting is higher when
the partners are direct competitors.‘ Meanwhile, competition literature also studied collaboration
with competitors. Ketchen and Snow (2004) include coopetition as one of six streams in
competitive dynamics research. Chen (2008) summarizes that competition-oriented cooperation
studies use various competitive attributes (such as industry structure and inter-firm competitive
relationships) to predict outcomes (such as duration, intensity, organizational learning between
partners) of cooperative arrangements (such as joint ventures, alliances).
A critical issue is that these research streams continue to use different terms even after
the term ‗coopetition‘ was introduced into the academic literature by Brandenburger and
Nalebuff (1996). Thus, scholars can be confused in regard to the difference between coopetition
and certain types of alliance (e.g., horizontal alliance, scale alliance, or competitor alliance) or
certain types of competition (e.g., collective competition). The alliance literature has developed
the categorizations for collaboration with competitors, such as ―horizontal alliances,‖ ―scale
alliances,‖ and ―competitor alliances.‖ First, alliances between competitors within an industry are
referred to as ―horizontal alliances‖ (Burgers, Hill & Kim, 1993). They can be distinguished
from vertical alliances between firms operating in adjacent stages of a value chain (Harrigan,
1988). Based on the venture relatedness, Harrigan (1988) divided the types of ventures into two
categories – vertical and horizontal. She argues that joint ventures are vertically related to
owners if buyer-seller relationships are created between owner and venture, as in the example of
Reserve Mining (owned by Republic Steel and Armco Steel); horizontally related joint ventures
link owner and venture in the same strategic activities, as in the example of New United Motor
Manufacturing Inc. (NUMMI) owned by GM and Toyota. Second, Dussauge, Garrette, and
Mitchell (2000) provide another useful classification (i.e., scale vs. link alliances) of alliances
19
that supports the theory relating to coopetition, albeit implicitly (Walley, 2007). Where firms
contribute similar resources to achieve scale advantages, the relationship is referred to as a ―scale
alliance,‖ while a ―link alliance‖ refers to the relationship where firms contribute complimentary
resources to achieve a differential advantage (Dussauge, Garrette & Mitchell, 2004). Finally, Luo,
Rindfleisch, and Tse (2007) suggest that firms can form alliances with rivals (which they term
"competitor alliances") to accomplish both competitive and cooperative goals and boost profits
in a "win-win" manner.
In sum, the phenomenon of collaboration with competitors has been studied from the
viewpoints of cooperation theory and competition theory as well as the coopetition literature.
Such studies have advanced our understanding of the phenomenon (collaboration with
competitors), and coopetition research can draw extensively from these studies. Therefore, it is
necessary to examine the similarities/differences between coopetition and related research
streams, which will show the uniqueness of coopetition.
2.1.2 The Coopetitive Perspective
2.1.2.1 Why do we need the term coopetition?
The term coopetition was coined by Ray Noorda, CEO of the technology company
Novell, but it was popularized by the bestselling book titled Co-Opetition by Brandenburger and
Nalebuff published in 1996 (Gnyawali et al., 2008). The discussion above raises a natural
question: ―Why do we need the term (or concept) of coopetition?‖ Scholars who support
coopetition argue that the research from either the cooperation or the competition perspective is
limited when capturing the business reality, which is much more complex in terms of separating
between competing and collaborating actors. Coopetition strategies are by nature non-
conventional, paradoxical, or heterodox because they link two concepts that are contradictory by
20
definition and nature – competition and cooperation (Yami et al., 2010). Brandenburger and
Nalebuff (1996) and their followers considered the concept of coopetition to be a new strategic
perspective that is capable of overcoming the limits of the old strategic dichotomy (cooperation
or competition) and suggested that firms should seek the advantages arising from both
competition and cooperation. More scholars have recognized the benefits of a blended approach
that includes both the competitive and cooperative perspectives. For example, Chen (2008)
observed that although competition and cooperation individually have received much
consideration in the strategy field, there seems to be clear and unsolved contradiction between
the competitive paradigm and the cooperative paradigm. Therefore, Chen (2008) points out that,
even though both competitive and cooperative strategies are integral parts of a firm‘s overall
strategy, researchers have given little attention to the fundamental issue of interplay between the
two concepts.
2.1.2.2 Different views of coopetition
While the elements of competition and collaboration are essential for the
conceptualization of coopetition, scholars have used a wide variety of definitions and
perspectives to examine it (Yami et al., 2010). While some definitions are focused, others are
rather broad. Scholars capture the concept of coopetition based on the three most cited seminal
works: Brandenburg and Nalebuff (1996), Lado et al. (1997), and Bengtsson and Kock (2000). In
the book Co-Opetition, Brandenburg and Nalebuff (1996) provide a theoretical background of
coopetition, based on the ―value-net‖ model, which focuses on the presence of a
―complementor.‖ From this viewpoint, coopetition includes indirect collaboration among
competitors. For example, two competitors (e.g., computer manufacturers) can be
complementors through their collaboration with a third firm (e.g., software producers). Lado et
21
al. (1997) make another contribution to the notion of coopetition, even though they did not use
the term. Using game theory, RBV, and social network theory, they argued that a combination of
competitive and cooperative strategies will create a higher overall rent for a firm (so called
―syncretic rent‖). Brandenburger and Nalebuff (1996) and their followers consequently view
coopetition as the sum of many different relationships and the cooperative and competitive part
is divided between different actors (Bengtsson et al., 2010), which results in a very broad
definition of coopetition.
In contrast to the broad approach, Bengtsson and Kock (1999, 2000) are more focused in
defining coopetition as a ―dyadic and paradoxical relationship emerging when two firms are
cooperating in some activities, while competing with each other in the remaining activities.‖
That is, the authors view collaboration and competition as two interrelated parts of one dyadic
relationship and argue that the different parts of the relationship are divided between activities.
In this regard, Bengtsson and Kock (2000) identified two different patterns of division between
the two parts of the coopetitive relationship: the value chain and the market (business units or
product area). In such cases, coopetition should be defined as a relationship between two actors
(Bengtsson & Kock, 1999, 2000) and the actors could be individuals, units, organizations,
alliances, or formalized networks (Bengtsson et al., 2010).
The definitions are also related to the levels of analysis (Bentsson et al., 2010). While
broad approaches are related to the network or portfolio level, focused approaches are related to
the dyadic level research. Until now, for quantitative research, scholars take a broad approach.
However, several scholars (e.g., Bentsson et al., 2010; Bengtsson & Kock, 2000; Gnyawali et al.,
2008) point out that coopetition should be defined more narrowly to better grasp the tension and
complexity that follows when two firms simultaneously cooperate and compete with each other.
22
As the focus of this research is on tension in coopetition, the focused definition of coopetition
and a dyadic level approach seem appropriate to this study.
2.1.2.3 Trends in the coopetition literature
Based on the foundation works (Brandenburg & Nalebuff, 1996; Bengtsson & Kock,
2000), the concept of coopetition has been increasingly adopted by scholars in various fields.
The coopetition literature offers several characteristics. First, as coopetition is a multi-level
phenomenon, coopetition research includes at least three levels of analysis: 1) intra-firm, 2)
inter-firm (or dyad), and 3) network (or portfolio) level research. As Table 2.1 and Table 2.2
present, research has been the most fruitful at the level of inter-firm relationships, while network
level research (e.g., Gnyawali, He & Madhavan, 2006; Peng & Bourne, 2009) and intra-firm
level studies (e.g., Tsai, 2002; Luo, 2005) have received far less academic attention. Second,
research on coopetition has developed in terms of conceptual advancement. Some scholars have
proposed theoretical extensions on the nature or typology of coopetition, which enables a better
understanding of the phenomenon. Dagnino and Padula (2002) differentiate among four forms of
coopetition, which depend on the number of rival firms and number of value activities involved
in coopetition relationships. Luo (2007a) offers the typology of the intensity of coopetition and
identifies four situations: contending (high competition, low cooperation), isolating (low-low),
partnering (high cooperation, low competition), and adapting (high-high). Gnyawali et al. (2008)
provide a framework that explains how coopetition occurs very intensely (when a dyad engages
in simultaneous collaboration and competition) and much less intensely (when several firms
engage in some forms of collaboration and competition at different time periods). Finally, with a
few exceptions, empirical research on coopetition has focused on explorative single-industry
case studies (Yami et al., 2010).
23
The subjects that the literature has examined can be divided into three categories: 1)
drivers, 2) processes/contexts, and 3) outcomes of coopetition (Gnyawali et al., 2008). First,
scholars identified various drivers (or motivations) of coopetition, such as changes in market
conditions, institutional or regulatory change, complementary resource or knowledge profiles
(Padula & Dagnino, 2007), or the need for advantages of scale (Walley, 2007). However, there
have been limited studies that extensively examine drivers of coopetition, the exception being
Gnyawali and Park‘s (2009) multi-level model of drivers and outcomes of coopetition. They
identified three drivers (short product life cycles, technological convergence, and massive R&D
investment), which will increase the likelihood of coopetition in the high-tech industry. In
addition, they argue that firm-level factors (firms‘ prospecting strategy and venerability) and
dyadic factors (technological competence, resource complementarity, and resource similarity)
interplay with industry-level factors, which will determine actual coopetition. Second, in terms
of the coopetition process, recent trends in coopetition research show a proliferation in the use of
the term ―coopetition‖ in various contexts and many studies broadly defined coopetitive
relationships. As Brandenburg and Nalebuff (1996) thought of coopetition as a revolutionary
mind-set, coopetition has been viewed as a broad philosophy. Therefore, coopetition has been
applied to explain various relationships and phenomena, including supply chain relationships,
firm-government (or broad stakeholders) relationships, and collaboration with direct/indirect
competitors. For example, Eriksson (2008) investigated coopetition in buyer-supplier
relationships. Luo (2007a) suggests that coopetition can be applied to various contexts, such as
MNC-host government relationships. Walley (2007) also suggested studying broad topics,
including coopetition with consumers.
24
Finally, regarding the outcomes of coopetition, even though some studies (e.g., Lado et
al., 1997) conceptually address the performance implications of coopetition, empirical studies
focusing on this link are rare (Walley, 2007). Only a few studies have dealt with financial
performance (Luo, Rindfleisch, & Tse, 2007; Ritala et al., 2008), innovation performance
(Quintana-García & Benavides-Velasco, 2004), JV stability (Park & Russo, 1996), and
competitive behavior (Gnyawali et al., 2006). With the limited empirical studies and some
inconsistent results, however, there is a great deal of ambiguity concerning the effects of
coopetition on firm performance. In terms of firm financial performance, Luo et al. (2007)
reported that competitor alliance intensity has an inverted U-shaped relationship with firm
profitability. However, Ritala et al. (2008) failed to find a significant relationship between
coopetition (in terms of the relative number of key competitors among the group of firm‘s
strategic alliances) and firm financial performance. Regarding joint venture stability, Park and
Russo (1996), using the perspectives of TCE, reported that a joint venture between competitors is
significantly more likely to fail. Innovation performance will be discussed in the next section.
2.1.3 Research gaps in the coopetition literature
Research on coopetition is still at a very early and conceptual phase (Padula & Dagnino,
2007) and is relatively small, fragmented, and sparse (Yami et al., 2010). Most empirical studies
are explorative single-industry case studies. The first gap in the literature addressed in this study
concerns the lack of studies and inconsistent results on the relationship between coopetition and
firm performance. There is a great deal of ambiguity concerning the effects of coopetition on
firm-level performance (Ritala, in press). As a key objective of strategy is to generate
competitive advantage, a fundamental issue to examine is the role of coopetition in firm
performance, including innovation. Second, tension in coopetition is under-researched. Tension
25
is inherent in coopetition due to the paradoxical relationship between competition and
cooperation. However, dynamic tension and its implications for firm performance have not been
systematically examined in the coopetition literature. Third, research has paid less attention to
the dynamics of coopetition. If the effects of coopetition on firm performance are significant,
how do a firm‘s specific capabilities related to coopetition affect its success? As coopetition is
considered a dynamic and paradoxical relationship, it is necessary to examine which factors are
necessary to manage coopetition in order to avoid the risks and maximize the benefits. Finally,
case studies are important especially for extending our understanding the tension and dynamics
of coopetition. With a few exceptions, most of the case studies focus on describing the
phenomenon of coopetition in various contexts. Therefore, we still know little about how firms
could simultaneously collaborate and compete, how the relationship evolves over time, and how
firms could manage tension from paradoxical factors in coopetition.
26
TABLE 2.1: Key Empirical Research on Coopetition
Author(s) Research
objectives
Research setting Unit of
analysis
Measures Key Findings
Financial Performance
1 Ritala et al.
(2008)
What is the
relationship b/w
firm performance
and the amount of
strategic alliances
with firm‘s key
competitors?
The global ICT sector
(56 large companies-10
largest firms from each
group)
N=36 (having at least
one or more
coopetitive
relationships)
Firm-
Portfolio Coopetition:
- The relative number of key
competitors among the firm‘s
strategic alliance partners
- The relative number of strategic
alliances among the firm‘s key
competitors
Performance: ROA, Sales
A high relative number of strategic
alliances among a group of firm‘s key
competitors contributes negatively to firm
performance.
Mixed results: statistical sign is negative and
significant (p<.05); correlation(r) is 0.42
(positive).
2 Luo,
Rindfleisch,
& Tse
(2007)
The impact of
competitor
alliances on
financial
performance.
Industries: electronics,
pharmaceuticals,
machinery, chemicals,
paper & forest,
apparel, rubber &
plastic, computer
industry.
Firm Coopetition: Survey
- Competitor alliances (CA)
intensity: five items
- Competitor-oriented strategies
(COS): six items
- Competitor-oriented objectives
(COO): four items
Performance: ROE
Competitor alliances intensity has an
inverted U-shaped relationship to firm
profitability (p<.01; r=.27).
Competitor-oriented strategies are positively
related to firm profitability (p<.01; r=.17).
Competitor-oriented objectives are
negatively related to firm profitability
(p<.01; r=-.12).
Innovation Performance
3 Ritala &
Hurmelinna-
Laukkanen
(2009)
Firm-specific
success factors in
coopetition.
A cross-industry
survey to 213 Finnish
companies
Firm Survey
DV: Level of incremental and
radical innovation
IVs: Potential absorptive capacity
(5 items); Appropriability regime
(7 factors)
In coopetition, both potential absorptive
capacity (p<.05; r=.11) and appropriability
regime (p<.01; r=.18) have a positive effect
on incremental innovation.
In the case of radical innovations,
appropriability regime has a positive effect
(p<.001; r=.24), while the effect of
absorptive capacity is not statistically
significant (r=.08).
4 Nieto &
Santamaria
(2007)
The effects of
different type of
partners on the
degree of novelty
of product
innovation.
Survey by Spanish
Ministry of Science
and Technology from
1998 to 2002
6500 observations
from 1300 firms
Firm-
Portfolio Coopetition: Collaboration with
competitors exclusively
Innovation: survey - the
characteristics (high or low
novelty) of product innovation
Collaboration with competitors exclusively
has a negative impact on the novelty of
innovation and produces the least level of
novel innovations (p<.01); r=-.00).
Collaboration with multiple partners
produces positive effects on innovation
(p<.01; r=.29)
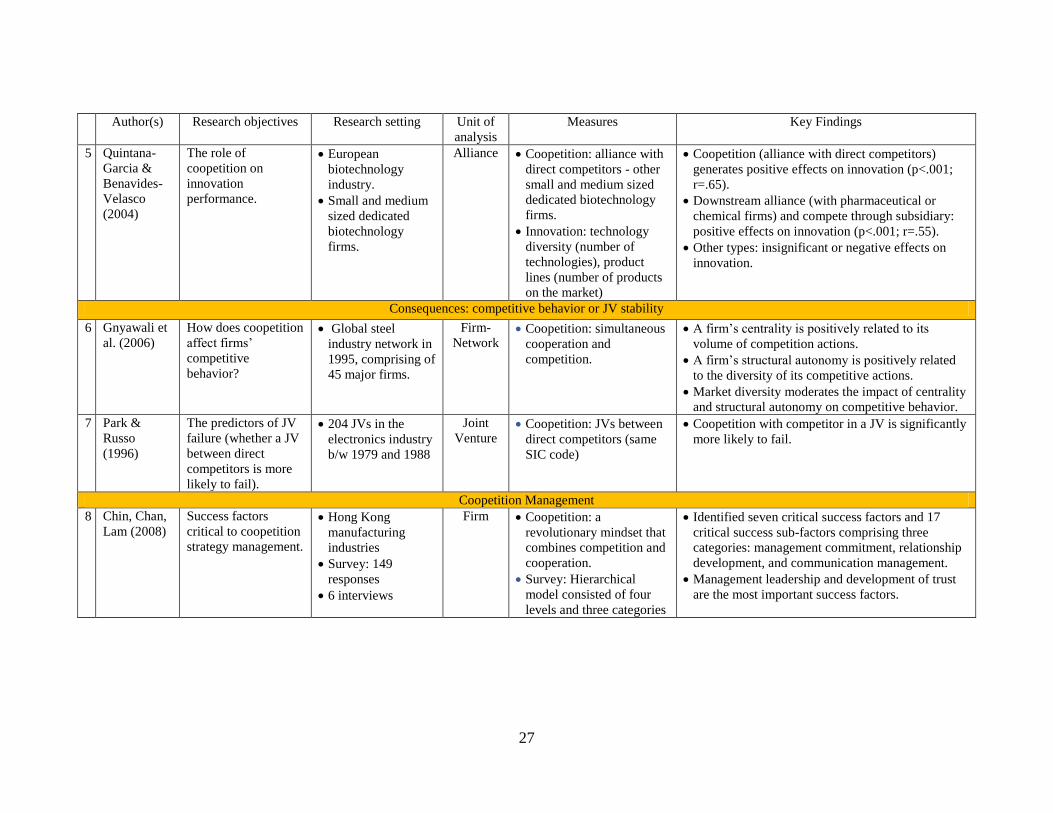
27
Author(s) Research objectives Research setting Unit of
analysis
Measures Key Findings
5 Quintana-
Garcia &
Benavides-
Velasco
(2004)
The role of
coopetition on
innovation
performance.
European
biotechnology
industry.
Small and medium
sized dedicated
biotechnology
firms.
Alliance
Coopetition: alliance with
direct competitors - other
small and medium sized
dedicated biotechnology
firms.
Innovation: technology
diversity (number of
technologies), product
lines (number of products
on the market)
Coopetition (alliance with direct competitors)
generates positive effects on innovation (p<.001;
r=.65).
Downstream alliance (with pharmaceutical or
chemical firms) and compete through subsidiary:
positive effects on innovation (p<.001; r=.55).
Other types: insignificant or negative effects on
innovation.
Consequences: competitive behavior or JV stability
6 Gnyawali et
al. (2006)
How does coopetition
affect firms‘
competitive
behavior?
Global steel
industry network in
1995, comprising of
45 major firms.
Firm-
Network Coopetition: simultaneous
cooperation and
competition.
A firm‘s centrality is positively related to its
volume of competition actions.
A firm‘s structural autonomy is positively related
to the diversity of its competitive actions.
Market diversity moderates the impact of centrality
and structural autonomy on competitive behavior.
7 Park &
Russo
(1996)
The predictors of JV
failure (whether a JV
between direct
competitors is more
likely to fail).
204 JVs in the
electronics industry
b/w 1979 and 1988
Joint
Venture Coopetition: JVs between
direct competitors (same
SIC code)
Coopetition with competitor in a JV is significantly
more likely to fail.
Coopetition Management
8 Chin, Chan,
Lam (2008)
Success factors
critical to coopetition
strategy management.
Hong Kong
manufacturing
industries
Survey: 149
responses
6 interviews
Firm Coopetition: a
revolutionary mindset that
combines competition and
cooperation.
Survey: Hierarchical
model consisted of four
levels and three categories
Identified seven critical success factors and 17
critical success sub-factors comprising three
categories: management commitment, relationship
development, and communication management.
Management leadership and development of trust
are the most important success factors.

28
TABLE 2.2: Key Case-Based Empirical Research on Coopetition
Author(s) Research objectives Research setting Unit of
analysis
Measures Key Findings
Coopetition Management
1 Watanabe
et al.
(2009)
The effects of the fusion
of Canon‘s indigenous
strength in printer
technology and market
learning effects.
Case study of Canon
printer
Firm A co-evolutionary
trajectory b/w printers and
PCs
Canon accomplished in sustainable functionality
development by fusing its indigenous strength and
effective external market learning.
While Canon and PC makers cooperate to expand
the PC market, they compete in the market of
computer peripheral equipment.
2 Oshri &
Weeber
(2006)
Whether is a
standardization battle
taking a hybrid mode
(not either pure
competition or
cooperation activities)?
Case study of the
Wireless Information
Devices Operating
System (WID-OS)
battle
Firm-dyad Coopetition: hybrid mode
between pure competition
and cooperation
Standard-setting activities are taking place in a
hybrid mode.
Members of a network undertake to 1) coordinate
standard-setting activities as a cooperative unit,
and 2) ensure that their competitive position in
their respective market is secured as individual
competitors.
3 Bengtsson
& Kock
(2000)
The trade-off between
cooperation and
competition in
relationships among
competitors.
Case study of the
two Swedish and one
Finnish industries
(the lining, brewery,
and diary industries)
Interview 21
persons.
Firm-dyad Coopetition: simultaneous
collaboration and
competition
Competitors cooperate with activities far from the
customer and compete in activities close to the
customer.
Driving factors influence coopetition:
heterogeneity in resources, competitors‘ position
and the connectedness b/w them, conflict and
consensus about organizational goals.
4 Tsai
(2002)
How does interunit
competition moderate
the relationship b/w
coordination mechanism
and interunit knowledge
sharing?
A large multiunit
company with 24
business units.
Surveys were
conducted in 1996
and 1998.
Intra firm
(Business
unit)
Coopetition:
simultaneously
collaborative and
competitive behavior
Social interaction has a significant positive effect
on knowledge sharing among units that compete
with each other for market share, but not among
units that compete for internal resources.
5 Cassiman
et al.
(2009)
Which factors are
relevant at the project
level to profit from R&D
projects?
Case study of
STMcroelectronics
52 projects between
1998 to 2003
Interviews
R&D
Project Partners: universities vs.
firms
Governance structure:
internal development,
cooperation, or contracting
The balance of cooperative and competitive forces
in the organization of R&D projects is made
through the alignment of three variables: project
knowledge attributes, project governance
structure, and project partner selection.
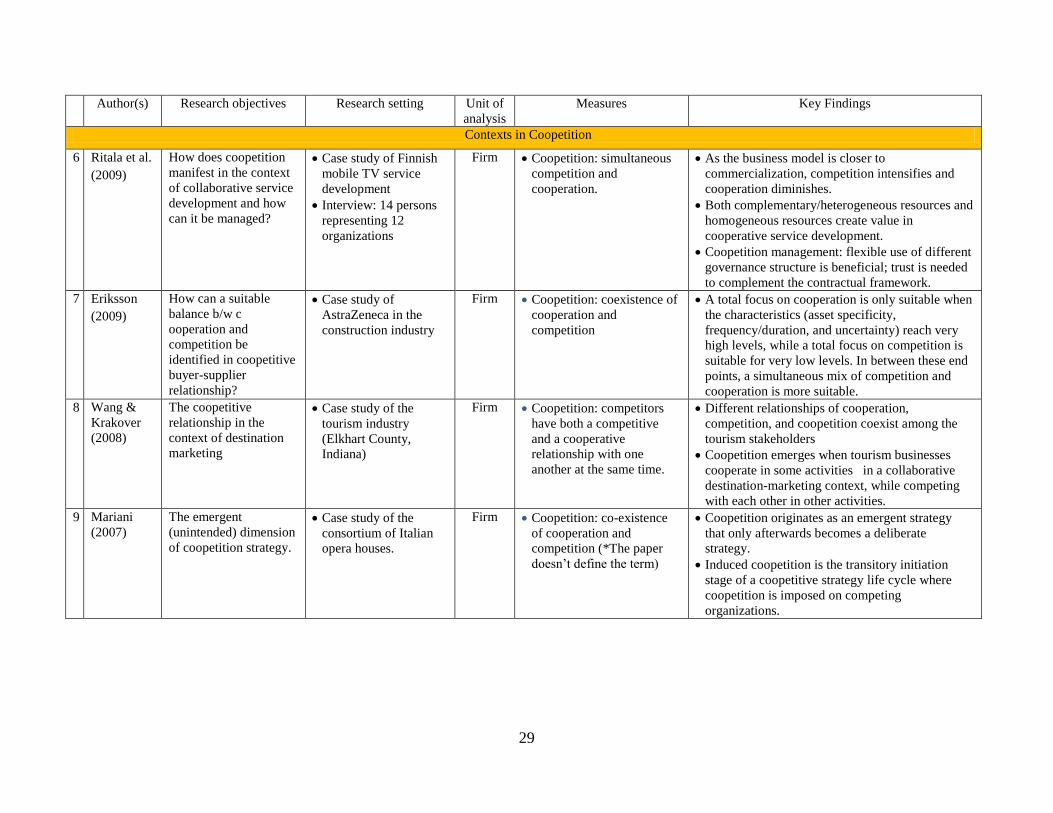
29
Author(s) Research objectives Research setting Unit of
analysis
Measures Key Findings
Contexts in Coopetition
6 Ritala et al.
(2009)
How does coopetition
manifest in the context
of collaborative service
development and how
can it be managed?
Case study of Finnish
mobile TV service
development
Interview: 14 persons
representing 12
organizations
Firm Coopetition: simultaneous
competition and
cooperation.
As the business model is closer to
commercialization, competition intensifies and
cooperation diminishes.
Both complementary/heterogeneous resources and
homogeneous resources create value in
cooperative service development.
Coopetition management: flexible use of different
governance structure is beneficial; trust is needed
to complement the contractual framework.
7 Eriksson
(2009)
How can a suitable
balance b/w c
ooperation and
competition be
identified in coopetitive
buyer-supplier
relationship?
Case study of
AstraZeneca in the
construction industry
Firm Coopetition: coexistence of
cooperation and
competition
A total focus on cooperation is only suitable when
the characteristics (asset specificity,
frequency/duration, and uncertainty) reach very
high levels, while a total focus on competition is
suitable for very low levels. In between these end
points, a simultaneous mix of competition and
cooperation is more suitable.
8 Wang &
Krakover
(2008)
The coopetitive
relationship in the
context of destination
marketing
Case study of the
tourism industry
(Elkhart County,
Indiana)
Firm Coopetition: competitors
have both a competitive
and a cooperative
relationship with one
another at the same time.
Different relationships of cooperation,
competition, and coopetition coexist among the
tourism stakeholders
Coopetition emerges when tourism businesses
cooperate in some activities in a collaborative
destination-marketing context, while competing
with each other in other activities.
9 Mariani
(2007)
The emergent
(unintended) dimension
of coopetition strategy.
Case study of the
consortium of Italian
opera houses.
Firm Coopetition: co-existence
of cooperation and
competition (*The paper
doesn‘t define the term)
Coopetition originates as an emergent strategy
that only afterwards becomes a deliberate
strategy.
Induced coopetition is the transitory initiation
stage of a coopetitive strategy life cycle where
coopetition is imposed on competing
organizations.
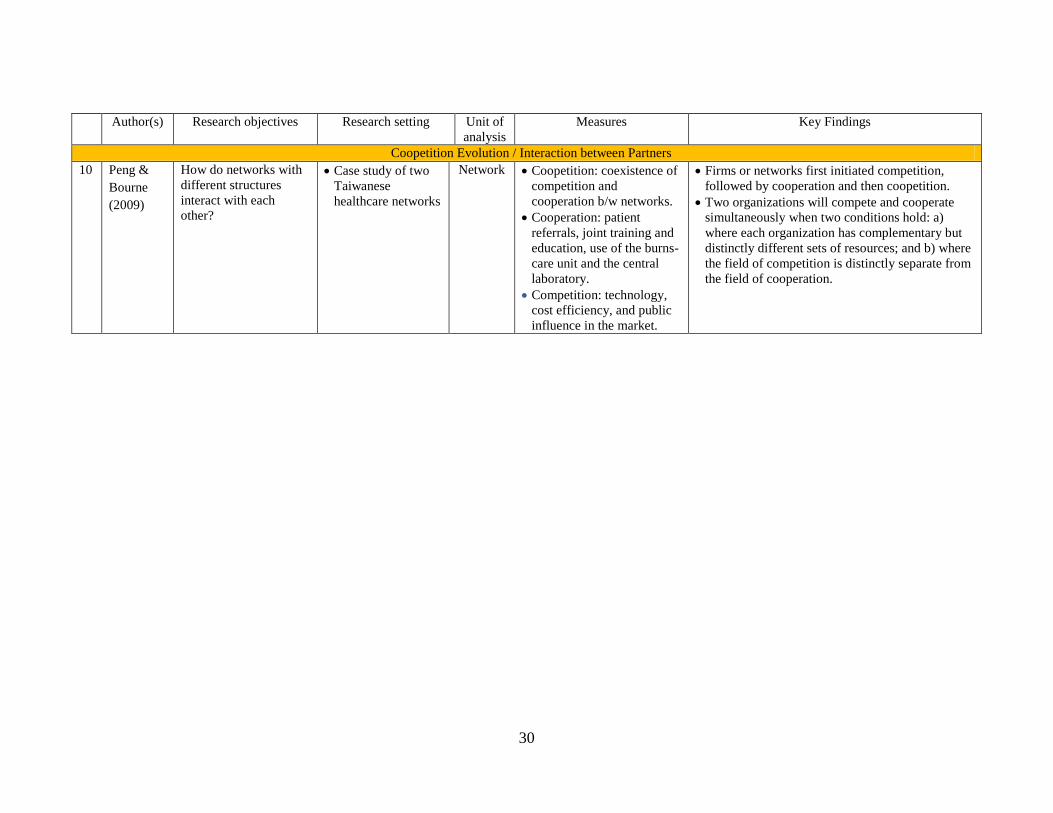
30
Author(s) Research objectives Research setting Unit of
analysis
Measures Key Findings
Coopetition Evolution / Interaction between Partners
10 Peng &
Bourne
(2009)
How do networks with
different structures
interact with each
other?
Case study of two
Taiwanese
healthcare networks
Network Coopetition: coexistence of
competition and
cooperation b/w networks.
Cooperation: patient
referrals, joint training and
education, use of the burns-
care unit and the central
laboratory.
Competition: technology,
cost efficiency, and public
influence in the market.
Firms or networks first initiated competition,
followed by cooperation and then coopetition.
Two organizations will compete and cooperate
simultaneously when two conditions hold: a)
where each organization has complementary but
distinctly different sets of resources; and b) where
the field of competition is distinctly separate from
the field of cooperation.
31
2.2 Role of Inter-firm Dynamics in Innovation
Innovation has long been seen as a source of competitive advantage (Abernathy & Clark,
1985; Ahuja & Katila, 2001; Schumpeter, 1942; Teece, 1996; Utterback & Suarez, 1993). Thus,
understanding the determinants of technological innovation has been an important area of inquiry
in the management and economics literatures. Although the innovation literature has examined
various levels of analysis (such as industry, firm, inter-firm, and intra-firm levels), the role of
inter-firm dynamics on innovation is an important but under-researched subject. The relationship
between competition and innovation is an ongoing subject (Tang, 2006). Some competition
studies, such as the patent race research, provide valuable insights on innovation from the inter-
firm dynamics perspective. In the last two decades, the management literature on innovation has
paid significant attention to inter-firm collaboration as a determinant of firm innovativeness
(Ahuja, 2000; Ahuja, Lampert, & Tandon, 2008; Lei, 2003; Powell, Koput, & SmithDoerr, 1996;
Sampson, 2007). However, the role of the interplay between competition and cooperation for
innovation performance has not been examined systematically. In the section below, I review the
role of coopetition on innovation and some studies from the competition and collaboration
literatures that help to develop coopetition studies.
2.2.1 Role of competition in innovation
The relationship between competition and innovation has been examined mainly at the
industry level by economists3. For example, Aghion, Bloom, Blundell, Griffith, and Howitt‘s
3 The Schumpeterian view predicts that innovation declines with competition. That is, an increase in product market
competition has a negative effect on productivity growth by reducing the monopoly rents that reward new
innovation. However, several studies predict the opposite results. For example, Gonzalex-Maestre and Penarrubia
(2005) argue that cooperation is recommended only when positive externalities are important. Combining the
opposite predictions, Aghion et al. (2005) propose and test a model that predicts an inverted-U pattern between
product market competition and innovation. In this model, competition discourages laggard firms from innovating
but encourages neck-and-neck firms to innovate. Further, the average technological distance between leaders and
followers increases with competition.
32
(2005) model predicts an inverted-U pattern between product market competition and
innovation. But, the patent race literature, which is more related to technology competition,
examines the relationship between competition and innovation from inter-firm dynamics
perspective and provides some important implications to the coopetition research. First, firms in
the same position (or close followers) in a patent race compete fiercely in R&D, but they can
also be potential partners for R&D. Fudenberg, Gilbert, Stiglitz, and Tirole (1983) studied the
main features of a patent race when firms compete in R&D, showing that firms in the same
position compete fiercely, dissipating the rent from innovation. Building on the dynamic model
of the patent race, Silipo (2005) analyzed the formation and breakup of joint ventures in relation
to: 1) the relative as well as absolute position of the firms in the race; and 2) the degree of
competition in the ex-post market. The results of the study imply that firms cooperate with
competitors in the same position or colse followers. Also, market competition affects their
collaboration: 1) if firms can collude in the product (or ex-post) market, they cooperate from the
outset and innovate jointly; and 2) if they will be serious competitors in the downstream market,
they cooperate at the outset but break their agreement in the last stage. Second, regarding the role
of a firm‘s position, the literature reports that the follower devotes more resources to R&D than
the leader (Doraszelski, 2003; Lerner, 1997), which gives rise to a pattern of action-reaction
(Doraszelski, 2003). Finally, related to the racing behavior, Khanna, Gulati, and Nohria (1998)
showed how the tension between cooperation and competition (or common benefits versus
private benefits) affects the dynamics of learning alliances. That is, a situation of pure private
benefits causes firms to race for learning against each other. And, ―starting from a situation of
pure private benefits, as the ratio of common to private benefit rises, the incentive to race is
attenuated (Khanna et al., 1998: 200).‖
33
Regarding technology competition, some scholars pay attention to intellectual property
(IP) litigation, which reflects competition and conflicts. For example, Lanjouw and Schankerman
(2001) imply that patent litigation is more likely when competitors (who are active in closely
related technology fields) are engaged in patent infringement (regardless that the competitors are
alliance partners or not) and it is important for patentees to defend the patent. That is, patentees
are more likely go to court to protect patents that form the base of a cumulative chain, or
technological trajectory (Lanjouw & Schankerman, 2001). Also, reputation building plays a role
in the decision to litigate: 1) firms are more likely to prosecute the infringement of a patent when
subsequent citations to that patent come from firms active in closely related technology fields;
and 2) litigation itself conveys information to competitors about the willingness to defend the
patent. However, previous studies focus on when and why patentees go to court to defend their
patents. And there were limited efforts to understand the effects when alliance partners are
engaged in patent infringements. In this regard, it is necessary to examine whether and how
partners‘ engagement in IP litigations increases tension and the threat of opportunism and, in
turn, firm innovation performance.
2.2.2 Role of cooperation in innovation
Research shows that collaborations (alliances or network) have a positive impact on
innovative output (Ahuja, 2000; Lei, 2003; Powell et al., 1996; Srivastava & Gnyawali, in press).
Collaborations provide timely access to knowledge and resources that are otherwise unavailable,
and firms can combine each other‘s resources in pursuing innovation projects that involve high
risks and require heavy investments (Gnyawali & Park, 2011). The impact of inter-firm
cooperative relationships on firm innovation has been studied at various levels: the role of inter-
firm cooperative relationships in the dyadic fashion (Mowery, Oxley, & Silverman, 1996;
34
Sampson, 2007), the role of a firm‘s position in the network (Ahuja, 2000; Zaheer & Bell, 2005),
alliance portfolio (Srivastava & Gnyawali, in press), and the impact of the structural features of
inter-firm network as a whole (Baum, Calabrese, & Silverman, 2000). In this study I focus on
cooperation at the dyadic level. The potential benefits of interorganizational collaboration are
facilitated by knowledge sharing and interactive learning processes among partners. This
potential is claimed to be considerably dependent on the strength of ties. Therefore, in this
section below, I review the strength-of-ties literature.
Strength of ties. The strength of ties is a ―combination of the amount of time, the
emotional intensity, the intimacy, and the reciprocal services which characterize the tie‖
(Granovetter, 1973:1361). Regarding the tie-strength, the interorganizational network literature
has two research streams that deal with 1) the structural embeddedness, i.e., the position of a
given organization in a broader network structure, and 2) the relational embeddedness, i.e., the
dyadic relationships or ties between the actor and each of its partners (Gulati, 1998; Uzzi, 1999).
Although structural embeddedness is important at the portfolio or network levels, I will focus on
the relational embeddedness because this study mainly deals with dyadic relationships. The
social network literature has suggested that strength-of-ties is the most dominant antecedent of
knowledge transfer at the dyadic level because strong ties reduce both motivational and cognitive
problems of knowledge transfer (Szulanski, 1996). The tie-strength research typically classifies
both interpersonal and interorganizational relationships as being either strong or weak. However,
the literature on both interpersonal and interorganizational levels ―provides considerable
evidence that partners involved in dyads holding the same kind of relationship (strong or weak)
behave homogeneously‖ (Capaldo, 2007: 588). Therefore, at the interorganizational level,
35
scholars draw the same rationale of interpersonal level to explain the same dimensions in
Granovetter‘s (1973) work.
At the inter-organizational level, strength-of-ties between partners, based on the notion of
relational embeddedness, is typically operationalized using frequency, duration, and resource
commitment. That is, strength-of-ties is indicated by ―the frequency of interaction between
partners and their level of resource commitment to the relationship‖ (Rowley, Behrens, &
Krackhardt, 2000:371). For them, some dimensions in Granovetter‘s (1973) work, such as the
emotional intensity and intimacy, are pertinent for the individual-level relationships, but are not
as applicable to the inter-firm alliances (Rowley et al., 2000). Regarding the frequency of
interaction between partners and their level of resource commitment to the relationship, the types
of collaborative arrangements and the safeguarding mechanism seem to be relevant.
There has been a considerable debate within the network literature regarding the relative
benefits of strong ties and weak ties (Hansen, 1999; Levin & Cross, 2004; Nelson, 1989).
Knowledge transfer or knowledge sharing is on a central part of the effects of strength-of-ties.
That is, embedded ties perform unique functions and are characterized by trust, fine-grained
information transfer, and joint problem solving arrangements (Uzzi, 1996). Meanwhile, the
literature provides considerable evidence that the behavior of partners in strong ties is different
from that of partners in weak ties. At the network level, weak ties (when they are also bridge
ties) may be more effective and useful in bringing in novel information (new but not complex) to
a network, while strong ties (when they are connected with a closure) may be more effective in
sharing complex knowledge (Hansen, 1999). Rowley et al. (2000) found that strong ties have
positive effects on firm performance in a rather stable environment, while weak ties have greater
effects in a rather dynamic environment.
36
2.2.3 Role of coopetition in innovation
Gnyawali and Park (2011) noted that, based on the core idea of the dynamic interplay
between collaboration and competition (Chen, 2008; Gnyawali & Madhavan, 2001), coopetition
is considered as a unique strategy that capitalizes on the benefits of collaboration and
competition (Brandenburger & Nalebuff, 1996a; Lado et al., 1997). While cooperation allows
firms access to rare and complementary resources, competition stimulates the search for new
rent-generating combinations of resources, skills, and processes. Therefore, most conceptual
research on coopetition suggested advantageous outcomes. However, there are also potential
drawbacks. The alliance literature suggests that firms may feel a higher level of threat of
opportunism in coopetitive relationships, which will cause negative effects in terms of
transaction costs and stability of the relationships. Further, Bengtsson and Kock (2001, 2008)
argue that coopetition causes the role conflicts at the individual level.
An important inquiry, which is related to the outcomes of coopetition, is how coopetition
could impact innovation in high-tech industries (Dagnino & Rocco, 2009; Gnyawali & Park,
2009) where innovation is critical. Jorde and Teece (1990) argue that cooperation among
competitors is essential if innovating firms are to compete in today‘s global markets. Despite the
importance of the issue, scholars have paid limited attention to empirical examinations of the
impact of coopetition on innovation. Further, the limited empirical studies reported inconsistent
results. Quintana-García and Benavides-Velasco (2004) empirically showed that collaboration
with direct competitors is important not only to acquire new technological knowledge and skills
from the partner, but also to create and access other capabilities based on intensive exploitation
of the existing ones (Gnyawali & Park, 2009). However, a few studies on innovation
performance, approached from general alliances, reported contradictory conclusions. For
37
example, Nieto and Santamaria (2007) reported that firms that established alliances with
competitors (i.e., coopetition) produced the least level of novel innovations, while collaboration
with multiple partners produced the highest level of novel innovations. That is, the authors
categorized the types of partners into the following: 1) collaboration with research organizations
(i.e., universities and technological institutes) exclusively, 2) collaboration with clients
exclusively, 3) collaboration with suppliers exclusively, 4) collaboration with competitors
exclusively, and 5) collaboration with multiple partners. Although this categorization is
necessary for research, it limits our ability to understand the effects of coopetition. That is, if we
consider that the research focus in strategic management has developed from competition to
collaboration (alliance/network) to coopetition, we can assume that many firms establish
alliances with suppliers and/or clients first, before adding competitor partners in their alliance
portfolio. Many firms that are engaged in alliances with competitors may not be involved in
alliances with competitors exclusively, but instead may be also engaged in alliances with other
type (or types) of partners. Therefore, the results should be interpreted cautiously. Recently,
some scholars (e.g., Ritala & Hurmelinna-Laukkanen, 2009) have addressed firm specific factors
(e.g., absorptive capacity) that increase innovation. Even though such studies are necessary,
research on the fundamental relationship between coopetition and innovation should be further
explored first. After that, we may need to explore under what conditions firms might generate
greater innovation performance in coopetitive relationships.
2.2.4 Research gaps in the role of coopetition in innovation
The first gap in the literature addressed in this study concerns the lack of studies and
inconsistent results on the relationship between coopetition and firm innovation performance.
The second gap, which is related to the one above, is the role a firm‘s specific capabilities play in
38
managing coopetition and thus generating superior firm innovation performance. In regard to
these gaps, several measurements are important. First, measures need to be developed to capture
varying degrees of coopetition. Previous empirical research used categorical variables to
examine the effects of coopetition on innovation. Categorical variables are limited if the
relationship between coopetition and innovation is non-linear. As scholars argue that coopetition
has both positive and negative consequences, the relationship between coopetition and
innovation may not be linear. Second, measures of coopetition need to capture the degree of
cooperation. Previous studies used the categorizations of coopetition based only on competition
between partners, ignoring cooperation. We can better understand tension in coopetition when
we consider both competition and cooperation. Third, a critical empirical hurdle in alliance
studies on innovation is that it is really difficult to match innovations directly to the alliances.
Separation of alliance related and non-alliance related innovation is extremely difficult (or
impossible) (Ahuja et al., 2008).
Additional issues are important to better understand the relationship between coopetition
and innovation. As coopetition is a multi-level phenomenon, cross-level research will be
valuable. Also, the effects of coopetition on firm innovation may vary across industries. Thus,
large-scale cross-sectional studies will be valuable for understanding the different effects of
coopetition on firm innovation in different industry contexts. Further, a public policy concern
with coopetition has been the potential for collaborating competitors to engage in collusion that
may hurt innovation as well as consumers‘ welfare (Gnyawali & Park, 2011). To reduce
concerns raised by some economists and policy makers, it is also important to examine
coopetition‘s impact on innovation performance at the industry level.
39
2.3 The Role of Coopetition Tension in Firm Innovation
Coopetition tension refers to the strain that managers or firms feel in coopetitive
relationships. Although coopetition is considered to be a win-win strategy, firms struggle with
the dilemma between the need to work together in order to create value and the temptation to be
opportunistic in order to appropriate a greater share of the created value (Lavie, 2007; Gnyawali
& Park, 2009; Ritala & Hurmelinna-Laukkanen, 2009). Coopetitive relationships thus involve a
high degree of interdependence with each other and are full of conflicts, yet the potential for
payoff is also high (Gnyawali & Park, 2011). Therefore, an important issue in the coopetition
literature is to understand and examine the nature, sources, and roles of tension in coopetition
and how firms can manage the tension to achieve positive outcomes.
The most widely used English dictionaries, including the Oxford and Merriam-Webster,
and online reference, such as Thesaurus, define ―tension‖ in a variety of ways4. Consistent with
them, WordNet Online provides various meanings of ―tension,‖ which are used in various fields,
such as psychology, foreign policy, physics, and art as well as management. In psychology,
tension (the synonym of stress) is ―a state of mental or emotional strain or suspense.‖ Further,
suspense is a feeling of uncertainty and anxiety about the outcome of certain actions, most often
referring to an audience‘s perceptions in a dramatic work. In military or foreign policy, tension
(the synonym of latent hostility) refers to ―feelings of hostility that are not manifest.‖ In art or
literature, tension refers to ―a balance between and interplay of opposing elements or
tendencies.‖ In sum, tension is based on the assumptions of uncertainty and anticipation (or
anxiety), while ―a balance between opposing elements‖ is critical to maintain and control the
4 Consider the following definitions of tension according to these online and offline sources: a) mental or
emotional strain; b) a situation in which there is conflict or strain because of differing views, aims, or
elements; c) inner striving, unrest, or imbalance often with physiological indication of emotion; d) a state
of latent hostility or opposition between individuals or groups; e) barely controlled hostility or a strained
relationship between people or groups; f) a balanced relation between strongly opposing elements.
40
relationship. In the section below, I explain how tension has been studied in the strategic
management literature.
2.3.1 Tension from the risk perspective
Most previous studies regarding tension in management focus on the risks of coopetition,
such as potential competition (feelings of hostility), threat of opportunism (uncertainty), and role
conflicts. In the competition literature, the concept of tension is related to ‗feelings of hostility‘
between and/or toward competitors. The literature discusses different levels of tension, such as
industry- or market-level tension (Porter, 1980), organizational level tension (―competitive
intensity‖ by Ang, 2008; Barnett, 1997), and dyadic level tension (―competitive tension‖ by
Chen et al., 2007). As I focus on competition between partners, ―competitive tension,‖ which is a
firm-dyad-level construct, will be more appropriate in this study. Chen, Su, and Tsai (2007)
define competitive tension as the strain between a focal firm and a given rival that is likely to
result in the firm taking action against the rival. Chen et al. (2007) used the term ―tension‖ rather
than ―threat,‖ ―intensity,‖ or another term because tension describes the state of latent strain that
precipitates the ―breaking point‖ when strain becomes manifest through competitive actions.
Second, tension in the alliance literature is related to the ―threat of opportunism.‖ Although the
TCE literature does not mention explicitly the term ―tension,‖ the ―threat of opportunism‖ is
based on uncertainty as well as asset specificity and frequency (Williamson, 1985). When the
degree of uncertainty is high, firms feel a higher threat from a partner‘s opportunistic behavior.
Finally, such a focus on the risks continues in studying tension in coopetition. Bengtsson and
Kock (2001, 2008) are the only studies that explicitly examine tension in coopetition. Using role
theory, they analyze the tension created as a result of the conflicts. They concentrate on the role
conflicts creating the tension in the relationship that affects the interaction within and between
41
firms. That is, tension develops when individuals within two interacting firms have to
simultaneously play different and conflicting roles or act in accordance with different logics of
interaction (Bengtsson & Kock, 2001). For example, top managers who occupy boundary
positions (e.g., Floyd & Lane, 2000) need to work with individuals and units that cooperate with
the partner firms, with individuals and units that actively compete with the same firm, and with
other actors in the network.
2.3.2 Tension from a balance approach
Studies from the risk (or threat) perspective provide valuable implications, especially for
managing the negative effects of tension. For example, firms take a stronger governance mode
when the threat of opportunism is high than they do when the threat of opportunism is low.
However, the risk-focus approach cannot reflect the positive side of tension. In this regard, some
scholars (e.g., Das & Teng, 2000) in alliance literature adopt the notion of tension as a balance
between opposing elements, which can lead to the most positive results. That is, partners should
balance the contradictory forces to secure the original arrangement and prevent the alliance from
an unplanned dissolution. Miles and Snow (1992) suggest that one key reason many network
organizations fail is that the firms tend toward unbalanced relationships, usually by leaning
toward too much control or modification. Ring and Van de Ven (1994) propose a framework of
alliance making that consists of successive stages propelled by interactive components such as
efficiency and equity. By integrating previous works, Das and Teng (2000) provide a theoretical
foundation on the role of tension in an alliance. Das and Teng (2000) suggest an internal tension
perspective of strategic alliances comprised of three pairs of competing forces – cooperation vs.
competition, rigidity vs. flexibility, and short-term vs. long-term. Although the authors argue that
the tension from the simultaneous existence of cooperation and competition between the partners
42
is an important characteristic of strategic alliances, the rationale of internal tension was not
empirically examined.
2.3.3 Tension from a paradox perspective
In addition to the balancing strategy discussed above, a new approach toward tension in
coopetition is based on the paradox perspective, and, specifically, the ―transparadox‖ (or the
Chinese ―middle way‖ perspective). Paradox is an important concept in understanding the
tension in coopetition because paradox is argued as a fundamental source of tension. Further, a
―paradoxical‖ relationship seems to be the term that scholars most often use to describe
coopetition (e.g., Chen, 2008). ―Paradox denotes contradictory yet interrelated elements ··· that
seem logical in isolation but absurd and irrational when appearing simultaneously‖ (Lewis, 2000:
760). According to this definition, the most salient characteristic of a paradox is its contradictory
nature. The paradox approach has been emphasized to understand the complex and often
juxtaposed firm behavior (Quinn & Cameron, 1988). Thus, how to manage paradox has long
been the subject of philosophical and organizational inquiry (Chen, 2008).
Integrating the paradox perspective and the balancing strategy, scholars (e.g., Chen,
2008; Lewis, 2000) suggest the transparadox perspective, based on the Chinese ―middle way‖
philosophy, to understand the tension in a paradoxical relationship. Lewis (2000) addresses the
limitation of paradox within an either/or (or independent opposites) framework by encouraging
researchers to ―transcend‖ paradox. Building on Lewis (2000), Chen (2008) proposes a new
concept, transparadox, a hybrid of the either/or and both/and perspectives that characterize,
respectively, Western and Eastern thought. The Chinese ―middle way‖ philosophy, with its
emphasis on balance and the integration of opposites, offers promise for enriching the
conventional Western conceptions of paradox (Chen, 2002, 2008). Thus, ―middle way‖ thinking
43
allows opposites to be viewed as interdependent entities that together form a totality and thus
offers a ―transcending‖ conceptualization of the relationship between two seemingly conflicting
entities. Chen (2002, 2008) identified two principal tenets of the ―middle way‖ perspective. The
first tenet is holism – the idea of self-other integration in which ‗self‘ and ‗other‘ are
interdependent opposites that can only be defined as a pair. The other pillar of the middle way is
paradox, which is best symbolized by the well-known yin/yang image in which opposites are
contained within it and together form a dynamic unity. In the transparadox perspective, based on
the ―Chinese middle way‖ philosophy, two opposites may be interdependent in nature and
together form a totality (Chen, 2002). Interdependent opposites refer to the concepts/entities that
exist only within the context of each other, or which find their definition only in terms of that of
their opposites (Chen, 2008).
2.3.4 Research gaps in the role of coopetition tension in firm innovation
While tension is paramount in coopetition, there is no empirical study on tension in
coopetition. Further, most previous studies that studied tension did so from a risk perspective.
Some scholars suggest that the balancing strategy and transparadox perspective are necessary to
understand and manage coopetition. However, there was no empirical study to support their
arguments. Building on the balancing strategy and transparadox perspective, it will be valuable
to develop and test how the balance of paradoxical factors in coopetition can influence firm
innovation.
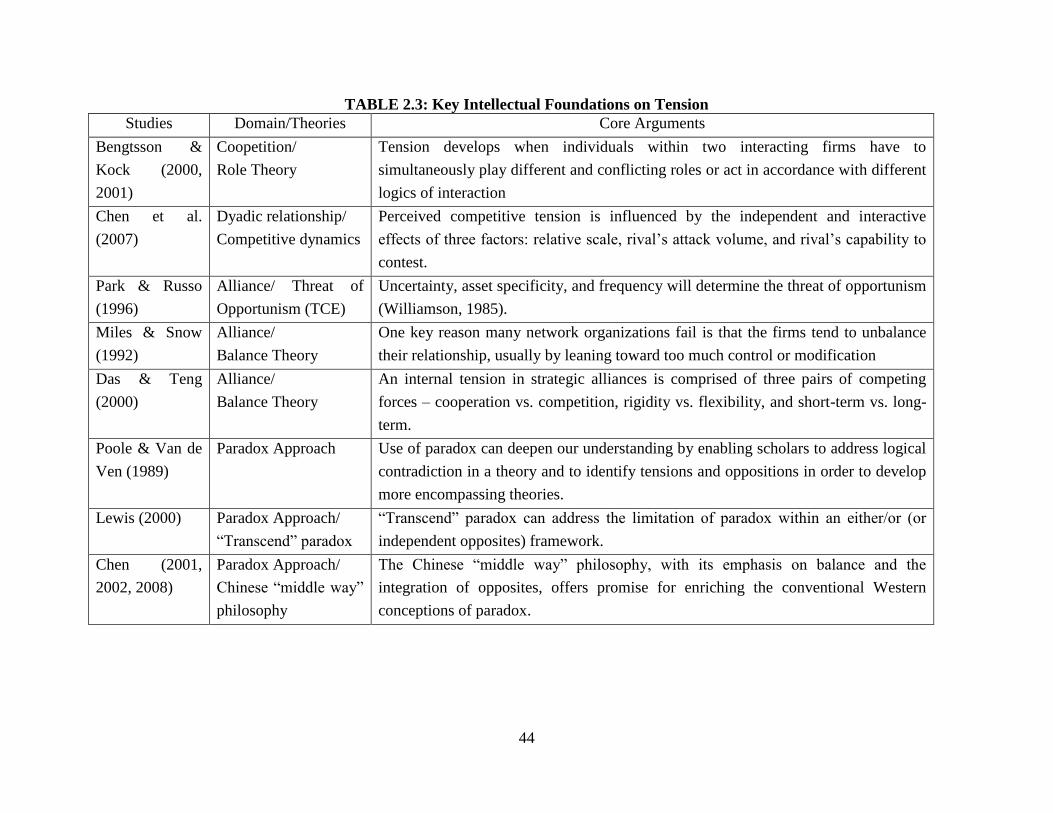
44
TABLE 2.3: Key Intellectual Foundations on Tension
Studies Domain/Theories Core Arguments
Bengtsson &
Kock (2000,
2001)
Coopetition/
Role Theory
Tension develops when individuals within two interacting firms have to
simultaneously play different and conflicting roles or act in accordance with different
logics of interaction
Chen et al.
(2007)
Dyadic relationship/
Competitive dynamics
Perceived competitive tension is influenced by the independent and interactive
effects of three factors: relative scale, rival‘s attack volume, and rival‘s capability to
contest.
Park & Russo
(1996)
Alliance/ Threat of
Opportunism (TCE)
Uncertainty, asset specificity, and frequency will determine the threat of opportunism
(Williamson, 1985).
Miles & Snow
(1992)
Alliance/
Balance Theory
One key reason many network organizations fail is that the firms tend to unbalance
their relationship, usually by leaning toward too much control or modification
Das & Teng
(2000)
Alliance/
Balance Theory
An internal tension in strategic alliances is comprised of three pairs of competing
forces – cooperation vs. competition, rigidity vs. flexibility, and short-term vs. long-
term.
Poole & Van de
Ven (1989)
Paradox Approach Use of paradox can deepen our understanding by enabling scholars to address logical
contradiction in a theory and to identify tensions and oppositions in order to develop
more encompassing theories.
Lewis (2000) Paradox Approach/
―Transcend‖ paradox
―Transcend‖ paradox can address the limitation of paradox within an either/or (or
independent opposites) framework.
Chen (2001,
2002, 2008)
Paradox Approach/
Chinese ―middle way‖
philosophy
The Chinese ―middle way‖ philosophy, with its emphasis on balance and the
integration of opposites, offers promise for enriching the conventional Western
conceptions of paradox.
45
2.4 The Role of a Firm’s Dynamic Capabilities in Firm Innovation
2.4.1 Dynamic capabilities
Dynamic capabilities refer to the firm‘s ability to integrate, build, and reconfigure
internal and external competences – to address rapidly changing environments (Teece, Pisano, &
Shuan 1997). The literature distinguishes dynamic capabilities from operational capabilities in
two ways. First, while operational capabilities enable an organization to earn a living in the
present (Winter, 2003), dynamic capabilities concern change (Helfat, Finkelstein, Mitchell,
Peteraf, Singh, Teece, & Winter, 2007). To survive and prosper under conditions of change,
firms must develop the ―dynamic capabilities‖ to create, extend, and modify the ways in which
they make their living (Helfat et al., 2007). Second, scholars (e.g., Helfat & Peteraf, 2003;
Winter, 2003) make a distinction between first-order operational capabilities (e.g., market and
technological capabilities) that a firm needs for its operations and the second-order dynamic
capabilities that a firm needs for changing operational routines. Dynamic capabilities are second-
or higher-order capabilities that make it possible to learn about new domains, create new asset
combinations and build new capabilities (Ellonen, Wikström & Jantunen, 2009; Wang &
Ahmed, 2007).
The concept of dynamic capabilities has been extended by several scholars. Teece et al.
(1997) propose three organizational and managerial processes – coordination/integrating,
learning, and reconfiguring – as core elements of dynamic capabilities. According to Teece
(2009), dynamic capabilities refer to the firm‘s ability to sense, seize, and adapt to generate and
exploit internal and external firm-specific competencies, and to address the firm‘s changing
environment. ―Sensing‖ capabilities denote the firm‘s activities in scanning and monitoring
changes in operating environments and identifying new opportunities and threats. ―Seizing‖
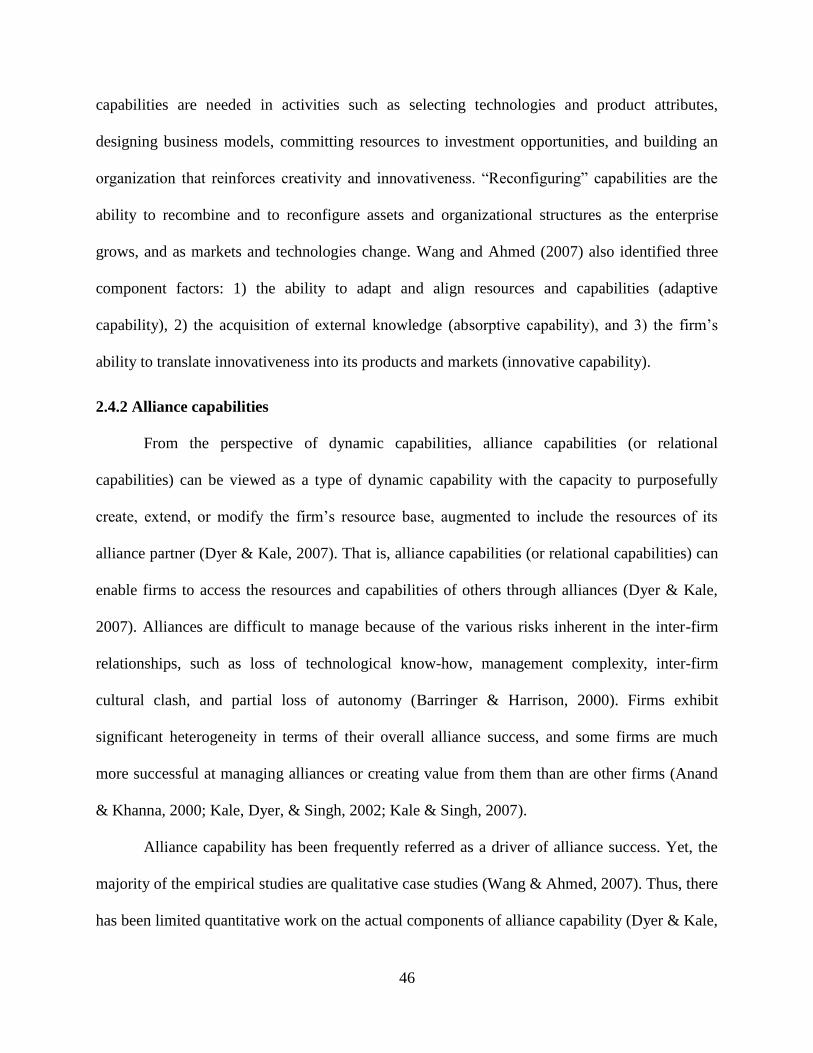
46
capabilities are needed in activities such as selecting technologies and product attributes,
designing business models, committing resources to investment opportunities, and building an
organization that reinforces creativity and innovativeness. ―Reconfiguring‖ capabilities are the
ability to recombine and to reconfigure assets and organizational structures as the enterprise
grows, and as markets and technologies change. Wang and Ahmed (2007) also identified three
component factors: 1) the ability to adapt and align resources and capabilities (adaptive
capability), 2) the acquisition of external knowledge (absorptive capability), and 3) the firm‘s
ability to translate innovativeness into its products and markets (innovative capability).
2.4.2 Alliance capabilities
From the perspective of dynamic capabilities, alliance capabilities (or relational
capabilities) can be viewed as a type of dynamic capability with the capacity to purposefully
create, extend, or modify the firm‘s resource base, augmented to include the resources of its
alliance partner (Dyer & Kale, 2007). That is, alliance capabilities (or relational capabilities) can
enable firms to access the resources and capabilities of others through alliances (Dyer & Kale,
2007). Alliances are difficult to manage because of the various risks inherent in the inter-firm
relationships, such as loss of technological know-how, management complexity, inter-firm
cultural clash, and partial loss of autonomy (Barringer & Harrison, 2000). Firms exhibit
significant heterogeneity in terms of their overall alliance success, and some firms are much
more successful at managing alliances or creating value from them than are other firms (Anand
& Khanna, 2000; Kale, Dyer, & Singh, 2002; Kale & Singh, 2007).
Alliance capability has been frequently referred as a driver of alliance success. Yet, the
majority of the empirical studies are qualitative case studies (Wang & Ahmed, 2007). Thus, there
has been limited quantitative work on the actual components of alliance capability (Dyer & Kale,
47
2007). Alliance capabilities that scholars have examined include alliance experience, a dedicated
alliance function, and an alliance learning process. First, much of the work on alliance capability
focuses on alliance experience as a key source of alliance management capability. For example,
Anand and Khanna (2000) show that firms having greater alliance experience can develop
alliance capabilities and have greater overall alliance success. This line of research suggests that
alliance management capability is a path-dependent capability accumulated from a firm‘s
previous alliance experience (Rothaermel & Deeds, 2006). Hoang and Rothaermel (2005) found
that the general alliance experience of the biotechnology partners is positively related to alliance
project performance, while relation-specific experience has a negative effect on alliance project
performance. Second, another focus was on a dedicated alliance function. Firms with a dedicated
alliance function, which oversees and coordinates a firm‘s overall alliance activity, have greater
alliance success (Kale et al., 2002). Finally, learning is a key part of alliance capability. Kale and
Singh (2007) show that an alliance learning process that involves articulation, codification,
sharing, and internalization of alliance management know-how is positively related to a firm‘s
overall alliance success.
2.4.3 Research gaps in the role of dynamic capabilities in firm innovation
Although coopetition is considered a dynamic relationship, there has been a lack of
attention to dynamic capabilities in the coopetition literature. In the alliance capability literature,
scholars found that firms with greater alliance experience and those that create a dedicated
alliance function realize greater success with alliances (Anand & Khanna, 2000; Kale et al.,
2002). As coopetition is unique and more challenging than are general alliances, a dedicated unit
seems more critical. However, it is necessary to examine the effects of those factors in the
coopetitive relationships. Further, there was no attempt to examine the moderating role of
48
alliance experience on the relationship between coopetition and innovation. Regarding the
organizational structure perspective, dynamic capability literature (e.g., Teece, 2009) suggests
that decentralization or considerable autonomy is necessary to adapt to rapidly changing
environments. Thus, it is necessary to link a dedicated alliance function for
integration/coordination with individual units having high autonomy for flexibility/adaptation.
While the importance of coopetition capability was acknowledged (e.g., Gnyawali & Park,
2011), the concept was not fully developed and its effect on firm outcome was not examined.
Thus, it is necessary to develop the concept and measures of coopetition capability and conduct
an empirical examination.
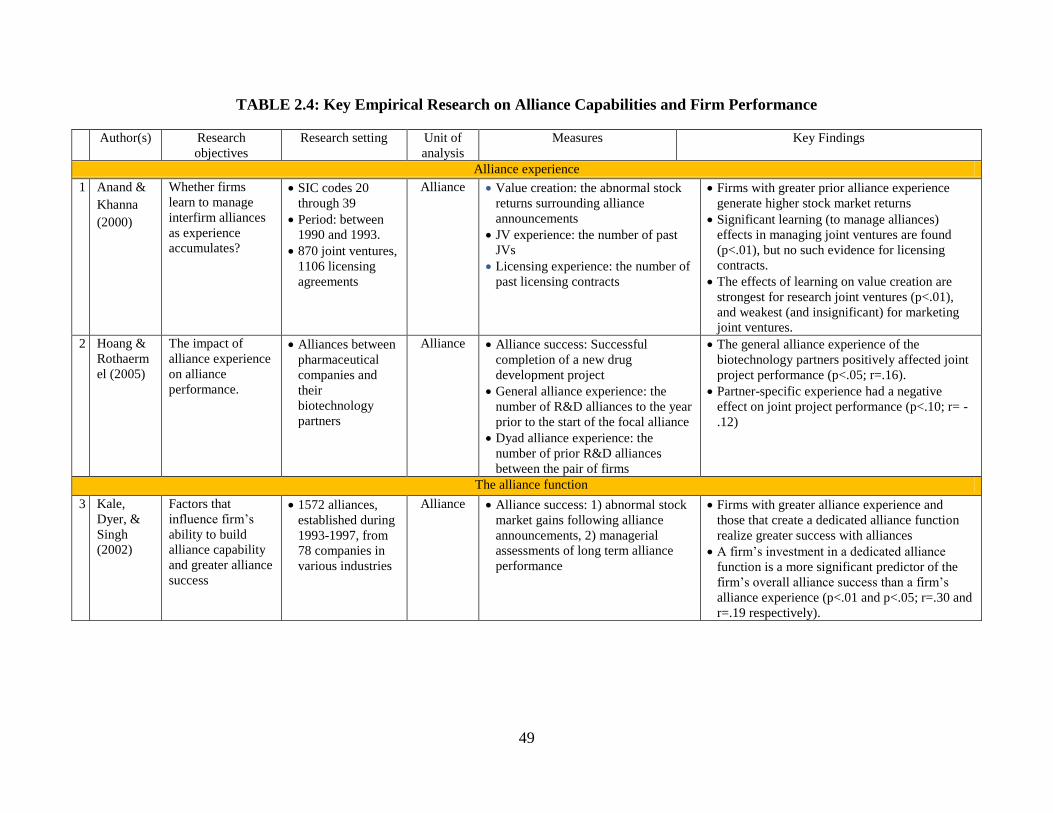
49
TABLE 2.4: Key Empirical Research on Alliance Capabilities and Firm Performance
Author(s) Research
objectives
Research setting Unit of
analysis
Measures Key Findings
Alliance experience
1 Anand &
Khanna
(2000)
Whether firms
learn to manage
interfirm alliances
as experience
accumulates?
SIC codes 20
through 39
Period: between
1990 and 1993.
870 joint ventures,
1106 licensing
agreements
Alliance Value creation: the abnormal stock
returns surrounding alliance
announcements
JV experience: the number of past
JVs
Licensing experience: the number of
past licensing contracts
Firms with greater prior alliance experience
generate higher stock market returns
Significant learning (to manage alliances)
effects in managing joint ventures are found
(p<.01), but no such evidence for licensing
contracts.
The effects of learning on value creation are
strongest for research joint ventures (p<.01),
and weakest (and insignificant) for marketing
joint ventures.
2 Hoang &
Rothaerm
el (2005)
The impact of
alliance experience
on alliance
performance.
Alliances between
pharmaceutical
companies and
their
biotechnology
partners
Alliance Alliance success: Successful
completion of a new drug
development project
General alliance experience: the
number of R&D alliances to the year
prior to the start of the focal alliance
Dyad alliance experience: the
number of prior R&D alliances
between the pair of firms
The general alliance experience of the
biotechnology partners positively affected joint
project performance (p<.05; r=.16).
Partner-specific experience had a negative
effect on joint project performance (p<.10; r= -
.12)
The alliance function
3 Kale,
Dyer, &
Singh
(2002)
Factors that
influence firm‘s
ability to build
alliance capability
and greater alliance
success
1572 alliances,
established during
1993-1997, from
78 companies in
various industries
Alliance Alliance success: 1) abnormal stock
market gains following alliance
announcements, 2) managerial
assessments of long term alliance
performance
Firms with greater alliance experience and
those that create a dedicated alliance function
realize greater success with alliances
A firm‘s investment in a dedicated alliance
function is a more significant predictor of the
firm‘s overall alliance success than a firm‘s
alliance experience (p<.01 and p<.05; r=.30 and
r=.19 respectively).
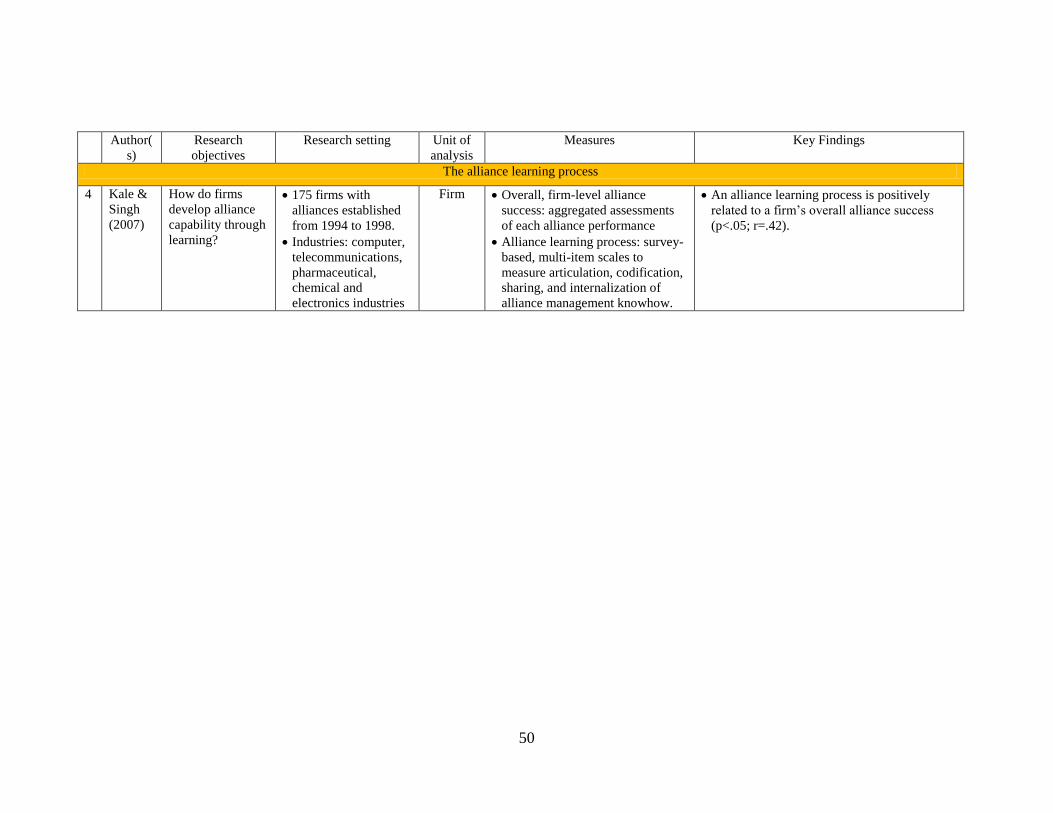
50
Author(
s)
Research
objectives
Research setting Unit of
analysis
Measures Key Findings
The alliance learning process
4 Kale &
Singh
(2007)
How do firms
develop alliance
capability through
learning?
175 firms with
alliances established
from 1994 to 1998.
Industries: computer,
telecommunications,
pharmaceutical,
chemical and
electronics industries
Firm Overall, firm-level alliance
success: aggregated assessments
of each alliance performance
Alliance learning process: survey-
based, multi-item scales to
measure articulation, codification,
sharing, and internalization of
alliance management knowhow.
An alliance learning process is positively
related to a firm‘s overall alliance success
(p<.05; r=.42).

51
3. CONCEPTUAL DEVELOPMENT AND HYPOTHESES
In this chapter, I develop the conceptual framework that provides the foundation of the
model‘s empirical testing. First, I identify the typology of coopetition based on the intensities of
competition and cooperation between partners. Following Luo (2007a), I create a 2 x 2 matrix
that provides concrete factors to determine the intensity of coopetition. Second, I discuss the
composition of the value that a firm creates and appropriates in a coopetition relationship.
Further, I discuss a key locus of tension in coopetition – knowledge sharing versus knowledge
protection. In the following section, I discuss the conceptual model. Last, I develop the testable
hypotheses related to coopetition and its effects on innovation, and the moderating role of
coopetition capabilities.
3.1 Coopetition, Coopetition Tension, and Their Roles in Firm Innovation
In this section, I attempt to advance our understanding of the effects of the varying
degrees of coopetition and the tension in coopetition on firm innovation performance.
3.1.1 Typology of coopetition
The impact of coopetition on firm innovation has remained largely unexplored and the
research reports mixed results, which may partly stem from the limitation of previous studies that
operationalized coopetition. While the measures of the degree of competition are too broad (e.g.,
4-digit SIC codes) or too narrow (e.g., identified as key competitors in annual reports), the
degree of collaboration has been ignored. To address this issue, I note that some scholars (e.g.,
Luo, 2007a) provide the typologies that consider both competition and cooperation even though
the typologies have not been operationalized in empirical research. Luo (2007a) notes that using
typologies allows us to further discuss strategic responses in different coopetition situations and
provides a valuable approach for understanding the intensity of coopetition in order to describe
52
the varying degrees of collaboration and competition between a pair rivals. Building on Luo‘s
(2007a) typology, I develop a 2x2 matrix (Figure 3.1) that is composed of cooperation-dominant
coopetition (Type A), balanced strong coopetition (Type B), weak coopetition (Type C), and
competition-dominant coopetition (Type D).
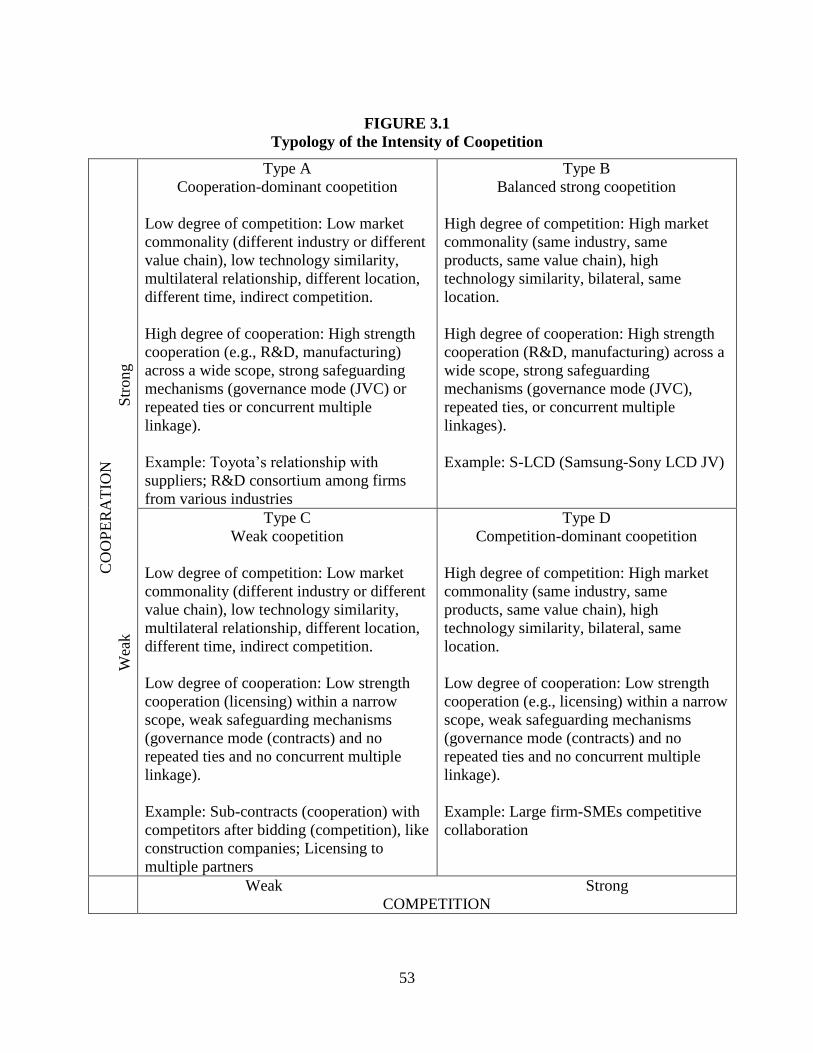
53
FIGURE 3.1
Typology of the Intensity of Coopetition
CO
OP
ER
AT
ION
Wea
k
S
trong
Type A
Cooperation-dominant coopetition
Low degree of competition: Low market
commonality (different industry or different
value chain), low technology similarity,
multilateral relationship, different location,
different time, indirect competition.
High degree of cooperation: High strength
cooperation (e.g., R&D, manufacturing)
across a wide scope, strong safeguarding
mechanisms (governance mode (JVC) or
repeated ties or concurrent multiple
linkage).
Example: Toyota‘s relationship with
suppliers; R&D consortium among firms
from various industries
Type B
Balanced strong coopetition
High degree of competition: High market
commonality (same industry, same
products, same value chain), high
technology similarity, bilateral, same
location.
High degree of cooperation: High strength
cooperation (R&D, manufacturing) across a
wide scope, strong safeguarding
mechanisms (governance mode (JVC),
repeated ties, or concurrent multiple
linkages).
Example: S-LCD (Samsung-Sony LCD JV)
Type C
Weak coopetition
Low degree of competition: Low market
commonality (different industry or different
value chain), low technology similarity,
multilateral relationship, different location,
different time, indirect competition.
Low degree of cooperation: Low strength
cooperation (licensing) within a narrow
scope, weak safeguarding mechanisms
(governance mode (contracts) and no
repeated ties and no concurrent multiple
linkage).
Example: Sub-contracts (cooperation) with
competitors after bidding (competition), like
construction companies; Licensing to
multiple partners
Type D
Competition-dominant coopetition
High degree of competition: High market
commonality (same industry, same
products, same value chain), high
technology similarity, bilateral, same
location.
Low degree of cooperation: Low strength
cooperation (e.g., licensing) within a narrow
scope, weak safeguarding mechanisms
(governance mode (contracts) and no
repeated ties and no concurrent multiple
linkage).
Example: Large firm-SMEs competitive
collaboration
Weak Strong
COMPETITION
54
3.1.2 Coopetition-based innovation performance
Value creation and value appropriation are central to coopetition. That is, coopetition
means cooperating to create a bigger business ―pie‖ while competing to divide it up
(Brandenburger & Nalebuff, 1996). Although Lavie (2007) argues that knowledge of the logic of
both value creation and value appropriation is necessary to understand how a firm can benefit
and gain competitive advantage from inter-firm collaboration, Gnyawali et al. (2008) point out
that the separation of these processes is even more pronounced in the case of coopetition. Despite
the importance of the logic of value creation and value appropriation in coopetition, the value
composition that is created and appropriated in coopetition has not been systematically
examined. In regard to this topic, Khanna et al. (1998) introduced the valuable logic of ―common
benefits vs. private benefits.‖ Luo (2007a) points out that ―establishing an alliance with
competitors emphasizes cooperation only, and its unit of analysis is the alliance itself rather than
the parent organizations. Therefore, they cannot reflect the effects of comprehensive competition
on a diverse list of products between rivals‖ (p.130). His argument implies that the effects of
coopetition can happen not only within the alliance boundaries but also beyond them. Kumar
(2010) explores the effects of common benefits (including synergies) based on cooperative
behavior versus private benefits based on non-cooperative behavior. He reports that the stock
market perceives JVs to be positive sum games (common benefits are dominant in JVs) rather
than zero sum games (private benefits are dominant in JVs).
Building on their arguments, I contend that the value creation and appropriation in
coopetition can be derived from a more complex process. The difference lies in that, while they
consider private benefits to be based on non-cooperative behavior, I suggest that private benefits
can be from both cooperation and competition. On the one hand, private benefits can be based on
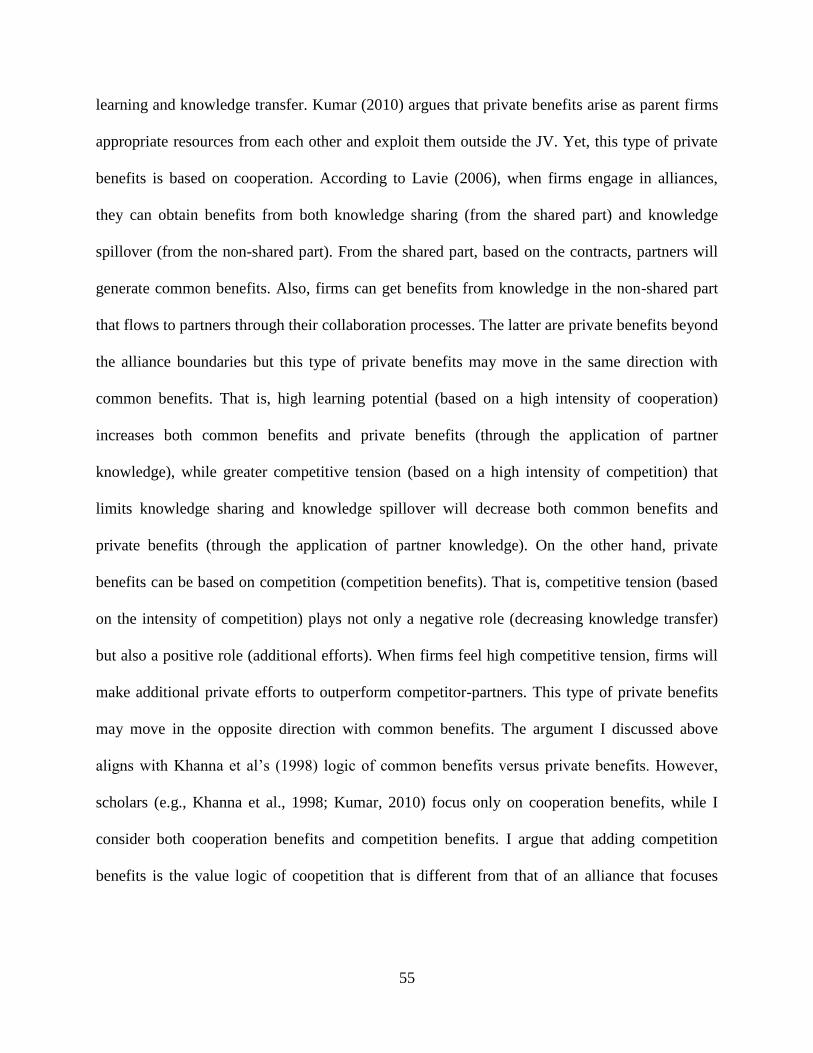
55
learning and knowledge transfer. Kumar (2010) argues that private benefits arise as parent firms
appropriate resources from each other and exploit them outside the JV. Yet, this type of private
benefits is based on cooperation. According to Lavie (2006), when firms engage in alliances,
they can obtain benefits from both knowledge sharing (from the shared part) and knowledge
spillover (from the non-shared part). From the shared part, based on the contracts, partners will
generate common benefits. Also, firms can get benefits from knowledge in the non-shared part
that flows to partners through their collaboration processes. The latter are private benefits beyond
the alliance boundaries but this type of private benefits may move in the same direction with
common benefits. That is, high learning potential (based on a high intensity of cooperation)
increases both common benefits and private benefits (through the application of partner
knowledge), while greater competitive tension (based on a high intensity of competition) that
limits knowledge sharing and knowledge spillover will decrease both common benefits and
private benefits (through the application of partner knowledge). On the other hand, private
benefits can be based on competition (competition benefits). That is, competitive tension (based
on the intensity of competition) plays not only a negative role (decreasing knowledge transfer)
but also a positive role (additional efforts). When firms feel high competitive tension, firms will
make additional private efforts to outperform competitor-partners. This type of private benefits
may move in the opposite direction with common benefits. The argument I discussed above
aligns with Khanna et al‘s (1998) logic of common benefits versus private benefits. However,
scholars (e.g., Khanna et al., 1998; Kumar, 2010) focus only on cooperation benefits, while I
consider both cooperation benefits and competition benefits. I argue that adding competition
benefits is the value logic of coopetition that is different from that of an alliance that focuses
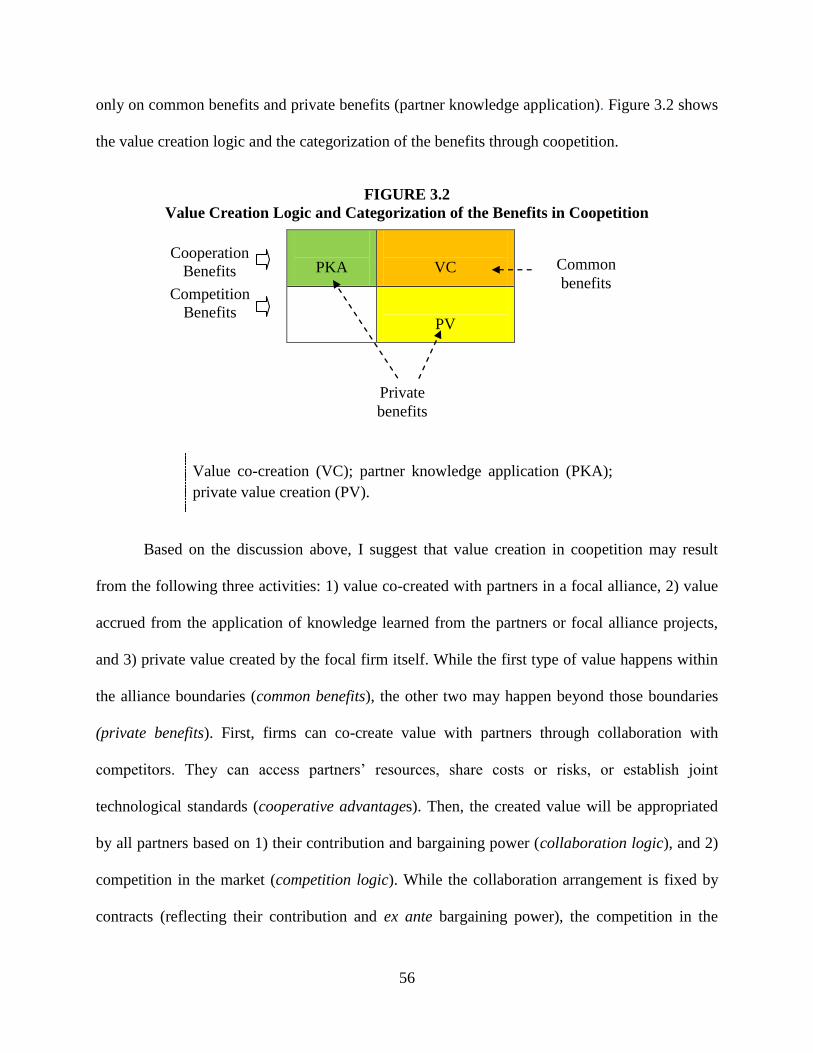
56
only on common benefits and private benefits (partner knowledge application). Figure 3.2 shows
the value creation logic and the categorization of the benefits through coopetition.
FIGURE 3.2
Value Creation Logic and Categorization of the Benefits in Coopetition
PKA
VC
PV
Value co-creation (VC); partner knowledge application (PKA);
private value creation (PV).
Based on the discussion above, I suggest that value creation in coopetition may result
from the following three activities: 1) value co-created with partners in a focal alliance, 2) value
accrued from the application of knowledge learned from the partners or focal alliance projects,
and 3) private value created by the focal firm itself. While the first type of value happens within
the alliance boundaries (common benefits), the other two may happen beyond those boundaries
(private benefits). First, firms can co-create value with partners through collaboration with
competitors. They can access partners‘ resources, share costs or risks, or establish joint
technological standards (cooperative advantages). Then, the created value will be appropriated
by all partners based on 1) their contribution and bargaining power (collaboration logic), and 2)
competition in the market (competition logic). While the collaboration arrangement is fixed by
contracts (reflecting their contribution and ex ante bargaining power), the competition in the
Cooperation
Benefits
benefits
Common
benefits
Private
benefits
Competition
Benefits
benefits
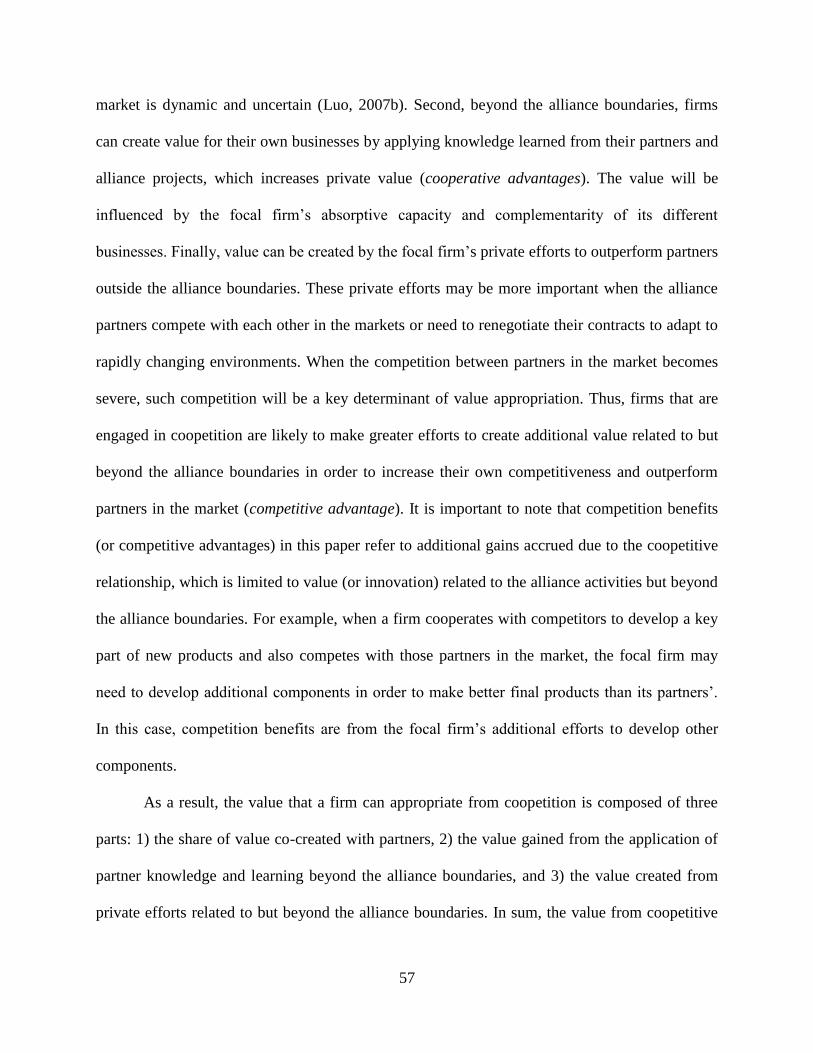
57
market is dynamic and uncertain (Luo, 2007b). Second, beyond the alliance boundaries, firms
can create value for their own businesses by applying knowledge learned from their partners and
alliance projects, which increases private value (cooperative advantages). The value will be
influenced by the focal firm‘s absorptive capacity and complementarity of its different
businesses. Finally, value can be created by the focal firm‘s private efforts to outperform partners
outside the alliance boundaries. These private efforts may be more important when the alliance
partners compete with each other in the markets or need to renegotiate their contracts to adapt to
rapidly changing environments. When the competition between partners in the market becomes
severe, such competition will be a key determinant of value appropriation. Thus, firms that are
engaged in coopetition are likely to make greater efforts to create additional value related to but
beyond the alliance boundaries in order to increase their own competitiveness and outperform
partners in the market (competitive advantage). It is important to note that competition benefits
(or competitive advantages) in this paper refer to additional gains accrued due to the coopetitive
relationship, which is limited to value (or innovation) related to the alliance activities but beyond
the alliance boundaries. For example, when a firm cooperates with competitors to develop a key
part of new products and also competes with those partners in the market, the focal firm may
need to develop additional components in order to make better final products than its partners‘.
In this case, competition benefits are from the focal firm‘s additional efforts to develop other
components.
As a result, the value that a firm can appropriate from coopetition is composed of three
parts: 1) the share of value co-created with partners, 2) the value gained from the application of
partner knowledge and learning beyond the alliance boundaries, and 3) the value created from
private efforts related to but beyond the alliance boundaries. In sum, the value from coopetitive
58
relationships depends on the benefits of both cooperation and competition, and a firm‘s learning
capability and knowledge management. The value creation and value appropriation through
coopetition can be summarized as follows:
FIGURE 3.3
Composition of Value Created and Appropriated in Coopetition
PKAA VCA VCB PKAB
PVA PVB
Value for Firm A Value for Firm B
Value Creation = value co-creation (VC) + partner knowledge application (PKA) + private
value creation (PV)
o Value co-creation (within the alliance boundaries) = VCA + VCB
o Partner knowledge application (beyond the alliance boundaries) = PKAA + PKAB
o Private value creation (related to but beyond the alliance boundaries) = PVA + PVB
Value appropriation (individual partner) = share of co-created value (within the alliance
boundaries) + value from partner knowledge application (beyond the alliance boundaries) +
value created from private efforts (related to but beyond the alliance boundaries)
o Value appropriation (Firm A) = VCA + PKAA + PVA
o Value appropriation (Firm B) = VCB + PKAB + PVB
3.1.3 Locus of tension – Knowledge sharing versus knowledge protection
A key locus of tension in coopetition is the dilemma between knowledge sharing and
knowledge protection. That is, the fundamental dilemma of alliances, including coopetition, is
that firms need to adopt various practices to facilitate knowledge transfer in order to create value
59
(Heiman & Nickerson, 2004). The paradox is that the knowledge that is shared in the course of
collaboration can be used in both cooperation and competition (Baumard, 2009; Ritala &
Hurmelinna-Laukkanen, 2009). Deploying practices to facilitate knowledge transfer may
increase the likelihood that economically valuable knowledge, which is beyond the scope of the
collaboration and difficult to protect legally, is expropriated (Heiman & Nickerson, 2004).
The tension in knowledge sharing and protection will be affected by the types of
collaborative arrangements and by the safeguarding mechanisms. That is, when coopetition is
involved in stronger types of collaboration (e.g., manufacturing or R&D), firms are more likely
to adapt practices, such as co-location, that promote the transfer of knowledge. Further, working
together with the employees from partner firms on a regular basis makes possible the transfer of
knowledge not directly relevant to the stated goals of the collaboration. Although some
knowledge may be legally protected (e.g., patents or contracts), much knowledge remains
unprotectable and thus is subject to potential expropriation by collaborators (Heiman &
Nickerson, 2004). Heiman and Nickerson (2004) argue that increasing knowledge transparency
via knowledge management practices (e.g., the use of high-bandwidth communication channels
and co-specialized communication codes) may give rise to opportunistic hazards. Thus, it is
critical for firms to understand how to manage the transfer of agreed-upon knowledge in their
collaborations while avoiding the expropriation of other, not-agreed-upon, yet economically
valuable knowledge (Heiman & Nickerson, 2004).
Meanwhile, such dilemmas tend to be of great concern when partners are direct
competitors; their markets are common and their resources are very similar (the intensity of
competition is high). Resource similarity offers two countervailing effects. On the one hand,
resource similarity increases the likelihood of scanning and monitoring for external resources,
60
accessing and acquiring external resources, and leveraging these resources for competitive
advantage (Cohen & Levinthal, 1990; Lane & Lubatkin, 1998; Mowery et al., 1996). If the focal
firm and its partners have high technological overlap, they are more likely to be aware of the
value of a partner‘s knowledge and have greater motivation to learn from them. Emden,
Calantone, and Droge (2006) argue that overlapping knowledge provides the necessary common
ground among partners to realize a technology‘s potential and to communicate with each other.
Further, the more experience the firms have in solving similar types of problems, the easier it
will be for the focal firm to find ways to apply the newly assimilated knowledge (Lane &
Lubatkin, 1998). As the relative absorptive capacity between competitors tends to be high,
partners in coopetition can quickly acquire knowledge from each other, and quickly apply it to
their projects or markets (Gnyawali & Park, 2009; Ritala & Hurmelinna-Laukkanen, 2009). In
addition, scholars suggest that similarity in partner firms‘ knowledge and knowledge-processing
systems enhances new learning and learning abilities (Lane & Lubatkin, 1998; Mowery et al.,
1996). On the other hand, high resource similarity between the focal firm and its partners
suggests that the firms feel high competitive tension (Chen et al., 2007) because competition will
eventually follow the joint creation of innovation. Then, firms‘ motivation or willingness to
transfer knowledge will be decreased because the firms will become more concerned about
partners‘ opportunistic behavior and unintended knowledge leakage. Firms may make extra
efforts to protect the knowledge. Therefore, the focal firm is less likely to access, acquire, and
leverage knowledge from its alliance partners.
As a result, when the degrees of both competition and collaboration are high, firms have
higher capabilities and greater motivation to learn from partners. In such a context, however,
willingness to transfer knowledge to partners may not be high and firms often make extra efforts
61
to protect against knowledge leakage. If a firm does not understand the dilemma or the dilemma
is not well managed, the value created from the collaboration through knowledge transfer may
possibly be eclipsed by the value of the knowledge expropriated – a loss in competitive
advantage may result. However, when willingness and ability are conflicting, the willingness
becomes more critical than the ability (Srivastava & Gnyawali, in press). Since reciprocity is
expected in alliances (Hansen, 1999), if a firm protects their knowledge, partners will respond by
instituting their own safeguards and barriers to protect their core resources. With the barriers on
both sides and intensified value tension, the resource flows get adversely affected (Heiman &
Nickerson, 2004; Norman, 2002; Srivastava & Gnyawali, in press). Thus, a real possibility is that
participating firms may tightly control knowledge to protect their core knowledge, which will
adversely affect knowledge flow that is critical for creating value, including innovation. Another
possible outcome is that an adversarial partner firm can at any moment disrupt a coopetition
relationship.
3.1.4 Coopetition capability
Teece et al. (1997) emphasize the importance of dynamic capabilities, i.e., a firm‘s ability
to integrate, build, and reconfigure internal and external competencies, to address rapidly
changing environments. Based on the notion of dynamic capability, I define coopetition
capability as ―accumulated managerial competencies regarding how to manage a firm‘s
coopetitive ties.‖ I define coopetition capability separately from general dynamic capability
because managing coopetition is a much more challenging task than managing general alliances.
Coopetition is dynamic in nature (Luo, 2007b) and is highly uncertain in terms of both
environment and a partner‘s behavior. Further, the ratio between competition and cooperation
changes across the stages of technological development. Thus, to generate greater innovation
62
performance in a coopetitive relationship, it is not enough to simply balance competition and
cooperation at the beginning of the alliance, but the firm must also have the capabilities to
manage a balanced relationship throughout the alliance lifecycle. Specifically, success in
coopetition requires many abilities – 1) to scan the environment for coopetition opportunities, 2)
to select partners with caution, 3) to coordinate conflicts within the firm and between partners, 4)
to estimate the evolving costs and benefits of coopetition, 5) to make necessary adjustments to
the cooperation-competition ratio, and 6) to maintain the bargaining power balance. The
capabilities to achieve these tasks are related not only to the logic of dynamic capabilities but
also to the unique characteristics of coopetition. As a result, although the fundamental dynamic
capabilities will apply to coopetition, firms may need more and unique capabilities to manage
tension from the dynamic and paradoxical factors inherent in coopetition.
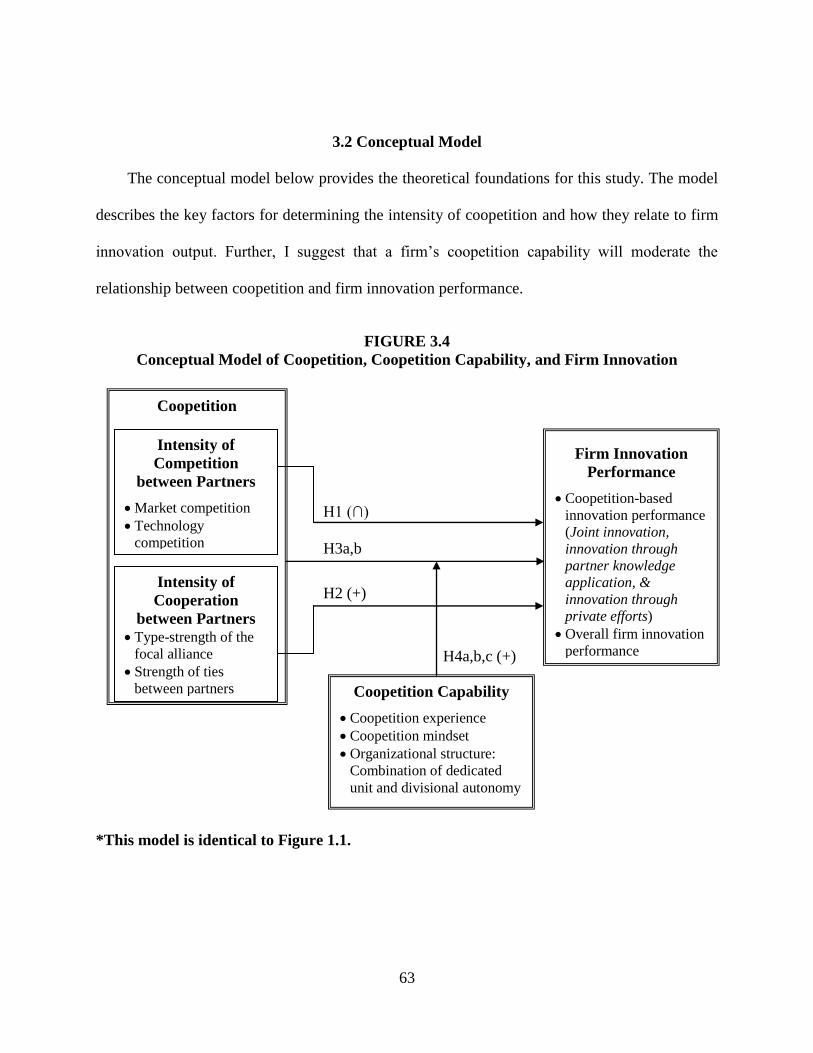
63
3.2 Conceptual Model
The conceptual model below provides the theoretical foundations for this study. The model
describes the key factors for determining the intensity of coopetition and how they relate to firm
innovation output. Further, I suggest that a firm‘s coopetition capability will moderate the
relationship between coopetition and firm innovation performance.
FIGURE 3.4
Conceptual Model of Coopetition, Coopetition Capability, and Firm Innovation
H1 (∩)
H3a,b
H2 (+)
H4a,b,c (+)
*This model is identical to Figure 1.1.
Coopetition
Intensity of
Cooperation
between Partners
Type-strength of the
focal alliance
Strength of ties
between partners
Intensity of
Competition
between Partners
Market competition
Technology
competition
Coopetition Capability
Coopetition experience
Coopetition mindset
Organizational structure:
Combination of dedicated
unit and divisional autonomy
Firm Innovation
Performance
Coopetition-based
innovation performance
(Joint innovation,
innovation through
partner knowledge
application, &
innovation through
private efforts)
Overall firm innovation
performance
64
3.3 Hypotheses Development
In this section, I develop the hypotheses to be tested. I outline the rationale for tension in
coopetition that supports the development of the hypotheses. While I develop hypotheses at
dyadic level, I develop hypotheses regarding the balance between competition and cooperation at
both the dyadic and portfolio levels because the balance between competition and cooperation
can be interpreted in multiple ways5.
3.3.1 Innovation and the intensity of competition between partners
The intensity of competition between partners in a coopetitive relationship refers to the
extent of competition between a focal firm and its partner in the product and geographical
markets in which they operate or in the process of technological development. Previous studies
have operationalized coopetition based on the competition between partners. Therefore, this
hypothesis is about the relationship between traditional coopetition and innovation. In this study
I operationalize the construct of ―competition between partners‖ by measuring two of its
dimensions: product market competition and technology competition. Following Chen (1996), I
will capture the intensity of product market competition by market commonality, i.e., the degree
of presence that a partner manifests in the markets where it overlaps with the focal firm. I will
capture the intensity of technology competition by technological resource similarity, i.e., the
relative overlap between the technological resources of the focal firm and those of a partner.
There are two countervailing arguments and empirical reports on the effects of the
current or potential competition between partners on innovation performance. On one hand, a
higher intensity of competition between partners, based on the higher degree of market
5 I suggest that the balance in coopetition can be interpreted in multiple ways: 1) a medium degree of competition,
2) a balance between competition and cooperation at the dyadic level, and 3) a balance between competition and cooperation at the portfolio level.
65
commonality or resource similarity, may provide greater positive effects on innovation. First,
from the perspective of learning potential, the more similar knowledge and technological
resources that competitor-partners typically possess will enlarge the amount of value created
from the partners‘ resources. Scholars suggest that similarities in partner firms‘ knowledge and
knowledge-processing systems enhance new learning and learning abilities (Lane & Lubatkin,
1998; Mowery et al., 1996). If the focal firm and its partners overlap technologically to a high
degree, they are more likely to be aware of the value of a partner‘s knowledge. Emden et al.
(2006) argue that overlapping knowledge provides the necessary common ground to realize the
technology‘s potential and to communicate with each other. Further, from a learner (or student)
perspective, coopetition increases a focal firm‘s motivation to learn from partners because
partners‘ knowledge may be more relevant to the focal firm‘s interests. In addition, in terms of
capability, the more experience the firms have in solving similar types of problems, the easier it
will be for the focal firm to find ways to apply newly assimilated knowledge (Lane & Lubatkin,
1998). In the same vein, technological resource similarity increases innovation potential through
the organizational search process. The idea of recombinatory search suggests that new inventions
emerge from the recombination or ―mixing and matching‖ of existing elements of knowledge
(Grant, 1996; Kogut & Zander, 1992). Kogut and Zander (1992) argue that the knowledge of the
firm evolves in a path-dependent way, through the replication and recombination of existing
knowledge (see Ahuja et al., 2008; Gupta, Smith, & Shalley, 2006). Second, firms can obtain
competition benefits in a coopetitive relationship. The focal firm may have greater motivation to
increase its own competitiveness in order to outperform its competitor-partners in the market
and/or technological competitions. As the value appropriation in coopetition is decided by
market competition as well as the contracts between partners, firms participating in coopetitive
66
relationships make more private efforts to innovate. From the competition perspective, it is
natural for firms to make private efforts to innovate in order to increase their own
competitiveness in the market, which will allow the firms to be in more favorable positions when
they renegotiate their relationships to adjust to new environments.
On the other hand, competition between partners may provide negative effects on firm
innovation. Kim and Parkhe (2009) suggest that competing similarity has a negative effect on
alliance outcomes6. First, from a teacher perspective, the presence of competition with partners
may discourage firms from sharing their knowledge, which will hurt innovation performance.
When the degree of competition between partners is high, competitive tension between the focal
firm and its partners will increase because knowledge gained from the partner through a
collaborative relationship could be used against the same partner in order to more effectively
compete in the markets (Gnyawali & Park, 2009). This high competitive tension will cause a low
level of knowledge sharing and a narrow scope of cooperation, which in turn, will result in a low
level of innovation output. Schuler, Jackson, and Luo (2004) suggest that unwillingness is one of
the main reasons that learning between partners fails. Sampson (2007) also argues that firms may
be able but not willing to share their knowledge-based capabilities. Firms may tightly control
knowledge flow into partners to avoid unintended knowledge leakage. This knowledge control
reduces the degree of freedom available to employees who are collaborating with partner firms.
Second, in terms of learning, scholars suggest that a high level of knowledge redundancy
between competitor partners may hurt innovation. Innovation arises out of new combinations of
existing capabilities (Schumpeter, 1942). Therefore, the addition of similar capabilities from
partners is unlikely to significantly help innovation (or may even hurt it beyond a critical level),
6 They use two variables, competing similarity and cooperating similarity, suggesting that competing similarity has
a negative effect and cooperating similarity has a positive effect on alliance outcomes.
67
especially when all possible new combinations of existing capabilities have been exhausted or a
high level of resource redundancies occur.
Taking the factors discussed above together, competition between partners in coopetitive
relationships may include factors that can help or hurt firm innovation performance. A critical
issue is whether a firm‘s innovation performance will be more influenced by the positive effects
of learning or the negative effects of competitive tension. Competitive tension describes the level
of strain between a focal firm and a given rival (a partner) that is likely to result in the firm
taking action against its rival and the strain of competitive tension becomes manifest through
competitive actions at a certain ―breaking point‖ (Chen et al., 2007). Their arguments imply that
the negative effects of competitive tension on firm performance are minimal at first and increase
slowly, but at a certain point the negative effects of competitive tension increase rapidly and
surpass the positive effects of learning. Further, when the tension between willingness (or
motivation) and capability of learning (or knowledge transfer) is high, willingness becomes more
critical (Srivastava & Gnyawali, in press). Therefore, I suggest that as the intensity of
competition between partners increases, the positive effects of learning potential are dominant up
to a certain point but beyond that point the negative effects of competitive tension surpass the
positive effects of learning potential. Therefore, I hypothesize that,
H1: The intensity of competition between partners, in terms of both market competition and
technology competition, will have an inverted U-shaped relationship with a focal firm’s
coopetition-based innovation performance. Specifically, a moderate level of competition
between a focal firm and its partner contributes more to the focal firm’s innovation output
than do very low or very high levels of competition between partners.
68
3.3.2 Innovation and the intensity of cooperation between partners
The intensity of cooperation between partners captures the extent to which a focal firm
can learn from a certain partner and share and acquire valuable knowledge from that partner
through a dyadic relationship. While the notion of relational embeddedness, i.e., the dyadic
relationships or ties between the actor and each of its partners (Gulati, 1998; Uzzi, 1999), takes a
network or portfolio approach, I focus on dyadic relationships between two firms that are based
both on a focal alliance and overall relationships. That is, cooperation between partners is
captured by two separate dimensions: 1) the type-strength (or the nature of the strength) of a
focal alliance (applying a weighing scheme) and 2) the strength of ties between two firms, i.e.,
the quality of the overall relationship between a focal firm and a particular partner.
The type-strength of a focal alliance. The type of collaboration (e.g., R&D,
manufacturing, marketing, and licensing) will provide potential benefits (e.g., the likelihood of
knowledge transfer) to a focal firm that can be obtained from the relationship. Srivastava (2007)
argues that the likelihood of knowledge transfer in an alliance depends on the types of
collaboration. Manufacturing and R&D have stronger strategic linkages and/or
interorganizational dependencies than marketing or licensing (Contractor & Lorange, 1988;
Nohria & Garcia-Point, 1991). In the semiconductor industry, manufacturing and cross-licensing
alliances play very important roles in the transfer of knowledge between partners (Grindley &
Teece, 1997). When coopetition is involved in manufacturing or R&D, firms are more likely to
co-locate employees and/or increase knowledge transparency. Heiman and Nickerson (2004)
echoed von Hippel‘s (1994) argument that technical collaboration often involves the transfer of
tacit knowledge to solve complex problems, which requires the adaptation of practices, such as
co-location, that promote the transfer of knowledge. Such conditions allow employees from
69
partner firms to work together closely on a regular basis, making possible the transfer of
knowledge not directly relevant to the stated goals of the collaboration (Heiman & Nickerson,
2004). That is, cooperation benefits are from both knowledge sharing (shared parts) and
knowledge spillover (non-shared parts) (Lavie, 2006). In sum, compared to marketing and
licensing, R&D and manufacturing offer greater level of knowledge transfer between partners. In
turn, the transferred knowledge will help the focal firm to generate innovations jointly with the
partner and innovations by applying the partner‘s knowledge to projects beyond the alliance
boundaries.
The strength of ties between two firms. The strength of the ties between two firms,
which is based on the overall cooperative relationship between the firms that is beyond the focal
alliance, will influence the extent to which the focal firm can realize the potential benefits
provided by the particular type of collaboration. The strength of the ties between two firms can
be captured by the notion of relational embeddedness at the dyadic level. From the relational
embeddedness perspective, strength-of-ties have been typically operationalized by frequency,
duration, and resource commitment. I suggest that those dimensions at the interorganizational
level can be captured by informal safeguards, such as previous ties and concurrent multiple
linkages between the same partners. Previous linkages and concurrent multiple linkages, which
capture both previous and current relationships between two firms, may show the frequency and
duration of the relationship and affect the reciprocity of the relationship. The strength-of-ties
literature suggests that strong ties have various benefits favorable for creating firm innovation.
First, strong ties (i.e., high quality of cooperation) serve as a trust-based governance
mechanism (Rowley et al., 2000), which enhances knowledge transfer and innovation. Since
contracts are incomplete and cannot specify all future developments (Williamson, 1985),
70
researchers have emphasized the important role that informal safeguards and trust-building
initiatives play in deterring the potential opportunistic behavior of alliance partners (Dyer &
Singh, 1998). Repeated ties and long-lasting relationships will encourage reciprocity, a long-term
perspective, and joint problem-solving arrangements (Uzzi, 1997). Also, concurrent multiple
linkages, i.e., multiple ties with the same partners over a specific period, will reduce the hazard
of opportunistic behavior. Parkhe (1993) argues that a firm may be judged as less opportunistic
when it and its partners have other ongoing agreements. Kogut (1989) found that continued
viability is enhanced by the presence of concurrent ties among partners, which facilitates
reciprocity. Supporting such a perspective, Park and Russo (1996) found that a joint venture
whose partners are connected through multiple concurrent linkages is less likely to fail. As
relationships deepen through repeated ties and/or concurrent multiple linkages, trust lessens
concerns over opportunism, and firms are able to share more finely grained information and tacit
knowledge (Suarez-Villa, 1998).
Second, when a focal firm has a strong tie to a certain partner, the two firms can create
effective knowledge sharing routines with each other, which will increase the focal firm‘s
innovativeness. The frequent and richer interactions between partners allow the participants to
develop a shared understanding (Srivastava, 2007). Therefore, strong ties have been found to
stimulate knowledge transfer in interorganizational settings (Dyer & Nobeoka, 2000; Kale, Singh,
& Perlmutter, 2000). Finally, strong ties promote adaptation to environmental changes (Kraatz,
1998). I note that strong ties based on informal governance mechanisms (previous linkages and
concurrent multiple linkages) may promote adaptation, while formal governance modes (joint
ventures or equity investment) may not. Under rapidly changing business environments, firms
cannot anticipate changes in advance and build them into contracts. Therefore, ―rapid
71
technological changes often require partners to modify the nature of their resource commitments,
expectations, and obligations in order to adjust to new environments‖ (Srivastava, 2007: 47).
Strong ties between partners allow firms to view these changes as opportunities for a win-win
situation in the long run, instead of creating a zero-sum game. The more two firms can adapt
their relationship to environmental changes, the more they will be able to solve problems (Uzzi,
1996).
I note that the benefits of the strong ties discussed above are relevant at the dyadic level,
but the benefits may or may not occur at the network level. At the network level, Uzzi‘s (1997)
notion of ‗overembeddedness‘ suggests that strategic networks composed mostly of strong ties
may threaten innovation, rather than enhance it (Capaldo, 2007). From the structural
embeddedness perspective, weak ties (when they are also bridge ties) may be more effective and
useful in bringing novel information (new but not complex) to a network, while strong ties (when
they are connected with a closure) may be more effective in sharing complex knowledge
(Hansen, 1999). However, weak ties may not be helpful for innovation at the dyadic level
because weak ties are likely to be thinner and less durable, and involve less commitment.
Therefore, if we consider only dyadic level interactions, strong ties provide more benefits to
knowledge transfer and, in turn, innovation.
In sum, the effects of an alliance on firm performance will be affected by both the type of
the focal alliance and the strength of the overall cooperative relationship between partners. While
the type-strength of a focal alliance is related to the potential benefits that a focal firm can obtain
from the alliance, the strength of ties between two firms is related to informal safeguarding
mechanisms and influences the partner firm‘s willingness to share knowledge. Therefore, by
changing the degree of knowledge sharing and transfer, the intensity of cooperation between
72
partners will mainly influence the joint innovation and innovation through the application of
partner knowledge. Therefore, I hypothesize that,
H2: The intensity of cooperation between partners, in terms of both the type-strength of a focal
alliance and the strength of ties between two firms, will positively affect the focal firm’s
coopetition-based innovation performance, mainly in the dimensions of joint innovation
and innovation through the application of partner knowledge, ceteris paribus.
3.3.3 Innovation and the balance between competition and cooperation
The tension in coopetition has been under-researched but seems to be a central issue in
understanding the role of coopetition in firm innovation performance. That is, as coopetition
provides both high potential benefits and high risks, the key to generate superior performance
lies in how to resolve the tension from paradoxical factors, such as value creation versus
appropriation and knowledge sharing versus protection.
Scholars (e.g., Chen, 2008; Das & Teng, 2000) suggest that a balancing strategy may be
the best condition to manage the tension in coopetition. Based on their arguments, I suggest that
firm innovation performance will be influenced by combinations of different degrees of
cooperation and competition and their balancing statuses. Although measuring the balance of
cooperation and competition will generate continuous data, typologies will be useful to explain
the effects of coopetition on innovation. Thus, I will use the typologies of four combinations:
Type A (cooperation-dominant coopetition: strong cooperation and weak competition), Type B
(balanced-strong coopetition: strong cooperation and strong competition), Type C (weak
coopetition: weak cooperation and weak competition), and Type D (competition-dominant
coopetition: weak cooperation and strong competition). The balance may be important both at
the dyadic level and at the portfolio level. Therefore, in the section below, I explore the effects of
the balance between competition and cooperation at both the dyadic level and the portfolio level.
73
3.3.3.1 Balance between the intensities of competition and cooperation at the dyadic level
At the dyadic level, I suggest that a balanced-strong coopetition (Type B) produces
superior innovation performance than other types of coopetition. As Figure 3.5 presents, value
creation and appropriation in coopetition depend on both cooperation and competition benefits as
well as learning potential within and beyond the alliance boundaries. In a balanced-strong
coopetition (Type B), partners are direct competitors (high intensity of competition between
partners) and the partners have strong ties between them and/or the focal alliance is strong based
on the type of alliance (e.g., R&D, manufacturing). In this context, firms focus both on value
creation and value appropriation. First, firms will make efforts to create greater value (value co-
creation). Even though they are competing in the same market, the partners need to cooperate in
order to achieve mutual gains, such as technological development, market creation, winning at a
battle for technological standards, and so on. Second, knowledge transfer or learning potential
should be high. In terms of motivation, competitor-partners may have high motivation to learn
from each other (competitor intelligence) and their knowledge is more relevant. Also, as
discussed in section 3.3.2, a stronger type of focal alliance, such as R&D and manufacturing,
offers greater potential for participating firms to generate innovation through co-location or the
levels of interaction that are critical for transferring tacit knowledge. Further, the risk of
coopetition will be reduced by informal safeguards, such as repeated ties (which increase trust
between partners) and concurrent multiple linkages (which reduce the threat of opportunism due
to reciprocity and mutual forbearance). As a result, firms will be able to share or leverage
partners‘ knowledge and resources and, in turn, will enlarge the co-created value within the
alliance (joint innovation) and can apply the knowledge to their own projects beyond the alliance
boundaries (innovation through partner knowledge application). Finally, while cooperating to
74
create greater value, the firms are also concerned with their own competitiveness in order to
appropriate more value. As the co-created value is appropriated by competition in the market,
firms will make more individual efforts to create value beyond the alliance boundaries (private
innovation). That is, the competitive pressure will result in increased efficiency and
competitiveness (competition benefits).
Other combinations may generate performance inferior to that of balanced-strong
coopetition (refer to Figure 3.5). In a cooperation-dominant coopetition (Type A), partners are
not direct competitors (low intensity of competition between partners) but the partners have
strong ties between them and/or the focal alliance is of a strong type (e.g., R&D, manufacturing).
In this context, value will be mainly created by collaborative benefits manifested in joint
innovation and innovation through the application of partner knowledge. When their markets are
different and resources are complementary, partners may share common goals in technology
development and have more chances to achieve mutual gains. As competitive tension is low,
partners may not control knowledge flow as tightly and firms can share the partners‘ resource
potential. However, this context may cause some negative effects on firm performance. First,
firms will not make additional individual efforts to create value beyond the alliance boundaries
(low private innovation in the partner’s domain) because the co-created value is mainly
appropriated by a cooperative arrangement. Scholars agree that an appropriate level of
competition facilitates efficiency and innovation. Therefore, a lack of competition may reduce
firms‘ efficiency and innovativeness in the long run. Second, if partners‘ resource profiles are
very different, firms may have limitations in leveraging partners‘ knowledge due to a lack of an
overlapping knowledge base, which is critical to understand the knowledge (Lane & Lubatkin,
1998; Mowery et al., 1996). In sum, in a cooperation-dominant coopetition, the collaboration
75
benefits (joint innovation and innovation through the application of partner knowledge) will be
greatest but competition benefits (private innovation in the partner’s domain) will be small,
which may limit the firm‘s overall competition-based innovation potential.
Meanwhile, in a competition-dominant coopetition, partners are direct competitors (high
intensity of competition between partners) but the partners have weak ties between them and/or
the focal alliance is of a weak type (e.g., licensing, marketing). In this context, value creation
most depends on each firm‘s individual efforts to create value beyond the alliance boundaries.
When the most value a focal firm can obtain depends on market competition, firms will concern
their own competitiveness and create private innovation in the partner‘s domains. But the
cooperation benefits will be limited because partners may tightly control knowledge transfer.
When partners are direct competitors, firms are very concerned with market competition and feel
high competitive tension. Therefore, firms may not share knowledge that is potentially related to
competition even though the knowledge is helpful to the alliance‘s success. Moreover, partners
may use strong knowledge protection mechanisms. Khanna et al. (1998) suggest that a learning
race may occur that is close to pure competition. Thus, if knowledge protection is weak, there is
a high potential for a ―learning race‖ in competition-dominant coopetition. In sum, in a
competition-dominant coopetition, the collaboration benefits will be small and learning potential
and knowledge sharing will be limited, which will limit the firm‘s innovation potential. Finally,
in a weak coopetition relationship, partners are not direct competitors (low intensity of
competition between partners) and the partners have weak ties between them and/or the focal
alliance is of a weak type (e.g., licensing, marketing). In this context, partners cannot gain much
benefit from either cooperation or competition. Even though the costs of this type of relationship
are the lowest, the learning potential will be also low because partners have low motivation to
76
learn from partners and low capability to understand their partners‘ knowledge. Taken together,
balanced-strong coopetition will generate the highest positive effects on firm innovation.
Considered in its entirety, I hypothesize that,
H3a: The greater intensity of competition between partners that is balanced with the greater
intensity of cooperation between them, the greater the focal firm’s coopetition-based
innovation performance. Specifically, balanced-strong coopetition, based on a high degree
of cooperation and a high degree of competition, contributes more to firm innovation than
does cooperation-dominant, competition-dominant, or weak coopetition.
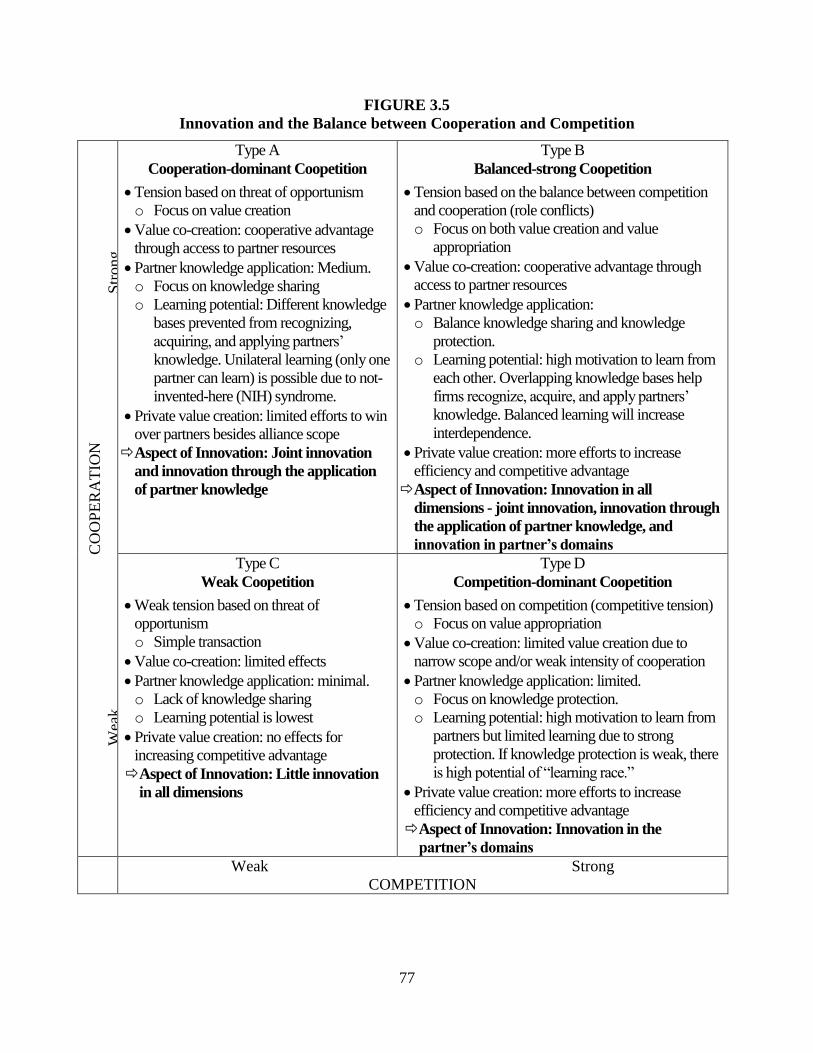
77
FIGURE 3.5
Innovation and the Balance between Cooperation and Competition
CO
OP
ER
AT
ION
Wea
k
S
trong
Type A
Cooperation-dominant Coopetition
Tension based on threat of opportunism
o Focus on value creation
Value co-creation: cooperative advantage
through access to partner resources
Partner knowledge application: Medium.
o Focus on knowledge sharing
o Learning potential: Different knowledge
bases prevented from recognizing,
acquiring, and applying partners‘
knowledge. Unilateral learning (only one
partner can learn) is possible due to not-
invented-here (NIH) syndrome.
Private value creation: limited efforts to win
over partners besides alliance scope
Aspect of Innovation: Joint innovation
and innovation through the application
of partner knowledge
Type B
Balanced-strong Coopetition
Tension based on the balance between competition
and cooperation (role conflicts)
o Focus on both value creation and value
appropriation
Value co-creation: cooperative advantage through
access to partner resources
Partner knowledge application:
o Balance knowledge sharing and knowledge
protection.
o Learning potential: high motivation to learn from
each other. Overlapping knowledge bases help
firms recognize, acquire, and apply partners‘
knowledge. Balanced learning will increase
interdependence.
Private value creation: more efforts to increase
efficiency and competitive advantage
Aspect of Innovation: Innovation in all
dimensions - joint innovation, innovation through
the application of partner knowledge, and
innovation in partner’s domains
Type C
Weak Coopetition
Weak tension based on threat of
opportunism
o Simple transaction
Value co-creation: limited effects
Partner knowledge application: minimal.
o Lack of knowledge sharing
o Learning potential is lowest
Private value creation: no effects for
increasing competitive advantage
Aspect of Innovation: Little innovation
in all dimensions
Type D
Competition-dominant Coopetition
Tension based on competition (competitive tension)
o Focus on value appropriation
Value co-creation: limited value creation due to
narrow scope and/or weak intensity of cooperation
Partner knowledge application: limited.
o Focus on knowledge protection.
o Learning potential: high motivation to learn from
partners but limited learning due to strong
protection. If knowledge protection is weak, there
is high potential of ―learning race.‖
Private value creation: more efforts to increase
efficiency and competitive advantage
Aspect of Innovation: Innovation in the
partner’s domains
Weak Strong
COMPETITION
78
3.3.3.2 Balance between competition and cooperation at the portfolio level
Regarding the balancing strategy and tension in coopetition, another possible
operationalization is the balance between cooperation and competition at the portfolio level. The
balance between competition and cooperation in a focal firm‘s alliance portfolio, i.e., the
complete set of a focal firm‘s collaborative relationships (Lavie, 2007), may be achieved by
including more balanced-strong coopetitive relationships7.
A balancing strategy suggests that the balance between competition and cooperation at
the portfolio level will help a focal firm generate greater innovation performance. First, the logic
of the balance between competition and cooperation at the dyadic level will be applied at the
portfolio level. If we agree that balanced-strong coopetition generates greater innovation
performance than other types of coopetition, a focal firm with an alliance portfolio (an
aggregation of individual alliances) that includes a greater number of balanced-strong
coopetition should produce greater coopetition-based innovation performance. Second, the
effects of the balance between competition and cooperation at the portfolio level may go beyond
simple aggregation of individual alliances by generating some synergy effects. Through the
inclusion of more balanced-strong coopetitions in their alliance portfolios, firms may create a
corporate culture that will influence the firm‘s overall innovation performance. Through
balanced-strong coopetition, executives may be able to develop a coopetition mindset and pursue
a win-win strategy with partners. Recognizing that coopetition can be positive-sum games, firms
will make efforts to create greater value (value co-creation). Also, balanced-strong coopetition
will make managers more alert as compared to cooperation-dominant coopetition. Firms
7 I note that another possible balancing strategy at the portfolio level can be achieved by developing an alliance
portfolio with multiple types of coopetition, such as competition-dominant, cooperation-dominant, and balanced-
strong coopetition. While a balanced-strong coopetition is balanced by itself, a competition-dominant coopetition
can be balanced by a cooperation-dominant coopetition. However, I focus on balanced-strong coopetition because it
offers higher tension.
79
sometimes do not recognize the risk of knowledge sharing and therefore carelessly share their
knowledge with partners. If some partners are opportunistic and outlearn others in the
relationship, the opportunistic partners could terminate the alliances earlier than original
scheduled (Khanna et al., 1998). Further, a lack of competition may reduce firms‘ efficiency in
the long run. Finally, when firms engage in multiple balanced-strong coopetitions, firms can
apply knowledge learned from a specific alliance to other alliances as well as their own projects.
Firms engaged in balanced-strong coopetition are direct competitors that possess similar
resources. As discussed in section 3.3.1, the organizational search literature (e.g., Kogut &
Zander, 1992) suggests that the knowledge of the firm evolves in a path-dependent way through
the replication and recombination of existing knowledge. Therefore, firms with an alliance
portfolio that includes more balanced-strong coopetition will gain more relevant knowledge and
resources from the partners and can use the resources for multiple projects.
On the other hand, including balanced-strong coopetition in an alliance portfolio may have
some negative effects. In terms of organizational search, beyond a critical level, the addition of
similar capabilities of the partners is unlikely to help (or may even hurt) innovation especially
when a high level of resource redundancies occurs because innovation arises out of new
combinations of existing capabilities. In a similar vein, strong ties at the portfolio level cause the
risk of ―overembeddedness‖ (Uzzi, 1997). That is, beyond a threshold, embeddedness can hurt
performance by insulating firms from information that exists outside their network. Ritala et al.
(2008) also suggest that firms should be aware of the risks that are included in cooperating with
too many of their most direct competitors by reporting that a high relative number of strategic
alliances among a firm‘s key competitors contributes negatively to firm performance. However,
they did not consider the intensity of cooperation and the balance between competition and
80
cooperation in a focal alliance. Overall, although there are some negative effects, I suggest that,
including more balanced-strong coopetition, which will increase the balance between
competition and cooperation at the portfolio level, will positively affect firm innovation
performance. Therefore, I hypothesize that,
H3b: The higher the ratio of balanced-strong coopetition a firm has in its alliance portfolio, the
greater the overall firm innovation performance, ceteris paribus.
3.3.4 The moderating role of coopetition capability
As discussed in section 3.1.4, I conceptualize coopetition capabilities based on the notion
of dynamic capabilities. According to Teece (2009), dynamic capabilities refer to the firm‘s
ability to sense, seize, and adapt in order to generate and exploit internal and external firm-
specific competencies, and to address the firm‘s changing environment. To capture the balance
strategy and the dimensions of dynamic capabilities, I explore three different coopetition
capabilities: coopetition experience, coopetition mindset, and organizational structure with a
combination of dedicated unit and divisional autonomy. ―Sensing‖ and ―seizing‖ coopetition
opportunities requires recognizing the importance of coopetition and coopetition opportunities.
Brandenburger and Nalebuff (1996) suggest that coopetition requires a new mental model,
namely a ―coopetition mindset.‖ ―Adapting (or managing)‖ coopetition may require coordinating
conflicts (e.g., role conflicts), which are related to not only a managerial mindset but also
organizational structure and incentive systems. Finally, previous coopetition experience, which is
related to entire processes of coopetition, will be helpful in all dimensions.
In this study, I focus on the moderating role of coopetition capabilities in the context with
both high intensity of competition between partners and high intensity of cooperation in terms of
the type-strength of a focal alliance. The first reason is that coopetition capabilities seem to be
more essential in contexts with a high intensity of competition. The fundamental challenge of
81
coopetition stems from the dynamic nature of the relationships with competitor-partners. Luo
(2007a) points out that the cooperative and competitive element mix is not static, but rather
dynamic in response to changing parameters in both their external and internal environments.
Therefore, although cooperation is subject to some formal governance, competition can change
without any formal governance (Luo, 2007a). The matter, therefore, is how to deal with conflicts
and tension related to competition with partners. Another reason is that as discussed in section
3.3.2, type-strength of a focal alliance may offer only the potential of value creation and high
intensity of competition between partners will limit the potential. In the section below, I explore
three coopetition capabilities in detail and suggest that firms with greater coopetition capabilities
may better understand the dynamics of coopetition and manage various conflicts in the lifecycle
of coopetition, which will weaken the negative effects of competitive tension and strengthen
positive effects of learning.
Coopetition experience. At the heart of organizational learning resides experience (Levitt
& March, 1988). Inkpen and Tsang (2007) echoed Varadarajan and Cunningham‘s (1995)
argument that a firm‘s accumulated learning from its past involvement in strategic alliances is
likely to have an impact on the effectiveness of its future alliances. Alliance-experienced firms
learn to manage alliances more effectively over time (Anand & Khanna, 2000; Barkema,
Shenkar, Vermeulen, & Bell, 1997; Tsang, 2002). Based on the same logic, prior coopetition
experience will contribute to coopetition success.
Regarding experiences with inter-firm collaboration, I note that the capability accumulated
from alliance experiences may be helpful for managing coopetition because there are overlaps
with general alliances, such as the general procedures. As discussed previously, however,
coopetition has unique characteristics and challenges to manage. Compared to inexperienced
82
firms, firms with more coopetition experience may understand the dynamics of coopetition,
know how to coordinate conflicts, and have the skills to communicate with multiple parties
within the firm and with partners. Therefore, the experience with coopetition (cooperation with
competing firms) will be more critical than the experience from general alliances for managing
future coopetitions. Another reason that coopetition experience is important is related to tension.
If firms are repeatedly involved in coopetitive relationships, we can assume that the firms are
confident in their ability to generate benefits from coopetitive relationships and may have more
capability to manage the relationships. As a result, firms with more experience with coopetition
may be better able to manage the tension from the paradoxical factors in coopetition than less
experienced firms in the same situation. As explained above, I focus on the intensity of
competition between partners and balanced-strong coopetition. Therefore, I hypothesize that,
H4a: A focal firm’s coopetition experience will positively moderate the relationship between
balanced-strong coopetition and the focal firm’s coopetition-based innovation
performance.
Coopetition mindset. Brandenburger and Nalebuff (1996) argue that coopetition requires a
new mindset – the management mental model with a win-win approach based on value creation
and value appropriation. Elements of a coopetition mental model might include recognizing the
importance of coopetition, scanning the environment for coopetition opportunities, developing
ways to effectively engage in actual collaborative relationships with competitors (Gnyawali &
Park, 2009), and continuously seeking a win-win method with competitor-partners during the
period of the partnership. The coopetition mindset may affect both ex ante formation and ex post
dynamics of coopetition. In this study, however, I mainly discuss the role of the coopetition
mindset as the coopetition capability that manages the tension in the dynamic evolution of the
83
relationship. I suggest that the key to coopetition success rests with executives who develop a
coopetition mindset.
Firms led by executives with a coopetition mindset are more likely not only to perceive
coopetition opportunities but also to effectively manage the dynamics of coopetition (Gnyawali
& Park, 2009). First, a win-win approach is the most effective way to create significant value
and, in turn, obtain a bigger share of the value (Brandenburger & Nalebuff, 1996; Cairo, 2006).
Even though a firm‘s partners are direct competitors or larger than the focal firm, management
will continually pursue a win-win approach and positive sum game instead of worrying about its
partner‘s opportunism. Second, executives with a coopetition mindset will view a bigger picture
with long-term goals. From the SME context, Gnyawali and Park (2009) argue that firms will be
motivated to collaborate with some competitors to increase their bargaining power against
others. If a small firm can effectively learn through coopetitive ties, it can become a better
partner and avail itself of more attractive opportunities in the long run (Gnyawali & Park, 2009).
Viewing the bigger picture with a long-term goal keeps coopetitive relationships from being
shaken by a short-term change in the partners‘ relative positions. Meanwhile, if management has
strong competitor-oriented objectives, the degree to which the organization‘s primary goal is to
defeat competitors in the marketplace (Luo et al., 2007), they will view their industry as a zero-
sum game in which their gains must come at the expense of competitors. Also, Luo et al. (2007)
echoed Campbell and Furrer‘s (1995) argument that zero-sum goals are harmful to learning, shift
priorities away from value creation, and fuel mutually harmful price wars. In sum, management
with a coopetition mindset is more likely to manage the competitive tension and the threat of
opportunism from coopetition better than management with a zero-sum mindset. As a result,
84
learning and knowledge transfer will be facilitated by a coopetition mindset, increasing the
likelihood of innovation performance. Therefore, I hypothesize that,
H4b: Firms with executives that have a coopetition mindset will positively moderate the
relationship between balanced-strong coopetition and the focal firm’s coopetition-based
innovation performance8.
Organizational structure: Combination of dedicated unit and divisional autonomy. With
respect to the organizational structure, I suggest that divisional autonomy, i.e., the degree of
autonomy of each individual division in multidivisional firms, may be useful for managing
coopetition. Focusing on the issue of role conflict in coopetition, Bengtsson and Kock (2008)
suggest that while organizations can engage in both cooperation and competition simultaneously,
individuals cannot cooperate and compete directly with each other simultaneously. Their
arguments imply that even though top management makes strategic decisions about cooperating
with direct competitors, employees who have been accustomed to pure competition or pure
cooperative relationships may be confronted with various challenges in day-to-day operation in
terms of balancing competition and cooperation. To reduce or resolve the conflicts, I suggest that
divisions with a high degree of autonomy can simplify their relationships. Specifically, higher
divisional autonomy may reduce the negative effects of tension from role conflicts. Let us
assume that division A in firm X is cooperating with firm Y, while division B in firm X is
competing with the same firm Y. Division A may feel lower competitive tension because they do
not compete directly with the partner. Therefore, the partners may have common goals and they
closely cooperate and transfer knowledge, which will create greater common benefits (co-created
value). Meanwhile, division B is directly competing with firm Y. If they use the same
products/technologies developed in the alliance between the two firms, the division may make
8 This hypothesis will not be statistically tested but supported by case description.
85
more effort to surpass and differentiate itself from firm Y in the market (private value from
competitive benefits). Therefore, firm X can effectively manage tension in coopetition and
generate superior performance.
The literature on dynamic capability has emphasized the role of ‗dedicated alliance
function.‘ For example, Kale et al. (2002) suggest that firms need to create, so-called, ‗dedicated
alliance function‘ – a separate, dedicated organizational unit charged with the responsibility to
capture, share, and disseminate the alliance management know-how associated with prior
experience. Considering both a dedicated unit and divisional autonomy, I suggest that the role of
such a separate unit will be critical to managing coopetition. The unit dedicated to
interorganizational relationships will be able to capture the differences between coopetition and
general alliances and the unique challenges of coopetition more systematically than would a
more generalized measure. Also, the unit can efficiently store, share, and disseminate the
coopetition management know-how. Further, when divisional autonomy is high and competition
among individual divisions is severe, a dedicated alliance function can coordinate the conflicts
among individual divisions and generate synergies out of multiple relationships. Considering
divisional autonomy, I note that a new challenge facing management is that it must balance
divisional autonomy and the coordination of the conflicted interests of divisions involved within
the firm. When each division has a high degree of autonomy and individual divisions compete
with each other to generate better contributions to the firm, the severe competition among
individual divisions within the firm can hurt firm performance. Therefore, I note that a dedicated
unit is vital when divisional autonomy is high. In sum, firms with a structure of a ―combination
of a dedicated unit and divisional autonomy‖ can better manage complex issues in coopetition.
Therefore, I hypothesize that,

86
H4c: A focal firm’s organizational structure with the combination of dedicated unit and
divisional autonomy will positively moderate the relationship between balanced-strong
coopetition and the focal firm’s coopetition-based innovation performance9.
9 This hypothesis is not statistically tested but supported by case description.
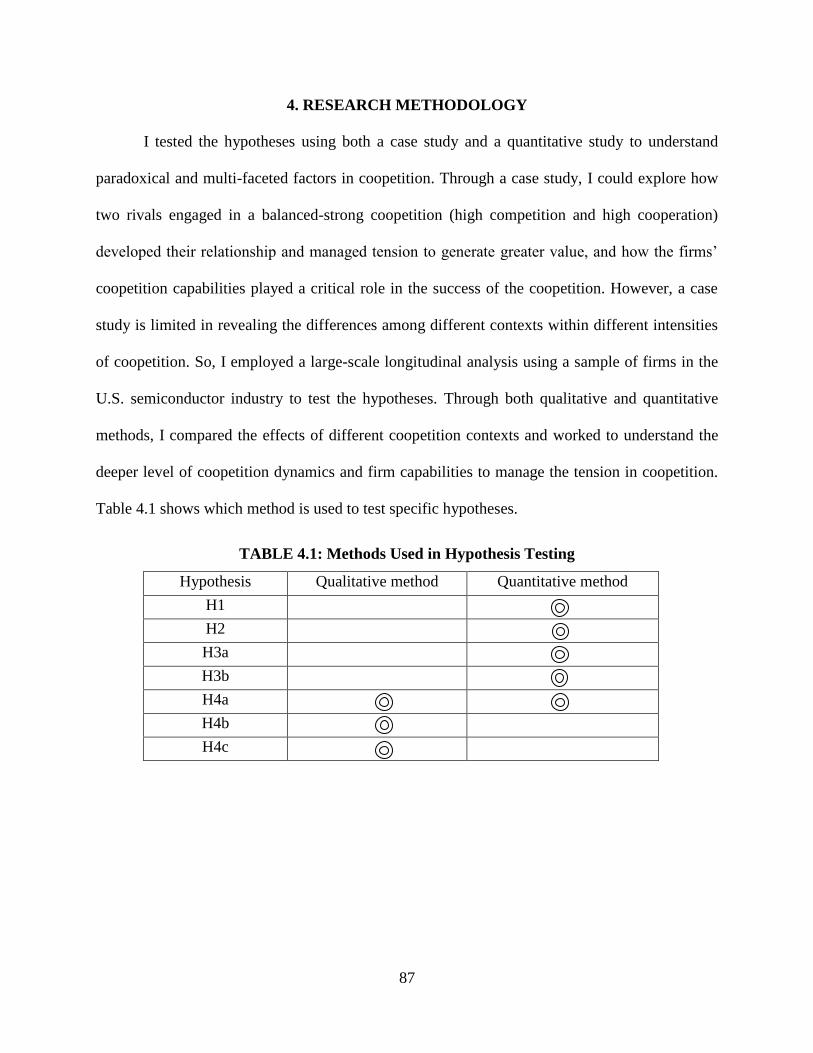
87
4. RESEARCH METHODOLOGY
I tested the hypotheses using both a case study and a quantitative study to understand
paradoxical and multi-faceted factors in coopetition. Through a case study, I could explore how
two rivals engaged in a balanced-strong coopetition (high competition and high cooperation)
developed their relationship and managed tension to generate greater value, and how the firms‘
coopetition capabilities played a critical role in the success of the coopetition. However, a case
study is limited in revealing the differences among different contexts within different intensities
of coopetition. So, I employed a large-scale longitudinal analysis using a sample of firms in the
U.S. semiconductor industry to test the hypotheses. Through both qualitative and quantitative
methods, I compared the effects of different coopetition contexts and worked to understand the
deeper level of coopetition dynamics and firm capabilities to manage the tension in coopetition.
Table 4.1 shows which method is used to test specific hypotheses.
TABLE 4.1: Methods Used in Hypothesis Testing
Hypothesis Qualitative method Quantitative method
H1
H2
H3a
H3b
H4a
H4b
H4c
88
4.1 Qualitative Research: An In-Depth Case Study10
4.1.1 Research setting
The research design employed an exploratory approach in order to provide meaningful
insights into the effects of coopetition on the tension between competitors, technological
development, and participants‘ performance. Gnyawali and Park (2011) argue that case-based
exploratory methods are best suited for investigating new and poorly understood phenomena
(Eisenhardt, 1989) that have multiple and complex elements (Dodgson, Mathews, Kastelle, &
Hu, 2008) and that evolve over time (Langley, 1999). An in-depth case study is a reasonably
good approach to examine complex phenomena (Yin, 1984). Since coopetition is a multi-faceted
and paradoxical phenomenon, an in-depth case study over a long period provides insight into the
drivers, processes, and consequences of coopetition (Gnyawali & Park, 2011). With the goal of
an exemplar case to advance our understanding of the tension in coopetition and the role of a
firm‘s coopetition capabilities in managing the paradoxical and dynamic relationship, I selected a
balanced-strong coopetition (high competition and high cooperation), a joint venture between
two major rivals in the high tech industry.
Established by Samsung Electronics and Sony Corporation in April 2004, S-LCD is a
joint venture to develop and produce seventh generation (1,870 x 2,200mm motherglass) liquid
crystal display (LCD) panels for flat screen TVs. Each party owns 50 percent of the venture, with
the chief executive officer (CEO) from Samsung and the chief financial officer (CFO) from
Sony. Samsung contributes its technological strengths in LCD technology, while Sony
contributes its technological strengths in television, brand recognition, and market leadership in
the television market (Gnyawali & Park, 2011).
10
In this section, I build on the case description in Gnyawali and Park (2011).
89
S-LCD provides an ideal setting to examine hypotheses regarding coopetition capability
and the balance between competition and cooperation. First, the firms operate in a high-tech
industry sector in which alliance activity has been dynamic and intensive (Hagedoorn, 1993). In
the TV industry, the relationships among major players have dramatically changed as TV
technology has transitioned from analog (cathode-ray tube (CRT)) to digital, including liquid
crystal display (LCD), plasma display panel (PDP), and organic light-emitting diode (OLED).
Sony, which was a distinct leader in the traditional CRT TV market, was lagging behind in the
technological development of flat screen TV. During the transition from analog to digital, the
competition surrounding the technological standards became severe. Examining cooperation
between the incumbent leader (Sony Corporation) and an emerging leader (Samsung Electronics)
in the technology transition context can give more exciting and valuable implications.
Second, the case provides the most paradoxical situation of coopetition in which firms are
involved in simultaneous strong collaboration and strong competition (Gnyawali et al., 2008).
Further, the two firms are approximately equal in size and overlap significantly in the
marketplace so the paradoxical nature of the relationship would be most intense. In 2003, when
the two firms agreed to establish S-LCD, the annual revenue of Samsung Electronics was
US$54.1 billion and that of Sony was US$67.2 billion, while their global brand rankings were
25th
and 20th
, respectively. The firms have competed in various product markets, such as TV,
computer, video, audio, and handsets, as well as in various geographic markets in the US,
Europe, and Asia. In such extreme situations, the tension between competitor-partners and its
impact may be readily observed. Further, the joint venture, which still exists at the time of this
study in 2011. has a sufficiently long history (eight years from 2004 to 2011) to allow a
longitudinal analysis. Finally, the firms are public firms for which archival data are available.
90
4.1.2 Data collection
This study relied mainly on secondary data. First, I collected data from the two firms‘
annual reports for their businesses and strategy, industry research firms (e.g., DisplaySearch) for
market share, and public financial databases (e.g., COMPUSTAT). Records of alliances (data for
investigating coopetition experience to support hypothesis 4a) formed by Samsung Electronics
and Sony Corporation between 1994 (10 years before the JV) and 2003 were compiled from the
SDC Platinum database. Each alliance announcement was verified by tracking corresponding
information from multiple sources, such as the SDC database, annual report, and Factiva news.
Second, I employed news report analysis to develop a better understanding of the
situation, evolution, and effects of coopetition. As the joint venture between two industry leaders
has received a great deal of attention from the media, there are ample news reports even though
the focuses are different. I downloaded news reports from the Factiva database through key word
searches and extracted key statements/quotes from news reports that relate to the conceptual
arguments developed above. By analyzing the news reports from 2003 (to understand the
situation right before Samsung and Sony decided to establish the alliance) to 2010, I attempted to
understand industry and dyadic forces related to the formation of this coopetitive venture, the
evolution of coopetition between two competitor-partners, and firm and industry-level outcomes.
I focused on major newspapers and reports in Korea, Japan, and the United States. Cross-
checking information through newspapers in three countries enabled me to overcome possible
bias and gain access to the materiality of the S-LCD JV, as well as to its evolution and impact.
91
4.1.3 Analysis
This qualitative research is appropriate for exploring new facets that have not been
thoroughly addressed in the literature about the emerging phenomenon of coopetition. Further,
hypotheses 4b and 4c were not statistically tested but supported by case description (qualitative
methods) due to the limitations of collecting data for large scale quantitative research. That is, I
provided illustrative support for the relevant hypotheses by describing the factors that occurred
in the case. To make sure that this case is a balanced-strong coopetition, I reported the two firms‘
businesses, their positions in the businesses, and the strength of ties between the two firms. In
terms of coopetition capabilities, I analyzed their coopetition experience, coopetition mindset,
and organizational structure. Regarding coopetition mindset, I used relevant quotes from news
articles and corporate annual reports. Regarding organizational structure, I analyzed the two
firms‘ organizational charts and expanded relationships with affiliates. Also, quantitative data
(i.e., alliance data) were used to examine the role of coopetition experience.
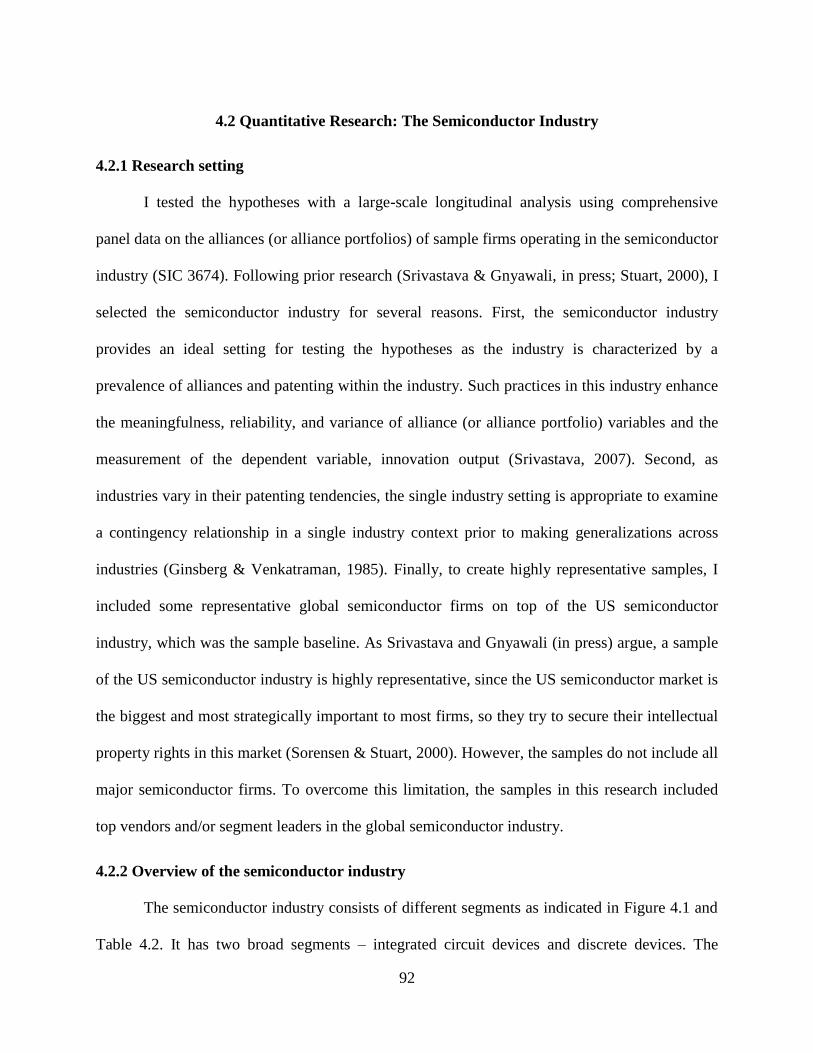
92
4.2 Quantitative Research: The Semiconductor Industry
4.2.1 Research setting
I tested the hypotheses with a large-scale longitudinal analysis using comprehensive
panel data on the alliances (or alliance portfolios) of sample firms operating in the semiconductor
industry (SIC 3674). Following prior research (Srivastava & Gnyawali, in press; Stuart, 2000), I
selected the semiconductor industry for several reasons. First, the semiconductor industry
provides an ideal setting for testing the hypotheses as the industry is characterized by a
prevalence of alliances and patenting within the industry. Such practices in this industry enhance
the meaningfulness, reliability, and variance of alliance (or alliance portfolio) variables and the
measurement of the dependent variable, innovation output (Srivastava, 2007). Second, as
industries vary in their patenting tendencies, the single industry setting is appropriate to examine
a contingency relationship in a single industry context prior to making generalizations across
industries (Ginsberg & Venkatraman, 1985). Finally, to create highly representative samples, I
included some representative global semiconductor firms on top of the US semiconductor
industry, which was the sample baseline. As Srivastava and Gnyawali (in press) argue, a sample
of the US semiconductor industry is highly representative, since the US semiconductor market is
the biggest and most strategically important to most firms, so they try to secure their intellectual
property rights in this market (Sorensen & Stuart, 2000). However, the samples do not include all
major semiconductor firms. To overcome this limitation, the samples in this research included
top vendors and/or segment leaders in the global semiconductor industry.
4.2.2 Overview of the semiconductor industry
The semiconductor industry consists of different segments as indicated in Figure 4.1 and
Table 4.2. It has two broad segments – integrated circuit devices and discrete devices. The
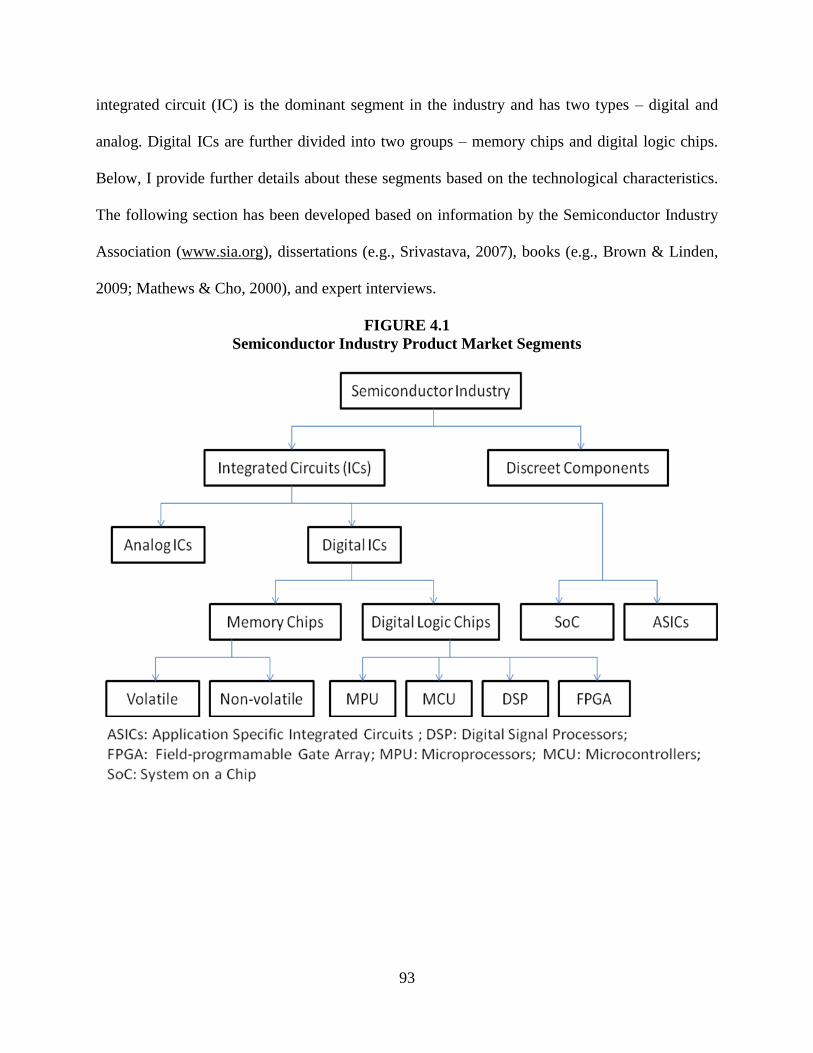
93
integrated circuit (IC) is the dominant segment in the industry and has two types – digital and
analog. Digital ICs are further divided into two groups – memory chips and digital logic chips.
Below, I provide further details about these segments based on the technological characteristics.
The following section has been developed based on information by the Semiconductor Industry
Association (www.sia.org), dissertations (e.g., Srivastava, 2007), books (e.g., Brown & Linden,
2009; Mathews & Cho, 2000), and expert interviews.
FIGURE 4.1
Semiconductor Industry Product Market Segments
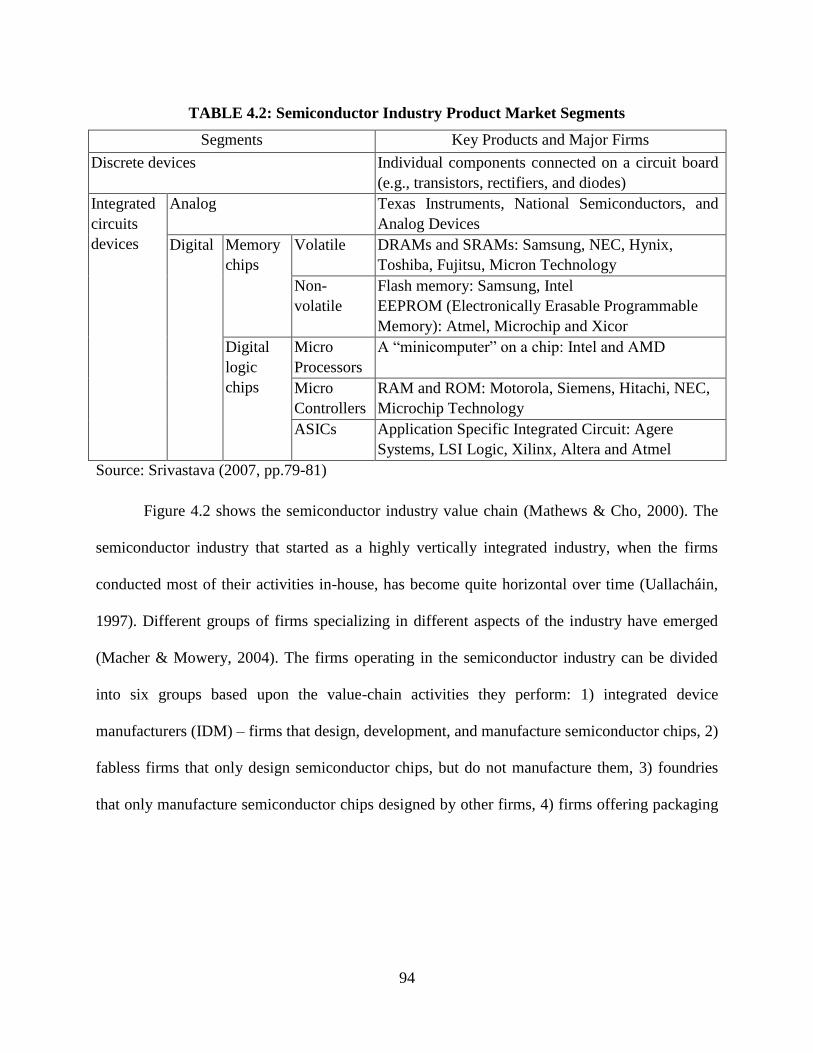
94
TABLE 4.2: Semiconductor Industry Product Market Segments
Segments Key Products and Major Firms
Discrete devices Individual components connected on a circuit board
(e.g., transistors, rectifiers, and diodes)
Integrated
circuits
devices
Analog Texas Instruments, National Semiconductors, and
Analog Devices
Digital Memory
chips
Volatile DRAMs and SRAMs: Samsung, NEC, Hynix,
Toshiba, Fujitsu, Micron Technology
Non-
volatile
Flash memory: Samsung, Intel
EEPROM (Electronically Erasable Programmable
Memory): Atmel, Microchip and Xicor
Digital
logic
chips
Micro
Processors
A ―minicomputer‖ on a chip: Intel and AMD
Micro
Controllers
RAM and ROM: Motorola, Siemens, Hitachi, NEC,
Microchip Technology
ASICs Application Specific Integrated Circuit: Agere
Systems, LSI Logic, Xilinx, Altera and Atmel
Source: Srivastava (2007, pp.79-81)
Figure 4.2 shows the semiconductor industry value chain (Mathews & Cho, 2000). The
semiconductor industry that started as a highly vertically integrated industry, when the firms
conducted most of their activities in-house, has become quite horizontal over time (Uallacháin,
1997). Different groups of firms specializing in different aspects of the industry have emerged
(Macher & Mowery, 2004). The firms operating in the semiconductor industry can be divided
into six groups based upon the value-chain activities they perform: 1) integrated device
manufacturers (IDM) – firms that design, development, and manufacture semiconductor chips, 2)
fabless firms that only design semiconductor chips, but do not manufacture them, 3) foundries
that only manufacture semiconductor chips designed by other firms, 4) firms offering packaging
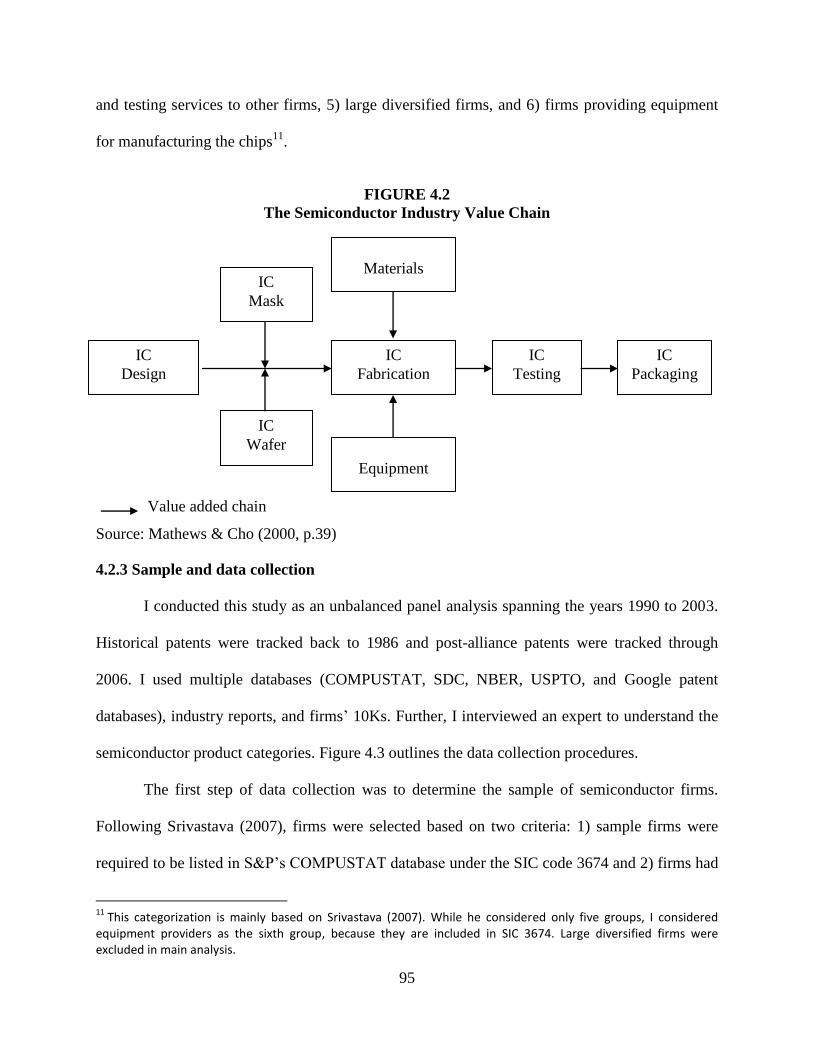
95
and testing services to other firms, 5) large diversified firms, and 6) firms providing equipment
for manufacturing the chips11
.
FIGURE 4.2
The Semiconductor Industry Value Chain
Value added chain
Source: Mathews & Cho (2000, p.39)
4.2.3 Sample and data collection
I conducted this study as an unbalanced panel analysis spanning the years 1990 to 2003.
Historical patents were tracked back to 1986 and post-alliance patents were tracked through
2006. I used multiple databases (COMPUSTAT, SDC, NBER, USPTO, and Google patent
databases), industry reports, and firms‘ 10Ks. Further, I interviewed an expert to understand the
semiconductor product categories. Figure 4.3 outlines the data collection procedures.
The first step of data collection was to determine the sample of semiconductor firms.
Following Srivastava (2007), firms were selected based on two criteria: 1) sample firms were
required to be listed in S&P‘s COMPUSTAT database under the SIC code 3674 and 2) firms had
11
This categorization is mainly based on Srivastava (2007). While he considered only five groups, I considered equipment providers as the sixth group, because they are included in SIC 3674. Large diversified firms were excluded in main analysis.
IC
Packaging
IC
Testing
IC
Fabrication
Materials
Equipment
IC
Mask
IC
Wafer
IC
Design
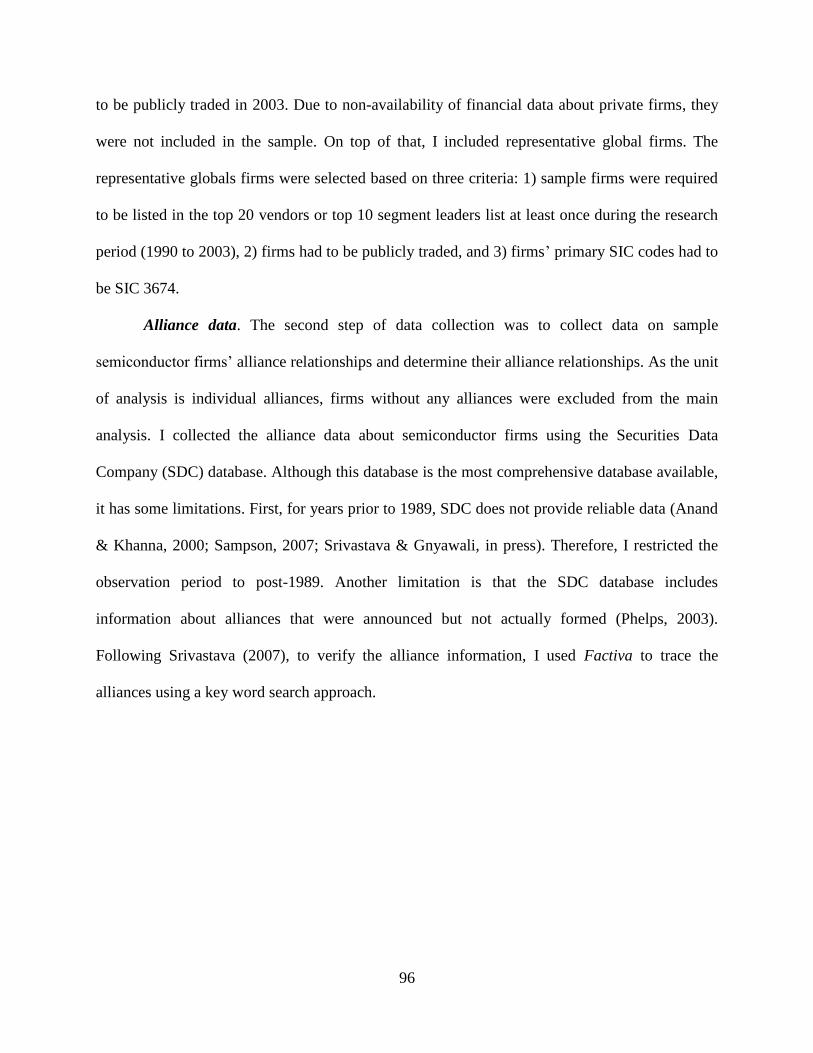
96
to be publicly traded in 2003. Due to non-availability of financial data about private firms, they
were not included in the sample. On top of that, I included representative global firms. The
representative globals firms were selected based on three criteria: 1) sample firms were required
to be listed in the top 20 vendors or top 10 segment leaders list at least once during the research
period (1990 to 2003), 2) firms had to be publicly traded, and 3) firms‘ primary SIC codes had to
be SIC 3674.
Alliance data. The second step of data collection was to collect data on sample
semiconductor firms‘ alliance relationships and determine their alliance relationships. As the unit
of analysis is individual alliances, firms without any alliances were excluded from the main
analysis. I collected the alliance data about semiconductor firms using the Securities Data
Company (SDC) database. Although this database is the most comprehensive database available,
it has some limitations. First, for years prior to 1989, SDC does not provide reliable data (Anand
& Khanna, 2000; Sampson, 2007; Srivastava & Gnyawali, in press). Therefore, I restricted the
observation period to post-1989. Another limitation is that the SDC database includes
information about alliances that were announced but not actually formed (Phelps, 2003).
Following Srivastava (2007), to verify the alliance information, I used Factiva to trace the
alliances using a key word search approach.
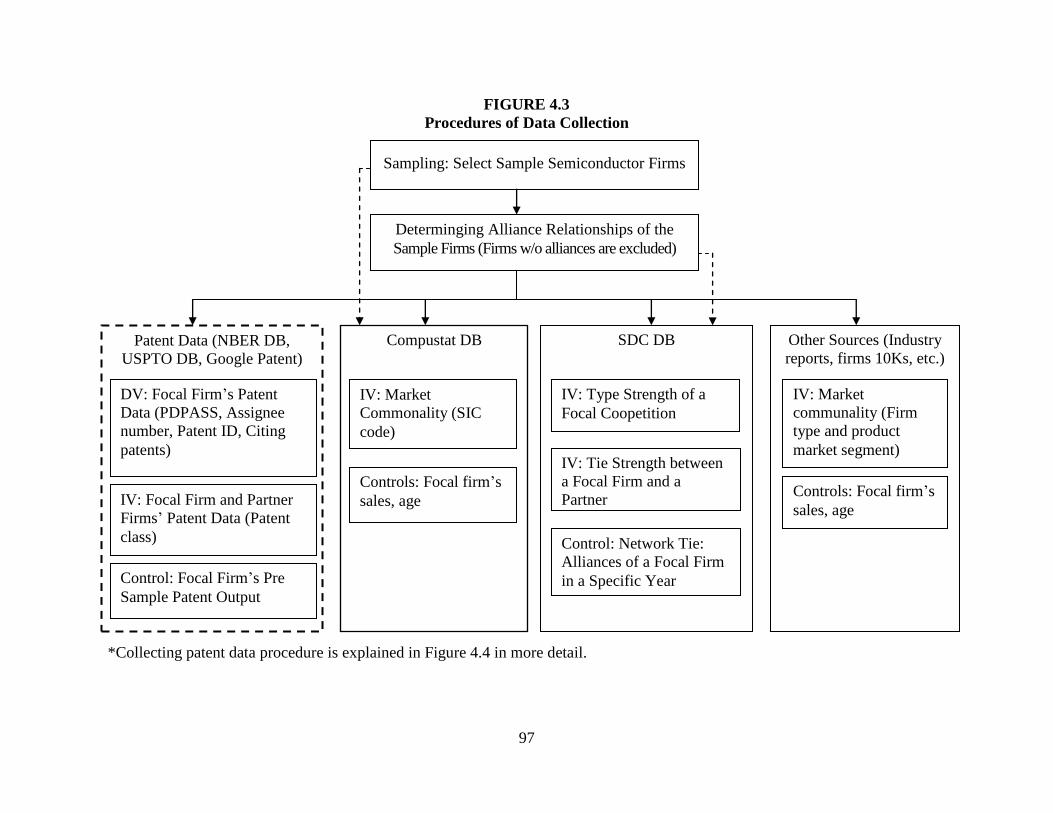
97
FIGURE 4.3
Procedures of Data Collection
*Collecting patent data procedure is explained in Figure 4.4 in more detail.
SDC DB
Patent Data (NBER DB,
USPTO DB, Google Patent)
IV: Tie Strength between
a Focal Firm and a
Partner
Control: Network Tie:
Alliances of a Focal Firm
in a Specific Year
IV: Type Strength of a
Focal Coopetition
Compustat DB
DV: Focal Firm‘s Patent
Data (PDPASS, Assignee
number, Patent ID, Citing
patents)
IV: Focal Firm and Partner
Firms‘ Patent Data (Patent
class)
Control: Focal Firm‘s Pre
Sample Patent Output
Other Sources (Industry
reports, firms 10Ks, etc.)
IV: Market
Commonality (SIC
code)
Controls: Focal firm‘s
sales, age
IV: Market
communality (Firm
type and product
market segment)
Controls: Focal firm‘s
sales, age
Sampling: Select Sample Semiconductor Firms
Determinging Alliance Relationships of the
Sample Firms (Firms w/o alliances are excluded)
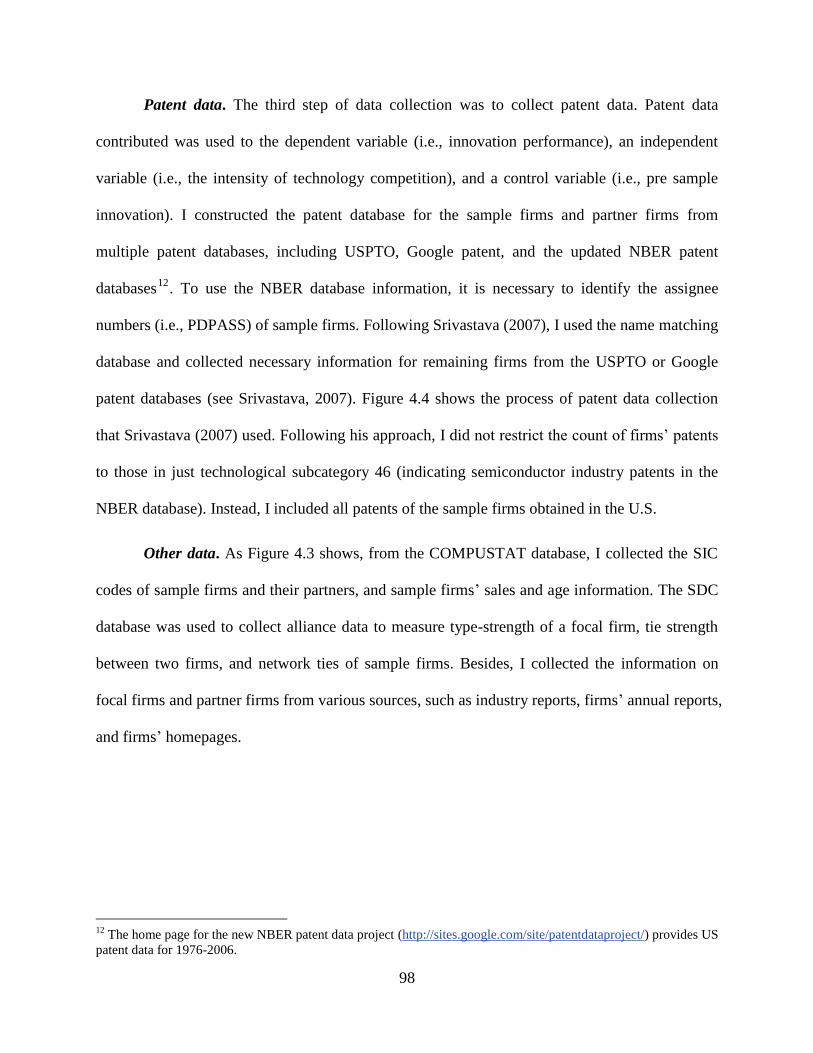
98
Patent data. The third step of data collection was to collect patent data. Patent data
contributed was used to the dependent variable (i.e., innovation performance), an independent
variable (i.e., the intensity of technology competition), and a control variable (i.e., pre sample
innovation). I constructed the patent database for the sample firms and partner firms from
multiple patent databases, including USPTO, Google patent, and the updated NBER patent
databases12
. To use the NBER database information, it is necessary to identify the assignee
numbers (i.e., PDPASS) of sample firms. Following Srivastava (2007), I used the name matching
database and collected necessary information for remaining firms from the USPTO or Google
patent databases (see Srivastava, 2007). Figure 4.4 shows the process of patent data collection
that Srivastava (2007) used. Following his approach, I did not restrict the count of firms‘ patents
to those in just technological subcategory 46 (indicating semiconductor industry patents in the
NBER database). Instead, I included all patents of the sample firms obtained in the U.S.
Other data. As Figure 4.3 shows, from the COMPUSTAT database, I collected the SIC
codes of sample firms and their partners, and sample firms‘ sales and age information. The SDC
database was used to collect alliance data to measure type-strength of a focal firm, tie strength
between two firms, and network ties of sample firms. Besides, I collected the information on
focal firms and partner firms from various sources, such as industry reports, firms‘ annual reports,
and firms‘ homepages.
12
The home page for the new NBER patent data project (http://sites.google.com/site/patentdataproject/) provides US
patent data for 1976-2006.
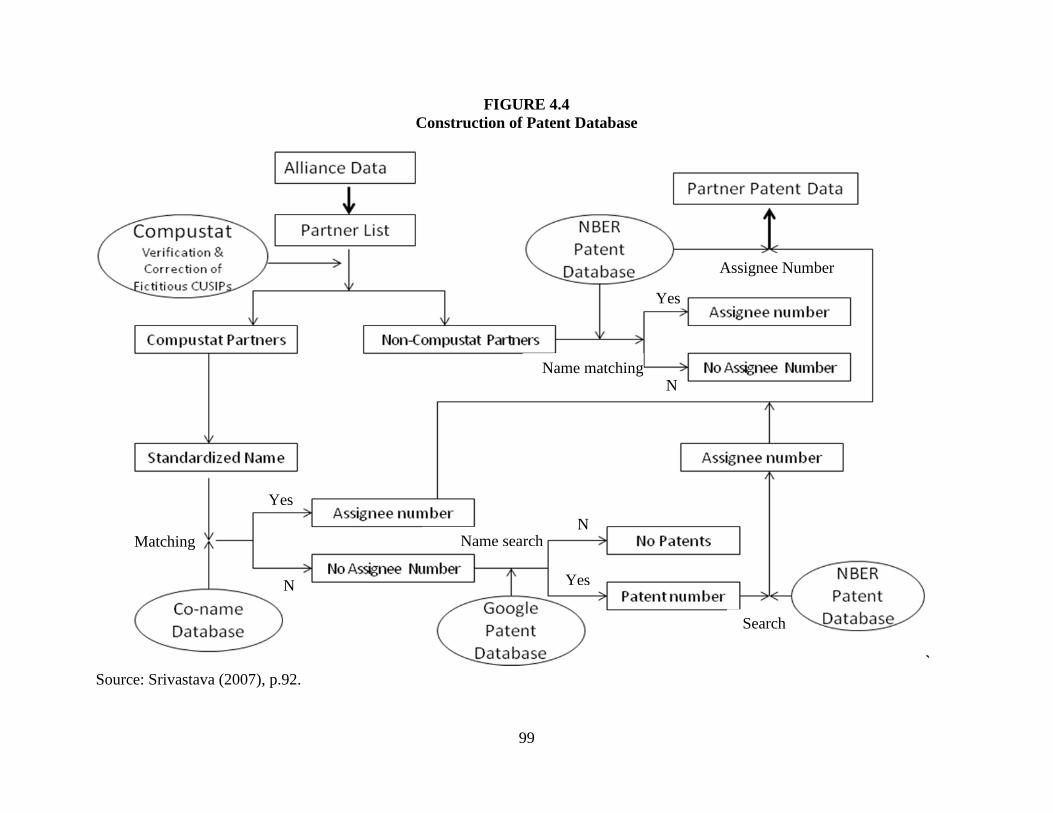
99
FIGURE 4.4
Construction of Patent Database
`
Source: Srivastava (2007), p.92.
Name matching
Name search Matching
Search
Yes
Yes
Yes
N
o
N
o
N
o
Assignee Number
100
4.2.4 Measures
4.2.4.1 Dependent variables
Coopetition-based innovation output. First, following prior research (Ahuja, 2000; Sampson,
2007; Schilling & Phelps, 2007; Srivastava & Gnyawali, in press), I measured the volume of a
firm‘s innovation output using the firm‘s patents. Prior research suggests that patents provide a
fairly reliable measure of innovation activity (Acs, Anselin, & Varga, 2002) and of innovation
performance (Sampson, 2007). Second, following Sampson (2007), I considered a one-year lag
between alliance announcement and patent application and measured the firm innovative
performance in a three-year post-alliance window. It takes time for an announced alliance to be
effective and for the participating firms to develop technologies for patent, which requires at
least a one-year lag. Further, as this study focuses on a dynamic perspective and learning effects,
I selected a period (three-year window) instead of a specific year. Third, consistent with previous
studies, I used the number of granted patents (Ahuja & Katila, 2004), giving weights with
citation numbers (Srivastava & Gnyawali, in press). Finally, to improve the matching of
innovations to alliances, I developed a new measure of firm innovation performance –
―coopetition-based‖ innovation output. This captures the innovation output only related to
coopetition and is based on the patent citation patterns in the focal firm‘s patent portfolio. As I
discussed in section 3.1.2, I captured the value from coopetition through three categories: 1)
value co-created with partners, 2) value through the application of partner knowledge, and 3)
value created by private efforts in the partner‘s domains. To capture the value of each category, I
separately measured innovation in the three categories. Then, I measured coopetition-based
innovation output by combining innovations from the three categories.
101
Joint innovation. This category captured the innovation performance through value co-
created with partners. If partner firms jointly develop new technologies, both companies
will apply for a patent together. So, if both companies were co-assignees to patents for
which they applied within three years (t1 ~ t3) after a focal alliance was announced, the
patents were categorized as ―joint innovation.‖
Innovation through the application of partner knowledge. Following Mowery et al.,
(1996), I captured knowledge transfer by citation. I considered only one-directional
citations from Firm i to Firm j. That is, Citation (Firm i, Firm j) = Citations to Firm j patents
in Firm i‘s patents. If a focal firm applied for patents that cited the specific partner‘s
patents, the patents were categorized as ―innovation through knowledge application.13‖
Innovation in the partner’s domains. This category captured the competition benefits
through additional private value creation efforts. If the focal firm applied for patents that
were categorized in the same patent classes as the other partner, the patents were
categorized as ―innovation in partner‘s domains.‖
Coopetition-based innovation performance = joint innovation+ innovation through the
application of partner knowledge+ innovation in the partner’s domains. If patents were
observed across categories, I only considered them once based on the likelihood of
coopetition relatedness. I assumed that joint innovation is more related to coopetition than
the other two categories, while innovation through the application of partner knowledge is
more related to coopetition than innovation in the partner‘s domains. Thus, if two partners
were co-assignees to a specific patent and the patent cited the partner‘s patents, I
13
To measure innovation through the application of partner knowledge and innovation in the partner‘s domains, I
considered the increase measured by the difference between post alliance and pre alliance outputs. Due to citation
lag, however, such measures generate many negative numbers that will violate the condition of my primary method,
negative binomial regression. Instead, I added pre sample innovation performance as a control variable.
102
categorized the patent as joint innovation. If a patent that was in the partner‘s domains
cited the partner‘s patents, I categorized the patent as innovation through the application of
partner knowledge.
Overall firm innovation output. The specific procedure was the same as with coopetition-
based innovation performance. I: 1) measured the volume of a firm‘s innovation output using
the firm‘s patents, 2) considered a one-year lag between alliance announcement and patent
application, 3) measured the firm innovative performance in a three-year post-alliance window,
and 4) used the number of granted patents and then weighted them using the number of citations.
The only difference between the two procedures was that this measure captured the focal firm‘s
entire innovation performance. This aligns with previous studies (Ahuja, 2000; Ahuja & Katila,
2004; Sampson, 2007; Srivastava & Gnyawali, in press). Thus, it could be used to compare
against my new measure of coopetition-based innovation performance. Further, this was the
dependant variable at the portfolio level of analysis.
4.2.4.2 Independent variables
Coopetition. I captured the intensity of coopetition based on the combination of two
components: 1) the intensity of competition between partners, and 2) the intensity of cooperation
between partners.
The intensity of competition between partners. The intensity of competition was
measured in terms of two types of competition – market competition (Market_comp) and
technology competition (Tech_comp). Such categorization of competition is based on Chen‘s
(1996) resource-based and market-side competition. Tech_comp captures the competition in
upstream activities, while Market_comp captures the competition in downstream activities.
While the market competition was measured by market commonality, the technology
103
competition was measured by similarity in technological resources (patent class overlap) as
follows:
Degree of market competition = Market commonality (SIC code overlap, firm type overlap,
and product market overlap in the same industry)
Degree of technology competition = Technology similarity (patent class overlap)
Market Competition (Market_comp) was measured by market commonality that refers to the
degree of overlap in the markets of the focal firm and its partners. The most common
measure for business relatedness (similarity) between two firms uses the SIC (or NAICS)
codes of the two firms (Wang & Zajac, 2008). However, this measure is too broad to reflect
competition in product segments. As discussed in section 4.2.2, there are six different types
of semiconductor firms (IDM, fabless, foundry, tester, equipment provider, and large
diversified firm) based on value-chain activities. Further, the semiconductor industry is
divided into several product market segments (refer to Figure 4.1). That is, even though two
firms are operating in the same industry based on SIC codes, they may not consider the other
to be a direct competitor if their firm type is different or they are producing different
products. Thus, I measured market commonality by SIC code (four levels based on 4-digit
SIC code), firm type, and product market segment (refer to Table 4.3).
First, I measured market commonality by using the SIC code. Adopting Wang and Zajac
(2008), I set the business similarity of two firms to be 0 if the four digits of the two firms‘
SIC codes are completely different, 0.2 if the first digit of the two firms‘ SIC codes are the
same, 0.4 if the first two digits of the two firms‘ SIC codes are the same, and 0.6 if the first
three digits of the two firms‘ SIC codes are the same. If the four digits of the two firms‘ SIC
codes are the same, I considered the firm types of the two partners. If the firm types are

104
different, I set the business similarity of two firms to be 0.8. Finally, if their firm types are
the same and product market segments overlap, I considered them to be direct competitors
and set the business similarity of two firms to 1.
In the process, categorization of the product market segment was tricky. First, I collected
information on the top players and segment leaders provided by semiconductor industry
research firms, such as iSupply Corp., Gartner Dataquest Corp., Cahners In-Stat Group, and
Semico Research Corp. However, the information did not include small firms or firms‘ full
business segments. Thus, I collected firm information and business descriptions from various
sources, such as LexisNexis Academic, company 10Ks, and firm homepages. A firm‘s
business description provides information about its primary businesses and firm type (e.g.,
fabless, foundry, and tester). Second, I organized the product market segments (refer to
Figure 4.1). Finally, I slotted each firm into product market segments. As some firms operate
in multiple segments, I coded all categories in which firms were engaged. However, I was
not sure how to categorize some firms‘ (around 20 percent of the samples) business segments.
Thus, I received help from an expert in categorization who assessed my coding.
TABLE 4.3 Rating the Market Competition
Criterion Ratio
Step1: SIC code
overlap
If the four digits of the two firms‘ SIC codes are completely
different
0.0
If the first digit of the two firms‘ SIC codes are same 0.2
If the first two digits of the two firms‘ SIC codes are same 0.4
If the first three digits of the two firms‘ SIC codes are same 0.6
Step2: Firm type
overlap
If the four digits of the two firms‘ SIC codes are same but the
firm types are different. In case the firm types are IDM (or
fabless), product market segments are not overlapped.
0.8
Step3: Product
market segment
overlap
If the four digits of the two firms‘ SIC codes are the same and
the firm types are IDM (or fabless). At least one product
market segment overlaps.
1.0
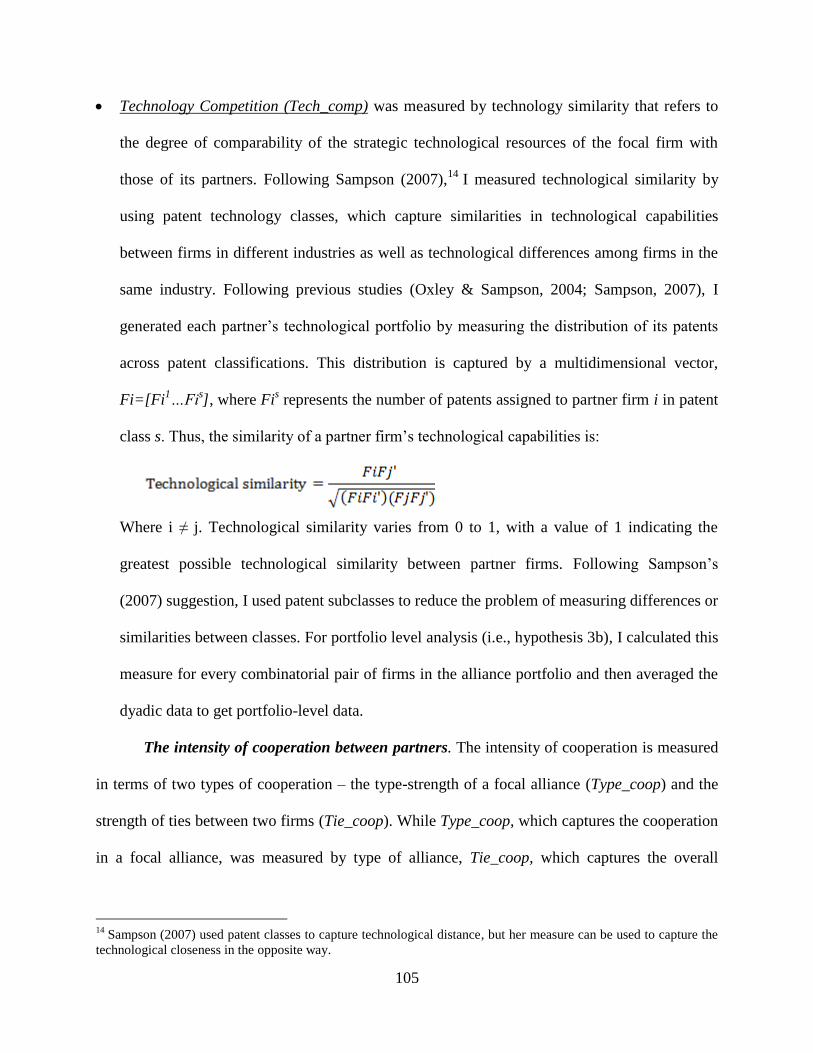
105
Technology Competition (Tech_comp) was measured by technology similarity that refers to
the degree of comparability of the strategic technological resources of the focal firm with
those of its partners. Following Sampson (2007),14
I measured technological similarity by
using patent technology classes, which capture similarities in technological capabilities
between firms in different industries as well as technological differences among firms in the
same industry. Following previous studies (Oxley & Sampson, 2004; Sampson, 2007), I
generated each partner‘s technological portfolio by measuring the distribution of its patents
across patent classifications. This distribution is captured by a multidimensional vector,
Fi=[Fi1…Fi
s], where Fi
s represents the number of patents assigned to partner firm i in patent
class s. Thus, the similarity of a partner firm‘s technological capabilities is:
Where i ≠ j. Technological similarity varies from 0 to 1, with a value of 1 indicating the
greatest possible technological similarity between partner firms. Following Sampson‘s
(2007) suggestion, I used patent subclasses to reduce the problem of measuring differences or
similarities between classes. For portfolio level analysis (i.e., hypothesis 3b), I calculated this
measure for every combinatorial pair of firms in the alliance portfolio and then averaged the
dyadic data to get portfolio-level data.
The intensity of cooperation between partners. The intensity of cooperation is measured
in terms of two types of cooperation – the type-strength of a focal alliance (Type_coop) and the
strength of ties between two firms (Tie_coop). While Type_coop, which captures the cooperation
in a focal alliance, was measured by type of alliance, Tie_coop, which captures the overall
14
Sampson (2007) used patent classes to capture technological distance, but her measure can be used to capture the
technological closeness in the opposite way.
106
cooperation (beyond the focal alliance) between two firms, was measured by repeated ties and
concurrent linkages, as follows:
The type-strength of a focal alliance (Type_coop). Scholars suggest that the strength in
cooperation depends on the type of cooperation. Following previous studies (e.g., Contractor
& Lorange, 1988; Nohria & Garcia-Point, 1991; Srivastava, 2007), I used a weighing
scheme, which is meant to reflect the strength of cooperation, based on the types of
collaboration (e.g., R&D, manufacturing, marketing, and licensing) across multiple scopes.
Following Srivastava (2007), the weighing scheme in this study is based on the likelihood of
knowledge transfer and learning potential in an alliance. In accordance with Contractor and
Lorange (1988), R&D value chain activity receives the highest weight. In the semiconductor
industry, manufacturing and cross-licensing alliances also play very important roles in the
transfer of knowledge between partners (Grindley & Teece, 1997). Licensing and marketing
alliances receive the least weight. This aligns with Anand and Khanna‘s (2000) finding that
the effects of learning on value creation are strongest for research joint ventures, followed by
production, and weakest for marketing joint ventures. As alliances may involve cooperation
across multiple value-chain activities, the weight of a given alliance is a function of value-
chain activities involved in the alliance. I assumed that the effects of JVs are twice as strong
as the effects of contracts. Adopting Srivastava and Gnyawali (in press) and considering JV's,
I used the following formula:
The type-strength of a focal alliance (Type_coop) = (4*R&D + 3*Manufacturing +
2*Cross licensing + Licensing + Marketing + Tech-Transfer) *JV weight (joint venture 2,
alliance 1)
The strength of ties between partners (Tie_coop). The overall strength of ties between two
firms is also based on the likelihood of knowledge transfer and learning potential in an
107
alliance. I conceptualized the strength of ties at the dyadic level as the overall cooperative
relationship between two firms, which was operationalized by repeated ties and concurrent
multiple linkages. Interestingly, repeated ties and concurrent multiple ties are informal
safeguards based on the relationships between two firms beyond the focal alliance. In regard
to measurement, repeated ties and concurrent multiple linkages were measured in a
sophisticated way. First, they were rated based on the number of ties. Repeated ties is the
accumulated number of alliances with the same partner over five years beginning the year (t-5
~ t-1) prior to the start of the focal alliance. Concurrent multiple linkages is the number of
current linkages (alliances announced in the same (t0) and following (t1) years of the focal
alliance) with the same partner except the focal alliance. It was 0 if there was no repeated tie
or multiple linkages. Second, the effects of joint ventures are stronger than those of contracts,
such as licensing (Anand & Khanna, 2000). I assumed that the effects of JVs are twice as
strong as the effects of contracts. Finally, the benefits of prior alliance experience may
depreciate rapidly over time. Recent experience can be a more salient source of inference and
contribution to the learning, which will become more relevant to current strategic choices
(Sampson, 2005). To reflect the temporal characteristics of learning experience stored in
organizational memory, I employed a discounted measure of firm experience by year. I
assumed that the real value of each repeated tie will depreciate 20 percent a year as follows:
joint ventures (1, 0.8, 0.6, 0.4, 0.2 until the fifth year), contracts (0.5, 0.4, 0.3, 0.2, 0.1 until
the fifth year).
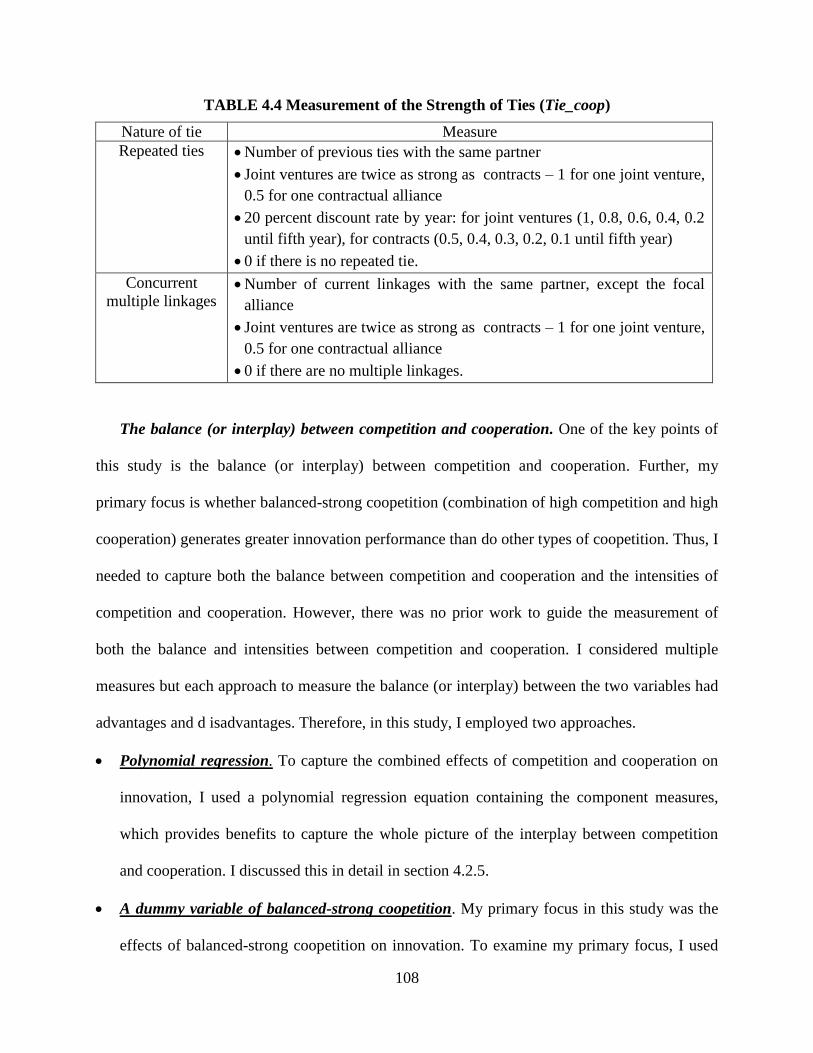
108
TABLE 4.4 Measurement of the Strength of Ties (Tie_coop)
Nature of tie Measure
Repeated ties Number of previous ties with the same partner
Joint ventures are twice as strong as contracts – 1 for one joint venture,
0.5 for one contractual alliance
20 percent discount rate by year: for joint ventures (1, 0.8, 0.6, 0.4, 0.2
until fifth year), for contracts (0.5, 0.4, 0.3, 0.2, 0.1 until fifth year)
0 if there is no repeated tie.
Concurrent
multiple linkages Number of current linkages with the same partner, except the focal
alliance
Joint ventures are twice as strong as contracts – 1 for one joint venture,
0.5 for one contractual alliance
0 if there are no multiple linkages.
The balance (or interplay) between competition and cooperation. One of the key points of
this study is the balance (or interplay) between competition and cooperation. Further, my
primary focus is whether balanced-strong coopetition (combination of high competition and high
cooperation) generates greater innovation performance than do other types of coopetition. Thus, I
needed to capture both the balance between competition and cooperation and the intensities of
competition and cooperation. However, there was no prior work to guide the measurement of
both the balance and intensities between competition and cooperation. I considered multiple
measures but each approach to measure the balance (or interplay) between the two variables had
advantages and d isadvantages. Therefore, in this study, I employed two approaches.
Polynomial regression. To capture the combined effects of competition and cooperation on
innovation, I used a polynomial regression equation containing the component measures,
which provides benefits to capture the whole picture of the interplay between competition
and cooperation. I discussed this in detail in section 4.2.5.
A dummy variable of balanced-strong coopetition. My primary focus in this study was the
effects of balanced-strong coopetition on innovation. To examine my primary focus, I used
109
dummy variables, which was a supplement approach to polynomial regression. I created
dummy variables based on typologies with a 2x2 matrix. The dummy variable was 1 if the
samples were in the category of balanced-strong coopetition, 0 if not. An issue was the
criterion to categorize balanced-strong coopetition. I used three criteria: 1) over the mean
values, 2) over mean + 0.5 standard deviation, and 3) over mean + 1 standard deviation.
While all other variables were based on continuous scales, market competition
(Market_comp) was based on an ordinal scale. Thus, I set the criteria to create dummy
variables as follows: 1) Market_comp was greater than 0.4 (over mean) when the partners‘ 2-
digit SIC codes were the same; 2) Market_comp was greater than 0.8 when the partners‘ 4-digit
SIC codes were the same; and 3) Market_comp was 1 when the partners are in the same industry
(partners‘ 4-dight SIC codes were the same), took the same types of firm, and played in the same
product segment.
The ratio of balanced-strong coopetition in an alliance portfolio. Although my theoretical
arguments are based on the dyadic alliances of the focal firms that were listed in SIC code
3674, I also tested hypothesis 3b at the portfolio level. Following previous works (e.g., Lavie,
2007; Srivastava & Gnyawali, in press), the ―firm-year‖ was considered the operational unit
of portfolio level analysis. In addition, adopting Baum et al. (2000), I considered alliances
that were founded in previous years and were still in existence in a sampling year.
4.2.4.3 Moderators
Coopetition experience. I measured coopetition experience by the accumulated number
of alliances with competitors (partners belonging to the same 4-digit SIC code) to the year prior
to the start of the focal alliance. I captured coopetition experience in two different ways. First, I
measured the accumulated number of alliances with competitors (partners belonging to the same
110
4-digit SIC code). I considered depreciation of 20 percent a year. Second, I measured the
adjusted number of coopetition experiences by the types of alliance. That is, I calculated the
adjusted number of coopetition experiences by multiplying the number of coopetitions with type
strength that I discussed above. Coopetition experience is different from repeated ties, which is a
key segment of the quality of cooperation. While repeated ties means previous alliances with the
same partner, coopetition experience excludes alliances with the same partner if the partner is not
a competitor, but includes previous alliances with any competitor-partners. Nonetheless, there is
concern about multicollinearity. Therefore, the results of the moderating effects of coopetition
experience in the relationship between coopetition (including tie_coop) and innovation
performance should be interpreted cautiously.
4.2.4.4 Control variables
I controlled for the effects of other variables that may affect patent generation by the
focal firms. Based on prior literature, I identified the variables mainly from the characteristics of
focal firms themselves and alliance portfolio characteristics. Further, to control specific effects
related to this research, I considered pre sample innovation, firm types, and year dummies.
Pre sample innovation. Prior patents capture a firm‘s technological capabilities (Patel &
Pavitt, 1997), R&D spending, a firm‘s propensity to patent (Trajtenberg, 1990), and the
knowledge stock of focal firms that may account for permanent unobserved heterogeneity among
the sample firms (Schilling & Phelps, 2007). Following previous research practice (Ahuja &
Katila, 2001; Sampson, 2007; Srivastava & Gnyawali, in press), I used the sum of patents
obtained by the focal firm during the five years prior to entering the sample.
Focal firm’s sales. The literature shows that size provides a number of advantages, such
as a larger store of technological knowledge and capabilities (Damanpour, 1991), greater
111
economies of scale (Cohen & Klepper, 1996), and the resources to tolerate an occasional
unsuccessful R&D project (Damanpour, 1991). Sales of a firm may indicate its size (Cohen &
Klepper, 1996; Sorensen & Stuart, 2000). Prerior studies used the log value of the focal firm‘s
sales (Hitt, Hoskisson, Johnson, & Moesel, 1996; Mesquita, Anand, & Brush, 2008) or number
of employees (Ahuja & Katila, 2001; Hitt et al., 1996) to measure its size. I used the log value of
the focal firm‘s sales.
Number of ties. Number of ties represents the portfolio size and its centrality. Previous
research reports that a higher degree of centrality benefits firms by bringing more new resources,
growth opportunities, and innovation capabilities. Ahuja (2000) reports that in the chemical
industry, more direct ties enhanced a firm‘s patenting rate. I measured direct ties by the sum of a
focal firm‘s alliances in the year that a focal alliance was announced.
Firm age. I measured firm age as the log value of the difference between the year of
observation and the year of firm incorporation.
Type of the firm. Considering integrated device manufacturing (IDM) as the basis, I
controlled for other types of firm (such as fabless, foundries, testers, and equipment providers) as
it may affect their patenting strategies.
Year dummy. Due to citation lag and a result of truncation, more recent patents may have
received fewer numbers of citations than patents that were generated earlier (Hall, Jaffe, &
Trajtenberg, 2001). By adding year dummies from 1991 to 2003, I controlled for the effects of
systemic difference in numbers of citations to the patents year over year.
Table 4.5 lists the dependent and independent variables, their description, and
measurement. This table provides a snapshot view of variables and their measurement.
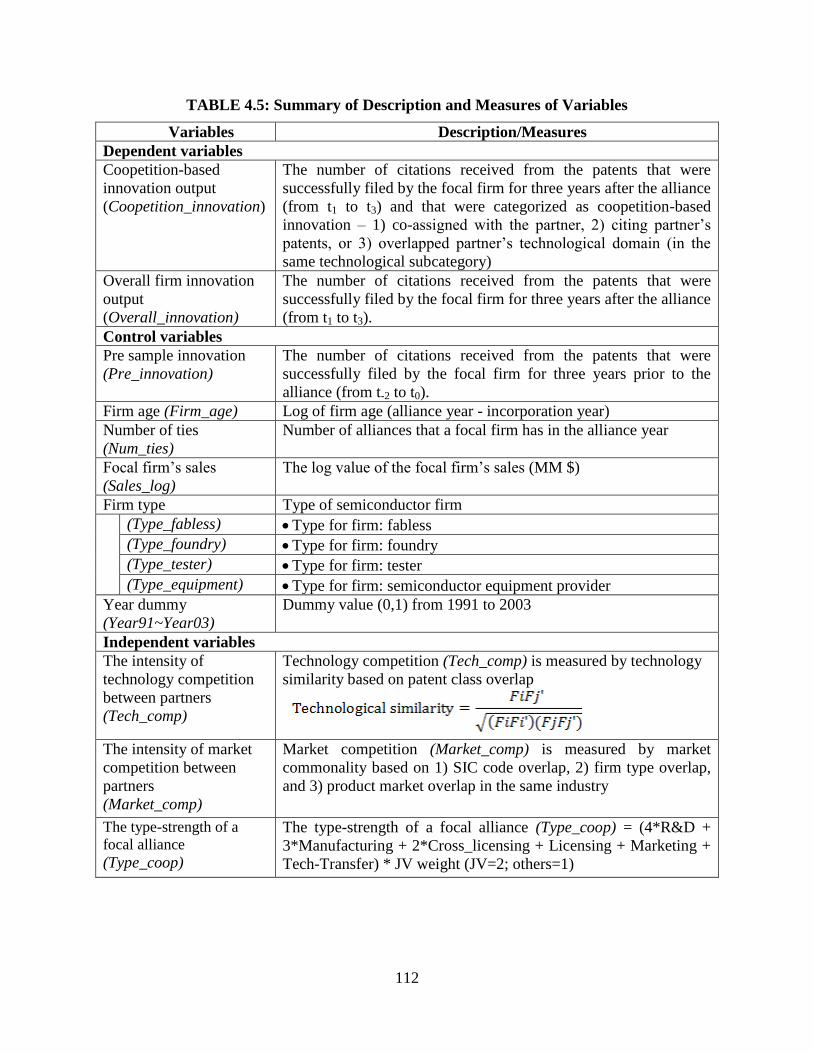
112
TABLE 4.5: Summary of Description and Measures of Variables
Variables Description/Measures
Dependent variables
Coopetition-based
innovation output
(Coopetition_innovation)
The number of citations received from the patents that were
successfully filed by the focal firm for three years after the alliance
(from t1 to t3) and that were categorized as coopetition-based
innovation – 1) co-assigned with the partner, 2) citing partner‘s
patents, or 3) overlapped partner‘s technological domain (in the
same technological subcategory)
Overall firm innovation
output
(Overall_innovation)
The number of citations received from the patents that were
successfully filed by the focal firm for three years after the alliance
(from t1 to t3).
Control variables
Pre sample innovation
(Pre_innovation)
The number of citations received from the patents that were
successfully filed by the focal firm for three years prior to the
alliance (from t-2 to t0).
Firm age (Firm_age) Log of firm age (alliance year - incorporation year)
Number of ties
(Num_ties)
Number of alliances that a focal firm has in the alliance year
Focal firm‘s sales
(Sales_log)
The log value of the focal firm‘s sales (MM $)
Firm type Type of semiconductor firm
(Type_fabless) Type for firm: fabless
(Type_foundry) Type for firm: foundry
(Type_tester) Type for firm: tester
(Type_equipment) Type for firm: semiconductor equipment provider
Year dummy
(Year91~Year03)
Dummy value (0,1) from 1991 to 2003
Independent variables
The intensity of
technology competition
between partners
(Tech_comp)
Technology competition (Tech_comp) is measured by technology
similarity based on patent class overlap
The intensity of market
competition between
partners
(Market_comp)
Market competition (Market_comp) is measured by market
commonality based on 1) SIC code overlap, 2) firm type overlap,
and 3) product market overlap in the same industry
The type-strength of a
focal alliance
(Type_coop)
The type-strength of a focal alliance (Type_coop) = (4*R&D +
3*Manufacturing + 2*Cross_licensing + Licensing + Marketing +
Tech-Transfer) * JV weight (JV=2; others=1)
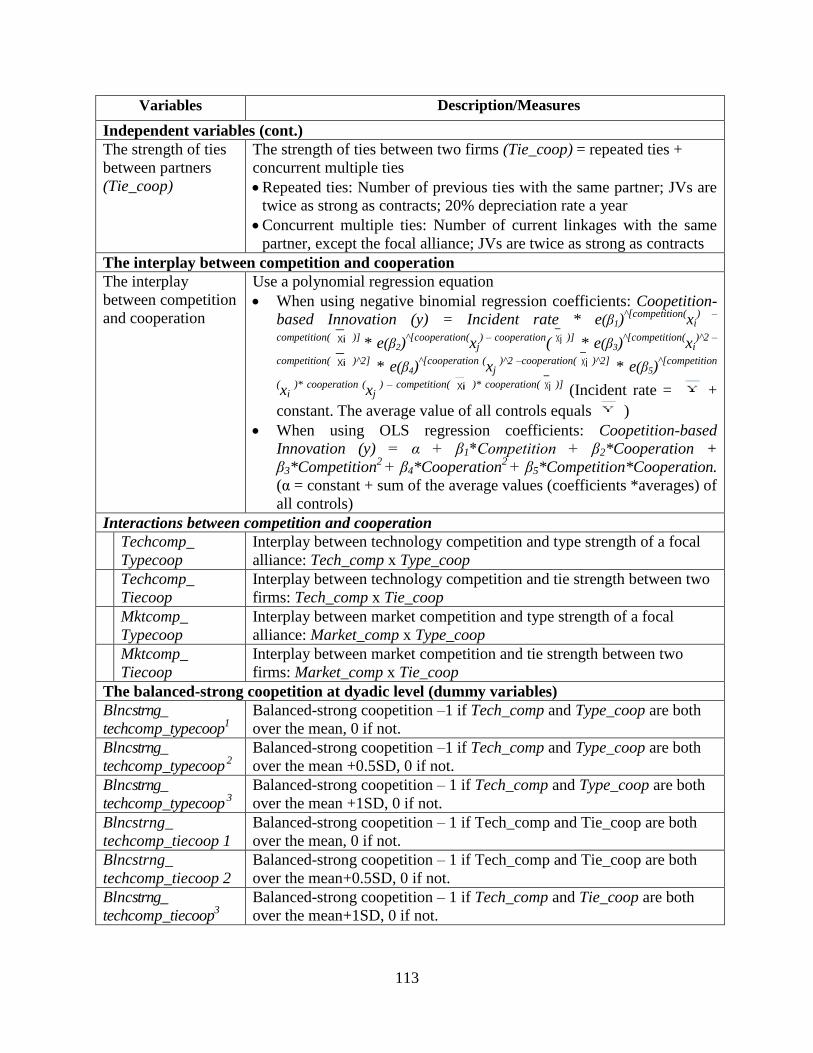
113
Variables Description/Measures
Independent variables (cont.)
The strength of ties
between partners
(Tie_coop)
The strength of ties between two firms (Tie_coop) = repeated ties +
concurrent multiple ties
Repeated ties: Number of previous ties with the same partner; JVs are
twice as strong as contracts; 20% depreciation rate a year
Concurrent multiple ties: Number of current linkages with the same
partner, except the focal alliance; JVs are twice as strong as contracts
The interplay between competition and cooperation
The interplay
between competition
and cooperation
Use a polynomial regression equation
When using negative binomial regression coefficients: Coopetition-
based Innovation (y) = Incident rate * e(β1)^[competition(
xi) –
competition( )] * e(β2)
^[cooperation(xj
) – cooperation(
)] * e(β3)
^[competition(xi
)^2 –
competition( )^2] * e(β4)
^[cooperation (xj
)^2 –cooperation( )^2] * e(β5)
^[competition
(xi
)* cooperation (xj
) – competition( )* cooperation( )] (Incident rate = +
constant. The average value of all controls equals )
When using OLS regression coefficients: Coopetition-based
Innovation (y) = α + β1*Competition + β2*Cooperation +
β3*Competition2
+ β4*Cooperation2
+ β5*Competition*Cooperation.
(α = constant + sum of the average values (coefficients *averages) of
all controls)
Interactions between competition and cooperation
Techcomp_
Typecoop
Interplay between technology competition and type strength of a focal
alliance: Tech_comp x Type_coop
Techcomp_
Tiecoop
Interplay between technology competition and tie strength between two
firms: Tech_comp x Tie_coop
Mktcomp_
Typecoop
Interplay between market competition and type strength of a focal
alliance: Market_comp x Type_coop
Mktcomp_
Tiecoop
Interplay between market competition and tie strength between two
firms: Market_comp x Tie_coop
The balanced-strong coopetition at dyadic level (dummy variables)
Blncstrng_
techcomp_typecoop1
Balanced-strong coopetition –1 if Tech_comp and Type_coop are both
over the mean, 0 if not.
Blncstrng_
techcomp_typecoop 2
Balanced-strong coopetition –1 if Tech_comp and Type_coop are both
over the mean +0.5SD, 0 if not.
Blncstrng_
techcomp_typecoop 3
Balanced-strong coopetition – 1 if Tech_comp and Type_coop are both
over the mean +1SD, 0 if not.
Blncstrng_
techcomp_tiecoop 1
Balanced-strong coopetition – 1 if Tech_comp and Tie_coop are both
over the mean, 0 if not.
Blncstrng_
techcomp_tiecoop 2
Balanced-strong coopetition – 1 if Tech_comp and Tie_coop are both
over the mean+0.5SD, 0 if not.
Blncstrng_
techcomp_tiecoop3
Balanced-strong coopetition – 1 if Tech_comp and Tie_coop are both
over the mean+1SD, 0 if not.
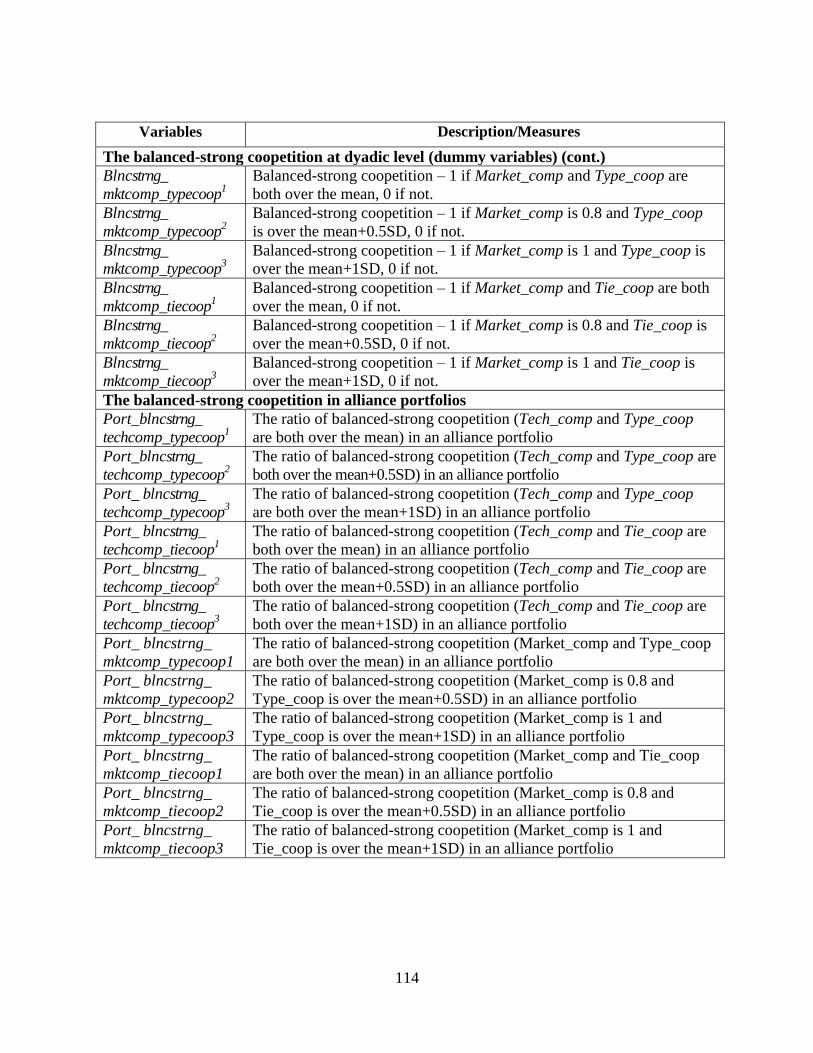
114
Variables Description/Measures
The balanced-strong coopetition at dyadic level (dummy variables) (cont.)
Blncstrng_
mktcomp_typecoop1
Balanced-strong coopetition – 1 if Market_comp and Type_coop are
both over the mean, 0 if not.
Blncstrng_
mktcomp_typecoop2
Balanced-strong coopetition – 1 if Market_comp is 0.8 and Type_coop
is over the mean+0.5SD, 0 if not.
Blncstrng_
mktcomp_typecoop3
Balanced-strong coopetition – 1 if Market_comp is 1 and Type_coop is
over the mean+1SD, 0 if not.
Blncstrng_
mktcomp_tiecoop1
Balanced-strong coopetition – 1 if Market_comp and Tie_coop are both
over the mean, 0 if not.
Blncstrng_
mktcomp_tiecoop2
Balanced-strong coopetition – 1 if Market_comp is 0.8 and Tie_coop is
over the mean+0.5SD, 0 if not.
Blncstrng_
mktcomp_tiecoop3
Balanced-strong coopetition – 1 if Market_comp is 1 and Tie_coop is
over the mean+1SD, 0 if not.
The balanced-strong coopetition in alliance portfolios
Port_blncstrng_
techcomp_typecoop1
The ratio of balanced-strong coopetition (Tech_comp and Type_coop
are both over the mean) in an alliance portfolio
Port_blncstrng_
techcomp_typecoop2
The ratio of balanced-strong coopetition (Tech_comp and Type_coop are
both over the mean+0.5SD) in an alliance portfolio
Port_ blncstrng_
techcomp_typecoop3
The ratio of balanced-strong coopetition (Tech_comp and Type_coop
are both over the mean+1SD) in an alliance portfolio
Port_ blncstrng_
techcomp_tiecoop1
The ratio of balanced-strong coopetition (Tech_comp and Tie_coop are
both over the mean) in an alliance portfolio
Port_ blncstrng_
techcomp_tiecoop2
The ratio of balanced-strong coopetition (Tech_comp and Tie_coop are
both over the mean+0.5SD) in an alliance portfolio
Port_ blncstrng_
techcomp_tiecoop3
The ratio of balanced-strong coopetition (Tech_comp and Tie_coop are
both over the mean+1SD) in an alliance portfolio
Port_ blncstrng_
mktcomp_typecoop1
The ratio of balanced-strong coopetition (Market_comp and Type_coop
are both over the mean) in an alliance portfolio
Port_ blncstrng_
mktcomp_typecoop2
The ratio of balanced-strong coopetition (Market_comp is 0.8 and
Type_coop is over the mean+0.5SD) in an alliance portfolio
Port_ blncstrng_
mktcomp_typecoop3
The ratio of balanced-strong coopetition (Market_comp is 1 and
Type_coop is over the mean+1SD) in an alliance portfolio
Port_ blncstrng_
mktcomp_tiecoop1
The ratio of balanced-strong coopetition (Market_comp and Tie_coop
are both over the mean) in an alliance portfolio
Port_ blncstrng_
mktcomp_tiecoop2
The ratio of balanced-strong coopetition (Market_comp is 0.8 and
Tie_coop is over the mean+0.5SD) in an alliance portfolio
Port_ blncstrng_
mktcomp_tiecoop3
The ratio of balanced-strong coopetition (Market_comp is 1 and
Tie_coop is over the mean+1SD) in an alliance portfolio
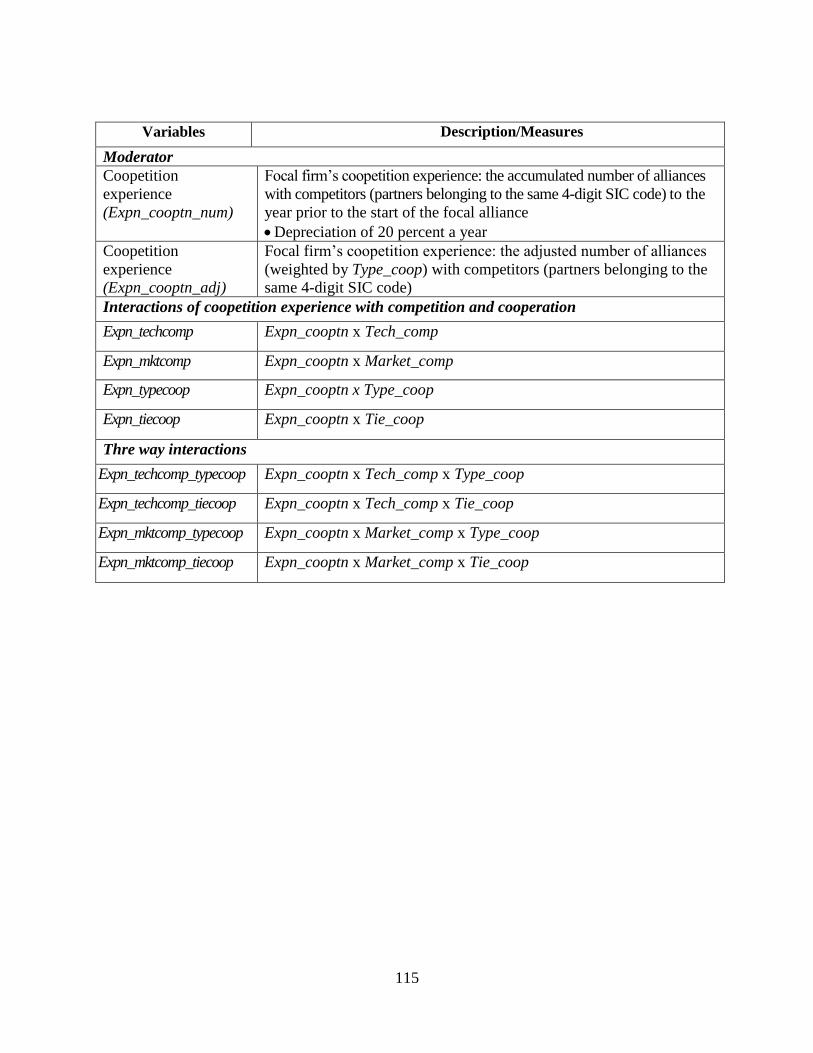
115
Variables Description/Measures
Moderator
Coopetition
experience
(Expn_cooptn_num)
Focal firm‘s coopetition experience: the accumulated number of alliances
with competitors (partners belonging to the same 4-digit SIC code) to the
year prior to the start of the focal alliance
Depreciation of 20 percent a year
Coopetition
experience
(Expn_cooptn_adj)
Focal firm‘s coopetition experience: the adjusted number of alliances
(weighted by Type_coop) with competitors (partners belonging to the
same 4-digit SIC code)
Interactions of coopetition experience with competition and cooperation
Expn_techcomp Expn_cooptn x Tech_comp
Expn_mktcomp Expn_cooptn x Market_comp
Expn_typecoop Expn_cooptn x Type_coop
Expn_tiecoop Expn_cooptn x Tie_coop
Thre way interactions
Expn_techcomp_typecoop Expn_cooptn x Tech_comp x Type_coop
Expn_techcomp_tiecoop Expn_cooptn x Tech_comp x Tie_coop
Expn_mktcomp_typecoop Expn_cooptn x Market_comp x Type_coop
Expn_mktcomp_tiecoop Expn_cooptn x Market_comp x Tie_coop
116
4.2.5 Statistical Methods
I tested the hypotheses using two different statistical methods. First, using negative
binomial regression, I tested the entire model, including the direct effects of independent
variables (the intensities of competition and cooperation) and the balance of competition and
cooperation on the dependent variable (coopetition-based innovation) as well as the moderating
effects of coopetition capabilities on the relationship between coopetition and coopetition-based
innovation. Second, I used polynomial regression that enables researchers to test congruence
hypotheses in a more comprehensive way. Using polynomial regression, I tested the direct effects
of independent variables and the joint effect of the two independent variables on dependent
variable (innovation performance).
Negative binomial regression. The dependent variable, the number of patents for which a
focal firm applies in given years, is a count variable. Further, this variable takes only non-
negative integer values (Sampson, 2007). Therefore, the linear regression model may not be
appropriate (Long & Freese, 2006). A Poisson regression provides a baseline model for such
count data but the basic Poisson model makes the strong assumption that there is no
heterogeneity in the sample. However, for count data, the variance may often exceed the mean.
The presence of such over-dispersion causes standard errors of parameters to be underestimated,
resulting in the overstatement of levels of statistical significance. To correct for over-dispersion,
a negative binomial regression model can be used. The negative binomial regression model
―addresses the failure of the Poisson regression model, by adding a parameter, α, that reflects
unobserved heterogeneity among observations‖ (Long & Freese, 2006:372). The parameter α
indicates the degree of dispersion in the predictions. When α is zero, the negative binomial
regression model becomes the same as the Poisson regression model. Another advantage of a
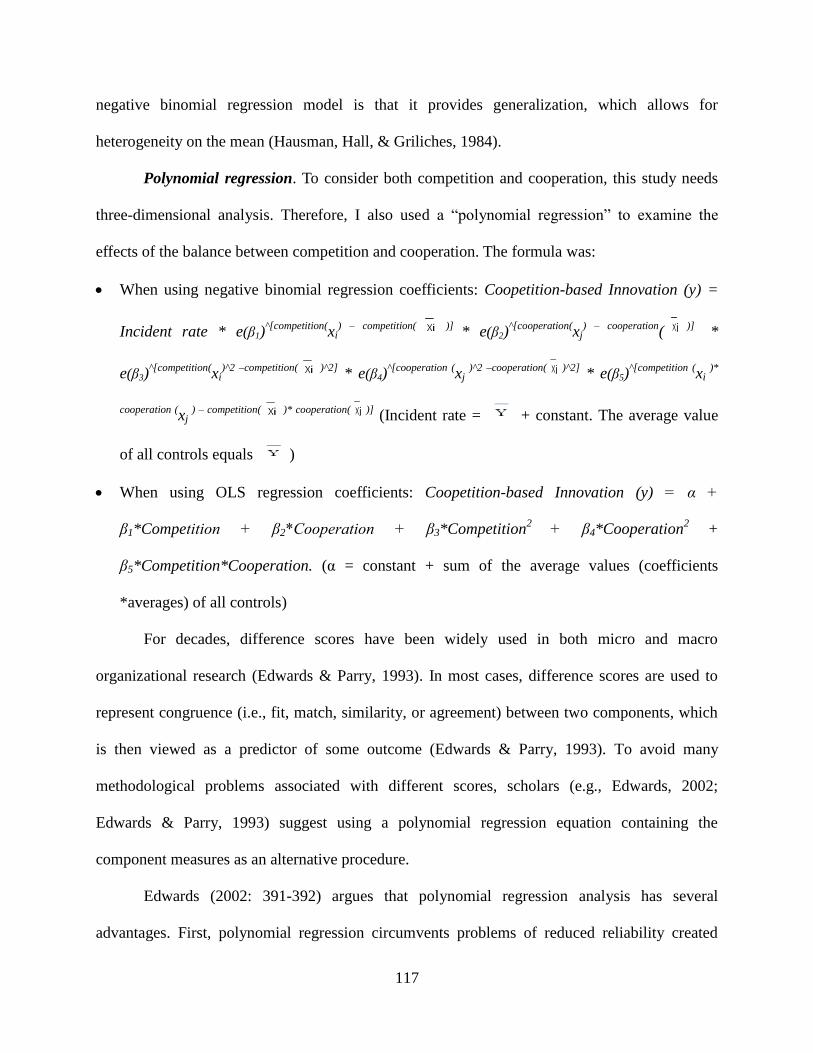
117
negative binomial regression model is that it provides generalization, which allows for
heterogeneity on the mean (Hausman, Hall, & Griliches, 1984).
Polynomial regression. To consider both competition and cooperation, this study needs
three-dimensional analysis. Therefore, I also used a ―polynomial regression‖ to examine the
effects of the balance between competition and cooperation. The formula was:
When using negative binomial regression coefficients: Coopetition-based Innovation (y) =
Incident rate * e(β1)^[competition(
xi) – competition( )]
* e(β2)^[cooperation(
xj) – cooperation
()]
*
e(β3)^[competition(
xi)^2 –competition( )^2]
* e(β4)^[cooperation (
xj )^2 –cooperation( )^2]
* e(β5)^[competition (
xi )*
cooperation (xj
) – competition( )* cooperation( )] (Incident rate = + constant. The average value
of all controls equals )
When using OLS regression coefficients: Coopetition-based Innovation (y) = α +
β1*Competition + β2*Cooperation + β3*Competition2
+ β4*Cooperation2
+
β5*Competition*Cooperation. (α = constant + sum of the average values (coefficients
*averages) of all controls)
For decades, difference scores have been widely used in both micro and macro
organizational research (Edwards & Parry, 1993). In most cases, difference scores are used to
represent congruence (i.e., fit, match, similarity, or agreement) between two components, which
is then viewed as a predictor of some outcome (Edwards & Parry, 1993). To avoid many
methodological problems associated with different scores, scholars (e.g., Edwards, 2002;
Edwards & Parry, 1993) suggest using a polynomial regression equation containing the
component measures as an alternative procedure.
Edwards (2002: 391-392) argues that polynomial regression analysis has several
advantages. First, polynomial regression circumvents problems of reduced reliability created
118
when component measures are subtracted from one another. Second, by using component
measures in their original form, polynomial regression avoids ambiguities that result when the
component measures are reduced to a single score. Third, whereas different scores confound the
effects of their components, polynomial regression allows comprehensive assessment of the
separate and joint effects of the components. Finally, polynomial regression preserves the
inherently three-dimensional relationship between the components and the outcome, thereby
enabling researchers to develop and test congruence hypotheses that are more comprehensive
and complex than the simplified models implied by difference scores.
I reported both 1) the regression tables including interaction terms of competition and
cooperation and 2) the figures portrayed in terms of quadratic regression equations of the
interplay between competition and cooperation and their corresponding three dimensional
response surfaces. I examined both the regression coefficients and the shape of the figures to test
the hypotheses. Despite the advantages of polynomial equations, the interpretative difficulties
prevent the widespread use of polynomial regression equations in the study (Edwards, 2002). To
overcome the interpretative difficulties, scholars (e.g., Edwards, 2002) suggest using the
response surface methodology, which provides a framework for testing and interpreting
polynomial regression equations. Based on the response surface methodology, I focused on two
features of surfaces: 1) stationary point (i.e., the point at which the slope of the surface is 0 in all
directions), and 2) the slope of the surface along various lines of interest.

119
5.0 RESULTS AND ANALYSIS
In this chapter, I discuss the test results of the hypotheses described in Chapter 4. As
mentioned in the previous chapter, I primarily used negative binomial regression to test the
effects of coopetition and coopetition capability on innovation performance. To further
investigate the relationships that some hypotheses expect, I additionally used polynomial
regression that gives more concrete pictures of the relationships. Following the results of the
hypothesis testing by quantitative analysis, the last section (section 5.7) provides the findings of
the qualitative empirical research that provide illustrative support for several hypotheses,
including hypotheses 4b and 4c.
5.1 Descriptive Statistics (Sample Characteristics)
Table 5.1 reports the means, standard deviation, and minimum and maximum values of all
the variables for the sample alliances. Table 5.2 reports the Pearson correlation among all the
variables. Table 5.3 reports the Pearson correlation among the variables in alliance portfolio level.
The asterisk in Tables 5.2 and 5.3 indicates that the Pearson correlation coefficient is significant
at the 0.05 or lower level. Refer to Table 4.5 (in section 4.2.4) that describes the variables used to
test the hypotheses.
In this study, I provided a new measure of innovation performance – coopetition-based
innovation. I measured the coopetition-based innovation performance as the sum of the citations
received by the focal firm‘s patents in three categories: 1) co-assigned patents, 2) patents citing
the partner‘s patents, and 3) patents in the same subclasses as the partner‘s patents. In the
hypothesis testing and analysis, I primarily used the new measure of innovation performance –
120
coopetition-based innovation15
.
Model 0 in Table 5.4 is the base model that shows the effects of only control variables with
a one-year lag. Like previous studies, I input sales, firm age, number of ties, and pre-sample
patents as primary control variables. The effects of sales and pre-sample patents on the
innovation output are positive and significant. In this study, I input additional control variables or
excluded a typical control variable as follows. First, I input year dummies from 1991 through
2003 to control for the effects of the systemic difference in citations year over year.16
. The
coefficients of year dummies in the base model (model 0) clearly show that there are significant
effects from the timing of patent. While there are significant positive effects from 1991 to 1993,
there are significant negative effects from 1998 to 2003. The effects of the period from 1994 to
1997 are not significant. Year dummy variables were included in all regression tables but I only
presented year dummy variables in Tables 5.4 and 5.5 and did not present them for the models in
other tables to save space.
Second, I added firm type (such as fabless, foundries, and testers) as a control because firms
with different types may differ in their patenting strategies. Among the firm types, the effect of a
semiconductor equipment provider on innovation is negative and significant. Third, I excluded
R&D from the control list because sales and R&D were highly correlated and there were many
missing values on R&D. Correlations among control variables are still high. However, high
correlation between control variables does not influence estimates of the independent variables
(Wooldridge, 2009: 98).
Finally, adjusted the standard errors for focal firms‘ multiple alliances. Sampson (2005)
15
To ensure this measure is appropriate, I compared it with overall innovation performance which was a typical
measure used in the literature (refer to Appendix A). Results reported were based on this measure
(Coopetition_innovation). 16
Hall et al. (2001) observed the decline in the number of citations received in recent years, which is a result of
truncation. Thus, truncation reinforces the need to use appropriate controls for the timing of citations.
121
noted that, when a firm is involved in multiple alliances during the same period, not all errors are
independent. To correct for the lack of independence between observations involving the same
firm, Sampson (2005) used a technique that creates a super observation. Following the technique
(using cluster command in stata), I adjusted standard errors to address the correlation among
observations issue as there are repeated observations for many firms. Thus, standard errors were
adjusted for 118 clusters based on focal firms.
I discuss four kinds of coopetition based on the combinations of two kinds of competition –
technology competition (Tech_comp) and market competition (Market_comp) – and two kinds of
cooperation – a cooperative type of a focal alliance (Type_coop) and overall cooperation between
two partners beyond the focal alliance (Tie_coop). As I noted in section 4.2.4.2, Tech_comp
captures the competition in upstream activities, while Market_comp captures the competition in
downstream activities. Further, Type_coop captures the cooperation in a focal alliance, while
Tie_coop captures the overall cooperation (beyond the focal alliance) between two firms. Even
though I used different kinds of competition and cooperation, I expected the effects of the two
types of competition (and the effects of the two types of cooperation) would be similar and did
not develop separate hypotheses for each type of competition and cooperation. Different from my
expectations, however, there are low correlations between competition measures (correlation
between Tech_comp and Market_comp: 0.18) and between cooperation measures (correlation
between Type_coop and Tie_coop: 0.02). This lack of strong correlation between related
measures causes concern about construct validity of one or both of them.
In the following sections, I first discuss the effects of competition (H1) and cooperation (H2)
on coopetition-based innovation,b then the effects of the balance between competition and
cooperation both at the dyadic level (H3a) and at the alliance portfolio level (H3b), and finally the
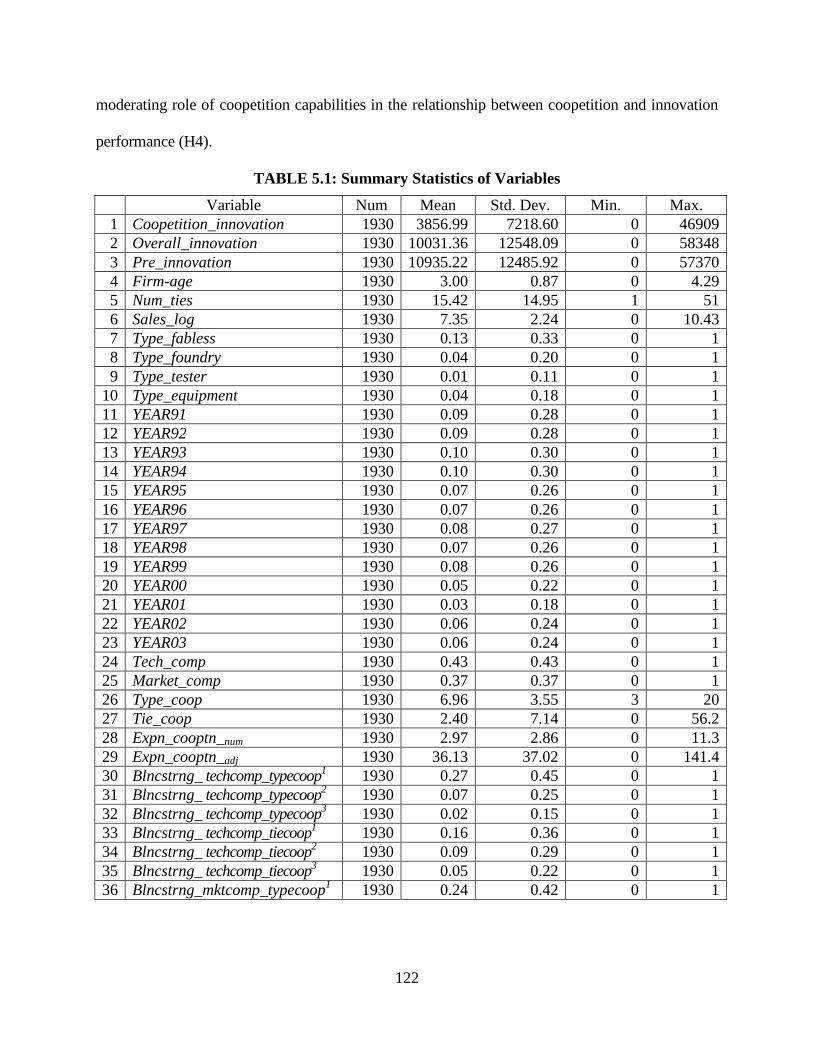
122
moderating role of coopetition capabilities in the relationship between coopetition and innovation
performance (H4).
TABLE 5.1: Summary Statistics of Variables
Variable Num Mean Std. Dev. Min. Max.
1 Coopetition_innovation 1930 3856.99 7218.60 0 46909
2 Overall_innovation 1930 10031.36 12548.09 0 58348
3 Pre_innovation 1930 10935.22 12485.92 0 57370
4 Firm-age 1930 3.00 0.87 0 4.29
5 Num_ties 1930 15.42 14.95 1 51
6 Sales_log 1930 7.35 2.24 0 10.43
7 Type_fabless 1930 0.13 0.33 0 1
8 Type_foundry 1930 0.04 0.20 0 1
9 Type_tester 1930 0.01 0.11 0 1
10 Type_equipment 1930 0.04 0.18 0 1
11 YEAR91 1930 0.09 0.28 0 1
12 YEAR92 1930 0.09 0.28 0 1
13 YEAR93 1930 0.10 0.30 0 1
14 YEAR94 1930 0.10 0.30 0 1
15 YEAR95 1930 0.07 0.26 0 1
16 YEAR96 1930 0.07 0.26 0 1
17 YEAR97 1930 0.08 0.27 0 1
18 YEAR98 1930 0.07 0.26 0 1
19 YEAR99 1930 0.08 0.26 0 1
20 YEAR00 1930 0.05 0.22 0 1
21 YEAR01 1930 0.03 0.18 0 1
22 YEAR02 1930 0.06 0.24 0 1
23 YEAR03 1930 0.06 0.24 0 1
24 Tech_comp 1930 0.43 0.43 0 1
25 Market_comp 1930 0.37 0.37 0 1
26 Type_coop 1930 6.96 3.55 3 20
27 Tie_coop 1930 2.40 7.14 0 56.2
28 Expn_cooptn_num 1930 2.97 2.86 0 11.3
29 Expn_cooptn_adj 1930 36.13 37.02 0 141.4
30 Blncstrng_ techcomp_typecoop1 1930 0.27 0.45 0 1
31 Blncstrng_ techcomp_typecoop2 1930 0.07 0.25 0 1
32 Blncstrng_ techcomp_typecoop3 1930 0.02 0.15 0 1
33 Blncstrng_ techcomp_tiecoop1 1930 0.16 0.36 0 1
34 Blncstrng_ techcomp_tiecoop2 1930 0.09 0.29 0 1
35 Blncstrng_ techcomp_tiecoop3 1930 0.05 0.22 0 1
36 Blncstrng_mktcomp_typecoop1 1930 0.24 0.42 0 1
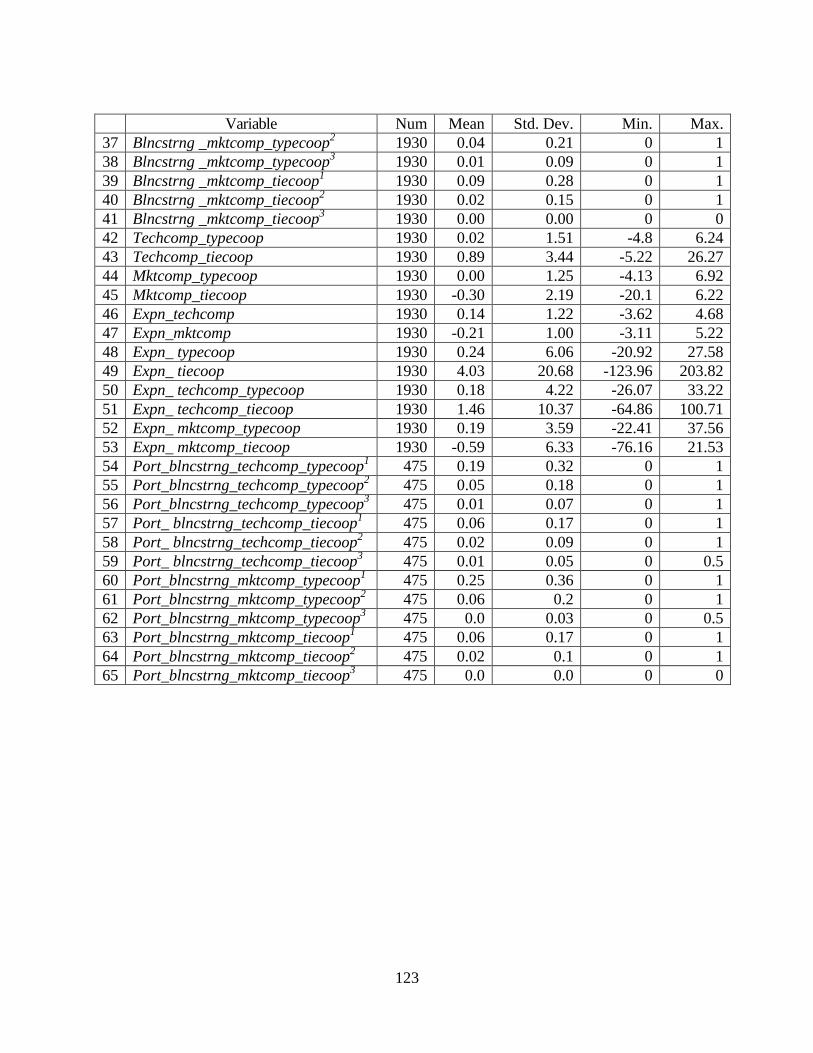
123
Variable Num Mean Std. Dev. Min. Max.
37 Blncstrng _mktcomp_typecoop2 1930 0.04 0.21 0 1
38 Blncstrng _mktcomp_typecoop3 1930 0.01 0.09 0 1
39 Blncstrng _mktcomp_tiecoop1 1930 0.09 0.28 0 1
40 Blncstrng _mktcomp_tiecoop2 1930 0.02 0.15 0 1
41 Blncstrng _mktcomp_tiecoop3 1930 0.00 0.00 0 0
42 Techcomp_typecoop 1930 0.02 1.51 -4.8 6.24
43 Techcomp_tiecoop 1930 0.89 3.44 -5.22 26.27
44 Mktcomp_typecoop 1930 0.00 1.25 -4.13 6.92
45 Mktcomp_tiecoop 1930 -0.30 2.19 -20.1 6.22
46 Expn_techcomp 1930 0.14 1.22 -3.62 4.68
47 Expn_mktcomp 1930 -0.21 1.00 -3.11 5.22
48 Expn_ typecoop 1930 0.24 6.06 -20.92 27.58
49 Expn_ tiecoop 1930 4.03 20.68 -123.96 203.82
50 Expn_ techcomp_typecoop 1930 0.18 4.22 -26.07 33.22
51 Expn_ techcomp_tiecoop 1930 1.46 10.37 -64.86 100.71
52 Expn_ mktcomp_typecoop 1930 0.19 3.59 -22.41 37.56
53 Expn_ mktcomp_tiecoop 1930 -0.59 6.33 -76.16 21.53
54 Port_blncstrng_techcomp_typecoop1 475 0.19 0.32 0 1
55 Port_blncstrng_techcomp_typecoop2 475 0.05 0.18 0 1
56 Port_blncstrng_techcomp_typecoop3 475 0.01 0.07 0 1
57 Port_ blncstrng_techcomp_tiecoop1 475 0.06 0.17 0 1
58 Port_ blncstrng_techcomp_tiecoop2 475 0.02 0.09 0 1
59 Port_ blncstrng_techcomp_tiecoop3 475 0.01 0.05 0 0.5
60 Port_blncstrng_mktcomp_typecoop1 475 0.25 0.36 0 1
61 Port_blncstrng_mktcomp_typecoop2 475 0.06 0.2 0 1
62 Port_blncstrng_mktcomp_typecoop3 475 0.0 0.03 0 0.5
63 Port_blncstrng_mktcomp_tiecoop1 475 0.06 0.17 0 1
64 Port_blncstrng_mktcomp_tiecoop2 475 0.02 0.1 0 1
65 Port_blncstrng_mktcomp_tiecoop3 475 0.0 0.0 0 0
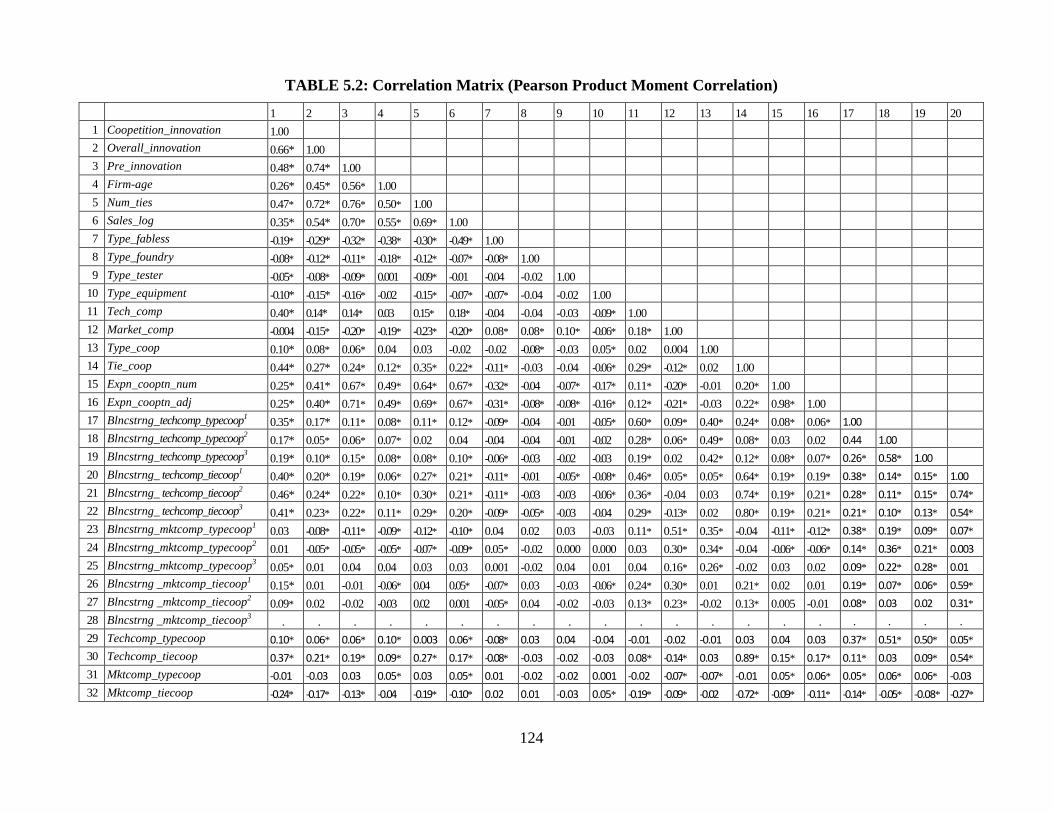
124
TABLE 5.2: Correlation Matrix (Pearson Product Moment Correlation)
1 2 3 4 5 6 7 8 9 10 11 12 13 14 15 16 17 18 19 20
1 Coopetition_innovation 1.00
2 Overall_innovation 0.66* 1.00
3 Pre_innovation 0.48* 0.74* 1.00
4 Firm-age 0.26* 0.45* 0.56* 1.00
5 Num_ties 0.47* 0.72* 0.76* 0.50* 1.00
6 Sales_log 0.35* 0.54* 0.70* 0.55* 0.69* 1.00
7 Type_fabless -0.19* -0.29* -0.32* -0.38* -0.30* -0.49* 1.00
8 Type_foundry -0.08* -0.12* -0.11* -0.18* -0.12* -0.07* -0.08* 1.00
9 Type_tester -0.05* -0.08* -0.09* 0.001 -0.09* -0.01 -0.04 -0.02 1.00
10 Type_equipment -0.10* -0.15* -0.16* -0.02 -0.15* -0.07* -0.07* -0.04 -0.02 1.00
11 Tech_comp 0.40* 0.14* 0.14* 0.03 0.15* 0.18* -0.04 -0.04 -0.03 -0.09* 1.00
12 Market_comp -0.004 -0.15* -0.20* -0.19* -0.23* -0.20* 0.08* 0.08* 0.10* -0.06* 0.18* 1.00
13 Type_coop 0.10* 0.08* 0.06* 0.04 0.03 -0.02 -0.02 -0.08* -0.03 0.05* 0.02 0.004 1.00
14 Tie_coop 0.44* 0.27* 0.24* 0.12* 0.35* 0.22* -0.11* -0.03 -0.04 -0.06* 0.29* -0.12* 0.02 1.00
15 Expn_cooptn_num 0.25* 0.41* 0.67* 0.49* 0.64* 0.67* -0.32* -0.04 -0.07* -0.17* 0.11* -0.20* -0.01 0.20* 1.00
16 Expn_cooptn_adj 0.25* 0.40* 0.71* 0.49* 0.69* 0.67* -0.31* -0.08* -0.08* -0.16* 0.12* -0.21* -0.03 0.22* 0.98* 1.00
17 Blncstrng_techcomp_typecoop1 0.35* 0.17* 0.11* 0.08* 0.11* 0.12* -0.09* -0.04 -0.01 -0.05* 0.60* 0.09* 0.40* 0.24* 0.08* 0.06* 1.00 18 Blncstrng_techcomp_typecoop2 0.17* 0.05* 0.06* 0.07* 0.02 0.04 -0.04 -0.04 -0.01 -0.02 0.28* 0.06* 0.49* 0.08* 0.03 0.02 0.44 1.00
19 Blncstrng_techcomp_typecoop3 0.19* 0.10* 0.15* 0.08* 0.08* 0.10* -0.06* -0.03 -0.02 -0.03 0.19* 0.02 0.42* 0.12* 0.08* 0.07* 0.26* 0.58* 1.00 20 Blncstrng_ techcomp_tiecoop1 0.40* 0.20* 0.19* 0.06* 0.27* 0.21* -0.11* -0.01 -0.05* -0.08* 0.46* 0.05* 0.05* 0.64* 0.19* 0.19* 0.38* 0.14* 0.15* 1.00
21 Blncstrng_ techcomp_tiecoop2 0.46* 0.24* 0.22* 0.10* 0.30* 0.21* -0.11* -0.03 -0.03 -0.06* 0.36* -0.04 0.03 0.74* 0.19* 0.21* 0.28* 0.11* 0.15* 0.74*
22 Blncstrng_ techcomp_tiecoop3 0.41* 0.23* 0.22* 0.11* 0.29* 0.20* -0.09* -0.05* -0.03 -0.04 0.29* -0.13* 0.02 0.80* 0.19* 0.21* 0.21* 0.10* 0.13* 0.54*
23 Blncstrng_mktcomp_typecoop1 0.03 -0.08* -0.11* -0.09* -0.12* -0.10* 0.04 0.02 0.03 -0.03 0.11* 0.51* 0.35* -0.04 -0.11* -0.12* 0.38* 0.19* 0.09* 0.07*
24 Blncstrng_mktcomp_typecoop2 0.01 -0.05* -0.05* -0.05* -0.07* -0.09* 0.05* -0.02 0.000 0.000 0.03 0.30* 0.34* -0.04 -0.06* -0.06* 0.14* 0.36* 0.21* 0.003
25 Blncstrng_mktcomp_typecoop3 0.05* 0.01 0.04 0.04 0.03 0.03 0.001 -0.02 0.04 0.01 0.04 0.16* 0.26* -0.02 0.03 0.02 0.09* 0.22* 0.28* 0.01
26 Blncstrng _mktcomp_tiecoop1 0.15* 0.01 -0.01 -0.06* 0.04 0.05* -0.07* 0.03 -0.03 -0.06* 0.24* 0.30* 0.01 0.21* 0.02 0.01 0.19* 0.07* 0.06* 0.59*
27 Blncstrng _mktcomp_tiecoop2 0.09* 0.02 -0.02 -0.03 0.02 0.001 -0.05* 0.04 -0.02 -0.03 0.13* 0.23* -0.02 0.13* 0.005 -0.01 0.08* 0.03 0.02 0.31*
28 Blncstrng _mktcomp_tiecoop3 . . . . . . . . . . . . . . . . . . . .
29 Techcomp_typecoop 0.10* 0.06* 0.06* 0.10* 0.003 0.06* -0.08* 0.03 0.04 -0.04 -0.01 -0.02 -0.01 0.03 0.04 0.03 0.37* 0.51* 0.50* 0.05*
30 Techcomp_tiecoop 0.37* 0.21* 0.19* 0.09* 0.27* 0.17* -0.08* -0.03 -0.02 -0.03 0.08* -0.14* 0.03 0.89* 0.15* 0.17* 0.11* 0.03 0.09* 0.54*
31 Mktcomp_typecoop -0.01 -0.03 0.03 0.05* 0.03 0.05* 0.01 -0.02 -0.02 0.001 -0.02 -0.07* -0.07* -0.01 0.05* 0.06* 0.05* 0.06* 0.06* -0.03
32 Mktcomp_tiecoop -0.24* -0.17* -0.13* -0.04 -0.19* -0.10* 0.02 0.01 -0.03 0.05* -0.19* -0.09* -0.02 -0.72* -0.09* -0.11* -0.14* -0.05* -0.08* -0.27*
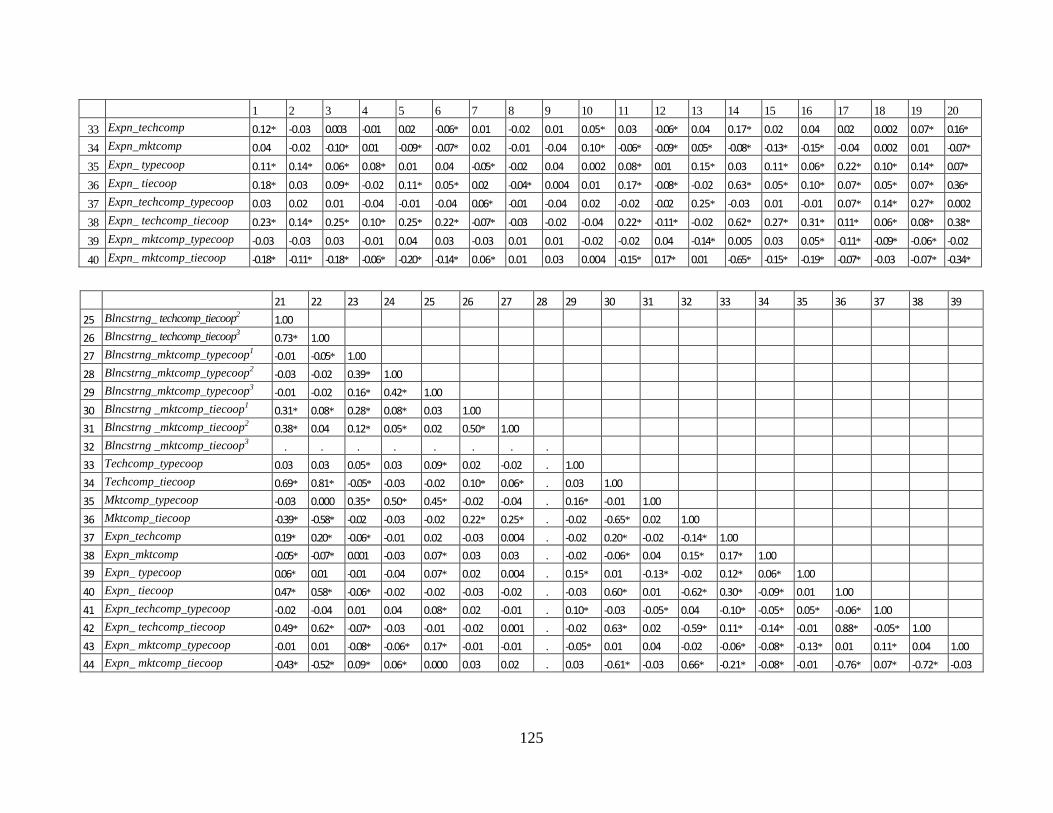
125
1 2 3 4 5 6 7 8 9 10 11 12 13 14 15 16 17 18 19 20
33 Expn_techcomp 0.12* -0.03 0.003 -0.01 0.02 -0.06* 0.01 -0.02 0.01 0.05* 0.03 -0.06* 0.04 0.17* 0.02 0.04 0.02 0.002 0.07* 0.16*
34 Expn_mktcomp 0.04 -0.02 -0.10* 0.01 -0.09* -0.07* 0.02 -0.01 -0.04 0.10* -0.06* -0.09* 0.05* -0.08* -0.13* -0.15* -0.04 0.002 0.01 -0.07*
35 Expn_ typecoop 0.11* 0.14* 0.06* 0.08* 0.01 0.04 -0.05* -0.02 0.04 0.002 0.08* 0.01 0.15* 0.03 0.11* 0.06* 0.22* 0.10* 0.14* 0.07*
36 Expn_ tiecoop 0.18* 0.03 0.09* -0.02 0.11* 0.05* 0.02 -0.04* 0.004 0.01 0.17* -0.08* -0.02 0.63* 0.05* 0.10* 0.07* 0.05* 0.07* 0.36*
37 Expn_techcomp_typecoop 0.03 0.02 0.01 -0.04 -0.01 -0.04 0.06* -0.01 -0.04 0.02 -0.02 -0.02 0.25* -0.03 0.01 -0.01 0.07* 0.14* 0.27* 0.002
38 Expn_ techcomp_tiecoop 0.23* 0.14* 0.25* 0.10* 0.25* 0.22* -0.07* -0.03 -0.02 -0.04 0.22* -0.11* -0.02 0.62* 0.27* 0.31* 0.11* 0.06* 0.08* 0.38*
39 Expn_ mktcomp_typecoop -0.03 -0.03 0.03 -0.01 0.04 0.03 -0.03 0.01 0.01 -0.02 -0.02 0.04 -0.14* 0.005 0.03 0.05* -0.11* -0.09* -0.06* -0.02
40 Expn_ mktcomp_tiecoop -0.18* -0.11* -0.18* -0.06* -0.20* -0.14* 0.06* 0.01 0.03 0.004 -0.15* 0.17* 0.01 -0.65* -0.15* -0.19* -0.07* -0.03 -0.07* -0.34*
21 22 23 24 25 26 27 28 29 30 31 32 33 34 35 36 37 38 39
25 Blncstrng_ techcomp_tiecoop2 1.00 26 Blncstrng_ techcomp_tiecoop3 0.73* 1.00
27 Blncstrng_mktcomp_typecoop1 -0.01 -0.05* 1.00 28 Blncstrng_mktcomp_typecoop2 -0.03 -0.02 0.39* 1.00
29 Blncstrng_mktcomp_typecoop3 -0.01 -0.02 0.16* 0.42* 1.00 30 Blncstrng _mktcomp_tiecoop1 0.31* 0.08* 0.28* 0.08* 0.03 1.00
31 Blncstrng _mktcomp_tiecoop2 0.38* 0.04 0.12* 0.05* 0.02 0.50* 1.00 32 Blncstrng _mktcomp_tiecoop3 . . . . . . . .
33 Techcomp_typecoop 0.03 0.03 0.05* 0.03 0.09* 0.02 -0.02 . 1.00 34 Techcomp_tiecoop 0.69* 0.81* -0.05* -0.03 -0.02 0.10* 0.06* . 0.03 1.00
35 Mktcomp_typecoop -0.03 0.000 0.35* 0.50* 0.45* -0.02 -0.04 . 0.16* -0.01 1.00 36 Mktcomp_tiecoop -0.39* -0.58* -0.02 -0.03 -0.02 0.22* 0.25* . -0.02 -0.65* 0.02 1.00
37 Expn_techcomp 0.19* 0.20* -0.06* -0.01 0.02 -0.03 0.004 . -0.02 0.20* -0.02 -0.14* 1.00 38 Expn_mktcomp -0.05* -0.07* 0.001 -0.03 0.07* 0.03 0.03 . -0.02 -0.06* 0.04 0.15* 0.17* 1.00
39 Expn_ typecoop 0.06* 0.01 -0.01 -0.04 0.07* 0.02 0.004 . 0.15* 0.01 -0.13* -0.02 0.12* 0.06* 1.00 40 Expn_ tiecoop 0.47* 0.58* -0.06* -0.02 -0.02 -0.03 -0.02 . -0.03 0.60* 0.01 -0.62* 0.30* -0.09* 0.01 1.00
41 Expn_techcomp_typecoop -0.02 -0.04 0.01 0.04 0.08* 0.02 -0.01 . 0.10* -0.03 -0.05* 0.04 -0.10* -0.05* 0.05* -0.06* 1.00 42 Expn_ techcomp_tiecoop 0.49* 0.62* -0.07* -0.03 -0.01 -0.02 0.001 . -0.02 0.63* 0.02 -0.59* 0.11* -0.14* -0.01 0.88* -0.05* 1.00
43 Expn_ mktcomp_typecoop -0.01 0.01 -0.08* -0.06* 0.17* -0.01 -0.01 . -0.05* 0.01 0.04 -0.02 -0.06* -0.08* -0.13* 0.01 0.11* 0.04 1.00
44 Expn_ mktcomp_tiecoop -0.43* -0.52* 0.09* 0.06* 0.000 0.03 0.02 . 0.03 -0.61* -0.03 0.66* -0.21* -0.08* -0.01 -0.76* 0.07* -0.72* -0.03
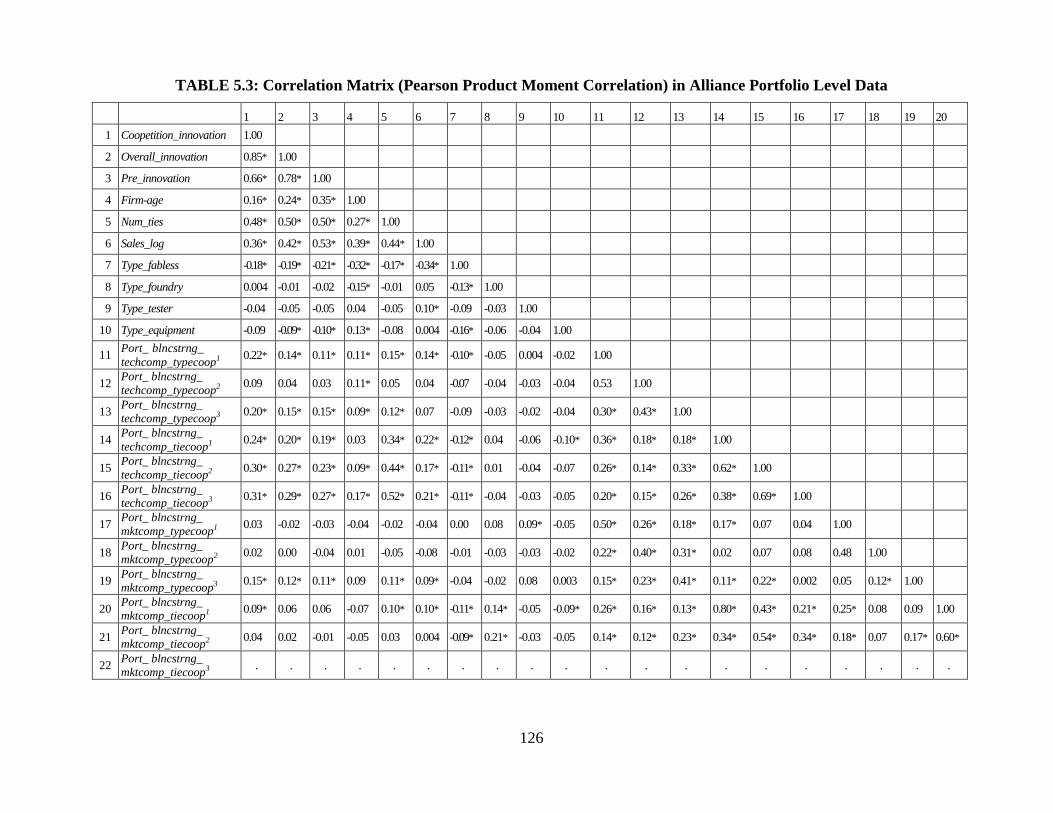
126
TABLE 5.3: Correlation Matrix (Pearson Product Moment Correlation) in Alliance Portfolio Level Data
1 2 3 4 5 6 7 8 9 10 11 12 13 14 15 16 17 18 19 20
1 Coopetition_innovation 1.00
2 Overall_innovation 0.85* 1.00
3 Pre_innovation 0.66* 0.78* 1.00
4 Firm-age 0.16* 0.24* 0.35* 1.00
5 Num_ties 0.48* 0.50* 0.50* 0.27* 1.00
6 Sales_log 0.36* 0.42* 0.53* 0.39* 0.44* 1.00
7 Type_fabless -0.18* -0.19* -0.21* -0.32* -0.17* -0.34* 1.00
8 Type_foundry 0.004 -0.01 -0.02 -0.15* -0.01 0.05 -0.13* 1.00
9 Type_tester -0.04 -0.05 -0.05 0.04 -0.05 0.10* -0.09 -0.03 1.00
10 Type_equipment -0.09 -0.09* -0.10* 0.13* -0.08 0.004 -0.16* -0.06 -0.04 1.00
11 Port_ blncstrng_
techcomp_typecoop1 0.22* 0.14* 0.11* 0.11* 0.15* 0.14* -0.10* -0.05 0.004 -0.02 1.00
12 Port_ blncstrng_
techcomp_typecoop2 0.09 0.04 0.03 0.11* 0.05 0.04 -0.07 -0.04 -0.03 -0.04 0.53 1.00
13 Port_ blncstrng_
techcomp_typecoop3 0.20* 0.15* 0.15* 0.09* 0.12* 0.07 -0.09 -0.03 -0.02 -0.04 0.30* 0.43* 1.00
14 Port_ blncstrng_
techcomp_tiecoop1 0.24* 0.20* 0.19* 0.03 0.34* 0.22* -0.12* 0.04 -0.06 -0.10* 0.36* 0.18* 0.18* 1.00
15 Port_ blncstrng_
techcomp_tiecoop2 0.30* 0.27* 0.23* 0.09* 0.44* 0.17* -0.11* 0.01 -0.04 -0.07 0.26* 0.14* 0.33* 0.62* 1.00
16 Port_ blncstrng_
techcomp_tiecoop3 0.31* 0.29* 0.27* 0.17* 0.52* 0.21* -0.11* -0.04 -0.03 -0.05 0.20* 0.15* 0.26* 0.38* 0.69* 1.00
17 Port_ blncstrng_
mktcomp_typecoop1 0.03 -0.02 -0.03 -0.04 -0.02 -0.04 0.00 0.08 0.09* -0.05 0.50* 0.26* 0.18* 0.17* 0.07 0.04 1.00
18 Port_ blncstrng_
mktcomp_typecoop2 0.02 0.00 -0.04 0.01 -0.05 -0.08 -0.01 -0.03 -0.03 -0.02 0.22* 0.40* 0.31* 0.02 0.07 0.08 0.48 1.00
19 Port_ blncstrng_
mktcomp_typecoop3 0.15* 0.12* 0.11* 0.09 0.11* 0.09* -0.04 -0.02 0.08 0.003 0.15* 0.23* 0.41* 0.11* 0.22* 0.002 0.05 0.12* 1.00
20 Port_ blncstrng_
mktcomp_tiecoop1 0.09* 0.06 0.06 -0.07 0.10* 0.10* -0.11* 0.14* -0.05 -0.09* 0.26* 0.16* 0.13* 0.80* 0.43* 0.21* 0.25* 0.08 0.09 1.00
21 Port_ blncstrng_
mktcomp_tiecoop2 0.04 0.02 -0.01 -0.05 0.03 0.004 -0.09* 0.21* -0.03 -0.05 0.14* 0.12* 0.23* 0.34* 0.54* 0.34* 0.18* 0.07 0.17* 0.60*
22 Port_ blncstrng_
mktcomp_tiecoop3 . . . . . . . . . . . . . . . . . . . .
127
5.2 The Role of Competition between Partners in Innovation
Hypothesis 1 predicts that the intensity of competition between partners will have an
inverted U-shaped relationship with a focal firm‘s coopetition-based innovation performance. To
test this hypothesis, I first calculated the technology competition based on the overlap of patent
class between partners. To calculate the market competition, I considered three factors: 1) SIC
code overlap, 2) overlap of the type of firm, and 3) the product market overlap.
Table 5.4 introduces the effects of competition between partners on coopetition-based
innovation. Model 1 shows the effects of technology competition (Tech_comp) on coopetition-
based innovation (Coopetition_innovation), while model 2 shows the effects of market
competition (Market_comp). Figures 5.1 and 5.2 present the effects of competition (Tech_comp
and Market_comp) on Coopetition_innovation, based on models 1b and 2b, respectively. As the
results show, the hypothesis is only partially supported in terms of market competition (model 2b,
Figure 5.2). The relationship between market competition and coopetition-based innovation
shows an inverted-U shape. That is, Market_comp has a positive and significant relationship with
Coopetition_innovation, while the squared term of market competition, Market_comp^2
, has a
negative and significant relationship with Coopetition_innovation at the 0.001 level. However,
the effects of Tech_comp are positive and significant instead of being an inverted-U relationship
with Coopetition_innovation (model 1b, Figure 5.1).
The results imply that two different types of competition may explain two countervailing
arguments and empirical reports in the literature on the effects of competition between partners on
innovation performance. From the market competition perspective, two different countervailing
forces – learning potential and competitive tension – play together. As the intensity of
competition increases, the positive effects of learning potential increases but the negative effects
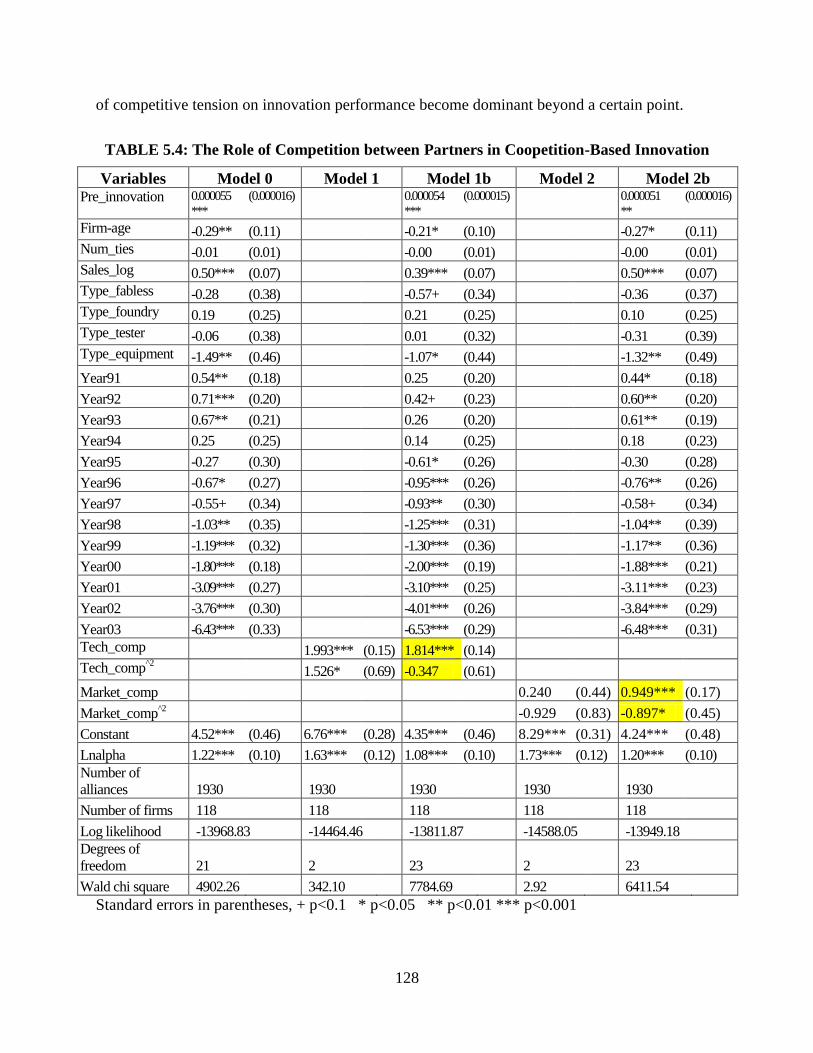
128
of competitive tension on innovation performance become dominant beyond a certain point.
TABLE 5.4: The Role of Competition between Partners in Coopetition-Based Innovation
Variables Model 0 Model 1 Model 1b Model 2 Model 2b Pre_innovation 0.000055
***
(0.000016)
0.000054
***
(0.000015)
0.000051
**
(0.000016)
Firm-age -0.29** (0.11)
-0.21* (0.10)
-0.27* (0.11)
Num_ties -0.01 (0.01)
-0.00 (0.01)
-0.00 (0.01)
Sales_log 0.50*** (0.07)
0.39*** (0.07)
0.50*** (0.07)
Type_fabless -0.28 (0.38)
-0.57+ (0.34)
-0.36 (0.37)
Type_foundry 0.19 (0.25)
0.21 (0.25)
0.10 (0.25)
Type_tester -0.06 (0.38)
0.01 (0.32)
-0.31 (0.39)
Type_equipment -1.49** (0.46)
-1.07* (0.44)
-1.32** (0.49)
Year91 0.54** (0.18)
0.25 (0.20)
0.44* (0.18)
Year92 0.71*** (0.20)
0.42+ (0.23)
0.60** (0.20)
Year93 0.67** (0.21)
0.26 (0.20)
0.61** (0.19)
Year94 0.25 (0.25)
0.14 (0.25)
0.18 (0.23)
Year95 -0.27 (0.30)
-0.61* (0.26)
-0.30 (0.28)
Year96 -0.67* (0.27)
-0.95*** (0.26)
-0.76** (0.26)
Year97 -0.55+ (0.34)
-0.93** (0.30)
-0.58+ (0.34)
Year98 -1.03** (0.35)
-1.25*** (0.31)
-1.04** (0.39)
Year99 -1.19*** (0.32)
-1.30*** (0.36)
-1.17** (0.36)
Year00 -1.80*** (0.18)
-2.00*** (0.19)
-1.88*** (0.21)
Year01 -3.09*** (0.27)
-3.10*** (0.25)
-3.11*** (0.23)
Year02 -3.76*** (0.30)
-4.01*** (0.26)
-3.84*** (0.29)
Year03 -6.43*** (0.33)
-6.53*** (0.29)
-6.48*** (0.31)
Tech_comp
1.993*** (0.15) 1.814*** (0.14)
Tech_comp^2
1.526* (0.69) -0.347 (0.61)
Market_comp
0.240 (0.44) 0.949*** (0.17)
Market_comp^2
-0.929 (0.83) -0.897* (0.45)
Constant 4.52*** (0.46) 6.76*** (0.28) 4.35*** (0.46) 8.29*** (0.31) 4.24*** (0.48)
Lnalpha 1.22*** (0.10) 1.63*** (0.12) 1.08*** (0.10) 1.73*** (0.12) 1.20*** (0.10)
Number of
alliances 1930
1930
1930
1930
1930
Number of firms 118
118
118
118
118
Log likelihood -13968.83 -14464.46 -13811.87 -14588.05 -13949.18
Degrees of
freedom 21
2
23
2
23
Wald chi square 4902.26
342.10
7784.69
2.92
6411.54
Standard errors in parentheses, + p<0.1 * p<0.05 ** p<0.01 *** p<0.001
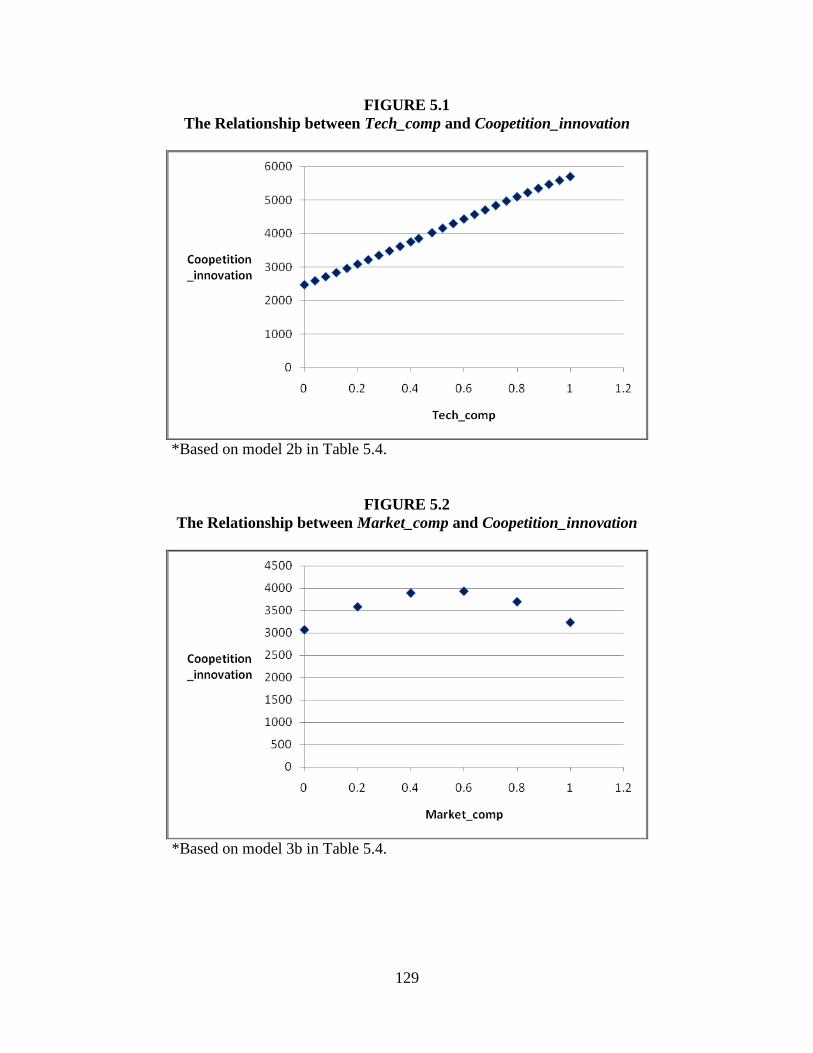
129
FIGURE 5.1
The Relationship between Tech_comp and Coopetition_innovation
*Based on model 2b in Table 5.4.
FIGURE 5.2
The Relationship between Market_comp and Coopetition_innovation
*Based on model 3b in Table 5.4.
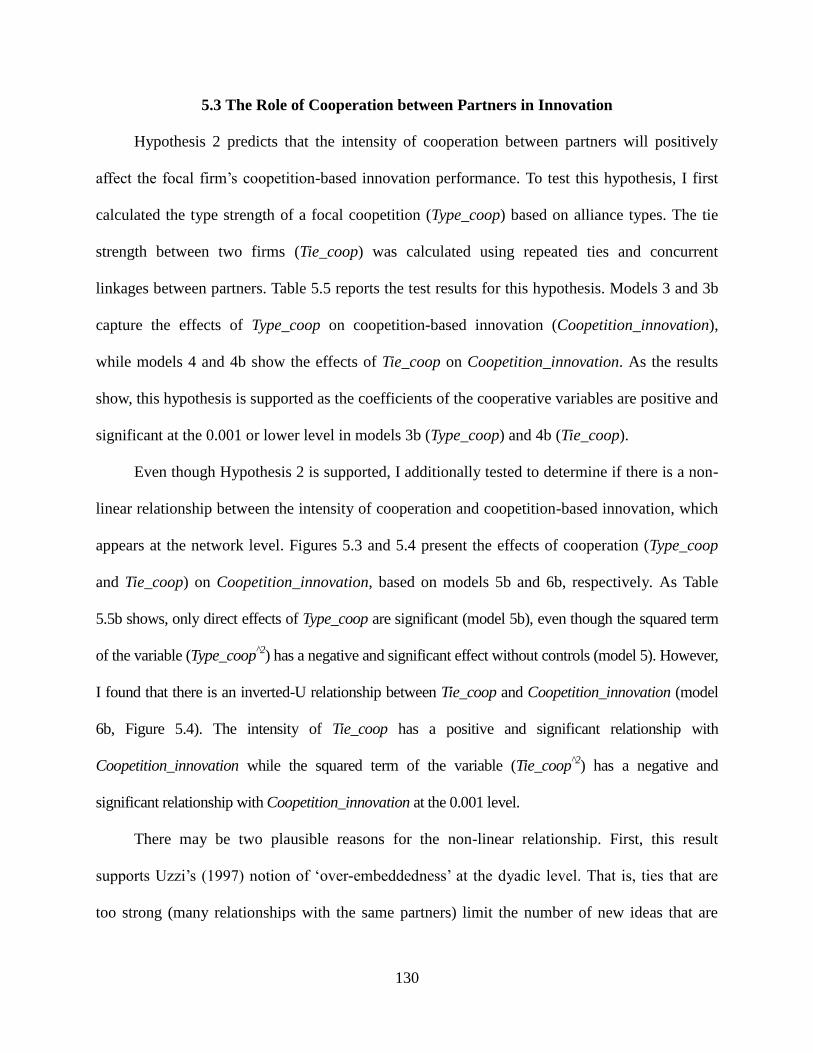
130
5.3 The Role of Cooperation between Partners in Innovation
Hypothesis 2 predicts that the intensity of cooperation between partners will positively
affect the focal firm‘s coopetition-based innovation performance. To test this hypothesis, I first
calculated the type strength of a focal coopetition (Type_coop) based on alliance types. The tie
strength between two firms (Tie_coop) was calculated using repeated ties and concurrent
linkages between partners. Table 5.5 reports the test results for this hypothesis. Models 3 and 3b
capture the effects of Type_coop on coopetition-based innovation (Coopetition_innovation),
while models 4 and 4b show the effects of Tie_coop on Coopetition_innovation. As the results
show, this hypothesis is supported as the coefficients of the cooperative variables are positive and
significant at the 0.001 or lower level in models 3b (Type_coop) and 4b (Tie_coop).
Even though Hypothesis 2 is supported, I additionally tested to determine if there is a non-
linear relationship between the intensity of cooperation and coopetition-based innovation, which
appears at the network level. Figures 5.3 and 5.4 present the effects of cooperation (Type_coop
and Tie_coop) on Coopetition_innovation, based on models 5b and 6b, respectively. As Table
5.5b shows, only direct effects of Type_coop are significant (model 5b), even though the squared term
of the variable (Type_coop^2
) has a negative and significant effect without controls (model 5). However,
I found that there is an inverted-U relationship between Tie_coop and Coopetition_innovation (model
6b, Figure 5.4). The intensity of Tie_coop has a positive and significant relationship with
Coopetition_innovation while the squared term of the variable (Tie_coop^2
) has a negative and
significant relationship with Coopetition_innovation at the 0.001 level.
There may be two plausible reasons for the non-linear relationship. First, this result
supports Uzzi‘s (1997) notion of ‗over-embeddedness‘ at the dyadic level. That is, ties that are
too strong (many relationships with the same partners) limit the number of new ideas that are
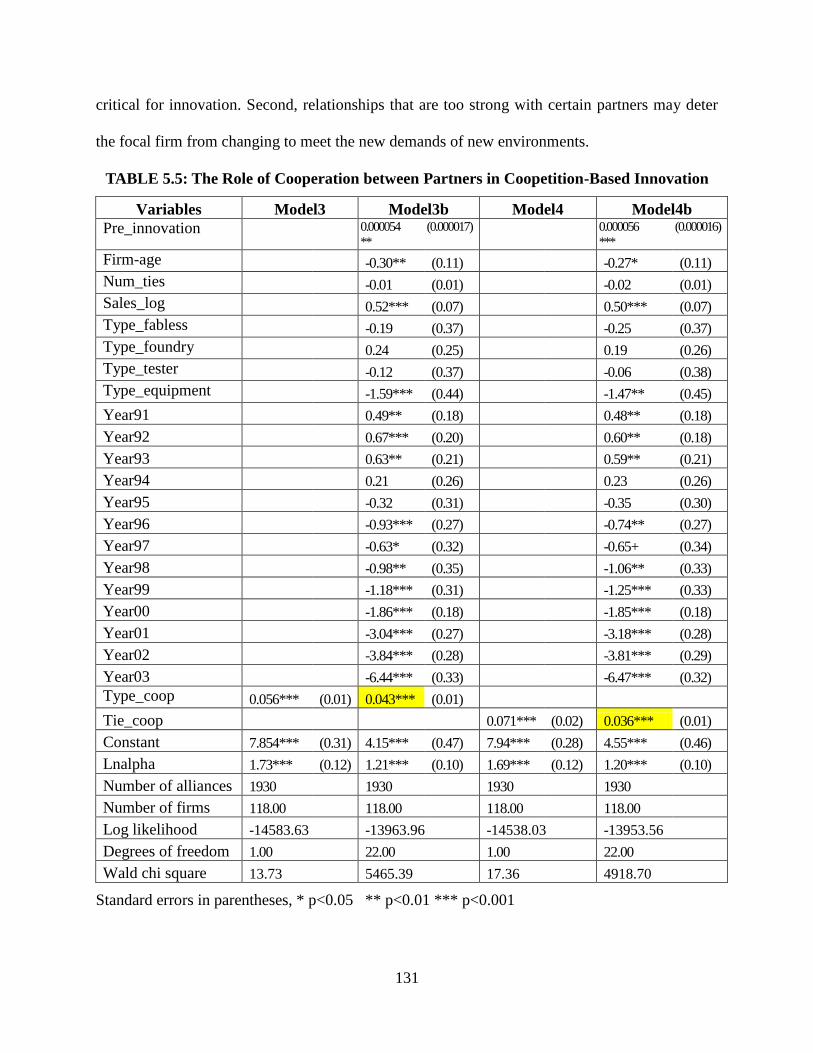
131
critical for innovation. Second, relationships that are too strong with certain partners may deter
the focal firm from changing to meet the new demands of new environments.
TABLE 5.5: The Role of Cooperation between Partners in Coopetition-Based Innovation
Variables Model3 Model3b Model4 Model4b
Pre_innovation
0.000054
**
(0.000017)
0.000056
***
(0.000016)
Firm-age
-0.30** (0.11)
-0.27* (0.11)
Num_ties
-0.01 (0.01)
-0.02 (0.01)
Sales_log
0.52*** (0.07)
0.50*** (0.07)
Type_fabless
-0.19 (0.37)
-0.25 (0.37)
Type_foundry
0.24 (0.25)
0.19 (0.26)
Type_tester
-0.12 (0.37)
-0.06 (0.38)
Type_equipment
-1.59*** (0.44)
-1.47** (0.45)
Year91
0.49** (0.18)
0.48** (0.18)
Year92
0.67*** (0.20)
0.60** (0.18)
Year93
0.63** (0.21)
0.59** (0.21)
Year94
0.21 (0.26)
0.23 (0.26)
Year95
-0.32 (0.31)
-0.35 (0.30)
Year96
-0.93*** (0.27)
-0.74** (0.27)
Year97
-0.63* (0.32)
-0.65+ (0.34)
Year98
-0.98** (0.35)
-1.06** (0.33)
Year99
-1.18*** (0.31)
-1.25*** (0.33)
Year00
-1.86*** (0.18)
-1.85*** (0.18)
Year01
-3.04*** (0.27)
-3.18*** (0.28)
Year02
-3.84*** (0.28)
-3.81*** (0.29)
Year03
-6.44*** (0.33)
-6.47*** (0.32)
Type_coop 0.056*** (0.01) 0.043*** (0.01)
Tie_coop
0.071*** (0.02) 0.036*** (0.01)
Constant 7.854*** (0.31) 4.15*** (0.47) 7.94*** (0.28) 4.55*** (0.46)
Lnalpha 1.73*** (0.12) 1.21*** (0.10) 1.69*** (0.12) 1.20*** (0.10)
Number of alliances 1930
1930
1930
1930
Number of firms 118.00
118.00
118.00
118.00
Log likelihood -14583.63 -13963.96 -14538.03 -13953.56
Degrees of freedom 1.00 22.00 1.00 22.00
Wald chi square 13.73 5465.39 17.36 4918.70
Standard errors in parentheses, * p<0.05 ** p<0.01 *** p<0.001
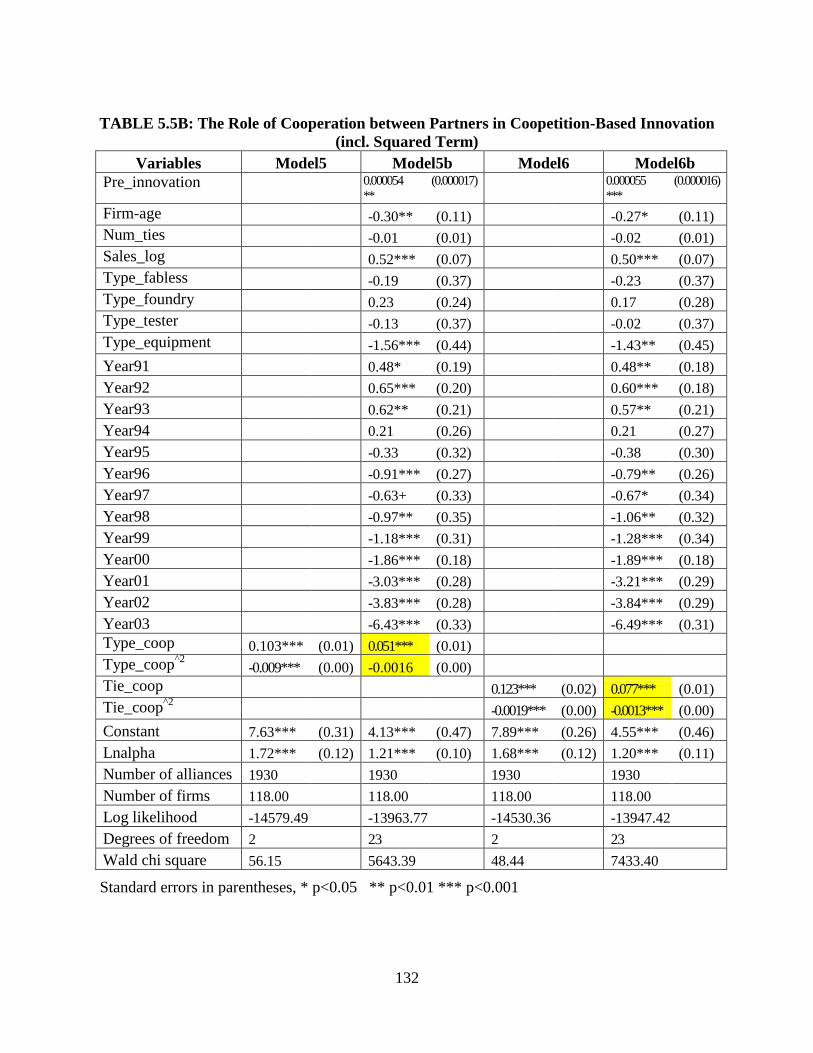
132
TABLE 5.5B: The Role of Cooperation between Partners in Coopetition-Based Innovation
(incl. Squared Term)
Variables Model5 Model5b Model6 Model6b
Pre_innovation
0.000054
**
(0.000017)
0.000055
***
(0.000016)
Firm-age
-0.30** (0.11)
-0.27* (0.11)
Num_ties
-0.01 (0.01)
-0.02 (0.01)
Sales_log
0.52*** (0.07)
0.50*** (0.07)
Type_fabless
-0.19 (0.37)
-0.23 (0.37)
Type_foundry
0.23 (0.24)
0.17 (0.28)
Type_tester
-0.13 (0.37)
-0.02 (0.37)
Type_equipment
-1.56*** (0.44)
-1.43** (0.45)
Year91
0.48* (0.19)
0.48** (0.18)
Year92
0.65*** (0.20)
0.60*** (0.18)
Year93
0.62** (0.21)
0.57** (0.21)
Year94
0.21 (0.26)
0.21 (0.27)
Year95
-0.33 (0.32)
-0.38 (0.30)
Year96
-0.91*** (0.27)
-0.79** (0.26)
Year97
-0.63+ (0.33)
-0.67* (0.34)
Year98
-0.97** (0.35)
-1.06** (0.32)
Year99
-1.18*** (0.31)
-1.28*** (0.34)
Year00
-1.86*** (0.18)
-1.89*** (0.18)
Year01
-3.03*** (0.28)
-3.21*** (0.29)
Year02
-3.83*** (0.28)
-3.84*** (0.29)
Year03
-6.43*** (0.33)
-6.49*** (0.31)
Type_coop 0.103*** (0.01) 0.051*** (0.01)
Type_coop^2
-0.009*** (0.00) -0.0016 (0.00)
Tie_coop
0.123*** (0.02) 0.077*** (0.01)
Tie_coop^2
-0.0019*** (0.00) -0.0013*** (0.00)
Constant 7.63*** (0.31) 4.13*** (0.47) 7.89*** (0.26) 4.55*** (0.46)
Lnalpha 1.72*** (0.12) 1.21*** (0.10) 1.68*** (0.12) 1.20*** (0.11)
Number of alliances 1930
1930
1930
1930
Number of firms 118.00
118.00
118.00
118.00
Log likelihood -14579.49 -13963.77 -14530.36 -13947.42
Degrees of freedom 2 23 2 23
Wald chi square 56.15 5643.39 48.44 7433.40
Standard errors in parentheses, * p<0.05 ** p<0.01 *** p<0.001
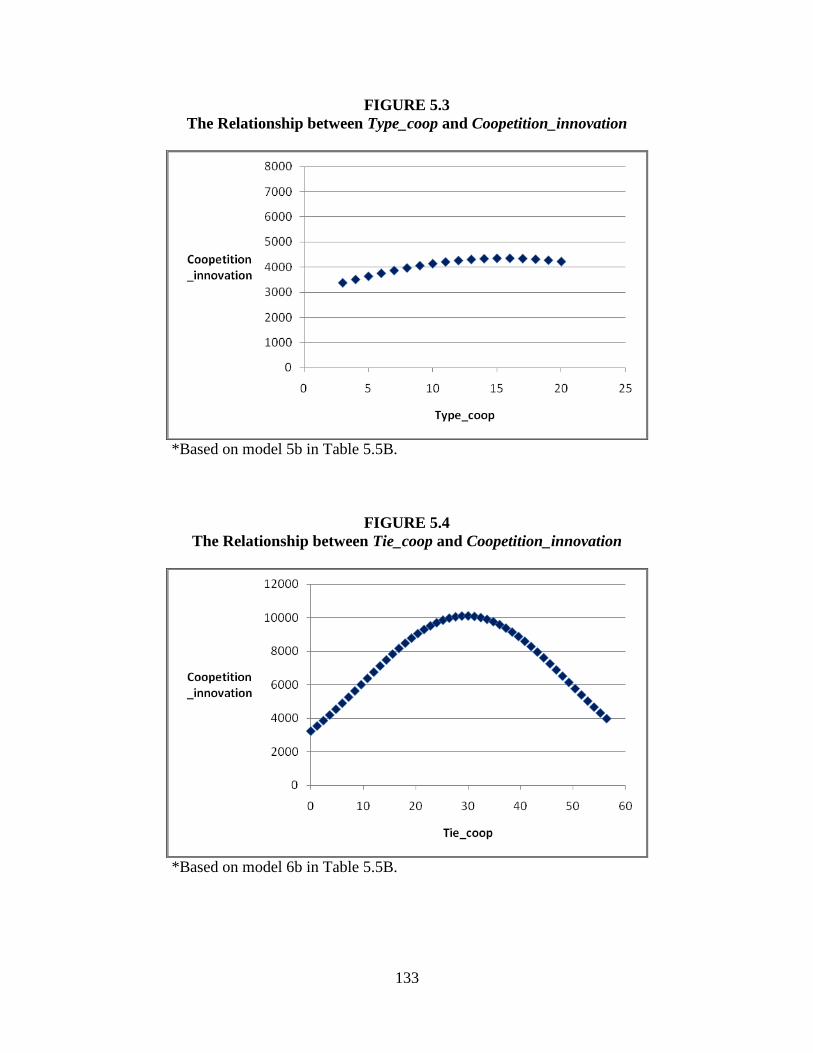
133
FIGURE 5.3
The Relationship between Type_coop and Coopetition_innovation
*Based on model 5b in Table 5.5B.
FIGURE 5.4
The Relationship between Tie_coop and Coopetition_innovation
*Based on model 6b in Table 5.5B.
134
5.4 The Role of Balance between Competition and Cooperation in Innovation at the Dyadic Level
Hypothesis 3a predicts that the balance between competition and cooperation will
positively affect the focal firm‘s coopetition-based innovation. To test the hypothesis, I measured
the balance in two different ways because each approach available to examine the balance (or
interplay) between the two variables has its own advantages and disadvantages. First, I used
polynomial regression to capture the comprehensive effects of the interplay of competition and
cooperation. Second, I estimated coopetition-based innovation as a function of balanced-strong
coopetition as a dummy variable17
. As I measured the degree of competition in two ways
(Tech_comp and Market_comp) and the degree of cooperation in two ways (Type_coop and
Tie_coop), there were four combinations to represent coopetition. Since the inclusion of all
interaction terms in one model may increase multicollinearity, I added them to the regression
models separately for the hypothesis testing.
5.4.1 Polynomial regression analysis: interplay between competition and cooperation
As polynomial regression analysis has advantages in examining the interplay of two
variables, I used polynomial regression to investigate the effects of combining competition and
cooperation on innovation. Tables 5.6 and 5.7 report the relevant coefficients based on negative
binomial regression, while Tables 5.6B and 5.7B report the coefficients from multiple
regression18
. Using the coefficients of variables from negative binomial regressions, at the top of
Figures 5.6, 5.7, 5.8, and 5.9, I present surfaces in terms of quadratic regression equations of the
interplay between competition and cooperation and their corresponding three dimensional
17
The hypothesis is not about simple balance but about balanced-strong coopetititon (i.e., high intensities of
competition and cooperation). 18
To look at the regression model with controls only, refer to model 0 (negative binomial regression) and Appendix
B (multiple regression).
135
response surfaces (refer to Section 4.2.5). On the bottom of Figures 5.6, 5.7, 5.8, and 5.9,
surfaces were portrayed using the coefficients of variables from multiple regressions.
In an attempt to increase the robustness of the results, I used the coefficients from both
negative binomial and multiple regressions to portray surfaces for polynomial regression analysis.
Such an approach to increase robustness seems important for the following reasons. First, a
limitation of polynomial regression is that, even though polynomial regression models may
provide good fits within the range of data, they frequently deteriorate outside the range of the
data. Second, I found that there was a mismatch between the real data and the hypothetical
surface in Figures 5.7 and 5.9 (the combination of competition (Tech_comp or Market_comp)
and Tie_coop). The discrepancy probably occurred because the data is not uniformly distributed.
Figure 5.5 reports the distributions of the combinations of competition and cooperation variables.
The distribution maps show that there are few or no observations in the segment of low
Tech_comp and high Tie_coop and in the segments of high Market_comp and high Tie_coop. I
noted that different numbers of the points in the distribution maps are due to overlapped
observations within the same points because Market_comp was measured in ordinal scale and
Type_coop was integer.
The results show that hypothesis 3a is partially supported. The balance between
technology competition (Tech_comp) and cooperation (Type_coop or Tie_coop) shows positive
and significant effects (models 10b and 11b and Figures 5.6 and 5.7), which supports the
hypothesis. The balance between market competition (Market_comp) and Tie_coop shows
positive and significant effects (model 15b and Figure 5.9), which also supports the hypothesis.
Only the balance between market competition (Market_comp) and Type_coop shows an
136
insignificant effect (model 14b and Figure 5.8). All interaction terms based on negative binomial
regression are insignificant.
Hypothesis 3a is most clearly supported by Figure 5.6 that represents a hypothetical
relationship between coopetition (in the combination of Tech_comp and Type_coop) and
coopetition-based innovation. Overall, the surface clearly supports the hypothesis of the balance
between competition and cooperation (H3a), depicting four basic effects. First,
Coopetition_innovation is higher when technology competition (Tech_comp) and type strength
of the focal alliance (Type_coop) are both high than when Tech_comp and Type_coop are both
low. Second, at the same intensity of cooperation (Type_coop), the higher intensity of
competition (Tech_comp) generates the greater innovation performance
(Coopetition_innovation). For example, when Type_coop is 9.80 in both surfaces in the figure,
Coopetition_innovation increases as the intensity of Tech_comp increases, and the highest
Coopetition_innovation can be achieved when the intensity of Tech_comp is highest (1.00).
Third, the intensity of Type_coop is more important when the intensity of Tech_comp is high
than when the intensity of Tech_comp is low. Finally, when using both negative binomial
regression coefficients and OLS regression coefficients, the optimal point lies in the high
intensity of competition (Tech_comp: 1.00) and the high intensity of cooperation (Type_coop:
20.00). That is, when partners are competitors with similar technological resources (the intensity
of Tech_comp is high), firms will generate greater innovation performance with high intensity of
Type_coop (e.g., a joint venture with multiple activities) than with low intensity of Type_coop
(e.g., a licensing or marketing alliance). In Figure 5.6, both surfaces in the figure are very similar,
except for the ranges of the dependent variable. That is, the range of coopetition-based
innovation is wider in the bottom surface than in the top surface.
137
Hypothesis 3a is also supported by Figure 5.7 that represents the effects of the interplay
between Tech_comp and Tie_coop. The surfaces on the top and bottom seem different but the
surface on the top is very similar to part of the surface on the bottom (i.e., in the range of
Tie_coop from 0 to 22.48 in which 97.4 percent of the observations appear). The differences
between the two surfaces clearly appear when the intensities of Tech_comp and Tie_coop are
both high. In the top surface, when the intensity of Tech_comp is high, Tie_coop shows an
inverted_U shape. In the bottom surface, however, when the intensity of Tech_comp is high,
Tie_coop does not show an inverted_U shape, rather it shows a positive relationship. As a result,
the optimal points are different in the two surfaces. When we look at the optimal point, the
surface on the top shows that high Tech_comp (1.00) and medium-high Tie_coop (39.34)
generates the highest innovation performance. Considering that the Tie_coops of most samples
are 0 or very low, while the maximum value of Tie_coop is very high, the optimal point has
pretty high intensity of Tie_coop. The surface on the bottom clearly shows that high Tech_comp
(1.00) and high Tie_coop (56.2) generate the highest innovation performance.
Figure 5.9 also supports the hypothesis. Like Figure 5.7, the surface on the top in Figure 5.9
is very similar to part of the surface on the bottom (i.e., in the range of Tie_coop from 0 to 22.48).
The shapes suggest that, when Market_comp is high, the increase of Tie_coop will increase the
innovation performance except for the range of very high intensity of Tie_coop. Conversely,
when Tie_coop is high (or medium), the increase of Market_comp will increase innovation
performance. When we look at the optimal point, the surface on the top suggests that high
Market_comp (1.00) and mid-high Tie_coop (39.34) generates the highest innovation
performance. The shape on the bottom shows that high Market_comp (1.00) and high Tie_coop
(56.2) generate the highest innovation performance. However, the result should be interpreted
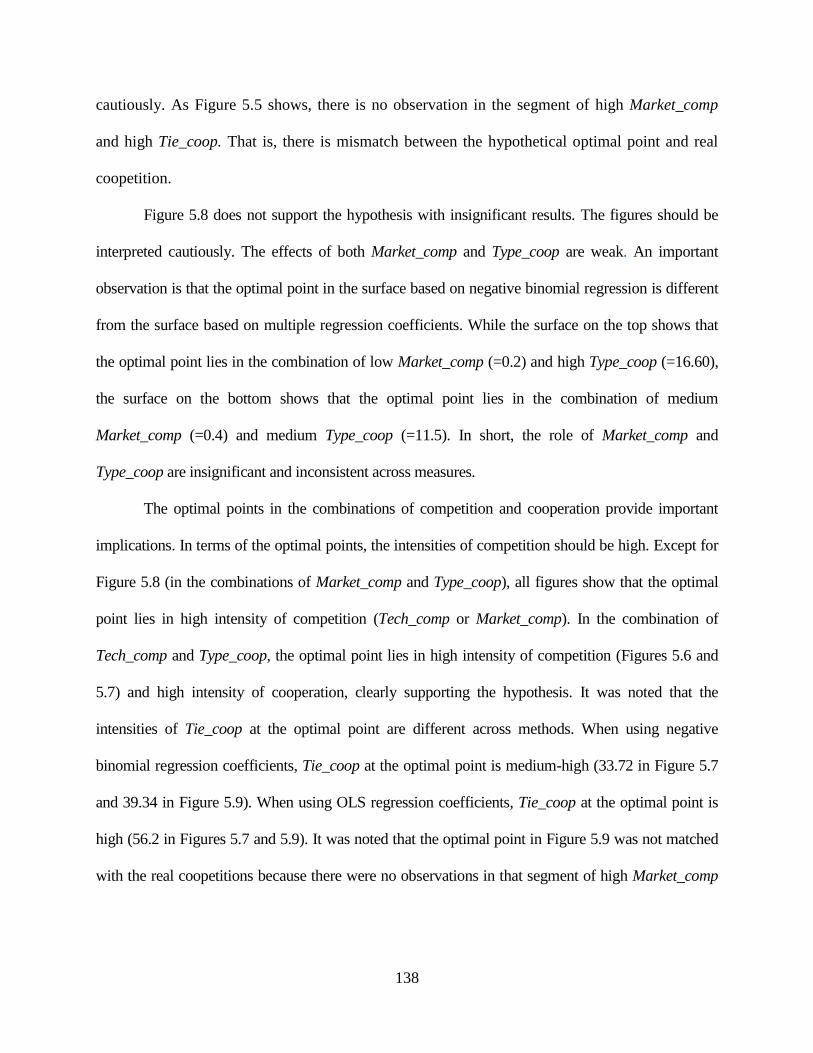
138
cautiously. As Figure 5.5 shows, there is no observation in the segment of high Market_comp
and high Tie_coop. That is, there is mismatch between the hypothetical optimal point and real
coopetition.
Figure 5.8 does not support the hypothesis with insignificant results. The figures should be
interpreted cautiously. The effects of both Market_comp and Type_coop are weak. An important
observation is that the optimal point in the surface based on negative binomial regression is different
from the surface based on multiple regression coefficients. While the surface on the top shows that
the optimal point lies in the combination of low Market_comp (=0.2) and high Type_coop (=16.60),
the surface on the bottom shows that the optimal point lies in the combination of medium
Market_comp (=0.4) and medium Type_coop (=11.5). In short, the role of Market_comp and
Type_coop are insignificant and inconsistent across measures.
The optimal points in the combinations of competition and cooperation provide important
implications. In terms of the optimal points, the intensities of competition should be high. Except for
Figure 5.8 (in the combinations of Market_comp and Type_coop), all figures show that the optimal
point lies in high intensity of competition (Tech_comp or Market_comp). In the combination of
Tech_comp and Type_coop, the optimal point lies in high intensity of competition (Figures 5.6 and
5.7) and high intensity of cooperation, clearly supporting the hypothesis. It was noted that the
intensities of Tie_coop at the optimal point are different across methods. When using negative
binomial regression coefficients, Tie_coop at the optimal point is medium-high (33.72 in Figure 5.7
and 39.34 in Figure 5.9). When using OLS regression coefficients, Tie_coop at the optimal point is
high (56.2 in Figures 5.7 and 5.9). It was noted that the optimal point in Figure 5.9 was not matched
with the real coopetitions because there were no observations in that segment of high Market_comp
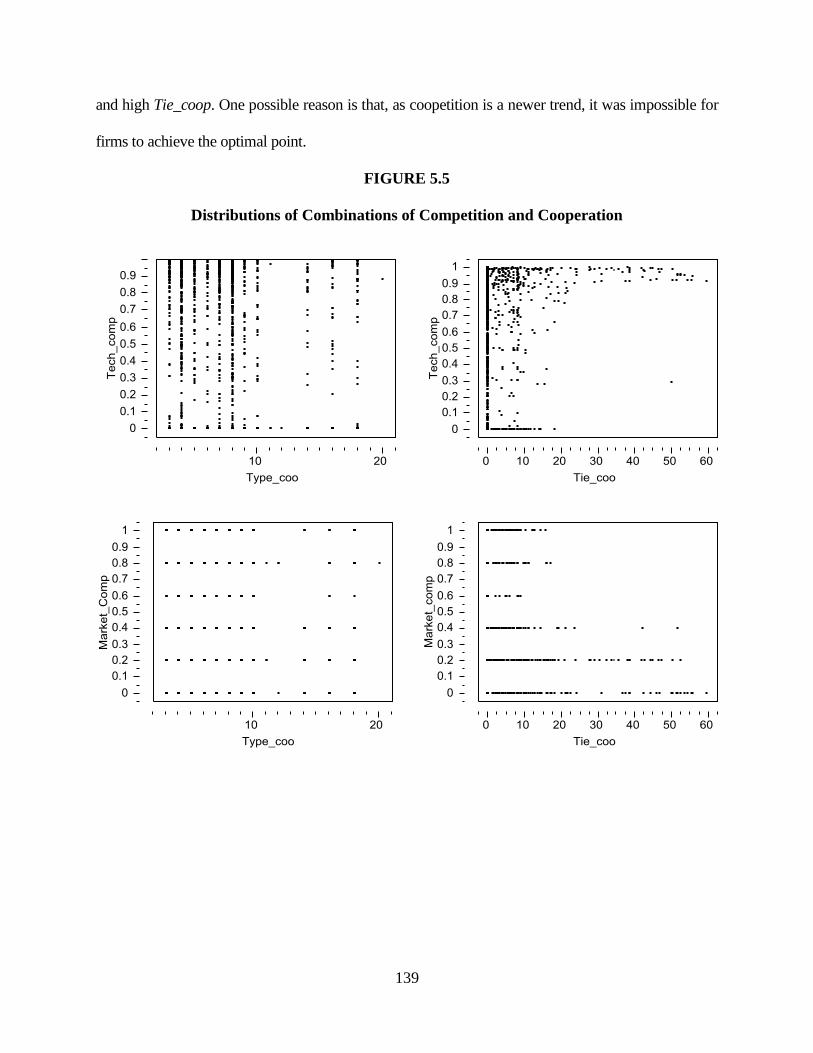
139
and high Tie_coop. One possible reason is that, as coopetition is a newer trend, it was impossible for
firms to achieve the optimal point.
FIGURE 5.5
Distributions of Combinations of Competition and Cooperation
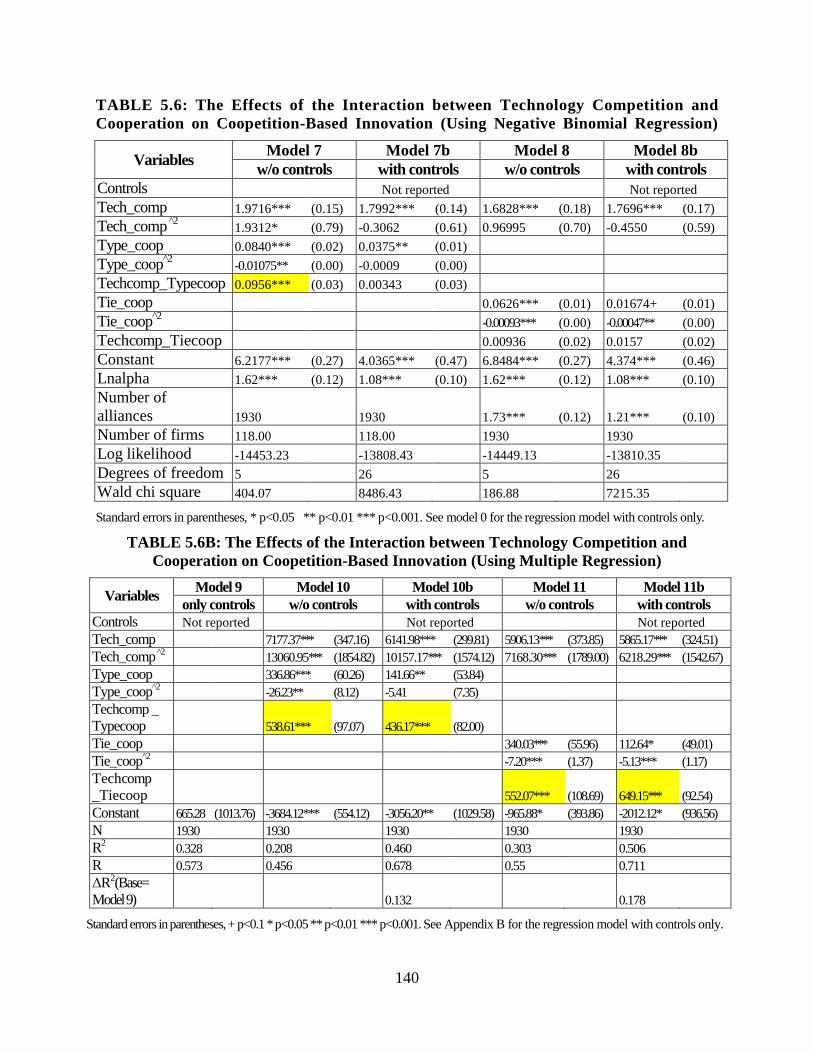
140
TABLE 5.6: The Effects of the Interaction between Technology Competition and
Cooperation on Coopetition-Based Innovation (Using Negative Binomial Regression)
Variables Model 7 Model 7b Model 8 Model 8b
w/o controls with controls w/o controls with controls
Controls
Not reported
Not reported
Tech_comp 1.9716*** (0.15) 1.7992*** (0.14) 1.6828*** (0.18) 1.7696*** (0.17)
Tech_comp ̂ 2
1.9312* (0.79) -0.3062 (0.61) 0.96995 (0.70) -0.4550 (0.59)
Type_coop 0.0840*** (0.02) 0.0375** (0.01)
Type_coop^2
-0.01075** (0.00) -0.0009 (0.00)
Techcomp_Typecoop 0.0956*** (0.03) 0.00343 (0.03)
Tie_coop
0.0626*** (0.01) 0.01674+ (0.01)
Tie_coop^2
-0.00093*** (0.00) -0.00047** (0.00)
Techcomp_Tiecoop
0.00936 (0.02) 0.0157 (0.02)
Constant 6.2177*** (0.27) 4.0365*** (0.47) 6.8484*** (0.27) 4.374*** (0.46)
Lnalpha 1.62*** (0.12) 1.08*** (0.10) 1.62*** (0.12) 1.08*** (0.10)
Number of
alliances 1930
1930
1.73*** (0.12) 1.21*** (0.10)
Number of firms 118.00
118.00
1930
1930
Log likelihood -14453.23 -13808.43 -14449.13 -13810.35
Degrees of freedom 5 26 5 26
Wald chi square 404.07
8486.43 186.88
7215.35
Standard errors in parentheses, * p<0.05 ** p<0.01 *** p<0.001. See model 0 for the regression model with controls only.
TABLE 5.6B: The Effects of the Interaction between Technology Competition and
Cooperation on Coopetition-Based Innovation (Using Multiple Regression)
Variables Model 9 Model 10 Model 10b Model 11 Model 11b
only controls w/o controls with controls w/o controls with controls
Controls Not reported
Not reported
Not reported
Tech_comp
7177.37*** (347.16) 6141.98*** (299.81) 5906.13*** (373.85) 5865.17*** (324.51)
Tech_comp ̂ 2
13060.95*** (1854.82) 10157.17*** (1574.12) 7168.30*** (1789.00) 6218.29*** (1542.67)
Type_coop
336.86*** (60.26) 141.66** (53.84)
Type_coop^2
-26.23** (8.12) -5.41 (7.35)
Techcomp _
Typecoop
538.61*** (97.07) 436.17*** (82.00)
Tie_coop
340.03*** (55.96) 112.64* (49.01)
Tie_coop^2
-7.20*** (1.37) -5.13*** (1.17)
Techcomp
_Tiecoop
552.07*** (108.69) 649.15*** (92.54)
Constant 665.28 (1013.76) -3684.12*** (554.12) -3056.20** (1029.58) -965.88* (393.86) -2012.12* (936.56)
N 1930
1930
1930
1930
1930
R2 0.328
0.208
0.460
0.303
0.506
R 0.573
0.456
0.678
0.55
0.711
ΔR2(Base=
Model 9)
0.132
0.178
Standard errors in parentheses, + p<0.1 * p<0.05 ** p<0.01 *** p<0.001. See Appendix B for the regression model with controls only.
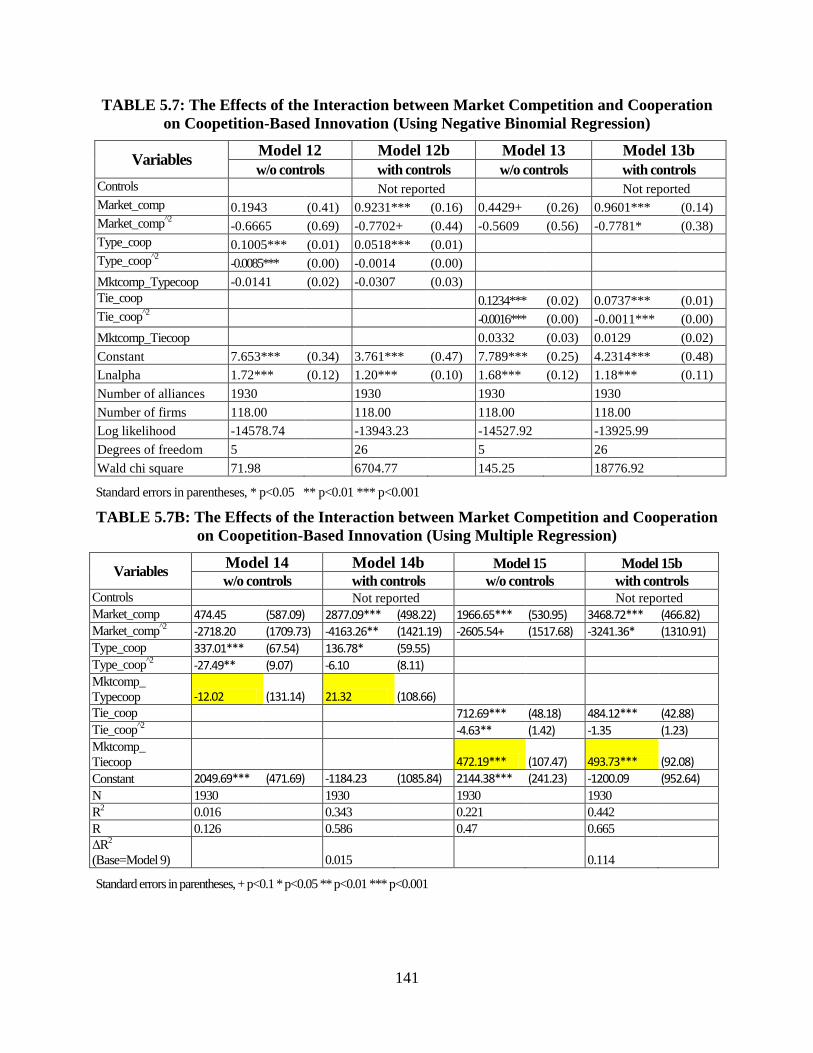
141
TABLE 5.7: The Effects of the Interaction between Market Competition and Cooperation
on Coopetition-Based Innovation (Using Negative Binomial Regression)
Variables Model 12 Model 12b Model 13 Model 13b
w/o controls with controls w/o controls with controls Controls
Not reported
Not reported
Market_comp 0.1943 (0.41) 0.9231*** (0.16) 0.4429+ (0.26) 0.9601*** (0.14)
Market_comp2̂ -0.6665 (0.69) -0.7702+ (0.44) -0.5609 (0.56) -0.7781* (0.38)
Type_coop 0.1005*** (0.01) 0.0518*** (0.01)
Type_coop2̂ -0.0085*** (0.00) -0.0014 (0.00)
Mktcomp_Typecoop -0.0141 (0.02) -0.0307 (0.03)
Tie_coop
0.1234*** (0.02) 0.0737*** (0.01)
Tie_coop2̂
-0.0016*** (0.00) -0.0011*** (0.00)
Mktcomp_Tiecoop
0.0332 (0.03) 0.0129 (0.02)
Constant 7.653*** (0.34) 3.761*** (0.47) 7.789*** (0.25) 4.2314*** (0.48)
Lnalpha 1.72*** (0.12) 1.20*** (0.10) 1.68*** (0.12) 1.18*** (0.11)
Number of alliances 1930
1930
1930
1930
Number of firms 118.00
118.00
118.00
118.00
Log likelihood -14578.74 -13943.23 -14527.92 -13925.99
Degrees of freedom 5 26 5 26
Wald chi square 71.98
6704.77 145.25
18776.92
Standard errors in parentheses, * p<0.05 ** p<0.01 *** p<0.001
TABLE 5.7B: The Effects of the Interaction between Market Competition and Cooperation
on Coopetition-Based Innovation (Using Multiple Regression)
Variables Model 14 Model 14b Model 15 Model 15b
w/o controls with controls w/o controls with controls Controls
Not reported
Not reported
Market_comp 474.45 (587.09) 2877.09*** (498.22) 1966.65*** (530.95) 3468.72*** (466.82) Market_comp
2̂ -2718.20 (1709.73) -4163.26** (1421.19) -2605.54+ (1517.68) -3241.36* (1310.91)
Type_coop 337.01*** (67.54) 136.78* (59.55) Type_coop
2̂ -27.49** (9.07) -6.10 (8.11)
Mktcomp_
Typecoop -12.02 (131.14) 21.32 (108.66) Tie_coop
712.69*** (48.18) 484.12*** (42.88) Tie_coop
2̂
-4.63** (1.42) -1.35 (1.23) Mktcomp_
Tiecoop
472.19*** (107.47) 493.73*** (92.08)
Constant 2049.69*** (471.69) -1184.23 (1085.84) 2144.38*** (241.23) -1200.09 (952.64)
N 1930
1930
1930
1930
R2 0.016
0.343
0.221
0.442
R 0.126
0.586
0.47
0.665
ΔR2
(Base=Model 9)
0.015
0.114
Standard errors in parentheses, + p<0.1 * p<0.05 ** p<0.01 *** p<0.001
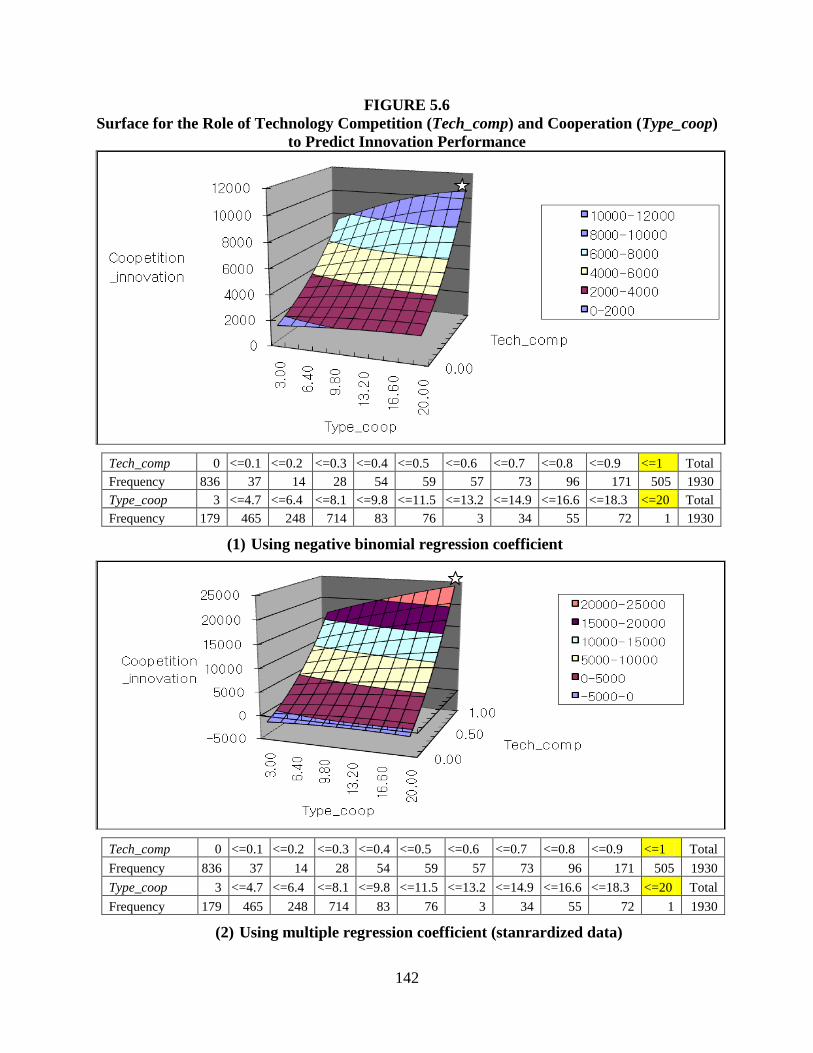
142
FIGURE 5.6
Surface for the Role of Technology Competition (Tech_comp) and Cooperation (Type_coop)
to Predict Innovation Performance
Tech_comp 0 <=0.1 <=0.2 <=0.3 <=0.4 <=0.5 <=0.6 <=0.7 <=0.8 <=0.9 <=1 Total
Frequency 836 37 14 28 54 59 57 73 96 171 505 1930
Type_coop 3 <=4.7 <=6.4 <=8.1 <=9.8 <=11.5 <=13.2 <=14.9 <=16.6 <=18.3 <=20 Total
Frequency 179 465 248 714 83 76 3 34 55 72 1 1930
(1) Using negative binomial regression coefficient
Tech_comp 0 <=0.1 <=0.2 <=0.3 <=0.4 <=0.5 <=0.6 <=0.7 <=0.8 <=0.9 <=1 Total
Frequency 836 37 14 28 54 59 57 73 96 171 505 1930
Type_coop 3 <=4.7 <=6.4 <=8.1 <=9.8 <=11.5 <=13.2 <=14.9 <=16.6 <=18.3 <=20 Total
Frequency 179 465 248 714 83 76 3 34 55 72 1 1930
(2) Using multiple regression coefficient (stanrardized data)
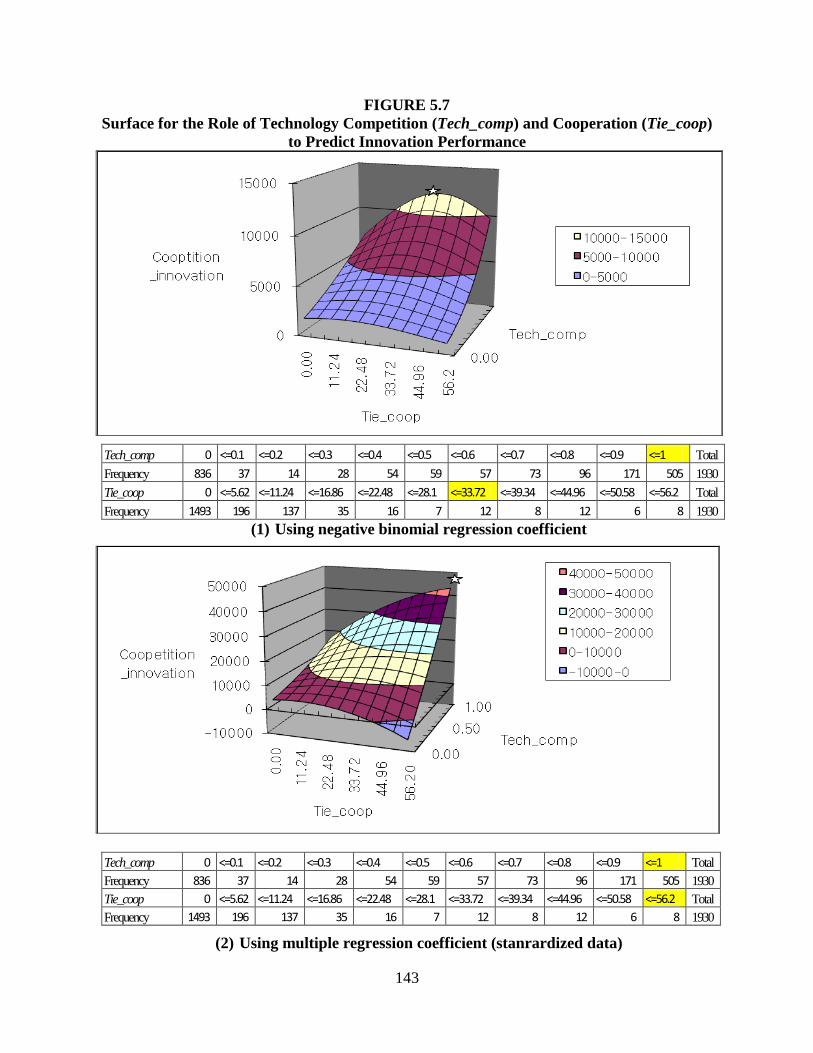
143
FIGURE 5.7
Surface for the Role of Technology Competition (Tech_comp) and Cooperation (Tie_coop)
to Predict Innovation Performance
Tech_comp 0 <=0.1 <=0.2 <=0.3 <=0.4 <=0.5 <=0.6 <=0.7 <=0.8 <=0.9 <=1 Total
Frequency 836 37 14 28 54 59 57 73 96 171 505 1930
Tie_coop 0 <=5.62 <=11.24 <=16.86 <=22.48 <=28.1 <=33.72 <=39.34 <=44.96 <=50.58 <=56.2 Total
Frequency 1493 196 137 35 16 7 12 8 12 6 8 1930
(1) Using negative binomial regression coefficient
Tech_comp 0 <=0.1 <=0.2 <=0.3 <=0.4 <=0.5 <=0.6 <=0.7 <=0.8 <=0.9 <=1 Total
Frequency 836 37 14 28 54 59 57 73 96 171 505 1930
Tie_coop 0 <=5.62 <=11.24 <=16.86 <=22.48 <=28.1 <=33.72 <=39.34 <=44.96 <=50.58 <=56.2 Total
Frequency 1493 196 137 35 16 7 12 8 12 6 8 1930
(2) Using multiple regression coefficient (stanrardized data)
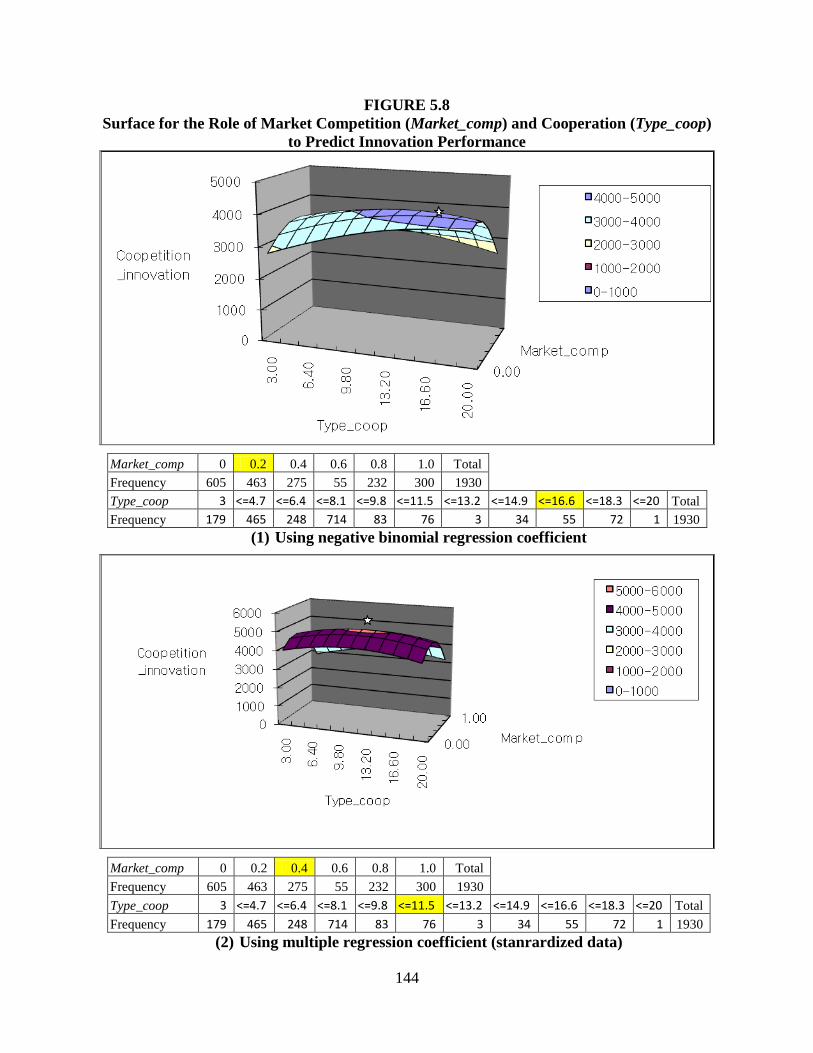
144
FIGURE 5.8
Surface for the Role of Market Competition (Market_comp) and Cooperation (Type_coop)
to Predict Innovation Performance
Market_comp 0 0.2 0.4 0.6 0.8 1.0 Total
Frequency 605 463 275 55 232 300 1930
Type_coop 3 <=4.7 <=6.4 <=8.1 <=9.8 <=11.5 <=13.2 <=14.9 <=16.6 <=18.3 <=20 Total
Frequency 179 465 248 714 83 76 3 34 55 72 1 1930
(1) Using negative binomial regression coefficient
Market_comp 0 0.2 0.4 0.6 0.8 1.0 Total
Frequency 605 463 275 55 232 300 1930
Type_coop 3 <=4.7 <=6.4 <=8.1 <=9.8 <=11.5 <=13.2 <=14.9 <=16.6 <=18.3 <=20 Total
Frequency 179 465 248 714 83 76 3 34 55 72 1 1930
(2) Using multiple regression coefficient (stanrardized data)
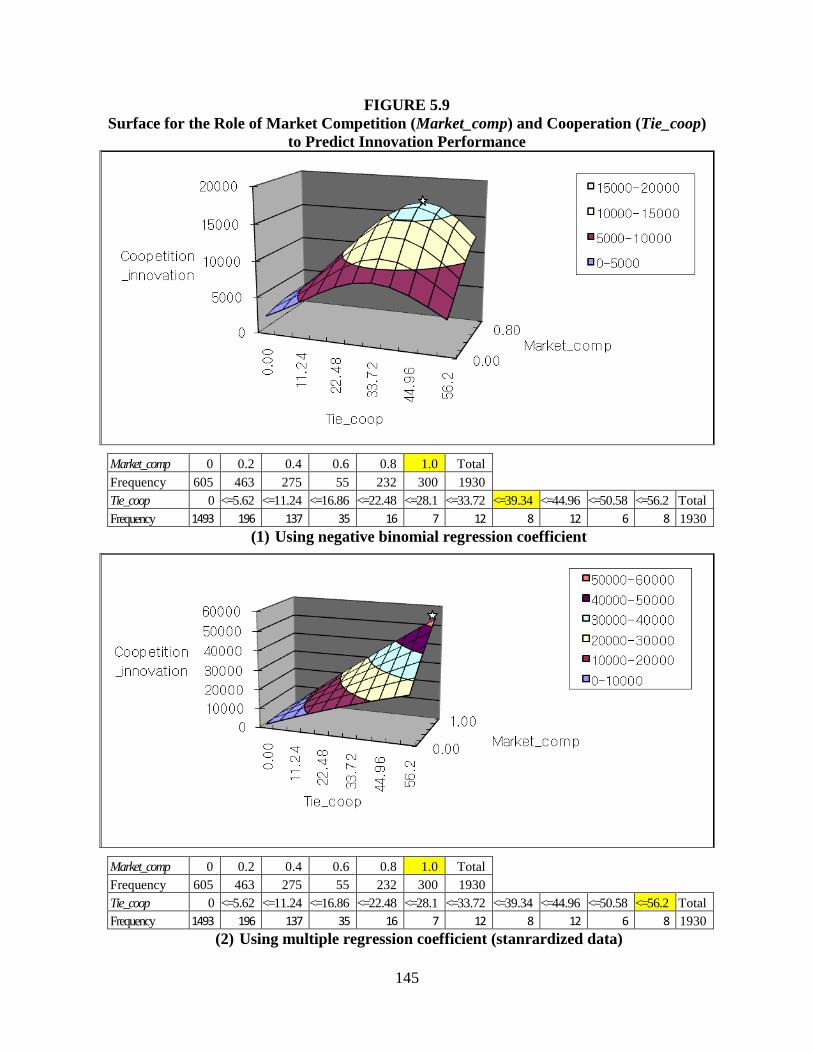
145
FIGURE 5.9
Surface for the Role of Market Competition (Market_comp) and Cooperation (Tie_coop)
to Predict Innovation Performance
Market_comp 0 0.2 0.4 0.6 0.8 1.0 Total
Frequency 605 463 275 55 232 300 1930
Tie_coop 0 <=5.62 <=11.24 <=16.86 <=22.48 <=28.1 <=33.72 <=39.34 <=44.96 <=50.58 <=56.2 Total
Frequency 1493 196 137 35 16 7 12 8 12 6 8 1930
(1) Using negative binomial regression coefficient
Market_comp 0 0.2 0.4 0.6 0.8 1.0 Total
Frequency 605 463 275 55 232 300 1930
Tie_coop 0 <=5.62 <=11.24 <=16.86 <=22.48 <=28.1 <=33.72 <=39.34 <=44.96 <=50.58 <=56.2 Total
Frequency 1493 196 137 35 16 7 12 8 12 6 8 1930
(2) Using multiple regression coefficient (stanrardized data)
146
5.4.2 The dummy variables of balanced-strong coopetition at the dyadic level
My key argument is that the intensity of cooperation should be increased as the intensity
of competition increases. Previous studies (e.g., Sampson, 2005) often used dummy variables to
estimate the effects of a subgroup of an independent variable. To test my key interests, I
estimated coopetition-based innovation as a function of balanced-strong coopetition as a dummy
variable. I measured balanced-strong coopetition via three dummy variables that captured the
extent of balanced-strong coopetition. The criteria to create dummy variables are 1) over the
mean values, 2) over mean + 0.5 standard deviation, and 3) over mean + 1 standard deviation in
four different combinations. For example, when I used the first criterion, balanced-strong
coopetition equals one if competition and cooperation are both over mean intensities, and zero if
not. While all other variables are based on continuous scales, market competition (Market_comp)
is based on an ordinal scale. Thus, I set the criterion to create dummy variables as follows: 1)
Market_comp is greater than 0.4 (over the mean) that happens when partners‘ 2-digit SIC codes
are the same; 2) Market_comp is greater than 0.8 that happens when partners‘ 4-digit SIC codes are
the same; and 3) Market_comp is 1 that happens when partners are in the same industry (partners‘ 4-
dight SIC codes are the same), take the same types of firm, and play in the same product segment.
That is, when I used the third criterion of balanced strong coopetition in combination with market
competition and cooperation, balanced-strong coopetition equals 1 if market competition equals 1
and cooperation is greater than mean plus 1 standard deviation, and zero if not.
Tables 5.8 and 5.9 report the test results for this hypothesis by using the dummy variables
of balanced-strong coopetition. Table 5.8 presents the effects of balanced-strong coopetition in
terms of high technology competition (Tech_comp) and high cooperation (Type_coop or
Tie_coop), while Table 5.9 presents the effects of balanced-strong coopetition in terms of high
147
market competition (Market_comp) and high cooperation. As the results show, this hypothesis
(H3a) is strongly supported as most coefficients of the dummy variables are positive and
significant at the 0.001 or lower level in both tables. One interesting finding was that there were
no observations in the category of the combination of high market commonality (Market_comp
=1) and high intensity of Tie_coop (mean + 1 standard deviation) (models 27 and 27b).
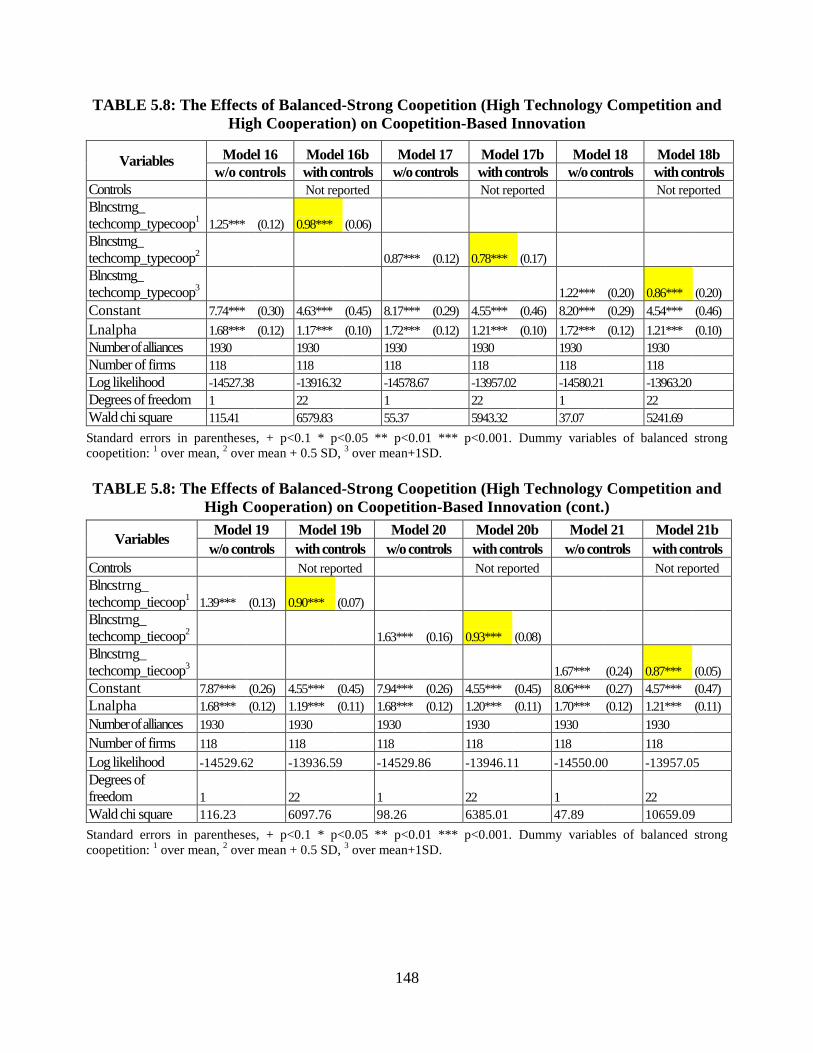
148
TABLE 5.8: The Effects of Balanced-Strong Coopetition (High Technology Competition and
High Cooperation) on Coopetition-Based Innovation
Variables Model 16 Model 16b Model 17 Model 17b Model 18 Model 18b
w/o controls with controls w/o controls with controls w/o controls with controls
Controls
Not reported
Not reported
Not reported
Blncstrng_
techcomp_typecoop1 1.25*** (0.12) 0.98*** (0.06)
Blncstrng_
techcomp_typecoop2
0.87*** (0.12) 0.78*** (0.17)
Blncstrng_
techcomp_typecoop3
1.22*** (0.20) 0.86*** (0.20)
Constant 7.74*** (0.30) 4.63*** (0.45) 8.17*** (0.29) 4.55*** (0.46) 8.20*** (0.29) 4.54*** (0.46)
Lnalpha 1.68*** (0.12) 1.17*** (0.10) 1.72*** (0.12) 1.21*** (0.10) 1.72*** (0.12) 1.21*** (0.10)
Number of alliances 1930
1930
1930
1930
1930
1930
Number of firms 118
118
118
118
118
118
Log likelihood -14527.38 -13916.32 -14578.67 -13957.02 -14580.21 -13963.20
Degrees of freedom 1
22
1
22
1
22
Wald chi square 115.41 6579.83 55.37 5943.32 37.07 5241.69
Standard errors in parentheses, + p<0.1 * p<0.05 ** p<0.01 *** p<0.001. Dummy variables of balanced strong
coopetition: 1 over mean,
2 over mean + 0.5 SD,
3 over mean+1SD.
TABLE 5.8: The Effects of Balanced-Strong Coopetition (High Technology Competition and
High Cooperation) on Coopetition-Based Innovation (cont.)
Variables Model 19 Model 19b Model 20 Model 20b Model 21 Model 21b
w/o controls with controls w/o controls with controls w/o controls with controls
Controls
Not reported
Not reported
Not reported
Blncstrng_
techcomp_tiecoop1 1.39*** (0.13) 0.90*** (0.07)
Blncstrng_
techcomp_tiecoop2
1.63*** (0.16) 0.93*** (0.08)
Blncstrng_
techcomp_tiecoop3
1.67*** (0.24) 0.87*** (0.05)
Constant 7.87*** (0.26) 4.55*** (0.45) 7.94*** (0.26) 4.55*** (0.45) 8.06*** (0.27) 4.57*** (0.47)
Lnalpha 1.68*** (0.12) 1.19*** (0.11) 1.68*** (0.12) 1.20*** (0.11) 1.70*** (0.12) 1.21*** (0.11)
Number of alliances 1930
1930
1930
1930
1930
1930
Number of firms 118
118
118
118
118
118
Log likelihood -14529.62 -13936.59 -14529.86 -13946.11 -14550.00 -13957.05
Degrees of
freedom 1
22
1
22
1
22
Wald chi square 116.23 6097.76 98.26 6385.01 47.89 10659.09
Standard errors in parentheses, + p<0.1 * p<0.05 ** p<0.01 *** p<0.001. Dummy variables of balanced strong
coopetition: 1 over mean,
2 over mean + 0.5 SD,
3 over mean+1SD.
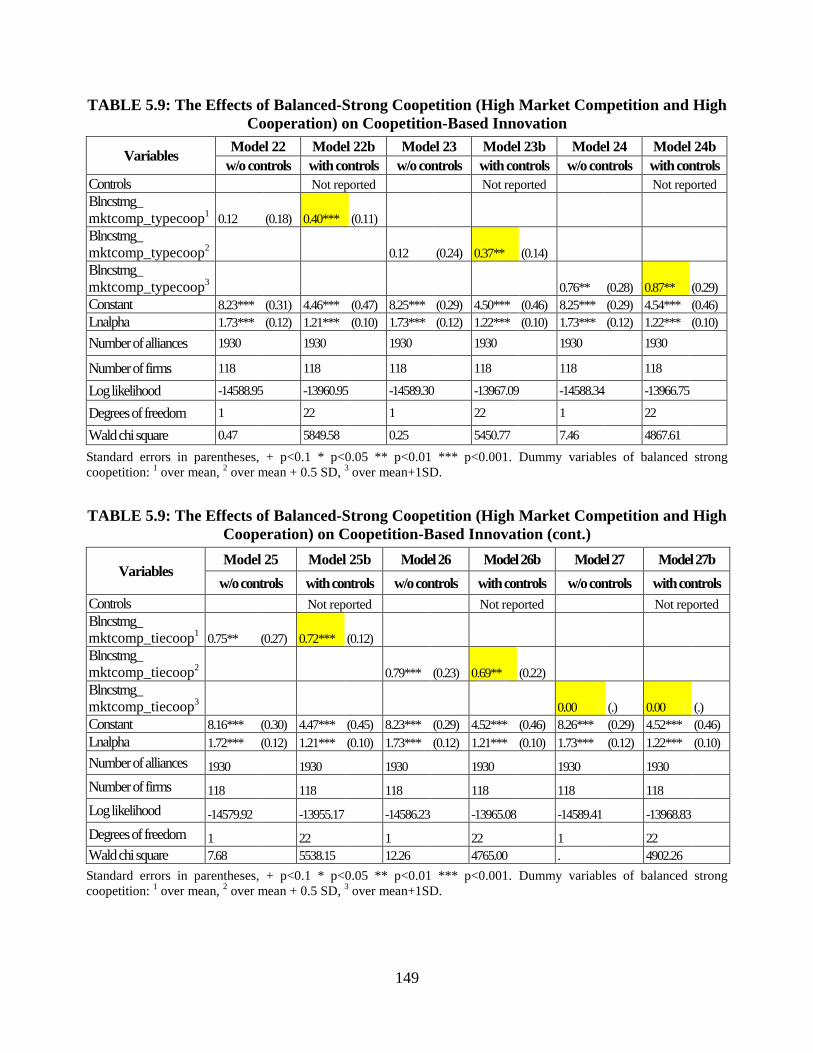
149
TABLE 5.9: The Effects of Balanced-Strong Coopetition (High Market Competition and High
Cooperation) on Coopetition-Based Innovation
Variables Model 22 Model 22b Model 23 Model 23b Model 24 Model 24b
w/o controls with controls w/o controls with controls w/o controls with controls
Controls
Not reported
Not reported
Not reported
Blncstrng_
mktcomp_typecoop1 0.12 (0.18) 0.40*** (0.11)
Blncstrng_
mktcomp_typecoop2
0.12 (0.24) 0.37** (0.14)
Blncstrng_
mktcomp_typecoop3
0.76** (0.28) 0.87** (0.29)
Constant 8.23*** (0.31) 4.46*** (0.47) 8.25*** (0.29) 4.50*** (0.46) 8.25*** (0.29) 4.54*** (0.46)
Lnalpha 1.73*** (0.12) 1.21*** (0.10) 1.73*** (0.12) 1.22*** (0.10) 1.73*** (0.12) 1.22*** (0.10)
Number of alliances 1930
1930
1930
1930
1930
1930
Number of firms 118
118
118
118
118
118
Log likelihood -14588.95 -13960.95 -14589.30 -13967.09 -14588.34 -13966.75
Degrees of freedom 1
22
1
22
1
22
Wald chi square 0.47 5849.58 0.25 5450.77 7.46 4867.61
Standard errors in parentheses, + p<0.1 * p<0.05 ** p<0.01 *** p<0.001. Dummy variables of balanced strong
coopetition: 1 over mean,
2 over mean + 0.5 SD,
3 over mean+1SD.
TABLE 5.9: The Effects of Balanced-Strong Coopetition (High Market Competition and High
Cooperation) on Coopetition-Based Innovation (cont.)
Variables Model 25 Model 25b Model 26 Model 26b Model 27 Model 27b
w/o controls with controls w/o controls with controls w/o controls with controls
Controls
Not reported
Not reported
Not reported
Blncstrng_
mktcomp_tiecoop1 0.75** (0.27) 0.72*** (0.12)
Blncstrng_
mktcomp_tiecoop2
0.79*** (0.23) 0.69** (0.22)
Blncstrng_
mktcomp_tiecoop3
0.00 (.) 0.00 (.)
Constant 8.16*** (0.30) 4.47*** (0.45) 8.23*** (0.29) 4.52*** (0.46) 8.26*** (0.29) 4.52*** (0.46)
Lnalpha 1.72*** (0.12) 1.21*** (0.10) 1.73*** (0.12) 1.21*** (0.10) 1.73*** (0.12) 1.22*** (0.10)
Number of alliances 1930
1930
1930
1930
1930
1930
Number of firms 118
118
118
118
118
118
Log likelihood -14579.92 -13955.17 -14586.23 -13965.08 -14589.41 -13968.83
Degrees of freedom 1
22
1
22
1
22
Wald chi square 7.68 5538.15 12.26 4765.00 . 4902.26
Standard errors in parentheses, + p<0.1 * p<0.05 ** p<0.01 *** p<0.001. Dummy variables of balanced strong
coopetition: 1 over mean,
2 over mean + 0.5 SD,
3 over mean+1SD.
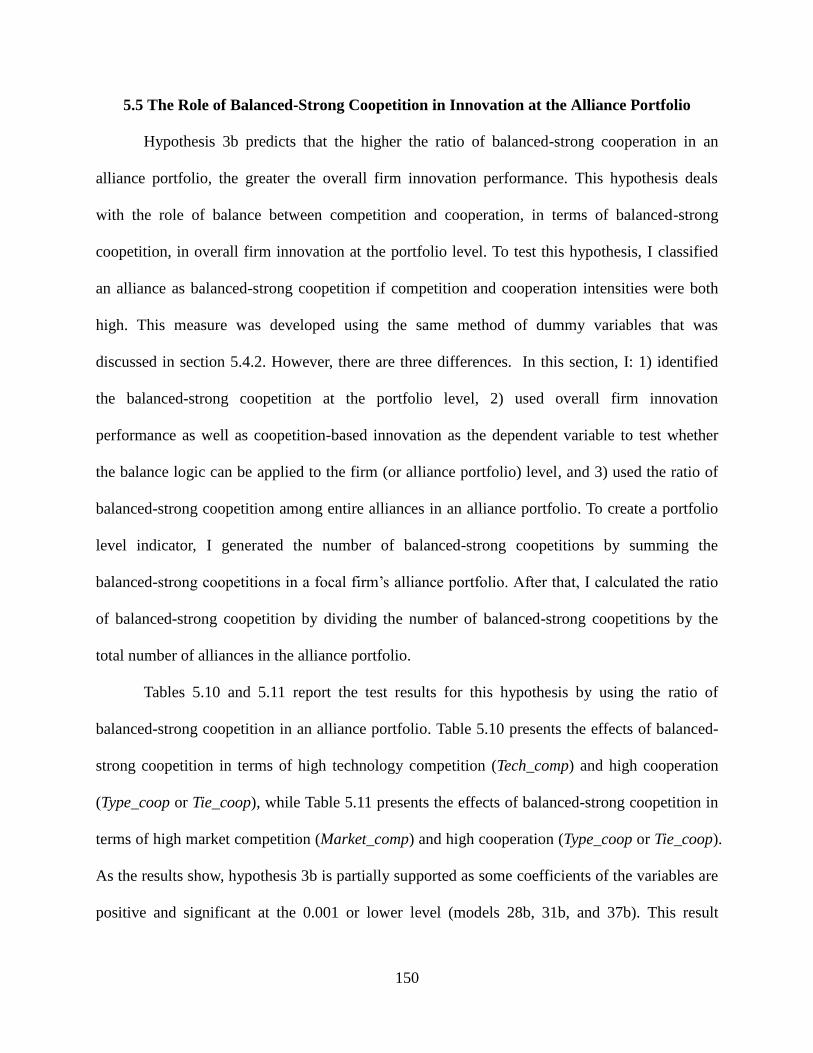
150
5.5 The Role of Balanced-Strong Coopetition in Innovation at the Alliance Portfolio
Hypothesis 3b predicts that the higher the ratio of balanced-strong cooperation in an
alliance portfolio, the greater the overall firm innovation performance. This hypothesis deals
with the role of balance between competition and cooperation, in terms of balanced-strong
coopetition, in overall firm innovation at the portfolio level. To test this hypothesis, I classified
an alliance as balanced-strong coopetition if competition and cooperation intensities were both
high. This measure was developed using the same method of dummy variables that was
discussed in section 5.4.2. However, there are three differences. In this section, I: 1) identified
the balanced-strong coopetition at the portfolio level, 2) used overall firm innovation
performance as well as coopetition-based innovation as the dependent variable to test whether
the balance logic can be applied to the firm (or alliance portfolio) level, and 3) used the ratio of
balanced-strong coopetition among entire alliances in an alliance portfolio. To create a portfolio
level indicator, I generated the number of balanced-strong coopetitions by summing the
balanced-strong coopetitions in a focal firm‘s alliance portfolio. After that, I calculated the ratio
of balanced-strong coopetition by dividing the number of balanced-strong coopetitions by the
total number of alliances in the alliance portfolio.
Tables 5.10 and 5.11 report the test results for this hypothesis by using the ratio of
balanced-strong coopetition in an alliance portfolio. Table 5.10 presents the effects of balanced-
strong coopetition in terms of high technology competition (Tech_comp) and high cooperation
(Type_coop or Tie_coop), while Table 5.11 presents the effects of balanced-strong coopetition in
terms of high market competition (Market_comp) and high cooperation (Type_coop or Tie_coop).
As the results show, hypothesis 3b is partially supported as some coefficients of the variables are
positive and significant at the 0.001 or lower level (models 28b, 31b, and 37b). This result
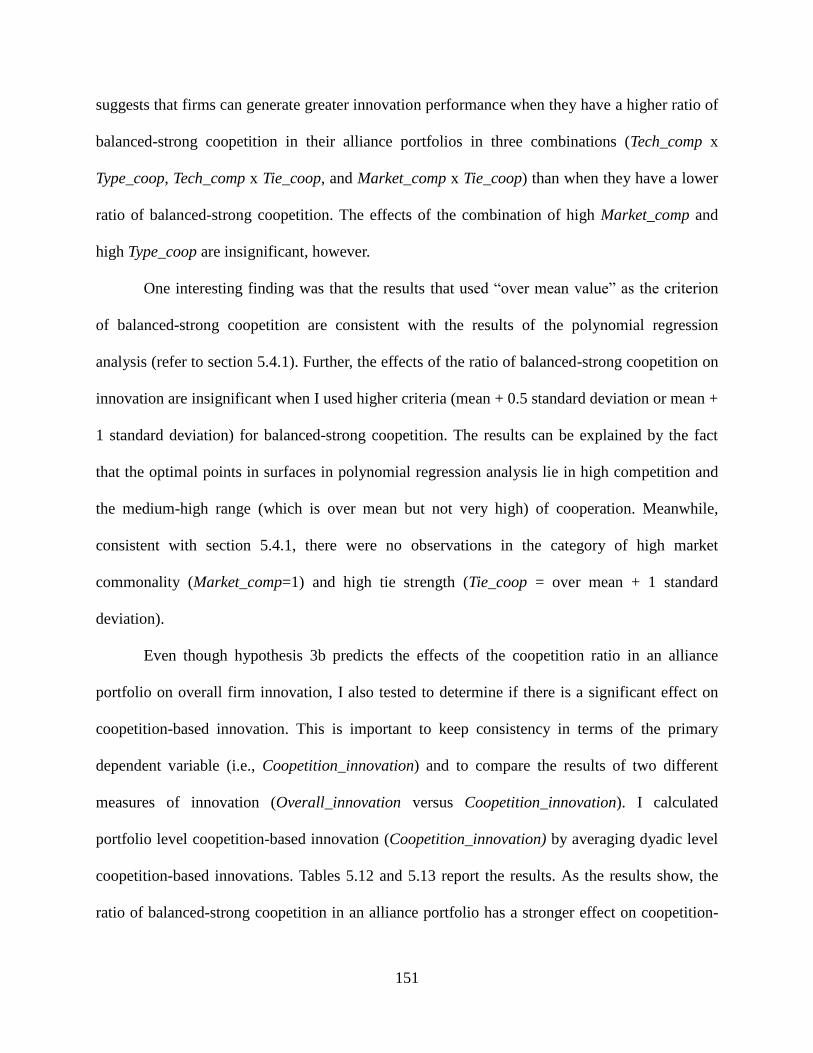
151
suggests that firms can generate greater innovation performance when they have a higher ratio of
balanced-strong coopetition in their alliance portfolios in three combinations (Tech_comp x
Type_coop, Tech_comp x Tie_coop, and Market_comp x Tie_coop) than when they have a lower
ratio of balanced-strong coopetition. The effects of the combination of high Market_comp and
high Type_coop are insignificant, however.
One interesting finding was that the results that used ―over mean value‖ as the criterion
of balanced-strong coopetition are consistent with the results of the polynomial regression
analysis (refer to section 5.4.1). Further, the effects of the ratio of balanced-strong coopetition on
innovation are insignificant when I used higher criteria (mean + 0.5 standard deviation or mean +
1 standard deviation) for balanced-strong coopetition. The results can be explained by the fact
that the optimal points in surfaces in polynomial regression analysis lie in high competition and
the medium-high range (which is over mean but not very high) of cooperation. Meanwhile,
consistent with section 5.4.1, there were no observations in the category of high market
commonality (Market_comp=1) and high tie strength (Tie_coop = over mean + 1 standard
deviation).
Even though hypothesis 3b predicts the effects of the coopetition ratio in an alliance
portfolio on overall firm innovation, I also tested to determine if there is a significant effect on
coopetition-based innovation. This is important to keep consistency in terms of the primary
dependent variable (i.e., Coopetition_innovation) and to compare the results of two different
measures of innovation (Overall_innovation versus Coopetition_innovation). I calculated
portfolio level coopetition-based innovation (Coopetition_innovation) by averaging dyadic level
coopetition-based innovations. Tables 5.12 and 5.13 report the results. As the results show, the
ratio of balanced-strong coopetition in an alliance portfolio has a stronger effect on coopetition-
152
based innovation than on overall firm innovation. This result suggests that firms can also
generate greater coopetition-based innovation performance when they have a higher ratio of
balanced-strong coopetition in their alliance portfolios in all four combinations (Tech_comp x
Type_coop, Tech_comp x Tie_coop, Market_comp x Type_coop, and Market_comp x Tie_coop)
than when they have a lower ratio of balanced-strong coopetition. Further, the effects are
significant even at a higher level of criteria for balanced-strong coopetition (models 40b, 41b,
43b, 46b, 48b, and 49b).
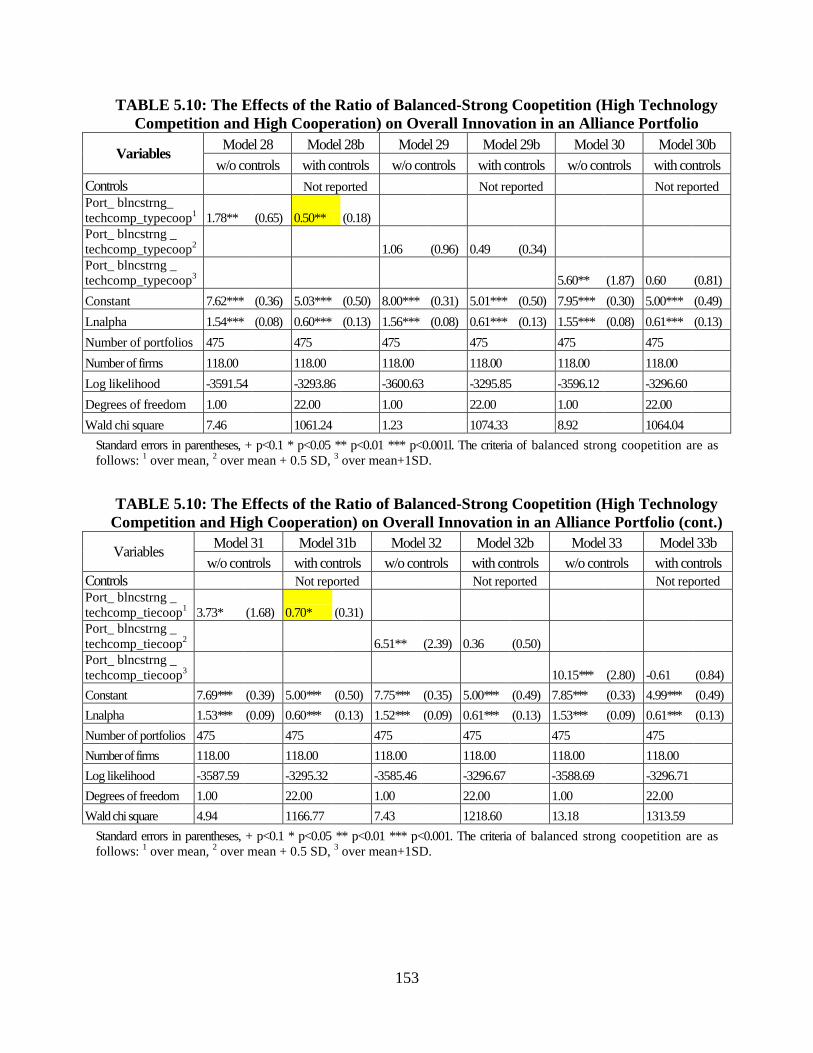
153
TABLE 5.10: The Effects of the Ratio of Balanced-Strong Coopetition (High Technology
Competition and High Cooperation) on Overall Innovation in an Alliance Portfolio
Variables Model 28 Model 28b Model 29 Model 29b Model 30 Model 30b
w/o controls with controls w/o controls with controls w/o controls with controls
Controls
Not reported
Not reported
Not reported
Port_ blncstrng_
techcomp_typecoop1 1.78** (0.65) 0.50** (0.18)
Port_ blncstrng _
techcomp_typecoop2
1.06 (0.96) 0.49 (0.34)
Port_ blncstrng _
techcomp_typecoop3
5.60** (1.87) 0.60 (0.81)
Constant 7.62*** (0.36) 5.03*** (0.50) 8.00*** (0.31) 5.01*** (0.50) 7.95*** (0.30) 5.00*** (0.49)
Lnalpha 1.54*** (0.08) 0.60*** (0.13) 1.56*** (0.08) 0.61*** (0.13) 1.55*** (0.08) 0.61*** (0.13)
Number of portfolios 475
475
475
475
475
475
Number of firms 118.00
118.00
118.00
118.00
118.00
118.00
Log likelihood -3591.54 -3293.86 -3600.63 -3295.85 -3596.12 -3296.60
Degrees of freedom 1.00
22.00
1.00
22.00
1.00
22.00
Wald chi square 7.46 1061.24 1.23 1074.33 8.92 1064.04
Standard errors in parentheses, + p<0.1 * p<0.05 ** p<0.01 *** p<0.001l. The criteria of balanced strong coopetition are as
follows: 1 over mean,
2 over mean + 0.5 SD,
3 over mean+1SD.
TABLE 5.10: The Effects of the Ratio of Balanced-Strong Coopetition (High Technology
Competition and High Cooperation) on Overall Innovation in an Alliance Portfolio (cont.)
Variables Model 31 Model 31b Model 32 Model 32b Model 33 Model 33b
w/o controls with controls w/o controls with controls w/o controls with controls
Controls
Not reported
Not reported
Not reported
Port_ blncstrng _
techcomp_tiecoop1 3.73* (1.68) 0.70* (0.31)
Port_ blncstrng _
techcomp_tiecoop2
6.51** (2.39) 0.36 (0.50)
Port_ blncstrng _
techcomp_tiecoop3
10.15*** (2.80) -0.61 (0.84)
Constant 7.69*** (0.39) 5.00*** (0.50) 7.75*** (0.35) 5.00*** (0.49) 7.85*** (0.33) 4.99*** (0.49)
Lnalpha 1.53*** (0.09) 0.60*** (0.13) 1.52*** (0.09) 0.61*** (0.13) 1.53*** (0.09) 0.61*** (0.13)
Number of portfolios 475
475
475
475
475
475
Number of firms 118.00
118.00
118.00
118.00
118.00
118.00
Log likelihood -3587.59 -3295.32 -3585.46 -3296.67 -3588.69 -3296.71
Degrees of freedom 1.00
22.00
1.00
22.00
1.00
22.00
Wald chi square 4.94 1166.77 7.43 1218.60 13.18 1313.59
Standard errors in parentheses, + p<0.1 * p<0.05 ** p<0.01 *** p<0.001. The criteria of balanced strong coopetition are as
follows: 1 over mean,
2 over mean + 0.5 SD,
3 over mean+1SD.
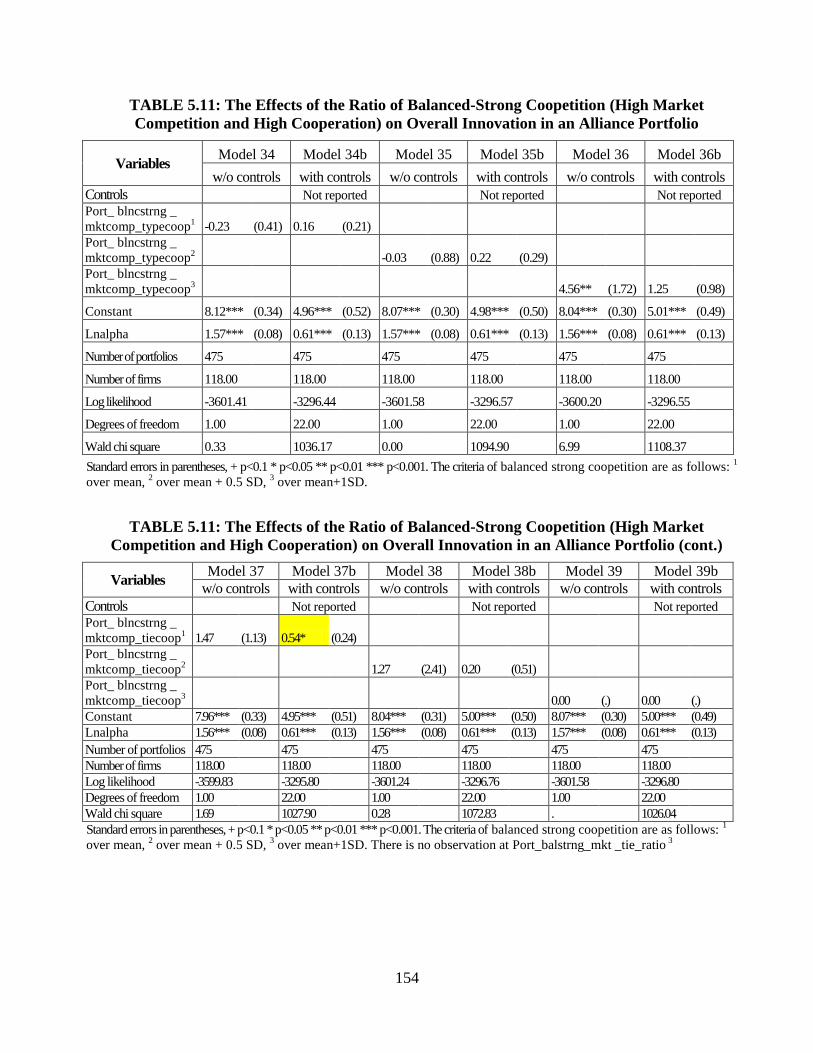
154
TABLE 5.11: The Effects of the Ratio of Balanced-Strong Coopetition (High Market
Competition and High Cooperation) on Overall Innovation in an Alliance Portfolio
Variables Model 34 Model 34b Model 35 Model 35b Model 36 Model 36b
w/o controls with controls w/o controls with controls w/o controls with controls
Controls
Not reported
Not reported
Not reported
Port_ blncstrng _
mktcomp_typecoop1 -0.23 (0.41) 0.16 (0.21)
Port_ blncstrng _
mktcomp_typecoop2
-0.03 (0.88) 0.22 (0.29)
Port_ blncstrng _
mktcomp_typecoop3
4.56** (1.72) 1.25 (0.98)
Constant 8.12*** (0.34) 4.96*** (0.52) 8.07*** (0.30) 4.98*** (0.50) 8.04*** (0.30) 5.01*** (0.49)
Lnalpha 1.57*** (0.08) 0.61*** (0.13) 1.57*** (0.08) 0.61*** (0.13) 1.56*** (0.08) 0.61*** (0.13)
Number of portfolios 475
475
475
475
475
475
Number of firms 118.00
118.00
118.00
118.00
118.00
118.00
Log likelihood -3601.41 -3296.44 -3601.58 -3296.57 -3600.20 -3296.55
Degrees of freedom 1.00
22.00
1.00
22.00
1.00
22.00
Wald chi square 0.33 1036.17 0.00 1094.90 6.99 1108.37
Standard errors in parentheses, + p<0.1 * p<0.05 ** p<0.01 *** p<0.001. The criteria of balanced strong coopetition are as follows: 1
over mean, 2 over mean + 0.5 SD,
3 over mean+1SD.
TABLE 5.11: The Effects of the Ratio of Balanced-Strong Coopetition (High Market
Competition and High Cooperation) on Overall Innovation in an Alliance Portfolio (cont.)
Variables Model 37 Model 37b Model 38 Model 38b Model 39 Model 39b
w/o controls with controls w/o controls with controls w/o controls with controls
Controls
Not reported
Not reported
Not reported
Port_ blncstrng _
mktcomp_tiecoop1 1.47 (1.13) 0.54* (0.24)
Port_ blncstrng _
mktcomp_tiecoop2
1.27 (2.41) 0.20 (0.51)
Port_ blncstrng _
mktcomp_tiecoop3
0.00 (.) 0.00 (.)
Constant 7.96*** (0.33) 4.95*** (0.51) 8.04*** (0.31) 5.00*** (0.50) 8.07*** (0.30) 5.00*** (0.49)
Lnalpha 1.56*** (0.08) 0.61*** (0.13) 1.56*** (0.08) 0.61*** (0.13) 1.57*** (0.08) 0.61*** (0.13)
Number of portfolios 475
475
475
475
475
475
Number of firms 118.00
118.00
118.00
118.00
118.00
118.00
Log likelihood -3599.83 -3295.80 -3601.24 -3296.76 -3601.58 -3296.80
Degrees of freedom 1.00
22.00
1.00
22.00
1.00
22.00
Wald chi square 1.69 1027.90 0.28 1072.83 . 1026.04
Standard errors in parentheses, + p<0.1 * p<0.05 ** p<0.01 *** p<0.001. The criteria of balanced strong coopetition are as follows: 1
over mean, 2 over mean + 0.5 SD,
3 over mean+1SD. There is no observation at Port_balstrng_mkt _tie_ratio
3
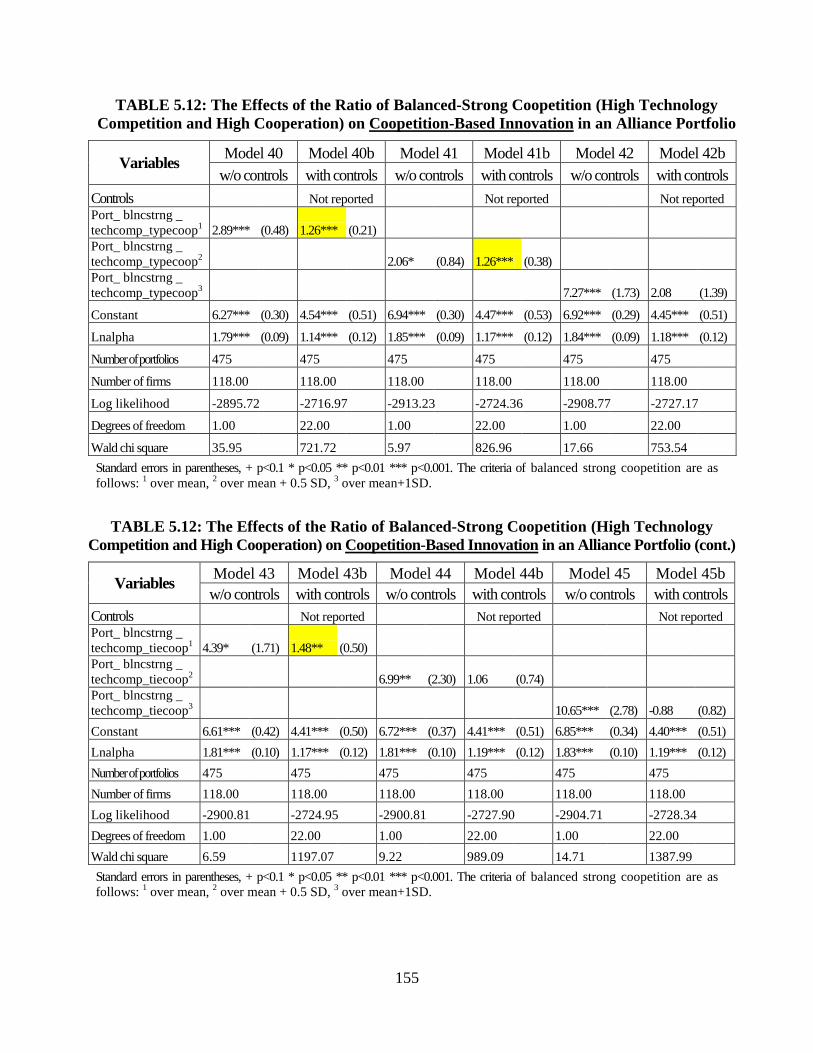
155
TABLE 5.12: The Effects of the Ratio of Balanced-Strong Coopetition (High Technology
Competition and High Cooperation) on Coopetition-Based Innovation in an Alliance Portfolio
Variables Model 40 Model 40b Model 41 Model 41b Model 42 Model 42b
w/o controls with controls w/o controls with controls w/o controls with controls
Controls
Not reported
Not reported
Not reported
Port_ blncstrng _
techcomp_typecoop1 2.89*** (0.48) 1.26*** (0.21)
Port_ blncstrng _
techcomp_typecoop2
2.06* (0.84) 1.26*** (0.38)
Port_ blncstrng _
techcomp_typecoop3
7.27*** (1.73) 2.08 (1.39)
Constant 6.27*** (0.30) 4.54*** (0.51) 6.94*** (0.30) 4.47*** (0.53) 6.92*** (0.29) 4.45*** (0.51)
Lnalpha 1.79*** (0.09) 1.14*** (0.12) 1.85*** (0.09) 1.17*** (0.12) 1.84*** (0.09) 1.18*** (0.12)
Number of portfolios 475
475
475
475
475
475
Number of firms 118.00
118.00
118.00
118.00
118.00
118.00
Log likelihood -2895.72 -2716.97 -2913.23 -2724.36 -2908.77 -2727.17
Degrees of freedom 1.00
22.00
1.00
22.00
1.00
22.00
Wald chi square 35.95 721.72 5.97 826.96 17.66 753.54
Standard errors in parentheses, + p<0.1 * p<0.05 ** p<0.01 *** p<0.001. The criteria of balanced strong coopetition are as
follows: 1 over mean,
2 over mean + 0.5 SD,
3 over mean+1SD.
TABLE 5.12: The Effects of the Ratio of Balanced-Strong Coopetition (High Technology
Competition and High Cooperation) on Coopetition-Based Innovation in an Alliance Portfolio (cont.)
Variables Model 43 Model 43b Model 44 Model 44b Model 45 Model 45b
w/o controls with controls w/o controls with controls w/o controls with controls
Controls
Not reported
Not reported
Not reported
Port_ blncstrng _
techcomp_tiecoop1 4.39* (1.71) 1.48** (0.50)
Port_ blncstrng _
techcomp_tiecoop2
6.99** (2.30) 1.06 (0.74)
Port_ blncstrng _
techcomp_tiecoop3
10.65*** (2.78) -0.88 (0.82)
Constant 6.61*** (0.42) 4.41*** (0.50) 6.72*** (0.37) 4.41*** (0.51) 6.85*** (0.34) 4.40*** (0.51)
Lnalpha 1.81*** (0.10) 1.17*** (0.12) 1.81*** (0.10) 1.19*** (0.12) 1.83*** (0.10) 1.19*** (0.12)
Number of portfolios 475
475
475
475
475
475
Number of firms 118.00
118.00
118.00
118.00
118.00
118.00
Log likelihood -2900.81 -2724.95 -2900.81 -2727.90 -2904.71 -2728.34
Degrees of freedom 1.00
22.00
1.00
22.00
1.00
22.00
Wald chi square 6.59 1197.07 9.22 989.09 14.71 1387.99
Standard errors in parentheses, + p<0.1 * p<0.05 ** p<0.01 *** p<0.001. The criteria of balanced strong coopetition are as
follows: 1 over mean,
2 over mean + 0.5 SD,
3 over mean+1SD.
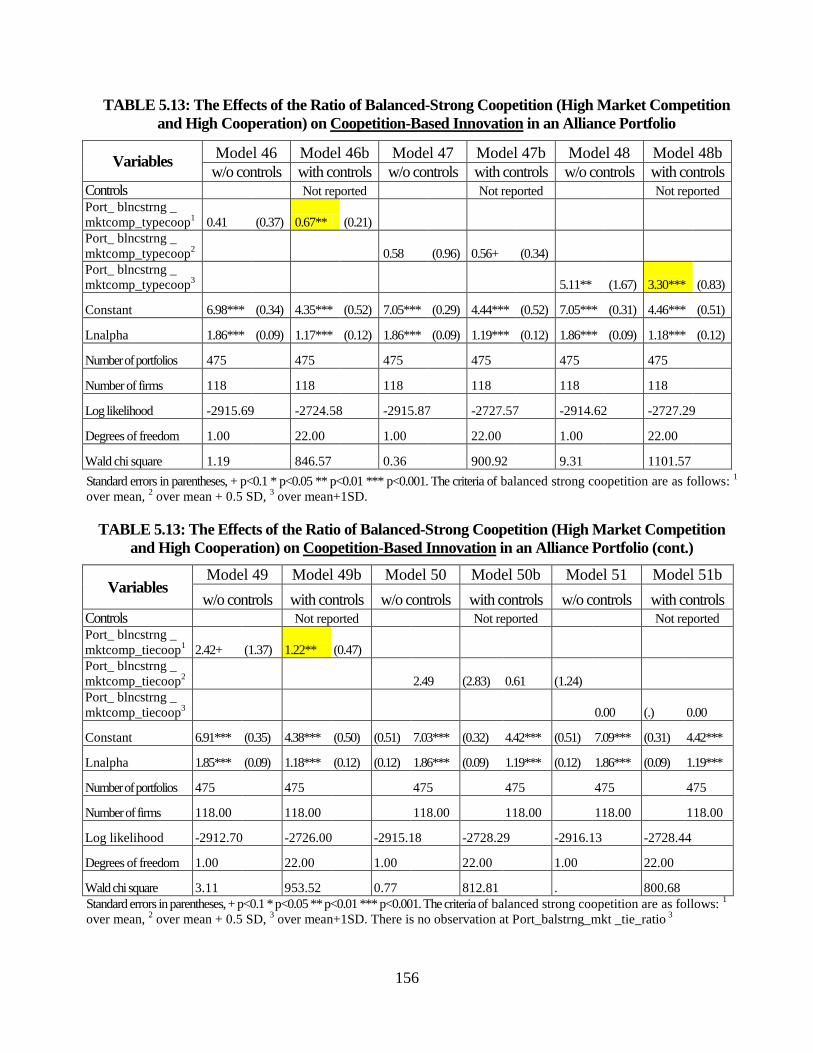
156
TABLE 5.13: The Effects of the Ratio of Balanced-Strong Coopetition (High Market Competition
and High Cooperation) on Coopetition-Based Innovation in an Alliance Portfolio
Variables Model 46 Model 46b Model 47 Model 47b Model 48 Model 48b
w/o controls with controls w/o controls with controls w/o controls with controls Controls
Not reported
Not reported
Not reported
Port_ blncstrng _
mktcomp_typecoop1 0.41 (0.37) 0.67** (0.21)
Port_ blncstrng _
mktcomp_typecoop2
0.58 (0.96) 0.56+ (0.34)
Port_ blncstrng _
mktcomp_typecoop3
5.11** (1.67) 3.30*** (0.83)
Constant 6.98*** (0.34) 4.35*** (0.52) 7.05*** (0.29) 4.44*** (0.52) 7.05*** (0.31) 4.46*** (0.51)
Lnalpha 1.86*** (0.09) 1.17*** (0.12) 1.86*** (0.09) 1.19*** (0.12) 1.86*** (0.09) 1.18*** (0.12)
Number of portfolios 475
475
475
475
475
475
Number of firms 118
118
118
118
118
118
Log likelihood -2915.69 -2724.58 -2915.87 -2727.57 -2914.62 -2727.29
Degrees of freedom 1.00
22.00
1.00
22.00
1.00
22.00
Wald chi square 1.19 846.57 0.36 900.92 9.31 1101.57
Standard errors in parentheses, + p<0.1 * p<0.05 ** p<0.01 *** p<0.001. The criteria of balanced strong coopetition are as follows: 1
over mean, 2 over mean + 0.5 SD,
3 over mean+1SD.
TABLE 5.13: The Effects of the Ratio of Balanced-Strong Coopetition (High Market Competition
and High Cooperation) on Coopetition-Based Innovation in an Alliance Portfolio (cont.)
Variables Model 49 Model 49b Model 50 Model 50b Model 51 Model 51b
w/o controls with controls w/o controls with controls w/o controls with controls Controls
Not reported
Not reported
Not reported
Port_ blncstrng _
mktcomp_tiecoop1 2.42+ (1.37) 1.22** (0.47)
Port_ blncstrng _
mktcomp_tiecoop2
2.49 (2.83) 0.61 (1.24)
Port_ blncstrng _
mktcomp_tiecoop3
0.00 (.) 0.00
Constant 6.91*** (0.35) 4.38*** (0.50) (0.51) 7.03*** (0.32) 4.42*** (0.51) 7.09*** (0.31) 4.42***
Lnalpha 1.85*** (0.09) 1.18*** (0.12) (0.12) 1.86*** (0.09) 1.19*** (0.12) 1.86*** (0.09) 1.19***
Number of portfolios 475
475
475
475
475
475
Number of firms 118.00
118.00
118.00
118.00
118.00
118.00
Log likelihood -2912.70 -2726.00 -2915.18 -2728.29 -2916.13 -2728.44
Degrees of freedom 1.00
22.00
1.00
22.00
1.00
22.00
Wald chi square 3.11 953.52 0.77 812.81 . 800.68
Standard errors in parentheses, + p<0.1 * p<0.05 ** p<0.01 *** p<0.001. The criteria of balanced strong coopetition are as follows: 1
over mean, 2 over mean + 0.5 SD,
3 over mean+1SD. There is no observation at Port_balstrng_mkt _tie_ratio
3
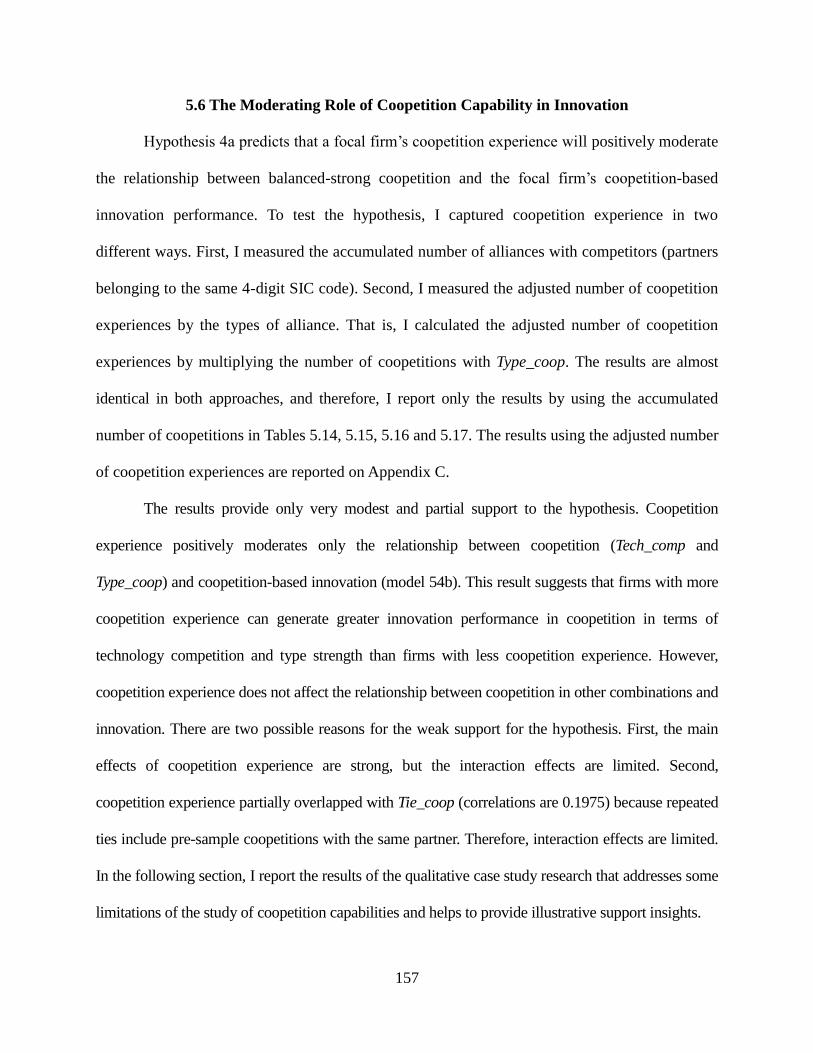
157
5.6 The Moderating Role of Coopetition Capability in Innovation
Hypothesis 4a predicts that a focal firm‘s coopetition experience will positively moderate
the relationship between balanced-strong coopetition and the focal firm‘s coopetition-based
innovation performance. To test the hypothesis, I captured coopetition experience in two
different ways. First, I measured the accumulated number of alliances with competitors (partners
belonging to the same 4-digit SIC code). Second, I measured the adjusted number of coopetition
experiences by the types of alliance. That is, I calculated the adjusted number of coopetition
experiences by multiplying the number of coopetitions with Type_coop. The results are almost
identical in both approaches, and therefore, I report only the results by using the accumulated
number of coopetitions in Tables 5.14, 5.15, 5.16 and 5.17. The results using the adjusted number
of coopetition experiences are reported on Appendix C.
The results provide only very modest and partial support to the hypothesis. Coopetition
experience positively moderates only the relationship between coopetition (Tech_comp and
Type_coop) and coopetition-based innovation (model 54b). This result suggests that firms with more
coopetition experience can generate greater innovation performance in coopetition in terms of
technology competition and type strength than firms with less coopetition experience. However,
coopetition experience does not affect the relationship between coopetition in other combinations and
innovation. There are two possible reasons for the weak support for the hypothesis. First, the main
effects of coopetition experience are strong, but the interaction effects are limited. Second,
coopetition experience partially overlapped with Tie_coop (correlations are 0.1975) because repeated
ties include pre-sample coopetitions with the same partner. Therefore, interaction effects are limited.
In the following section, I report the results of the qualitative case study research that addresses some
limitations of the study of coopetition capabilities and helps to provide illustrative support insights.
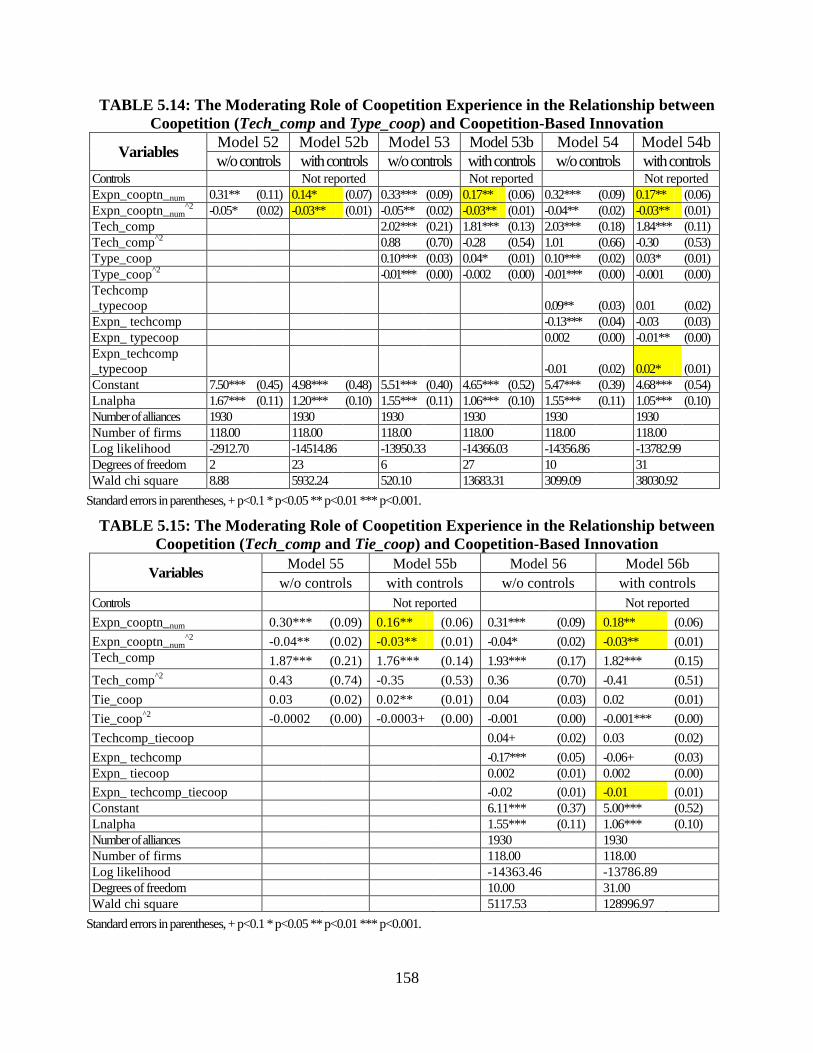
158
TABLE 5.14: The Moderating Role of Coopetition Experience in the Relationship between
Coopetition (Tech_comp and Type_coop) and Coopetition-Based Innovation
Variables Model 52 Model 52b Model 53 Model 53b Model 54 Model 54b
w/o controls with controls w/o controls with controls w/o controls with controls Controls
Not reported
Not reported
Not reported
Expn_cooptn_num 0.31** (0.11) 0.14* (0.07) 0.33*** (0.09) 0.17** (0.06) 0.32*** (0.09) 0.17** (0.06)
Expn_cooptn_num^2
-0.05* (0.02) -0.03** (0.01) -0.05** (0.02) -0.03** (0.01) -0.04** (0.02) -0.03** (0.01)
Tech_comp
2.02*** (0.21) 1.81*** (0.13) 2.03*** (0.18) 1.84*** (0.11)
Tech_comp^2
0.88 (0.70) -0.28 (0.54) 1.01 (0.66) -0.30 (0.53)
Type_coop
0.10*** (0.03) 0.04* (0.01) 0.10*** (0.02) 0.03* (0.01)
Type_coop^2
-0.01*** (0.00) -0.002 (0.00) -0.01*** (0.00) -0.001 (0.00)
Techcomp
_typecoop
0.09** (0.03) 0.01 (0.02)
Expn_ techcomp
-0.13*** (0.04) -0.03 (0.03)
Expn_ typecoop
0.002 (0.00) -0.01** (0.00)
Expn_techcomp
_typecoop
-0.01 (0.02) 0.02* (0.01)
Constant 7.50*** (0.45) 4.98*** (0.48) 5.51*** (0.40) 4.65*** (0.52) 5.47*** (0.39) 4.68*** (0.54)
Lnalpha 1.67*** (0.11) 1.20*** (0.10) 1.55*** (0.11) 1.06*** (0.10) 1.55*** (0.11) 1.05*** (0.10)
Number of alliances 1930
1930
1930
1930
1930
1930
Number of firms 118.00
118.00
118.00
118.00
118.00
118.00
Log likelihood -2912.70 -14514.86 -13950.33 -14366.03 -14356.86 -13782.99
Degrees of freedom 2
23
6
27
10
31
Wald chi square 8.88 5932.24 520.10 13683.31 3099.09 38030.92
Standard errors in parentheses, + p<0.1 * p<0.05 ** p<0.01 *** p<0.001.
TABLE 5.15: The Moderating Role of Coopetition Experience in the Relationship between
Coopetition (Tech_comp and Tie_coop) and Coopetition-Based Innovation
Variables Model 55 Model 55b Model 56 Model 56b
w/o controls with controls w/o controls with controls
Controls
Not reported
Not reported
Expn_cooptn_num 0.30*** (0.09) 0.16** (0.06) 0.31*** (0.09) 0.18** (0.06)
Expn_cooptn_num^2
-0.04** (0.02) -0.03** (0.01) -0.04* (0.02) -0.03** (0.01)
Tech_comp 1.87*** (0.21) 1.76*** (0.14) 1.93*** (0.17) 1.82*** (0.15)
Tech_comp^2
0.43 (0.74) -0.35 (0.53) 0.36 (0.70) -0.41 (0.51)
Tie_coop 0.03 (0.02) 0.02** (0.01) 0.04 (0.03) 0.02 (0.01)
Tie_coop^2
-0.0002 (0.00) -0.0003+ (0.00) -0.001 (0.00) -0.001*** (0.00)
Techcomp_tiecoop
0.04+ (0.02) 0.03 (0.02)
Expn_ techcomp
-0.17*** (0.05) -0.06+ (0.03)
Expn_ tiecoop
0.002 (0.01) 0.002 (0.00)
Expn_ techcomp_tiecoop
-0.02 (0.01) -0.01 (0.01)
Constant
6.11*** (0.37) 5.00*** (0.52)
Lnalpha
1.55*** (0.11) 1.06*** (0.10)
Number of alliances
1930
1930
Number of firms
118.00
118.00
Log likelihood
-14363.46 -13786.89
Degrees of freedom
10.00
31.00
Wald chi square
5117.53
128996.97
Standard errors in parentheses, + p<0.1 * p<0.05 ** p<0.01 *** p<0.001.
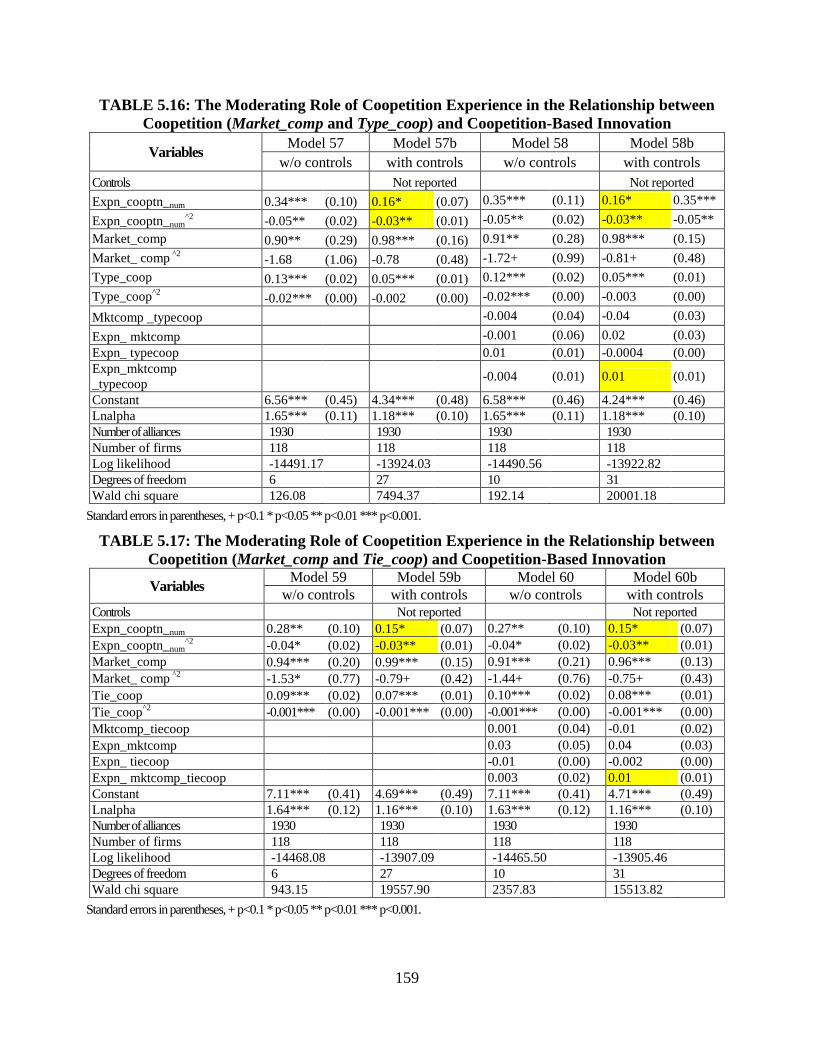
159
TABLE 5.16: The Moderating Role of Coopetition Experience in the Relationship between
Coopetition (Market_comp and Type_coop) and Coopetition-Based Innovation
Variables Model 57 Model 57b Model 58 Model 58b
w/o controls with controls w/o controls with controls
Controls
Not reported
Not reported
Expn_cooptn_num 0.34*** (0.10) 0.16* (0.07) 0.35*** (0.11) 0.16* 0.35***
Expn_cooptn_num^2
-0.05** (0.02) -0.03** (0.01) -0.05** (0.02) -0.03** -0.05**
Market_comp 0.90** (0.29) 0.98*** (0.16) 0.91** (0.28) 0.98*** (0.15)
Market_ comp ^2
-1.68 (1.06) -0.78 (0.48) -1.72+ (0.99) -0.81+ (0.48)
Type_coop 0.13*** (0.02) 0.05*** (0.01) 0.12*** (0.02) 0.05*** (0.01)
Type_coop^2
-0.02*** (0.00) -0.002 (0.00) -0.02*** (0.00) -0.003 (0.00)
Mktcomp _typecoop
-0.004 (0.04) -0.04 (0.03)
Expn_ mktcomp
-0.001 (0.06) 0.02 (0.03)
Expn_ typecoop
0.01 (0.01) -0.0004 (0.00)
Expn_mktcomp
_typecoop
-0.004 (0.01) 0.01 (0.01)
Constant 6.56*** (0.45) 4.34*** (0.48) 6.58*** (0.46) 4.24*** (0.46)
Lnalpha 1.65*** (0.11) 1.18*** (0.10) 1.65*** (0.11) 1.18*** (0.10)
Number of alliances 1930
1930
1930
1930
Number of firms 118
118
118
118
Log likelihood -14491.17 -13924.03 -14490.56 -13922.82
Degrees of freedom 6
27
10
31
Wald chi square 126.08
7494.37
192.14
20001.18
Standard errors in parentheses, + p<0.1 * p<0.05 ** p<0.01 *** p<0.001.
TABLE 5.17: The Moderating Role of Coopetition Experience in the Relationship between
Coopetition (Market_comp and Tie_coop) and Coopetition-Based Innovation
Variables Model 59 Model 59b Model 60 Model 60b
w/o controls with controls w/o controls with controls
Controls
Not reported
Not reported
Expn_cooptn_num 0.28** (0.10) 0.15* (0.07) 0.27** (0.10) 0.15* (0.07)
Expn_cooptn_num^2
-0.04* (0.02) -0.03** (0.01) -0.04* (0.02) -0.03** (0.01)
Market_comp 0.94*** (0.20) 0.99*** (0.15) 0.91*** (0.21) 0.96*** (0.13)
Market_ comp ^2
-1.53* (0.77) -0.79+ (0.42) -1.44+ (0.76) -0.75+ (0.43)
Tie_coop 0.09*** (0.02) 0.07*** (0.01) 0.10*** (0.02) 0.08*** (0.01)
Tie_coop^2
-0.001*** (0.00) -0.001*** (0.00) -0.001*** (0.00) -0.001*** (0.00)
Mktcomp_tiecoop
0.001 (0.04) -0.01 (0.02)
Expn_mktcomp
0.03 (0.05) 0.04 (0.03)
Expn_ tiecoop
-0.01 (0.00) -0.002 (0.00)
Expn_ mktcomp_tiecoop
0.003 (0.02) 0.01 (0.01)
Constant 7.11*** (0.41) 4.69*** (0.49) 7.11*** (0.41) 4.71*** (0.49)
Lnalpha 1.64*** (0.12) 1.16*** (0.10) 1.63*** (0.12) 1.16*** (0.10)
Number of alliances 1930
1930
1930
1930
Number of firms 118
118
118
118
Log likelihood -14468.08 -13907.09 -14465.50 -13905.46
Degrees of freedom 6
27
10
31
Wald chi square 943.15
19557.90
2357.83
15513.82
Standard errors in parentheses, + p<0.1 * p<0.05 ** p<0.01 *** p<0.001.
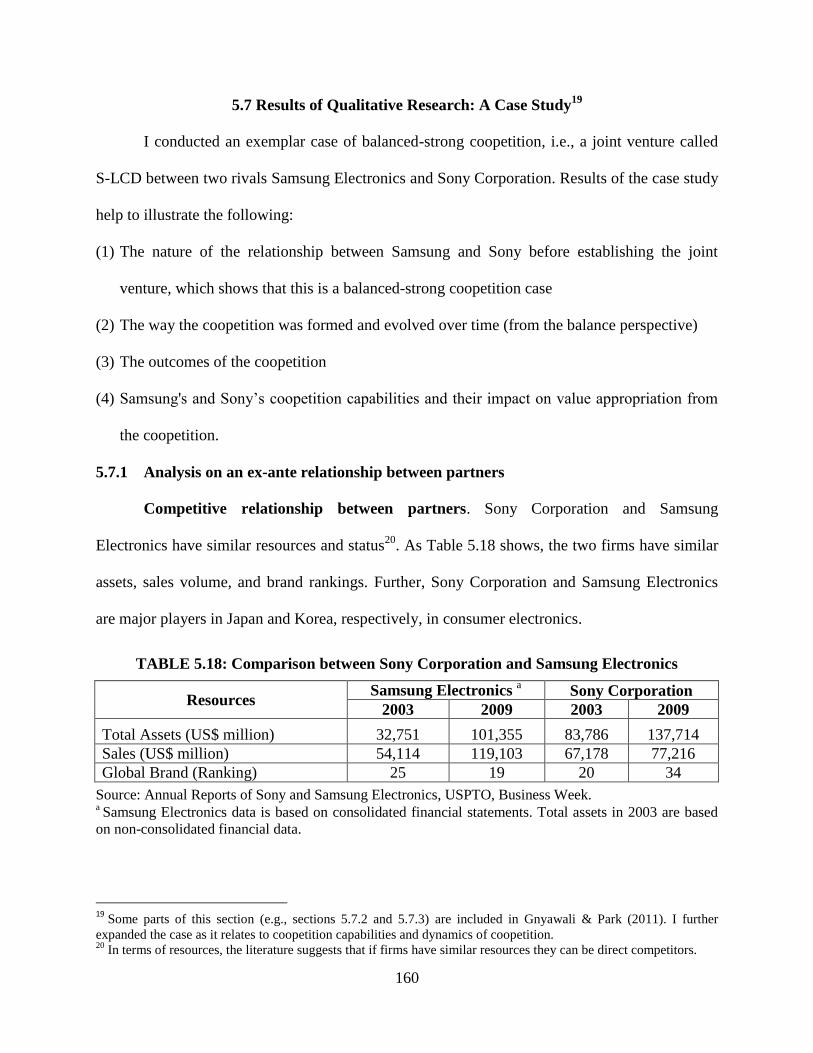
160
5.7 Results of Qualitative Research: A Case Study19
I conducted an exemplar case of balanced-strong coopetition, i.e., a joint venture called
S-LCD between two rivals Samsung Electronics and Sony Corporation. Results of the case study
help to illustrate the following:
(1) The nature of the relationship between Samsung and Sony before establishing the joint
venture, which shows that this is a balanced-strong coopetition case
(2) The way the coopetition was formed and evolved over time (from the balance perspective)
(3) The outcomes of the coopetition
(4) Samsung's and Sony‘s coopetition capabilities and their impact on value appropriation from
the coopetition.
5.7.1 Analysis on an ex-ante relationship between partners
Competitive relationship between partners. Sony Corporation and Samsung
Electronics have similar resources and status20
. As Table 5.18 shows, the two firms have similar
assets, sales volume, and brand rankings. Further, Sony Corporation and Samsung Electronics
are major players in Japan and Korea, respectively, in consumer electronics.
TABLE 5.18: Comparison between Sony Corporation and Samsung Electronics
Resources Samsung Electronics
a Sony Corporation
2003 2009 2003 2009
Total Assets (US$ million) 32,751 101,355 83,786 137,714
Sales (US$ million) 54,114 119,103 67,178 77,216
Global Brand (Ranking) 25 19 20 34
Source: Annual Reports of Sony and Samsung Electronics, USPTO, Business Week. a Samsung Electronics data is based on consolidated financial statements. Total assets in 2003 are based
on non-consolidated financial data.
19
Some parts of this section (e.g., sections 5.7.2 and 5.7.3) are included in Gnyawali & Park (2011). I further
expanded the case as it relates to coopetition capabilities and dynamics of coopetition. 20
In terms of resources, the literature suggests that if firms have similar resources they can be direct competitors.
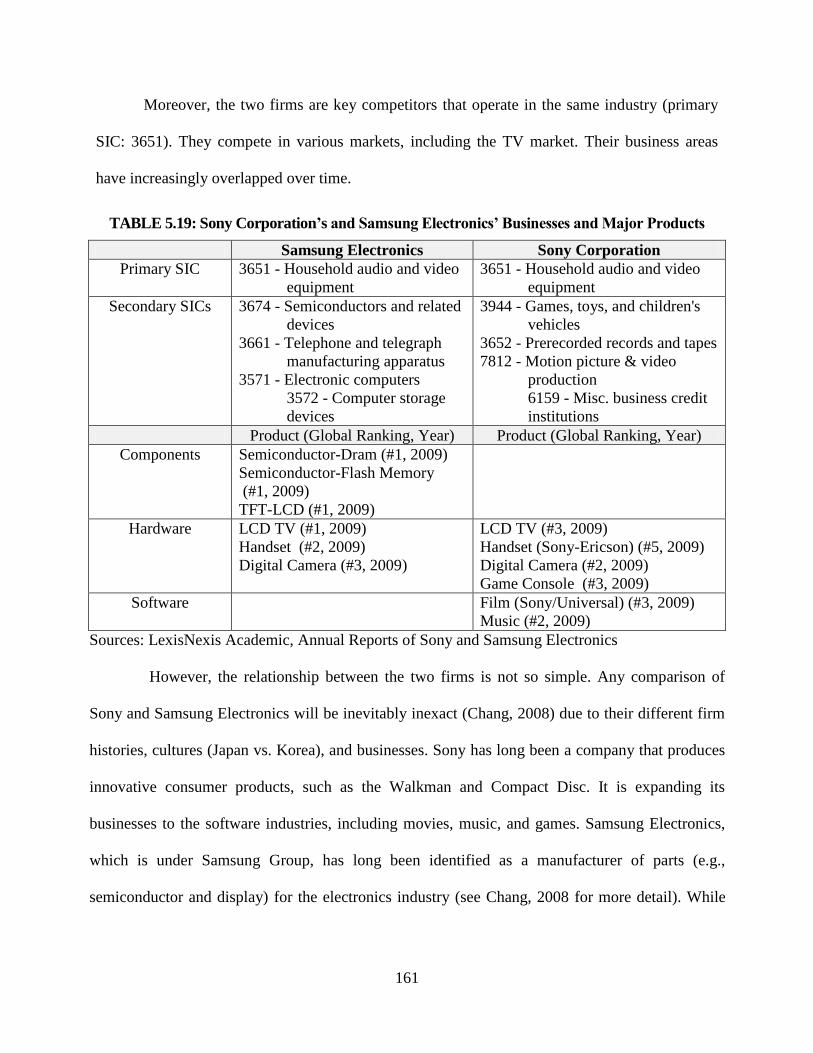
161
Moreover, the two firms are key competitors that operate in the same industry (primary
SIC: 3651). They compete in various markets, including the TV market. Their business areas
have increasingly overlapped over time.
TABLE 5.19: Sony Corporation’s and Samsung Electronics’ Businesses and Major Products
Samsung Electronics Sony Corporation
Primary SIC 3651 - Household audio and video
equipment
3651 - Household audio and video
equipment
Secondary SICs 3674 - Semiconductors and related
devices
3661 - Telephone and telegraph
manufacturing apparatus
3571 - Electronic computers
3572 - Computer storage
devices
3944 - Games, toys, and children's
vehicles
3652 - Prerecorded records and tapes
7812 - Motion picture & video
production
6159 - Misc. business credit
institutions
Product (Global Ranking, Year) Product (Global Ranking, Year)
Components Semiconductor-Dram (#1, 2009)
Semiconductor-Flash Memory
(#1, 2009)
TFT-LCD (#1, 2009)
Hardware LCD TV (#1, 2009)
Handset (#2, 2009)
Digital Camera (#3, 2009)
LCD TV (#3, 2009)
Handset (Sony-Ericson) (#5, 2009)
Digital Camera (#2, 2009)
Game Console (#3, 2009)
Software Film (Sony/Universal) (#3, 2009)
Music (#2, 2009)
Sources: LexisNexis Academic, Annual Reports of Sony and Samsung Electronics
However, the relationship between the two firms is not so simple. Any comparison of
Sony and Samsung Electronics will be inevitably inexact (Chang, 2008) due to their different firm
histories, cultures (Japan vs. Korea), and businesses. Sony has long been a company that produces
innovative consumer products, such as the Walkman and Compact Disc. It is expanding its
businesses to the software industries, including movies, music, and games. Samsung Electronics,
which is under Samsung Group, has long been identified as a manufacturer of parts (e.g.,
semiconductor and display) for the electronics industry (see Chang, 2008 for more detail). While
162
Samsung Electronics became a major electronics company by producing various consumer
products (ranked number one in the TV market and number two in the handset market), the
company is still very strong in component markets, ranking number two in the semiconductor
industry (following Intel) as the largest producer of DRAM and flesh memory. In 2006, as liquid
crystal display (LCD) became another key product area, Samsung created a separate division for
the LCD business. In sum, the two firms are direct competitors in the same industry (SIC 3651),
even though they have different strengths – Sony in software and Samsung in components
manufacturing.
Cooperative relationship between partners. Start of cooperative relationships occurred
through a buyer-supplier relationship between Samsung and Sony in the semiconductor industry.
In 2001, Samsung became a supplier of flash memory to Sony. In the same year, Sony
established a strategic alliance with Samsung in the memory stick business. The alliance was to
strengthen technical cooperation by developing and marketing electronic products centered on
Sony's memory stick technology. Samsung was to explore the use of Sony's memory sticks in its
various products, including DVD players, mobile phones, personal computers, and televisions.
Overall, however, the relationship between Samsung and Sony before the joint venture
was dominated by competition. Despite their fierce rivalry, the two firms established a joint
venture (called S-LCD) in April 2004 to develop and produce 7th
generation (motherglass size of
1 870 x 2 200mm) liquid crystal display (LCD) panels for flat screen TVs. The initial investment
was US$1 billion from each firm, and they tripled their investment and moved on to the 8th
generation technology within a few years. Samsung contributed its technological strengths in the
LCD technology while Sony contributed its technological strengths and brand recognition in
television.
163
5.7.2 Dynamics of Samsung-Sony coopeitition
I examined the dynamics of coopetition at two stages: the formation of coopetition and
the evolution of coopetition. I observed that the balanced perspective is critical at both stages.
The formation of coopetition. My analysis of the coopetition suggests that a strong
governance mode with balance and commitment of top management are important factors at the stage
of coopetition formation. First, the two rival firms took a strong governance mode with balance. For S-
LCD, the two rivals created an equity joint venture. Each party holds a 50 percent interest (Samsung
owns 50 percent plus one share) in the venture, with the CEO of the joint venture coming from
Samsung and the CFO from Sony. Therefore, the two firms have a strong governance mode with equal
ownership and balanced influence over the joint venture. In terms of the type of alliance, the joint
venture manufactures amorphous TFT liquid crystal display (LCD) panels for televisions and
computers. The S-LCD originally produced seventh generation panels. In 2008, S-LCD extended to
eighth-generation LCD panels. Each firm purchases 50 percent of the LCD panels that S-LCD
produces. This is consistent with prior research in transaction cost economics that suggests that by
adopting an equity joint venture structure, the hazards of opportunism can be mitigated because
incentives are more closely aligned (Oxley, 1997; Oxley & Sampson, 2004; Sampson, 2004). Second,
top management from the two firms had close relationships and gave strong commitments to the joint
venture. For example, owing to a request from Sony, Mr. Jae-Yong Lee, the current president of
Samsung Electronics and the eldest son of the Samsung group chairman, became a member of the
board of directors of S-LCD. As Samsung possesses both LCD and PDP technologies, Sony wanted to
a strong commitment to S-LCD from Samsung‘s top management.
The evolution of coopetition. The coopetitive relationship has evolved over time in
response to changing environments. In Figure 5.10, I present areas of collaboration and
164
competition mainly through S-LCD and illustrate how coopetition evolved. The upper part of the
figure illustrates areas of competition and the lower part illustrates collaboration; moving from
left to right provides the evolution of coopetition from 2003 to 2010.
The S-LCD case clearly shows that, when the cooperation with competitors succeeds,
both firms become more direct competitors. Before the joint venture, Samsung and Sony were
not major players in the digital TV market. Sharp and Philips were ranked number one and two.
However, Sony became number one when it introduced Bravia LCD TV using panels produced
by S-LCD. And Samsung Electronics took the number one spot a year later with its Bordeaux
series. Samsung and Sony became first and second in the market for four years from 2006 to
2009. Second, the two firms developed new products, such as LED TV and 3D TV, and display
technologies, such as OLED, which are related to, but beyond, the alliance boundaries. Finally, in
February 2008, Sony announced a joint venture with Sharp Corporation, the third largest LCD
TV maker at that time, for tenth generation LCD panels. Through this LCD joint venture with
another competitor, Sony has reduced its dependence on Samsung, which increases the balance of
power between the two firms.
While continually competing with each other to be the industry leader, two partners can
increase their cooperation as well. Since the establishment of S-LCD in 2004, Samsung and Sony
have deepened their resource commitments to the venture. S-LCD started with seventh
generation LCD panel production in April 2005 and the production capacity increased from
60,000 to 100,000 panels per month through additional investments. Based on their tremendous
success with seventh generation technology, they invested in an eighth generation plant, which
produces LCD panels of 46‖ and larger. S-LCD started eighth generation production in August
2007 with a production capacity of 50,000 substrates per month. In June 2009, S-LCD launched
165
a second eighth generation line with a production capacity of 70,000 substrates per month.
Further, the two firms developed additional cooperative relationships beyond S-LCD. In
November 2004, they reached a cross-licensing agreement that applied to over 20,000 patents,
which facilitated knowledge sharing and product development. In the agreement, balance was
critical. That is, they cross-licensed almost equal number of patents (11,000 patents from
Samsung and 13,000 patents from Sony). Further, they balanced competition and cooperation,
while facilitating a knowledge sharing approach that also protected their core knowledge. While
facilitating knowledge sharing by cross-licensing, the two firms tried to maintain the uniqueness
of each company and promoted healthy competition in the market. So-called ―Differentiated
Technology Patents,‖ such as Sony‘s PlayStation architecture and Samsung‘s home networking
technology, are excluded from the cross-licensing agreement. The agreement also does not apply
to TFT-LCD and OLED display patents. In addition, the Sony group, including Samsung, won
the DVD battle with its Blu-ray technology prevailing over the Toshiba group‘s HD-DVD. As a
result, the two firms created multiple linkages during that period.
In sum, in the dynamics of coopetition, balance appears to be critical for the success of
coopetition. At the formation of coopetition stage, two rivals can balance their influence and
contributions to the joint venture through the governance mode (50:50 equity shares). At the
evolution of the coopetition, coopetition may increase both competition and cooperation. When
coopetition succeeds, partners become more direct competitors. Further, their competitive goals
conflict because both firms are aiming for market leadership. Naturally, competitive tension was
severe. From the balance perspective, for coopetition success, such increased competition should
be balanced with increased cooperation. Partners can deepen their interdependence by finding
additional opportunities to increase cooperation in other areas.
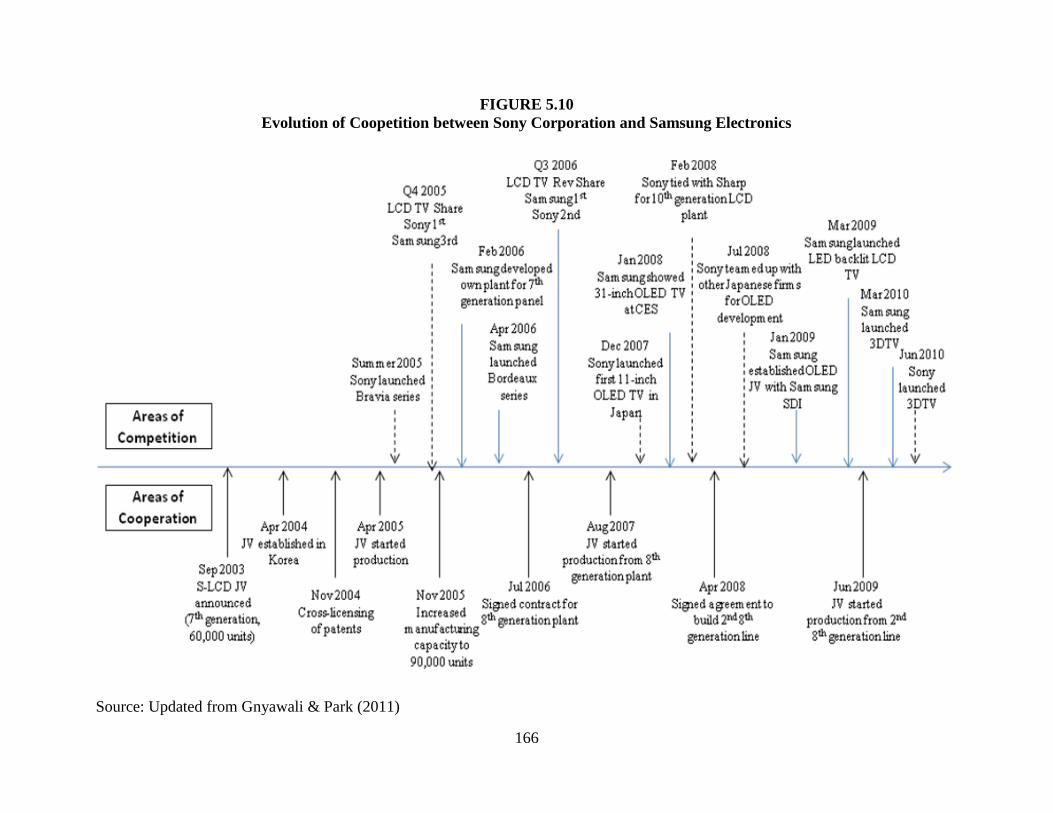
166
FIGURE 5.10
Evolution of Coopetition between Sony Corporation and Samsung Electronics
Source: Updated from Gnyawali & Park (2011)
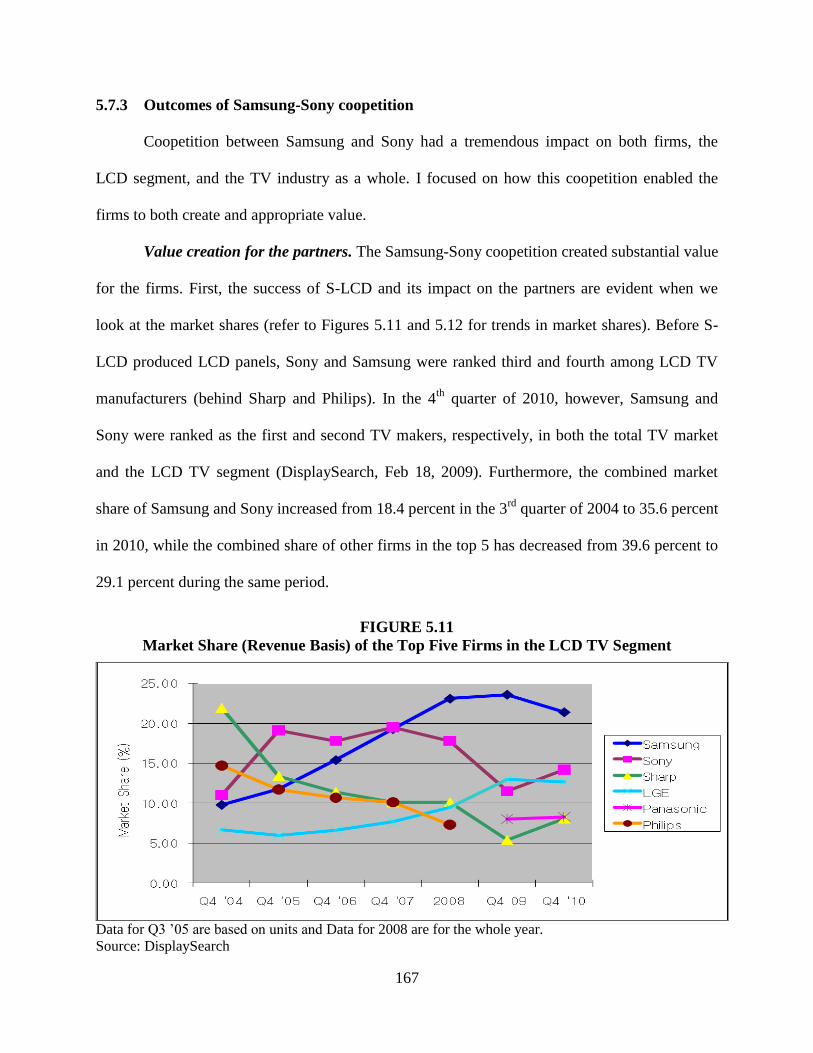
167
5.7.3 Outcomes of Samsung-Sony coopetition
Coopetition between Samsung and Sony had a tremendous impact on both firms, the
LCD segment, and the TV industry as a whole. I focused on how this coopetition enabled the
firms to both create and appropriate value.
Value creation for the partners. The Samsung-Sony coopetition created substantial value
for the firms. First, the success of S-LCD and its impact on the partners are evident when we
look at the market shares (refer to Figures 5.11 and 5.12 for trends in market shares). Before S-
LCD produced LCD panels, Sony and Samsung were ranked third and fourth among LCD TV
manufacturers (behind Sharp and Philips). In the 4th
quarter of 2010, however, Samsung and
Sony were ranked as the first and second TV makers, respectively, in both the total TV market
and the LCD TV segment (DisplaySearch, Feb 18, 2009). Furthermore, the combined market
share of Samsung and Sony increased from 18.4 percent in the 3rd
quarter of 2004 to 35.6 percent
in 2010, while the combined share of other firms in the top 5 has decreased from 39.6 percent to
29.1 percent during the same period.
FIGURE 5.11
Market Share (Revenue Basis) of the Top Five Firms in the LCD TV Segment
Data for Q3 ‘05 are based on units and Data for 2008 are for the whole year.
Source: DisplaySearch
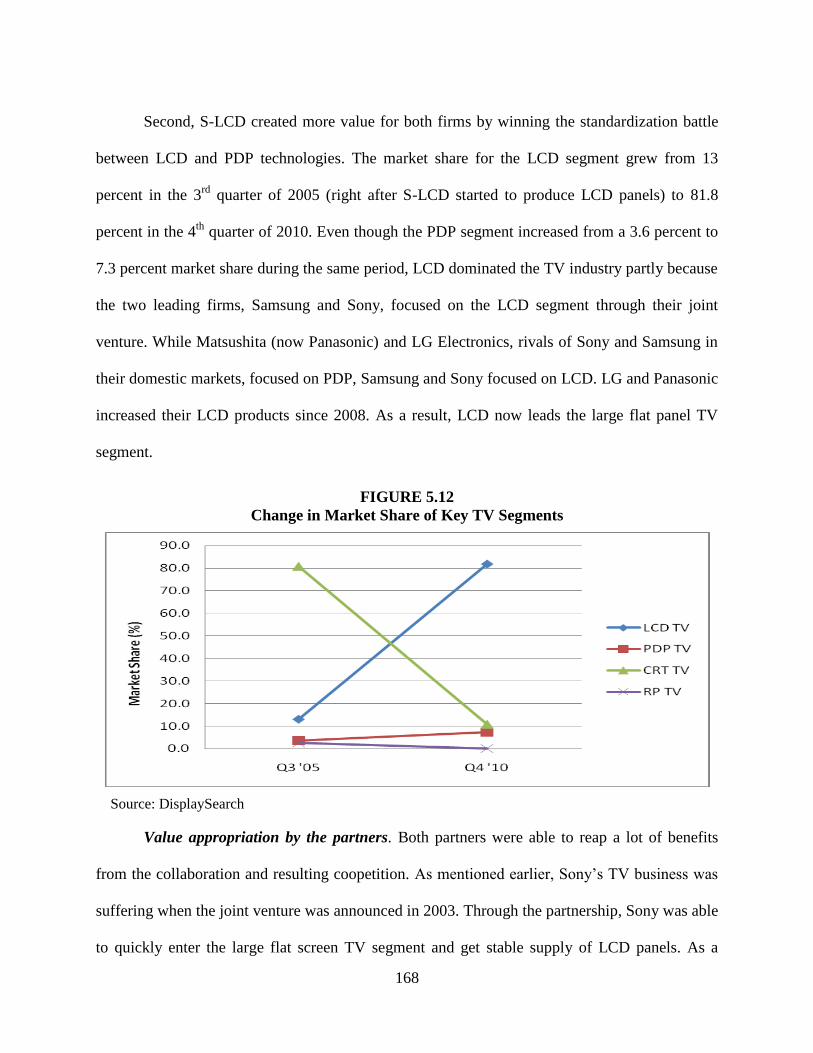
168
Second, S-LCD created more value for both firms by winning the standardization battle
between LCD and PDP technologies. The market share for the LCD segment grew from 13
percent in the 3rd
quarter of 2005 (right after S-LCD started to produce LCD panels) to 81.8
percent in the 4th
quarter of 2010. Even though the PDP segment increased from a 3.6 percent to
7.3 percent market share during the same period, LCD dominated the TV industry partly because
the two leading firms, Samsung and Sony, focused on the LCD segment through their joint
venture. While Matsushita (now Panasonic) and LG Electronics, rivals of Sony and Samsung in
their domestic markets, focused on PDP, Samsung and Sony focused on LCD. LG and Panasonic
increased their LCD products since 2008. As a result, LCD now leads the large flat panel TV
segment.
FIGURE 5.12
Change in Market Share of Key TV Segments
Source: DisplaySearch
Value appropriation by the partners. Both partners were able to reap a lot of benefits
from the collaboration and resulting coopetition. As mentioned earlier, Sony‘s TV business was
suffering when the joint venture was announced in 2003. Through the partnership, Sony was able
to quickly enter the large flat screen TV segment and get stable supply of LCD panels. As a
169
result, it was able to launch the Bravia model in a very short time. Because of Sony‘s brand name
and expertise on TV, Bravia became an instant hit and Sony unseated Sharp from its top market
position in LCD TV sales (refer to Figure 5.11). Thus, while Sony was experiencing deep
problems in the flat screen TV market, the joint venture with a capable competitor enabled Sony
to quickly catch-up with market trends.
Samsung seems to have appropriated even greater value from S-LCD. Samsung has set
the technological standards in the industry by leveraging its internal technological strengths and
technological and market leadership gained through the partnership with Sony. Samsung took the
lead in the large sized LCD panel segment and gained a favorable position in the battle over
technical standards. Since 2006, Samsung has been the leading company in the total TV market
as well as the LCD segment, while Sony has been ranked second. Samsung is the largest LCD
panel producer through its own plants in addition to the S-LCD plant. As a result, while Sony
received strong returns through focused investment in LCD within a short period of time,
Samsung became the largest TV maker and panel producer. It appears that firm-specific
knowledge and capabilities played an important role in value appropriation from coopetition,
which I discuss later.
5.7.4 The role of coopetition capabilities
In this section, I report how coopetition capabilities enable coopetition partners to
generate benefits and long-term success. I investigated coopetition capabilities from three
perspectives: 1) coopetition experience, 2) organizational structure – dedicated unit and
divisional autonomy, and 3) coopetition mindset.
Coopetition experience. From 1994 to 2003 (during the 10-year period before the joint
venture), Sony and Samsung have similar alliance experiences with 102 and 112 alliances,
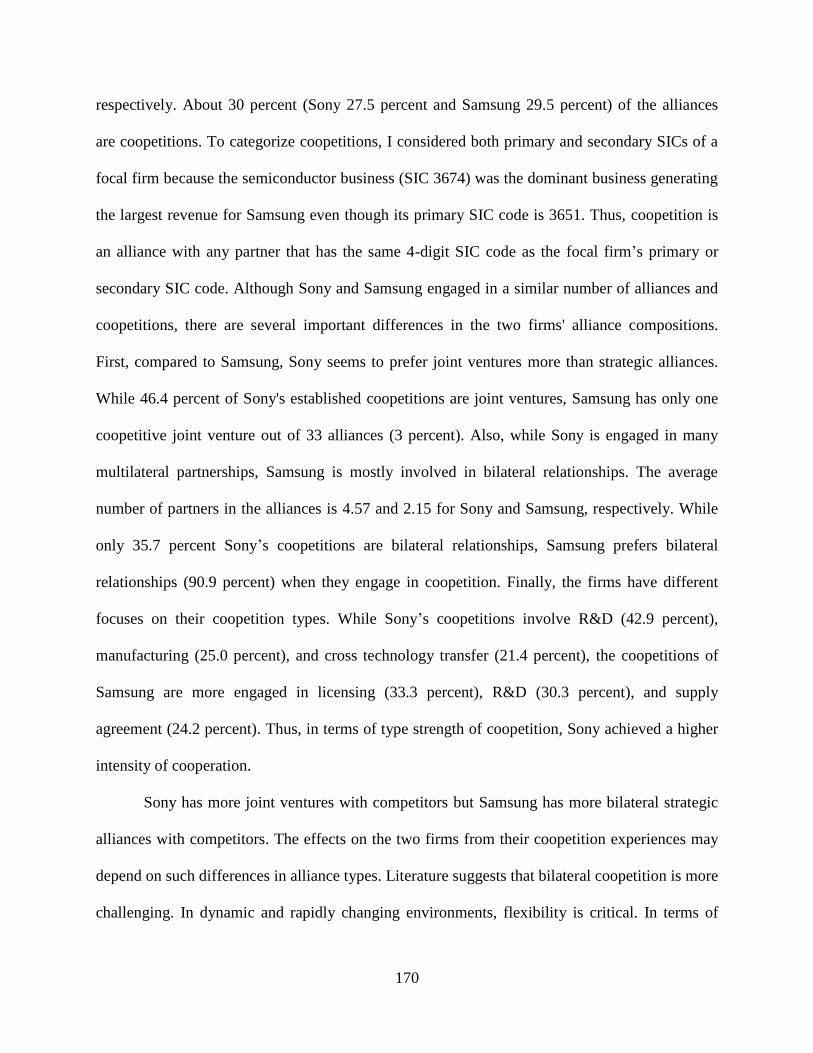
170
respectively. About 30 percent (Sony 27.5 percent and Samsung 29.5 percent) of the alliances
are coopetitions. To categorize coopetitions, I considered both primary and secondary SICs of a
focal firm because the semiconductor business (SIC 3674) was the dominant business generating
the largest revenue for Samsung even though its primary SIC code is 3651. Thus, coopetition is
an alliance with any partner that has the same 4-digit SIC code as the focal firm‘s primary or
secondary SIC code. Although Sony and Samsung engaged in a similar number of alliances and
coopetitions, there are several important differences in the two firms' alliance compositions.
First, compared to Samsung, Sony seems to prefer joint ventures more than strategic alliances.
While 46.4 percent of Sony's established coopetitions are joint ventures, Samsung has only one
coopetitive joint venture out of 33 alliances (3 percent). Also, while Sony is engaged in many
multilateral partnerships, Samsung is mostly involved in bilateral relationships. The average
number of partners in the alliances is 4.57 and 2.15 for Sony and Samsung, respectively. While
only 35.7 percent Sony‘s coopetitions are bilateral relationships, Samsung prefers bilateral
relationships (90.9 percent) when they engage in coopetition. Finally, the firms have different
focuses on their coopetition types. While Sony‘s coopetitions involve R&D (42.9 percent),
manufacturing (25.0 percent), and cross technology transfer (21.4 percent), the coopetitions of
Samsung are more engaged in licensing (33.3 percent), R&D (30.3 percent), and supply
agreement (24.2 percent). Thus, in terms of type strength of coopetition, Sony achieved a higher
intensity of cooperation.
Sony has more joint ventures with competitors but Samsung has more bilateral strategic
alliances with competitors. The effects on the two firms from their coopetition experiences may
depend on such differences in alliance types. Literature suggests that bilateral coopetition is more
challenging. In dynamic and rapidly changing environments, flexibility is critical. In terms of
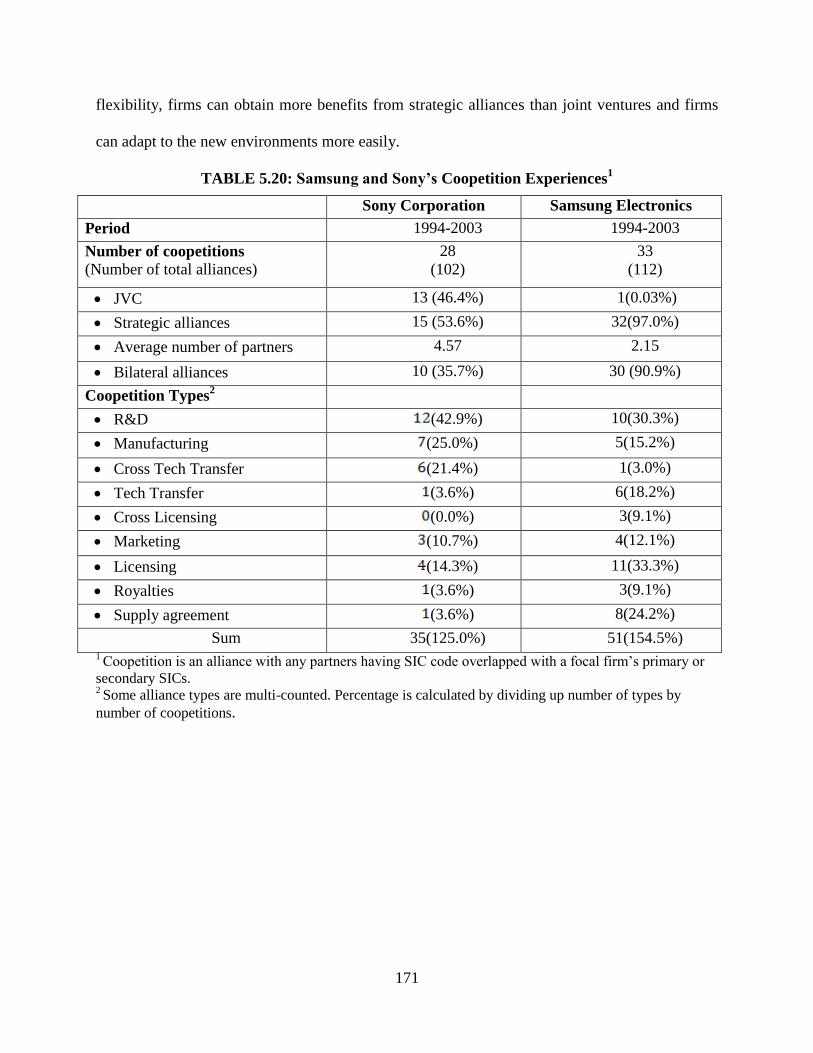
171
flexibility, firms can obtain more benefits from strategic alliances than joint ventures and firms
can adapt to the new environments more easily.
TABLE 5.20: Samsung and Sony’s Coopetition Experiences1
Sony Corporation Samsung Electronics
Period 1994-2003 1994-2003
Number of coopetitions
(Number of total alliances)
28
(102)
33
(112)
JVC 13 (46.4%) 1(0.03%)
Strategic alliances 15 (53.6%) 32(97.0%)
Average number of partners 4.57 2.15
Bilateral alliances 10 (35.7%) 30 (90.9%)
Coopetition Types2
R&D (42.9%) 10(30.3%)
Manufacturing (25.0%) 5(15.2%)
Cross Tech Transfer (21.4%) 1(3.0%)
Tech Transfer (3.6%) 6(18.2%)
Cross Licensing (0.0%) 3(9.1%)
Marketing (10.7%) 4(12.1%)
Licensing (14.3%) 11(33.3%)
Royalties (3.6%) 3(9.1%)
Supply agreement (3.6%) 8(24.2%)
Sum 35(125.0%) 51(154.5%) 1 Coopetition is an alliance with any partners having SIC code overlapped with a focal firm‘s primary or
secondary SICs. 2 Some alliance types are multi-counted. Percentage is calculated by dividing up number of types by
number of coopetitions.
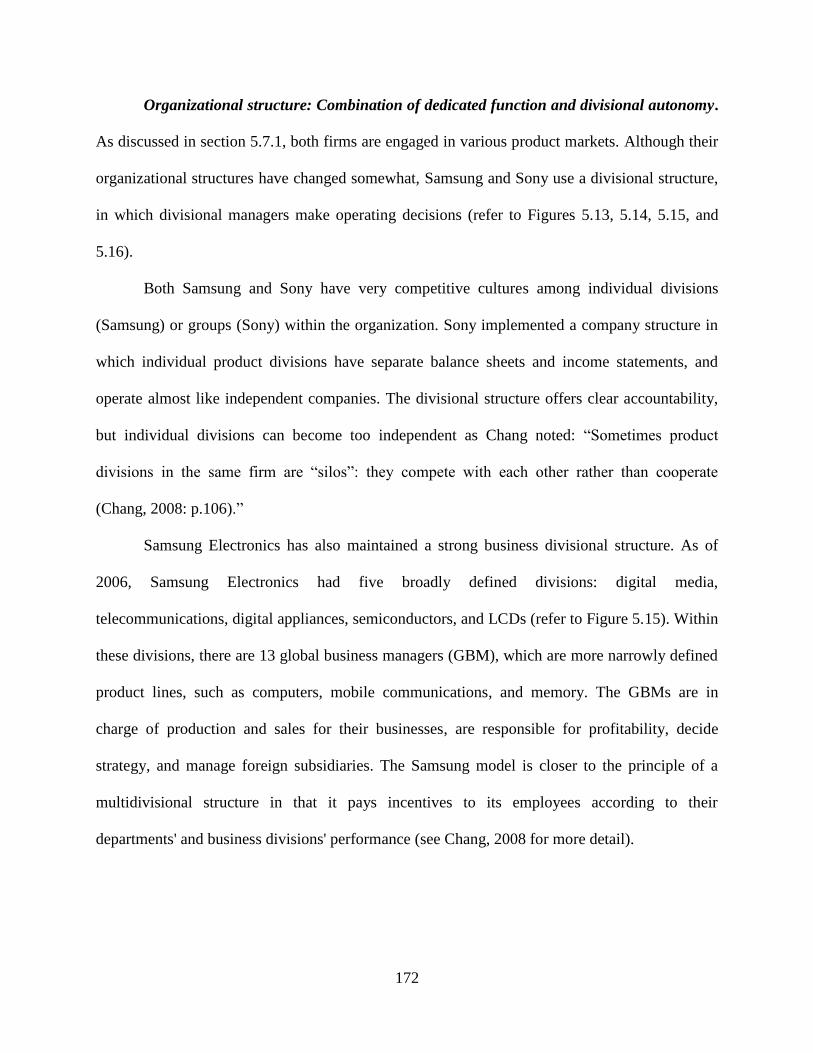
172
Organizational structure: Combination of dedicated function and divisional autonomy.
As discussed in section 5.7.1, both firms are engaged in various product markets. Although their
organizational structures have changed somewhat, Samsung and Sony use a divisional structure,
in which divisional managers make operating decisions (refer to Figures 5.13, 5.14, 5.15, and
5.16).
Both Samsung and Sony have very competitive cultures among individual divisions
(Samsung) or groups (Sony) within the organization. Sony implemented a company structure in
which individual product divisions have separate balance sheets and income statements, and
operate almost like independent companies. The divisional structure offers clear accountability,
but individual divisions can become too independent as Chang noted: ―Sometimes product
divisions in the same firm are ―silos‖: they compete with each other rather than cooperate
(Chang, 2008: p.106).‖
Samsung Electronics has also maintained a strong business divisional structure. As of
2006, Samsung Electronics had five broadly defined divisions: digital media,
telecommunications, digital appliances, semiconductors, and LCDs (refer to Figure 5.15). Within
these divisions, there are 13 global business managers (GBM), which are more narrowly defined
product lines, such as computers, mobile communications, and memory. The GBMs are in
charge of production and sales for their businesses, are responsible for profitability, decide
strategy, and manage foreign subsidiaries. The Samsung model is closer to the principle of a
multidivisional structure in that it pays incentives to its employees according to their
departments' and business divisions' performance (see Chang, 2008 for more detail).
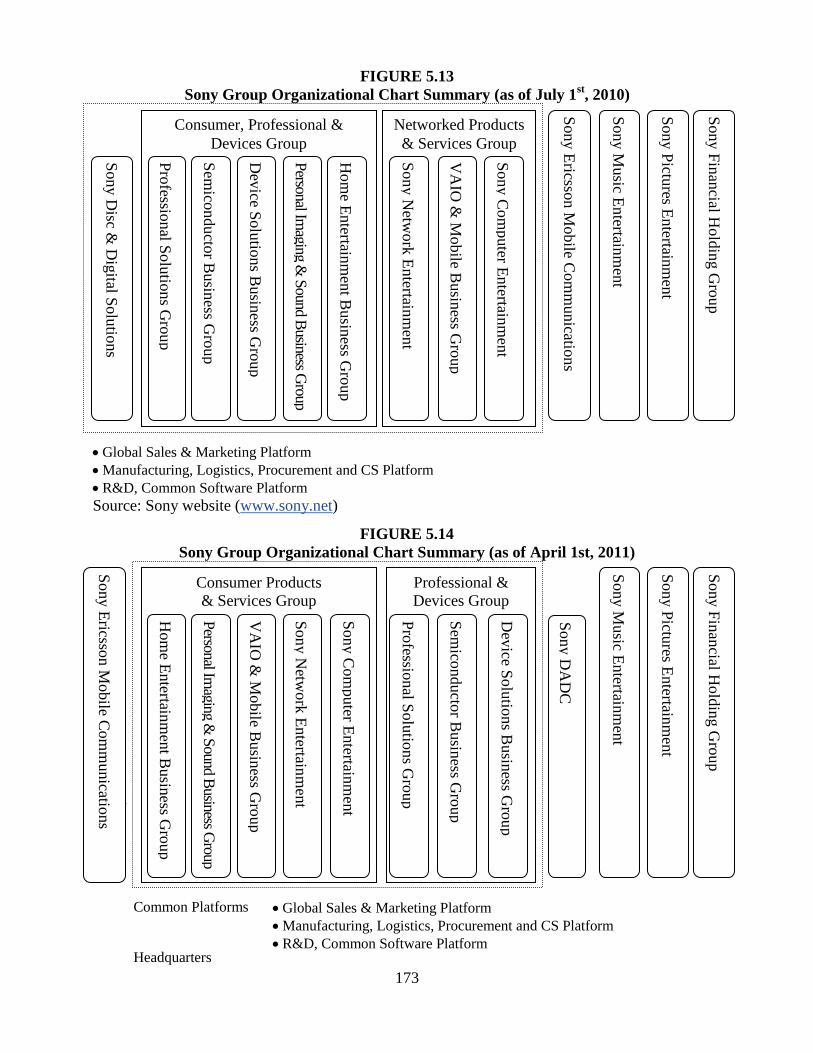
173
FIGURE 5.13
Sony Group Organizational Chart Summary (as of July 1st, 2010)
Common Platforms
Source: Sony website (www.sony.net)
FIGURE 5.14
Sony Group Organizational Chart Summary (as of April 1st, 2011)
Com
Common Platforms
Headquarters
Global Sales & Marketing Platform
Manufacturing, Logistics, Procurement and CS Platform
R&D, Common Software Platform
Consumer, Professional &
Devices Group
Sem
iconducto
r Busin
ess Gro
up
Sony D
isc & D
igital S
olu
tions
Networked Products
& Services Group
Dev
ice Solu
tions B
usin
ess Gro
up
Personal Im
aging & S
ound Business G
roup
Hom
e Entertain
men
t Busin
ess Gro
up
Pro
fessional S
olu
tions G
roup
Sony E
ricsson M
obile C
om
municatio
ns
Sony N
etwork
Entertain
men
t
VA
IO &
Mobile B
usin
ess Gro
up
Sony C
om
puter E
ntertain
men
t
Sony M
usic E
ntertain
men
t
Sony P
ictures E
ntertain
men
t
Sony F
inan
cial Hold
ing G
roup
Global Sales & Marketing Platform
Manufacturing, Logistics, Procurement and CS Platform
R&D, Common Software Platform
Source: Sony website (www.sony.net)
Consumer
& Services
Professional &
Devices Group
Consumer Products
& Services Group
Sem
icond
ucto
r Busin
ess Gro
up
Sony D
AD
C
Dev
ice Solu
tions B
usin
ess Gro
up
Personal Im
aging & S
ound Business G
roup
Hom
e Entertain
men
t Busin
ess Gro
up
Pro
fessional S
olu
tions G
roup
Sony E
ricsson M
obile C
om
municatio
ns
Sony N
etwork
Entertain
men
t
VA
IO &
Mobile B
usin
ess Gro
up
Sony C
om
puter E
ntertain
men
t
Sony M
usic E
ntertain
men
t
Sony P
ictures E
ntertain
men
t
Sony F
inan
cial Hold
ing G
roup
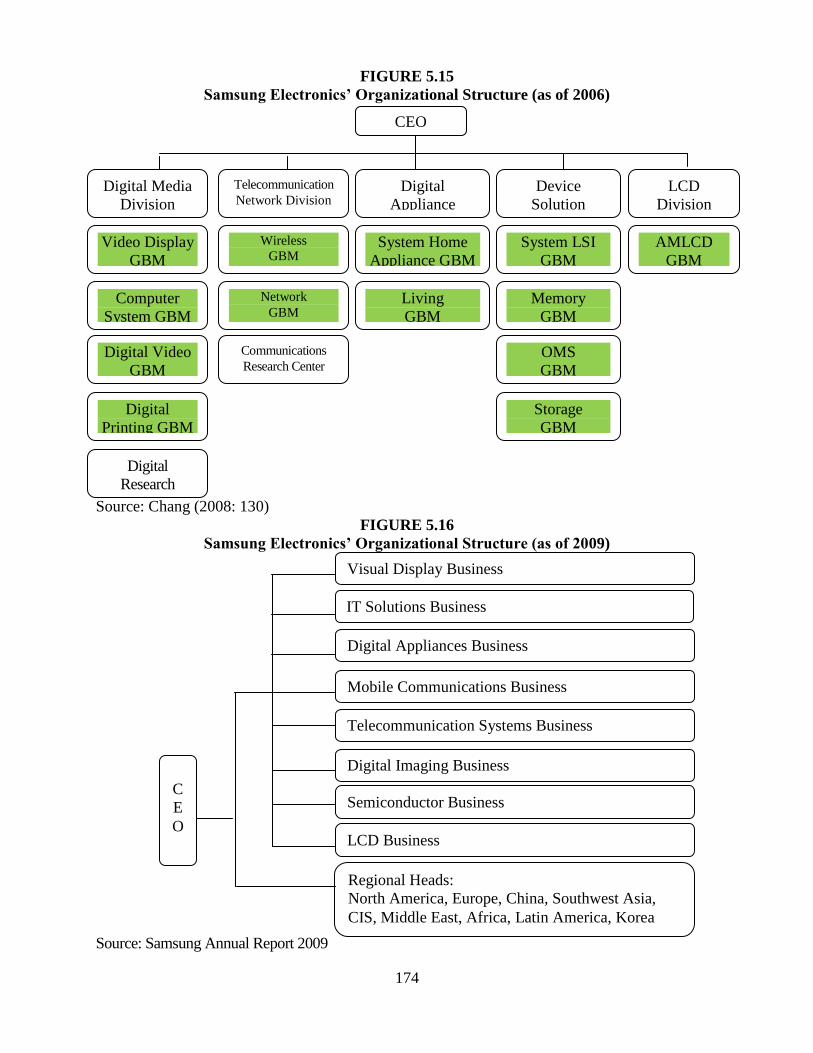
174
FIGURE 5.15
Samsung Electronics’ Organizational Structure (as of 2006)
Source: Chang (2008: 130)
FIGURE 5.16
Samsung Electronics’ Organizational Structure (as of 2009)
Source: Samsung Annual Report 2009
Visual Display Business
IT Solutions Business
Regional Heads:
North America, Europe, China, Southwest Asia,
CIS, Middle East, Africa, Latin America, Korea
Digital Appliances Business
Mobile Communications Business
Telecommunication Systems Business
Digital Imaging Business
Semiconductor Business
LCD Business
C
E
O
Digital Media
Division
LCD
Division
Telecommunication
Network Division Digital
Appliance
Division
Device
Solution
Division
Video Display
GBM
Computer
System GBM
Digital Video
GBM
Digital
Printing GBM
Wireless
GBM
Network
GBM
System Home
Appliance GBM
Living
GBM
System LSI
GBM
Memory
GBM
OMS
GBM
Storage
GBM
AMLCD
GBM
Digital
Research
Center
Communications
Research Center
CEO
175
In short, the two firms have similar organizational structures (multi-divisional structure)
where individual divisions or groups have a lot of autonomy that allows them to operate like
independent companies. Therefore, inter-unit competition is severe. The natural question, then, is
what are the differences between the two firms? A significant difference in the organizational
structures is Samsung‘s unique business composition. As Figure 5.15 shows, Samsung
Electronics has an organizational structure that is divided into set divisions (digital media,
telecommunications, and digital appliances) and part divisions (semiconductors and LCDs).
Although the firm changed its organizational structure in 2009, the businesses of Samsung
Electronics were composed of set businesses and component businesses during most research
periods. Further, ―Samsung‘s different businesses, such as semiconductor, mobile
communication, and LCD, compete with each other to demonstrate their units‘ achievements
(Chang, 2008, p.133).‖ When Samsung‘s digital media division purchases LCD panel from S-
LCD, they engage in price negotiate just like they do with external firms. Figure 5.17 shows how
S-LCD is simultaneously competing and cooperating with different divisions of Samsung.
Samsung‘s relationship with S-LCD is complicated. Samsung Electronics‘ LCD division has its
own facilities and the digital media division produces both LCD TV and PDP TV. Thus,
Samsung purchases LCD panels from not only S-LCD but also from its own LCD division. Also,
the digital media division purchases PDP panels from Samsung SDI, an affiliate of the Samsung
Group and the second largest PDP producer (following Panasonic). As a result, competition
between units of Samsung Electronics (or broadly the Samsung Group) facilitates technological
development and Samsung Electronics (i.e., digital media division) can provide wide range of
products.
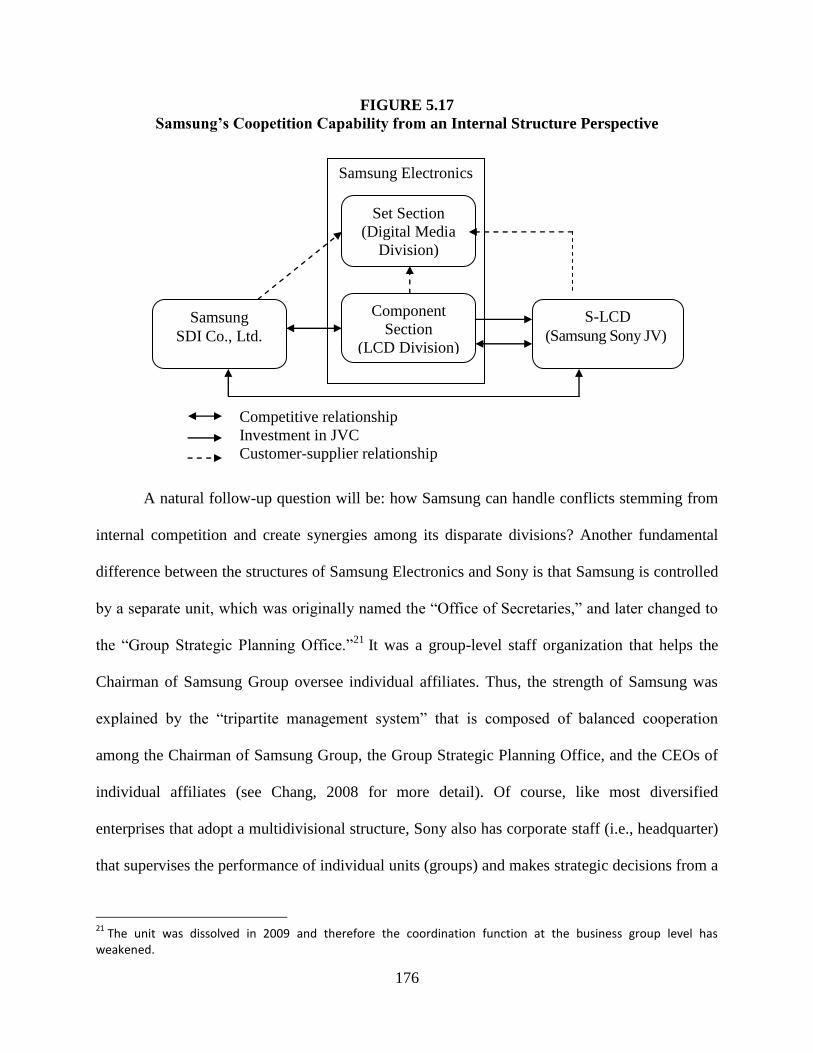
176
FIGURE 5.17
Samsung’s Coopetition Capability from an Internal Structure Perspective
Competitive relationship
Investment in JVC
Customer-supplier relationship
A natural follow-up question will be: how Samsung can handle conflicts stemming from
internal competition and create synergies among its disparate divisions? Another fundamental
difference between the structures of Samsung Electronics and Sony is that Samsung is controlled
by a separate unit, which was originally named the ―Office of Secretaries,‖ and later changed to
the ―Group Strategic Planning Office.‖21
It was a group-level staff organization that helps the
Chairman of Samsung Group oversee individual affiliates. Thus, the strength of Samsung was
explained by the ―tripartite management system‖ that is composed of balanced cooperation
among the Chairman of Samsung Group, the Group Strategic Planning Office, and the CEOs of
individual affiliates (see Chang, 2008 for more detail). Of course, like most diversified
enterprises that adopt a multidivisional structure, Sony also has corporate staff (i.e., headquarter)
that supervises the performance of individual units (groups) and makes strategic decisions from a
21
The unit was dissolved in 2009 and therefore the coordination function at the business group level has weakened.
Samsung Electronics
Set Section
(Digital Media
Division)
Component
Section
(LCD Division)
S-LCD
(Samsung Sony JV)
Samsung
SDI Co., Ltd.
177
corporate perspective. However, ―Sony‘s headquarter has a minimal role and no power to induce
resource sharing and cooperation (Chang, 2008: 123).‖
In sum, Samsung seems to have a more desirable organizational structure for pursuing
coopetition. Through the divisional structure, individual divisions have clear accountability and
stay creative. The chairman of Samsung Group and his staff organization, a dedicated unit,
coordinate conflicts and make strategic decisions at the corporate or business group level.
Coopetition Mindset. A win-win approach of open-minded executives was critical to
success. Top management should oversee the big picture and search for new opportunities to
cooperate with partners. Top management of both firms shows an open minded approach
pursuing simultaneous cooperation and competition. Mr. Murayama says that, ―in consumer
electronics, it‘s hard to keep secrets long anyway, and being open with Samsung is key to
making the joint venture work. If we put up barriers, they‘ll close up too‖ (WSJ, 2006)22
. ―The
Sony-Samsung alliance is certainly a win-win,‖ declares Sang Wan Lee, president of Samsung‘s
LCD unit (BusinessWeek, 2006)23
.
Coopetition is full of conflicts. Role conflicts are especially serious obstacles to be
addressed. To deal with role conflicts, the mindset of both top management and middle level
managers is important to generate better performance. In terms of middle level managers‘ who
are affected by corporate culture, there are some differences between the two firms. First, from a
learning perspective, Samsung seems more active and progressive. As a late entrant to the
electronics industry as compared to other global firms, Samsung Electronics has tried to maintain
a willingness to learn from those firms. In contrast, Sony‘s past strengths and history of success
with in-house technological development may have somewhat hindered it, when compared to
22
http://buiznt.cob.calpoly.edu/cob/MGT/Pendergast/sp06/303/Sony-
Samsung%20Rivalry%20and%20Alliance.htm (accessed on April 23, 2011). 23
http://www.lifewhile.com/money/10420335/detail.html (accessed on April 23, 2011).
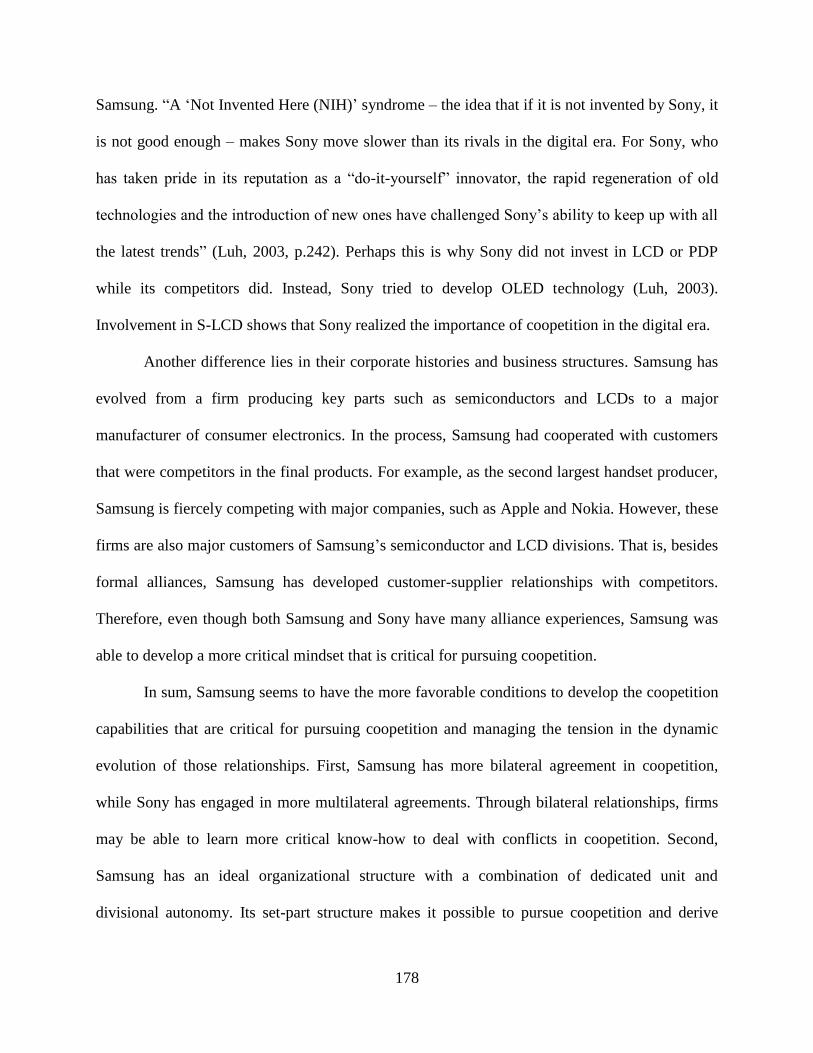
178
Samsung. ―A ‗Not Invented Here (NIH)‘ syndrome – the idea that if it is not invented by Sony, it
is not good enough – makes Sony move slower than its rivals in the digital era. For Sony, who
has taken pride in its reputation as a ―do-it-yourself‖ innovator, the rapid regeneration of old
technologies and the introduction of new ones have challenged Sony‘s ability to keep up with all
the latest trends‖ (Luh, 2003, p.242). Perhaps this is why Sony did not invest in LCD or PDP
while its competitors did. Instead, Sony tried to develop OLED technology (Luh, 2003).
Involvement in S-LCD shows that Sony realized the importance of coopetition in the digital era.
Another difference lies in their corporate histories and business structures. Samsung has
evolved from a firm producing key parts such as semiconductors and LCDs to a major
manufacturer of consumer electronics. In the process, Samsung had cooperated with customers
that were competitors in the final products. For example, as the second largest handset producer,
Samsung is fiercely competing with major companies, such as Apple and Nokia. However, these
firms are also major customers of Samsung‘s semiconductor and LCD divisions. That is, besides
formal alliances, Samsung has developed customer-supplier relationships with competitors.
Therefore, even though both Samsung and Sony have many alliance experiences, Samsung was
able to develop a more critical mindset that is critical for pursuing coopetition.
In sum, Samsung seems to have the more favorable conditions to develop the coopetition
capabilities that are critical for pursuing coopetition and managing the tension in the dynamic
evolution of those relationships. First, Samsung has more bilateral agreement in coopetition,
while Sony has engaged in more multilateral agreements. Through bilateral relationships, firms
may be able to learn more critical know-how to deal with conflicts in coopetition. Second,
Samsung has an ideal organizational structure with a combination of dedicated unit and
divisional autonomy. Its set-part structure makes it possible to pursue coopetition and derive
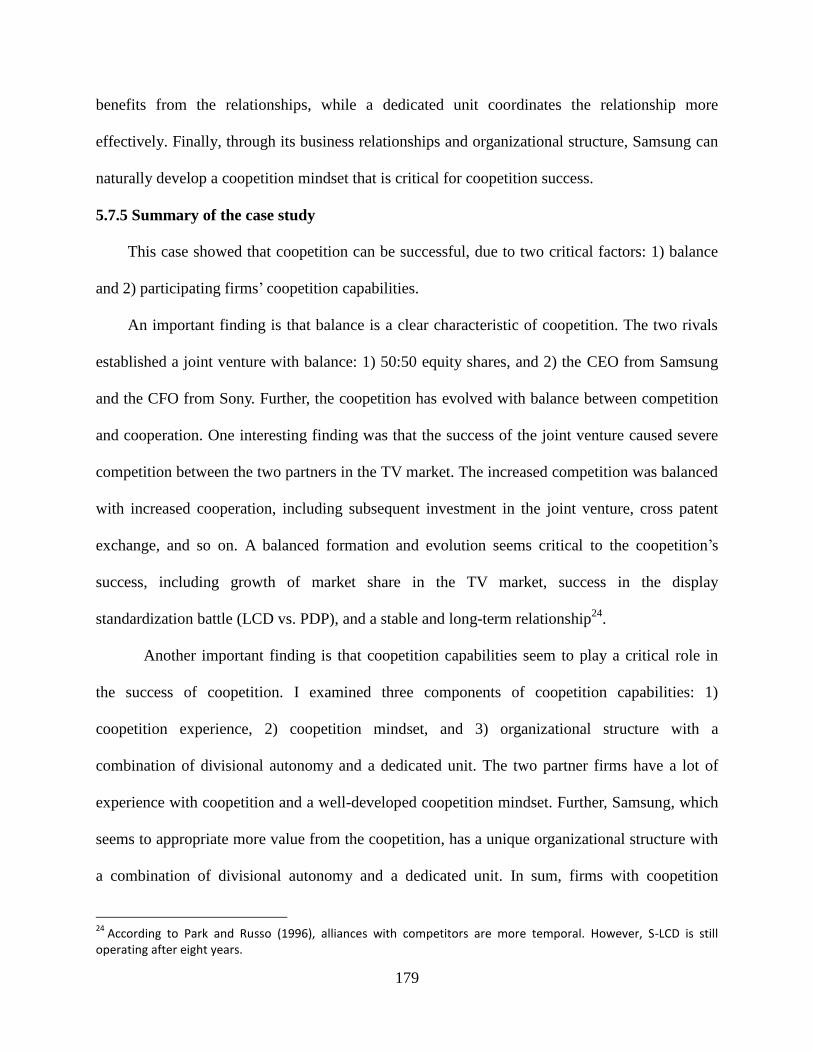
179
benefits from the relationships, while a dedicated unit coordinates the relationship more
effectively. Finally, through its business relationships and organizational structure, Samsung can
naturally develop a coopetition mindset that is critical for coopetition success.
5.7.5 Summary of the case study
This case showed that coopetition can be successful, due to two critical factors: 1) balance
and 2) participating firms‘ coopetition capabilities.
An important finding is that balance is a clear characteristic of coopetition. The two rivals
established a joint venture with balance: 1) 50:50 equity shares, and 2) the CEO from Samsung
and the CFO from Sony. Further, the coopetition has evolved with balance between competition
and cooperation. One interesting finding was that the success of the joint venture caused severe
competition between the two partners in the TV market. The increased competition was balanced
with increased cooperation, including subsequent investment in the joint venture, cross patent
exchange, and so on. A balanced formation and evolution seems critical to the coopetition‘s
success, including growth of market share in the TV market, success in the display
standardization battle (LCD vs. PDP), and a stable and long-term relationship24
.
Another important finding is that coopetition capabilities seem to play a critical role in
the success of coopetition. I examined three components of coopetition capabilities: 1)
coopetition experience, 2) coopetition mindset, and 3) organizational structure with a
combination of divisional autonomy and a dedicated unit. The two partner firms have a lot of
experience with coopetition and a well-developed coopetition mindset. Further, Samsung, which
seems to appropriate more value from the coopetition, has a unique organizational structure with
a combination of divisional autonomy and a dedicated unit. In sum, firms with coopetition
24
According to Park and Russo (1996), alliances with competitors are more temporal. However, S-LCD is still operating after eight years.
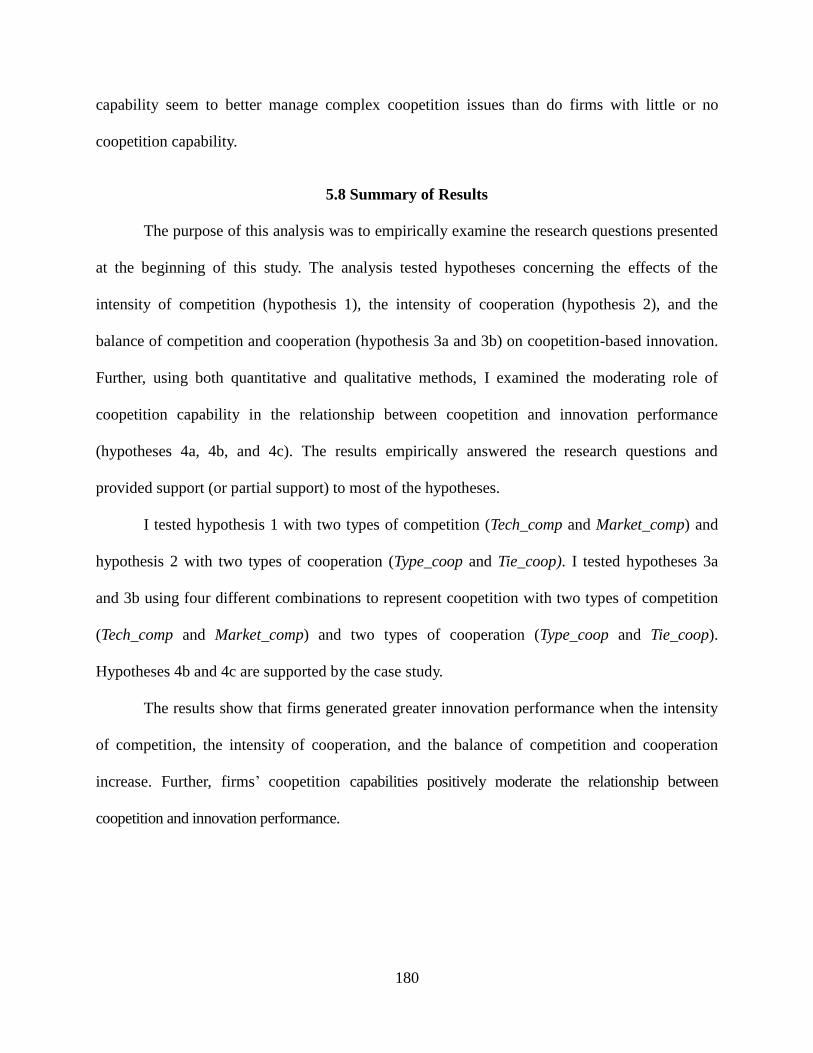
180
capability seem to better manage complex coopetition issues than do firms with little or no
coopetition capability.
5.8 Summary of Results
The purpose of this analysis was to empirically examine the research questions presented
at the beginning of this study. The analysis tested hypotheses concerning the effects of the
intensity of competition (hypothesis 1), the intensity of cooperation (hypothesis 2), and the
balance of competition and cooperation (hypothesis 3a and 3b) on coopetition-based innovation.
Further, using both quantitative and qualitative methods, I examined the moderating role of
coopetition capability in the relationship between coopetition and innovation performance
(hypotheses 4a, 4b, and 4c). The results empirically answered the research questions and
provided support (or partial support) to most of the hypotheses.
I tested hypothesis 1 with two types of competition (Tech_comp and Market_comp) and
hypothesis 2 with two types of cooperation (Type_coop and Tie_coop). I tested hypotheses 3a
and 3b using four different combinations to represent coopetition with two types of competition
(Tech_comp and Market_comp) and two types of cooperation (Type_coop and Tie_coop).
Hypotheses 4b and 4c are supported by the case study.
The results show that firms generated greater innovation performance when the intensity
of competition, the intensity of cooperation, and the balance of competition and cooperation
increase. Further, firms‘ coopetition capabilities positively moderate the relationship between
coopetition and innovation performance.
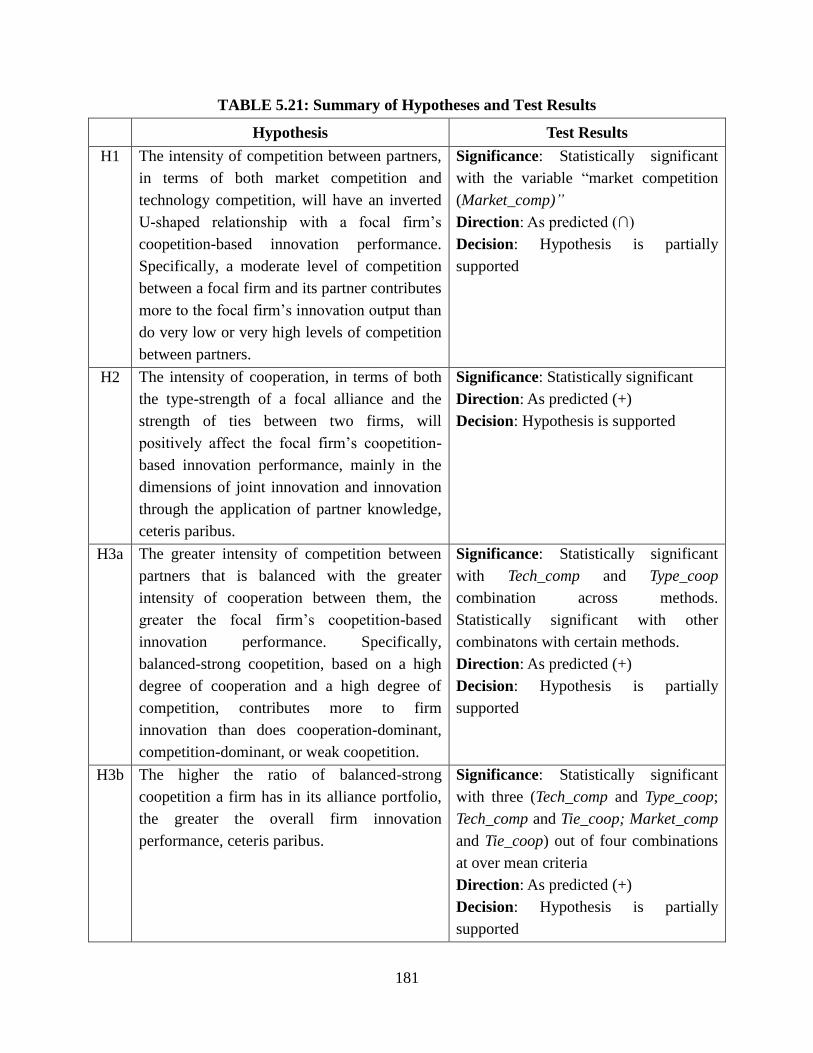
181
TABLE 5.21: Summary of Hypotheses and Test Results
Hypothesis Test Results
H1 The intensity of competition between partners,
in terms of both market competition and
technology competition, will have an inverted
U-shaped relationship with a focal firm‘s
coopetition-based innovation performance.
Specifically, a moderate level of competition
between a focal firm and its partner contributes
more to the focal firm‘s innovation output than
do very low or very high levels of competition
between partners.
Significance: Statistically significant
with the variable ―market competition
(Market_comp)”
Direction: As predicted (∩)
Decision: Hypothesis is partially
supported
H2 The intensity of cooperation, in terms of both
the type-strength of a focal alliance and the
strength of ties between two firms, will
positively affect the focal firm‘s coopetition-
based innovation performance, mainly in the
dimensions of joint innovation and innovation
through the application of partner knowledge,
ceteris paribus.
Significance: Statistically significant
Direction: As predicted (+)
Decision: Hypothesis is supported
H3a The greater intensity of competition between
partners that is balanced with the greater
intensity of cooperation between them, the
greater the focal firm‘s coopetition-based
innovation performance. Specifically,
balanced-strong coopetition, based on a high
degree of cooperation and a high degree of
competition, contributes more to firm
innovation than does cooperation-dominant,
competition-dominant, or weak coopetition.
Significance: Statistically significant
with Tech_comp and Type_coop
combination across methods.
Statistically significant with other
combinatons with certain methods.
Direction: As predicted (+)
Decision: Hypothesis is partially
supported
H3b The higher the ratio of balanced-strong
coopetition a firm has in its alliance portfolio,
the greater the overall firm innovation
performance, ceteris paribus.
Significance: Statistically significant
with three (Tech_comp and Type_coop;
Tech_comp and Tie_coop; Market_comp
and Tie_coop) out of four combinations
at over mean criteria
Direction: As predicted (+)
Decision: Hypothesis is partially
supported
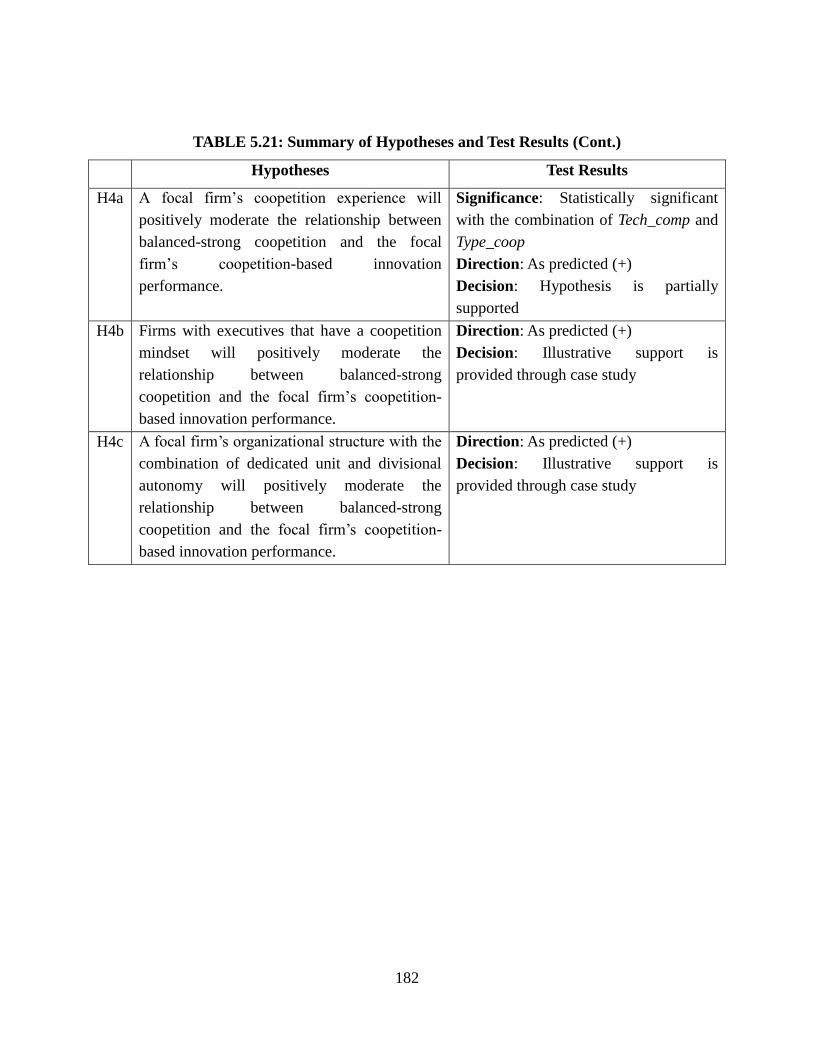
182
TABLE 5.21: Summary of Hypotheses and Test Results (Cont.)
Hypotheses Test Results
H4a A focal firm‘s coopetition experience will
positively moderate the relationship between
balanced-strong coopetition and the focal
firm‘s coopetition-based innovation
performance.
Significance: Statistically significant
with the combination of Tech_comp and
Type_coop
Direction: As predicted (+)
Decision: Hypothesis is partially
supported
H4b Firms with executives that have a coopetition
mindset will positively moderate the
relationship between balanced-strong
coopetition and the focal firm‘s coopetition-
based innovation performance.
Direction: As predicted (+)
Decision: Illustrative support is
provided through case study
H4c A focal firm‘s organizational structure with the
combination of dedicated unit and divisional
autonomy will positively moderate the
relationship between balanced-strong
coopetition and the focal firm‘s coopetition-
based innovation performance.
Direction: As predicted (+)
Decision: Illustrative support is
provided through case study
183
6. DISCUSSSION AND IMPLICATIONS
In this dissertation, I examined the following research questions: 1) to what extent does
coopetition impact firm innovation performance? and 2) to what extent does a firm‘s coopetition
capability influence the relationship between coopetition and firm innovation performance? A
review of the literature showed that firms have increasingly engaged in coopetition (Bengtsson &
Kock, 2000; Luo, 2007a). Coopetition is particularly important for innovation in high tech
industries (Dagnino & Rocco, 2009; Gnyawali et al., 2008) where firms confront challenges such
as short product life cycles, technological convergence, and massive R&D costs (Gnyawali &
Park, 2009). Scholars argue that coopetition is important to gain both cooperation benefits and
competition benefits (Lado et al., 1997; Bengtsson et al., 2010). Despite the practical importance
and increasing popularity of coopetition from the academic arena, research that has empirically
examined the effects of coopetition on innovation is limited (Yami et al., 2010) and has reported
inconsistent results. This underscored the need for a systematic examination of the effects of
coopetition on innovation.
In addressing the inconsistent findings of the relationship between coopetition and
innovation, this study attempted to shift the focus of discussion from whether coopetition is
beneficial for innovation to how, when, and to what extent firms can reap the benefits of
coopetition. To shift focus, I conceptualized coopetition with three aspects: 1) competition
between partners, 2) cooperation between partners, and 3) the interplay between the two. As
coopetition consists of the simultaneous pursuit of competition and cooperation, it is necessary to
investigate the two elements together in order to understand complex, deeper situations.
Although conceptual advancements have been made, empirical coopetition research has not
systematically investigated the two elements or the interplay between the two.
184
Further, I noted that, even though coopetition provides opportunities to gain benefits that
arise from both cooperation and competition, firms may not obtain all the benefits because
managing coopetition is very challenging and complex. In this regard, I paid attention to the two
possible factors to influence that potential innovation performance that firms can achieve from
coopetition relationships: 1) the balance between competition and cooperation and 2) the role of
a firm‘s coopetition capability.
First, this research demonstrated the importance of the balance between competition and
cooperation in coopetition. As scholars (e.g., Gnyawali, 2010) suggest that a deeper examination
of paradox is likely to develop a better understanding of coopetition, I noted that tension from
paradoxical factors, such as competition versus cooperation and knowledge sharing versus
knowledge protection, may play a critical role in coopetition-based innovation. In this regard,
some scholars (e.g., Chen, 2008; Das & Teng, 2000) suggest that firms should balance the
contradictory forces (i.e., competition and cooperation) to generate the most positive effects.
Building on the transparadox (Chen, 2008) and balancing strategy (Das & Teng, 2000)
perspectives, I suggested that coopetition tension may play a positive role (i.e., creative tension)
in innovation when competition and cooperation are balanced.
Second, this study provided evidence that coopetition capability is critical to manage
coopetition and generate greater performance. From the dynamic capability perspective, I note
that understanding the role of a firm‘s specific capability to manage coopetition, which I term as
―coopetition capability,‖ is critical to examine the effects of coopetition on innovation. That is,
the dynamic (Luo, 2007b) and paradoxical (Chen, 2008) nature of coopetition calls for
understanding the moderating role of a firm‘s coopetition capability in the relationship between
coopetition and innovation performance. A lack of proper capability to understand coopetition‘s
185
characteristics and manage paradoxical issues may lead to suboptimal performance. However,
empirical research has not systematically examined how firms develop capabilities to deal with
tension from such paradoxical phenomena and dynamic changes. I identified three important
components of coopetition capabilities: 1) coopetition experience, 2) coopeititon mindset, and 3)
organizational structure and then empirically examined them.
Based on the conceptual and methodological advancements, this study provided
empirical evidence regarding the effects of coopetition and coopetition capability on coopetition-
based innovation. First, it demonstrated that coopetition based on market competition
(Market_comp) has an inverted-U shape with innovation, while coopetition based on technology
competition (Tech_comp) has positive effects on innovation. Previous work based on market
competition from a categorical approach reported inconsistent results, i.e., positive, negative, or
no effects of coopetition on innovation. Using an ordinal scale, this study showed that
coopetition based on market competition has a non-linear relationship with innovation. Further, it
revealed that coopetition based on technology competition shows a different shape (positive
relationship with innovation) than coopetition based on market competition. Second, it showed
that, when competition and cooperation are considered together, the balance between
competition and cooperation generates greater innovation performance from coopetition than
does the unbalance between competition and cooperation. The optimal balance between
competition and cooperation seems to be high intensity of competition and high intensity
(Type_coop) or medium-high intensity (Tie_coop) of cooperation. Further, the case study
suggests that the balance is important not only at the formation of coopetition but also at the
evolution of coopetition. Finally, this study demonstrated the important role of coopetition
capability in the relationship between coopetition and innovation.
186
Through both the case study and the qualitatitive study, this research provided several
very significant findings that have important implications for research in coopetition, innovation,
competition, and cooperation, in general. In the section below, I discuss the major findings and
implications of my research. I also outline some limitations of the research and suggest
directions for future research.
6.1 Discussion of Research Findings
6.1.1 The role of competition between partners in innovation
The results showed that the relationship between market competition and coopetition-
based innovation is an inverted-U shape. However, the effects of technology competition
(Patent_simil) are positive and significant instead of being an inverted-U relationship. The results
imply that two different types of competition affect firm innovation differently, which explains two
countervailing arguments and empirical reports on the effects of competition between partners on
innovation performance in the literature. Chen (1996) suggested that market commonality and
resource similarity are key indicators of competitors. Building on Chen‘s (1996) argument, Park,
Gnyawali, & Srivastava (in press) suggest that two potentially countervailing forces will be at
work in coopetition. First, similarity increases the likelihood of scanning and monitoring external
resources, accessing and acquiring external resources, and leveraging these resources for
competitive advantage (Cohen & Levinthal, 1990; Lane & Lubatkin, 1998; Mowery et al., 1996).
Second, high similarity between the focal firm and its partners suggests that these firms are
competitors with each other, thereby increasing the competitive tension (Chen, Su, & Tsai, 2007)
and reducing the likelihood of the focal firm to access, acquire, and leverage knowledge from its
portfolio of alliances.
187
The results of this study suggested that two countervailing forces – learning potential and
competitive tension – play differently in market competition (Market_comp) and technology
competition (Tech_comp). From the market competition perspective, the two countervailing
forces play together. As the intensity of competition increases, the positive effects of learning
potential increase, but the negative effects of competitive tension on alliance performance
become dominant beyond a certain point. That is, when market commonality is high,
opportunism is likely to increase because knowledge gained from the partner through a
collaborative relationship can be used against the same partner in order to effectively compete in
the market (Gnyawali & Park, 2009). Firms also worry about unintended knowledge leakage.
This high competitive tension may cause a low level of knowledge sharing and a narrow scope of
cooperation and, in turn, result in a low level of innovation output.
From the technology competition perspective, however, it seems that the benefits of
learning potential from resource similarity outweigh the downside. The test results hypothesis 1
support the notion of relative absorptive capacity (Lane & Lubatkin, 1998). That is, the more
experience the firms have in solving similar types of problems, the easier it will be for the focal
firm to find ways to apply the newly assimilated knowledge (Lane & Lubatkin, 1998). Further, if
the focal firm and its partners have high technological overlap, they are more likely to be aware
of the value of a partner‘s knowledge and have a motivation to learn from them. The results can
be explained from another perspective. Scholars argue that a coopetitive relationship frequently
cooperates in upstream activities and compete in downstream activities (Bengtsson & Kock,
2000; Walley, 2007). As technology competition is more related to upstream activities, the results
might be affected by both competition and cooperation. Nonetheless, the results are different
from the arguments that the competitive tension and redundancies created from resource
188
similarity might inhibit firm innovation especially beyond a certain point. In this regard, I noted
that there was an overlap between measures of technology competition and one segment of the
dependent variable (i.e., coopetition-based innovation). Thus, the results should be interpreted
cautiously.
6.1.2 The role of cooperation between partners in innovation
The results showed that both the type strength of a focal coopetition (Type_coop) and the
strength of ties between two firms (Tie_coop) positively affect the focal firm‘s coopetition-based
innovation. That is, when Type_coop or Tie_coop is high, firms can generate greater innovation
performance through coopetition than when Type_coop or Tie_coop is low.
Transfer of tacit knowledge to solve complex problems may be the key in innovation in
technical collaboration. This study suggested that the high intensity of Type_coop may facilitate
innovation through the adaptation of practices, such as co-location (von Hippel, 1994) and
working together on a regular basis, which makes possible the transfer of knowledge (Heiman &
Nickerson, 2004) from both knowledge sharing (shared parts) and knowledge spillover (non-
shared parts) (Lavie, 2006). This study also suggested that strong ties (i.e., high intensity of
Tie_coop) at the dyadic level may facilitate innovation by reducing both motivational and
cognitive problems of knowledge transfer (Szulanski, 1996), serving as a trust-based governance
mechanism (Rowley et al., 2000), and facilitating reciprocity and long-term perspectives (Kogut,
1989; Uzzi, 1997).
Additional tests found that the effects of Tie_coop on innovation show an inverted-U
shape. The results suggest that Tie_coop (repeated ties and multiple linkages with the same partners)
may facilitate knowledge transfer, which may help innovation. However, beyond a certain point
(very high intensity of Tie_coop), the transferred knowledge from partners with many repeated and
189
multiple relationships may not be beneficial to innovation. The results can be explained from
multiple perspectives. First, the results suggest that the logic of structural embeddedness (i.e., the
position of a given organization in a broader network structure) (Uzzi, 1999), can be applied to
relational embeddedness (i.e., the dyadic relationships or ties between the actor and each of its
partners) (Gulati, 1998). Similar to the notion of ―overembeddedness‖ (Uzzi, 1999), tie strength
positively affects innovation performance. However, ties that are too strong (many relationships with
the same partners) may limit the number of new ideas that are critical for innovation or deter the
focal firm from changing to meet the demands of new environments. Second, the results can be
explained from a social capital perspective which suggests the role of social capital on knowledge (or
resource) transfer (Tsai, 2002; van Wijk, Jansen, & Lyles, 2008), but does not reveal whether
knowledge (or resource) transfer was beneficial to the organization (Maurer, Bartsch, & Ebers, 2011).
That is, social capital developed through Tie_coop (repeated ties and concurrent linkages) merely
provides opportunities for resource transfer but implies little about the extent to which resources are
actually used (Maurer et al., 2011). Finally, the results can be explained from the context perspective.
Daskalaki (2010) suggests that, in creative industries, balancing bonding and bridging of ties
leads to the formation of persistent yet flexible network boundaries and identities that are
constantly re-adjusted. Conguent with Daskalaki (2010), it is possible that, in the semiconductor
industry in which the environment is rapidly changing, firms may need a certain degree of tie
strength for knowledge transfer and a certain degree of flexibility (too high an intensity of Tie_coop
may hurt the flexibility) to adapt to new environment.
190
6.1.3 The role of balance between competition and cooperation in innovation at the dyadic level
One of the key conceptual arguments advanced in this dissertation is that the balance
between competition and cooperation enhances innovation performance. Using multiple
approaches, I examined the role of balance between competition and cooperation in innovation.
The polynomial regression analysis that I introduced in the coopetition literature provides
valuable information on the role of balance between competition and cooperation in innovation.
Surfaces based on polynomial regression clearly show that when the intensity of Tech_comp is
high, the innovation performance increases with an increase in the intensities of cooperation
(Type_coop or Tie_coop) (Figures 5.6 and 5.7). At the optimal points, the intensity of
competition in terms of both Tech_comp and Market_comp is high, while the intensity of
cooperation is high (Type_coop in Figure 5.6) or medium-high (over the mean value but not so
high) (Tie_coop in Figures 5.7 and 5.9). In short, polynomial regression analysis suggests that
the balance between competition and cooperation is important to generate greater coopetition-
based innovation. That is, the combination of high Tech_comp and high Type_coop generates the
greatest innovation performance. Based on negative binomial regression coefficients, however,
the optimal balance points are not symmetrical in the combination of competition and Tie_coop.
Rather they lean against competition (i.e., high competition and medium-high (over the mean but
not so high Tie_coop)).
Even though polynomial regression analysis has benefits in examining the interplay
between two elements (i.e., competition and cooperation) of coopetition, I employed another
approach – a dummy variable for balanced-strong coopetition because my primary focus was
whether a balanced-strong coopetition (high competition and high cooperation) could generate
greater innovation performance. The results were all positive and significant. That is, firms with

191
higher ratios of balanced-strong coopetition (i.e., high competition and high cooperation) in their
alliance portfolios generate greater innovation performance than firms with lower ratios of
balanced-strong coopetition do.
Further, the case study of S-LCD, an excellent example of balanced-strong coopetition,
extends the balance logic further. That is, the case study suggests that balance between
competition and cooperation is important even in the evolution stage of coopetition. The
Samsung-Sony joint venture shows that the success of coopetition may cause higher intensity of
competition between the two partners and the increased competition should be balanced with
increased cooperation in the evolution of the coopetition.
Overall, the balance between competition and cooperation positively influences
coopetition-based innovation performance. In terms of the combination between Tech_comp and
Type_coop, the balance positively affects coopetition-based innovation. In terms of competition
(Tech_comp or Market_comp) and Tie_coop, an optimal point of balance seems to be a high
intensity of competition and medium-high intensity of Tie_coop. When they cooperate with more
direct competitors, firms need stronger Tie_coop (higher than the mean value) to generate greater
innovation performance. However, a high intensity of Tie_coop (e.g., too many repeated ties
and/or concurrent multiple linkages) may hurt innovation.
6.1.4 The role of balanced-strong coopetition in innovation at the alliance portfolio
The concept of balance between competition and cooperation appears meaningful at the
alliance portfolio level. Results showed that the ratio of balanced-strong coopetition in an
alliance portfolio positively affects innovation performance with three out of four combinations
of competition and cooperation. Only the combination between Market_comp and Type_coop
was insignificant. Further, the effects of balanced-strong coopetition were significant only when
192
I used ‗over the mean value‘ as the criterion to categorize balanced-strong coopetition, while
using stronger level criteria (i.e., over mean + 0.5 standard deviation or over mean + 1 standard
deviation) generated insignificant results.
The results suggest that the balancing strategy is also important at the portfolio alliance
level. Consistent with dyadic level analysis, however, very high-level balance may reduce the
positive effects. This can be explained by the polynomial regression analysis discussed above.
That is, the optimal points (i.e., stationary points) in surfaces lie on the combination of high
competition and medium cooperation (over the mean value but not high). It is interesting to note
that the results at the portfolio level are consistent with the results of polynomial regression
analysis at the dyadic level.
6.1.5 The moderating role of cooperation capability in innovation
A key conceptual advancement in this dissertation is the moderating role of coopetition
capability in the relationship between coopetition and innovation performance. Through both
qualitative and quantitative approaches, I examined coopetition capability along the following
three elements: coopetition experience, coopetition mindset, and organizational structure.
The case study suggests that the coopetition mindset of top management and middle
managers is critical to generating greater performance from a coopetition relationship. As
coopetition is dynamic in nature (Luo, 2007b), the ratio between competition and cooperation
changes during the coopetition period. As S-LCD became successful, the two competitor
partners became more direct competitors. If only the intensity of competition between partners
increases while the intensity of cooperation is constant, it is not likely that the relationship can
continue. The literature reports that alliances with direct competitors are more temporal (Park &
Russo, 1996). I observed that the two partner firms made subsequent investments in S-LCD and
193
expanded their cooperative relationships while the success of S-LCD led to more competition
between them in the TV market. Thus, an increase in the intensity of competition was balanced
by an increase in the intensity of cooperation. In short, to generate greater innovation
performance in a coopetitive relationship, it is not enough to simply balance competition and
cooperation at the beginning of the alliance, but the firm must also have the capability to create
balance and manage that balance throughout the coopetition lifecycle. Literature suggests that
elements of a coopetition mental model might include recognizing the importance of coopetition,
scanning the environment for coopetition opportunities, and developing ways to effectively
engage in actual collaborative relationships with competitors (e.g., Gnyawali & Park, 2009).
Building on these ideas mentioned above, I suggested that a coopetition mindset includes
continuously seeking a win-win method with competitor-partners during the partnership period.
From the dynamic perspective, success in coopetition requires many capabilities, such as 1) to
coordinate conflicts within the firm and between partners, 2) to estimate the evolving costs and
benefits of coopetition, 3) to make necessary adjustments to the cooperation-competition ratio,
and 4) to maintain the bargaining power balance. In sum, seeing a bigger picture with a win-win
approach and balancing competition and cooperation in dynamic situations as well as
understanding the importance of coopetition and capturing the coopetition opportunities are key
factors of the coopetition mindset, which is one of the key success factors of coopetition.
From the case study, I also found that an organizational structure with a combination of a
dedicated unit and divisional autonomy is important in managing a coopetition relationship.
When firms can separate two units in a coopetition relationship - one to cooperate with the
partner and the other to compete with the partner - the independence of the divisions with high
degrees of autonomy can simplify the relationship. That is, firms can clarify the roles of
194
managers and employees who have been accustomed to pure competition or pure cooperative
relationships. Thus, divisional autonomy can address the issue of role conflicts raised by
Bengtsson and Kock (2008). Meanwhile, when individual divisions or groups with a lot of
autonomy compete with each other to generate better contributions to the firm (which increases
efficiency within a competitive culture), a dedicated unit is necessary to coordinate individual
divisions, create synergy, and resolve conflicts among divisions within the firm and between
partners. The dedicated unit might also enable the firm to capture, share, and disseminate the
coopetition (or alliance in general) management know-how associated with prior experience.
This underscores the need for and challenge in balancing divisional autonomy with the
coordination of conflicted divisional interests involved in the firm.
Finally, coopetition experience was examined using both qualitative and quantitative
approaches. The hypothesis test of coopetition experience showed partial support (in terms of
Tech_comp and Type_coop) for the hypothesis that coopetition experience enhances the
relationship between coopetition and innovation performance. Although the quantitative research
shows partial support for the hypothesis, the case study suggested that coopetition experience is
critical for coopetition success. Both firms have many coopetition experiences (around 30
percent of over 100 alliances for 10 years before the joint venture announcement were
coopetitions). Further, Samsung engaged in more strategic alliances with more bilateral
relationships that managed the coopetition more effectively than did Sony, which engaged in
more joint ventures with more multilateral relationships. The case suggests that coopetition
experience with dyadic relationships may have a greater influence than do multilateral
relationships. In sum, firms with dynamic capability, which is composed of coopetition
195
experience, a coopetition mindset, and an organizational structure with the combination of
divisional autonomy and a dedicated unit, are likely to better manage complex coopetition issues.
6.2 Contributions and Implications
This study makes several contributions to the literature. Figure 6.1 summarizes this
dissertation‘s major contributions to four streams of the literature: coopetition, innovation,
competition, and cooperation in general.
6.2.1 Contribution to the coopetition literature
In an endeavor to contribute to the coopetition literature, both theoretical and
methodological improvements were pursued. First, in terms of theoretical improvements, a
contribution of this research lies in a conceptualization and operationalization of coopetition.
Building on previous works (e.g., Bengtsson et al., 2010; Chen, 2008; Das & Teng, 2000;
Gnyawali et al., 2008; Luo, 2007a), I conceptualized coopetition as being composed of three
components: 1) competition between partners, 2) cooperation between partners, and 3) the
interplay between competition and cooperation. Although previous works imply that coopetition
is composed of three components, there was no empirical work to operationalize coopetition by
considering the three components. Gnyawali et al. (2008) suggest that the tension from the
paradoxical and dynamic nature of coopetition will clearly appear when the degrees of
competition and cooperation are both high. Thus, it is essential that the conceptualization and
operationalization of coopetition consider both competition and cooperation to explore the role
of tension in coopetition.
Second, this study investigated the moderating role of the firm‘s capabilities to manage
coopetition. Although managing dynamic and paradoxical situations inherent in coopetition
requires specialized capabilities (i.e., coopetition capabilities), there was a lack of attention to the
196
firm‘s coopetition capability in the coopetition literature. To advance our understanding of
coopetition capabilities, I identified three key elements of coopetition capabilities: 1) coopetition
experience, 2) coopetition mindset, and 3) organizational structure (i.e., combination of
divisional autonomy and dedicated unit).
Third, by adopting the transparadox approach (Chen, 2008) based on the Chinese Middle
Way perspective (Chen, 2002, 2008), this study extended the notion of the balance of opposites
(Das & Teng, 2000). This is initial empirical research to show that the balance between
competition and cooperation generates greater innovation performance, even though the optimal
balance may be not symmetric.25
Further, through a case study of a balanced-strong coopetition,
I demonstrated that the balance is important not only at the formation of coopetition, but also as
it evolves.
Methodologically, this dissertation differentiated itself from previous studies by
measuring coopetition as a continuous variable based both on the intensity of competition and
the intensity of cooperation. In this study, I measured coopetition using four combinations based
on two types of competition (technology competition and market competition) and two types of
cooperation (type strength of a focal coopetition and tie strength between two firms. As far as I
know, this dissertation is initial empirical research to capture coopetition from both the
competition and cooperation sides with continuous and ordinal variables, instead of dichotomous
(or categorical) variables. Further, to investigate the role of the balance between competition and
cooperation, I employed polynomial regression analysis, which is newly introduced in the
coopetition literature. Polynomial regression analysis has strengths when examining the interplay
of two elements through three-dimensional analysis. This study shows that polynomial
25
The optimal balance between competition and cooperation may not be symmetric, but leaning toward the competition side. That is, the optimal points (i.e., stationary points) in shapes of polynomial regression lie in the combinations of high competition and medium cooperation.
197
regression analysis provides valuable information (e.g., optimal points) and a clear picture about
the interplay of the two elements (i.e., competition and cooperation) of coopetition. As
coopetition is composed of both competition and cooperation, future research should use
polynomial regression analysis more frequently to investigate the role of coopetition.
Previous studies reported inconsistent results of coopetition effects (i.e., positive,
negative, or no effects on innovatrion) based on a categorical approach. This study demonstrated
that coopetition based on market competition has an inverted-U relationship with innovation,
while coopetition based on technology competition has a positive influence on coopetition-based
innovation. This study also showed that the effects of coopetition on innovation are positively
affected by the balance between competition and cooperation. Further, through both qualitative
and quantitative approaches, this study provided evidence that a firm‘s coopetition capability
plays a critical role in moderating the relationship between coopetition and innovation
performance.
6.2.2 Contribution to the innovation literature
To advance the literature on coopetition and its impact on innovation, it is important to
focus on the outcomes that are directly related to coopetition activities. Regarding the
composition of value (―innovation‖ in this study) that a focal firm can create and appropriate
through coopetition, I newly conceptualized coopetition-based innovation (i.e., innovation
performance through coopetition) that is composed of three components: 1) joint innovation, 2)
innovation through knowledge application, and 3) innovation in the partner‘s domains.
Methodologically, the new measure of coopetition performance (i.e., coopetition-based
innovation) helps resolve a huge hurdle in coopetition (or general alliance) research on
innovation – the difficulty in matching innovations directly with alliances (Ahuja et al., 2008).
198
Further, the new innovation measure at the alliance (or coopetition) level enables researchers to
employ tools for multilevel analysis (e.g., hierarchical linear modeling (HLM)). As it is difficult
to get coopetition (or alliance) level performance, previous studies have used overall firm
innovation as a proxy. When researchers use overall innovation performance at the coopetition
level of performance, however, the dependent variables for the dyadic (or alliance) level and
portfolio (or firm) level are the same, which may limit the use of multilevel analytical tools.
Future studies can conduct multilevel research by using overall innovation performance and
coopetition-based innovation (an innovation measure for the individual coopetition level this
study provides).
This study provided evidence that competition, cooperation, and the balance between
competition and cooperation have positive and significant effects on coopetition-based
innovation. Further, the moderating effects of coopetition experience on innovation were
investigated.
6.2.3 Contribution to the competition literature
Although the main focuses of this study were on coopetition and innovation, this research
contributes to the literature of competition. The competition literature has dealt with competition
mainly at the industry (or market) level (e.g., Aghion et al., 2005; Ritala, in press) or from the
competitor perspective (action and response in competitive dynamics research). Even though
little research (e.g., Khanna et al., 1998) has paid attention to the competition between partners,
efforts to operationalize the varying intensity of competition between partners were limited. That
is, most alliance research examined the effects of competition between partners on innovation
from a categorical perspective (competitor versus collaborator) based on SIC code. To address
the gaps in the literature, I focused on the intensity of competition between partners. Following
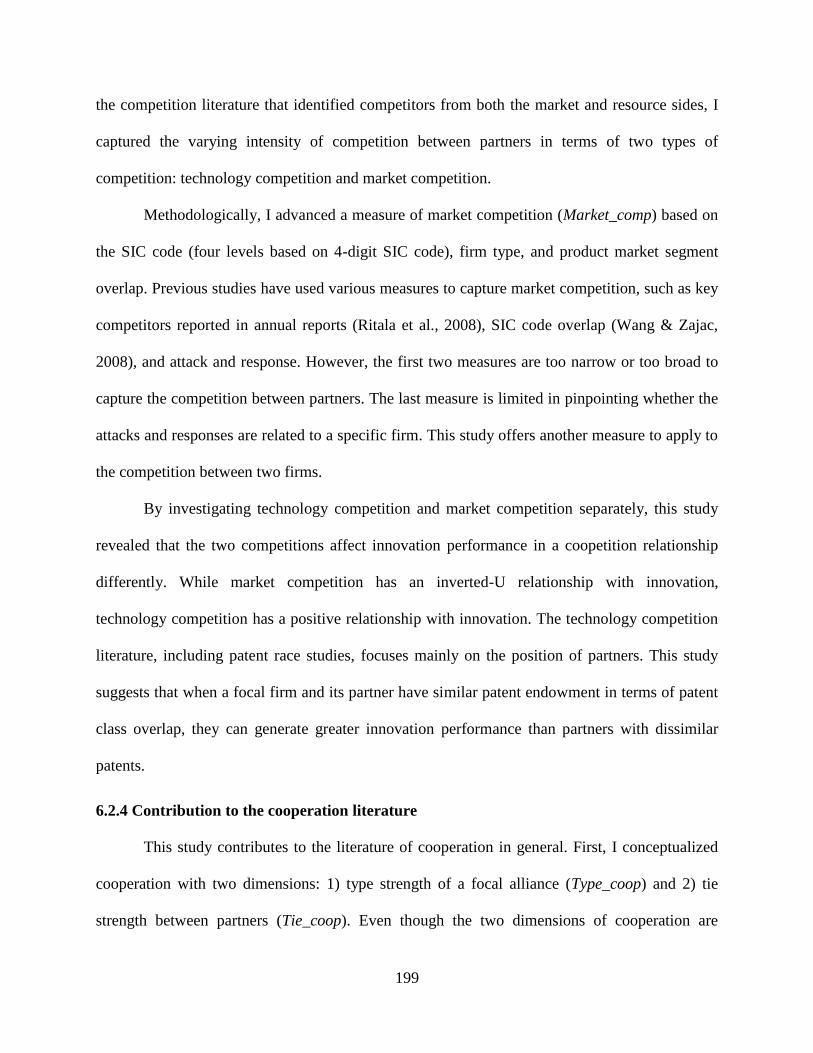
199
the competition literature that identified competitors from both the market and resource sides, I
captured the varying intensity of competition between partners in terms of two types of
competition: technology competition and market competition.
Methodologically, I advanced a measure of market competition (Market_comp) based on
the SIC code (four levels based on 4-digit SIC code), firm type, and product market segment
overlap. Previous studies have used various measures to capture market competition, such as key
competitors reported in annual reports (Ritala et al., 2008), SIC code overlap (Wang & Zajac,
2008), and attack and response. However, the first two measures are too narrow or too broad to
capture the competition between partners. The last measure is limited in pinpointing whether the
attacks and responses are related to a specific firm. This study offers another measure to apply to
the competition between two firms.
By investigating technology competition and market competition separately, this study
revealed that the two competitions affect innovation performance in a coopetition relationship
differently. While market competition has an inverted-U relationship with innovation,
technology competition has a positive relationship with innovation. The technology competition
literature, including patent race studies, focuses mainly on the position of partners. This study
suggests that when a focal firm and its partner have similar patent endowment in terms of patent
class overlap, they can generate greater innovation performance than partners with dissimilar
patents.
6.2.4 Contribution to the cooperation literature
This study contributes to the literature of cooperation in general. First, I conceptualized
cooperation with two dimensions: 1) type strength of a focal alliance (Type_coop) and 2) tie
strength between partners (Tie_coop). Even though the two dimensions of cooperation are
200
distinct, the efforts to classify the dimensions (or types) of cooperation and capture the effects of
each dimension in the same phenomenon were limited.
By examining the two dimensions of cooperation at the same time, this research revealed
that each type of cooperation shows similar but distinct effects on innovation. This study
demonstrated that the intensity of cooperation (i.e., Type_coop and Tie_coop) has a positive
relationship with coopetition-based innovation. Through additional tests, this study revealed that
Tie_coop (tie-strength between two firms) has an inverted-U relationship with innovation, which
suggests that the logic of structural embeddedness can apply to relational embeddedness. That is,
this study demonstrates that Uzzi‘s notion of ‗overembeddedness‘ can be applied to the dyadic
level as well. In the similar vein, this study implied that cooperative rent-seeking behavior might
help firms their strategic flexibility (Volberda, 1996) up to a certain point but high degree
cooperation might generate strategic inflexibility (Bresser & Harl, 1986). Further, this study
supported some scholars‘ (e.g., Maurer et al., 2011) arguments that social capital facilitates
knowledge transfer, but the transferred knowledge may not be beneficial.
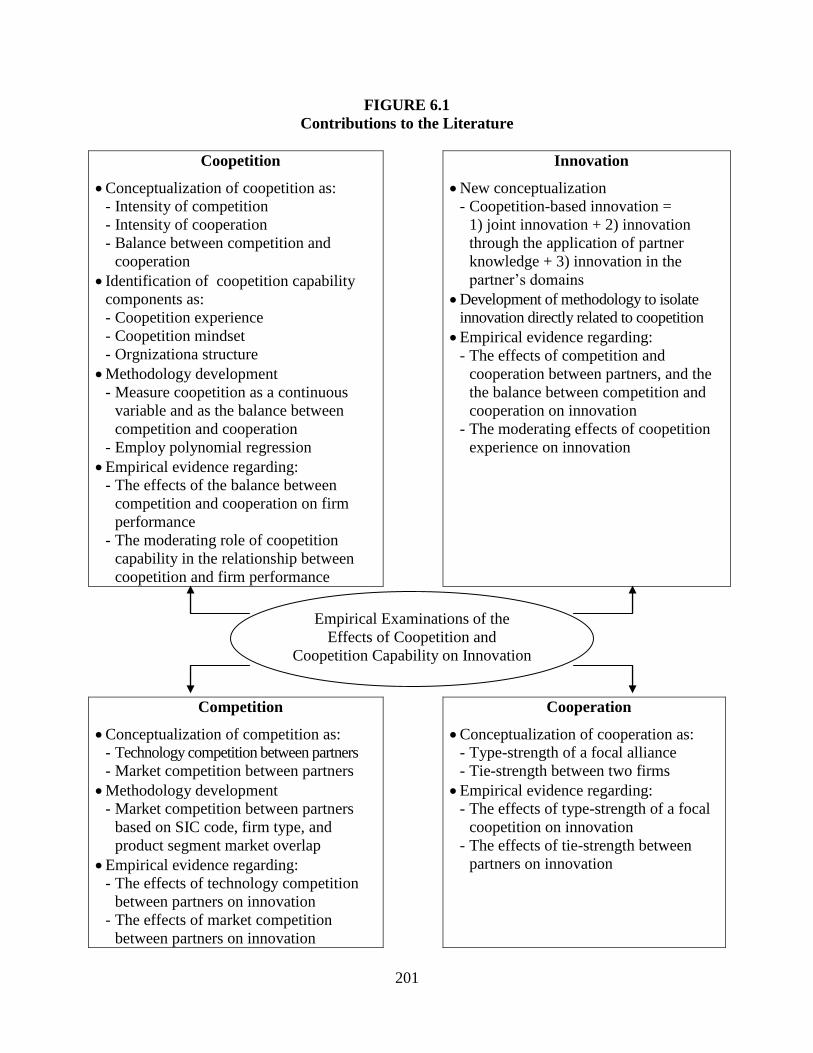
201
FIGURE 6.1
Contributions to the Literature
Coopetition
Conceptualization of coopetition as:
- Intensity of competition
- Intensity of cooperation
- Balance between competition and
cooperation
Identification of coopetition capability
components as:
- Coopetition experience
- Coopetition mindset
- Orgnizationa structure
Methodology development
- Measure coopetition as a continuous
variable and as the balance between
competition and cooperation
- Employ polynomial regression
Empirical evidence regarding:
- The effects of the balance between
competition and cooperation on firm
performance
- The moderating role of coopetition
capability in the relationship between
coopetition and firm performance
Innovation
New conceptualization
- Coopetition-based innovation =
1) joint innovation + 2) innovation
through the application of partner
knowledge + 3) innovation in the
partner‘s domains
Development of methodology to isolate
innovation directly related to coopetition
Empirical evidence regarding:
- The effects of competition and
cooperation between partners, and the
the balance between competition and
cooperation on innovation
- The moderating effects of coopetition
experience on innovation
Competition
Conceptualization of competition as:
- Technology competition between partners
- Market competition between partners
Methodology development
- Market competition between partners
based on SIC code, firm type, and
product segment market overlap
Empirical evidence regarding:
- The effects of technology competition
between partners on innovation
- The effects of market competition
between partners on innovation
Cooperation
Conceptualization of cooperation as:
- Type-strength of a focal alliance
- Tie-strength between two firms
Empirical evidence regarding:
- The effects of type-strength of a focal
coopetition on innovation
- The effects of tie-strength between
partners on innovation
Empirical Examinations of the
Effects of Coopetition and
Coopetition Capability on Innovation
rmance
202
6.2.5 Managerial implications
In addition to the contributions to the academic literature, this dissertation also offers
managers suggestions for managing coopetition. The innovation performance implications of
coopetition are highly relevant for many companies in the high-tech sector. Further, as
coopetition entails high uncertainty in terms of both the environment and partner behaviors,
firms need to engage in a partnership with caution and ex post adjustments are necessary.
Coopetition requires managers to redefine the competition with a more complex and multifaceted
manner and walk the fine line between collaborating in good faith and competing to enhance
their own strategic outcomes (Gnyawali et al., 2006). Furthermore, managers confront more
challenges due to the dynamic nature of coopetition (Luo, 2007b). Over time, the incentive to
invest more in cooperating or competing with a given firm changes (Morris, Kocak, & Ozer,
2007; Barnir & Smith, 2002). As a result, coopetition needs more capabilities in order to estimate
the evolving costs and benefits of coopetition, to keep the balance of bargaining power, and to
make necessary adjustments to the cooperation-competition ratio. Yet, the study of the role of
coopetition and the role of coopetition capabilities in innovation is very limited.
This study examined the effects of coopetition and the balance between competition and
cooperation on firm innovation. Through large scale longitudinal quantitative research, I
demonstrated that coopetition can be helpful to generate greater innovation performance in the
high tech industry. In the process, the balance between competition and cooperation is critical.
Further, how to understand and manage the tension rising from paradoxical factors in coopetition
is critical for selecting partners and managing (or coordinating) the paradoxical factors and
conflicts within and between firms. This study investigated whether and to what extent a firm‘s
capability to manage coopetition positively influences the relationship between coopetition and
203
firm innovation. The findings in this study from both quantitative and qualitative approaches
provide insights for managers considering a coopetition strategy, forming a coopetition in a more
balanced way, and developing coopetition capabilities in order to generate greater coopetition
performance.
6.3 Limitations and Directions for Future Research
6.3.1 Limitations of the research
This research has several limitations and the findings need to be interpreted in light of
these limitations. First, I tried to isolate coopetition-based innovation through three aspects: 1)
joint innovation, 2) citing partners, and 3) innovation in partners‘ domains. Conceptually, this
allows the isolation of the innovation related to coopetition. Further, the results of hypothesis
testing show that this new measure generates the results that match my conceptual arguments.
However, the second and third segments of coopetition-based innovation may be influenced by
focal firms‘ existing activities. Thus, I first considered the measure based on the increase from
pre-alliance to post-alliance. However, the increase measure generates negative performance
partly due to a significant citation lag (which was discussed in section 5.1). When innovation
performance (the dependent variable) is negative, I could not use the typical methods (Poisson
regression or negative binomial regression) that have been used in the innovation literature to
measure the count data and to resolve over-dispersion characteristics of patent data. Therefore, I
did not use the increase measure in this study. Instead, I added pre-sample innovation
performance as a control variable. Future research needs to advance this measure.
Second, and related to the above, the measure of technology competition is partly
overlapped with the dependent variable, coopetition-based of innovation. I used patent class
overlap to measure the intensity of technology competition. One component of coopetition-based
204
innovation is patents in the partner‘s domain. Thus, two measures partly overlap. As a result, the
increase in technology competition may cause higher innovation performance, which calls for
cautious interpretation of the results.
Third, as discussed in section 5.1, the lack of correlation between two types of
competition and two types of cooperation cause concern about a lack of construct validity. In this
regard, I argue that the different types of competition and cooperation capture different segments
of competition and cooperation. While Tech_comp captures the competition in upstream
activities, Market_comp captures the competition in downstream activities. While Type_coop
captures the cooperation in a focal alliance, Tie_coop captures the overall cooperation between
two firms. Further, while firms can select focal alliance types (Type_coop), tie strength between
firms (Tie_coop) is influenced by firm age, history, and other factors. Thus, many firms with
short histories and limited alliance experience have limited Tie_coop compared to firms with a
lot of alliance experience and long histories. Then, I had to develop separate constructs for each
type of competition and cooperation. To maintain a lean model, however, I used the current
construct and measures. Future research needs to develop the measures to capture the specified
constructs and examine the relationships in detail.
Finally, another limitation is due to the characteristics of data. As Figure 5.5 shows, the
distribution of Tie_coop (repeated ties and concurrent linkages) is very skewed and there are a
lot of 0‘s (no ties with the partner except for the focal alliance). Further, there are few or no
observations in the segment of low Tech_comp and high Tie_coop and in the segments of high
Market_comp and high Tie_coop. Such non-uniform distribution calls for cautious interpretation
of the results. Therefore, I provide distribution and frequency of competition and cooperation
variables.
205
6.3.2 Direction for future research
While this dissertation studied many aspects of coopetition and coopetition capabilities,
several interesting issues remain for future research.
First, this study was motivated to understand coopetition tension and its role in
innovation. Tension is inherent in coopetition due to paradoxical factors, such as value creation
versus value appropriation, and knowledge sharing versus knowledge protection. Scholars (e.g.,
Gnyawali, 2010) suggest that understanding and managing coopetition tension may be the key to
understanding the effects of coopetition on firm performance, including innovation performance.
Research on coopetition tension is in its early stages and there are many remaining issues. Future
research could conceptually advance and empirically investigate the nature, antecedents, and
consequences of tension. Originally, I tried to examine tension in this dissertation but I changed
the focus of the research due to the difficulty of measuring tension. Through in-depth case
studies and interviews with managers who engaged in coopetition, researchers could examine the
tension that appeared in a coopetition relationship, which could advance our understanding of the
role of tension in coopetition.
Second, future study can further advance the conceptualization and measurement of
competition and cooperation. In this dissertation, I examined the effects of two types of
competition and two types of cooperation on innovation. As I discussed in the limitations section,
I found that there is a lack of strong correlation between different types of competition and
different types of cooperation. The effects of different combinations of competition and
cooperation were also different. Although I tried to explain the results through a series of
possible reasons, it is still necessary to advance our understanding of why and how coopetitions
in different combinations of competition and cooperation can differently influence firm
206
performance. Further, it is necessary to develop measures to better capture each construct.
Especially, despite its importance in advancing our understanding of the relationship between
coopetition and innovation, there seems to be a lack of attention to technology competition and
no appropriate measure of technology competition between partners. Future research could
conceptually advance technology competition and develop its measures.
Third, this study underscored the importance of the balance between competition and
cooperation and examined some aspects of the balance in a coopetition relationship. I suggested
that the balance strategy is important to generate greater performance in the long term. However,
the optimal balance may vary in different contexts and in different measures. Future research
could advance the balance logic further by considering different contexts and empirically
examining the role of balance. As far as I know, this study is an initial work using polynomial
regression to examine the effects of coopetition and the balance between competition and
cooperation. Future research can apply polynomical regression to other firm performance (e.g.,
financial performance) and to other industries to generalize the findings in this study.
Fourth, as I discussed above, coopetition-based innovation is conceptually advanced in
terms of isolation of innovation related to coopetition. However, it is still limited in its ability to
capture the difference between pre-sample and post-sample innovation performance, even
though I considered pre-sample innovation as a control. Future research needs to advance the
measure of coopetition-based innovation to further isolate innovation directly related to
coopetition activities.
Fifth, Bengtsson et al. (2010) suggest that coopetition is well-suited for multi-level
analysis to fully capture coopetitive dynamics that have not yet received attention in prior work.
Further, coopetition processes at different levels are interlinked and could influence each other
207
(Bengtsson et al., 2010). In line with their logic, ―how do portfolio level factors influence
individual coopetition performance, vice versa?‖ is an important question to understand the role
of coopetition in firm performance. Future research could include multilevel research. Using my
conceptualization and measure of coopetition-based innovation, future study could generate
innovation performance at the alliance portfolio level. Using multilevel regression modeling (e.g.,
hierarchical linear modeling method (HLM)), researchers could examine the effects of
coopetition and coopetition capabilities on innovation performance at different levels, such as
individual coopetition, alliance portfolio, and firm levels. Empirical testing at a multilevel
context will help us understand the effects of coopetition and coopetition capabilities on firm
performance more comprehensively.
Finally, even though I did not report it, I found that there are differences between the
samples under SIC3674 and the samples that are considered to be semiconductor firms but
whose primary SIC code is not 3674. I note two possible reasons: 1) a different ratio of global vs.
domestic coopetition between the two groups, and 2) distinct characteristics across different
industries. One of the possible reasons may be the different ratio of global firms or global
coopetition. As Gnyawali and Park (2011) suggest, researchers could compare two groups, one
global and the other domestic, to draw similarities and differences. While cross-national
coopetition is more complex than domestic, cross-national coopetition with a global scope may
offer more opportunities than does domestic coopetition.The study and comparison of global and
domestic coopetition could be conducted as large-scale empirical research or as an in-depth case
study. Second, researchers could conduct a longitudinal empirical study with samples selected
from across multiple industries. Many studies focused on either a longitudinal research with

208
samples in a specific industry or a cross sectional research with samples from multiple industries
but in a specific period. Future study needs to pursue a cross sectional longitudinal analysis.
209
References
Abernathy, W.J., & Clark, K.B. 1985. Innovation - Mapping the Winds of Creative Destruction.
Research Policy 14(1): 3-22.
Acs, Z.J., Anselin, L., & Varga, A. 2002. Patents and innovation counts as measures of regional
production of new knowledge. Research Policy, 31(7): 1069-1085.
Aghion, P., Bloom, N., Blundell, R., Griffith, R., & Howitt, P. 2005. Competition and
innovation: An inverted-U relationship. Quarterly Journal of Economics, 120(2): 701-728.
Ahuja, G. 2000. Collaboration networks, structural holes, and innovation: A longitudinal study.
Administrative Science Quarterly, 45(3): 425-455.
Ahuja, G., & Katila, R. 2001. Technological acquisitions and the innovation performance of
acquiring firms: A longitudinal study. Strategic Management Journal 22(3): 197-220.
Ahuja, G., & Katila, R. 2004. Where do resources come from? The role of idiosyncratic
situations. Strategic Management Journal, 25(8/9): 887-907.
Ahuja, G., Lampert, C.M., & Tandon, V. 2008. Moving beyond Schumpeter: Management
research on the determinants of technological innovation. The Academy of Management
Annals 2(1): 1-98.
Anand, B.N., & Khanna, T. 2000. Do firms learn to create value? The case of alliances. Strategic
Management Journal, 21(3): 295-315.
Ang, S. 2008. Competitive intensity and collaboration: impact on firm growth across
technological environments. Strategic Management Journal, 29(20): 1057-1075.
Axelrod, R. 1984. The evolution of cooperation. New York: Basic Books.
Barkema, H.G., Shenkar, O., Vermeulen, F., & Bell, J.H.J. 1997. Working Abroad, Working
with Others: How Firms Learn to Operate International Joint Ventures. The Academy of
Management Journal, 40(2): 426-442.
Barnett, W.P. 1997. The dynamics of competitive intensity. Administrative Science Quarterly,
42(1): 128-160.
Barney, J.B. 1986. Strategic factor markets: expectations, luck, and business strategy.
Management Science, 32(10): 1231-1241.
Barney, J. 1991. Firm resources and sustained competitive advantage. Journal of Management,
17(1): 99-120.
BarNir, A., & Smith, K.A. 2002. Interfirm Alliances in the Small Business: The Role of Social
Networks. Journal of Small Business Management, 40 (3): 219-232.
Barringer, B., & Harrison, J. 2000. Walking a Tightrope: Creating Value Through
Interorganizational Relationships. Journal of Management, 26(3): 367-403
Baum, J.A.C., Calabrese, T., & Silverman, B.S. 2000. Don‘t go it alone: Alliance network
composition and startups‘ performance in Canadian biotechnology. Strategic Management
Journal, 21(3): 267-294.
210
Baumard, P. 2009. An asymmetric perspective on coopetitive strategies. International Journal
of Entrepreneurship and Small Business, 8(1): 6-22.
Bengtsson, M., Eriksson, J., & Wincent, J. 2010. Coopetition: New Ideas for a New Paradigm.
In: Yami, S., Castaldo, S., Dagnino, G.B., Le Roy, F. (Eds.), Coopetition: Winning
strategies for the 21st century. 19-39. Northampton, MA: Edward Elgar.
Bengtsson, M., & Kock, S. 1999. Cooperation and Competition in Relationships Between
Competitors in Business Networks. Joual of Business and Industrial Marketing, 14(3):
178-190.
Bengtsson, M., & Kock, S. 2000. Coopetition‖ in Business Networks—to Cooperate and
Compete Simultaneously. Industrial Marketing Management, 29(5): 411-426.
Bengtsson, M., & Kock, S. 2001. Tension in Copeition. Presented at the 16th
Nordic Academy
of Management Meeting, Uppsala, Sweden, August: 16-18.
Bengtsson, M., & Kock, S. 2008. Role Conflicts in Co-opetitive Relationships. Working Paper,
Umeå Business School, University of Umeå, Sweden.
Bonel, E., & Rocco, E. 2007. Coopeting to Survive; Surviving Coopetition. International
Studies of Management & Organization, 37(2): 70-96.
Bowman, C., & Faulkner, D. 1997. Competitive and Corporate Strategy. Irwin: London.
Brandenburger, A.M., & Nalebuff, B.J., 1996. Co-opetition. Doubleday, New York.
Bresser, R.K., & Harl, J.E. 1986. Collective strategy: vice or virtue? The Academy of
Management Review, 11(2): 408-427.
Brown, C., & Linden, G. 2009. Chips and change: how crisis reshapes the semiconductor
industry. MIT Press: Cambridge, Mass.
Burgers, W.P., Hill, C.W.L, & Kim, W.C. 1993. A theory of global strategic alliances: The case
of the global auto industry. Strategic Management Journal, 14(6): 419-432.
Cairo, R. 2006. Co-opetition and Strategic Business Alliances in Telecommunication: The Cases
of BT, Deutsch Telekom and Telefonica Espana. The Business Review, 5(2): 147-154.
Campbell, D.J., & Furrer, D.M. 1995. Goal setting and competition as determinants of task
performance. Journal of Organizational Behavior, 16(4): 377-389.
Capaldo, A. 2007. Network structure and innovation: The leveraging of a dual network as a
distinctive relational capability. Strategic Management Journal, 28(6): 585-608.
Carayannis, E.G., & Alexander, J. 1999. Winning by Co-Opetiting in Strategic Government-
University-Industry R&D Partnerships: The Power of Complex, Dynamic Knowledge
Networks. Journal of Technology Transfer, 24(2-3): 197-210.
Cassiman, B., Di Guardo, M.C., & Giovanni, V. 2009. Organising R&D Projects to Profit From
Innovation: Insights From Co-opetition. Long Range Planning, 42(2): 216-233.
Chang, S.J., 2008. Samsung vs. Sony: The Inside Story of the Electronics Giants’ Battle for
Global Supremacy. John Wiley & Sons (Asia) Pte. Ltd., Singapore.
Chen, M.J. 1996. Competitor analysis and interfirm rivalry: Toward a theoretical integration. Academy of Management Review, 21: 100-134.
211
Chen, M.J. 2002. Transcending paradox: The Chinese "middle way" perspective. Asia Pacific
Journal of Management, 19(2,3): 179-199.
Chen, M.J., 2008. Reconceptualizing the Competition-Cooperation Relationship: A
Transparadox Perspective. Journal of Management Inquiry 17(4), 288-305.
Chen, M.J., Su, K.H., & Tsai, W., 2007. Competitive Tension: The Awareness-Motivation-
Capability Perspective. Academy of Management Journal 50(1), 101-118.
Child, J., Faulkner, D., & Tallman, S.B. 2005. Cooperative strategy managing alliances,
networks, and joint ventures. Oxford University Press: USA.
Chin, K.-S., Chan, B.L., & Lam, P.-K., 2008. Identifying and prioritizing critical success factors
for coopetition strategy. Industrial Management + Data Systems, 108(4): 437-454.
Cohen, W.M., & Klepper, S. 1996. A reprise of size and R&D. Economic Journal, 106(437):
925-951.
Cohen, W.M., & Levintahal, D. 1990. Absorptive capacity: A new perspective on learning and
innovation. Administrative Science Quarterly, 35: 128-152.
Contractor, F. J., & Lorange, P. 1988. Why should firms cooperate? The strategy and economics
basis for cooperative ventures. In F. J. Contractor, & P. Lorange (Eds.), Cooperative
strategies in international business. Lexington: Lexington Books.
Dagnino, G., & Padula, G., 2002. Coopetition strategy: a new kind of interfirm dynamics for
value creation. EURAM, Stockholm.
Dagnino, G., & Rocco, E., 2009. Introduction – coopetition strategy. In: Dagnino, D., Rocco, E.
(Eds.), Coopetition Strategy. Routledge, pp. 1-21.
Damanpour, F. 1991. Organizational Innovation - a Metaanalysis of Effects of Determinants and
Moderators. Academy of Management Journal, 34(3): 555-590.
Das, T.K., & Teng, B.S. 2000. A resource-based theory of strategic alliances. Journal of
Management, 26(1): 31-61.
Dodgson, M., Mathews, J., Kastelle, T., Hu, M.C., 2008. The evolving nature of Taiwan‘s
national innovation system: The case of biotechnology innovation networks. Research
Policy 37, 430-445.
Doraszelski, U. 2003. An R&D race with knowledge accumulation. Rand Journal of Economics
34(1), 20-42.
Dussauge, P., Garrette, B., & Mitchell, W. 2000. Learning from competing partners: Outcomes
and durations of scale and link alliances in Europe, North America and Asia. Strategic
Management Journal, 21(2): 99-126.
Dussauge, P., Garrette, B., & Mitchell, W. 2004. Asymmetric performance: The market share impact of scale and link alliances in the global auto industry. Strategic Management Journal, 25(7): 701-711.
Dvorak, P., Ramstad, E., 2006 (January 3). TV Marriage: Behind Sony-Samsung rivalry, An
unlikely alliance develops electronics giants join forces on flat-panel technology. The Wall
Street Journal, A1.
212
Dyer, J.H., & Kale, P. 2007. Relational Capabilities: Drivers and Implications. In Helfat, C.E.,
Finkelstein, S., Mitchell, W., Peteraf, M.A., Singh, H., Teece, C.J., & Winter, S.G (Eds.),
Dynamic capabilities: Understanding strategic change in organizations. 65-79.
Oxnatford: Blackwell.
Dyer, J.H., & Nobeoka, K. 2000. Creating and managing a high-performance knowledge-sharing
network: The Toyota case. Strategic Management Journal: Special Issue: Strategic
Networks, 21(3): 345-367.
Dyer, J.H., & Singh, H. 1998. The relational view: Cooperative strategy and sources of
interorganizational competitive advantage. Academy of Management Review, 23 (4): 660-
679.
Edwards, J. R. 2002. Alternatives to difference scores: Polynomial regression analysis and
response surface methodology. In Drasgow, F., & Schmitt, N (Eds.), Measuring and
analyzing behavior in organizations: Advances in measurement and data analysis, The
Jossey-Bass business & management series: 350-400. San Francisco, CA: Jossey-Bass.
Edwards, J. R., & Parry, M.E. 1993. On the use of polynomial regression equations as an
alternative to difference scores in organizational research. Academy of Management
Journal, 36(6): 1577-1613.
Eisenhardt, K.M. 1989. Building theories from case study research. Academy of Management
Review, 14(4): 532-550.
Ellonen, H., Wikström, P., & Jantunen, A. 2009. Linking dynamic-capability portfolios and
innovation outcomes. Technovation 29(11), 753-
Emden, Z., Calantone, R.J., & Droge, C. 2006. Collaborating for New Product Development:
Selecting the Partner with Maximum Potential to Create Value. The Journal of Product
Innovation Management, 23:330-341.
Eriksson, P. 2008. Achieving Suitable Coopetition in Buyer-Supplier Relationships: The Case of
AstraZeneca. Journal of Business to Business Marketing, 15(4): 425-.
Ferrier, W. J., Smith, K. G., & Grimm, C. M. 1999. The role of competitive action in market
share erosion and industry dethronement: A study of industry leaders and challengers.
Academy of Management Journal, 42(4): 372-388.
Floyd, S.W., & Lane, P.J. 2000. Strategizing throughout the organization: Management role
conflict in strategic renewal. The Academy of Management Review, 25(1): 154-177.
Frank, R.H. 1988. Passions within reason: The strategic role of emotions. New York: Norton.
Fudenberg, D., Gilbert, R., Stiglitz, J., & Tirole, J. 1983. Preemption, Leapfrogging and
Competition in Patent Races. European Economic Review, 22(1): 3-31.
Ginsberg, A., & Venkatraman, N. 1985. Contingency perspectives of organizational strategy: A
critical review of the empirical research. The Academy of Management Review, 10(3):
421-434.
Gnyawali, D.R. 2010. Coopetition Tension: Emerging Conceptual Issues. Presented at the 30th
Starategic Management Society (SMS) International Conference. Rome, Italy. September
12-15.
213
Gnyawali, D.R., He, J., & Madhavan, R. 2006. Impact of Co-Opetition on Firm competitive
Behavior: An Empirical Examination. Journal of Management, 32(4): 507-530.
Gnyawali, D.R., He, J., & Madhavan, R. 2008. Co-Opetition: Promises and Challenges. In
Encyclopedia of 21st Century Management, (Ed.) Wenkel, C. Chapter 38: 386-398.
Gnyawali, D.R., & Madhavan, R. 2001. Cooperative Networks and Competitive Dynamics: A
Structural Embeddedness Perspective. Academy of Management Review, 26(3): 431-445.
Gnyawali, D.R., & Park, B.J. 2009. Co-opetition and Technological Innovation in Small and
Medium-Sized Enterprises: A Multilevel Conceptual Model. Journal of Small Business
Management, 47(3): 308-330.
Gnyawali, D. R., & Park, B. J. R. 2011. Co-opetition between giants: Collaboration with
competitors for technological innovation. Research Policy, 40: 650-663.
Gomes-Casseres, B. 1994. Group versus group: How alliance networks compete. Harvard
Business Review, 72(4): 62-71.
Granovetter, G. (1973). The strength of weak ties. American Journal of Sociology, 78: 1360-
1380.
Grant, R. 1996. Toward a knowledge-based theory of the firm. Strategic Management Journal,
17(Winter Issue): 109-122.
Grindley, P.C., & Teece, D.J. 1997. Managing intellectual capital: Licensing and cross-licensing
in semiconductors and electronics. California Management Review, 39(2): 8-41.
Gulati, R. 1998. Alliances and networks. Strategic Management Journal, 19(4): 293-317.
Gulti, R., Nohria, N., & Zaheer, A. 2000. Strategic networks. Strategic Management Journal,
21(3): 203-215.
Gupta, A.K., Smith, K.G., & Shalley, C.E. 2006. The Interplay Between Exploration And
Exploitation. Academy of Management Journal, 49(4): 693-706.
Hagedoorn, J. 1993. Understanding the Rationale of Strategic Technology Partnering -
Interorganizational Modes of Cooperation and Sectoral Differences. Strategic
Management Journal, 14(5): 371-385.
Hall, B.H., Jaffe, A.B., & Trajtenberg, M. 2001. The NBER patent citation data file: Lessons,
insights and methodological tools: NBER.
Hamel, G., Doz, Y.L., & Prahalad, C.K. 1989. Collaborate with Your Competitors-and Win.
Harvard Business Review, 67(Jan-Feb): 133-139.
Hamel, G. 1991. Competition for competence and inter-partner learning within international
strategic alliances. Strategic Management Journal, 12(Summer Supplement): 83-103.
Hansen, M.T. 1999. The search-transfer problem: The role of weak ties in sharing knowledge
across organization subunits. Administrative Science Quarterly, 44(1): 82-111.
Harbison, J.R., & Pekar, P. Jr. 1998. Smart Alliances. Jossey-Bass, San Francisco.
Harrigan, K.R. 1988. Joint ventures and competitive advantage Strategic Management Journal,
9(2): 141-158.

214
Hausman, J., Hall, B. H., & Griliches, Z. 1984. Econometric Models for Count Data with an
Application to the Patents-R & D Relationship. Econometrica, 52(4): 909-938.
Heiman, B.A., & Nickerson, J.A. 2004. Empirical evidence regarding the tension between
knowledge sharing and knowledge expropriation in collaborations. Managerial and
Decision Economics, 25(6-7): 401-420.
Helfat, C.E., & Peteraf, M.A. 2003. The dynamic resource-based view: Capability lifecycles.
Strategic Management Journal, 24(10): 997-1010.
Helfat, C.E., Finkelstein, S., Mitchell, W., Peteraf, M.A., Singh, H., Teece, C.J., & Winter, S.G.
2007. Dynamic capabilities: Understanding strategic change in organizations. Oxnatford:
Blackwell.
Hitt, M.A., Hoskisson, R.E., Johnson, R.A., & Moesel, D.D. 1996. The market for corporate
control and firm innovation. Academy of Management Journal, 39(5): 1084-1119.
Hoang, H., & Rothaermel, F.T. 2005. The effect of general and partner-specific alliance
experience on joint R&D project performance. Academy of Management Journal, 48(2):
332-345.
Hoskisson, R., Hitt, M., Wan, W., & Yiu, D. 1999. Theory and research in strategic
management: Swings of a pendulum. Journal of Management, 25: 417-456.
Inkpen, A.C., & Tsang, E.W.K. 2007. Learning and Strategic Alliances. The Academy of
Management Annals 1(10): 479 - 511.
Ireland, R.D., Hitt, M.A., & Vaidyanath, D. 2002. Alliance management as a source of
competitive advantage. Journal of Management, 28(3): 413-446.
Jorde, T.M., & Teece, D.J. 1990. Innovation and Cooperation: Implications for Competition and
Antitrust. The Journal of Economic Perspective, 4(3): 75-96.
Kale, P., Dyer, J. H., & Singh, H. 2002. Alliance capability, stock market response, and long-
term alliance success: The role of the alliance function. Strategic Management Journal,
23(8): 747-767.
Kale, P., & Singh, H. 2007. Building firm capabilities through learning: the role of the alliance
learning process in alliance capability and firm-level alliance success. Strategic
Management Journal, 28(10): 981-1000.
Kale, P., Singh, H., & Perlmutter, H., 2000. Learning and protection of proprietary assets in
strategic alliances: Building relational capital. Strategic Management Journal, 21(3): 217-
237.
Kanter, R.M. 1994. Collaborative advantage: the art of alliances. Harvard Business Review, 72:
96-96.
Ketchen, D.J. & Snow, C.C. 2004. Research on competitive dynamics: Recent accomplishments
and future challenges. Journal of Management, 30(6): 779-804.
Khanna, T., Gulati, R., & Nohria, N., 1998. The dynamics of learning alliances: competition,
cooperation, and relative scope. Strategic Management Journal 19: 193-210.
Kim, J., & Parkhe, A. 2009. Competing and Cooperating Similarity in Global Strategic
Alliances: An Exploratory Examination. British Journal of Management, 20(3): 363-376.
215
Knudsen, M.P. 2007. The relative importance of interfirm relationships and knowledge transfer
for new product development success. Journal of Product Innovation Management,
24(2): 117-138.
Kogut, B. 1989. The Stability Of Joint Ventures Reciprocity And Competitive. The Journal of
Industrial Economics, 38(2): 183-198.
Kogut, B., & Zander, U. 1992. Knowledge of the Firm, Combinative Capabilities, and the
Replication of Technology. Organization Science, 3(3): 383-397.
Kraatz, M.S. 1998. Learning by association? Interorganizational networks and adaptation to
environmental change. Academy of Management Journal, 41(6): 621-643
Kumar, M.V.S. 2010. Are joint ventures positive sum games? The relative effects of cooperative
and noncooperative behavior. Strategic Management Journal,
Lado, A.A., Boyd, N.G., & Hanlon, S.C., 1997. Competition, Cooperation, and the Search for
Economic Rents: A Syncretic Model. Academy of Management Review 22(1): 110-141.
Lado, A.A., Boyd, N.G., Wright, P., & Kroll, M. 2006. Paradox and theorizing within the
resource-based view. The Academy of Management Review, 31(1): 115-131.
Lane, P.J., & Lubatkin, M. 1998. Relative absorptive capacity and interorganizational learning.
Strategic Management Journal, 19(5): 461-477.
Langley, A., 1999. Strategies for theorizing from process data. Academy of Management Review
24(4), 691-710.
Lanjouw, J. O., & Schankerman, M. 2001. Characteristics of Patent Litigation: A Window on
Competition. The RAND Journal of Economics, 32(1): 129-151.
Lavie, D. 2006. The competitive advantage of interconnected firms: An extension of the
resource-based view. The Academy of Management Review, 31(3): 638-658.
Lavie, D. 2007. Alliance portfolios and firm performance: A study of value creation and
appropriation in the US software industry. Strategic Management Journal, 28: 1187-1212.
Lei, D. 2003. Competition, cooperation and learning: the new dynamics of strategy and
organization design for the innovation net. Int. Journal of Technology Management,
26(7), 694-716.
Lerner, J. 1997. An empirical exploration of a technology race. Rand Journal of Economics,
28(2): 228-247.
Levin, D.Z., & Cross, R. 2004. The strength of weak ties you can trust: The mediating role of
trust in effective knowledge transfer. Management Science, 50(11): 1477-1490.
Levitt, B., & March, J. 1988, Organizational Learning. Annual Review of Sociology, 14, 319-40.
Lewis, M. W. 2000. Exploring paradox: Toward a more comprehensive guide. The Academy of
Management Review 25(4), 760-776.
Long, J. S., & Freese, J. 2006. Regression models for categorical dependent variables using
stata (Second ed.). College Station., TX: Stata Press.
Luh, S.S., 2003. Business the Sony Way: Secrets of the World‘s Most Innovative Electronics
Giant. John Wiley & Sons, Oxford.
216
Luo, X., Rindfleisch, A., & Tse, D.K., 2007. Working with Rivals: The Impact of Competitor
Alliances on Financial Performance. Journal of Marketing Research, 44(1), 73-83.
Luo, Y. 2005. Toward coopetition within a multinational enterprise: a perspective from foreign
subsidiaries. Journal of World Business, 40(1): 71-90.
Luo, Y. 2007a. A Coopetition Perspective of Global Competition. Journal of World Business 42
(2), 129-144.
Luo, Y. 2007b. Are joint venture partners more opportunistic in a more volatile environment?
Strategic Management Journal, 28: 39-60.
Macher, J.T., & Mowery, D.C. 2004. Veritical specialization and industry structure in high
technology industries. Advances in Strategic Management, 21: 317-356.
Mariani, M.M. 2007. Coopetition as an Emergent Strategy: Empirical Evidence from an Italian
Consortium of Opera Houses. International Studies of Management & Organization,
37(2): 97-126.
Mathews, J.A., & Cho, D.S. 2000. Tiger Technology – The creation of s semiconductor
industry in East Asia. Cambridge University Press, Cambridge, UK.
Maurer, I., Bartsch, V., & Ebers, M. 2011. The Value of Intra-organizational Social Capital:
How it Fosters Knowledge Transfer, Innovation Performance, and Growth. Organization
Studies, 32(2): 157-185.
Mesquita, L.F., Anand, J., & Brush, T.H. 2008. Comparing the resource based and relational
views: knowledge transfer and spillover in vertical alliances. Strategic Management
Journal, 29(9): 913-941.
Miles, R. E., & Snow, C.C. 1992. Causes of Failure in Network Organizations. California
Management Review, 34(4): 53-72.
Morris, M.H., Kocak, A., & Ö zer, A., 2007. Coopetition as a Small Business Strategy:
Implications for Performance. Journal of Small Business Strategy, 18(1): 35-55.
Mowery, D.C., Oxley, J.E., & Silverman, B.S. 1996. Strategic alliances and interfirm knowledge
transfer. Strategic Management Journal, 17: 77-91.
Nelson, R. E. 1989. The strength of strong ties: Social networks and intergroup conflict in
organizations. Academy of Management Journal, 32(2): 377-401.
Nelson, R.R. 1991. Why Do Firms Differ, and How Does It Matter. Strategic Management
Journal, 12: 61-74.
Nieto, M.J., & Santamaría, L. 2007. The importance of diverse collaborative networks for the
novelty of product innovation. Technovation 27(6-7), 367-377.
Nohria, N., & Garcia-Pont, C. 1991. Global strategic linkages and industry structure. Strategic
Management Journal, 12: 105-124.
Norman, P. M. 2002. Protecting knowledge in strategic alliances - Resource and relational
characteristics. Journal of High Technology Management Research, 13(2): 177-202.
Oxley, J.E. 1997. Appropriability hazards and governance in strategic alliances: A transaction
cost approach. Journal of Law Economics & Organization, 13(2): 387-409.
217
Oxley, J.E., & Sampson, R.C., 2004. The scope and governance of international R&D alliances.
Strategic Management Journal, 25, 723-749.
Padula, G., & Dagnino, G.B. 2007. Untangling the Rise of Coopetition: The Intrusion of
Competition in a Cooperative Game Structure. International Studies of Management &
Organization, 37(2): 32-52.
Park, B.-J., Gnyawali, D.R., & Srivastava, M.K. 2009. Effects of Alliance Portfolio Resources
and Competitive Attributes on Firm Innovation. Presented at the 2009 Annual Meeting of
the Academy of Management, Chicago.
Park, S.H., & Russo, M.V. 1996. When competition eclipses cooperation: An event history
analysis of joint venture failure. Management Science, 42(6): 875-890.
Parkhe, A. 1993. Strategic alliance structuring: A game theoretic and transaction cost
examination of interfirm cooperation. Academy of Management Journal, 36(4): 794-829.
Patel, P., & Pavitt, K. 1997. The technological competencies of the world's largest firms:
complex and path-dependent, but not much variety. Research Policy, 26(2): 141-156.
Peng, T., & Bourne, M. 2009. The Coexistence of Competition and Cooperation between
Networks: Implications from Two Taiwanese Healthcare Networks. British Journal of
Management, 20(3): 377-
Penrose, E. 1959. The Theory of the Growth of the Firm. Oxford: Basil Balckwell.
Phelps, C.C. 2003. Technological exploration: A longitudinal study of the role of
recombinatory search and social capital in alliance networks. Ph.D. dissertation, New
York University, New York.
Poole, M.S., & Van de Ven, A.H. 1989. Using A Paradox To Build Management And
Organization Theories. The Academy of Management Review, 14(4): 562-579.
Porter, M.E. 1980. Competitive Strategy: Techniques for Analyzing Industries and
Competitors. New York: Free Press.
Porter, M.E. 1985. Competitive Advantage. New York: Free Press.
Powell, W.W., Koput, K.W., & Smith-Doerr, L., 1996. Interorganizational Collaboration and the
Locus of Innovation: Networks of Learning in Biotechnology. Administrative Science
Quarterly, 41(1): 116-144.
Porac, J.F., Thomas, H., Wilson, F., Paton, D., & Kanfer, A. 1995. Rivalry and the industry
model of Scottish knitwear producers. Administrative Science Quarterly, 40(2): 203.
Quinn, R.E., & Cameron, K.S. 1988. Paradox and transformation: Toward a theory of change
in organization and management, Ballinger Pub Co.
Quintana-García, C., & Benavides-Velasco, C., 2004. Cooperation, competition, an innovative
capability: a panel data of European dedicated biotechnology firms. Technovation, 24:
927-938.
Ring, P.S., & Van de Ven, A.H. 1994. Developmental processes of cooperative
interorganizational relationships. The Academy of Management Review, 19(1): 90-118.
218
Ritala, P. in press. Coopetition strategy – when is it successful? Empirical evidence on
Innovation and Market Performance, British Journal of Management.
Ritala, P., Hallikas, J., & Sissonen, H. 2008. The effect of strategic alliances between key
competitors on firm performance. Management Research, 6(3): 179-187.
Ritala, P., & Hurmelinna-Laukkanen, P. 2009. What's in it for me? Creating and appropriating
value in innovation-related coopetition. Technovation, 29(12): 819-828.
Ritala, P., Hurmelinna-Laukkanen, P., & Blomqvist, K. 2009. Tug of war in innovation–
coopetitive service development. International Journal of Services Technology and
Management, 12(3): 255-272.
Rothaermel, F.T., & Deeds, D.L. 2006. Alliance type, alliance experience and alliance
management capability in high-technology ventures. Journal of Business Venturing,
21(4): 429-460.
Rowley, T., Behrens, D., & Krackhardt, D. 2000. Redundant governance structures: An analysis
of structural and relational embeddedness in the steel and semiconductor industries.
Strategic Management Journal, 21(3): 369-386.
Sampson, R.C. 2004. The cost of misaligned governance in R&D alliances. Journal of Law
Economics & Organization, 20(2): 484-526.
Sampson, R.C. 2005. Experience effects and collaborative returns in R&D alliances. Strategic
Management Journal, 26(11): 1009-1031.
Sampson, R.C., 2007. R&D Alliances and Firm Performance: The Impact of Technological
Diversity and Alliance Organization on Innovation. The Academy of Management
Journal, 50(2): 364-386.
Schilling, M.A., & Phelps, C.C. 2007. Interfirm Collaboration Networks: The Impact of Large-
Scale Network Structure on Firm Innovation. Management Science, 53(7): 1113-1126.
Schuler, R.S., Jackson, S.E., & Luo, Y. 2004. Managing Human Resources in Cross-Border
alliances, London, UK: Routledge.
Schumpeter, J.A, 1942. Capitalism, Socialism, and Democracy, Harper & Brothers: New York.
Silipo, D. 2005. The evolution of cooperation in patent races: Theory and experimental evidence.
Journal of Economics 85(1), 1-38.
Smith, K. G., Ferrier, W. J., & Ndofor, H. 2001. Competitive dynamics research: Critique and
future directions. In Hitt, M., Freeman, E., & Harrison, J. (eds.), The Blackwell Handbook
of Strategic Management, Malden, MA: Blackwell Publishers, pp. 315-361.
Sorensen, J.B., & Stuart, T.E. 2000. Aging, obsolescence, and organizational innovation.
Administrative Science Quarterly, 45(1): 81-112.
Srivastava, M.K. 2007. Friends or Neighbors? The Effects of Inter-firm Networks and
Clusters on Technological Innovations in the U.S. Semiconductor Industry. Unpublished
doctoral dissertation, Virginia Polytechnic Institute and State University, VA.
Srivastava, M.K., & Gnyawali, R. in press. When Do Relational Resources Matter? Leveraging
Portfolio Technological Resources for Breakthrough Innovation. The Academy of
Management Journal,
219
Stuart, T.E. 2000. Interorganizational Alliances and the Performance of Firms: A study of
Growth and Innovation Rates in a High-technology Industry. Strategic Management
Journal, 21(8): 791-811.
Suarez-Villa, L. 1998. The structures of cooperation: Downscaling, outsourcing and the
networked alliance. Small Business Economics, 10(1): 5-16.
Szulanski, G. 1996. Exploring internal stickiness: Impediments to the transfer of best practice
within the firm. Strategic Management Journal, 17(Winter Special Issue): 27-43.
Tang, J. 2006. Competition and innovation behaviour. Research Policy, 35(1): 68-82.
Teece, D.J. 1996. Firm organization, industrial structure, and technological innovation. Journal
of Economic Behavior & Organization, 31(2): 193-224.
Teece, D.J. 2009. Dynamic capabilities & strategic management. New York: Oxford University
Press.
Teece, D.J., Pisano, G., & Shuen, A. 1997. Dynamic capabilities and strategic management.
Strategic Management Journal, 18(7): 509-533.
Trajtenberg, M. 1990. A penny for your quotes: patent citations and the value of innovations.
The Rand Journal of Economics, 21(1): 172-187.
Tsai, W.P. 2002. Social structure of "coopetition" within a multiunit organization: Coordination,
competition, and intraorganizational knowledge sharing. Organization Science, 13(2): 179-
190.
Tsang, E.W.K. 2002. Acquiring knowledge by foreign partners from international joint ventures
in a transition economy: learning-by-doing and learning myopia. Strategic Management
Journal, 23(9): 835-854.
Uallachain, B. 1997. Restructuring the American Semiconductor Industry: Vertical Integration of
Design Houses and Wafer Fabricators. Annals of the Association of American
Geographers, 87(2): 217-237.
Utterback, J.M., & Suarez, F.F., 1993. Innovation, Competition, and Industry Structure.
Research Policy, 22(1): 1-21.
Uzzi, B. 1996. The sources and consequences of embeddedness for the economic performance of
organizations: The network effect. American Sociological Review, 61(4): 674-698.
Uzzi, B. 1997. Social structure and competition in interfirm networks: The paradox of
embeddedness. Administrative Science Quarterly, 42(1): 35-67.
Uzzi, B. 1999. Embeddedness in the making of financial capital: How social relations and
networks benefit firms seeking financing. American Sociological Review, 64(4): 481-505.
van Wijk, R., Jansen, J. J. P., & Lyles, M. A. 2008. Inter- and intra-organizational knowledge
transfer: A meta-analytic review and assessment of its antecedents and consequences.
Journal of Management Studies, 45(4): 830-853
Varadarajan, P.R., & Cunningham, M.H. 1995. Strategic alliances: A synthesis of conceptual
foundations. Journal of the Academy of Marketing Science, 23: 282-296.
Volberda, H.W. 1996. Toward the flexible form: How to remain vital in hypercompetitive
environments. Organization Science, 7(4): 359-374.
220
von Hippel, E. 1994. Sticky Information and the Locus of Problem-Solving - Implications for
Innovation. Management Science, 40(4): 429-439.
Walley, K. 2007. Coopetition: An Introduction to the Subject and an Agenda for Research.
International Studies of Management & Organization, 37(2): 11-31.
Wang, C.L., & Ahmed, P. K. 2007. Dynamic capabilities: A review and research agenda.
International Journal of Management Reviews, 9(1): 31-51.
Wang, Y., & Krakover, S. 2008. Destination marketing: competition, cooperation or coopetition?
International Journal of Contemporary Hospitality Management, 20(2): 126-141.
Wang, L., & Zajac, E.J. 2008. Alliance or acquisition? A dyadic perspective on interfirm
resource combinations. Strategic Management Journal, 28: 1291-1317.
Watanabe, C., Lei, S., & Noritomo, O. 2009. Fusing indigenous technology development and
market learning for greater functionality development--An empirical analysis of the growth
trajectory of Canon printers. Technovation, 29(4): 265-283.
Wernerfelt, B. 1984. A resource-based view of the firm. Strategic Management Journal, 5(2):
171-180.
Williamson, O.E. 1985. The Economic Institutions of Capitalism. New York: The Free Press.
Winter, S.G. 2003. Understanding dynamic capabilities. Strategic Management Journal,
24(10): 991-995.
Yami, S., Castaldo, S., Dagnino, G.B., & Le Roy, F. 2010. Editors‘ Introduction. In: Yami, S.,
Castaldo, S., Dagnino, G.B., Le Roy, F. (Eds.), Coopetition: Winning strategies for the
21st century. 1-16. Northampton, MA: Edward Elgar.
Yin, R., 1984. Case study research. Sage Publications, Beverly Hills, CA.
Zaheer, A., & Bell, G.G. 2005. Benefiting from network position: Firm capabilities, structural
holes, and performance. Small Business Economics, 26 (9): 809-825.
221
APPENDICES
APPENDIX A
The Comparison of the Effects of Coopetition-based Innovation and Overall Firm
Innovation
In this study, I provide a new measure of innovation performance – coopetition-based
innovation. To ensure this measure is appropriate, I compare coopetition-based innovation with
overall innovation performance, which is a typical innovation measure. Table A1 shows that the
log-likelihood of coopetition-based innovation is greater than that of overall innovation (models
A1 and A2). When adding new variables in the base model, the increases in log-likelihood are
greater in the model using coopetition-based innovation compared to the models using overall
innovation (models A2, A3, B2, and B3). Based on these results, I primarily use a new measure
of innovation performance – coopetition-based innovation (Innovn_cooptn) – in the analysis.
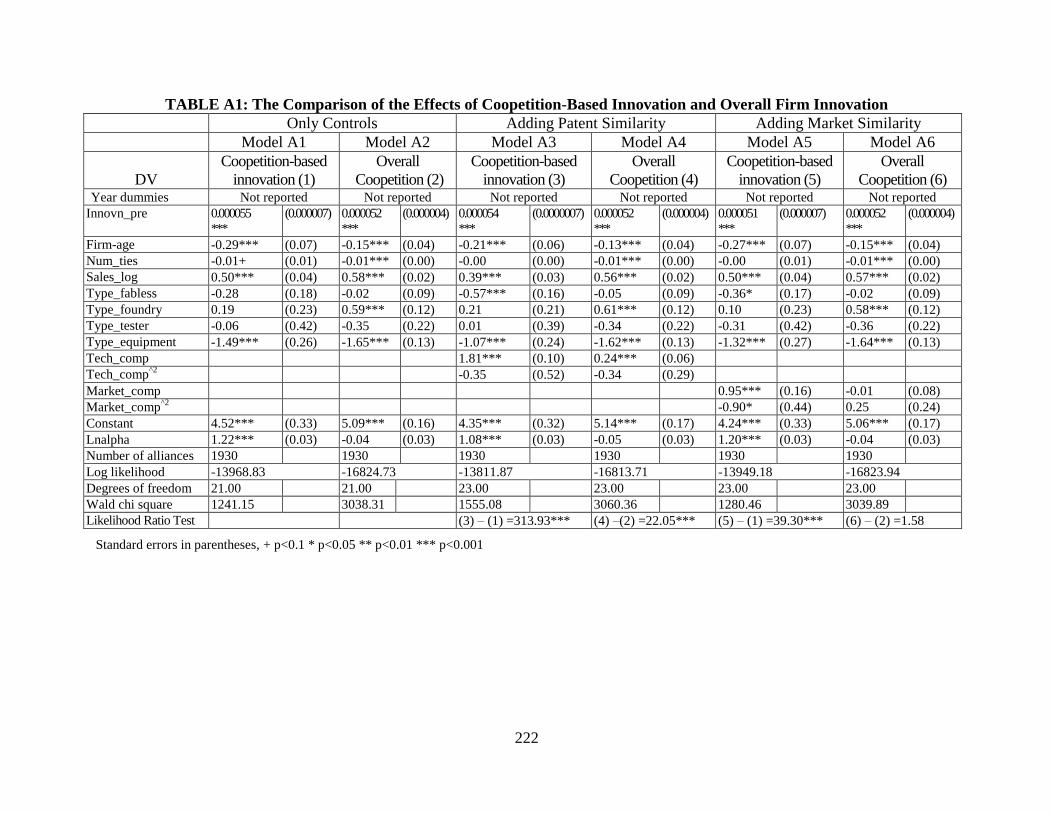
222
TABLE A1: The Comparison of the Effects of Coopetition-Based Innovation and Overall Firm Innovation
Only Controls Adding Patent Similarity Adding Market Similarity
Model A1 Model A2 Model A3 Model A4 Model A5 Model A6
DV
Coopetition-based
innovation (1)
Overall
Coopetition (2)
Coopetition-based
innovation (3)
Overall
Coopetition (4)
Coopetition-based
innovation (5)
Overall
Coopetition (6) Year dummies Not reported Not reported Not reported Not reported Not reported Not reported
Innovn_pre 0.000055
***
(0.000007) 0.000052
***
(0.000004) 0.000054
***
(0.0000007) 0.000052
***
(0.000004) 0.000051
***
(0.000007) 0.000052
***
(0.000004)
Firm-age -0.29*** (0.07) -0.15*** (0.04) -0.21*** (0.06) -0.13*** (0.04) -0.27*** (0.07) -0.15*** (0.04)
Num_ties -0.01+ (0.01) -0.01*** (0.00) -0.00 (0.00) -0.01*** (0.00) -0.00 (0.01) -0.01*** (0.00)
Sales_log 0.50*** (0.04) 0.58*** (0.02) 0.39*** (0.03) 0.56*** (0.02) 0.50*** (0.04) 0.57*** (0.02)
Type_fabless -0.28 (0.18) -0.02 (0.09) -0.57*** (0.16) -0.05 (0.09) -0.36* (0.17) -0.02 (0.09)
Type_foundry 0.19 (0.23) 0.59*** (0.12) 0.21 (0.21) 0.61*** (0.12) 0.10 (0.23) 0.58*** (0.12)
Type_tester -0.06 (0.42) -0.35 (0.22) 0.01 (0.39) -0.34 (0.22) -0.31 (0.42) -0.36 (0.22)
Type_equipment -1.49*** (0.26) -1.65*** (0.13) -1.07*** (0.24) -1.62*** (0.13) -1.32*** (0.27) -1.64*** (0.13)
Tech_comp
1.81*** (0.10) 0.24*** (0.06)
Tech_comp^2
-0.35 (0.52) -0.34 (0.29)
Market_comp
0.95*** (0.16) -0.01 (0.08)
Market_comp^2
-0.90* (0.44) 0.25 (0.24)
Constant 4.52*** (0.33) 5.09*** (0.16) 4.35*** (0.32) 5.14*** (0.17) 4.24*** (0.33) 5.06*** (0.17)
Lnalpha 1.22*** (0.03) -0.04 (0.03) 1.08*** (0.03) -0.05 (0.03) 1.20*** (0.03) -0.04 (0.03)
Number of alliances 1930
1930
1930
1930
1930
1930
Log likelihood -13968.83 -16824.73 -13811.87 -16813.71 -13949.18 -16823.94
Degrees of freedom 21.00 21.00 23.00 23.00 23.00 23.00
Wald chi square 1241.15
3038.31
1555.08
3060.36
1280.46
3039.89
Likelihood Ratio Test
(3) – (1) =313.93*** (4) –(2) =22.05*** (5) – (1) =39.30*** (6) – (2) =1.58
Standard errors in parentheses, + p<0.1 * p<0.05 ** p<0.01 *** p<0.001
223
APPENDIX B
Results of Multiple Regressions
The innovation literature has used negative binomial regression or Poisson regression to
analyze the patent output. Considering the characteristics of patent data (e.g., count data and very
much skewed distribution), such methods have strengths to capture the effects of the variables.
However, many scholars are accustomed to OLS and believe that OLS also has strengths, such as
the interpretation of the results.
Table A2 provides the results of multiple regressions on the same models. For the direct
effects of competition and cooperation variables (Tables A3, A4, A5a, A5b, A5c, and A5d), the
results are consistent in terms of statistical significance with the results of negative binomial
regression. However, differences were found in the interaction effects across different methods.
First, the effects of interaction terms between competition and cooperation are different. While
interaction terms in negative binomial regression are insignificant, those in OLS regression are
positive and significant except for Mktcomp_Typecoop. Second, the moderating effects of coopetition
experience in the relationship between coopetition and innovation are different. While the three way
interaction terms (coopetition experience x Market_comp x cooperation (either Type_coop or
Tie_coop)) in negative binomial regression are insignificant, those in OLS regression are
positive and significant. Only a three way interaction term (coopetition experience x Tech_comp
x Type_coop) is consistent across methods.
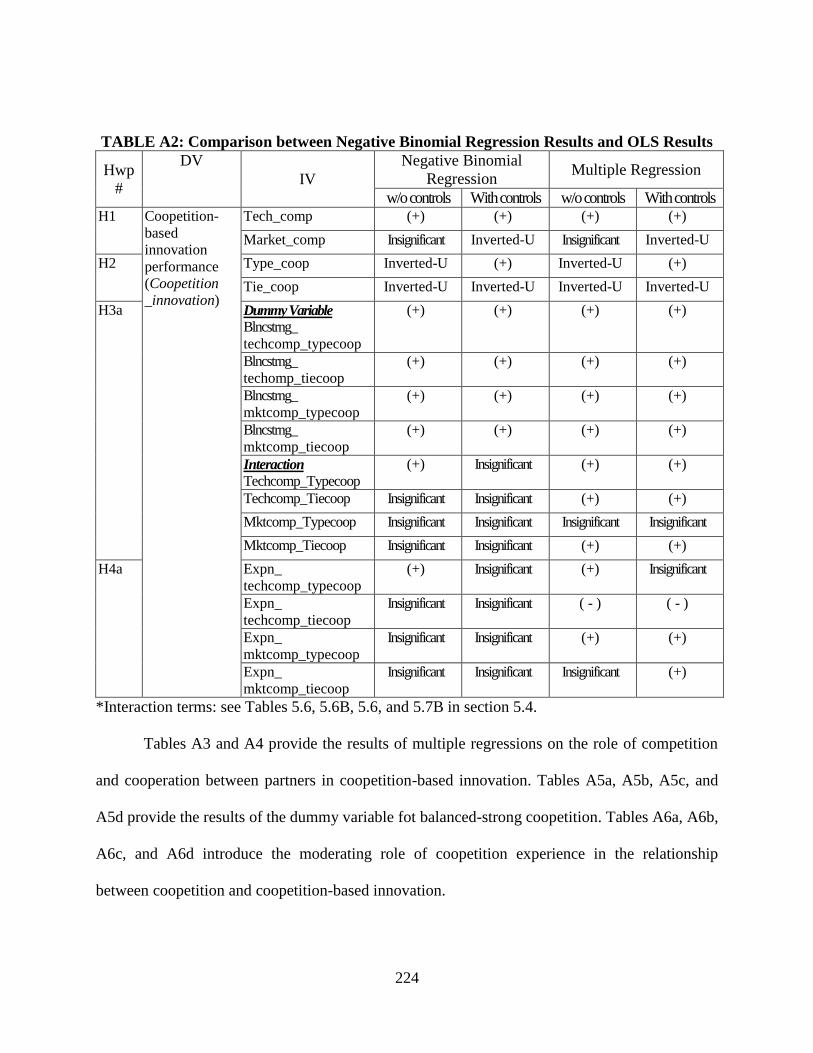
224
TABLE A2: Comparison between Negative Binomial Regression Results and OLS Results
Hwp
#
DV
IV
Negative Binomial
Regression Multiple Regression
w/o controls With controls w/o controls With controls H1 Coopetition-
based
innovation
performance
(Coopetition
_innovation)
Tech_comp (+) (+) (+) (+)
Market_comp Insignificant Inverted-U Insignificant Inverted-U
H2 Type_coop Inverted-U (+) Inverted-U (+)
Tie_coop Inverted-U Inverted-U Inverted-U Inverted-U
H3a Dummy Variable
Blncstrng_
techcomp_typecoop
(+) (+) (+) (+)
Blncstrng_
techomp_tiecoop
(+) (+) (+) (+)
Blncstrng_
mktcomp_typecoop
(+) (+) (+) (+)
Blncstrng_
mktcomp_tiecoop
(+) (+) (+) (+)
Interaction
Techcomp_Typecoop
(+) Insignificant (+) (+)
Techcomp_Tiecoop Insignificant Insignificant (+) (+)
Mktcomp_Typecoop Insignificant Insignificant Insignificant Insignificant
Mktcomp_Tiecoop Insignificant Insignificant (+) (+)
H4a Expn_
techcomp_typecoop
(+) Insignificant (+) Insignificant
Expn_
techcomp_tiecoop
Insignificant Insignificant ( - ) ( - )
Expn_
mktcomp_typecoop
Insignificant Insignificant (+) (+)
Expn_
mktcomp_tiecoop
Insignificant Insignificant Insignificant (+)
*Interaction terms: see Tables 5.6, 5.6B, 5.6, and 5.7B in section 5.4.
Tables A3 and A4 provide the results of multiple regressions on the role of competition
and cooperation between partners in coopetition-based innovation. Tables A5a, A5b, A5c, and
A5d provide the results of the dummy variable fot balanced-strong coopetition. Tables A6a, A6b,
A6c, and A6d introduce the moderating role of coopetition experience in the relationship
between coopetition and coopetition-based innovation.
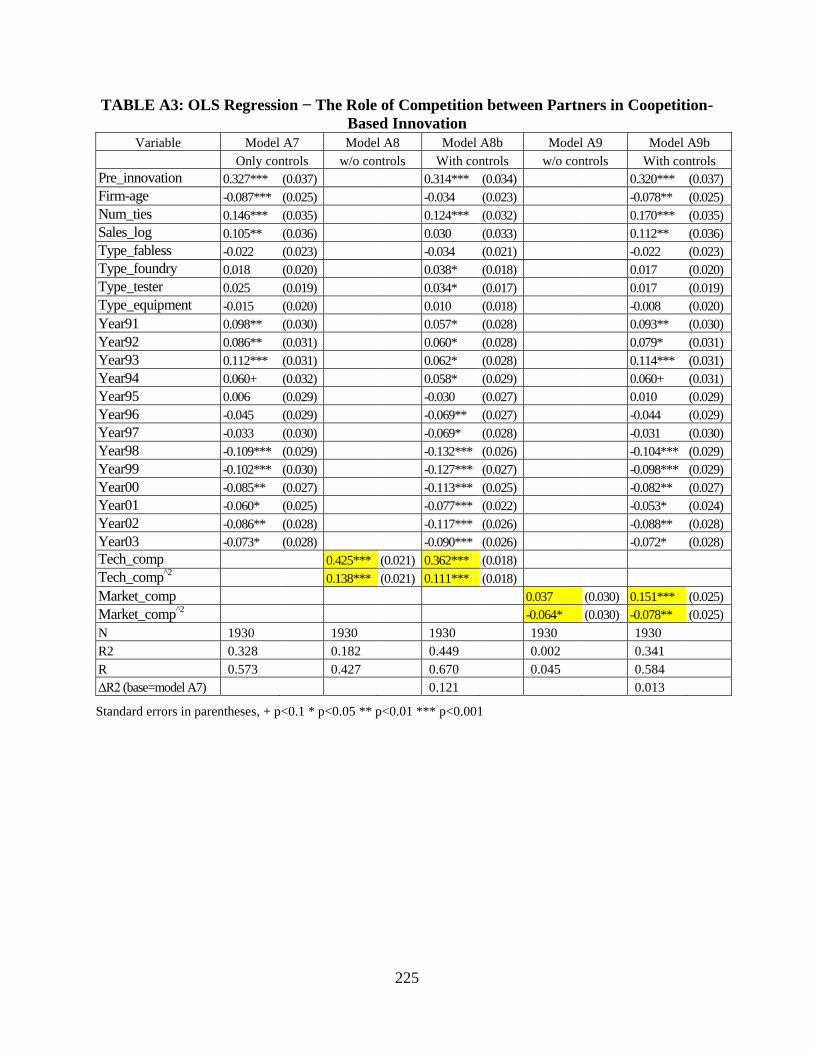
225
TABLE A3: OLS Regression − The Role of Competition between Partners in Coopetition-
Based Innovation
Variable Model A7 Model A8 Model A8b Model A9 Model A9b
Only controls w/o controls With controls w/o controls With controls
Pre_innovation 0.327*** (0.037) 0.314*** (0.034) 0.320*** (0.037)
Firm-age -0.087*** (0.025) -0.034 (0.023) -0.078** (0.025)
Num_ties 0.146*** (0.035) 0.124*** (0.032) 0.170*** (0.035)
Sales_log 0.105** (0.036) 0.030 (0.033) 0.112** (0.036)
Type_fabless -0.022 (0.023) -0.034 (0.021) -0.022 (0.023)
Type_foundry 0.018 (0.020) 0.038* (0.018) 0.017 (0.020)
Type_tester 0.025 (0.019) 0.034* (0.017) 0.017 (0.019)
Type_equipment -0.015 (0.020) 0.010 (0.018) -0.008 (0.020)
Year91 0.098** (0.030) 0.057* (0.028) 0.093** (0.030)
Year92 0.086** (0.031) 0.060* (0.028) 0.079* (0.031)
Year93 0.112*** (0.031) 0.062* (0.028) 0.114*** (0.031)
Year94 0.060+ (0.032) 0.058* (0.029) 0.060+ (0.031)
Year95 0.006 (0.029) -0.030 (0.027) 0.010 (0.029)
Year96 -0.045 (0.029) -0.069** (0.027) -0.044 (0.029)
Year97 -0.033 (0.030) -0.069* (0.028) -0.031 (0.030)
Year98 -0.109*** (0.029) -0.132*** (0.026) -0.104*** (0.029)
Year99 -0.102*** (0.030) -0.127*** (0.027) -0.098*** (0.029)
Year00 -0.085** (0.027) -0.113*** (0.025) -0.082** (0.027)
Year01 -0.060* (0.025) -0.077*** (0.022) -0.053* (0.024)
Year02 -0.086** (0.028) -0.117*** (0.026) -0.088** (0.028)
Year03 -0.073* (0.028) -0.090*** (0.026) -0.072* (0.028)
Tech_comp 0.425*** (0.021) 0.362*** (0.018)
Tech_comp^2
0.138*** (0.021) 0.111*** (0.018)
Market_comp 0.037 (0.030) 0.151*** (0.025)
Market_comp^2
-0.064* (0.030) -0.078** (0.025)
N 1930 1930 1930 1930 1930
R2 0.328 0.182 0.449 0.002 0.341
R 0.573 0.427 0.670 0.045 0.584
ΔR2 (base=model A7) 0.121 0.013
Standard errors in parentheses, + p<0.1 * p<0.05 ** p<0.01 *** p<0.001
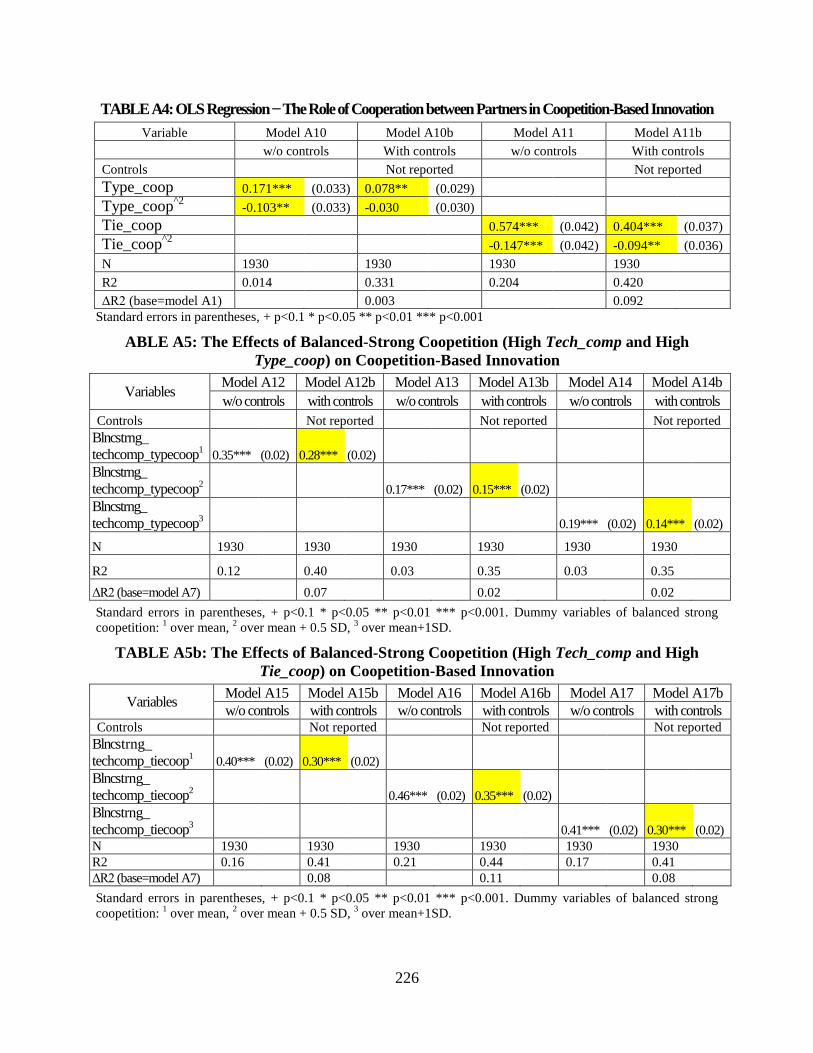
226
TABLE A4: OLS Regression − The Role of Cooperation between Partners in Coopetition-Based Innovation
Variable Model A10 Model A10b Model A11 Model A11b
w/o controls With controls w/o controls With controls
Controls
Not reported
Not reported
Type_coop 0.171*** (0.033) 0.078** (0.029)
Type_coop^2
-0.103** (0.033) -0.030 (0.030)
Tie_coop 0.574*** (0.042) 0.404*** (0.037)
Tie_coop^2
-0.147*** (0.042) -0.094** (0.036)
N 1930
1930 1930
1930
R2 0.014
0.331 0.204
0.420
ΔR2 (base=model A1)
0.003
0.092
Standard errors in parentheses, + p<0.1 * p<0.05 ** p<0.01 *** p<0.001
ABLE A5: The Effects of Balanced-Strong Coopetition (High Tech_comp and High
Type_coop) on Coopetition-Based Innovation
Variables Model A12 Model A12b Model A13 Model A13b Model A14 Model A14b
w/o controls with controls w/o controls with controls w/o controls with controls
Controls
Not reported
Not reported
Not reported
Blncstrng_
techcomp_typecoop1 0.35*** (0.02) 0.28*** (0.02)
Blncstrng_
techcomp_typecoop2
0.17*** (0.02) 0.15*** (0.02)
Blncstrng_
techcomp_typecoop3
0.19*** (0.02) 0.14*** (0.02)
N 1930
1930
1930
1930
1930
1930
R2 0.12
0.40
0.03
0.35
0.03
0.35
ΔR2 (base=model A7)
0.07
0.02
0.02
Standard errors in parentheses, + p<0.1 * p<0.05 ** p<0.01 *** p<0.001. Dummy variables of balanced strong
coopetition: 1 over mean,
2 over mean + 0.5 SD,
3 over mean+1SD.
TABLE A5b: The Effects of Balanced-Strong Coopetition (High Tech_comp and High
Tie_coop) on Coopetition-Based Innovation
Variables Model A15 Model A15b Model A16 Model A16b Model A17 Model A17b
w/o controls with controls w/o controls with controls w/o controls with controls Controls
Not reported
Not reported
Not reported
Blncstrng_
techcomp_tiecoop1 0.40*** (0.02) 0.30*** (0.02)
Blncstrng_
techcomp_tiecoop2
0.46*** (0.02) 0.35*** (0.02)
Blncstrng_
techcomp_tiecoop3
0.41*** (0.02) 0.30*** (0.02)
N 1930
1930
1930
1930
1930
1930
R2 0.16
0.41
0.21
0.44
0.17
0.41
ΔR2 (base=model A7)
0.08
0.11
0.08
Standard errors in parentheses, + p<0.1 * p<0.05 ** p<0.01 *** p<0.001. Dummy variables of balanced strong
coopetition: 1 over mean,
2 over mean + 0.5 SD,
3 over mean+1SD.
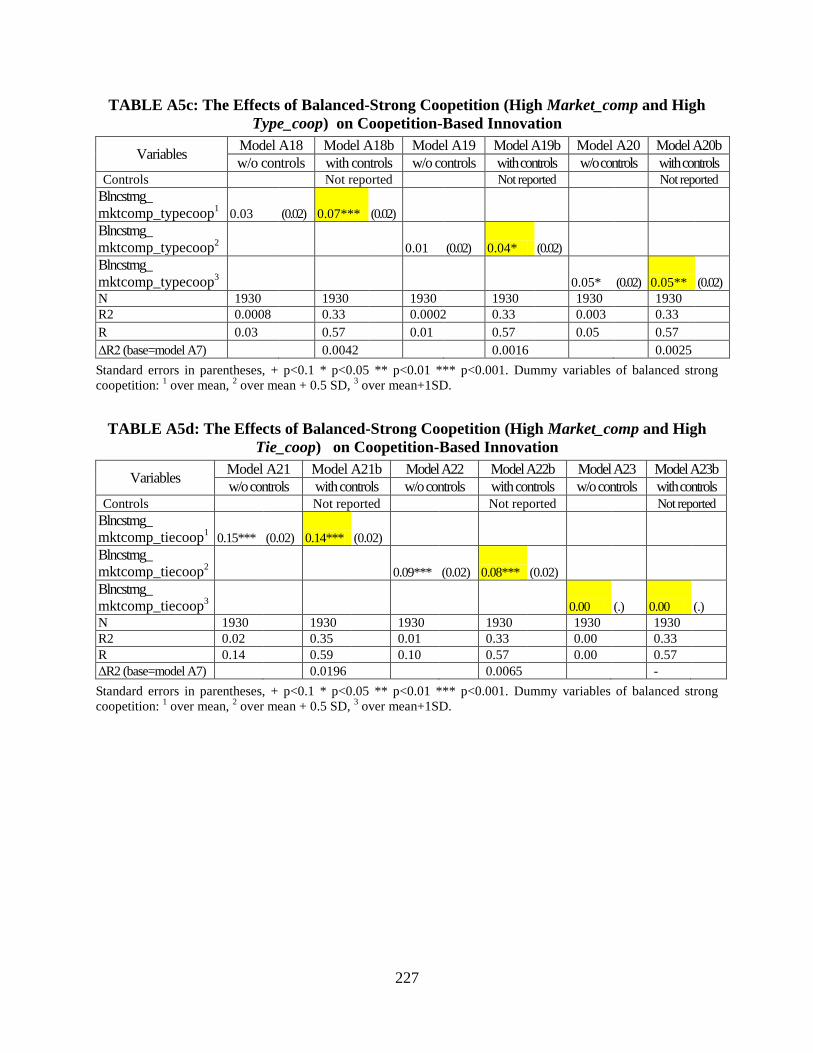
227
TABLE A5c: The Effects of Balanced-Strong Coopetition (High Market_comp and High
Type_coop) on Coopetition-Based Innovation
Variables Model A18 Model A18b Model A19 Model A19b Model A20 Model A20b
w/o controls with controls w/o controls with controls w/o controls with controls Controls
Not reported
Not reported
Not reported
Blncstrng_
mktcomp_typecoop1 0.03 (0.02) 0.07*** (0.02)
Blncstrng_
mktcomp_typecoop2
0.01 (0.02) 0.04* (0.02)
Blncstrng_
mktcomp_typecoop3
0.05* (0.02) 0.05** (0.02)
N 1930
1930
1930
1930
1930
1930
R2 0.0008
0.33
0.0002 0.33
0.003
0.33
R 0.03
0.57
0.01
0.57
0.05
0.57
ΔR2 (base=model A7)
0.0042
0.0016
0.0025
Standard errors in parentheses, + p<0.1 * p<0.05 ** p<0.01 *** p<0.001. Dummy variables of balanced strong
coopetition: 1 over mean,
2 over mean + 0.5 SD,
3 over mean+1SD.
TABLE A5d: The Effects of Balanced-Strong Coopetition (High Market_comp and High
Tie_coop) on Coopetition-Based Innovation
Variables Model A21 Model A21b Model A22 Model A22b Model A23 Model A23b
w/o controls with controls w/o controls with controls w/o controls with controls Controls
Not reported
Not reported
Not reported
Blncstrng_
mktcomp_tiecoop1 0.15*** (0.02) 0.14*** (0.02)
Blncstrng_
mktcomp_tiecoop2
0.09*** (0.02) 0.08*** (0.02)
Blncstrng_
mktcomp_tiecoop3
0.00 (.) 0.00 (.)
N 1930
1930
1930
1930
1930
1930
R2 0.02
0.35
0.01
0.33
0.00
0.33
R 0.14
0.59
0.10
0.57
0.00
0.57
ΔR2 (base=model A7)
0.0196
0.0065
-
Standard errors in parentheses, + p<0.1 * p<0.05 ** p<0.01 *** p<0.001. Dummy variables of balanced strong
coopetition: 1 over mean,
2 over mean + 0.5 SD,
3 over mean+1SD.
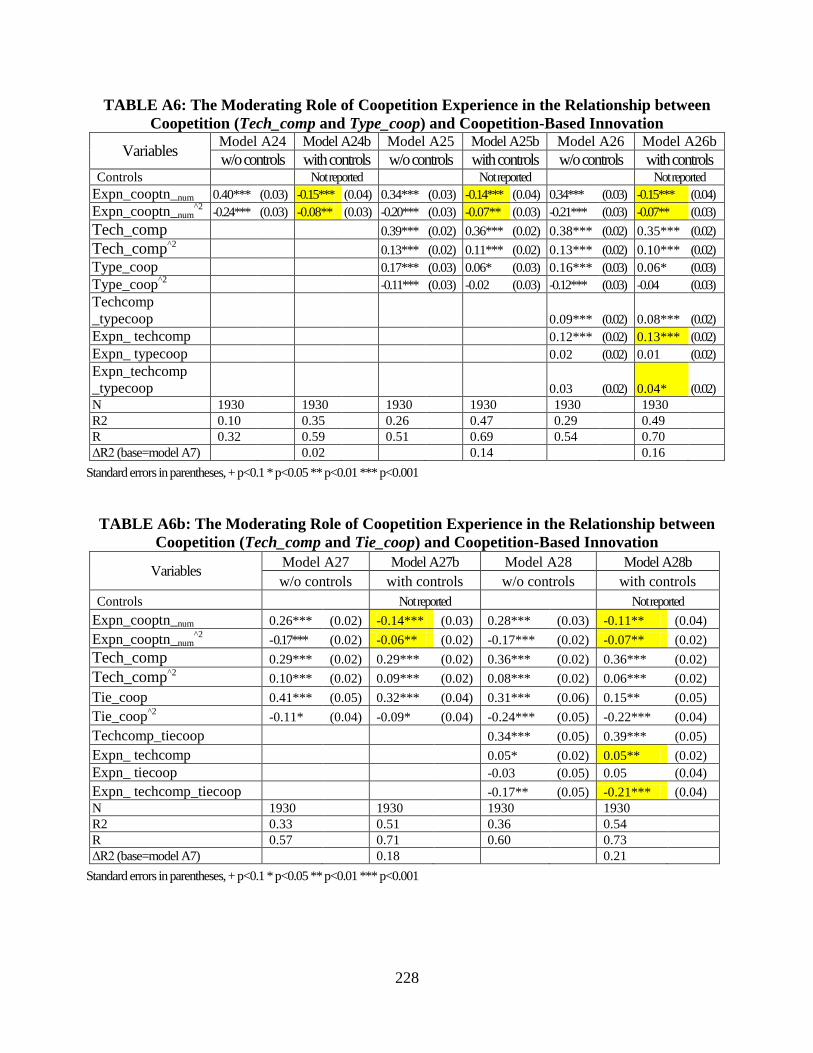
228
TABLE A6: The Moderating Role of Coopetition Experience in the Relationship between
Coopetition (Tech_comp and Type_coop) and Coopetition-Based Innovation
Variables Model A24 Model A24b Model A25 Model A25b Model A26 Model A26b
w/o controls with controls w/o controls with controls w/o controls with controls Controls
Not reported
Not reported
Not reported
Expn_cooptn_num 0.40*** (0.03) -0.15*** (0.04) 0.34*** (0.03) -0.14*** (0.04) 0.34*** (0.03) -0.15*** (0.04)
Expn_cooptn_num^2
-0.24*** (0.03) -0.08** (0.03) -0.20*** (0.03) -0.07** (0.03) -0.21*** (0.03) -0.07** (0.03)
Tech_comp
0.39*** (0.02) 0.36*** (0.02) 0.38*** (0.02) 0.35*** (0.02)
Tech_comp^2
0.13*** (0.02) 0.11*** (0.02) 0.13*** (0.02) 0.10*** (0.02)
Type_coop
0.17*** (0.03) 0.06* (0.03) 0.16*** (0.03) 0.06* (0.03)
Type_coop^2
-0.11*** (0.03) -0.02 (0.03) -0.12*** (0.03) -0.04 (0.03)
Techcomp
_typecoop
0.09*** (0.02) 0.08*** (0.02)
Expn_ techcomp
0.12*** (0.02) 0.13*** (0.02)
Expn_ typecoop
0.02 (0.02) 0.01 (0.02)
Expn_techcomp
_typecoop
0.03 (0.02) 0.04* (0.02)
N 1930
1930
1930
1930
1930
1930
R2 0.10
0.35
0.26
0.47
0.29
0.49
R 0.32
0.59
0.51
0.69
0.54
0.70
ΔR2 (base=model A7)
0.02
0.14
0.16
Standard errors in parentheses, + p<0.1 * p<0.05 ** p<0.01 *** p<0.001
TABLE A6b: The Moderating Role of Coopetition Experience in the Relationship between
Coopetition (Tech_comp and Tie_coop) and Coopetition-Based Innovation
Variables Model A27 Model A27b Model A28 Model A28b
w/o controls with controls w/o controls with controls
Controls
Not reported
Not reported
Expn_cooptn_num 0.26*** (0.02) -0.14*** (0.03) 0.28*** (0.03) -0.11** (0.04)
Expn_cooptn_num^2
-0.17*** (0.02) -0.06** (0.02) -0.17*** (0.02) -0.07** (0.02)
Tech_comp 0.29*** (0.02) 0.29*** (0.02) 0.36*** (0.02) 0.36*** (0.02)
Tech_comp^2 0.10*** (0.02) 0.09*** (0.02) 0.08*** (0.02) 0.06*** (0.02)
Tie_coop 0.41*** (0.05) 0.32*** (0.04) 0.31*** (0.06) 0.15** (0.05)
Tie_coop^2
-0.11* (0.04) -0.09* (0.04) -0.24*** (0.05) -0.22*** (0.04)
Techcomp_tiecoop
0.34*** (0.05) 0.39*** (0.05)
Expn_ techcomp
0.05* (0.02) 0.05** (0.02)
Expn_ tiecoop
-0.03 (0.05) 0.05 (0.04)
Expn_ techcomp_tiecoop
-0.17** (0.05) -0.21*** (0.04)
N 1930
1930
1930
1930
R2 0.33
0.51
0.36
0.54
R 0.57
0.71
0.60
0.73
ΔR2 (base=model A7)
0.18
0.21
Standard errors in parentheses, + p<0.1 * p<0.05 ** p<0.01 *** p<0.001
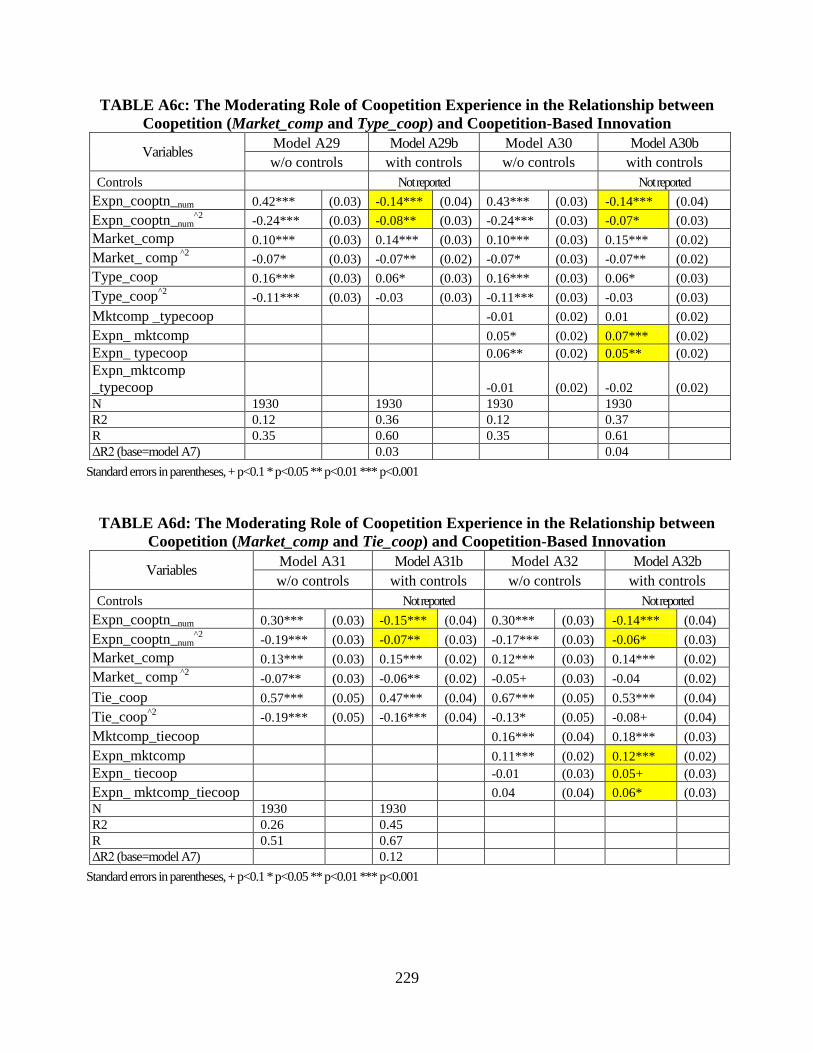
229
TABLE A6c: The Moderating Role of Coopetition Experience in the Relationship between
Coopetition (Market_comp and Type_coop) and Coopetition-Based Innovation
Variables Model A29 Model A29b Model A30 Model A30b
w/o controls with controls w/o controls with controls
Controls
Not reported
Not reported
Expn_cooptn_num 0.42*** (0.03) -0.14*** (0.04) 0.43*** (0.03) -0.14*** (0.04)
Expn_cooptn_num^2
-0.24*** (0.03) -0.08** (0.03) -0.24*** (0.03) -0.07* (0.03)
Market_comp 0.10*** (0.03) 0.14*** (0.03) 0.10*** (0.03) 0.15*** (0.02)
Market_ comp ^2
-0.07* (0.03) -0.07** (0.02) -0.07* (0.03) -0.07** (0.02)
Type_coop 0.16*** (0.03) 0.06* (0.03) 0.16*** (0.03) 0.06* (0.03)
Type_coop^2
-0.11*** (0.03) -0.03 (0.03) -0.11*** (0.03) -0.03 (0.03)
Mktcomp _typecoop
-0.01 (0.02) 0.01 (0.02)
Expn_ mktcomp
0.05* (0.02) 0.07*** (0.02)
Expn_ typecoop
0.06** (0.02) 0.05** (0.02)
Expn_mktcomp
_typecoop
-0.01 (0.02) -0.02 (0.02)
N 1930
1930
1930
1930
R2 0.12
0.36
0.12
0.37
R 0.35
0.60
0.35
0.61
ΔR2 (base=model A7)
0.03
0.04
Standard errors in parentheses, + p<0.1 * p<0.05 ** p<0.01 *** p<0.001
TABLE A6d: The Moderating Role of Coopetition Experience in the Relationship between
Coopetition (Market_comp and Tie_coop) and Coopetition-Based Innovation
Variables Model A31 Model A31b Model A32 Model A32b
w/o controls with controls w/o controls with controls
Controls
Not reported
Not reported
Expn_cooptn_num 0.30*** (0.03) -0.15*** (0.04) 0.30*** (0.03) -0.14*** (0.04)
Expn_cooptn_num^2
-0.19*** (0.03) -0.07** (0.03) -0.17*** (0.03) -0.06* (0.03)
Market_comp 0.13*** (0.03) 0.15*** (0.02) 0.12*** (0.03) 0.14*** (0.02)
Market_ comp ^2
-0.07** (0.03) -0.06** (0.02) -0.05+ (0.03) -0.04 (0.02)
Tie_coop 0.57*** (0.05) 0.47*** (0.04) 0.67*** (0.05) 0.53*** (0.04)
Tie_coop^2
-0.19*** (0.05) -0.16*** (0.04) -0.13* (0.05) -0.08+ (0.04)
Mktcomp_tiecoop
0.16*** (0.04) 0.18*** (0.03)
Expn_mktcomp
0.11*** (0.02) 0.12*** (0.02)
Expn_ tiecoop
-0.01 (0.03) 0.05+ (0.03)
Expn_ mktcomp_tiecoop
0.04 (0.04) 0.06* (0.03)
N 1930
1930
R2 0.26
0.45
R 0.51
0.67
ΔR2 (base=model A7)
0.12
Standard errors in parentheses, + p<0.1 * p<0.05 ** p<0.01 *** p<0.001
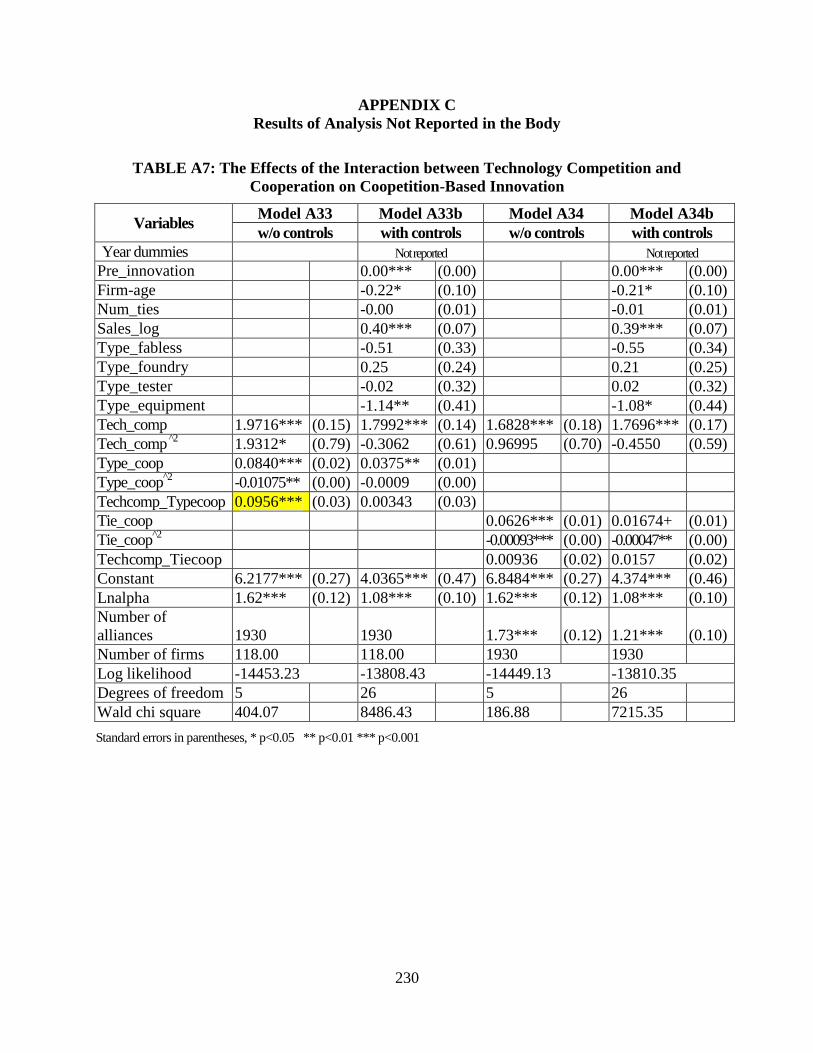
230
APPENDIX C
Results of Analysis Not Reported in the Body
TABLE A7: The Effects of the Interaction between Technology Competition and
Cooperation on Coopetition-Based Innovation
Variables Model A33 Model A33b Model A34 Model A34b
w/o controls with controls w/o controls with controls
Year dummies
Not reported
Not reported
Pre_innovation 0.00*** (0.00) 0.00*** (0.00)
Firm-age -0.22* (0.10) -0.21* (0.10)
Num_ties -0.00 (0.01) -0.01 (0.01)
Sales_log 0.40*** (0.07) 0.39*** (0.07)
Type_fabless -0.51 (0.33) -0.55 (0.34)
Type_foundry 0.25 (0.24) 0.21 (0.25)
Type_tester -0.02 (0.32) 0.02 (0.32)
Type_equipment -1.14** (0.41) -1.08* (0.44)
Tech_comp 1.9716*** (0.15) 1.7992*** (0.14) 1.6828*** (0.18) 1.7696*** (0.17)
Tech_comp ̂ 2
1.9312* (0.79) -0.3062 (0.61) 0.96995 (0.70) -0.4550 (0.59)
Type_coop 0.0840*** (0.02) 0.0375** (0.01)
Type_coop^2
-0.01075** (0.00) -0.0009 (0.00)
Techcomp_Typecoop 0.0956*** (0.03) 0.00343 (0.03)
Tie_coop
0.0626*** (0.01) 0.01674+ (0.01)
Tie_coop^2
-0.00093*** (0.00) -0.00047** (0.00)
Techcomp_Tiecoop
0.00936 (0.02) 0.0157 (0.02)
Constant 6.2177*** (0.27) 4.0365*** (0.47) 6.8484*** (0.27) 4.374*** (0.46)
Lnalpha 1.62*** (0.12) 1.08*** (0.10) 1.62*** (0.12) 1.08*** (0.10)
Number of
alliances 1930
1930
1.73*** (0.12) 1.21*** (0.10)
Number of firms 118.00
118.00
1930
1930
Log likelihood -14453.23 -13808.43 -14449.13 -13810.35
Degrees of freedom 5 26 5 26
Wald chi square 404.07
8486.43 186.88
7215.35
Standard errors in parentheses, * p<0.05 ** p<0.01 *** p<0.001
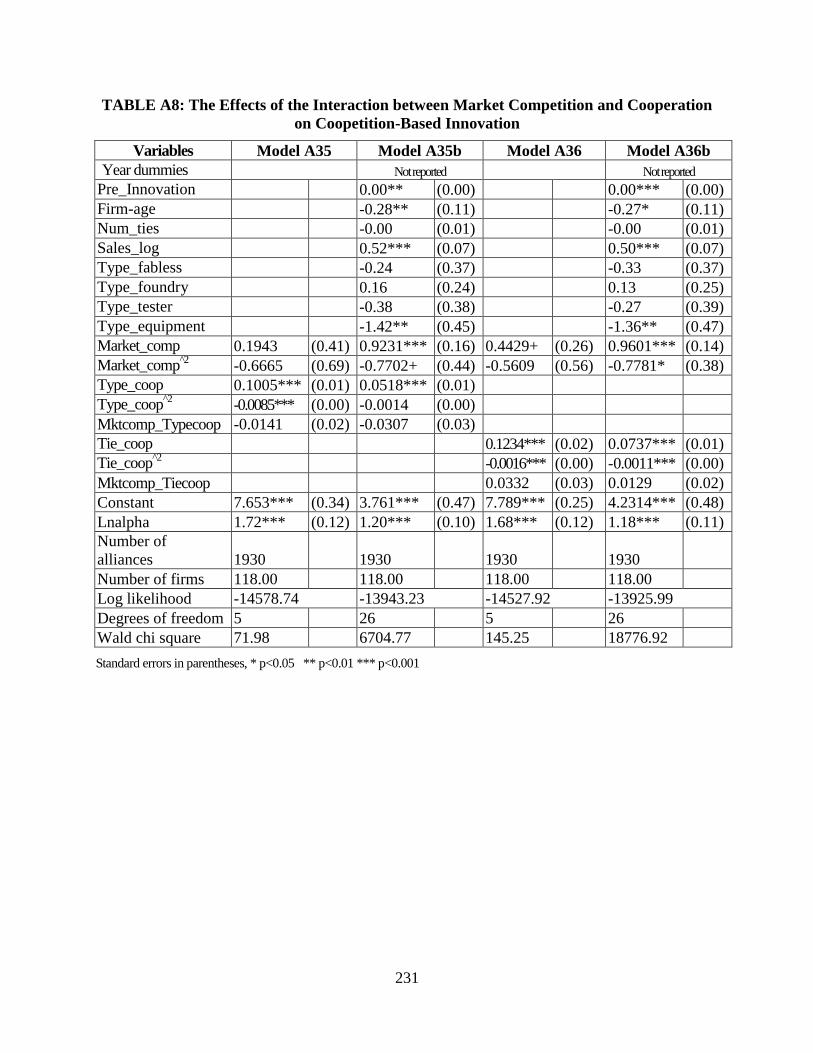
231
TABLE A8: The Effects of the Interaction between Market Competition and Cooperation
on Coopetition-Based Innovation
Variables Model A35 Model A35b Model A36 Model A36b
Year dummies
Not reported
Not reported
Pre_Innovation 0.00** (0.00) 0.00*** (0.00)
Firm-age -0.28** (0.11) -0.27* (0.11)
Num_ties -0.00 (0.01) -0.00 (0.01)
Sales_log 0.52*** (0.07) 0.50*** (0.07)
Type_fabless -0.24 (0.37) -0.33 (0.37)
Type_foundry 0.16 (0.24) 0.13 (0.25)
Type_tester -0.38 (0.38) -0.27 (0.39)
Type_equipment -1.42** (0.45) -1.36** (0.47)
Market_comp 0.1943 (0.41) 0.9231*** (0.16) 0.4429+ (0.26) 0.9601*** (0.14)
Market_comp2̂ -0.6665 (0.69) -0.7702+ (0.44) -0.5609 (0.56) -0.7781* (0.38)
Type_coop 0.1005*** (0.01) 0.0518*** (0.01)
Type_coop^2
-0.0085*** (0.00) -0.0014 (0.00)
Mktcomp_Typecoop -0.0141 (0.02) -0.0307 (0.03)
Tie_coop
0.1234*** (0.02) 0.0737*** (0.01)
Tie_coop^2
-0.0016*** (0.00) -0.0011*** (0.00)
Mktcomp_Tiecoop
0.0332 (0.03) 0.0129 (0.02)
Constant 7.653*** (0.34) 3.761*** (0.47) 7.789*** (0.25) 4.2314*** (0.48)
Lnalpha 1.72*** (0.12) 1.20*** (0.10) 1.68*** (0.12) 1.18*** (0.11)
Number of
alliances 1930
1930
1930
1930
Number of firms 118.00
118.00
118.00
118.00
Log likelihood -14578.74 -13943.23 -14527.92 -13925.99
Degrees of freedom 5 26 5 26
Wald chi square 71.98
6704.77 145.25
18776.92
Standard errors in parentheses, * p<0.05 ** p<0.01 *** p<0.001
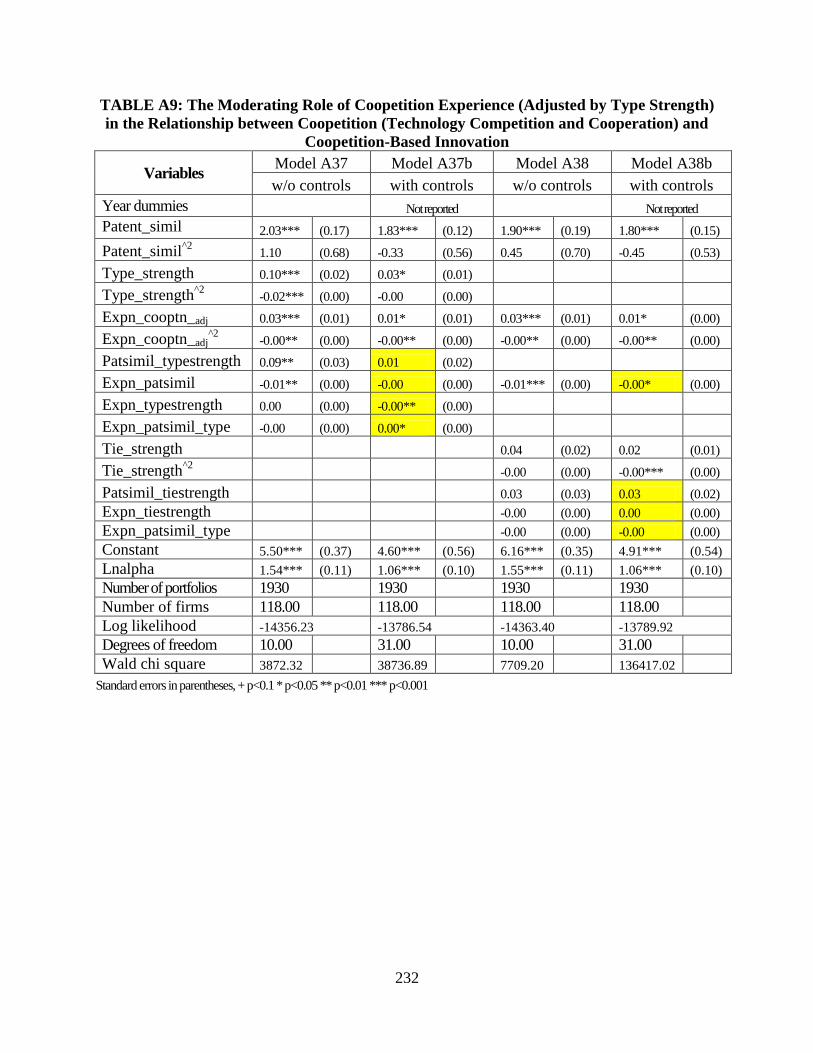
232
TABLE A9: The Moderating Role of Coopetition Experience (Adjusted by Type Strength)
in the Relationship between Coopetition (Technology Competition and Cooperation) and
Coopetition-Based Innovation
Variables Model A37 Model A37b Model A38 Model A38b
w/o controls with controls w/o controls with controls
Year dummies
Not reported
Not reported
Patent_simil 2.03*** (0.17) 1.83*** (0.12) 1.90*** (0.19) 1.80*** (0.15)
Patent_simil^2
1.10 (0.68) -0.33 (0.56) 0.45 (0.70) -0.45 (0.53)
Type_strength 0.10*** (0.02) 0.03* (0.01)
Type_strength^2
-0.02*** (0.00) -0.00 (0.00)
Expn_cooptn_adj 0.03*** (0.01) 0.01* (0.01) 0.03*** (0.01) 0.01* (0.00)
Expn_cooptn_adj^2
-0.00** (0.00) -0.00** (0.00) -0.00** (0.00) -0.00** (0.00)
Patsimil_typestrength 0.09** (0.03) 0.01 (0.02)
Expn_patsimil -0.01** (0.00) -0.00 (0.00) -0.01*** (0.00) -0.00* (0.00)
Expn_typestrength 0.00 (0.00) -0.00** (0.00)
Expn_patsimil_type -0.00 (0.00) 0.00* (0.00)
Tie_strength
0.04 (0.02) 0.02 (0.01)
Tie_strength^2
-0.00 (0.00) -0.00*** (0.00)
Patsimil_tiestrength
0.03 (0.03) 0.03 (0.02)
Expn_tiestrength
-0.00 (0.00) 0.00 (0.00)
Expn_patsimil_type
-0.00 (0.00) -0.00 (0.00)
Constant 5.50*** (0.37) 4.60*** (0.56) 6.16*** (0.35) 4.91*** (0.54)
Lnalpha 1.54*** (0.11) 1.06*** (0.10) 1.55*** (0.11) 1.06*** (0.10)
Number of portfolios 1930
1930
1930
1930
Number of firms 118.00
118.00
118.00
118.00
Log likelihood -14356.23 -13786.54 -14363.40 -13789.92
Degrees of freedom 10.00
31.00
10.00
31.00
Wald chi square 3872.32
38736.89
7709.20
136417.02
Standard errors in parentheses, + p<0.1 * p<0.05 ** p<0.01 *** p<0.001
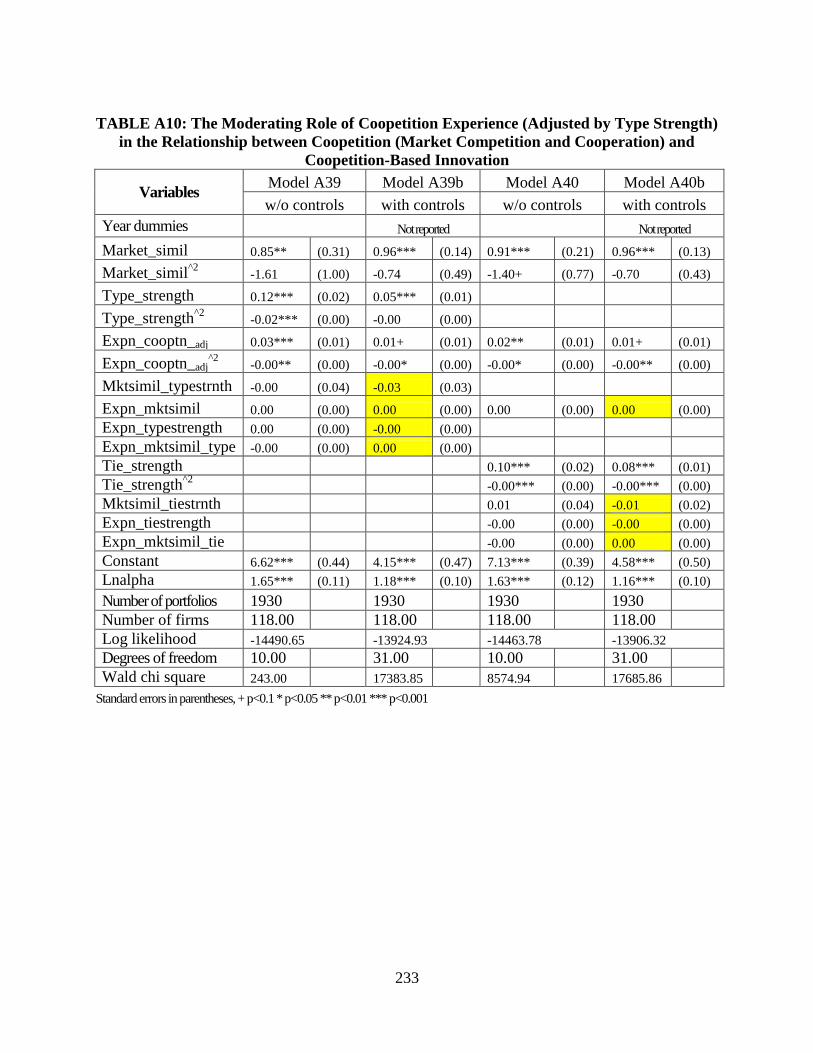
233
TABLE A10: The Moderating Role of Coopetition Experience (Adjusted by Type Strength)
in the Relationship between Coopetition (Market Competition and Cooperation) and
Coopetition-Based Innovation
Variables Model A39 Model A39b Model A40 Model A40b
w/o controls with controls w/o controls with controls
Year dummies
Not reported
Not reported
Market_simil 0.85** (0.31) 0.96*** (0.14) 0.91*** (0.21) 0.96*** (0.13)
Market_simil^2
-1.61 (1.00) -0.74 (0.49) -1.40+ (0.77) -0.70 (0.43)
Type_strength 0.12*** (0.02) 0.05*** (0.01)
Type_strength^2
-0.02*** (0.00) -0.00 (0.00)
Expn_cooptn_adj 0.03*** (0.01) 0.01+ (0.01) 0.02** (0.01) 0.01+ (0.01)
Expn_cooptn_adj^2
-0.00** (0.00) -0.00* (0.00) -0.00* (0.00) -0.00** (0.00)
Mktsimil_typestrnth -0.00 (0.04) -0.03 (0.03)
Expn_mktsimil 0.00 (0.00) 0.00 (0.00) 0.00 (0.00) 0.00 (0.00)
Expn_typestrength 0.00 (0.00) -0.00 (0.00)
Expn_mktsimil_type -0.00 (0.00) 0.00 (0.00)
Tie_strength
0.10*** (0.02) 0.08*** (0.01)
Tie_strength^2
-0.00*** (0.00) -0.00*** (0.00)
Mktsimil_tiestrnth
0.01 (0.04) -0.01 (0.02)
Expn_tiestrength
-0.00 (0.00) -0.00 (0.00)
Expn_mktsimil_tie
-0.00 (0.00) 0.00 (0.00)
Constant 6.62*** (0.44) 4.15*** (0.47) 7.13*** (0.39) 4.58*** (0.50)
Lnalpha 1.65*** (0.11) 1.18*** (0.10) 1.63*** (0.12) 1.16*** (0.10)
Number of portfolios 1930
1930
1930
1930
Number of firms 118.00
118.00
118.00
118.00
Log likelihood -14490.65 -13924.93 -14463.78 -13906.32
Degrees of freedom 10.00
31.00
10.00
31.00
Wald chi square 243.00
17383.85
8574.94
17685.86
Standard errors in parentheses, + p<0.1 * p<0.05 ** p<0.01 *** p<0.001
234
APPENDIX D
Results of Samples with All Major Semiconductor Firms
(incl. not classified as SIC 3674)
As discussed in section 4.2, one of six types of semiconductor firms is the diversified
firms. For example, Samsung Electronics (2nd
ranked semiconductor firm) and Toshiba (4th
ranked semiconductor firm) are diversified firms and their primary SIC codes are not SIC3674
(semiconductor industry). Even though industry reports include all semiconductor firms,
academic research has focused on SIC 3674 to maintain consistency and reduce possible noises.
In this study, at first I included all major semiconductor firms, but I also found noise and
reported samples under SIC 3674. Researchers in future research may face the same dilemma
(i.e., whether to include all major semiconductor firms or only firms classified under SIC 3674).
Thus, I report the sample characteristics of different samples and the results of samples with all
major semiconductor firms.
Table A11 reports the sample characteristics (such as mean, standard deviation, min, and
max) of diversified semiconductor firms (not classified as SIC 3674) and total semiconductor
firms (SIC 3674 and those classified as other than SIC 3674). Interestingly, samples that are not
under SIC 3674 have a higher average Tech_comp but a lower average Market_tech than the
average samples under SIC 3674. More distinct differences are from Tie_coop and Expn_coopn.
Samples that are not classified SIC3674 have a much greater average and greater maximum
value than SIC 3674 samples. Samples that are not part of SIC 3674 have much less coopetition
experience (Expn_coopn) than samples that are under SIC 3674.
Table A12 reports the results of different samples with 1) SIC 3674 (number of samples:
1930), 2) not SIC 3674 (number of samples: 1476), and total semiconductor firms (number of
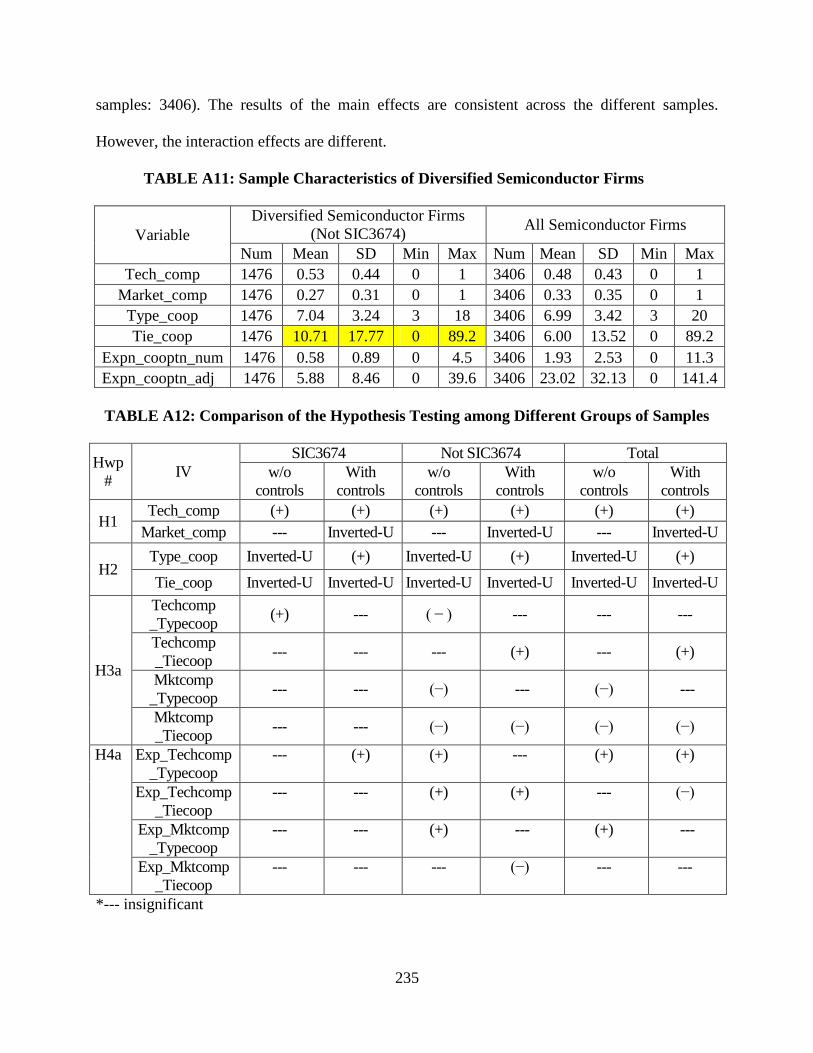
235
samples: 3406). The results of the main effects are consistent across the different samples.
However, the interaction effects are different.
TABLE A11: Sample Characteristics of Diversified Semiconductor Firms
Variable
Diversified Semiconductor Firms
(Not SIC3674) All Semiconductor Firms
Num Mean SD Min Max Num Mean SD Min Max
Tech_comp 1476 0.53 0.44 0 1 3406 0.48 0.43 0 1
Market_comp 1476 0.27 0.31 0 1 3406 0.33 0.35 0 1
Type_coop 1476 7.04 3.24 3 18 3406 6.99 3.42 3 20
Tie_coop 1476 10.71 17.77 0 89.2 3406 6.00 13.52 0 89.2
Expn_cooptn_num 1476 0.58 0.89 0 4.5 3406 1.93 2.53 0 11.3
Expn_cooptn_adj 1476 5.88 8.46 0 39.6 3406 23.02 32.13 0 141.4
TABLE A12: Comparison of the Hypothesis Testing among Different Groups of Samples
Hwp
# IV
SIC3674 Not SIC3674 Total
w/o
controls
With
controls
w/o
controls
With
controls
w/o
controls
With
controls
H1 Tech_comp (+) (+) (+) (+) (+) (+)
Market_comp --- Inverted-U --- Inverted-U --- Inverted-U
H2 Type_coop Inverted-U (+) Inverted-U (+) Inverted-U (+)
Tie_coop Inverted-U Inverted-U Inverted-U Inverted-U Inverted-U Inverted-U
H3a
Techcomp
_Typecoop (+) --- ( − ) --- --- ---
Techcomp
_Tiecoop --- --- --- (+) --- (+)
Mktcomp
_Typecoop --- --- (−) --- (−) ---
Mktcomp
_Tiecoop --- --- (−) (−) (−) (−)
H4a Exp_Techcomp
_Typecoop
--- (+) (+) --- (+) (+)
Exp_Techcomp
_Tiecoop
--- --- (+) (+) --- (−)
Exp_Mktcomp
_Typecoop
--- --- (+) --- (+) ---
Exp_Mktcomp
_Tiecoop
--- --- --- (−) --- ---
*--- insignificant