Embed Size (px)
Citation preview
Int. J. Electrochem. Sci., 14 (2019) 2606 – 2620, doi: 10.20964/2019.03.53
International Journal of
ELECTROCHEMICAL SCIENCE
www.electrochemsci.org
The effects of Ca addition on corrosion and discharge
performance of commercial pure aluminum alloy 1070 as anode
for Aluminum-air battery
Ting Xu, Zhengfei Hu*, Cheng Yao
Shanghai Key Laboratory for R&D and Application of Metallic Functional Materials, School of
Materials Science and Engineering, Tongji University, No. 4800 Cao’an Road, Shanghai 201804,
China *E-mail: [email protected]
Received: 16 October 2018 / Accepted: 11 December 2018 / Published: 7 February 2019
The effects of calcium addition on the commercial pure aluminum alloy anode for Al-air battery in
alkaline electrolyte were examined by potentiodynamic polarization, AC impedance, corrosion rate and
discharge measurements. The results show that calcium addition can increase the polarization resistance,
discharge voltage and restrain the corrosion rate in 4 M KOH. Electrodes with calcium addition have the
superior anode efficiency and higher capacity density. Microstructure observations show that calcium
addition refines the grain structure, redistributes the impurity elements Fe and Si, and leads to more
intermetallic phases formed along the inter-dendritic region and grain boundary and dispersed in the
matrix. These characteristics are responsible for the improved electrochemical performance of the Al-
air battery.
Keywords: Commercial pure aluminum; Ca addition; Microstructure; Corrosion; Discharge behavior
1. INTRODUCTION
The aluminum-air battery as an environmentally friendly and high-theoretical-energy-density
system has attracted considerable attention in research and development since the 1960s [1,2]. As
reported [3-8], the theoretical cell voltage and energy density of aluminum-air battery are 2.7 V and 8076
Wh kg-1, respectively. In addition, the practical specific energy of 400 Wh kg-1 in this system is also
superior to other metal-air batteries. The commercial aluminum alloys for aluminum-air battery are an
attractive technology due to their unique combination of being nontoxic and inexpensive and having
easy processing [6] compared with other energy technologies.
It is well known that the surface of aluminum alloys can quickly form a protective oxide film
when in contact with the air or electrolyte [1]. As a result of this film, the aluminum anode exhibits
Int. J. Electrochem. Sci., Vol. 14, 2019
2607
polarization, and its corrosion potential moves towards the positive direction under the current load. In
addition, the major problem is the low coulombic efficiency in aluminum-air battery. Within the alkaline
electrolyte, the aluminum-air battery is accompanied by an undesired hydrogen evolution reaction in the
reaction equation (1) during the discharge process [4,6,9]. This high rate of parasitic corrosion results in
aluminum mass and conductivity losses [10]. Both serious polarization and corrosion limit commercial
applications of aluminum-air batteries.
Al+3H2O+OH-→Al(OH)4- + H2↑ (1)
To avoid these problems, researchers have focused on reducing polarization and accelerating the
rate of oxidation while slowing down the hydrogen evolution reaction. One typical way is a small amount
of alloying elements to pure aluminum to increase the activation of the anodes, such as Mg, Ga, Hg and
Sn, or to decrease the corrosion rate such as with Pb, In, Zn, and Sn [4,11-17]. Another method is to
change the microstructure of the anode, which is related to the electrochemical and discharge behavior
[10]. The composition and structure of anode have a great influence on the properties of the battery.
Some commercial aluminum alloys used as anodes for Al-air alkaline batteries, such as1085,
2024, 6013 and 7075, have been investigated [ 6,18,19]. The composition and structure of the anodes
have a great influence on the properties of the battery. These research works indicate that the commercial
aluminum alloys provided various electrochemical performances for their complex compositions, and
sometimes they have positive effects on battery efficiency and decrease the corrosion rate. Due to the
anode of pure aluminum or trace alloyed showing much better battery efficiency [4,20], it is expected
that the commercial pure aluminum or the modified alloy could result in a comparable performance,
with an obvious cost reduction for the battery on the material supply.
However, limited research has been reported regarding the effects of Ca addition on the corrosion
and discharge performance of aluminum alloy as anode for aluminum-air batter. In this paper, the
commercial pure aluminum alloy 1070 with calcium addition is proposed as aluminum anodes of
aluminum-air battery. By comparing the corrosion behaviors of aluminum anodes with different calcium
contents, the aim of this study is to investigate the effects of calcium addition and the correlative
intermetallic phase on the performance of the aluminum-air battery. Microstructure, corrosion rate,
open-circuit potential (OCP), potentiodynamic polarization and electrochemical impedance
spectroscopy (EIS) were implemented in the half cell assembly to analyse the performance of anodic
dissolution. The constant current discharge in the full cell was studied to evaluate the performance of
the aluminum-air battery.
2. EXPERIMENTAL PROCEDURES
2.1. Electrodes and electrolyte
The aluminum alloys were prepared by the stir cast method. The commercial pure aluminum
1070 was taken as the master alloy, which was melted and heated to a super-heated temperature of
approximately 780 °C in a graphite crucible in an electric resistance furnace. Then, 99.99 wt.% pure
calcium was added to the molten metal. When calcium was dissolved completely, the melt was stirred
Int. J. Electrochem. Sci., Vol. 14, 2019
2608
well by a mechanical stirrer at a certain rpm to ensure complete homogenization of the alloying elements.
The melt was isothermally held for several minutes before stirring stopped and then poured into a
metallic mould preheated to 300 °C. The master aluminum alloy 1070 and pure calcium were provided
by Sichuan Jinyue New materials Co., LTD, China, and Shanghai Shunyou Metallic Materials Co.,
China, respectively. The casting alloys were subjected to heat treatments in the following steps: a
solution heat treatment (540 °C / 4 h) in an electrical oven, then quenching to cold water, followed by
ageing at 140 °C for 2.5 h. The detailed compositions of the casting samples are listed in Table 1. The
sample without calcium and those containing 0.075 wt.% Ca, 0.270 wt.% Ca and 1.140 wt.% Ca are
denoted as 1#, 2#, 3# and 4# alloy, respectively. The 1# sample was obtained by recasting the master
aluminum alloy. Metallography was used to observe the surface morphology of the specimens, and X-
ray diffraction (XRD) was employed to determine the structural and phase information of the samples.
Table 1. Chemical compositions (wt.%) of aluminum anodes.
Sample Component
Fe Si Zn Ca Al
1# 0.127 0.042 0.008 <0.001 Rem.
2# 0.218 0.171 0.029 0.075 Rem.
3# 0.229 0.270 0.035 0.270 Rem.
4# 0.228 0.334 0.035 1.140 Rem.
For electrochemical tests, specimens were small cubes (10 mm×10 mm×5 mm) cut from the
above casting samples. All specimens were mounted in a soft mode and sealed with epoxy resin. The
geometric surface area of each working electrodes was 1.0 cm2, and they were mechanically ground and
polished through standard routines. In addition, the specimens were ultrasonically cleaned in deionized
water, rinsed in ethanol and dried with air.
The air cathode was rolled up by a Ni metal mesh, a catalytic layer consisting of MnO2/C and
PTFE and a waterproof layer consisting of PTFE, carbon materials and NaSO4 [7,21,22]. The electrolyte
is 4 M KOH solution, as it possesses the peak electrolytic conductivity.
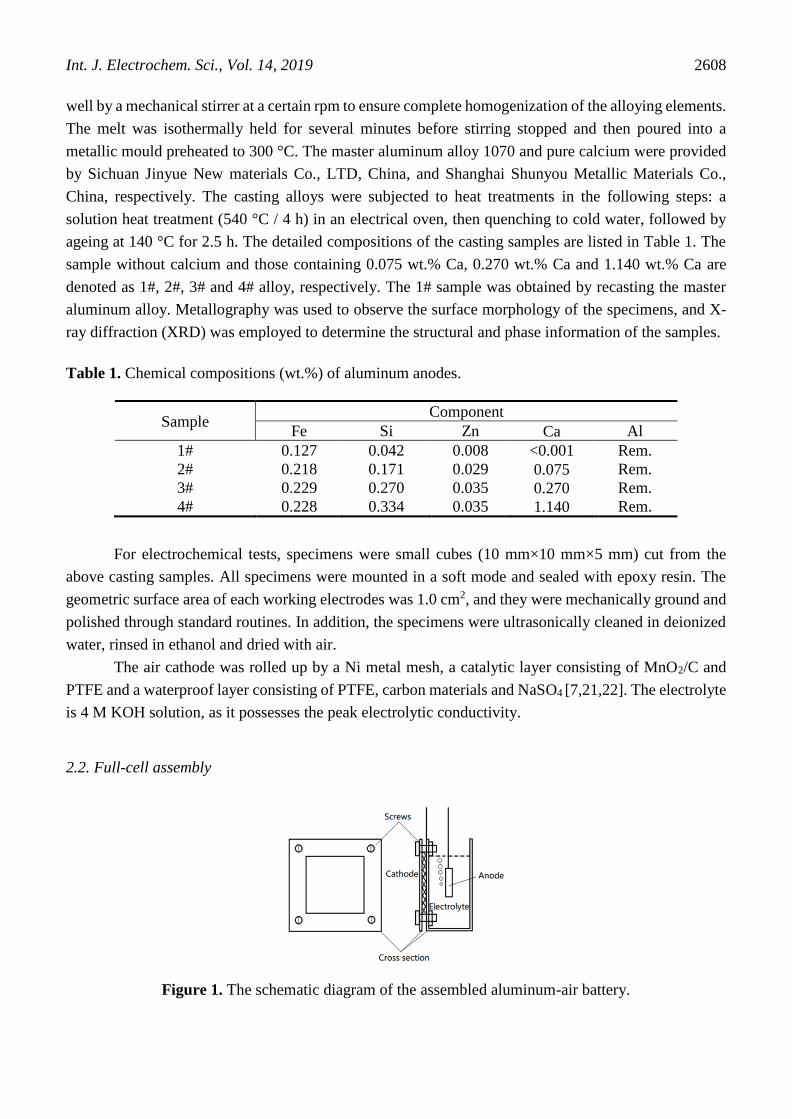
2.2. Full-cell assembly
Figure 1. The schematic diagram of the assembled aluminum-air battery.
Int. J. Electrochem. Sci., Vol. 14, 2019
2609
The full cell assembly for this study is shown in Fig. 1. This full cell was made up of the sample
anode, the air cathode and an acrylic board. To prevent the limiting factors to the anode performance,
the total reaction area of the cathode (25 cm2) was oversized compared to the reaction area of the Al
anode (1.0 cm2).
2.3. Corrosion test
To further determine the corrosion rate, specimens were immersed in 4 M KOH for one hour.
Before and after immersion, the weight of the specimens was measured and recorded. The rate of
corrosion was defined as follows [23,24]:
Corrosion rate (mm a-1) = DAt
W.687 (2)
where W is the loss weight after the corrosion test (mg), D is the aluminum alloy density (g cm-
2), A is the reaction surface area (cm2), and t is the self-corrosion test time ().
2.4. Electrochemical measurements
The electrochemical performance evaluation in a three-electrode cell system was carried out with
a GAMRY Reference 600+ electrochemical workstation under computer control. The electrolyte for
those tests was 4 M KOH and the exposed area of anode was controlled at 1.0 cm2. The open circuit
potential (Eocp) test with a test time of 7200 s was carried out to evaluate the stability of reaction. The
anodic oxidation reaction performance was investigated by the anodic polarization test. The anodic
polarization curves were recorded at a scan rate of 1 mV s-1. Electrochemical impedance spectroscopy
(EIS) was carried out to evaluate the electrochemical behavior. This test was performed after a two-hour
open circuit potential test and applied a sinusoidal wave. The frequency range of wave was from 105 to
10-2 Hz, and the amplitude of the wave was 5 mV. By using GAMRY Reference 600+ software, the
equivalent circuit and parameters were obtained by fitting the experimental data.
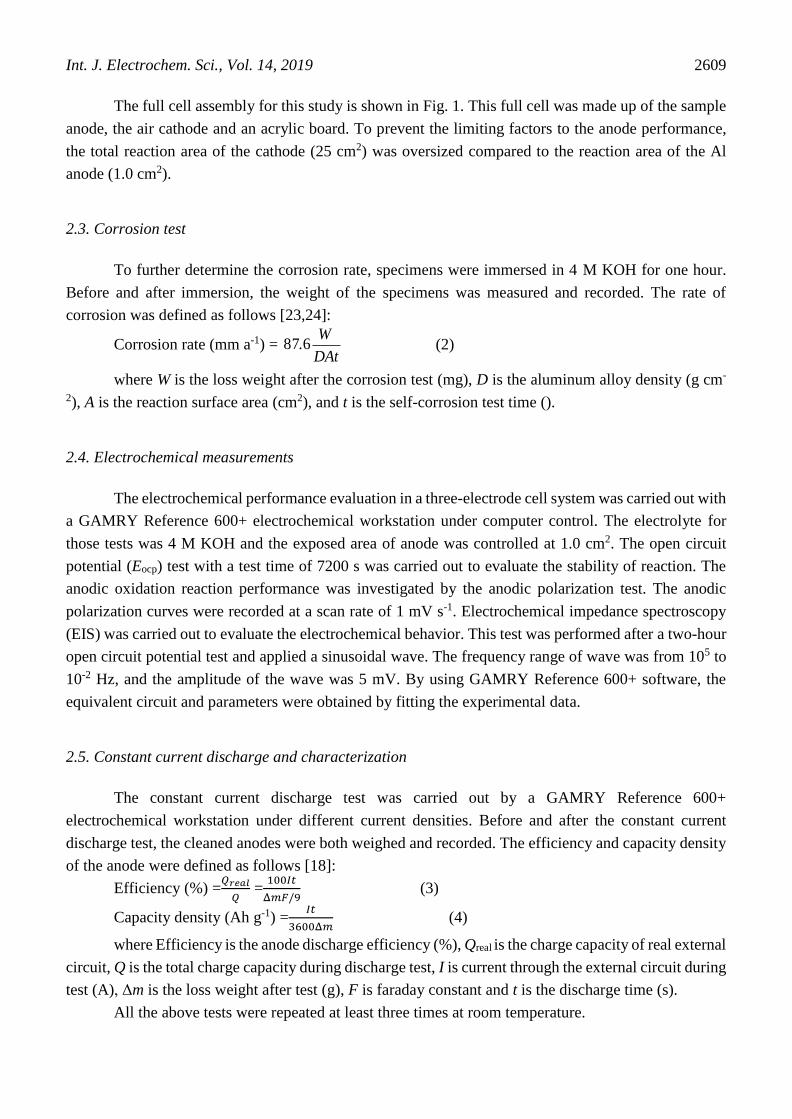
2.5. Constant current discharge and characterization
The constant current discharge test was carried out by a GAMRY Reference 600+
electrochemical workstation under different current densities. Before and after the constant current
discharge test, the cleaned anodes were both weighed and recorded. The efficiency and capacity density
of the anode were defined as follows [18]:
Efficiency (%) =𝑄𝑟𝑒𝑎𝑙
𝑄 =
100𝐼𝑡
Δ𝑚𝐹/9 (3)
Capacity density (Ah g-1) =𝐼𝑡
3600Δ𝑚 (4)
where Efficiency is the anode discharge efficiency (%), Qreal is the charge capacity of real external
circuit, Q is the total charge capacity during discharge test, I is current through the external circuit during
test (A), Δm is the loss weight after test (g), F is faraday constant and t is the discharge time (s).
All the above tests were repeated at least three times at room temperature.
Int. J. Electrochem. Sci., Vol. 14, 2019
2610
Scanning electron microscopy (SEM) and energy dispersive X-ray spectroscopy (EDS) were
used to investigate the surface morphology and corresponding element distributions of the specimens
without surface cleaning after 1 h discharge in 4 M KOH.
3. RESULTS AND DISCUSSION
3.1. Corrosion behavior of the anodes
It is known that Al-air battery exhibits superior performance in alkaline electrolyte compared to
other media. However, the polarization and corrosion of anodes in alkaline conditions are more serious,
which influences the performance of the full battery. So, this section discusses the corrosion behavior of
the calcium aluminum alloys in 4 M KOH.
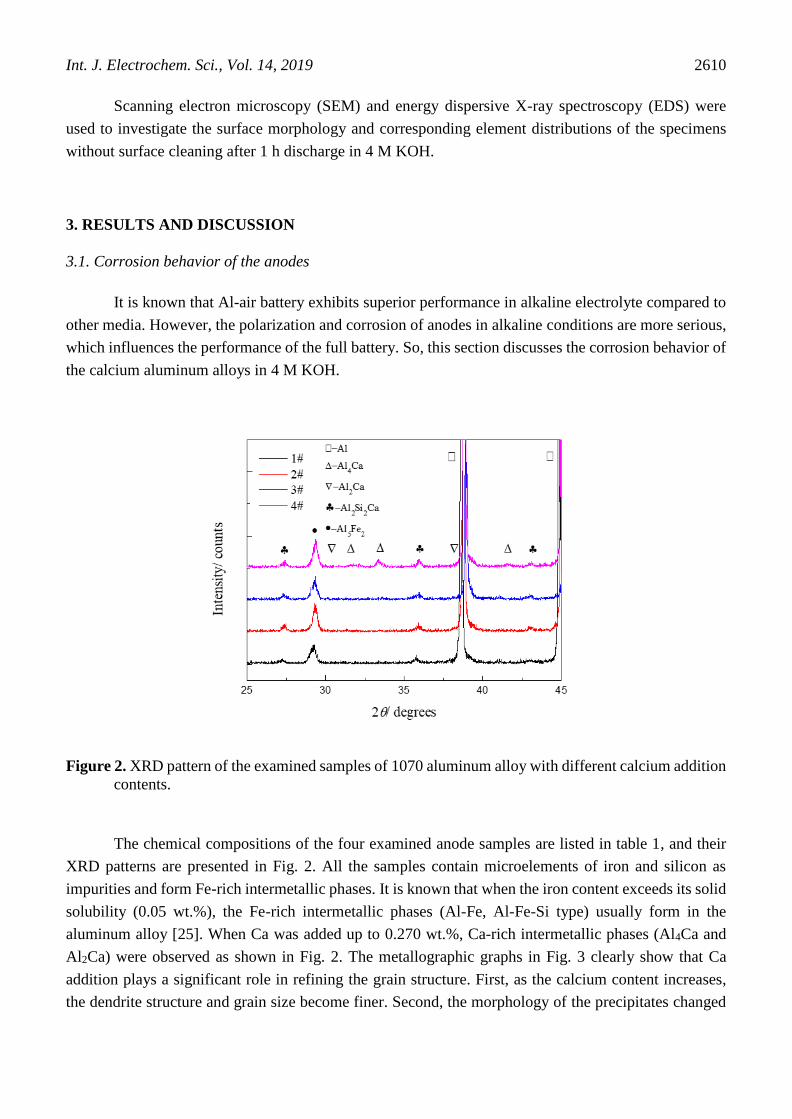
Figure 2. XRD pattern of the examined samples of 1070 aluminum alloy with different calcium addition
contents.
The chemical compositions of the four examined anode samples are listed in table 1, and their
XRD patterns are presented in Fig. 2. All the samples contain microelements of iron and silicon as
impurities and form Fe-rich intermetallic phases. It is known that when the iron content exceeds its solid
solubility (0.05 wt.%), the Fe-rich intermetallic phases (Al-Fe, Al-Fe-Si type) usually form in the
aluminum alloy [25]. When Ca was added up to 0.270 wt.%, Ca-rich intermetallic phases (Al4Ca and
Al2Ca) were observed as shown in Fig. 2. The metallographic graphs in Fig. 3 clearly show that Ca
addition plays a significant role in refining the grain structure. First, as the calcium content increases,
the dendrite structure and grain size become finer. Second, the morphology of the precipitates changed
Int. J. Electrochem. Sci., Vol. 14, 2019
2611
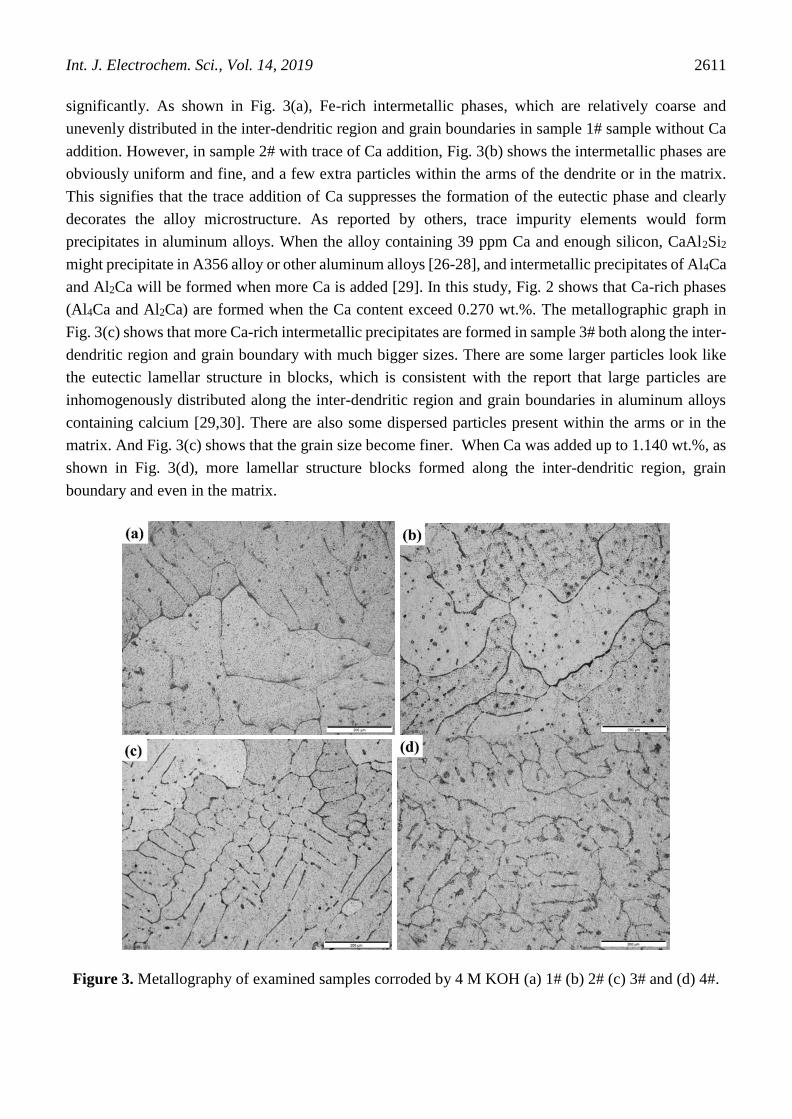
significantly. As shown in Fig. 3(a), Fe-rich intermetallic phases, which are relatively coarse and
unevenly distributed in the inter-dendritic region and grain boundaries in sample 1# sample without Ca
addition. However, in sample 2# with trace of Ca addition, Fig. 3(b) shows the intermetallic phases are
obviously uniform and fine, and a few extra particles within the arms of the dendrite or in the matrix.
This signifies that the trace addition of Ca suppresses the formation of the eutectic phase and clearly
decorates the alloy microstructure. As reported by others, trace impurity elements would form
precipitates in aluminum alloys. When the alloy containing 39 ppm Ca and enough silicon, CaAl2Si2
might precipitate in A356 alloy or other aluminum alloys [26-28], and intermetallic precipitates of Al4Ca
and Al2Ca will be formed when more Ca is added [29]. In this study, Fig. 2 shows that Ca-rich phases
(Al4Ca and Al2Ca) are formed when the Ca content exceed 0.270 wt.%. The metallographic graph in
Fig. 3(c) shows that more Ca-rich intermetallic precipitates are formed in sample 3# both along the inter-
dendritic region and grain boundary with much bigger sizes. There are some larger particles look like
the eutectic lamellar structure in blocks, which is consistent with the report that large particles are
inhomogenously distributed along the inter-dendritic region and grain boundaries in aluminum alloys
containing calcium [29,30]. There are also some dispersed particles present within the arms or in the
matrix. And Fig. 3(c) shows that the grain size become finer. When Ca was added up to 1.140 wt.%, as
shown in Fig. 3(d), more lamellar structure blocks formed along the inter-dendritic region, grain
boundary and even in the matrix.
Figure 3. Metallography of examined samples corroded by 4 M KOH (a) 1# (b) 2# (c) 3# and (d) 4#.
Int. J. Electrochem. Sci., Vol. 14, 2019
2612
The corrosion rate in 4 M KOH during discharge is a significant factor affecting the utilization
efficiency of the anode for the Al-air battery. Table 2 gives the corrosion rate of the four anodes after
one-hour immersion in 4 M KOH solution. It displays that corrosion rate decreases with increasing
calcium addition. The sample 2# shows the fastest corrosion rate and sample 4# shows the lowest
corrosion rate, which might due to distribution and the amount of Fe-Si-type impurities and the formation
of the lamellar structure eutectic phases.
Table 2. Corrosion rate of aluminum anodes from the one-hour corrosion test in 4 M KOH.
Sample Loss weight / mg Corrosion rate / mm a-1
1# 40.7 1320
2# 80.3 2610
3# 41.0 1330
4# 35.4 1150
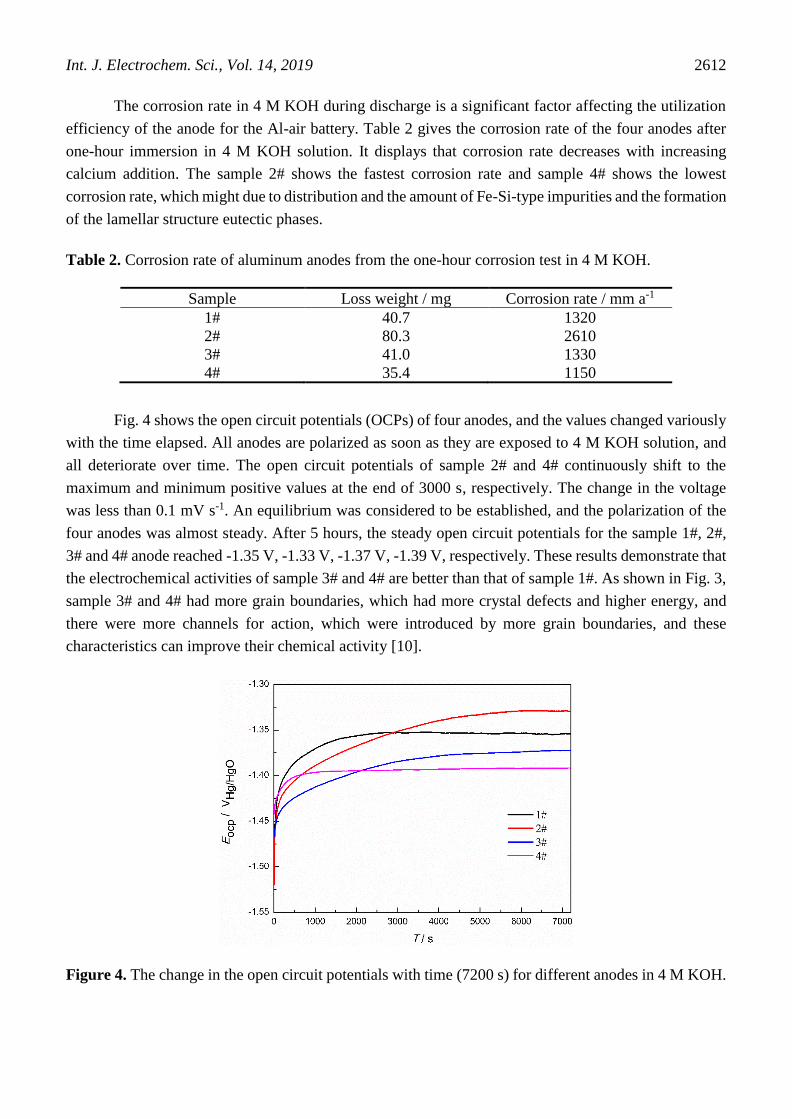
Fig. 4 shows the open circuit potentials (OCPs) of four anodes, and the values changed variously
with the time elapsed. All anodes are polarized as soon as they are exposed to 4 M KOH solution, and
all deteriorate over time. The open circuit potentials of sample 2# and 4# continuously shift to the
maximum and minimum positive values at the end of 3000 s, respectively. The change in the voltage
was less than 0.1 mV s-1. An equilibrium was considered to be established, and the polarization of the
four anodes was almost steady. After 5 hours, the steady open circuit potentials for the sample 1#, 2#,
3# and 4# anode reached -1.35 V, -1.33 V, -1.37 V, -1.39 V, respectively. These results demonstrate that
the electrochemical activities of sample 3# and 4# are better than that of sample 1#. As shown in Fig. 3,
sample 3# and 4# had more grain boundaries, which had more crystal defects and higher energy, and
there were more channels for action, which were introduced by more grain boundaries, and these
characteristics can improve their chemical activity [10].
Figure 4. The change in the open circuit potentials with time (7200 s) for different anodes in 4 M KOH.
Int. J. Electrochem. Sci., Vol. 14, 2019
2613
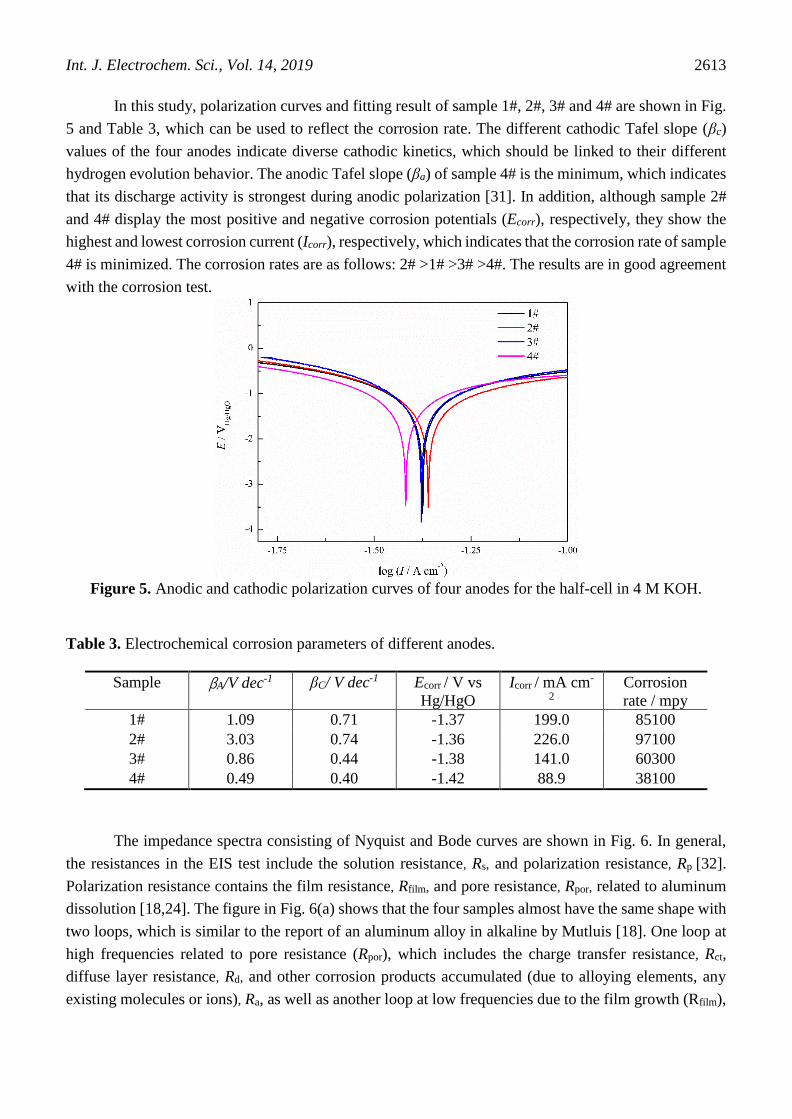
In this study, polarization curves and fitting result of sample 1#, 2#, 3# and 4# are shown in Fig.
5 and Table 3, which can be used to reflect the corrosion rate. The different cathodic Tafel slope (βc)
values of the four anodes indicate diverse cathodic kinetics, which should be linked to their different
hydrogen evolution behavior. The anodic Tafel slope (βa) of sample 4# is the minimum, which indicates
that its discharge activity is strongest during anodic polarization [31]. In addition, although sample 2#
and 4# display the most positive and negative corrosion potentials (Ecorr), respectively, they show the
highest and lowest corrosion current (Icorr), respectively, which indicates that the corrosion rate of sample
4# is minimized. The corrosion rates are as follows: 2# >1# >3# >4#. The results are in good agreement
with the corrosion test.
Figure 5. Anodic and cathodic polarization curves of four anodes for the half-cell in 4 M KOH.
Table 3. Electrochemical corrosion parameters of different anodes.
Sample βA/V dec-1 βC/ V dec-1 Ecorr / V vs
Hg/HgO
Icorr / mA cm-
2
Corrosion
rate / mpy
1# 1.09 0.71 -1.37 199.0 85100
2# 3.03 0.74 -1.36 226.0 97100
3# 0.86 0.44 -1.38 141.0 60300
4# 0.49 0.40 -1.42 88.9 38100
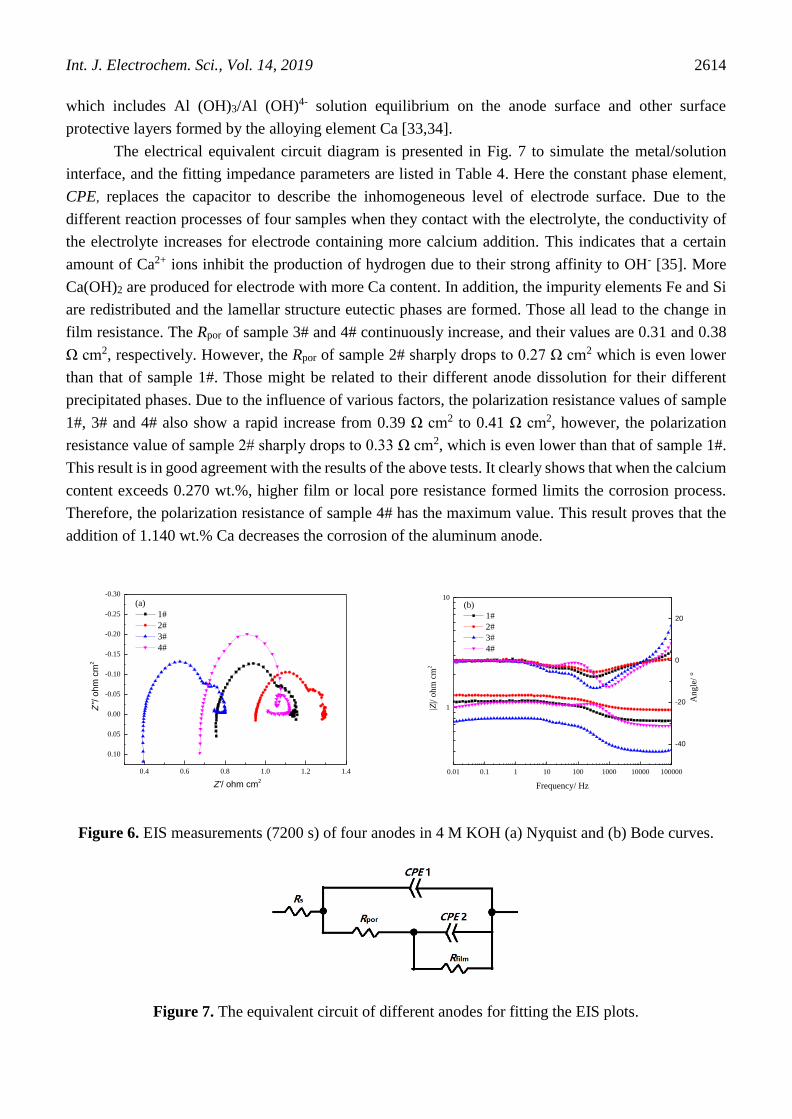
The impedance spectra consisting of Nyquist and Bode curves are shown in Fig. 6. In general,
the resistances in the EIS test include the solution resistance, Rs, and polarization resistance, Rp [32].
Polarization resistance contains the film resistance, Rfilm, and pore resistance, Rpor, related to aluminum
dissolution [18,24]. The figure in Fig. 6(a) shows that the four samples almost have the same shape with
two loops, which is similar to the report of an aluminum alloy in alkaline by Mutluis [18]. One loop at
high frequencies related to pore resistance (Rpor), which includes the charge transfer resistance, Rct,
diffuse layer resistance, Rd, and other corrosion products accumulated (due to alloying elements, any
existing molecules or ions), Ra, as well as another loop at low frequencies due to the film growth (Rfilm),
Int. J. Electrochem. Sci., Vol. 14, 2019
2614
which includes Al (OH)3/Al (OH)4- solution equilibrium on the anode surface and other surface
protective layers formed by the alloying element Ca [33,34].
The electrical equivalent circuit diagram is presented in Fig. 7 to simulate the metal/solution
interface, and the fitting impedance parameters are listed in Table 4. Here the constant phase element,
CPE, replaces the capacitor to describe the inhomogeneous level of electrode surface. Due to the
different reaction processes of four samples when they contact with the electrolyte, the conductivity of
the electrolyte increases for electrode containing more calcium addition. This indicates that a certain
amount of Ca2+ ions inhibit the production of hydrogen due to their strong affinity to OH- [35]. More
Ca(OH)2 are produced for electrode with more Ca content. In addition, the impurity elements Fe and Si
are redistributed and the lamellar structure eutectic phases are formed. Those all lead to the change in
film resistance. The Rpor of sample 3# and 4# continuously increase, and their values are 0.31 and 0.38
Ω cm2, respectively. However, the Rpor of sample 2# sharply drops to 0.27 Ω cm2 which is even lower
than that of sample 1#. Those might be related to their different anode dissolution for their different
precipitated phases. Due to the influence of various factors, the polarization resistance values of sample
1#, 3# and 4# also show a rapid increase from 0.39 Ω cm2 to 0.41 Ω cm2, however, the polarization
resistance value of sample 2# sharply drops to 0.33 Ω cm2, which is even lower than that of sample 1#.
This result is in good agreement with the results of the above tests. It clearly shows that when the calcium
content exceeds 0.270 wt.%, higher film or local pore resistance formed limits the corrosion process.
Therefore, the polarization resistance of sample 4# has the maximum value. This result proves that the
addition of 1.140 wt.% Ca decreases the corrosion of the aluminum anode.
Figure 6. EIS measurements (7200 s) of four anodes in 4 M KOH (a) Nyquist and (b) Bode curves.
Figure 7. The equivalent circuit of different anodes for fitting the EIS plots.
0.4 0.6 0.8 1.0 1.2 1.4
0.10
0.05
0.00
-0.05
-0.10
-0.15
-0.20
-0.25
-0.30
Z''/
ohm
cm
2
Z'/ ohm cm2
(a)
1#
2#
3#
4#
0.01 0.1 1 10 100 1000 10000 100000
1
10
|Z|/ o
hm
cm
2
Frequency/ Hz
(b)
1#
2#
3#
4#
-40
-20
0
20
Angle
/ °
Int. J. Electrochem. Sci., Vol. 14, 2019
2615
Table 4. Fitting results of different anodes for the EIS plots from Figure 6.
Sample Rs
(Ω cm2)
CPE1 Rpor
(Ω cm2)
CPE2 Rfilm
(Ω cm2)
Rp=Rpor+ Rfilm
(Ω cm2) Yo1(S cm2) α1 Yo2(S cm2) α2
1# 0.76 5.04E-3 0.85 0.32 0.14 1.00 6.52E-2 0.39
2# 0.95 6.10E-3 0.83 0.27 0.14 1.00 6.34E-2 0.33
3# 0.04 3.49E-3 0.90 0.31 0.12 1.00 8.08E-2 0.39
4# 0.07 4.36E-4 1.00 0.38 0.49 1.00 2.57E-2 0.41
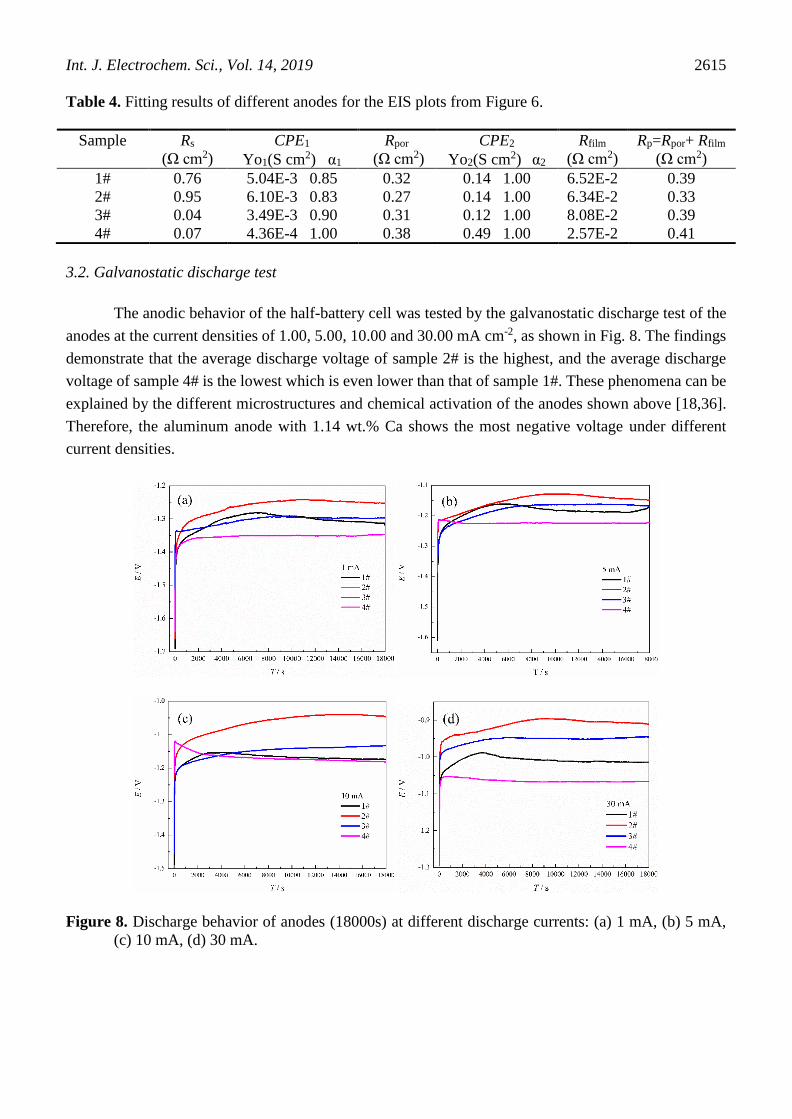
3.2. Galvanostatic discharge test
The anodic behavior of the half-battery cell was tested by the galvanostatic discharge test of the
anodes at the current densities of 1.00, 5.00, 10.00 and 30.00 mA cm-2, as shown in Fig. 8. The findings
demonstrate that the average discharge voltage of sample 2# is the highest, and the average discharge
voltage of sample 4# is the lowest which is even lower than that of sample 1#. These phenomena can be
explained by the different microstructures and chemical activation of the anodes shown above [18,36].
Therefore, the aluminum anode with 1.14 wt.% Ca shows the most negative voltage under different
current densities.
Figure 8. Discharge behavior of anodes (18000s) at different discharge currents: (a) 1 mA, (b) 5 mA,
(c) 10 mA, (d) 30 mA.
Int. J. Electrochem. Sci., Vol. 14, 2019
2616
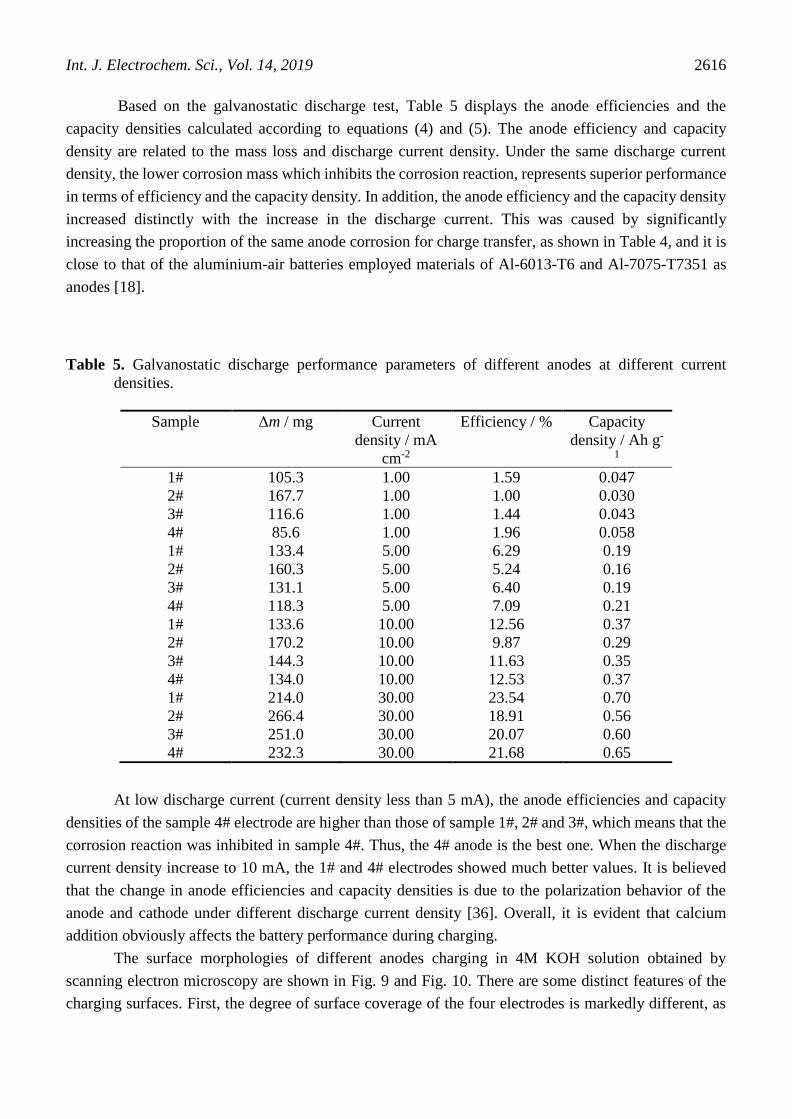
Based on the galvanostatic discharge test, Table 5 displays the anode efficiencies and the
capacity densities calculated according to equations (4) and (5). The anode efficiency and capacity
density are related to the mass loss and discharge current density. Under the same discharge current
density, the lower corrosion mass which inhibits the corrosion reaction, represents superior performance
in terms of efficiency and the capacity density. In addition, the anode efficiency and the capacity density
increased distinctly with the increase in the discharge current. This was caused by significantly
increasing the proportion of the same anode corrosion for charge transfer, as shown in Table 4, and it is
close to that of the aluminium-air batteries employed materials of Al-6013-T6 and Al-7075-T7351 as
anodes [18].
Table 5. Galvanostatic discharge performance parameters of different anodes at different current
densities.
Sample Δm / mg Current
density / mA
cm-2
Efficiency / % Capacity
density / Ah g-
1
1# 105.3 1.00 1.59 0.047
2# 167.7 1.00 1.00 0.030
3# 116.6 1.00 1.44 0.043
4# 85.6 1.00 1.96 0.058
1# 133.4 5.00 6.29 0.19
2# 160.3 5.00 5.24 0.16
3# 131.1 5.00 6.40 0.19
4# 118.3 5.00 7.09 0.21
1# 133.6 10.00 12.56 0.37
2# 170.2 10.00 9.87 0.29
3# 144.3 10.00 11.63 0.35
4# 134.0 10.00 12.53 0.37
1# 214.0 30.00 23.54 0.70
2# 266.4 30.00 18.91 0.56
3# 251.0 30.00 20.07 0.60
4# 232.3 30.00 21.68 0.65
At low discharge current (current density less than 5 mA), the anode efficiencies and capacity
densities of the sample 4# electrode are higher than those of sample 1#, 2# and 3#, which means that the
corrosion reaction was inhibited in sample 4#. Thus, the 4# anode is the best one. When the discharge
current density increase to 10 mA, the 1# and 4# electrodes showed much better values. It is believed
that the change in anode efficiencies and capacity densities is due to the polarization behavior of the
anode and cathode under different discharge current density [36]. Overall, it is evident that calcium
addition obviously affects the battery performance during charging.
The surface morphologies of different anodes charging in 4M KOH solution obtained by
scanning electron microscopy are shown in Fig. 9 and Fig. 10. There are some distinct features of the
charging surfaces. First, the degree of surface coverage of the four electrodes is markedly different, as
Int. J. Electrochem. Sci., Vol. 14, 2019
2617
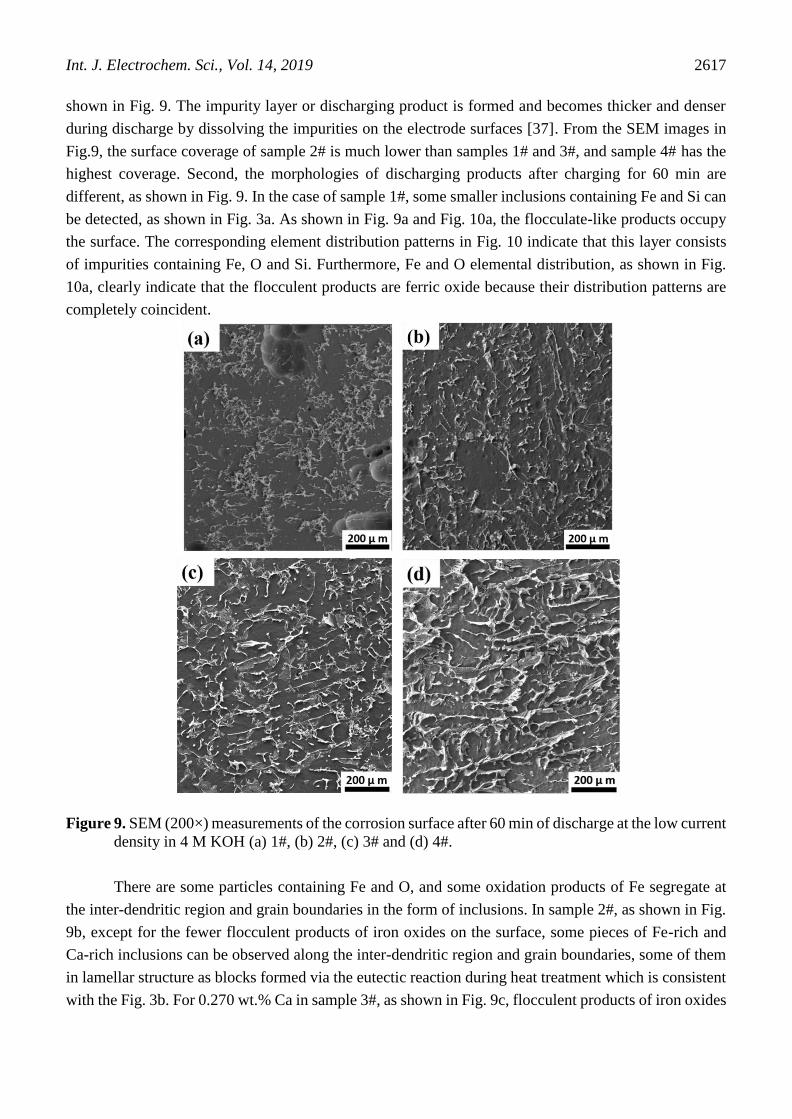
shown in Fig. 9. The impurity layer or discharging product is formed and becomes thicker and denser
during discharge by dissolving the impurities on the electrode surfaces [37]. From the SEM images in
Fig.9, the surface coverage of sample 2# is much lower than samples 1# and 3#, and sample 4# has the
highest coverage. Second, the morphologies of discharging products after charging for 60 min are
different, as shown in Fig. 9. In the case of sample 1#, some smaller inclusions containing Fe and Si can
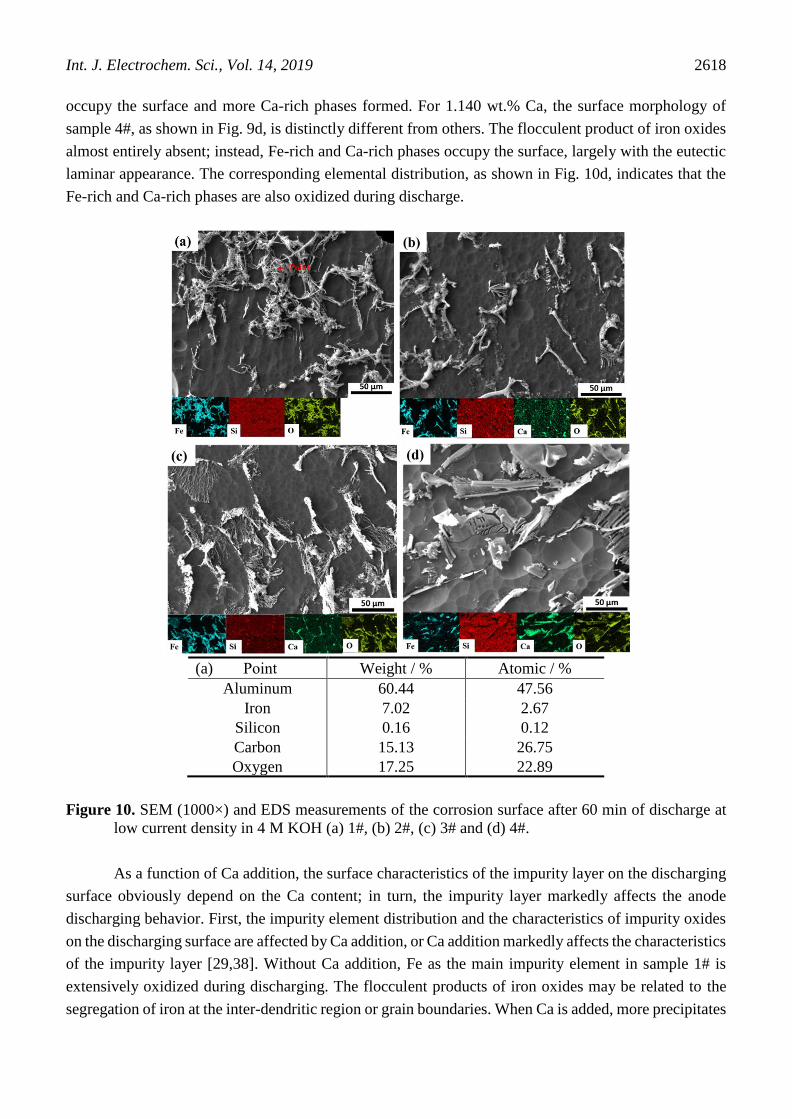
be detected, as shown in Fig. 3a. As shown in Fig. 9a and Fig. 10a, the flocculate-like products occupy
the surface. The corresponding element distribution patterns in Fig. 10 indicate that this layer consists
of impurities containing Fe, O and Si. Furthermore, Fe and O elemental distribution, as shown in Fig.
10a, clearly indicate that the flocculent products are ferric oxide because their distribution patterns are
completely coincident.
Figure 9. SEM (200×) measurements of the corrosion surface after 60 min of discharge at the low current
density in 4 M KOH (a) 1#, (b) 2#, (c) 3# and (d) 4#.
There are some particles containing Fe and O, and some oxidation products of Fe segregate at
the inter-dendritic region and grain boundaries in the form of inclusions. In sample 2#, as shown in Fig.
9b, except for the fewer flocculent products of iron oxides on the surface, some pieces of Fe-rich and
Ca-rich inclusions can be observed along the inter-dendritic region and grain boundaries, some of them
in lamellar structure as blocks formed via the eutectic reaction during heat treatment which is consistent
with the Fig. 3b. For 0.270 wt.% Ca in sample 3#, as shown in Fig. 9c, flocculent products of iron oxides
Int. J. Electrochem. Sci., Vol. 14, 2019
2618
occupy the surface and more Ca-rich phases formed. For 1.140 wt.% Ca, the surface morphology of
sample 4#, as shown in Fig. 9d, is distinctly different from others. The flocculent product of iron oxides
almost entirely absent; instead, Fe-rich and Ca-rich phases occupy the surface, largely with the eutectic
laminar appearance. The corresponding elemental distribution, as shown in Fig. 10d, indicates that the
Fe-rich and Ca-rich phases are also oxidized during discharge.
(a) Point Weight / % Atomic / %
Aluminum 60.44 47.56
Iron 7.02 2.67
Silicon 0.16 0.12
Carbon 15.13 26.75
Oxygen 17.25 22.89
Figure 10. SEM (1000×) and EDS measurements of the corrosion surface after 60 min of discharge at
low current density in 4 M KOH (a) 1#, (b) 2#, (c) 3# and (d) 4#.
As a function of Ca addition, the surface characteristics of the impurity layer on the discharging
surface obviously depend on the Ca content; in turn, the impurity layer markedly affects the anode
discharging behavior. First, the impurity element distribution and the characteristics of impurity oxides
on the discharging surface are affected by Ca addition, or Ca addition markedly affects the characteristics
of the impurity layer [29,38]. Without Ca addition, Fe as the main impurity element in sample 1# is
extensively oxidized during discharging. The flocculent products of iron oxides may be related to the
segregation of iron at the inter-dendritic region or grain boundaries. When Ca is added, more precipitates
Int. J. Electrochem. Sci., Vol. 14, 2019
2619
are formed in the inter-dendritic region and grain boundaries. This means that the addition of Ca may
reduce the solid solubility of the impurity elements Fe and Si in the aluminum alloy, which then
segregate at the inter-dendritic region or grain boundaries to form inclusions [29,30,39]. Compared with
sample 1#, Fe redistributed in other samples, and more Fe-rich and Ca-rich phases can be found. This
changed the discharge products that occupied the surface and were obviously oxidized. For 1.140 wt.%
Ca in sample 4#, the distribution of impurity elements was changed completely and more precipitates
were observed. Thus, the discharge surface was occupied by Fe-rich and Ca-rich phases, which emerged
as inclusions and were oxidized. These impurity inclusions and their oxides cover most of the surface
and significantly reduce the corrosion rate and improve the performance of the Al-air battery.
4. CONCLUSIONS
The effects of Ca addition on the corrosion and discharge performance of commercial pure
aluminum alloy 1070 used as the anode in aluminum-air battery were studied. Microstructure
observations show that calcium addition significantly modifies the microstructure of the commercial
pure aluminum. With increasing calcium content, the dendrite structure and grain size become finer, the
impurity elements Fe and Si tend to segregate in the alloys, and more intermetallic phases are distributed
along the inter-dendritic region, grain boundary and in the matrix as the product of the eutectic reaction.
Aluminum alloy anodes containing higher Ca content have higher polarization resistance and
higher discharge voltage and also exhibit superior the better anode efficiency and capacity density. SEM
observation shows that the impurity layer formed on the discharge surface can serve as a corrosion
inhibitor and have positive effects on corrosion.
References
1. S. Zaromb, J. Electrochem. Soc., 109 (1962) 1125.
2. S. Yang and H. Knickle, J. Power Sources, 112 (2002) 162.
3. Q. Li and N.J. Bjerrum, J. Power Sources, 110 (2002) 1.
4. M. Mokhtar, M.Z.M. Talib, E.H. Majlan, S.M. Tasirin, W.M.F.W. Ramli, W.R.W. Daud and J.
Sahari, J. Ind. Eng. Chem., 32 (2015) 1.
5. H.G. Schwarz, Encyclopedia of Energy, 1 (2004) 81.
6. M. Pino, J. Chacón, E. Fatás and P. Ocón, J. Power Sources, 299 (2015) 195.
7. Y. Liu, Q. Sun, W. Li, K.R. Adair, J. Li and X. Sun, Green Energy & Environment, 2 (2017) 246.
8. D.R. Egan, C.P.D. León, R.J.K. Wood, R.L. Jones, K.R. Stokes and F.C. Walsh, J. Power Sources,
236 (2013) 293.
9. M.A. Rahman, X. Wang and C. Wen, J. Electrochem. Soc., 160 (2013) A1759.
10. L. Fan, H. Lu and J. Leng, Electrochim. Acta, 165 (2015) 22.
11. J. Ma, J. Wen, J. Gao and Q. Li, J. Power Sources, 253 (2014) 419.
12. I. Smoljko, S. Gudić, N. Kuzmanić and M. Kliskic´, J. Appl. Electrochem., 42 (2012) 969.
13. S.Z.E. Abedin and F. Endres. J. Appl. Electrochem., 34 (2004) 1071.
14. D.D. Macdonald, S. Real and M. Urquidi-Macdonald, J. Electrochem. Soc., 135 (1988) 2397.
15. M. Nestoridi, D. Pletcher, R.J.K. Wood, S. Wang, R.L. Jones, K.R. Stokes and I. Wilcock, J. Power
Int. J. Electrochem. Sci., Vol. 14, 2019
2620
Sources, 178 (2008) 445.
16. R. Liang, Y. Su, X.L. Sui, D.M. Gu, G.S. Huang and Z.B. Wang, J. Solid State Electr., (2018).
17. P. Montagné and M. Tillard, J. Solid State Electr., 19 (2015) 685.
18. R.N. Mutlu, S. Ateş and B. Yazıcı, Int. J. Hydrogen Energ,, 42 (2017) 23315.
19. M. Pino, C. Cuadrado, J. Chacón, P. Rodríguez, E. Fatás and P. Ocón. J. Appl. Electrochem., 44
(2014) 1371.
20. J. Ma, J. Wen, J. Gao and Q. Li. Electrochim. Acta., 129 (2014) 69.
21. J.S. Lee, G.S. Park, H.I. Lee, S.T. Kim, R. Cao, M. Liu and J. Cho, Nano Letters, 11 (2011) 5362.
22. L. Mao, D. Zhang, T. Sotomura, K. Nakatsu, N. Koshiba and T. Ohsaka, Electrochim. Acta, 48
(2003) 1015.
23. D.A. Jones, Principles and prevention of corrosion, Prentice Hall, (1996) NJ, USA.
24. Y.J. Cho, I.J. Park, H.J. Lee and J.G. Kim, J. Power Sources, 277 (2015) 370.
25. P. Skjerpe, Metall. Mater. Trans. A, 18 (1987) 189.
26. T.H. Ludwig, E.S. Dæhlen, P.L. Schaffer and L. Arnberg, J. Alloy. Compd., 586 (2014) 180.
27. S. Wenner, C.D. Marioara, S.J. Andersen and R. Holmestad, Mat. Sci. Eng. A, 575 (2013) 241.
28. T.H. Ludwig, P.L. Schaffer and L. Arnberg, Metall. Mater. Trans. A, 44 (2013) 3783.
29. D.P. Mondal, N. Jha, A. Badkul, S. Das, M.S. Yadav and P. Jain, Mater. Design, 32 (2011) 2803.
30. Q. Lu, Y. Shen, S. Zhong, C. Zhao and W. Long, Rare Metal Mat. Eng., 47 (2018) 1739.
31. H. Xiong, K. Yu, X. Yin, Y. Dai, Y. Yan and H. Zhu, J. Alloy. Compd., 708 (2017) 652.
32. I.J. Park, S.R. Choi and J.G. Kim, J. Power Sources, 357 (2017) 47.
33. K.C. Emregül and A.A. Aksüt, Corros. Sci., 42 (2000) 2051.
34. R. Solmaz, Corros. Sci., 52 (2010) 3321.
35. Z. Zhao, X. Chen and M. Hao, Energy, 36 (2011) 2782.
36. L. Fan and H. Lu, J. Power Sources, 284 (2015) 409.
37. J. Wang, J. Wang, H. Shao, J. Zhang and C. Cao, J.Appl. Electrochem., 37 (2007) 753.
38. M. Deng, D. Höche, S.V. Lamaka, D. Snihirova and M.L. Zheludkevich, J. Power Sources, 396
(2018) 109.
39. S.S. Sreeja Kumari, R.M. Pillai and B.C. Pai, Int. Mater. Rev., 50 (2005) 216.
© 2019 The Authors. Published by ESG (www.electrochemsci.org). This article is an open access
article distributed under the terms and conditions of the Creative Commons Attribution license
(http://creativecommons.org/licenses/by/4.0/).